Submitted:
14 September 2023
Posted:
15 September 2023
You are already at the latest version
Abstract
Disorder of S-adenosylhomocysteine hydrolase (AHCY) activity leads to the potentially lethal rare disease AHCY deficiency, first described in 2004 by Baric and co-workers [1]. In order to shed new light on molecular aspects of the disease, in particular changes at transcriptome level, we enabled knock-down of AHCY expression in model systems such as the colon cancer cell line SW480 to simulate the environment occurring in AHCY deficiency patients. Further, we per-formed deep sequencing of mRNA, followed by differential expression and molecular pathway analysis. Fifteen differentially expressed networks were identified, and interestingly, we found a predicted effect of AHCY down-regulation on the expression of the Lymphoidphoid enhanc-er-binding factor 1 (LEF1) gene, indicating changes in the TCF4/LEF1 complex. LEF1, a member of the T-cell Factor (TCF)/LEF1 family of high-mobility group transcription factors, is a down-stream mediator of the Wnt/β-catenin signaling pathway [2]. LEF1 is essential in stem cell maintenance, and especially in its role in epithelial-mesenchymal transition (EMT). Western blot analysis of LEF1 protein expression confirmed our transcriptomic data predictions and revealed significantly increased LEF1 protein in AHCY- deficient cells, providing a novel link between AHCY and cancer cell phenotype.
Keywords:
AHCY deficiency
; S-adenosylhomocysteine (SAH)
; LEF1
; STAT3
; MYC
; metastasis
; EMT
; cancer cell phenotype
; shRNA
; Next-generation sequencing
1. Introduction
S-adenosylhomocysteine hydrolase (AHCY) is an enzyme that catalyzes the hydrolysis of S-adenosylhomocysteine (SAH) to produce adenosine (Ado) and homocysteine (Hyc) [3]. SAH is generated through transmethylation reactions of S-adenosylmethionine (SAM), which serves as main methyl-group donor in most living organisms, and is involved in a variety of cellular processes, including DNA methylation, histone modification, and RNA processing. Also, SAH is a potent competitive inhibitor of methyltransferases [4]. Therefore, maintaining proper AHCY activity is crucial for regulating the cellular methylation potential, which is determined by the ratio of SAH to SAM metabolites [5,6]. The significance of AHCY in regulating the cellular methylation potential has been underscored by the discovery of AHCY deficiency in humans, a rare, and potentially lethal multisystem disorder caused by allelic mutations in the AHCY gene that result in reduced AHCY enzymatic activity [1,7,8,9,10,11], with dramatically increased levels of metabolites SAH and SAM. Evidently, increased levels of SAH are associated with increased cell proliferation, migration, and invasion, possibly due to disruption of methylation status and altered expression of key genetic factors that control these vital cellular processes [12]. In a previous study, we showed that DNA hypermethylation seems to be a frequent but not a constant feature associated with AHCY deficiency that affects different genomic regions to different degrees, which on the other hand could impair the regulation of gene expression, and subsequently cellular signaling pathways [13].
So far, AHCY deficiency has been linked to a range of metabolic disorders, including liver disease [14]. Also, AHCY downregulation contributes to tumorigenesis [15].
However, still elusive appear the pathogenic effects of AHCY deficiency at molecular level. Understanding the mechanisms that lead to aversive conditions and diseases as a result of AHCY deficiency is important for developing effective strategies for the prevention and treatment of these conditions. Thus, in this study we investigated the effects of AHCY down-regulation on the colon cancer derived model cell line SW480.
To do so, we enabled short hairpin RNA (shRNA) mediated gene silencing in SW480 cells, in order to resemble AHCY deficiency at cellular level. The efficiency of generating AHCY-deficient environment was evaluated by determining the concentrations of crucial metabolites SAM and SAH in the AHCY-deficient SW480 cells. Subsequently, after establishing effective AHCY silencing, we performed RNA sequencing to analyze changes in gene expression levels in response to AHCY down-regulation. To contextualize the RNA-seq data, we deployed Ingenuity Pathway Analysis (IPA) for predicting changes to signaling networks and related downstream effects, and to identify new targets or candidate biomarkers in context of various biological systems. We also performed western blotting to confirm data obtained from RNA sequencing, by assessing the protein levels of key components of signaling pathways of interest.
Besides the major role of AHCY in the regulation of the cellular methylation potential, we show that AHCY downregulation can impact a wide range of cellular functions. Our findings provide new insights into the molecular mechanisms underlying the effects of AHCY downregulation, in particular on, Lymphoidphoid enhancer-binding factor 1 (LEF1), a member of the T-cell Factor (TCF)/LEF1 family of high-mobility group transcription factors, and a downstream mediator of the Wnt/β-catenin signaling pathway. The Wnt pathway is highly conserved and involved in various cellular processes, including embryonic development, tissue homeostasis, stem cell maintenance, and cell differentiation. This result bodes well with previous findings that implicate disorder of Wnt signaling in various diseases, including cancer and neurodegenerative diseases [16]. On the other hand, LEF1 is essential in stem cell maintenance and organ development, especially in its role in epithelial-mesenchymal transition (EMT) [17]. Thus, investigation of this relationship may help elucidate the molecular mechanisms underlying the effect of AHCY on cancer cell behavior, and may contribute to a better understanding of the pathogenesis of AHCY deficiency-related diseases.
2. Results
2.1. SAM/SAH measurements
The levels of S-adenosylmethionine (SAM) and S-adenosylhomocysteine (SAH) were measured in AHCY deficient cells to investigate the impact of AHCY deficiency on the metabolism of these compounds. Compared to the control cells, the AHCY deficient cells exhibited a significant increase in the amount of SAH, with levels approximately two-fold higher. In the AHCY deficient cells, the concentration of SAH was found to be [4.6] ng/mL, whereas in the control cells, it was [2] ng/mL. This substantial elevation in SAH suggests impaired methylation capacity in the AHCY deficient cells, as SAH is an inhibitor of methyltransferase enzymes. Conversely, the levels of SAM, the precursor of SAH and a key methyl donor, did not show a significant difference between the AHCY deficient cells and the control cells. The concentration of SAM in the AHCY deficient cells was [278] ng/mL, while in the control cells, it was [458] ng/mL.
The appropriate concentration of puromycin (0.8 μg/mL) was used for selection of cells with shRNA insert after infection with lentiviral particles.
Figure 1.
SAM/SAH measurements (c) Levels of SAM and SAH (ng/ml) and their ratio (d) SAM/SAH in the lysates of AHCY-silenced and control cells, as measured by LC-MS/MS. ± SD is represented as vertical line and is based on three independent measurements.
Figure 1.
SAM/SAH measurements (c) Levels of SAM and SAH (ng/ml) and their ratio (d) SAM/SAH in the lysates of AHCY-silenced and control cells, as measured by LC-MS/MS. ± SD is represented as vertical line and is based on three independent measurements.
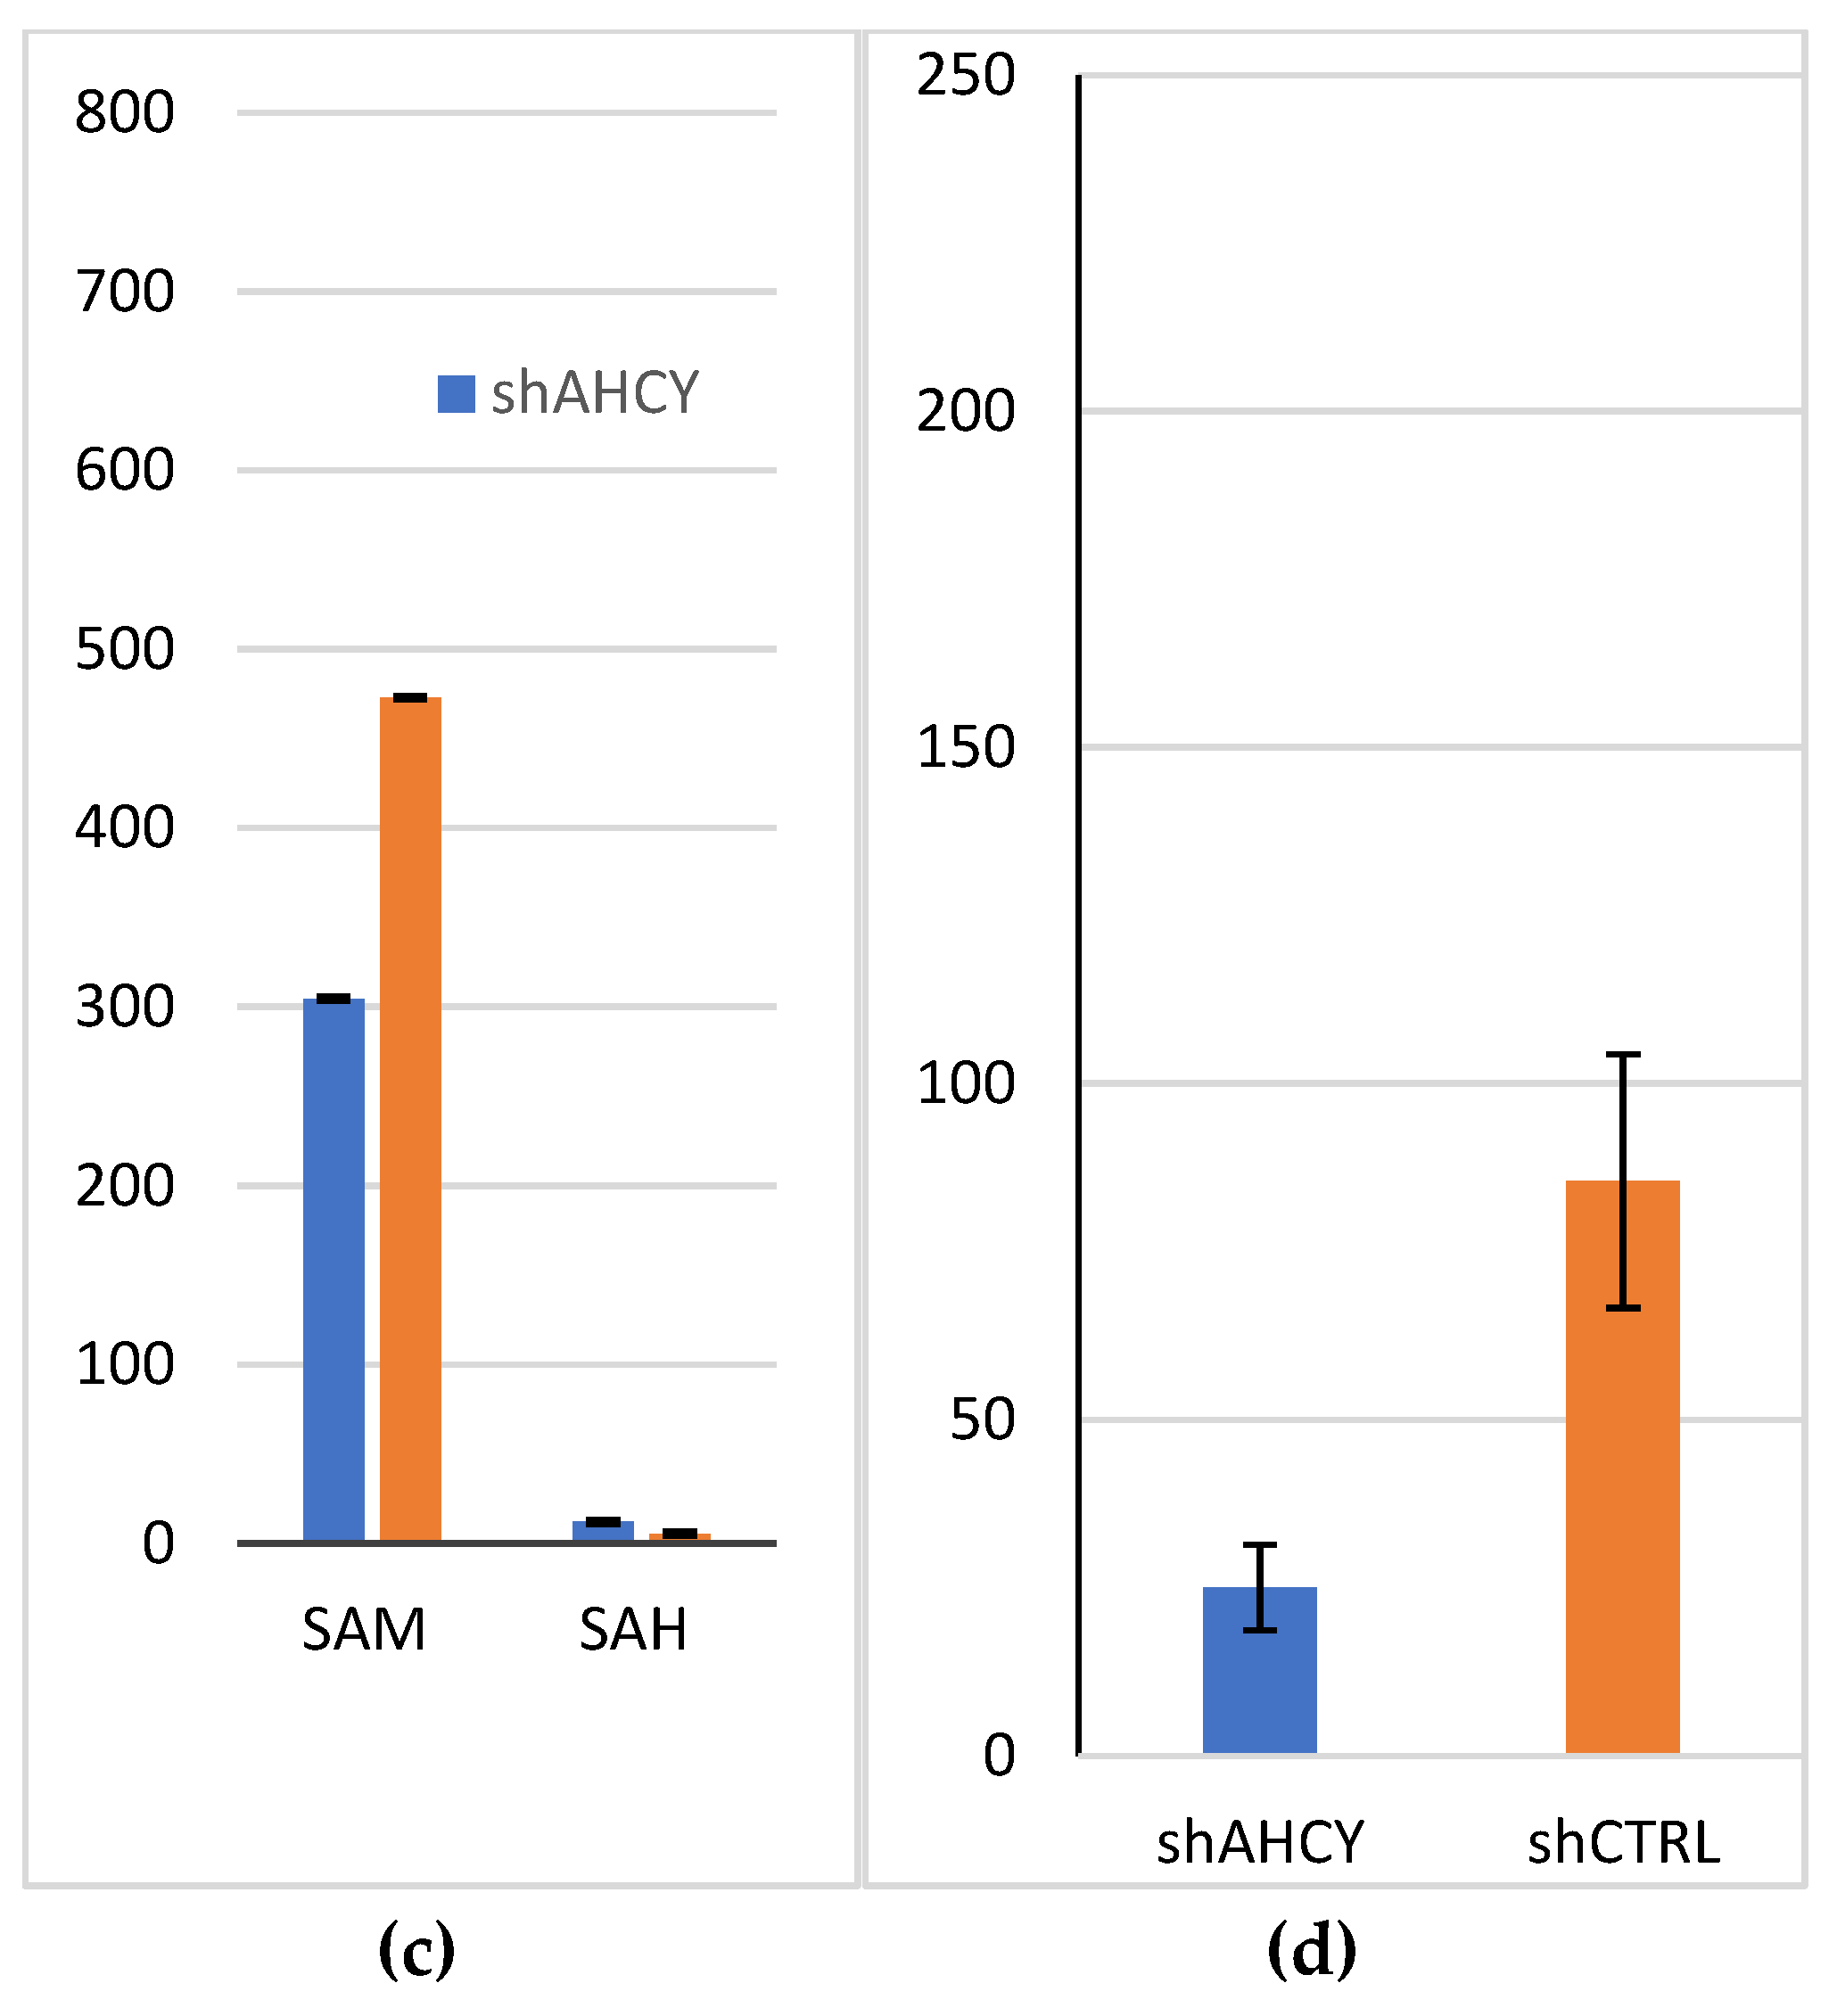
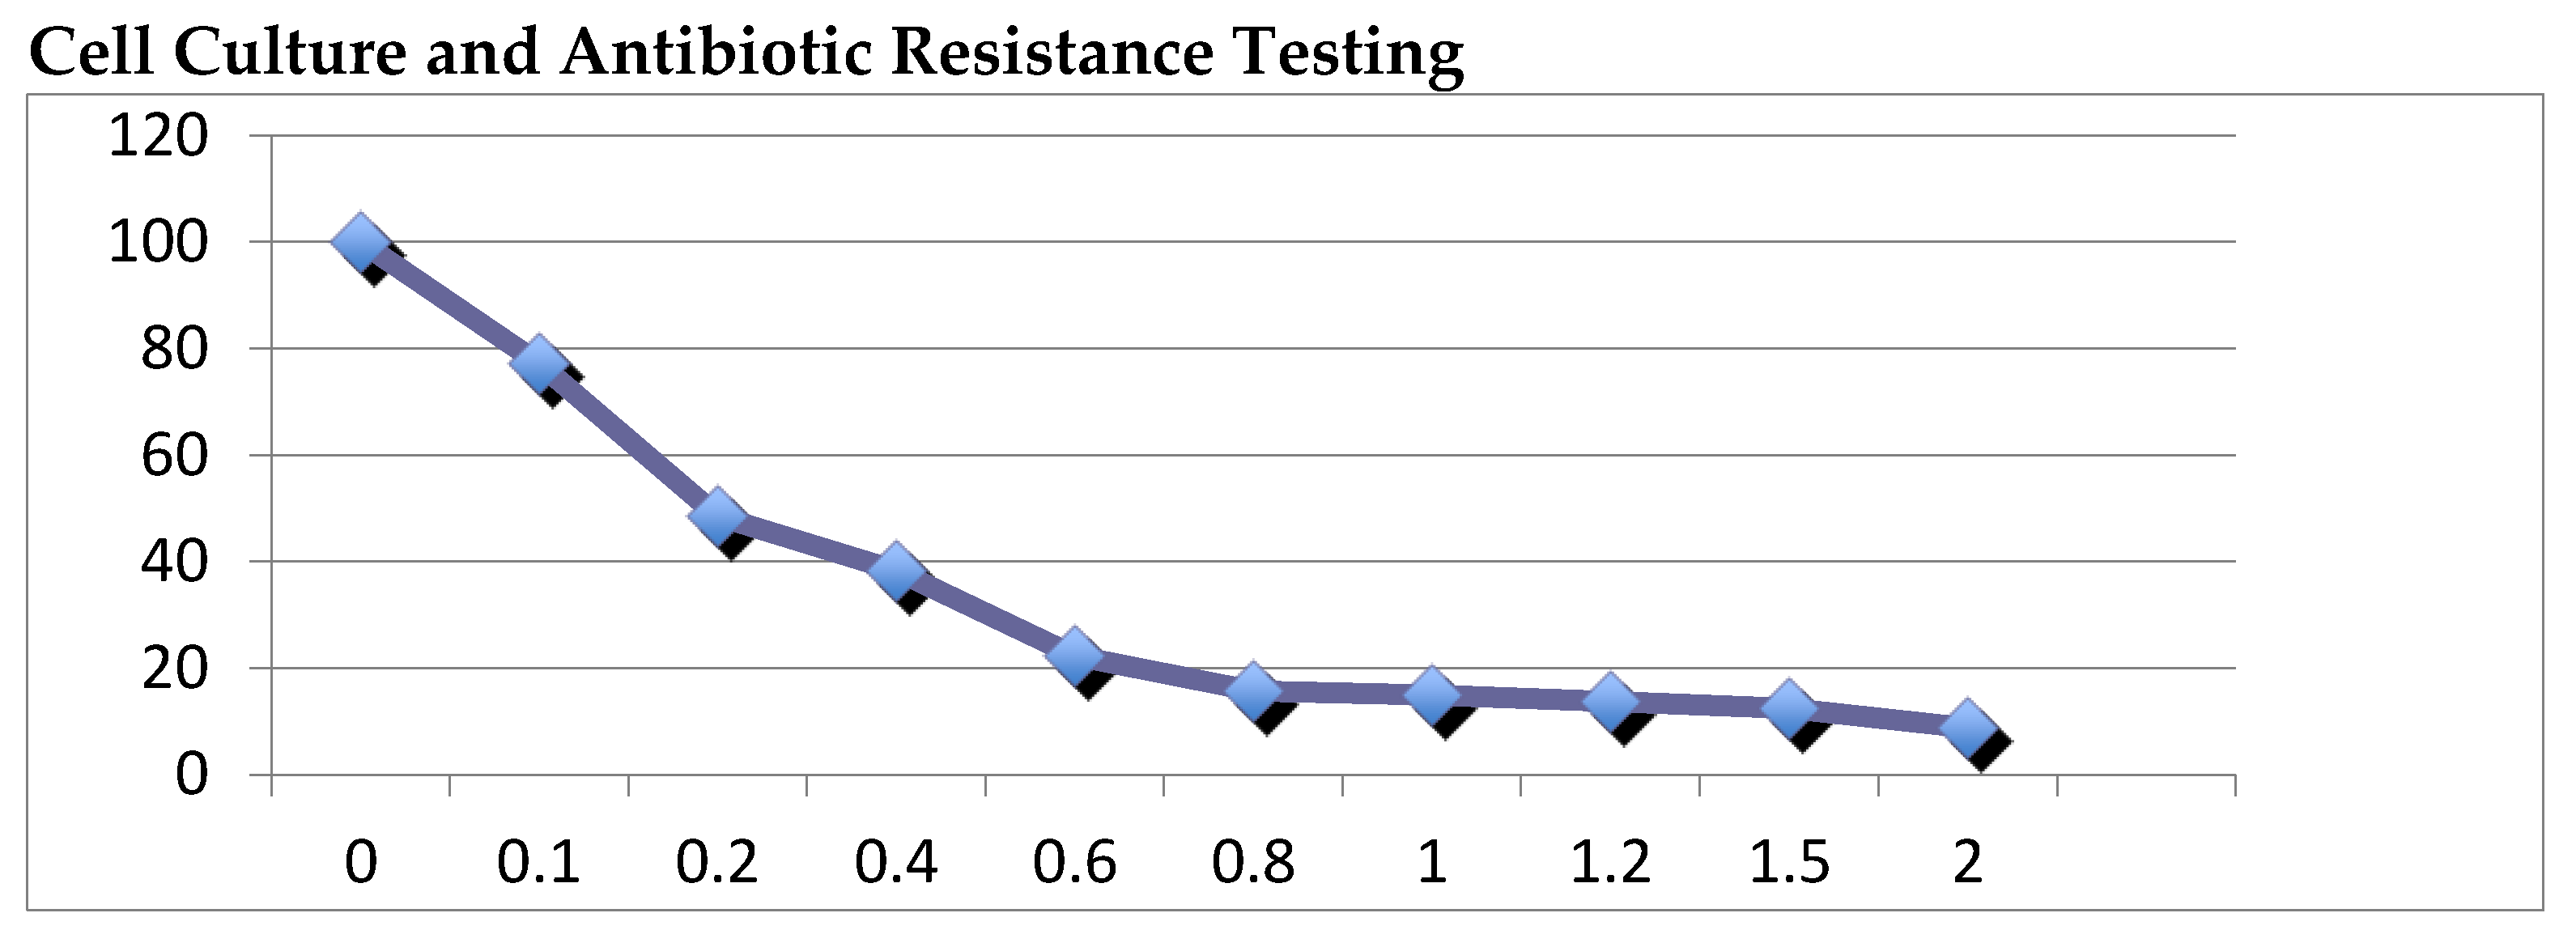
Figure 2.
Cell Culture and Antibiotic Resistance Testing.
2.2. RNA-seq
mRNA sequencing of SW480 cells yielded an average of 65 million paired-end reads per sample, with a read length of 151 nucleotides. The reads were aligned to the reference genome (hg38 No Alts, with decoys)) using DRAGEN RNA Pipeline (Version 3.9.5.) available on BaseSpace Sequence Hub (Illumina), with an average mapping rate of 98,1% of total reads. RNA quantification was performed using the aforementioned BaseSpace tool, and differential expression analysis was performed using the DRAGEN Differential Expression tool (Illumina) that utilizes DeSeq2 algorithm to identify differential expresses genes between two conditions.
Overall, we identified approx. 15,000 expressed genes in SW480 cells, with 3627 genes showing significantly different expression levels between treated and control groups (adjusted p-value < 0.05 and fold change > 0.5). Of these differentially expressed genes, 1350 were upregulated and 2,277 were downregulated in the treated group compared to the control group.
2.3. In-depth Examination of the Most Significantly Altered Signalling Pathways
The IPA software package was used to analyse the data generated by mRNA sequencing, indicating significant differences in gene expression in several biological processes and pathways. We found 523 genes related to cellular movement, 605 related to cellular development, and 600 genes related to cellular growth and proliferation to be differentially expressed, respectively. (Table 1 and Table 2).
Further, we have focused our analysis to most relevant non-canonical signaling pathways that are somehow connected to differentially expressed LEF1 protein, such as the Wnt signaling network (Table 3, Figure 3), epithelial-mesenchymal transition (EMT) (Figure 4, Table 4), epithelial adherens junctions signaling (Figure 5), differential expression of cyclins and cell cycle regulation signaling (Figure 6), MYC network (Figure 7), tumor cell microenvironment pathway (Figure 8, Table 6), calcium signaling, STAT3 pathway ( Figure 9, Table 5), human embryonic stem cell pluripotency signaling (Figure 10), and Rho Family GTPases signaling (Figure 11). Also, we conducted data integration of differential gene expression, LEF1 Protein Levels, Wnt Signaling, and Cellular Responses (Figure 12).
2.4. Epithelial-Mesenchymal transition and E-cadherin/β-catenin/Wnt pathway
The AHCY deficient SW480 cell line exhibits significant changes in expression levels of genes that are part of the epithelial-mesenchymal transition (EMT). Most interesting changes occurred to the Lymphoidphoid enhancer-binding factor 1 (LEF1) gene expression. Accordingly, we have observed significant changes in Wnt signaling (Figure 3 and Figure 4, Table 3), which is to be expected as LEF1 is part of the Wnt/β-catenin signaling pathway.
Other changes within the Wnt pathway include WNT6 (Wnt family member 6) with a highly increased expression. Wnt6 is highly conserved in various species, mainly considered to be a member of the β-catenin-dependent Wnt signaling pathway.
Besides the upregulation of LEF1 and its possible regulatory role in Wnt signaling, we have observed the reduced expression of cadherin 12 (CDH12) (Table 3).
Also, we show increased ALCAM expression (Activated Leukocyte Cell Adhesion Molecule). The expression of ALCAM correlates with the expression of Snail proteins, showing Snail 1 and Snail 2 to be more active (Figure 5, Figure 7 and Figure 12, Table 4 and Table 5). Snail proteins are well-known EMT-Transcription factors, directly binding and suppressing E-cadherin at the proximal CDH1 promoter and remodeling intercellular adhesion.
Also, significant alterations in genes associated with tumor cell invasion were detected, such as significant upregulation of TGFβ1, ROAR, DAB2, BMP6, NOS2, PLXN2, and CADPS exhibited, and significant downregulation of TCF4 (Figure 12).
2.5. Differential Expression of Cyclins and Cell Cycle Regulation Signaling
The transcript levels of Cyclin A, Cyclin B, and CDK1 were found to be significantly increased (Figure 6). Cyclin B, in collaboration with CDK1, orchestrates the transition from the G2 phase to the mitotic phase, enabling successful cell division. Accordingly, we observed a higher level of gene expression of RB1, E2F, and TFDP1, which are key regulators of the cell cycle.
2.6. MYC, STAT3 and Human Embryonic Stem Cell Pluripotency Signaling
We have identified several proteins that are potentially regulated by MYC (Figure 7). Among them, the expression levels of AHCY, SOX5, SON, OLR1, LRG1, and COL4A1 were found to be significantly associated with MYC activity, specifically in terms of their potential downregulation. MYC exerts its regulatory role by directly binding to the regulatory regions of these genes and modulating their transcriptional activity.
2.7. The tumor microenvironment pathway
AHCY-deficient SW480 cells exhibit significant upregulation of genes important for the tumor microenvironment pathway, such as MMP19, MMP24, and CSF2, as well as upregulated activation of PLAU and BCL2 (Figure 8, Table 6).
We have observed higher expression of TIAM1 and activation of Rac1 (Figure 8). TIAM1 acts as a GEF, a protein that facilitates the exchange of GDP (guanosine diphosphate) for GTP (guanosine triphosphate) on Rac1.
2.8. G protein-coupled receptor (GPCR) signaling
RNA-seq data revealed an interesting observation regarding the expression of G protein-coupled receptor (GPCR) signaling. We found a downregulation of Adora receptors (GPCR) signaling in the AHCY- deficient cells (Figure 7), suggesting a potential alteration in cellular responses to external stimuli. This downregulation may place the tumor cells under increased stress, making them more competitive for limited resources and driving the activation of mechanisms responsible for cell migration and invasion.
2.9. Signaling by Rho Family GTPases
We observed activation of ROCK kinase, which further contributes to cytoskeletal remodeling and cell contractility (Figure 11). Namely, Rho GTPases, including Rho, PIP5K, and ROCK, are key regulators of cytoskeletal dynamics. The Rho signaling cascade also involves downstream effectors, such as FAK (focal adhesion kinase). Additionally, the increased activation of FAK (Figure 10), shown by its phosphorylated form, suggests enhanced focal adhesion turnover and cell-substrate adhesion including cytoskeleton reorganization.
2.10. Western blotting
Western blotting results confirmed efficient lentiviral mediated knock-down of AHCY gene expression in SW480 cells, with significantly decreased AHCY protein levels (Figure 13a).
Also, western blotting revealed a significant increase in the protein levels of LEF1 in AHCY-deficient SW480 cells when compared to the control cells (Figure 13b). Quantification of band intensities showed an approximately 50% increase in LEF1 protein expression in the AHCY- deficient cells. This observation indicates that the deficiency of AHCY has a direct impact on the expression of LEF1 in SW480 cells. Additionally, we found a significant increase in the expression of STAT3 protein in AHCY- deficient cells compared to control cells (Figure 13c).
For all experiments, GAPDH was used as a loading control, and detected by a rabbit polyclonal antibody (ab9458, Abcam). 30 μg of whole cell proteins retrieved from SW480 AHCY-deficient or SW480 control cells were loaded per well.
(a) Detection of AHCY protein using a monoclonal AHCY antibody (ab134966; Abcam).
(b) Detection of LEF1 protein using a monoclonal LEF1 antibody (sc-374522, Santa Cruz Biotechnology).
(c) Detection of STAT3 protein using a monoclonal STAT3 antibody (sc-8019, Santa Cruz Biotechnology).
3. Discussion
In order to imbalance the cellular SAM-to-SAH ratio and inflict changes to the cellular methylation potential, we knocked-out endogenous AHCY in the model cell line SW480, which leads to an accumulation of SAH. The elevated levels of SAH in the AHCY deficient cells may have implications for cellular processes that rely on proper methylation, such as gene expression regulation and epigenetic modifications.
Indeed, we have establihed a new link between S-adenosylhomocysteine hydrolase and cancer cell signaling by analyzing differentially expressed pathways in AHCY deficient SW480 cells. Namely, after AHCY knock-down, these cells exhibit significantly increased LEF1 protein levels, placing LEF1 into a complex interplay of various signaling pathways and molecular players involved in tumor cell migration and invasion, in particular the Wnt signaling pathway, where the up-regulation of LEF1 possibly is disrupting the TCF/LEF transcription factors ratio [4].
Namely, LEF1 is part of the Wnt/β-catenin signaling pathway, which includes for example genes such as c-Myc, LBH, Oct4, NANOG that have been associated with the upregulation of proteins typically involved in human breast cancer, gastrointestinal tumors, prostate cancer, leukemia, and others [18,19,20,21,22,23,24,25,26,27,28,29]. Some of these genes confer stem cell qualities including c-myc, cyclin D1, Oct4, and NANOG, and siRNA-mediated knockdown initiates differentiation [30,31], respectively. In addition, c-Myc appears to serve as a master regulator, playing a critical role in in embryonic development and regulating the transcription of genes involved in the cell cycle, and targets molecules involved in the G1/S transition such as CDK2, CDK4, CDC25A, and E2Fs [32].
Cyclin D1 is involved in cell cycle progression, especially in the G1 phase, and is necessary for growth and proliferation [33]. They also serve as downstream effectors of Wnt signaling and are activated by the recruitment of LEF1 to their respective promoter sites. Namely, the promoters for c-myc and cyclin D1 contain LEF1 consensus sequences that allow β-catenin-LEF1 to bind and modulate c-myc and cyclin D1 expression [34,35,36,37]. Other downstream target genes involved in proliferation could be affected as well, such as survin, and VEGF [55,56]. Point mutations of LEF1 located in exons 2 (K86E) and 3 (P106L) of LEF1 result in increased promoter activity and expression for c-myc and cyclin D1, causing increased leukemia cell proliferation [38]. Altered LEF1 expression and function commonly occur in several cancers, such as lung adenocarcinoma, colon cancer, endometrial carcinoma, prostate cancer and leukemia [39,40,41,42,43,44,45]. High LEF1 and low Notch2 expression patterns are associated with tumorigenesis, shorter overall survival time, and higher risk of death in CRC patients [46,47]. Also, the presence of increased LEF1 is associated with an increased risk for primary colorectal cancer and liver metastasis [48]. On the other hand, knockdown of LEF1 in colon cancer cells results in various effects on cellular processes such as a) increased apoptosis compared to control cells in vitro, and reduced tumor growth compared to normal colon cancer cells in vivo, b) reduced invasiveness via decreased MMP-2 and MMP-9 expression, and c) changed expression of genes involved in regulation of expression of matrix metalloproteinases such as metallopeptidase 7 (MMP7, a Zn2+ - dependent proteolytic enzyme) [49]. These studies demonstrate the importance of LEF1 in elucidating typical cancer characteristics, including proliferation, invasion, migration, and viability, amongst a variety of cancer types, and highlight its necessity in propagating these effects. Not only is LEF1 at the center of signaling pathways and mechanisms that initiate and maintain carcinogenesis, suppression of LEF1 reduces the proliferative and invasive properties of cancer. Also, LEF1 has been reported to promote EMT in cancer cells by activating Wnt/β-catenin signaling, which can in turn activate Notch signaling and GPCR signaling [50]. Similarly, calcium signaling has been shown to regulate Wnt/β-catenin signaling by activating calcium/calmodulin-dependent protein kinase II (CaMKII), which can phosphorylate LEF1 and activate its transcriptional activity. Therefore, LEF1 may indirectly modulate the activity of several of the signaling pathways identified in the RNA-seq analysis by interacting with other key signaling molecules, such as β-catenin, Notch, and GPCRs. This assumption is fostered by finding significantly lower expression levels of TCF4, whereas TCF4 is known to be in a direct interaction with LEF1 known as an interaction TCF/LEF, where overexpressed LEF1 leads to an enhanced tumor cell invasiveness and induces epithelial to mesenchymal transition [51]. Namely, transcription of LEF1 can be directly regulated by TCF4-β-catenin complexes [52]. As LEF-1 is not expressed in the normal colon mucosa [53], but is found in human colorectal cancer [54], a shift of β-catenin binding partners from TCF4 to LEF-1 might occur during carcinogenesis which might enable enhanced epithelial-mesenchymal transition (EMT) and malignant progression.
The precise mechanisms and consequences of these interactions may vary depending on the cellular context, specific target genes, and extracellular signals present. Further investigations are necessary to fully elucidate the intricate interplay between LEF1 and these canonical and non-canonical pathways in the context of our study, considering their potential impact on gene expression and cellular processes.
3.1. Additional Pathways Perturbations3.2. Epithelial-Mesenchymal transition
So far, the hallmark of EMT is the loss of epithelial marker expression, typically indicated by the presence of E-cadherin, with a gain in mesenchymal marker expression such as of N-cadherin and vimentin accompanied by invasive phenotype. Therefore, the E-cadherin/β-catenin/Wnt pathway signaling is pivotal for comprehending the potential consequences of identified gene expression alterations, given the observed changes in Wnt signaling, and its central role in governing cell-cell adhesion and the regulation of cell proliferation—both frequently perturbed within the tumor microenvironment. As we have found WNT6, highly conserved in various species, with a highly increased expression, and mainly considered to be a member of the β-catenin-dependent Wnt signaling pathway [55], we assume that Wnt6 might increase the proliferative ability of colorectal cancer cells (CRC), leading to increased expression of MMP2, which is also involved in the breakdown of the extracellular matrix [56]. In addition, the promoter region of Wnt6 is bound by polymorphic adenoma-like protein 2 (PLAGL2) in the nucleus of CRC cells [57]. PLAGL2, a zinc finger protein derived from the PLAG gene family [58,59,60], is a proto-oncogene and a transcription factor. PLAGL2 combines with the Wnt6 promoter and activates the β-catenin-dependent Wnt signaling pathway, thereby stimulating various downstream target genes (such as MMP7, CCND1) and promoting tumor development [61,62,63,64,65].
E-cadherin together with β-catenin as an adaptor protein establishes links to the actin cytoskeleton. Under physiological conditions, cytoplasmic β-catenin remains in an inactive state by being bound to the APC/GSK3β/Axin/CK1 degradation complex and undergoes phosphorylation for ubiquitination. Wnt signaling inhibits this degradative process by phosphorylating and inhibiting the GSK3β complex. Under conditions that amplify aberrant Wnt signaling, β-catenin translocates into the nucleus and binds to TCF-4/LEF-1 proteins to induce Wnt target genes such as c-Myc, cyclins, MMP, etc., leading to uncontrolled cell proliferation and growth [61,62,63,64,65]. In the absence of E-cadherin, un-sequestered β-catenin released from the membrane-bound cadherin-catenin complex leads to excess cytoplasmic β-catenin. It has been demonstrated that β-catenin uses the same binding interface to engage TCF and E-cadherin ligands and cadherins have a superior binding affinity. There is a suggestion that as E-cadherin protein is lost, there is excess un-sequestered cytoplasmic β-catenin that escapes degradation and enters the nucleus to bind to TCF and activate Wnt pathway. In addition to activating downstream Wnt associated genes, it is also demonstrated that nuclear translocation of β-catenin represses PTEN expression. PTEN is a tumor suppressor and a critical regulator of AKT/MTOR pathway. Thus, the carefully balanced Wnt/β-catenin/E-cad functioning is tipped in favor of uncontrolled cell proliferation promoting oncogenesis [93–100]. In addition, important signaling interactions between E-cadherin and other cellular pathways include RTK/EGFR/MAPK, and the P-120/Rho/RAC pathway, respectively.
Besides the upregulation of LEF1, and being part of the Wnt/β-catenin signaling pathway with possible regulatory roles in aformentioned processes, we have observed the reduced expression of cadherin 12 (CDH12), that has been implicated in promoting increased metastatic potential and cell migration [66]. The loss or downregulation of CDH12 can disrupt the adhesive interactions between cells, leading to a decreased cohesive behavior within the primary tumor and facilitating the detachment of tumor cells from the primary site. This loss of cell adhesion can enhance the migratory capacity of cancer cells, enabling their invasion into surrounding tissues and dissemination to distant sites. Consequently, the decreased expression of CDH12, along with reduced adhesive molecules, may contribute to a more aggressive and metastatic phenotype in cancer cells [67].
Contributing to potential migratory capacity might be enhanced expression of ALCAM, which is involved in cancer cell migration, in conjunction with the activation of the EMT pathway. ALCAM facilitates interactions between cells and their surrounding environment, and influences cytoskeletal rearrangements, promoting cellular protrusions that expedite directed cell migration. The expression of ALCAM correlates with the expression of SNA1, which is evident in our data [68].
Snail family members (Snail [SNAI1] are well-known EMT-TFs. The EMT-TFs directly bind and suppress E-cadherin at the proximal CDH1 promoter and remodel intercellular adhesion. Snail also suppress other epithelial markers and activate mesenchymal genes and we see in our data Snail 1 and Snail 2 more active (Figure 4, Table 5). Furthermore, EMT-TFs are known to reorganize epithelial polarity molecules and impede basement membrane formation to promote pro-invasive circumstances [69-70.
Significant upregulation of expression is found for genes associated with tumor cell invasion such TGFβ1, ROAR, DAB2, BMP6, NOS2, PLXN2, and CADPS, whereas TCF4 was significantly downregulated in AHCY deficient cells. Thus, our data bode well for linking gene activity changes to tumor progression and metastasis, suggesting that, a) TGFβ1's elevated activity aligns with invasion promotion, b) ROAR's surge suggests heightened invasiveness, c) DAB2's rise echoes invasion dynamics, d) BMP6's elevation points to tumor progression, e) NOS2's increase connects to invasiveness, f) PLXN2's upregulation implies migration involvement and, g) CADPS's rise aligns with invasiveness [71,72,73,74,75,76].
Interestingly, in the context of cell migration and invasion, we found downregulation of Adora receptors (GPCR), suggesting a potential alteration in cellular responses to external stimuli. This downregulation may place the tumor cells under increased stress, making them more competitive for limited resources and driving the activation of mechanisms responsible for cell migration and invasion.
Additional cytoskeletal dynamics are possibly mediated through signaling by Rho Family GTPases, fostered by the observed activation of ROCK kinase, which contributes to cytoskeletal remodeling and cell contractility. Namely, Rho GTPases, including Rho, PIP5K, and ROCK, are key regulators of cytoskeletal dynamics, including downstream effectors, such as FAK (focal adhesion kinase), which exhibits increased activation suggesting s enhanced focal adhesion turnover and cell-substrate adhesion including cytoskeleton reorganization [77,78]. Thus, the activation of Wnt signaling, STAT3, Rho GTPases, ROCK kinase, FAK, Regulation of the EMT Pathway and the upregulation of LEF1 protein collectively might contribute to cytoskeletal reorganization, cell trafficking, and enhanced cell motility, and highlight the complicated network of molecular events involved in the invasive behavior of tumor cells. Calcium signaling can intersect with the non-canonical Wnt pathway, potentially affecting LEF1 through various mechanisms, while LEF1, as a downstream effector of the canonical Wnt pathway, plays a role in regulating Epithelial-Mesenchymal Transition (EMT). Additionally, G Protein-Coupled Receptor (GPCR) signaling can influence the canonical Wnt pathway [79,80,81].
3.3. Differential Expression of Cyclins and Cell Cycle Regulation Signaling
Increased transcript levels of Cyclin A, Cyclin B, and CDK1 are indicating a potential modulation of cell cycle dynamics in response to AHCY deficiency. Cyclin B, in collaboration with CDK1, orchestrates the transition from the G2 phase to the mitotic phase, enabling successful cell division [82]. The increased expression of Cyclin B and CDK1 implies an augmented drive toward mitosis, possibly reflecting a compensatory mechanism triggered by AHCY deficiency, supported by higher expression of RB1, E2F, and TFDP1, which are key regulators of the cell cycle, being in a more active state in the studied cells. Considering the increased activity of RB1, E2F, and TFDP1, it can be inferred that these molecules are facilitating cell cycle progression.
RB1, when inactive or phosphorylated, releases its inhibitory effect on E2F transcription factors. The active E2F factors, in turn, promote the transcription of genes involved in DNA replication and cell division. TFDP1 interacts with E2F, forming the E2F/TFDP1 complex, which enhances the transcriptional activity of E2F. This complex further promotes the expression of genes required for cell cycle progression [83].
The activation of the E2F/TFDP1 complex leads to the transcription of genes involved in various phases of the cell cycle, such as G1/S transition, S phase, G2 phase, and M phase. However, it is unclear whether the dysregulated cyclin signaling observed in AHCY deficient SW480 cells may be influenced by aberrant LEF1 activity and its interplay with the Wnt pathway.
3.4. MYC, STAT3 and Human Embryonic Stem Cell Pluripotency Signaling
Significant perturbations in expression levels have been observed for several proteins that are potentially regulated by MYC, but also MYC itself. Namely, MYC exerts its regulatory role by directly binding to the regulatory regions of distinct genes such as SOX5, SON, OLR1, LRG1, and COL4A1, which have been found to be significantly associated with MYC activity, specifically in terms of their potential downregulation. Proteins SOX5, SON, and OLR1 have been implicated in various aspects of cancer progression and metastasis [81]. SOX5, a paralog of SOX2 within the SOX transcription factor family, may play a significant role in regulating cellular processes in the AHCY deficient SW480 cell line. Furthermore, the presence of such connections in other cellular systems and the known involvement of SOX6, a paralog of SOX2, in Wnt signaling, strengthens the importance of these findings within the broader context of cell regulation and signaling pathways in the tumor microenvironment. In the case of COL4A1, which is a component of basement membranes, lower expression could potentially disrupt the integrity of basement membranes. Our study also explores the connection between AHCY deficiency and pluripotency signaling in ESCs, focusing on observed upregulation of STAT3, and MYC, together with CDC25A, and BCL2, that suggest potential implications for enhanced cellular proliferation, survival, and anti-apoptotic responses. Also, as MYC, CDC25A, and BCL2 show increased activity, one might argue regarding possible contributions to cell growth, cycle control, and resistance to cell death as shown elsewhere [84,85,86,87,88]. Furthermore, the connection between STAT3 signaling and LEF1 protein levels suggests a potential interplay between these pathways, possibly mediated through crosstalk with the Wnt signaling pathway. Namely, STAT3 activation is crucial for ESC self-renewal by controlling important pluripotency genes like OCT4, NANOG, and SOX2. Additionally, STAT3 influences ESC growth and proliferation by affecting genes involved in the cell cycle, including cyclin D1 and c-myc. The downstream factor MYC also plays a role in ESC development, cell growth, proliferation and maintenance of pluripotency [89]. Therefore, our analysis establishes also links between AHCY deficiency and pluripotency signaling, shedding new light on the interaction of STAT3 and downstream elements in the HESCPS network.
3.5. The tumor microenvironment pathway
Significant changes have been detected in the tumor microenvironment pathway including genes MMP19, MMP24, and CSF2, as well as PLAU, BCL2, TIAM1 and Rac1. These changes might be attributed to the increased LEF1 protein levels, suggesting potential implications for the modulation of the tumor microenvironment in response to AHCY deficiency.
In addition, CSF2, also known as GM-CSF (Granulocyte-Macrophage Colony-Stimulating Factor), is a cytokine that plays a crucial role in the regulation of immune cell development, function, and inflammation. In addition to its immunomodulatory functions, emerging evidence suggests that CSF2 also contributes to cancer cell migration and invasion in the context of cancer metastasis, and indeed we detected highly increased expression of CSF2. In epithelial ovarian cancer cells activation of the CSF2/p-STAT3 pathway leads to the enhancement of stem cell-like properties in cancer cells [90]
TIAM1 acts as a GEF, a protein that facilitates the exchange of GDP (guanosine diphosphate) for GTP (guanosine triphosphate) on Rac1. This exchange shifts Rac1 into its active, GTP-bound form, triggering downstream signaling pathways that promote cell migration. Within the existing scientific literature, there is a firmly established comprehension of TIAM1's integral role in cell proliferation and tumorigenic potential [88].
Top of Form
Bottom of Form
Loss of TIAM1 or RAC1 inhibition induces cell death via BAX/BAK-mediated apoptosis. TIAM1-Nur77 interaction is required for small cell lung cancer (SCLC) cell survival. [91].
In addition, TIAM1 was elevated in thyroid cancer, and TIAM1 knockdown repressed thyroid cancer cell proliferation and promoted ferroptosis through regulating Nrf2/HO-1 axis. Taken together, these findings may suggest that TIAM1 plays a significant role in the tumor microenvironment signaling pathway by activating cell proliferation and tumorigenic potential.
Taken together, our findings provide valuable insights into the complex interplay of various signaling pathways and molecular players involved in tumor cell migration and invasion. Understanding these mechanisms at a molecular level may pave the way for the development of targeted therapeutic interventions aimed at disrupting these pathways and inhibiting tumor metastasis. Further investigations into the precise molecular mechanisms underlying the observed alterations and their implications for tumor progression will be crucial for a comprehensive understanding of tumor biology.
4. Materials and Methods
4.1. Cell Culture:
SW480 cells were obtained from the American Type Culture Collection (ATCC) and cultured in DMEM (Dulbecco's Modified Eagle's Medium, Gibco) supplemented with 10% fetal bovine serum (FBS, Gibco) and 1% penicillin-streptomycin (Gibco) at 37°C in a humidified atmosphere with 5% CO2.
HEK293T cells were obtained from the American Type Culture Collection (ATCC) and cultured in DMEM (Dulbecco's Modified Eagle's Medium, Gibco) supplemented with 10% fetal bovine serum (FBS, Gibco) and 1% penicillin-streptomycin (Gibco) at 37°C in a humidified atmosphere with 5% CO2.
Cells were sub-cultured every 2-3 days and passages 5-10 were used for all experiments.
4.2. Viability Assay:
Cell viability was determined using the MTT assay. Briefly, cells were seeded at a density of 5×10^3 cells/well in 96-well plates and incubated for 24 h. The cells were then treated with different concentrations of the test compounds for 24 h. After treatment, MTT reagent (Sigma) was added to each well and the plates were incubated for an additional 4 h. The formazan crystals were solubilized with DMSO (Sigma) and the absorbance was measured at 570 nm using a microplate reader (Biotek).
4.3. Lentivirus Production:
HEK293T cells were seeded in a 10-cm dish at a density of 5x10^6 cells/dish and incubated overnight. The cells were transfected with 5 μg of the short hairpin RNA (shRNA) lentiviral vector plasmids shRNA2 and, shRNA4 (Sigma), both targeting AHCY, respectively, and helper plasmids psPAX2 (3.75 μg) and pMD2.G (1.25 μg) using Lipofectamine 3000 (Thermo Fisher Scientific) according to the manufacturer's instructions. For production of control cells we used SHC016 non-target shRNA plasmid (2 and 4, Sigma), in combination with psPAX2 and pMD2.G plasmids. After 24 h, the transfection medium was replaced with fresh medium. The supernatant containing functional lentiviral particles was collected 48 h and 72 h post-transfection, pooled, and filtered through a 0.45-μm syringe filter (Millipore).
4.4. Cell Culture and Antibiotic Resistance Testing
SW480 cells were cultured in DMEM media supplemented with 10% fetal bovine serum (FBS) and 1% penicillin-streptomycin in a humidified incubator at 37°C and 5% CO2. Prior to lentiviral transduction, cells were tested for antibiotic resistance to puromycin using the MTT assay. Cells were seeded at a density of 2,000 cells per well in a 96-well plate and incubated for 24 hours to allow for cell attachment. Puromycin was added at various concentrations (0.2, 0.4, 0.6, 0.8, 1 μg/mL) and incubated for 48 hours. Following incubation, the media was removed, and the cells were washed with phosphate-buffered saline (PBS). MTT solution (5 mg/mL) was added to each well and incubated for 4 hours at 37°C. The MTT solution was removed, and the formazan crystals were dissolved in dimethyl sulfoxide (DMSO). Absorbance was measured at 570 nm using a microplate reader (Biotek). The concentration of puromycin that resulted in 50% inhibition of cell growth (IC50) was determined using Excel.
4.5. Lentiviral Transduction:
SW480 cells were seeded in a 6-well plate at a density of 2x10^5 cells/well and incubated overnight. The cells were then transduced with the lentiviral vector containing the gene of interest and an antibiotic resistance gene using polybrene (Sigma-Aldrich) at a final concentration of 8 μg/mL. After 24 h, the transduction medium was replaced with a fresh medium containing the appropriate antibiotic (e. puromycin) at a concentration of 1 μg/mL. The cells were then cultured for 3 days to allow for the selection of transduced cells.
4.6. Transcriptome profiling – RNA-Seq
Total cell RNA was extracted from 1 × 10⁶ cells using TRIzol® Reagent (Thermo Fisher Scientific, 15596026) following the manufacturer’s instructions. Two different cell passages were used to extract RNA both for shAHCY and shCTRL cells and treated as a biological replicate. RNA quantity was determined using a Qubit 3.0 Fluorometer and Qubit® RNA BR Assay Kit (Thermo Fisher Scientific, Q33216, Q10211). Agilent 2100 Bioanalyzer and Agilent RNA 6000 Nano Kits (Agilent technologies, G2939AA, 5067-1511) were used to assess the sample quality. TruSeq Stranded mRNA Library Prep Kit (Illumina, NP-202–1001) was used to prepare libraries from 90 ng of total RNA. Collected libraries were analyzed on a Bioanalyzer 2100, diluted to 1.4 pM, and sequenced on an Illumina NextSeq500 System using NextSeq500/550 High-Output v2 Kit, with 75 cycles (Illumina, FC-404–2005). Run setup, direct data streaming, demultiplexing, and analysis were performed at the BaseSpace Sequence Hub (Illumina) using the RNA Express BaseSpace App with default analysis parameters. Signaling pathway analysis was done by Ingenuity Pathway Analysis software (IPA, Ingenuity Systems; see http://www.ingenuity.com) The IPA Core Analysis was run with the Causal Network analysis option on the uploaded datasets for transcriptome data. Additional relevant parameters include the measurement value type for transcriptome log2 (fold change), a cut-of range: −0.5–0.5; focus on: both up/down-regulated, and species: human. The p-value was calculated using the right-tailed Fisher’s exact test.
Western blotting Whole-cell proteins were obtained by cell scraping in cold lysis buffer. The pellet is resuspended in 300 µL of a previously prepared cell lysis buffer RIPA (150 mM NaCl, 50 mM Tris, 0.1% SDS, 0.5% sodium deoxycholate (DOC), 1% NP-40) supplemented with protease inhibitors cOmplete™ Mini Protease Inhibitor Cocktail (SIGMA) and phosphatase inhibitor sodium orthovanadate Na3VO4 (Thermo Scientific) at a final concentration of 1 mM. Following sonication on ice (Misonix XL2000 Microson, 5.5 settings). After centrifugation at 14,000 rpm at +4 °C. The protein concentration in the supernatant was determined using a Pierce BCA Protein Assay Kit (Thermo Fisher Scientific, 23225). Proteins were separated by SDS-PAGE electrophoresis and transferred onto nitrocellulose membranes using the Trans-Blot® TurboTM Transfer System (BIO-RAD) and Mini Nitrocellulose Transfer Packs (BIO-RAD) according to the manufacturer's recommendations with turbo settings for transferring proteins of a wide range of molecular weights. To verify the successful transfer and quantify total proteins on the membrane, the proteins were briefly stained with a Ponceau S solution (0.1% Ponceau S, 5% acetic acid) and then rinsed with TBS-T buffer (Tris Buffered Saline Tween; 50 mM Tris-HCl (pH 7.5), 150 mM NaCl, 0.1% Tween-20). The membrane was then blocked with blocking buffer (5% non-fat milk powder in TBS-T, Sigma) for 1 hour at room temperature (RT) and washed 3 times for 15 minutes with TBS-T buffer (Sigma). The appropriate primary antibodies, e.g. anti-AHCY (ab134966 Abcam), anti-LEF1 (sc-374522, Santa Cruz Biotechnology), anti-STAT3 (sc-8019, Santa Cruz Biotechnology), and anti-GAPDH (ab9458, Abcam) were diluted in blocking buffer according to the manufacturer's recommendation, and the membranes were incubated with it for 2 hours at RT or overnight at +4oC, respectively. The membranes were washed 3 times for 15 minutes with wash buffer, and the mouse IgG Fc binding protein Horseradish Peroxidase (HRP) conjugated secondary antibody (sc-525409, Santa Cruz Biotechnology), diluted in blocking buffer according to the manufacturer's recommendation, was added for incubation at RT for 1 hour for STAT3 and LEF1 membranes. Accordingly, the HRP conjugated secondary Goat Anti-Rabbit IgG H&L antibody (ab6721, Abcam) was used for AHCY and GAPDH detection, respectively. Afterwards, the membranes were washed 3 times for 15 minutes with wash buffer. The chemiluminescent signal was developed using the ClarityTM Western ECL Blotting Substrate (BIO-RAD) kit according to the manufacturer's recommendation and detected using Alliance Q9 Mini (UVITEC). Densitometry analysis of the signal on the membrane images was performed using the ImageJ software.
Determination of SAM and SAH by LC–MS/MS. The liquid chromatography linked to the tandem mass spectrometry method for the determination of S-adenosylmethionine (SAM) and S-adenosylhomocysteine (SAH) in human cells was developed as a modification of a previously published method by Kozich laboratory. Namely, instead of using perchloric acid, we modified procedures in favor of ammonium formate. Stock solutions of SAM and SAH were prepared as 1 mg/mL solutions in cold Milli-Q water (MERCK MILLIPORE, Synergy). Since SAM and [2 H3]-SAM were obtained as p-toluene sulfonate salts, exact concentrations were determined by UV-spectroscopy (molar extinction coefficient ε=15400). Aliquots (0.1 mL) of SAM and SAH stock solutions were diluted together in Milli-Q water to yield concentrations of 10 μg/mL for each substance. [2 H3]-SAM was diluted with 0.1% FA in Milli-Q water. [13C5]-SAH was obtained from 30.3 μg/mL solution in Milli-Q water. Spiked solutions of labeled SAM and SAH were prepared by dilution of [2 H3]-SAM in Milli-Q water and with the addition of [13C5]-SAH. All standard solutions were stored at −20 °C. The calibration samples were prepared from SAM and SAH stock solutions in 1 M trifluoroacetic acid (TFA) with the addition of isotope-labeled internal standard solution (10 μL of spike solution [2 H3]-SAM 7.54 μg/mL and [13C5]-SAH 2.66 μg/mL). The calibration samples were neutralized with a 5 M solution of ammonium formate just before analysis, and the total volume of each calibration sample was 300μL. The particular calibration points of SAM and SAH were 11, 28, 56, 111, 333, 833, 1333, and 1666 ng/mL. QC samples were prepared as 333 ng/mL of 1 M TFA/5 M ammonium formate solution SAM and SAH spiked with the same volume of internal standard solution. The calibration curve was obtained by linear regression, and the peak area ratio (analyte/internal standard) was plotted versus the analyte concentration. Cells were grown in 10-cm plates, and after reaching 80% confluence, they were briefly washed in PBS. Lysis was performed in 1 M TFA on ice. The homogenate was briefly sonicated and cleared after centrifugation at 16 000 × g for 10 min at +4 °C. A 100-µL aliquot of cellular homogenate was spiked with internal standard solution (10μL of spike solution [2 H3]-SAM 7.54 μg/mL and [13C5]-SAH 2.66 μg/mL). Samples were neutralized with 190 µL of 5 M solution of ammonium formate just before analysis, and a clear solution was injected into the LC column. LC–MS/MS analysis was carried out using an Agilent Technologies 1200 series HPLC system equipped with a binary pump, a vacuum membrane degasser, an automated autosampler, and an injector interfaced with a 6420 triple quadrupole mass spectrometer with an electrospray ionization source (ESI; Agilent Technologies Inc. Palo Alto, CA, USA). The separation was performed on a Kinetex C18 column (75×4.6 mm, 2.6 μm particle size) (Phenomenex, Torrance, USA). Solvents for the analysis were 0.1% FA in water (solvent A) and 0.1% FA in acetonitrile (solvent B). The gradient was applied as follows: 0 min at 100% A, 0–3 min at 100% A, 3–12 min at 100% A-10% A, 12–14 min at 10% A, 14–16 min at 10% A-90% A, and 16–25 min at 100% A. The flow rate was 0.3mL/ min. Between 2.5 and 15 min of each run, the eluent was diverted to the ion source, while at the beginning and end of the run, the eluent was diverted to the waste. The ESI was operated in a positive mode, and samples were detected in the multiple reaction monitoring (MRM) modes, with a dwell time of 200 ms per MRM transition. The desolvation gas temperature was 300 °C, with a flow rate of 8.0 L/min. The capillary voltage was 4.0 kV. The collision gas was nitrogen. The MRM transitions of the precursor to product ion pairs were m/z 399.3-250.3 for SAM, m/z 402.3-250.3 for [2 H3]-SAM, m/z 385.3-136 for SAH, and m/z 390.3-136.3 for [13C5]-SAH. The fragment voltage for SAM and [2 H3]-SAM was 100 V and the collision energy was set at 10 V. The fragment voltage for SAH and [13C5]-SAH was 100 V and the collision energy was set at 15 V. All data acquisition and processing were performed using Agilent MassHunter software.
Data Upload and Core Analysis: The preprocessed gene expression data were uploaded into IPA for pathway analysis using the Core Analysis module. Core Analysis integrates known biological pathways, molecular networks, and functional annotations to analyze the input data.
The IPA Core Analysis was run with the Causal Network analysis option on the uploaded datasets for transcriptome data, providing single datasets. Molecule Identification: IPA mapped the gene symbols from the uploaded data onto its knowledge base to identify the corresponding molecules. This step aimed to ensure that the input genes were correctly annotated and matched with the existing biological information.
Pathway Analysis: IPA performed Pathway Enrichment Analysis using Fisher's exact test to determine the statistical significance of pathway enrichment based on the input gene expression patterns. A p-value threshold of (-0.5,0.5) was used to identify significantly enriched pathways. Functional Analysis: IPA conducted functional analysis to identify the biological functions, diseases, and upstream regulators associated with the input dataset. This analysis involved the prediction of activation or inhibition of regulatory molecules based on the input data and known downstream effects.
Interpretation and Visualization: IPA's visualization tools, including pathway maps, network diagrams, and functional analysis results, were used to interpret and visualize the results of the pathway analysis. These visualizations aided in understanding the underlying biology and generating hypotheses.
Statistical Analysis in IPA: Statistical significance in pathway enrichment and functional analysis results was determined using appropriate statistical tests: Fisher's exact test and z-score calculation. Multiple testing corrections Bonferroni were applied to control for false discovery rate where applicable.
4.7. Statistical Analysis:
All data are presented as mean ± standard deviation (SD) of at least three independent experiments. Statistical analysis was performed using GraphPad Prism software (version 9.0.1) and differences between groups were analyzed using one-way ANOVA followed by Tukey's multiple comparison test. A p-value of less than 0.05 was considered statistically significant.
5. Conclusions
Our study investigated the impact of the knock-down of S-adenosyl homocysteine hydrolase (AHCY) on gene expression and subsequent changes on signaling pathways. in the model cell line SW480.
Our findings demonstrate that AHCY deficiency significantly affects the levels of LEF1 protein in SW480 cells, leading to metabolic and signaling shifts causing gene expression changes with broad effects on Wnt signaling, EMT, Cell Cycle Regulation Signaling, and the tumor microenvironment pathway with potential implications for enhanced proliferation, cell invasion and metastasis.The canonical Wnt pathway and LEF1 indicate interplay on several signaling levels, and demonstrate that LEF1 plays a crucial role in cancer survival and activity:
- Calcium Signaling: Calcium signaling can intersect with the non-canonical Wnt pathway through various mechanisms. Calcium ions can modulate the activity of Wnt signaling components, including LEF1, by affecting β-catenin stability, the interaction between β-catenin and LEF1, or downstream signaling events. The PCP pathway after Wnt activation is also responsible for gene expression regulation but also for cell cytoskeleton remodeling together with ROCK and JNK kinases. The WNT/Ca2+ pathway is associated with muscle contraction, gene transcription, and enzyme activation and activates both β-catenin-dependent and β-catenin-independent pathways.
- Epithelial-Mesenchymal Transition (EMT): LEF1, as a downstream effector of the canonical Wnt pathway, can participate in the regulation of EMT. EMT is a dynamic process involved in tissue remodeling and cancer progression. Activation of the canonical Wnt pathway, including the involvement of LEF1, has been linked to the induction or maintenance of EMT programs.
- G Protein-Coupled Receptor (GPCR) Signaling: GPCR signaling can intersect with the canonical Wnt pathway through various mechanisms. Wnt ligands can be activated by GPCRs kinases, leading to the activation of downstream signaling cascades, which can modulate the canonical Wnt pathway and potentially influence the activity of LEF1, and we see in our RNAseq data lower differential expression of GPCRs.
Our findings provide valuable insights into the molecular mechanisms underlying cancer progression and may contribute to the identification of potential therapeutic targets for intervention in AHCY-deficient cancer cells.
Supplementary Materials
The following supporting information can be downloaded at the website of this paper posted on Preprints.org.
Author Contributions
Oliver Vugrek conceived the study and designed the experiments with input from Filip Rokić and Ivana Pavičić. Lidija Brkljačić performed the SAM/SAH measurements. Ivana Pavičić handled cell cultures. Samples for RNA-Seq analysis were prepared by Filip Rokić, RNA-Seq was performed by Filip Rokić. Filip Rokić performed the computational analysis of the RNA-Seq data. Ivana Pavičić performed the computational analysis using IPA. Oliver Vugrek and Ivana Pavičić wrote the paper with input from the other authors. Conceptualization, O.V.; methodology, O.V.; software, F.R. and I.P.; validation, F.R., I.P. ; formal analysis, I.P.; investigation, I.P.; resources, O.V.; data curation, I.P.; writing—original draft preparation, I.P.; writing—review and editing, O.V.; visualization, O.V.; supervision, O.V.; project administration, O.V.; funding acquisition, O.V. All authors have read and agreed to the published version of the manuscript.
Funding
This research was funded by the Croatian Science Foundation project “Molecular aspects of disease pathogenesis in AHCY deficiency, grant number IP-2018-01-5632”, and internal resources of the Laboratory for Advanced Genomics.
Data Availability Statement
We encourage all authors of articles published in MDPI journals to share their research data. In this section, please provide details regarding where data supporting reported results can be found, including links to publicly archived datasets analyzed or generated during the study. Where no new data were created, or where data is unavailable due to privacy or ethical restrictions, a statement is still required. Suggested Data Availability Statements are available in section “MDPI Research Data Policies” at https://www.mdpi.com/ethics.
Acknowledgments
In this section, you can acknowledge any support given which is not covered by the author contribution or funding sections. This may include administrative and technical support, or donations in kind (e.g., materials used for experiments).
Conflicts of Interest
“The authors declare no conflict of interest.”
References
- Baric I, Fumic K, Glenn B, Cuk M, Schulze A, Finkelstein JD, James SJ, Mejaski-Bosnjak V, Pazanin L, Pogribny IP, Rados M, Sarnavka V, Scukanec-Spoljar M, Allen RH, Stabler S, Uzelac L, Vugrek O, Wagner C, Zeisel S, Mudd SH. S-adenosylhomocysteine hydrolase deficiency in a human: a genetic disorder of methionine metabolism. Proc Natl Acad Sci U S A. 2004 Mar 23;101(12):4234-9. [CrossRef]
- Santiago L, Daniels G, Wang D, Deng FM, Lee P. Wnt signaling pathway protein LEF1 in cancer, as a biomarker for prognosis and a target for treatment. Am J Cancer Res. 2017 Jun 1;7(6):1389-1406. PMID: 28670499; PMCID: PMC5489786.
- De La Haba G, Cantonini GL. The enzymatic synthesis of S-adenosyl-L-homocysteine from adenosine and homocysteine. J Biol Chem. 1959 Mar;234(3):603-8. 1: PMID, 1364.
- Borchardt RT, Huber JA, Wu YS. Potential inhibitors of S-adenosylmethionine-dependent methyltransferases. 4. Further modifications of the amino and base portions of S-adenosyl-L-homocysteine. J Med Chem. 1976 Sep;19(9):1094-9. [CrossRef] [PubMed]
- Loehrer FM, Angst CP, Brunner FP, Haefeli WE, Fowler B. Evidence for disturbed S-adenosylmethionine : S-adenosylhomocysteine ratio in patients with end-stage renal failure: a cause for disturbed methylation reactions? Nephrol Dial Transplant. 1998 Mar;13(3):656-61. [CrossRef] [PubMed]
- Caudill MA, Wang JC, Melnyk S, Pogribny IP, Jernigan S, Collins MD, Santos-Guzman J, Swendseid ME, Cogger EA, James SJ. Intracellular S-adenosylhomocysteine concentrations predict global DNA hypomethylation in tissues of methyl-deficient cystathionine beta-synthase heterozygous mice. J Nutr. 2001 Nov;131(11):2811-8. [CrossRef]
- Vugrek O, Beluzić R, Nakić N, Mudd SH. S-adenosylhomocysteine hydrolase (AHCY) deficiency: two novel mutations with lethal outcome. Hum Mutat. 2009 Apr;30(4):E555-65. [CrossRef]
- Grubbs R, Vugrek O, Deisch J, Wagner C, Stabler S, Allen R, Barić I, Rados M, Mudd SH. S-adenosylhomocysteine hydrolase deficiency: two siblings with fetal hydrops and fatal outcomes. J Inherit Metab Dis. 2010 Dec;33(6):705-13. [CrossRef] [PubMed]
- Buist NR, Glenn B, Vugrek O, Wagner C, Stabler S, Allen RH, Pogribny I, Schulze A, Zeisel SH, Barić I, Mudd SH. S-adenosylhomocysteine hydrolase deficiency in a 26-year-old man. J Inherit Metab Dis. 2006 Aug;29(4):538-45. [CrossRef]
- Beluzić R, Cuk M, Pavkov T, Fumić K, Barić I, Mudd SH, Jurak I, Vugrek O. A single mutation at Tyr143 of human S-adenosylhomocysteine hydrolase renders the enzyme thermosensitive and affects the oxidation state of bound cofactor nicotinamide-adenine dinucleotide. Biochem J. 2006 Dec 1;400(2):245-53. [CrossRef]
- Honzík T, Magner M, Krijt J, Sokolová J, Vugrek O, Belužić R, Barić I, Hansíkova H, Elleder M, Veselá K, Bauerová L, Ondrušková N, Ješina P, Zeman J, Kožich V. Clinical picture of S-adenosylhomocysteine hydrolase deficiency resembles phosphomannomutase 2 deficiency. Mol Genet Metab. 2012 Nov;107(3):611-3. [CrossRef] [PubMed]
- Luo X, Xiao Y, Song F, Yang Y, Xia M, Ling W. Increased plasma S-adenosyl-homocysteine levels induce the proliferation and migration of VSMCs through an oxidative stress-ERK1/2 pathway in apoE(-/-) mice. Cardiovasc Res. 2012 Jul 15;95(2):241-50. [CrossRef] [PubMed]
- Motzek A, Knežević J, Switzeny OJ, Cooper A, Barić I, Beluzić R, Strauss KA, Puffenberger EG, Mudd SH, Vugrek O, Zechner U. Abnormal Hypermethylation at Imprinting Control Regions in Patients with S-Adenosylhomocysteine Hydrolase (AHCY) Deficiency. PLoS One. 2016 Mar 14;11(3):e0151261. [CrossRef]
- Stender S, Chakrabarti RS, Xing C, Gotway G, Cohen JC, Hobbs HH. Adult-onset liver disease and hepatocellular carcinoma in S-adenosylhomocysteine hydrolase deficiency. Mol Genet Metab. 2015 Dec;116(4):269-74. [CrossRef]
- J.F. Leal, I. J.F. Leal, I. Ferrer, C. Blanco-Aparicio, J. Hernández-Losa, S. Ramón y Cajal, A. Carnero, M.E. LLeonart. "S-adenosylhomocysteine hydrolase downregulation contributes to tumorigenesis." Carcinogenesis, Volume 29, Issue 11, 08, Pages 2089-2095. 20 November. [CrossRef]
- Anastas JN, Moon RT. Wnt signalling pathways as therapeutic targets in cancer. Nat Rev Cancer. 2013 Jan;13(1):11-26. [CrossRef] [PubMed]
- Atcha FA, Syed A, Wu B, Hoverter NP, Yokoyama NN, Ting JH, Munguia JE, Mangalam HJ, Marsh JL, Waterman ML. A unique DNA binding domain converts T-cell factors into strong Wnt effectors. Mol Cell Biol. 2007 Dec;27(23):8352-63. [CrossRef] [PubMed]
- Hovanes K, Li TW, Munguia JE, Truong T, Milovanovic T, Lawrence Marsh J, Holcombe RF, Waterman ML. Beta-catenin-sensitive isoforms of lymphoid enhancer factor-1 are selectively expressed in colon cancer. Nat Genet. 2001 May;28(1):53-7. [CrossRef] [PubMed]
- He TC, Sparks AB, Rago C, Hermeking H, Zawel L, da Costa LT, Morin PJ, Vogelstein B, Kinzler KW. Identification of c-MYC as a target of the APC pathway. Science. 1998 Sep 4;281(5382):1509-12. [CrossRef] [PubMed]
- The cyclin D1 gene is a target of the beta-catenin/LEF-1 pathway. Proc Natl Acad Sci U S A. 1999 ;96(10):5522-7. 11 May. [CrossRef]
- Huang C, Qin D. Role of Lef1 in sustaining self-renewal in mouse embryonic stem cells. J Genet Genomics. 2010 Jul;37(7):441-9. [CrossRef] [PubMed]
- Kim CG, Chung IY, Lim Y, Lee YH, Shin SY. A Tcf/Lef element within the enhancer region of the human NANOG gene plays a role in promoter activation. Biochem Biophys Res Commun. 2011 Jul 8;410(3):637-42. [CrossRef] [PubMed]
- Reya T, Clevers H. Wnt signalling in stem cells and cancer. Nature. 2005 Apr 14;434(7035):843-50. [CrossRef] [PubMed]
- Rieger ME, Sims AH, Coats ER, Clarke RB, Briegel KJ. The embryonic transcription cofactor LBH is a direct target of the Wnt signaling pathway in epithelial development and in aggressive basal subtype breast cancers. Mol Cell Biol. 2010 Sep;30(17):4267-79. [CrossRef]
- Cole MF, Johnstone SE, Newman JJ, Kagey MH, Young RA. Tcf3 is an integral component of the core regulatory circuitry of embryonic stem cells. Genes Dev. 2008 Mar 15;22(6):746-55. [CrossRef]
- Filali M, Cheng N, Abbott D, Leontiev V, Engelhardt JF. Wnt-3A/beta-catenin signaling induces transcription from the LEF-1 promoter. J Biol Chem. 2002 Sep 6;277(36):33398-410. [CrossRef] [PubMed]
- Jung HC, Kim K. Identification of MYCBP as a beta-catenin/LEF-1 target using DNA microarray analysis. Life Sci. 2005 Jul 29;77(11):1249-62. [CrossRef] [PubMed]
- Brabletz T, Jung A, Dag S, Hlubek F, Kirchner T. beta-catenin regulates the expression of the matrix metalloproteinase-7 in human colorectal cancer. Am J Pathol. 1999 Oct;155(4):1033-8. [CrossRef]
- Crawford HC, Fingleton BM, Rudolph-Owen LA, Goss KJ, Rubinfeld B, Polakis P, Matrisian LM. The metalloproteinase matrilysin is a target of beta-catenin transactivation in intestinal tumors. Oncogene. 1999 ;18(18):2883-91. 6 May. [CrossRef] [PubMed]
- Ling L, Nurcombe V, Cool SM. Wnt signaling controls the fate of mesenchymal stem cells. Gene. 2009 Mar 15;433(1-2):1-7. [CrossRef] [PubMed]
- Boyer LA, Lee TI, Cole MF, Johnstone SE, Levine SS, Zucker JP, Guenther MG, Kumar RM, Murray HL, Jenner RG, Gifford DK, Melton DA, Jaenisch R, Young RA. Core transcriptional regulatory circuitry in human embryonic stem cells. Cell. 2005 Sep 23;122(6):947-56. [CrossRef]
- Hay DC, Sutherland L, Clark J, Burdon T. Oct-4 knockdown induces similar patterns of endoderm and trophoblast differentiation markers in human and mouse embryonic stem cells. Stem Cells. 2004;22(2):225-35. [CrossRef] [PubMed]
- Satoh Y, Matsumura I, Tanaka H, Ezoe S, Sugahara H, Mizuki M, Shibayama H, Ishiko E, Ishiko J, Nakajima K, Kanakura Y. Roles for c-Myc in self-renewal of hematopoietic stem cells. J Biol Chem. 2004 Jun 11;279(24):24986-93. [CrossRef] [PubMed]
- Baldin V, Lukas J, Marcote MJ, Pagano M, Draetta G. Cyclin D1 is a nuclear protein required for cell cycle progression in G1. Genes Dev. 1993 May;7(5):812-21. [CrossRef] [PubMed]
- He TC, Sparks AB, Rago C, Hermeking H, Zawel L, da Costa LT, Morin PJ, Vogelstein B, Kinzler KW. Identification of c-MYC as a target of the APC pathway. Science. 1998 Sep 4;281(5382):1509-12. [CrossRef] [PubMed]
- Shtutman M, Zhurinsky J, Simcha I, Albanese C, D'Amico M, Pestell R, Ben-Ze'ev A. The cyclin D1 gene is a target of the beta-catenin/LEF-1 pathway. Proc Natl Acad Sci U S A. 1999 ;96(10):5522-7. 11 May. [CrossRef]
- Baek SH, Kioussi C, Briata P, Wang D, Nguyen HD, Ohgi KA, Glass CK, Wynshaw-Boris A, Rose DW, Rosenfeld MG. Regulated subset of G1 growth-control genes in response to derepression by the Wnt pathway. Proc Natl Acad Sci U S A. 2003 Mar 18;100(6):3245-50. [CrossRef]
- Guo X, Zhang R, Liu J, Li M, Song C, Dovat S, Li J, Ge Z. Characterization of LEF1 High Expression and Novel Mutations in Adult Acute Lymphoblastic Leukemia. PLoS One. 2015 ;10(5):e0125429. 5 May. [CrossRef]
- Li Y, Wang L, Zhang M, Melamed J, Liu X, Reiter R, Wei J, Peng Y, Zou X, Pellicer A, Garabedian MJ, Ferrari A, Lee P. LEF1 in androgen-independent prostate cancer: regulation of androgen receptor expression, prostate cancer growth, and invasion. Cancer Res. 2009 Apr 15;69(8):3332-8. [CrossRef]
- Petropoulos K, Arseni N, Schessl C, Stadler CR, Rawat VP, Deshpande AJ, Heilmeier B, Hiddemann W, Quintanilla-Martinez L, Bohlander SK, Feuring-Buske M, Buske C. A novel role for Lef-1, a central transcription mediator of Wnt signaling, in leukemogenesis. J Exp Med. 2008 Mar 17;205(3):515-22. [CrossRef]
- Waterman, ML. Lymphoid enhancer factor/T cell factor expression in colorectal cancer. Cancer Metastasis Rev. 2004 Jan-Jun;23(1-2):41-52. [CrossRef] [PubMed]
- Shelton DN, Fornalik H, Neff T, Park SY, Bender D, DeGeest K, Liu X, Xie W, Meyerholz DK, Engelhardt JF, Goodheart MJ. The role of LEF1 in endometrial gland formation and carcinogenesis. PLoS One. 2012;7(7):e40312. [CrossRef]
- Shelton DN, Fornalik H, Neff T, Park SY, Bender D, DeGeest K, Liu X, Xie W, Meyerholz DK, Engelhardt JF, Goodheart MJ. The role of LEF1 in endometrial gland formation and carcinogenesis. PLoS One. 2012;7(7):e40312. [CrossRef]
- Guo X, Zhang R, Liu J, Li M, Song C, Dovat S, Li J, Ge Z. Characterization of LEF1 High Expression and Novel Mutations in Adult Acute Lymphoblastic Leukemia. PLoS One. 2015 ;10(5):e0125429. 5 May. [CrossRef]
- Nguyen DX, Chiang AC, Zhang XH, Kim JY, Kris MG, Ladanyi M, Gerald WL, Massagué J. Wnt/TCF signaling through LEF1 and HOXB9 mediates lung adenocarcinoma metastasis. Cell. 2009 Jul 10;138(1):51-62. [CrossRef]
- Wang WJ, Yao Y, Jiang LL, Hu TH, Ma JQ, Ruan ZP, Tian T, Guo H, Wang SH, Nan KJ. Increased LEF1 expression and decreased Notch2 expression are strong predictors of poor outcomes in colorectal cancer patients. Dis Markers. 2013;35(5):395-405. [CrossRef]
- Lin AY, Chua MS, Choi YL, Yeh W, Kim YH, Azzi R, Adams GA, Sainani K, van de Rijn M, So SK, Pollack JR. Comparative profiling of primary colorectal carcinomas and liver metastases identifies LEF1 as a prognostic biomarker. PLoS One. 2011 Feb 24;6(2):e16636. [CrossRef]
- Lin AY, Chua MS, Choi YL, Yeh W, Kim YH, Azzi R, Adams GA, Sainani K, van de Rijn M, So SK, Pollack JR. Comparative profiling of primary colorectal carcinomas and liver metastases identifies LEF1 as a prognostic biomarker. PLoS One. 2011 Feb 24;6(2):e16636. [CrossRef]
- Wang WJ, Yao Y, Jiang LL, Hu TH, Ma JQ, Liao ZJ, Yao JT, Li DF, Wang SH, Nan KJ. Knockdown of lymphoid enhancer factor 1 inhibits colon cancer progression in vitro and in vivo. PLoS One. 2013 Oct 2;8(10):e76596. [CrossRef]
- Kim K, Lu Z, Hay ED. Direct evidence for a role of beta-catenin/LEF-1 signaling pathway in induction of EMT. Cell Biol Int. 2002;26(5):463-76. [CrossRef] [PubMed]
- Li TW, Ting JH, Yokoyama NN, Bernstein A, van de Wetering M, Waterman ML. Wnt activation and alternative promoter repression of LEF1 in colon cancer. Mol Cell Biol. 2006 Jul;26(14):5284-99. [CrossRef]
- Behrens J, von Kries JP, Kühl M, Bruhn L, Wedlich D, Grosschedl R, Birchmeier W. Functional interaction of beta-catenin with the transcription factor LEF-1. Nature. 1996 Aug 15;382(6592):638-42. [CrossRef] [PubMed]
- Hovanes K, Li TW, Munguia JE, Truong T, Milovanovic T, Lawrence Marsh J, Holcombe RF, Waterman ML. Beta-catenin-sensitive isoforms of lymphoid enhancer factor-1 are selectively expressed in colon cancer. Nat Genet. 2001 May;28(1):53-7. [CrossRef] [PubMed]
- Yokoyama NN, Pate KT, Sprowl S, Waterman ML. A role for YY1 in repression of dominant negative LEF-1 expression in colon cancer. Nucleic Acids Res. 2010 Oct;38(19):6375-88. [CrossRef]
- Hao YH, Lafita-Navarro MC, Zacharias L, Borenstein-Auerbach N, Kim M, Barnes S, Kim J, Shay J, DeBerardinis RJ, Conacci-Sorrell M. Induction of LEF1 by MYC activates the Wnt pathway and maintains cell proliferation. Cell Commun Signal. 2019 Oct 17;17(1):129. [CrossRef]
- Schmeckpeper J, Verma A, Yin L, Beigi F, Zhang L, Payne A, Zhang Z, Pratt RE, Dzau VJ, Mirotsou M. Inhibition of Wnt6 by Sfrp2 regulates adult cardiac progenitor cell differentiation by differential modulation of Wnt pathways. J Mol Cell Cardiol. 2015 Aug;85:215-25. [CrossRef]
- Zheng XL, Yu HG. Wnt6 contributes tumorigenesis and development of colon cancer via its effects on cell proliferation, apoptosis, cell-cycle and migration. Oncol Lett. 2018 Jul;16(1):1163-1172. [CrossRef]
- Li R, Wang C, Tong J, Su Y, Lin Y, Zhou X, Ye L. Wnt6 promotes the migration and differentiation of human dental pulp cells partly through c-Jun N-terminal kinase signaling pathway. J Endod. 2014 Jul;40(7):943-8. [CrossRef] [PubMed]
- Schmeckpeper J, Verma A, Yin L, Beigi F, Zhang L, Payne A, Zhang Z, Pratt RE, Dzau VJ, Mirotsou M. Inhibition of Wnt6 by Sfrp2 regulates adult cardiac progenitor cell differentiation by differential modulation of Wnt pathways. J Mol Cell Cardiol. 2015 Aug;85:215-25. [CrossRef]
- Zheng XL, Yu HG. Wnt6 contributes tumorigenesis and development of colon cancer via its effects on cell proliferation, apoptosis, cell-cycle and migration. Oncol Lett. 2018 Jul;16(1):1163-1172. [CrossRef]
- Kas K, Voz ML, Hensen K, Meyen E, Van de Ven WJ. Transcriptional activation capacity of the novel PLAG family of zinc finger proteins. J Biol Chem. 1998 Sep 4;273(36):23026-32. [CrossRef] [PubMed]
- Furukawa T, Adachi Y, Fujisawa J, Kambe T, Yamaguchi-Iwai Y, Sasaki R, Kuwahara J, Ikehara S, Tokunaga R, Taketani S. Involvement of PLAGL2 in activation of iron deficient- and hypoxia-induced gene expression in mouse cell lines. Oncogene. 2001 Aug 2;20(34):4718-27. [CrossRef] [PubMed]
- Wezensky SJ, Hanks TS, Wilkison MJ, Ammons MC, Siemsen DW, Gauss KA. Modulation of PLAGL2 transactivation by positive cofactor 2 (PC2), a component of the ARC/Mediator complex. Gene. 2010 Feb 15;452(1):22-34. [CrossRef]
- Li N, Li D, Du Y, Su C, Yang C, Lin C, Li X, Hu G. Overexpressed PLAGL2 transcriptionally activates Wnt6 and promotes cancer development in colorectal cancer. Oncol Rep. 2019 Feb;41(2):875-884. [CrossRef]
- Knoepfler PS, Zhang XY, Cheng PF, Gafken PR, McMahon SB, Eisenman RN. Myc influences global chromatin structure. EMBO J. 2006 Jun 21;25(12):2723-34. [CrossRef]
- Ma J, Zhao J, Lu J, Wang P, Feng H, Zong Y, Ou B, Zheng M, Lu A. Cadherin-12 enhances proliferation in colorectal cancer cells and increases progression by promoting EMT. Tumour Biol. 2016 Jul;37(7):9077-88. [CrossRef]
- Ofori-Acquah SF, King JA. Activated leukocyte cell adhesion molecule: a new paradox in cancer. Transl Res. 2008 Mar;151(3):122-8. [CrossRef]
- Degen, W. G. , & van Kempen, L. C. (2002). ALCAM: shedding light on the role of CD166 in normal and pathological cell processes. Tissue Antigens, 60(2), 89-98.
- Kuświk, M. , Bieńkowski, M., & Jankowska-Steifer, E. (2021). ALCAM (CD166) in Cancer Biology: More Than Just a Cell Adhesion Molecule. Cancers, 13(11). Hansen AG, Swart GW, Zijlstra A. ALCAM: Basis Sequence: Mouse. AFCS Nat Mol Pages. 2011;2011:10.1038/mp.a004126.01. [CrossRef]
- Villarejo A, Cortés-Cabrera A, Molina-Ortíz P, Portillo F, Cano A. Differential role of Snail1 and Snail2 zinc fingers in E-cadherin repression and epithelial to mesenchymal transition. J Biol Chem. 2014 Jan 10;289(2):930-41. [CrossRef]
- Derynck R, Akhurst RJ, Balmain A. TGF-beta signaling in tumor suppression and cancer progression. Nat Genet. 2001 Oct;29(2):117-29. [CrossRef] [PubMed]
- Hocevar BA, Mou F, Rennolds JL, Morris SM, Cooper JA, Howe PH. Regulation of the Wnt signaling pathway by disabled-2 (Dab2). EMBO J. 2003 Jun 16;22(12):3084-94. [CrossRef]
- Morrissey C, Brown LG, Pitts TE, Vessella RL, Corey E. Bone morphogenetic protein 7 is expressed in prostate cancer metastases and its effects on prostate tumor cells depend on cell phenotype and the tumor microenvironment. Neoplasia. 2010 Feb;12(2):192-205. [CrossRef]
- Fukumura D, Kashiwagi S, Jain RK. The role of nitric oxide in tumour progression. Nat Rev Cancer. 2006 Jul;6(7):521-34. [CrossRef] [PubMed]
- Artigiani S, Conrotto P, Fazzari P, Gilestro GF, Barberis D, Giordano S, Comoglio PM, Tamagnone L. Plexin-B3 is a functional receptor for semaphorin 5A. EMBO Rep. 2004 Jul;5(7):710-4. [CrossRef]
- Zhao GX, Xu YY, Weng SQ, Zhang S, Chen Y, Shen XZ, Dong L, Chen S. CAPS1 promotes colorectal cancer metastasis via Snail mediated epithelial mesenchymal transformation. Oncogene. 2019 Jun;38(23):4574-4589. [CrossRef] [PubMed]
- Cowell CF, Yan IK, Eiseler T, Leightner AC, Döppler H, Storz P. Loss of cell-cell contacts induces NF-kappaB via RhoA-mediated activation of protein kinase D1. J Cell Biochem. 2009 Mar 1;106(4):714-28. [CrossRef]
- Westhoff MA, Serrels B, Fincham VJ, Frame MC, Carragher NO. SRC-mediated phosphorylation of focal adhesion kinase couples actin and adhesion dynamics to survival signaling. Mol Cell Biol. 2004 Sep;24(18):8113-33. [CrossRef]
- Sethi JK, Vidal-Puig A. Wnt signalling and the control of cellular metabolism. Biochem J. 2010 Mar 15;427(1):1-17. [CrossRef]
- Tada M, Kai M. Noncanonical Wnt/PCP signaling during vertebrate gastrulation. Zebrafish. 2009;6(1):29–40.
- Goldsmith ZG, Dhanasekaran DN. G protein regulation of MAPK networks. Oncogene. 2007 ;26(22):3122-42. 14 May. [CrossRef] [PubMed]
- Clemm von Hohenberg K, Müller S, Schleich S, Meister M, Bohlen J, Hofmann TG, Teleman AA. Cyclin B/CDK1 and Cyclin A/CDK2 phosphorylate DENR to promote mitotic protein translation and faithful cell division. Nat Commun. 2022 Feb 3;13(1):668. [CrossRef]
- Harbour JW, Dean DC. The Rb/E2F pathway: expanding roles and emerging paradigms. Genes Dev. 2000 Oct 1;14(19):2393-409. [CrossRef] [PubMed]
- rimm D, Bauer J, Wise P, Krüger M, Simonsen U, Wehland M, Infanger M, Corydon TJ. The role of SOX family members in solid tumours and metastasis. Semin Cancer Biol. 2020 Dec;67(Pt 1):122-153. [CrossRef] [PubMed]
- Knoepfler PS, Zhang XY, Cheng PF, Gafken PR, McMahon SB, Eisenman RN. Myc influences global chromatin structure. EMBO J. 2006 Jun 21;25(12):2723-34. [CrossRef]
- Thiery JP, Sleeman JP. Complex networks orchestrate epithelial-mesenchymal transitions. Nat Rev Mol Cell Biol. 2006 Feb;7(2):131-42. [CrossRef] [PubMed]
- Hocevar BA, Mou F, Rennolds JL, Morris SM, Cooper JA, Howe PH. Regulation of the Wnt signaling pathway by disabled-2 (Dab2). EMBO J. 2003 Jun 16;22(12):3084-94. [CrossRef]
- Karlsson-Rosenthal C, Millar JB. Cdc25: mechanisms of checkpoint inhibition and recovery. Trends Cell Biol. 2006 Jun;16(6):285-92. [CrossRef] [PubMed]
- Liu Y, Zhu C, Tang L, Chen Q, Guan N, Xu K, Guan X. MYC dysfunction modulates stemness and tumorigenesis in breast cancer. Int J Biol Sci. 2021 Jan 1;17(1):178-187. [CrossRef]
- Li X, Wang J, Wu W, Gao H, Liu N, Zhan G, Li L, Han L, Guo X. Myeloid-derived suppressor cells promote epithelial ovarian cancer cell stemness by inducing the CSF2/p-STAT3 signalling pathway. FEBS J. 2020 Dec;287(23):5218-5235. [CrossRef]
- 88. Payapilly A, Guilbert R, Descamps T, White G, Magee P, Zhou C, Kerr A, Simpson KL, Blackhall F, Dive C, Malliri A. TIAM1-RAC1 promote small-cell lung cancer cell survival through antagonizing Nur77-induced BCL2 conformational change. Cell Rep. 2021 Nov 9;37(6):109979. [CrossRef]
- Li W, Huang G, Wei J, Cao H, Jiang G. ALKBH5 inhibits thyroid cancer progression by promoting ferroptosis through TIAM1-Nrf2/HO-1 axis. Mol Cell Biochem. 2023 Apr;478(4):729-741. [CrossRef] [PubMed]
Figure 3.
Wnt Signaling pathway. The diagram provides an overview of the major components and interactions within the Wnt signaling pathway such as LEF1 and TCF/LEF1 complex. The color assignments in IPA are based on statistical analyses, such as the z-score. The z-score compares the observed gene expression changes in a given dataset to a reference dataset, assessing the significance and direction of those changes. Positive z-scores indicate upregulation = red, orange=activated, whereas negative z-scores indicate downregulation = green, blue = inhibited, and z-scores close to zero indicate no significant change = no color. The color scheme employed in this figure is consistent with the color scheme utilized in all presented figures.
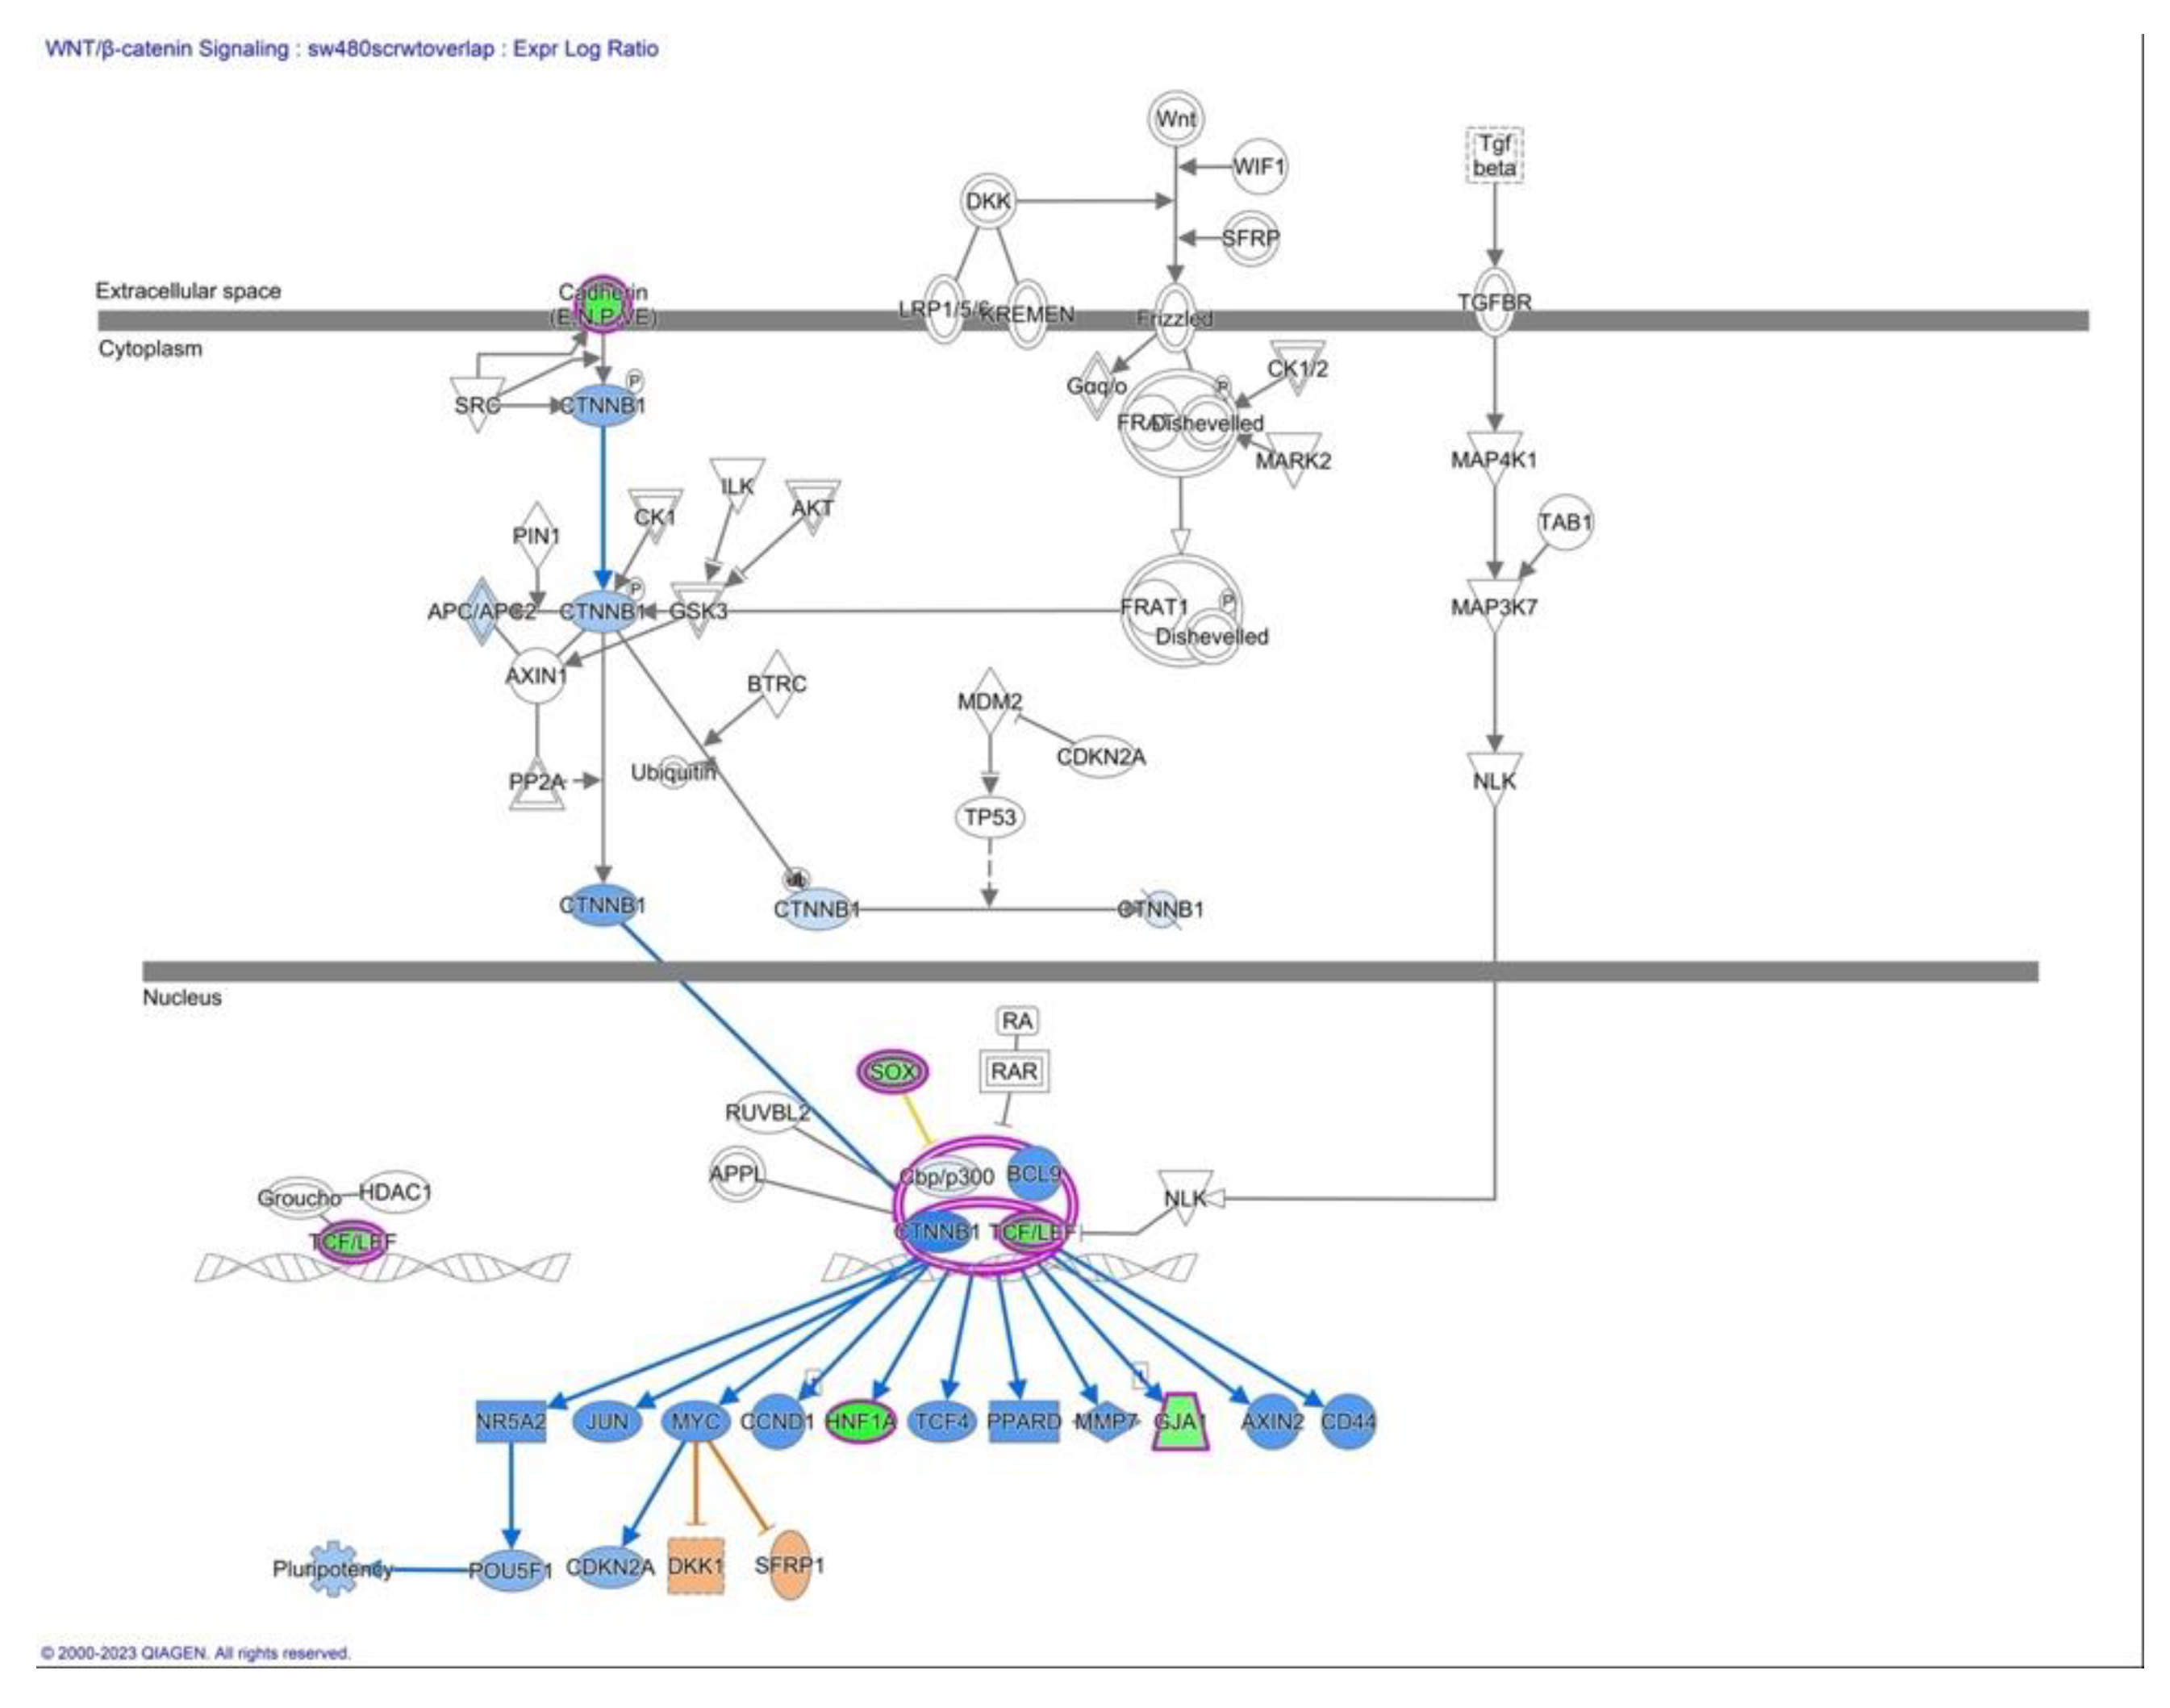
Figure 4.
IPA core analysis of the regulation of the Epithelial-Mesenchymal Transition Pathway in SW480 AHCY deficient cells, revealing the involvement of LEF1, a functional transcription factor forming part of the TCF/LEF complex, thereby exerting regulatory control over the expression of genes crucial for EMT.
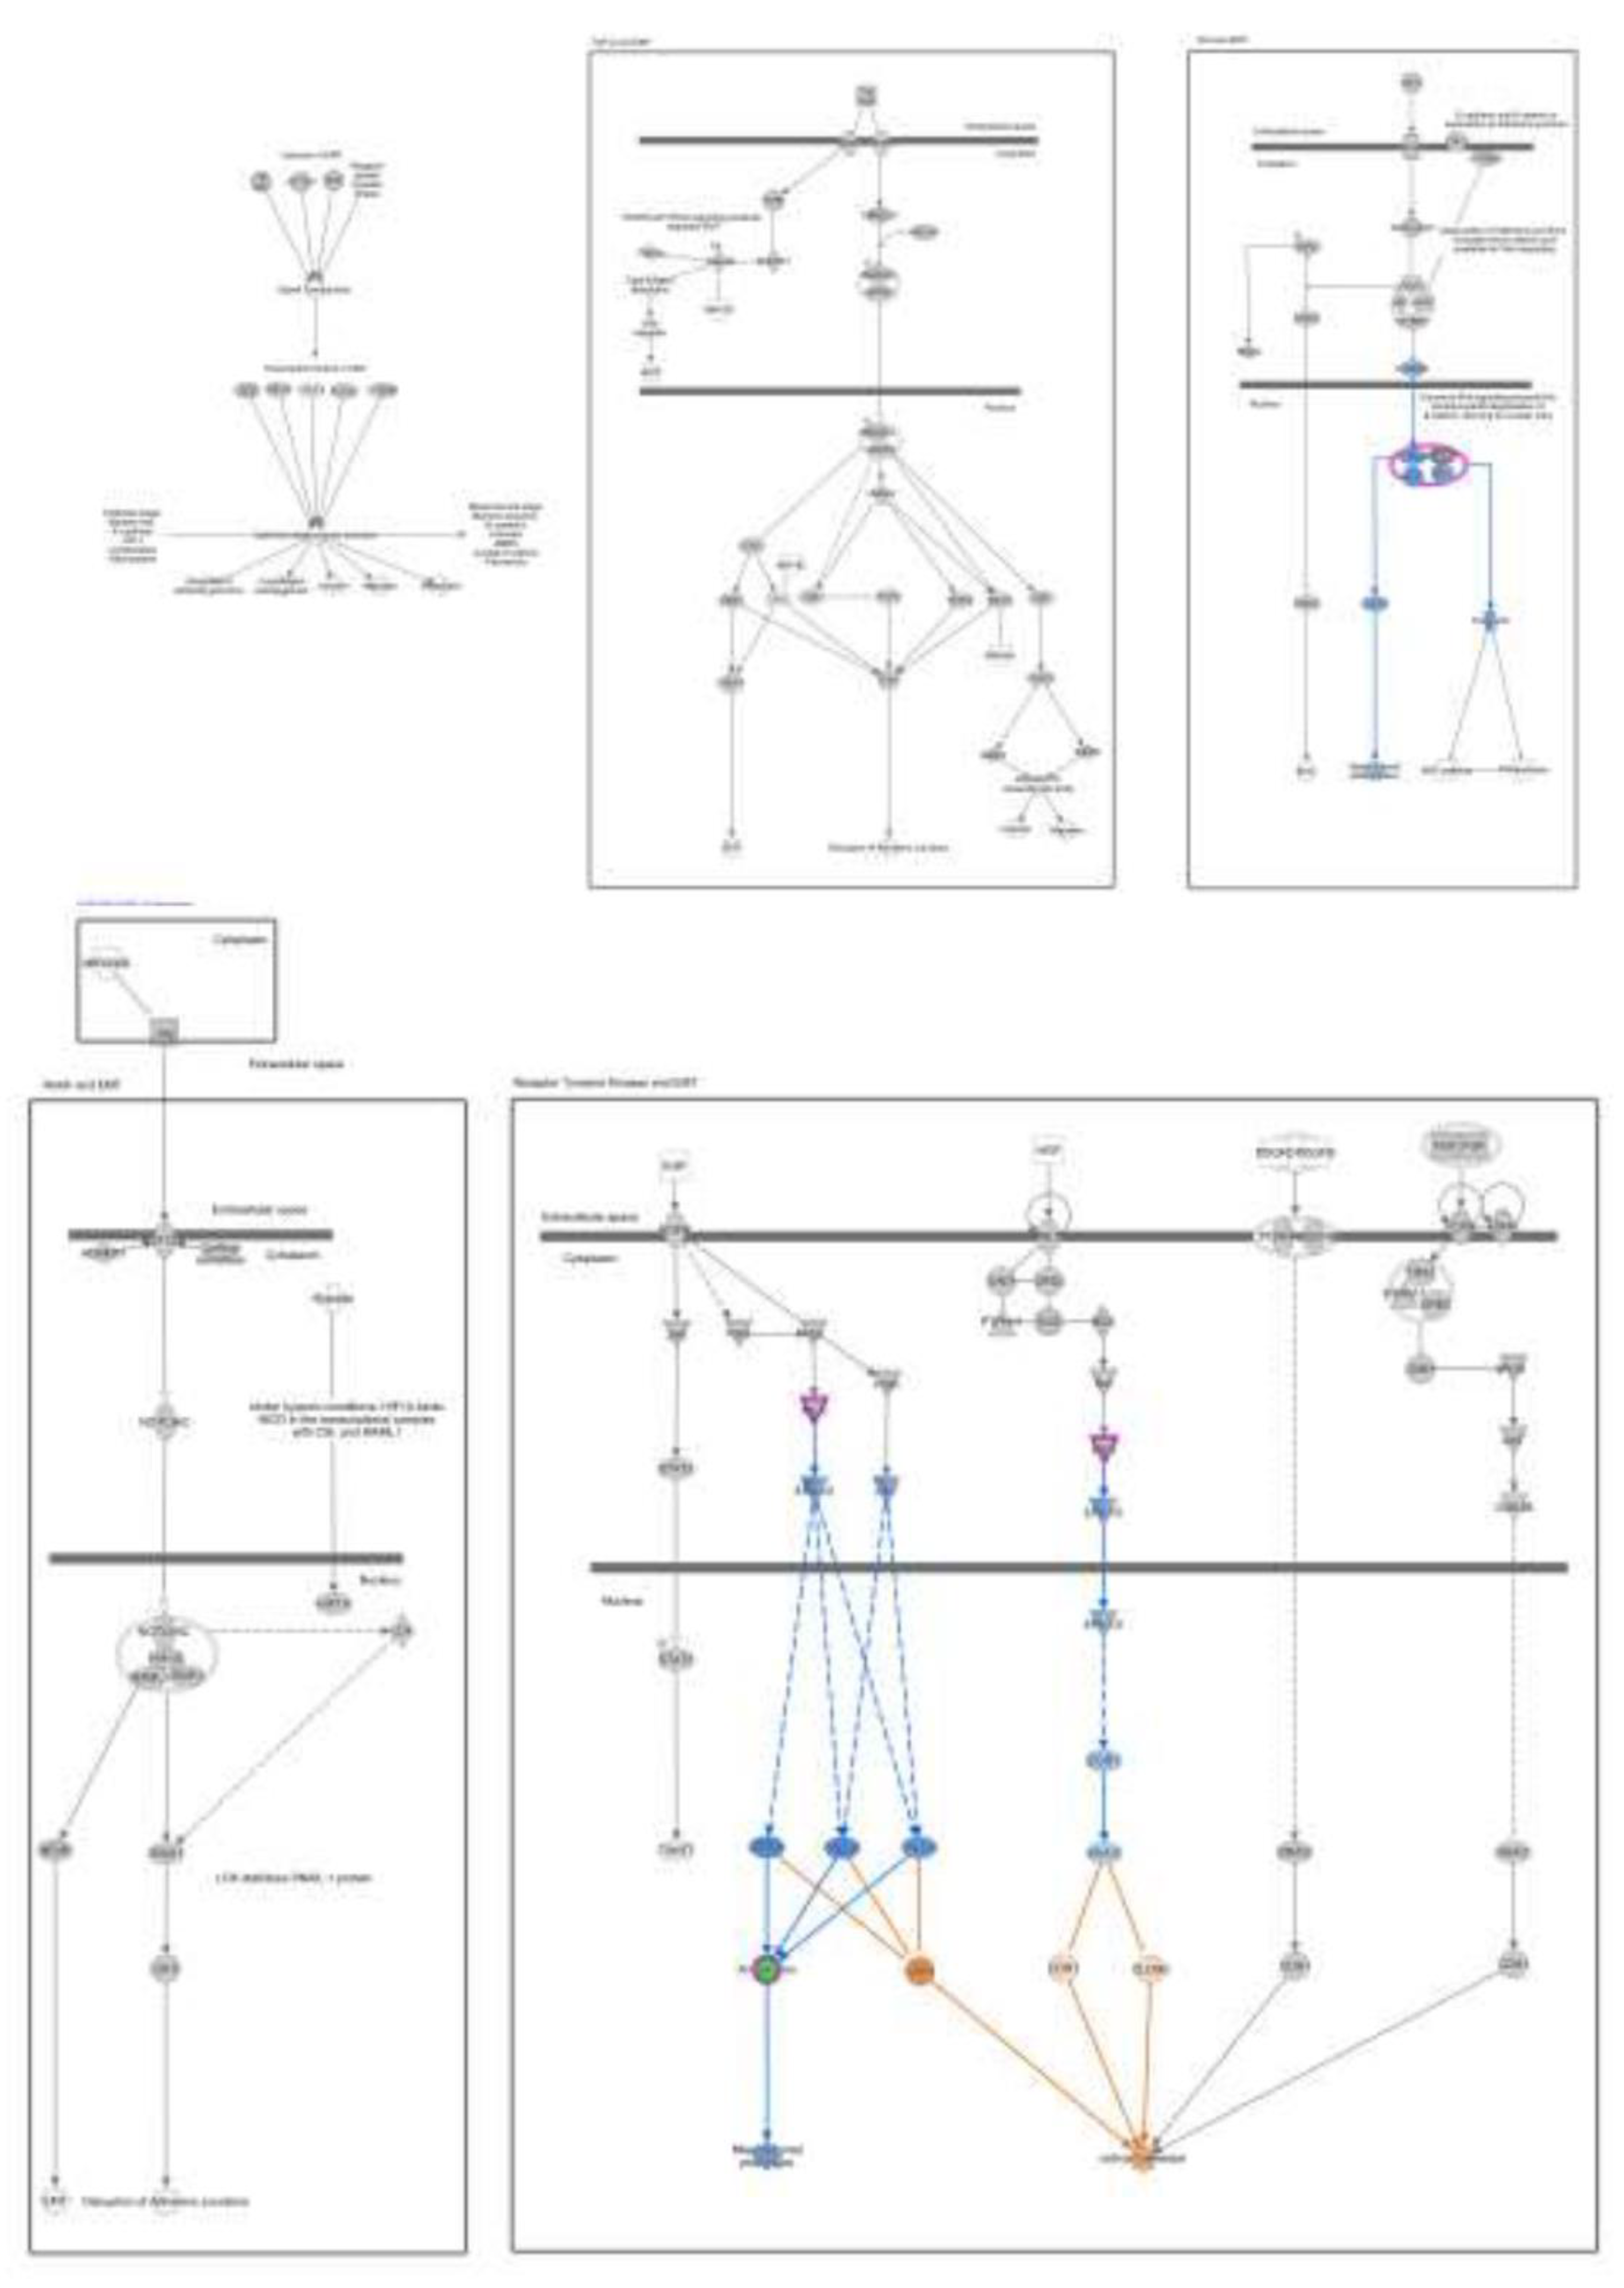
Figure 5.
IPA Core analysis of the Epithelial Adherens Junctions Signaling in SW480 AHCY deficient cells with increased expression of LEF1 protein. The accompanying Table 5 provides valuable insights into the transcriptional alterations observed in pivotal genes associated with Epithelial Adherens Junctions Signaling following differential expression analysis such as: CDH1, CDH2, TCF/ LEF1. Notably, there are changes in gene expression observed in the TCF/LEF complex, mirroring the patterns seen in the Wnt signaling pathway and the Regulation of the Epithelial-Mesenchymal Transition Pathway.

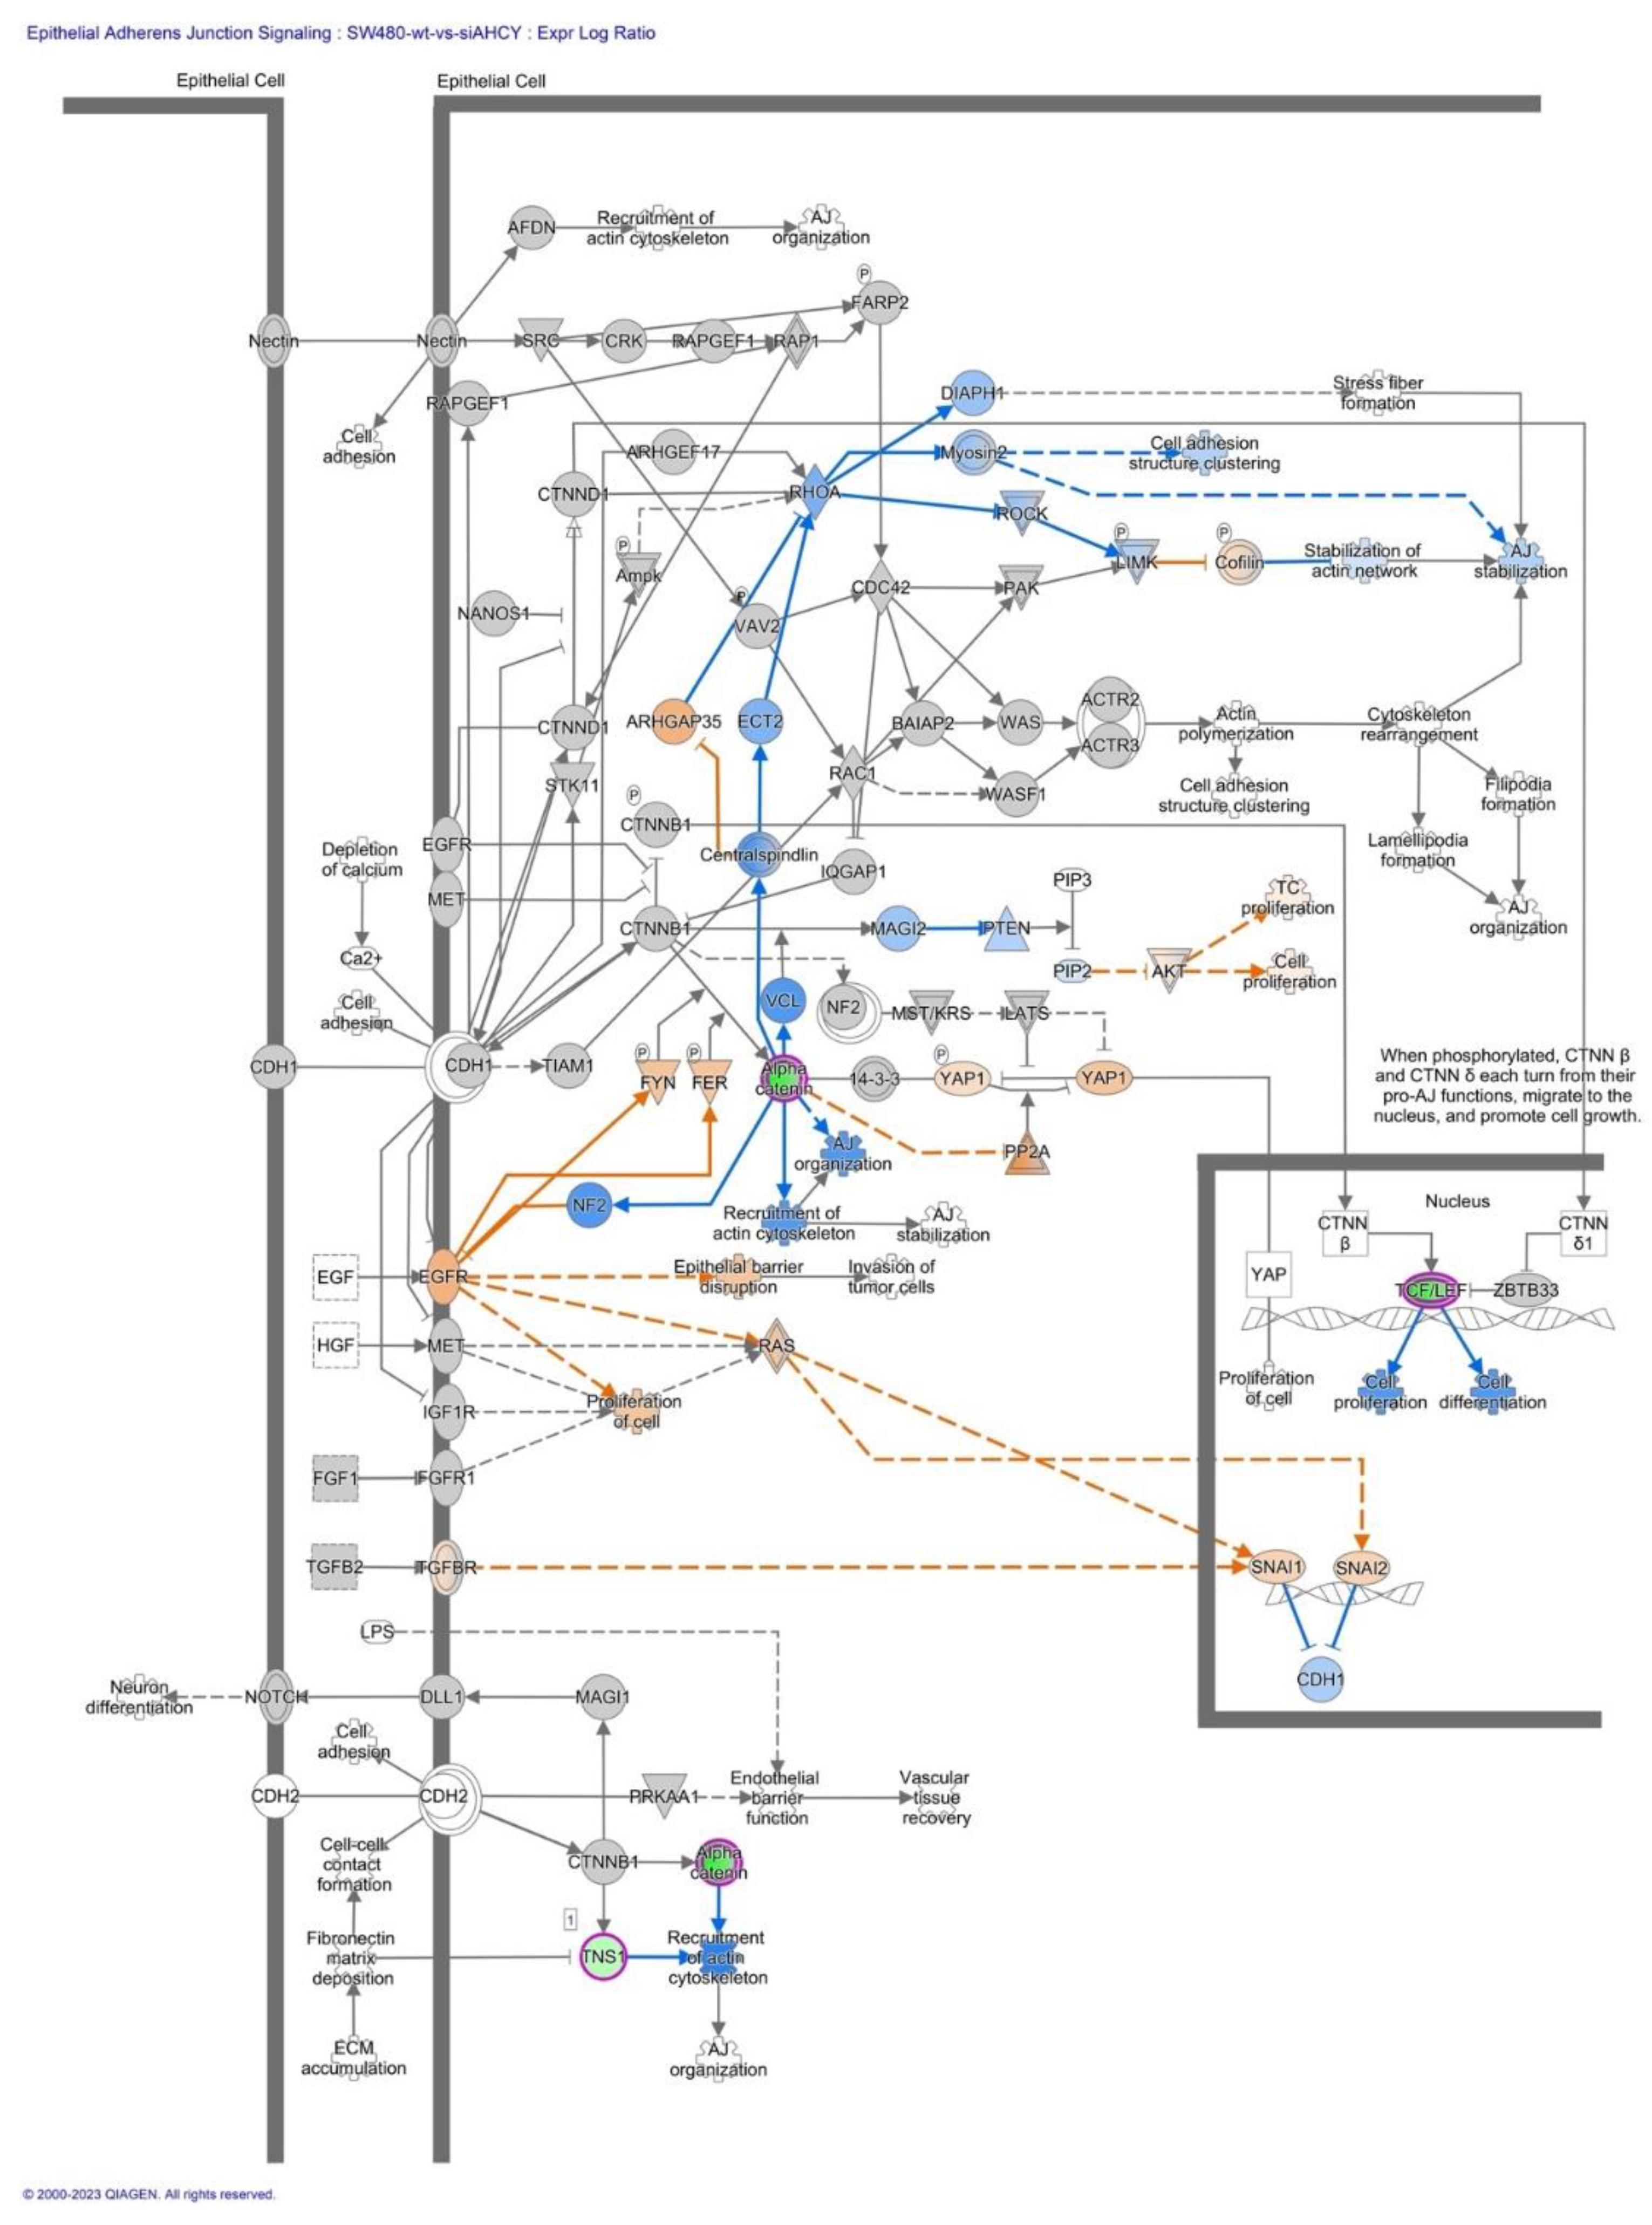
Figure 6.
IPA Core analysis of Differential Expression of Cyclins and Cell Cycle Regulation Signaling in SW480 AHCY deficient cells with increased expression of LEF1 protein. Notably, the transcript levels of Cyclin A, Cyclin B, and CDK1 were found to be significantly activated, indicating a potential modulation of cell cycle dynamics in response to AHCY deficiency. Cyclin B, in collaboration with CDK1, orchestrates the transition from the G2 phase to the mitotic phase, enabling successful cell division. The heightened expression of Cyclin B and CDK1 [52) implies an augmented drive toward mitosis, possibly reflecting a compensatory mechanism triggered by AHCY deficiency.
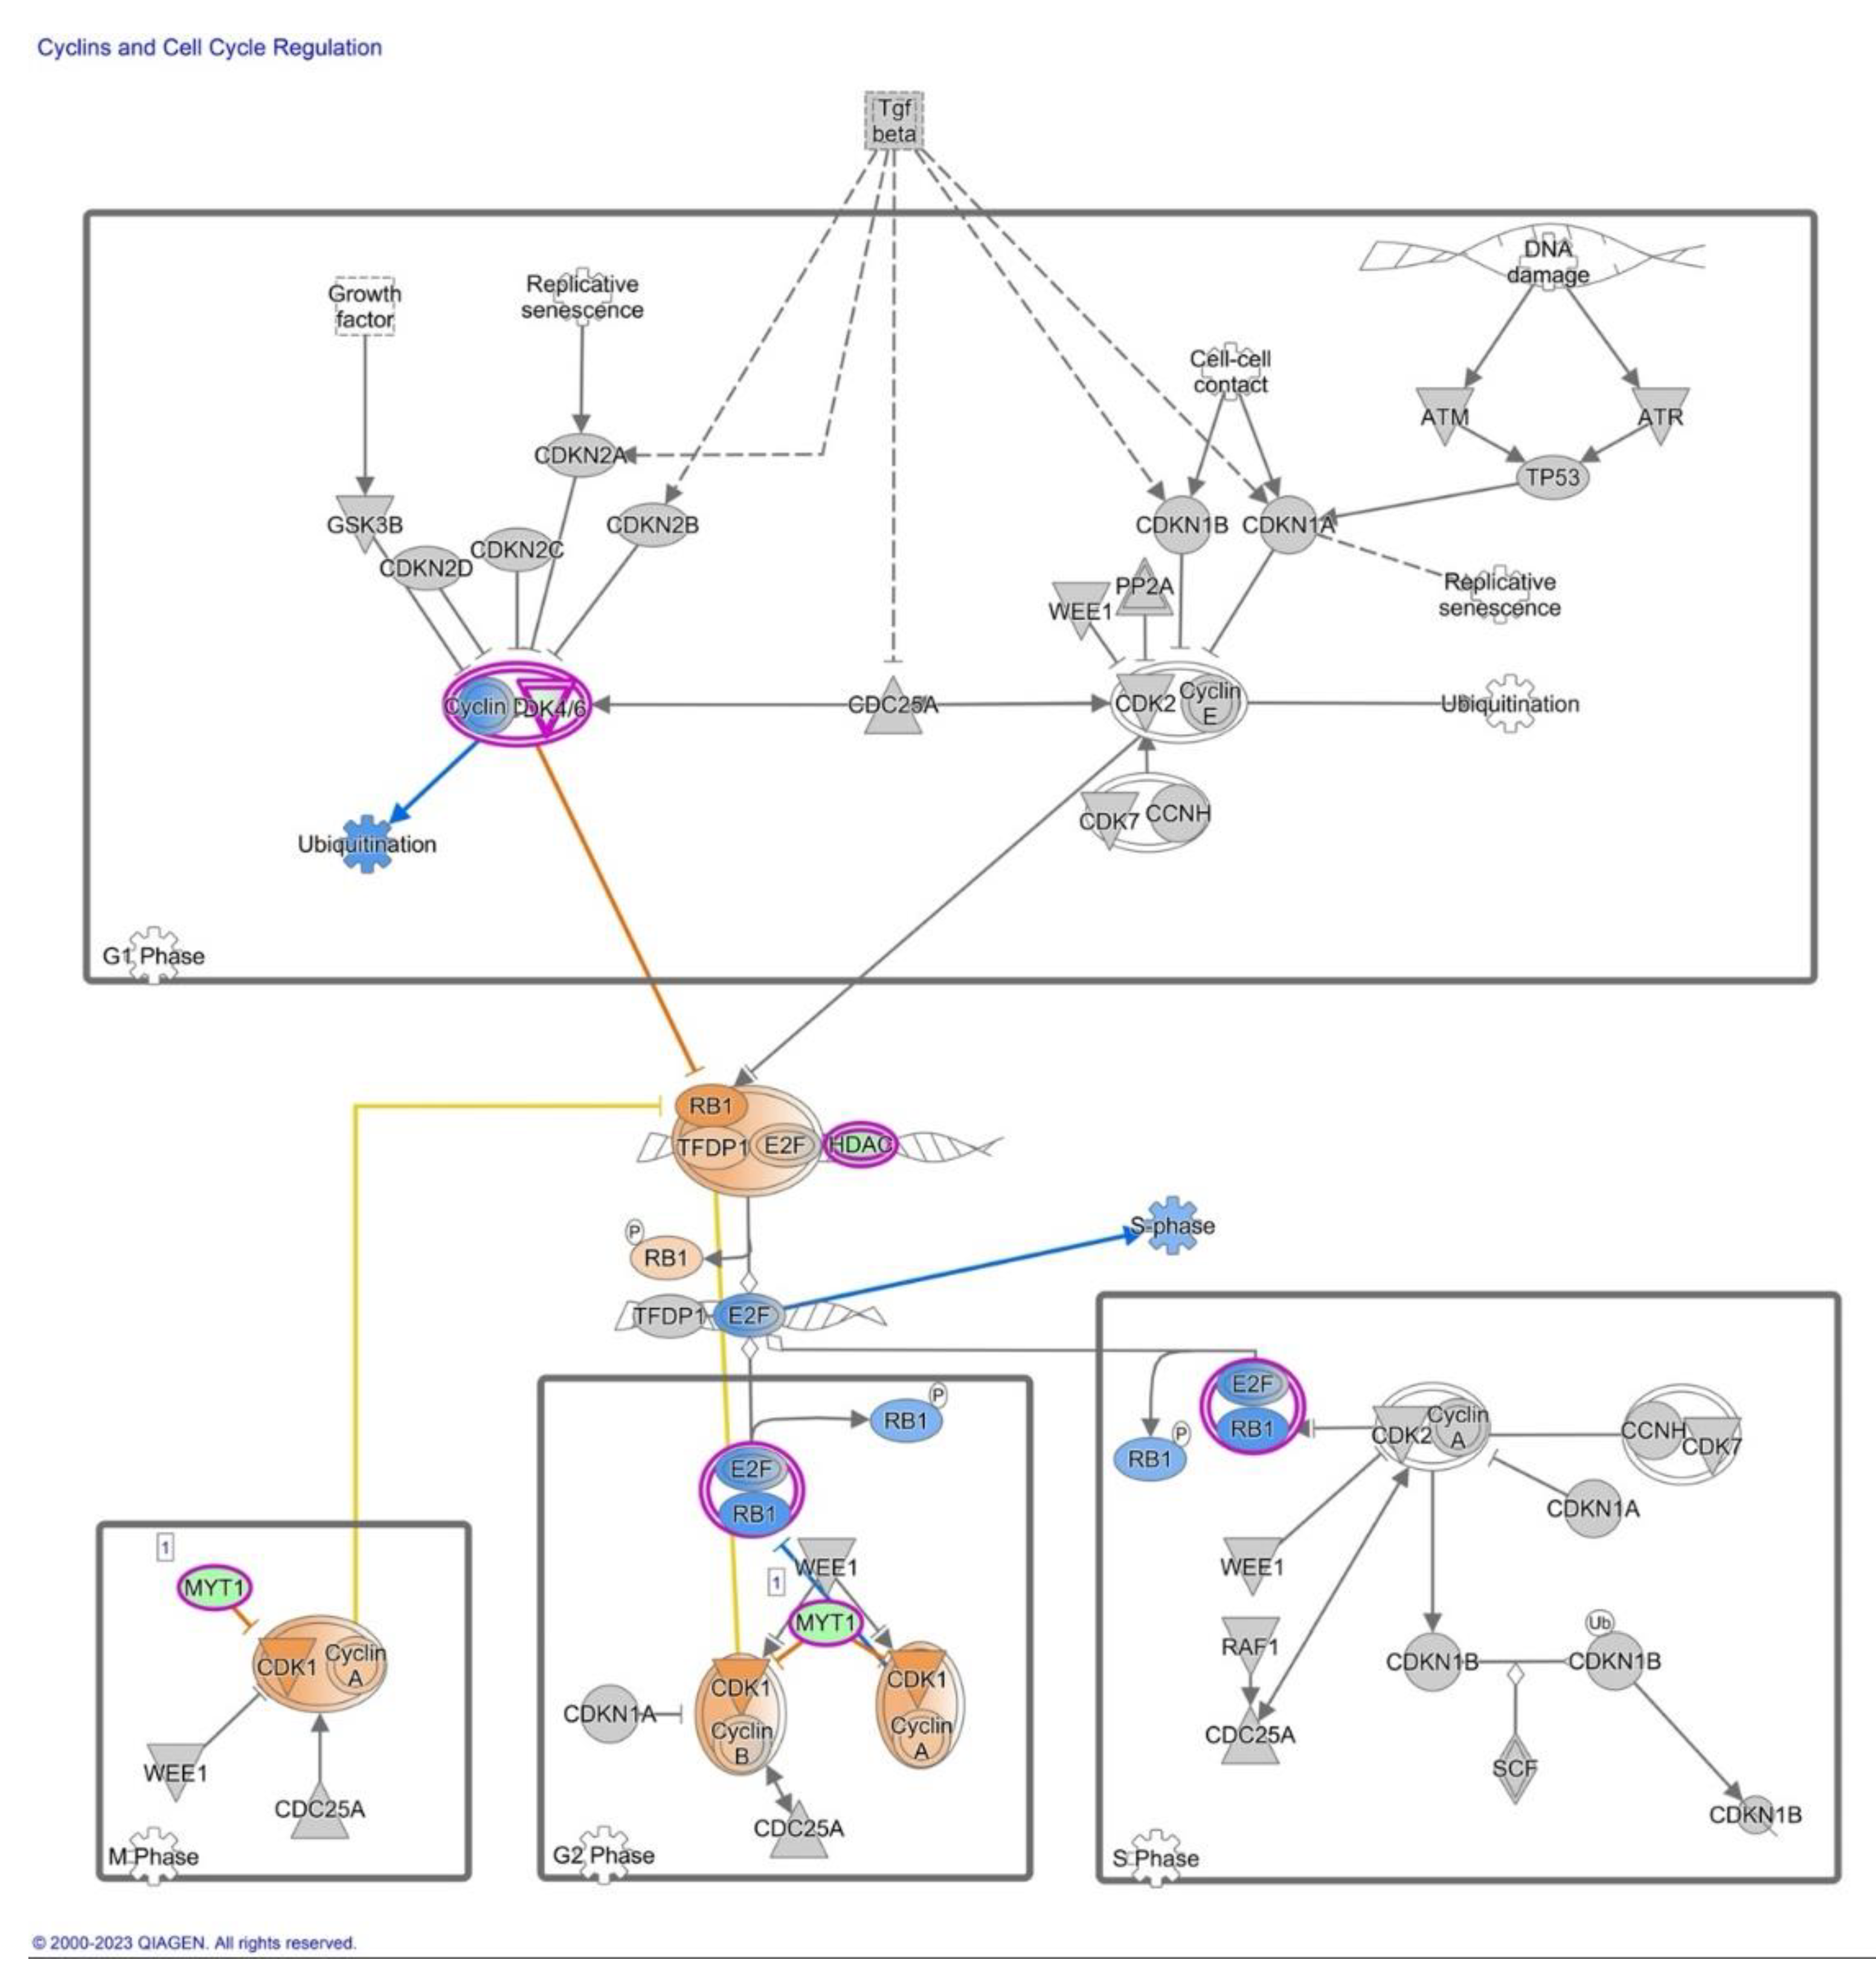
Figure 7.
MYC network; IPA Analysis indicates MYC dependent regulation of several proteins including, AHCY, SOX5, SON, OLR1, LGR5, and COL4A1, which expression levels were found to be significantly associated with MYC activity, indicating MYC as a potential master regulator.
Figure 7.
MYC network; IPA Analysis indicates MYC dependent regulation of several proteins including, AHCY, SOX5, SON, OLR1, LGR5, and COL4A1, which expression levels were found to be significantly associated with MYC activity, indicating MYC as a potential master regulator.
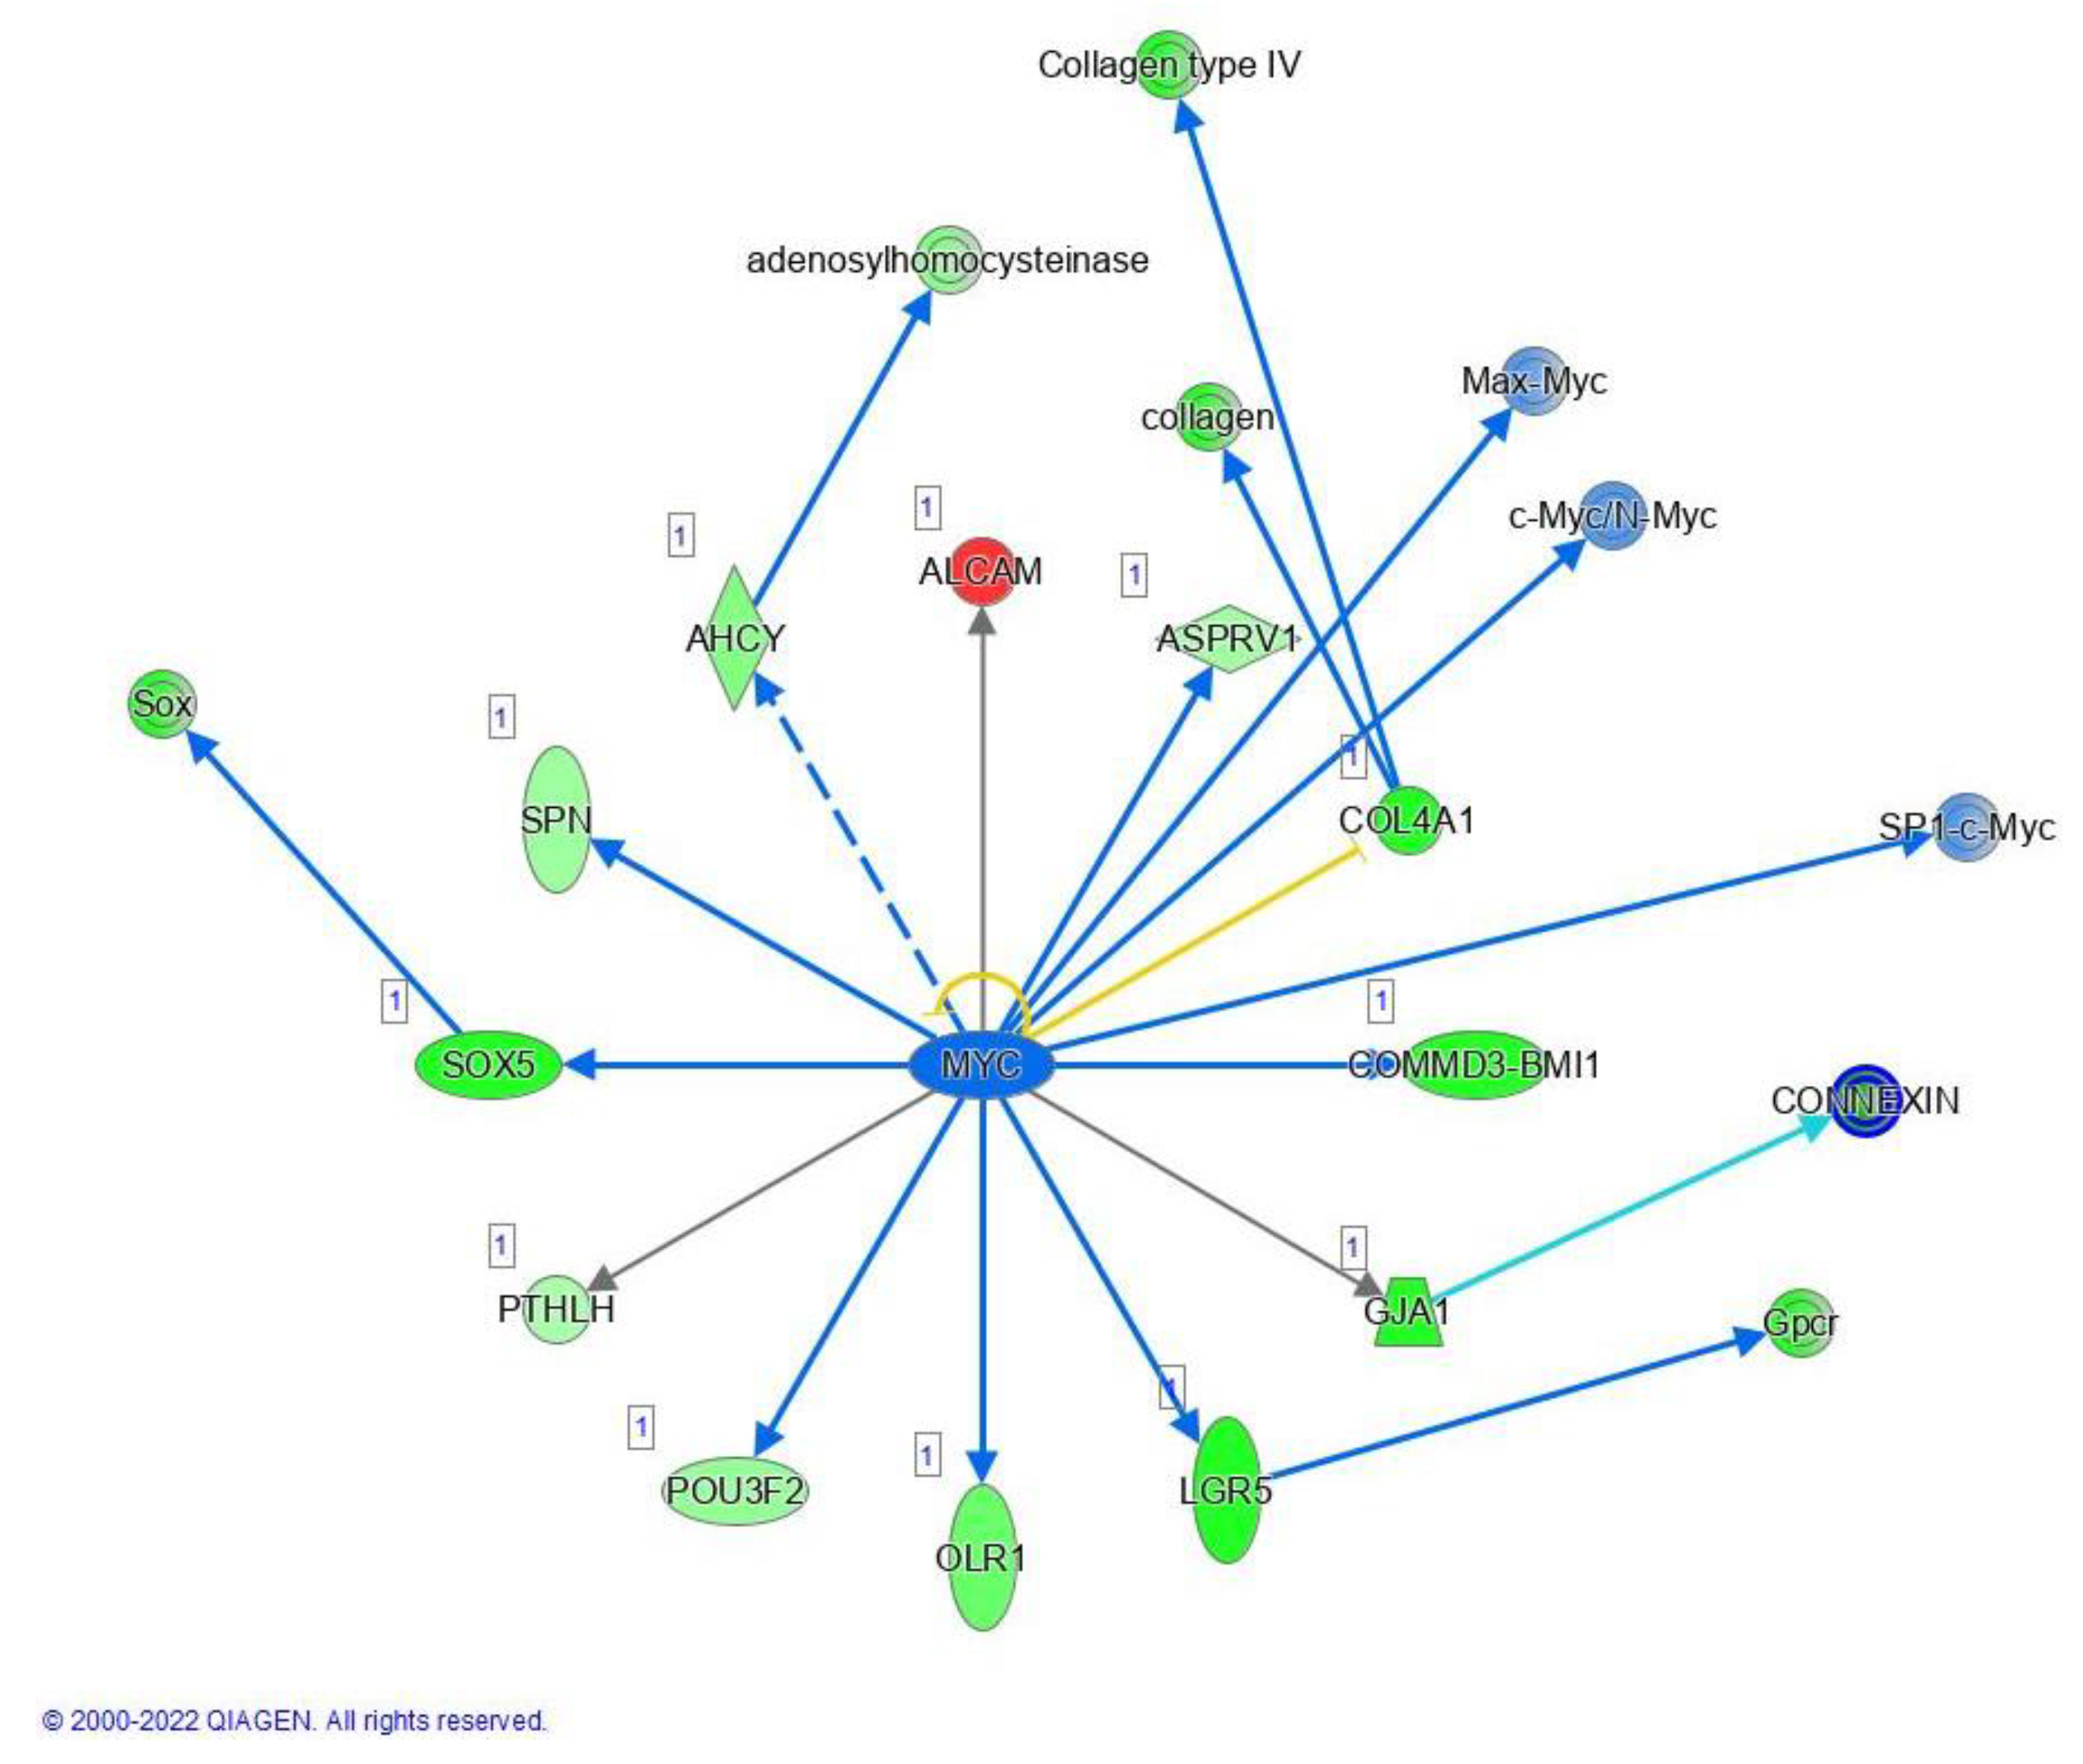
Figure 8.
IPA Core analysis of the Tumor Microenvironment Pathway in SW480 AHCY deficient cells with increased expression of LEF1 protein.
Figure 8.
IPA Core analysis of the Tumor Microenvironment Pathway in SW480 AHCY deficient cells with increased expression of LEF1 protein.
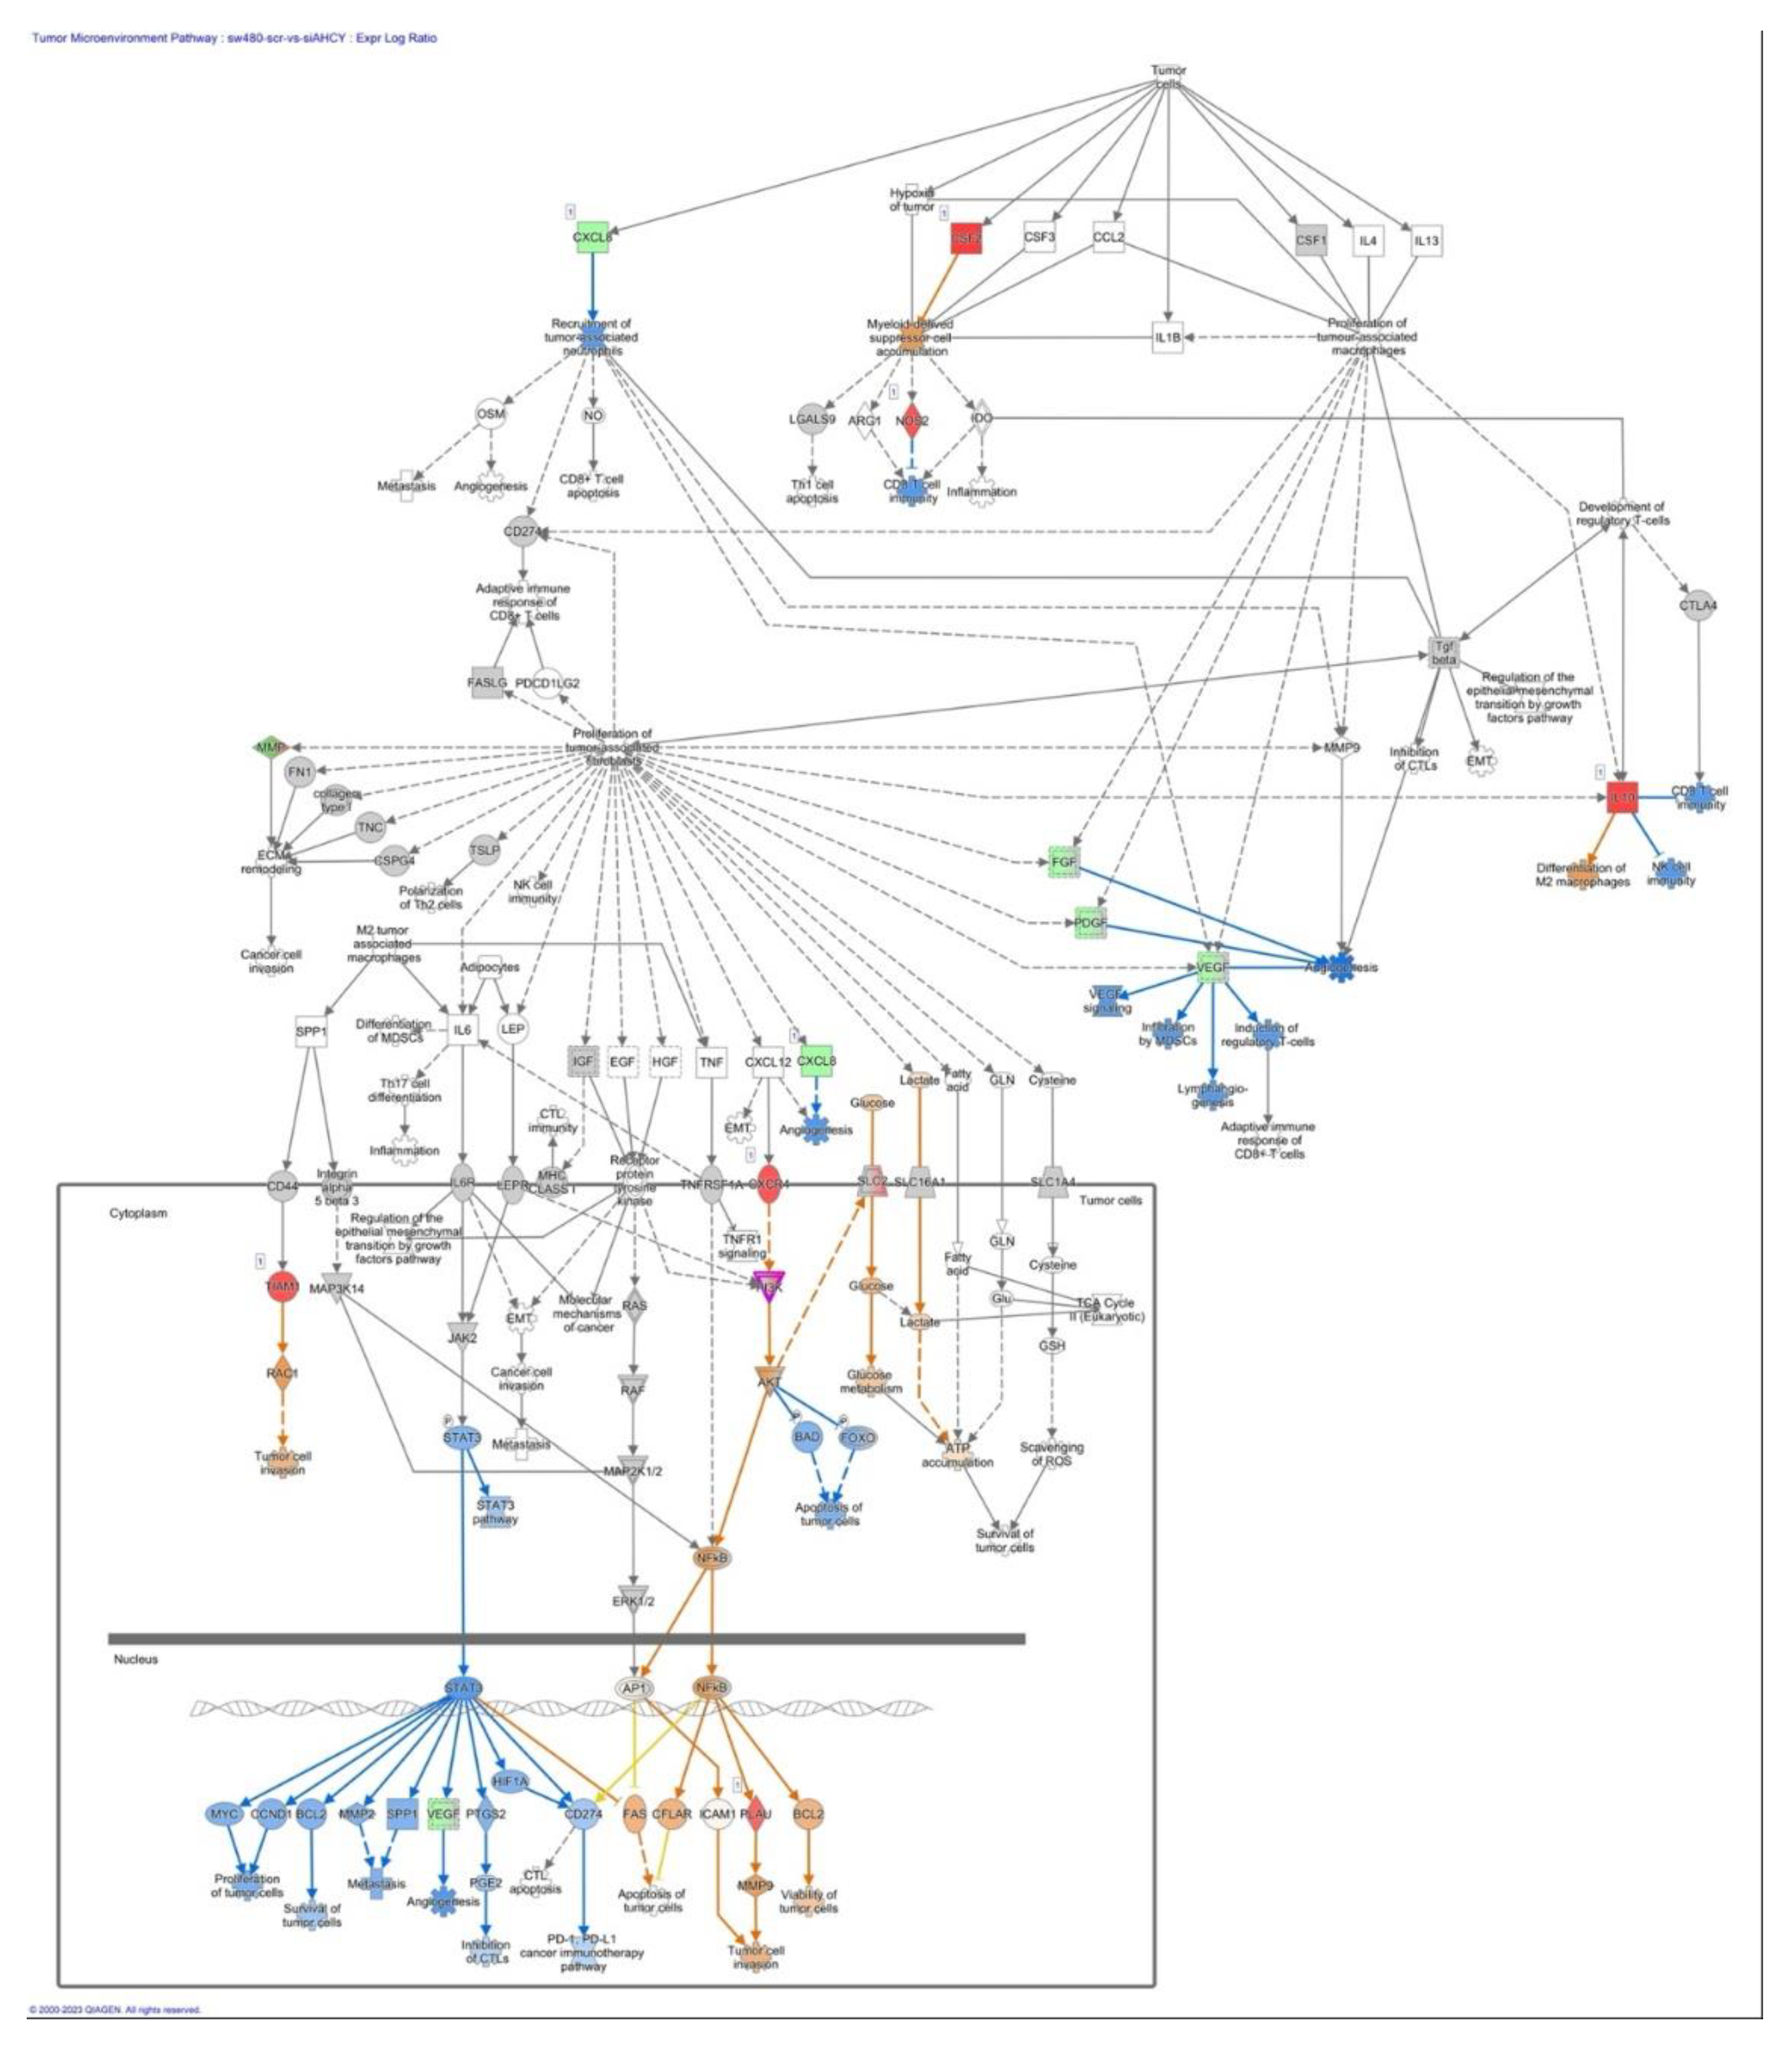
Figure 9.
STAT3 Signaling in SW480 AHCY deficient cells. The figure summarizes the upregulation and activation of STAT3, MYC, CDC25A, and BCL2, highlighting potential implications for cellular responses and signaling crosstalk.
Figure 9.
STAT3 Signaling in SW480 AHCY deficient cells. The figure summarizes the upregulation and activation of STAT3, MYC, CDC25A, and BCL2, highlighting potential implications for cellular responses and signaling crosstalk.
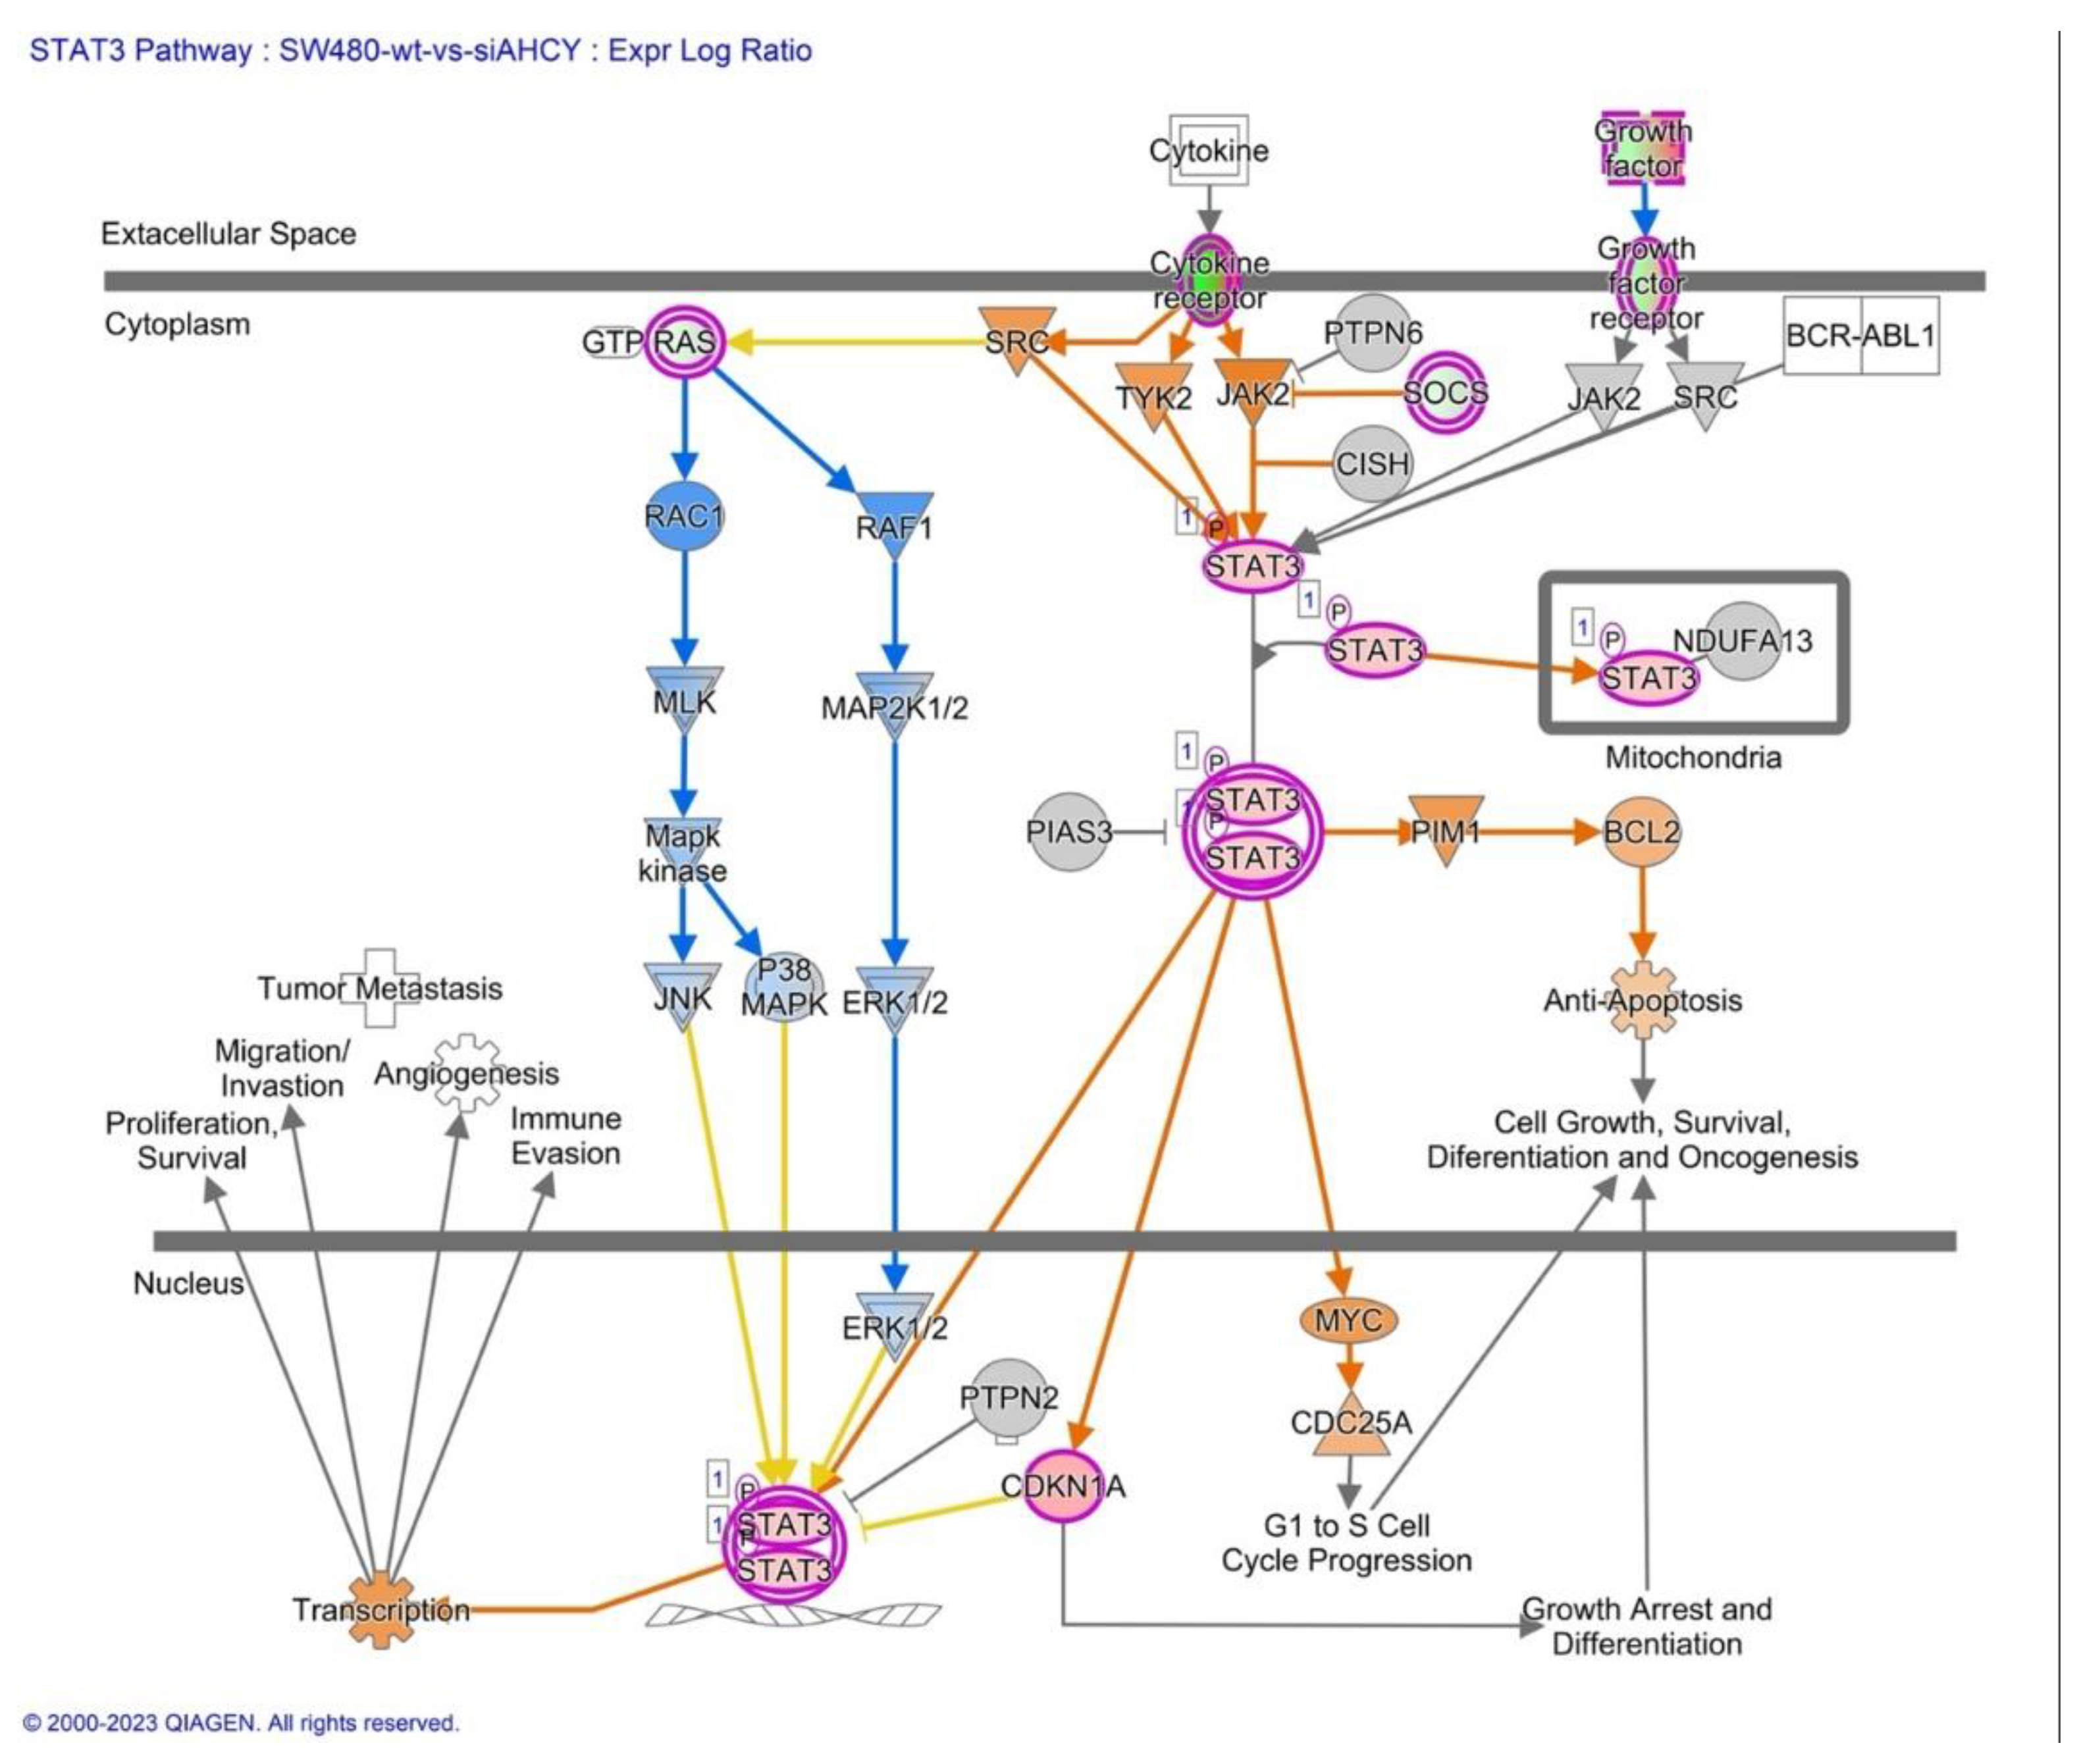
Figure 10.
Human Embryonic Stem Cell Pluripotency Signaling. STAT3 plays a critical role in regulating the self-renewal and proliferation of embryonic stem cells (ESCs). The figure illustrates the involvement of STAT3 in maintaining the pluripotent state of ESCs and promoting their proliferation, highlighting key downstream effectors and signaling pathways.
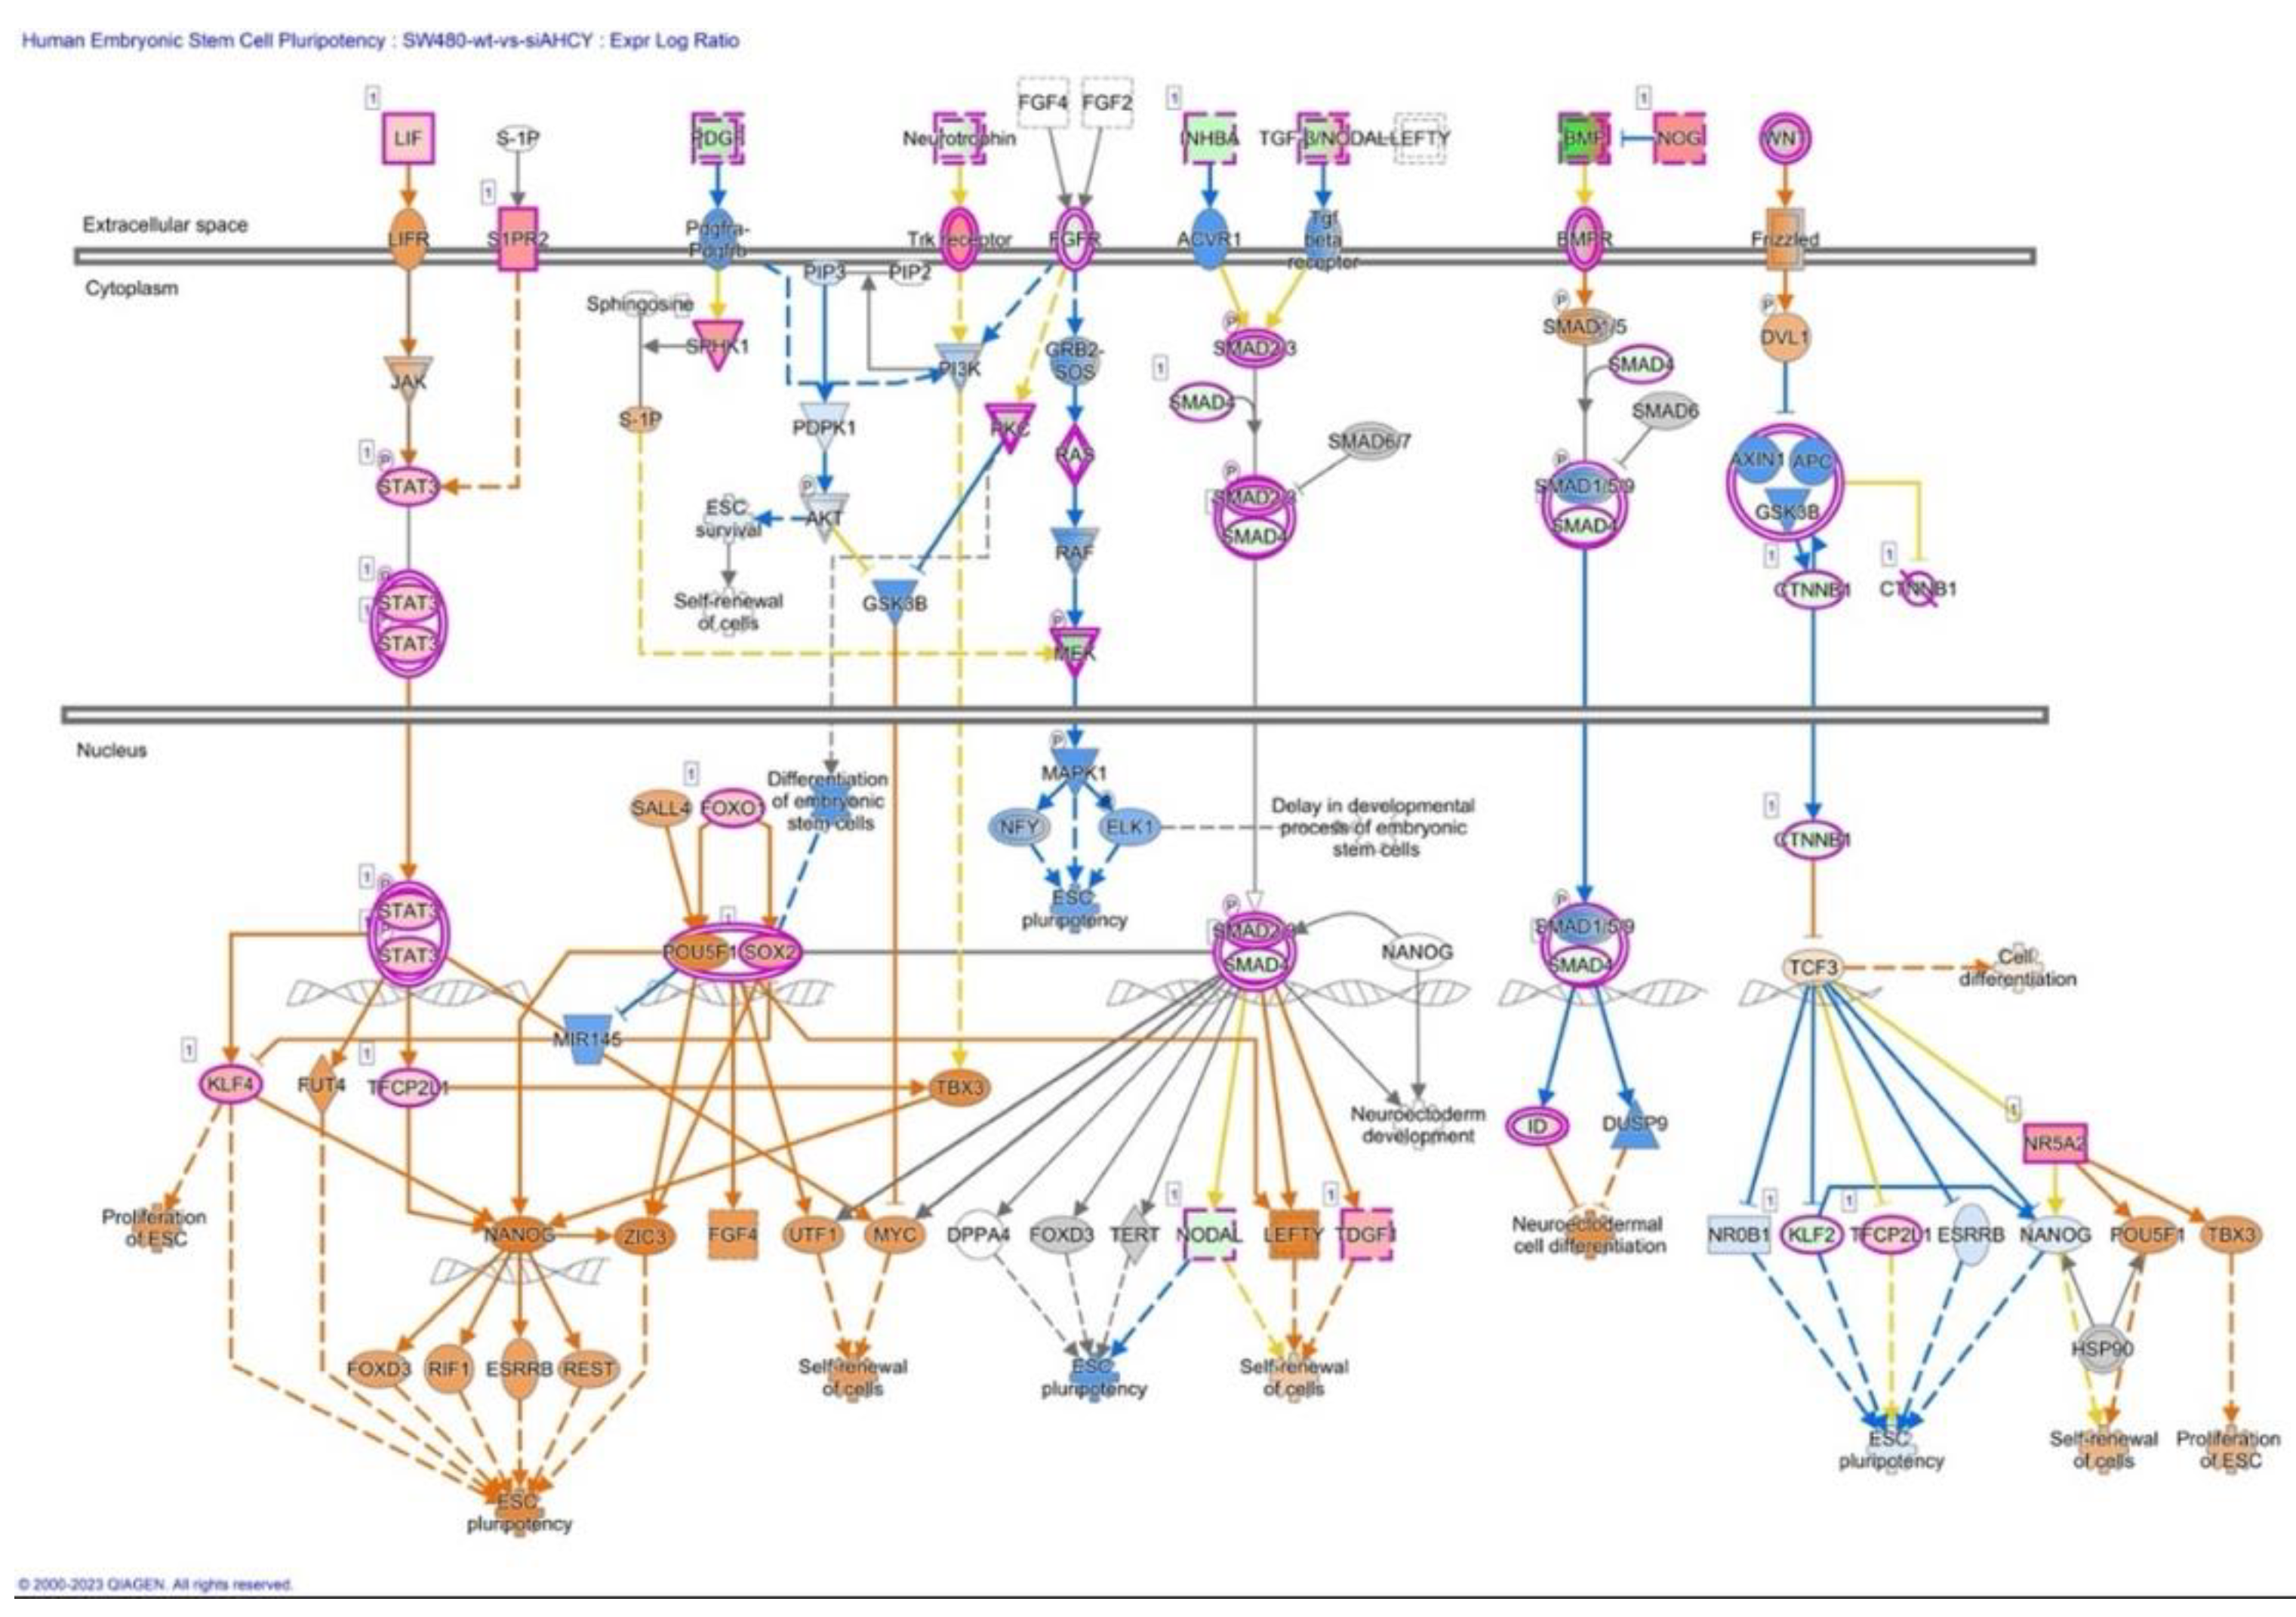
Figure 11.
IPA Core analysis of signaling by Rho Family GTPases in SW480 AHCY deficient cells with increased expression of LEF1 protein. The figure depicts the increased activation of cytoskeletal reorganization, cell trafficking, and migration/invasion-related processes in response to AHCY deficiency and increased levels of LEF1 protein. Rho GTPases, including Rho, PIP5K, and ROCK, are shown as key regulators of cytoskeletal dynamics.
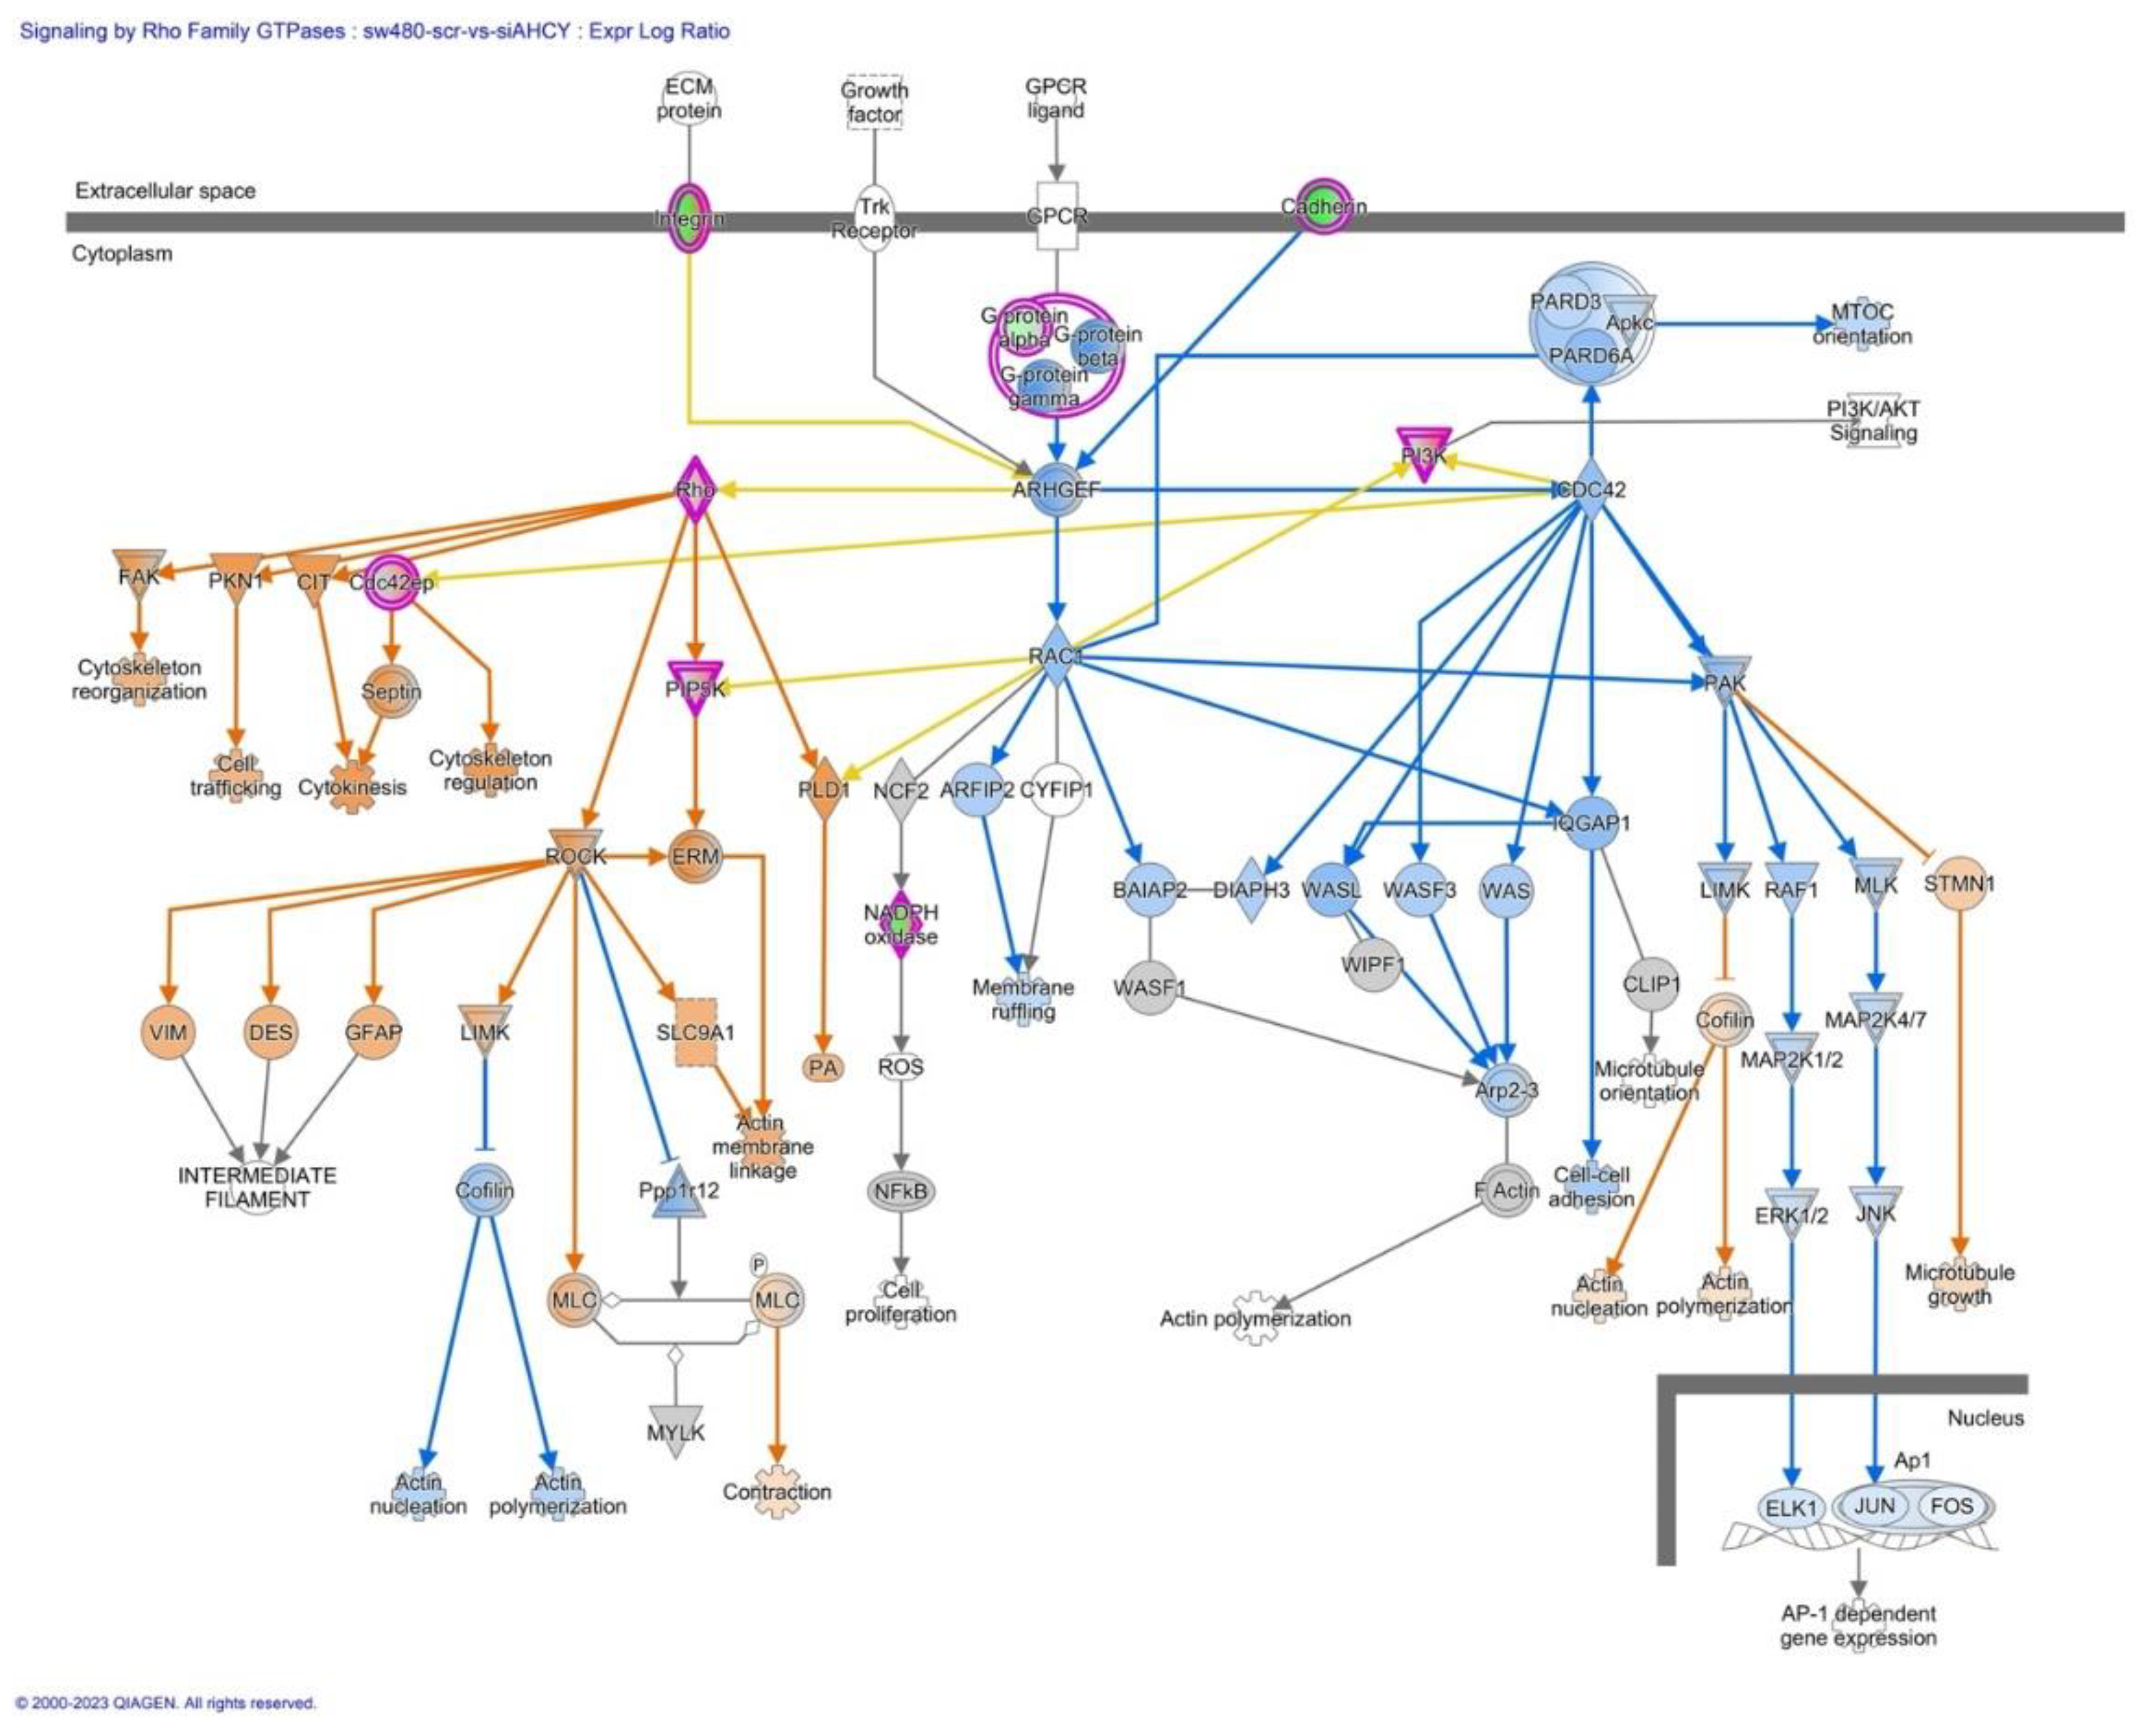
Figure 12.
Integration of Differential Gene Expression, LEF1 Protein Levels, Wnt Signaling, and Cellular Responses in AHCY-deficient SW480 Cells. Differential gene expression analysis in AHCY-deficient SW480 cells revealed significant alterations in genes associated with tumor cell invasion. TGFβ1, ROAR, DAB2, BMP6, NOS2, PLXN2, and CADPS exhibited significant upregulation, while TCF4 and AHCY were significantly downregulated. These gene expression changes were connected with increased LEF1 protein levels, activated Wnt signaling, and potential implications for enhanced cell invasion and proliferation through the upregulation of Cyclin A and Cyclin B.
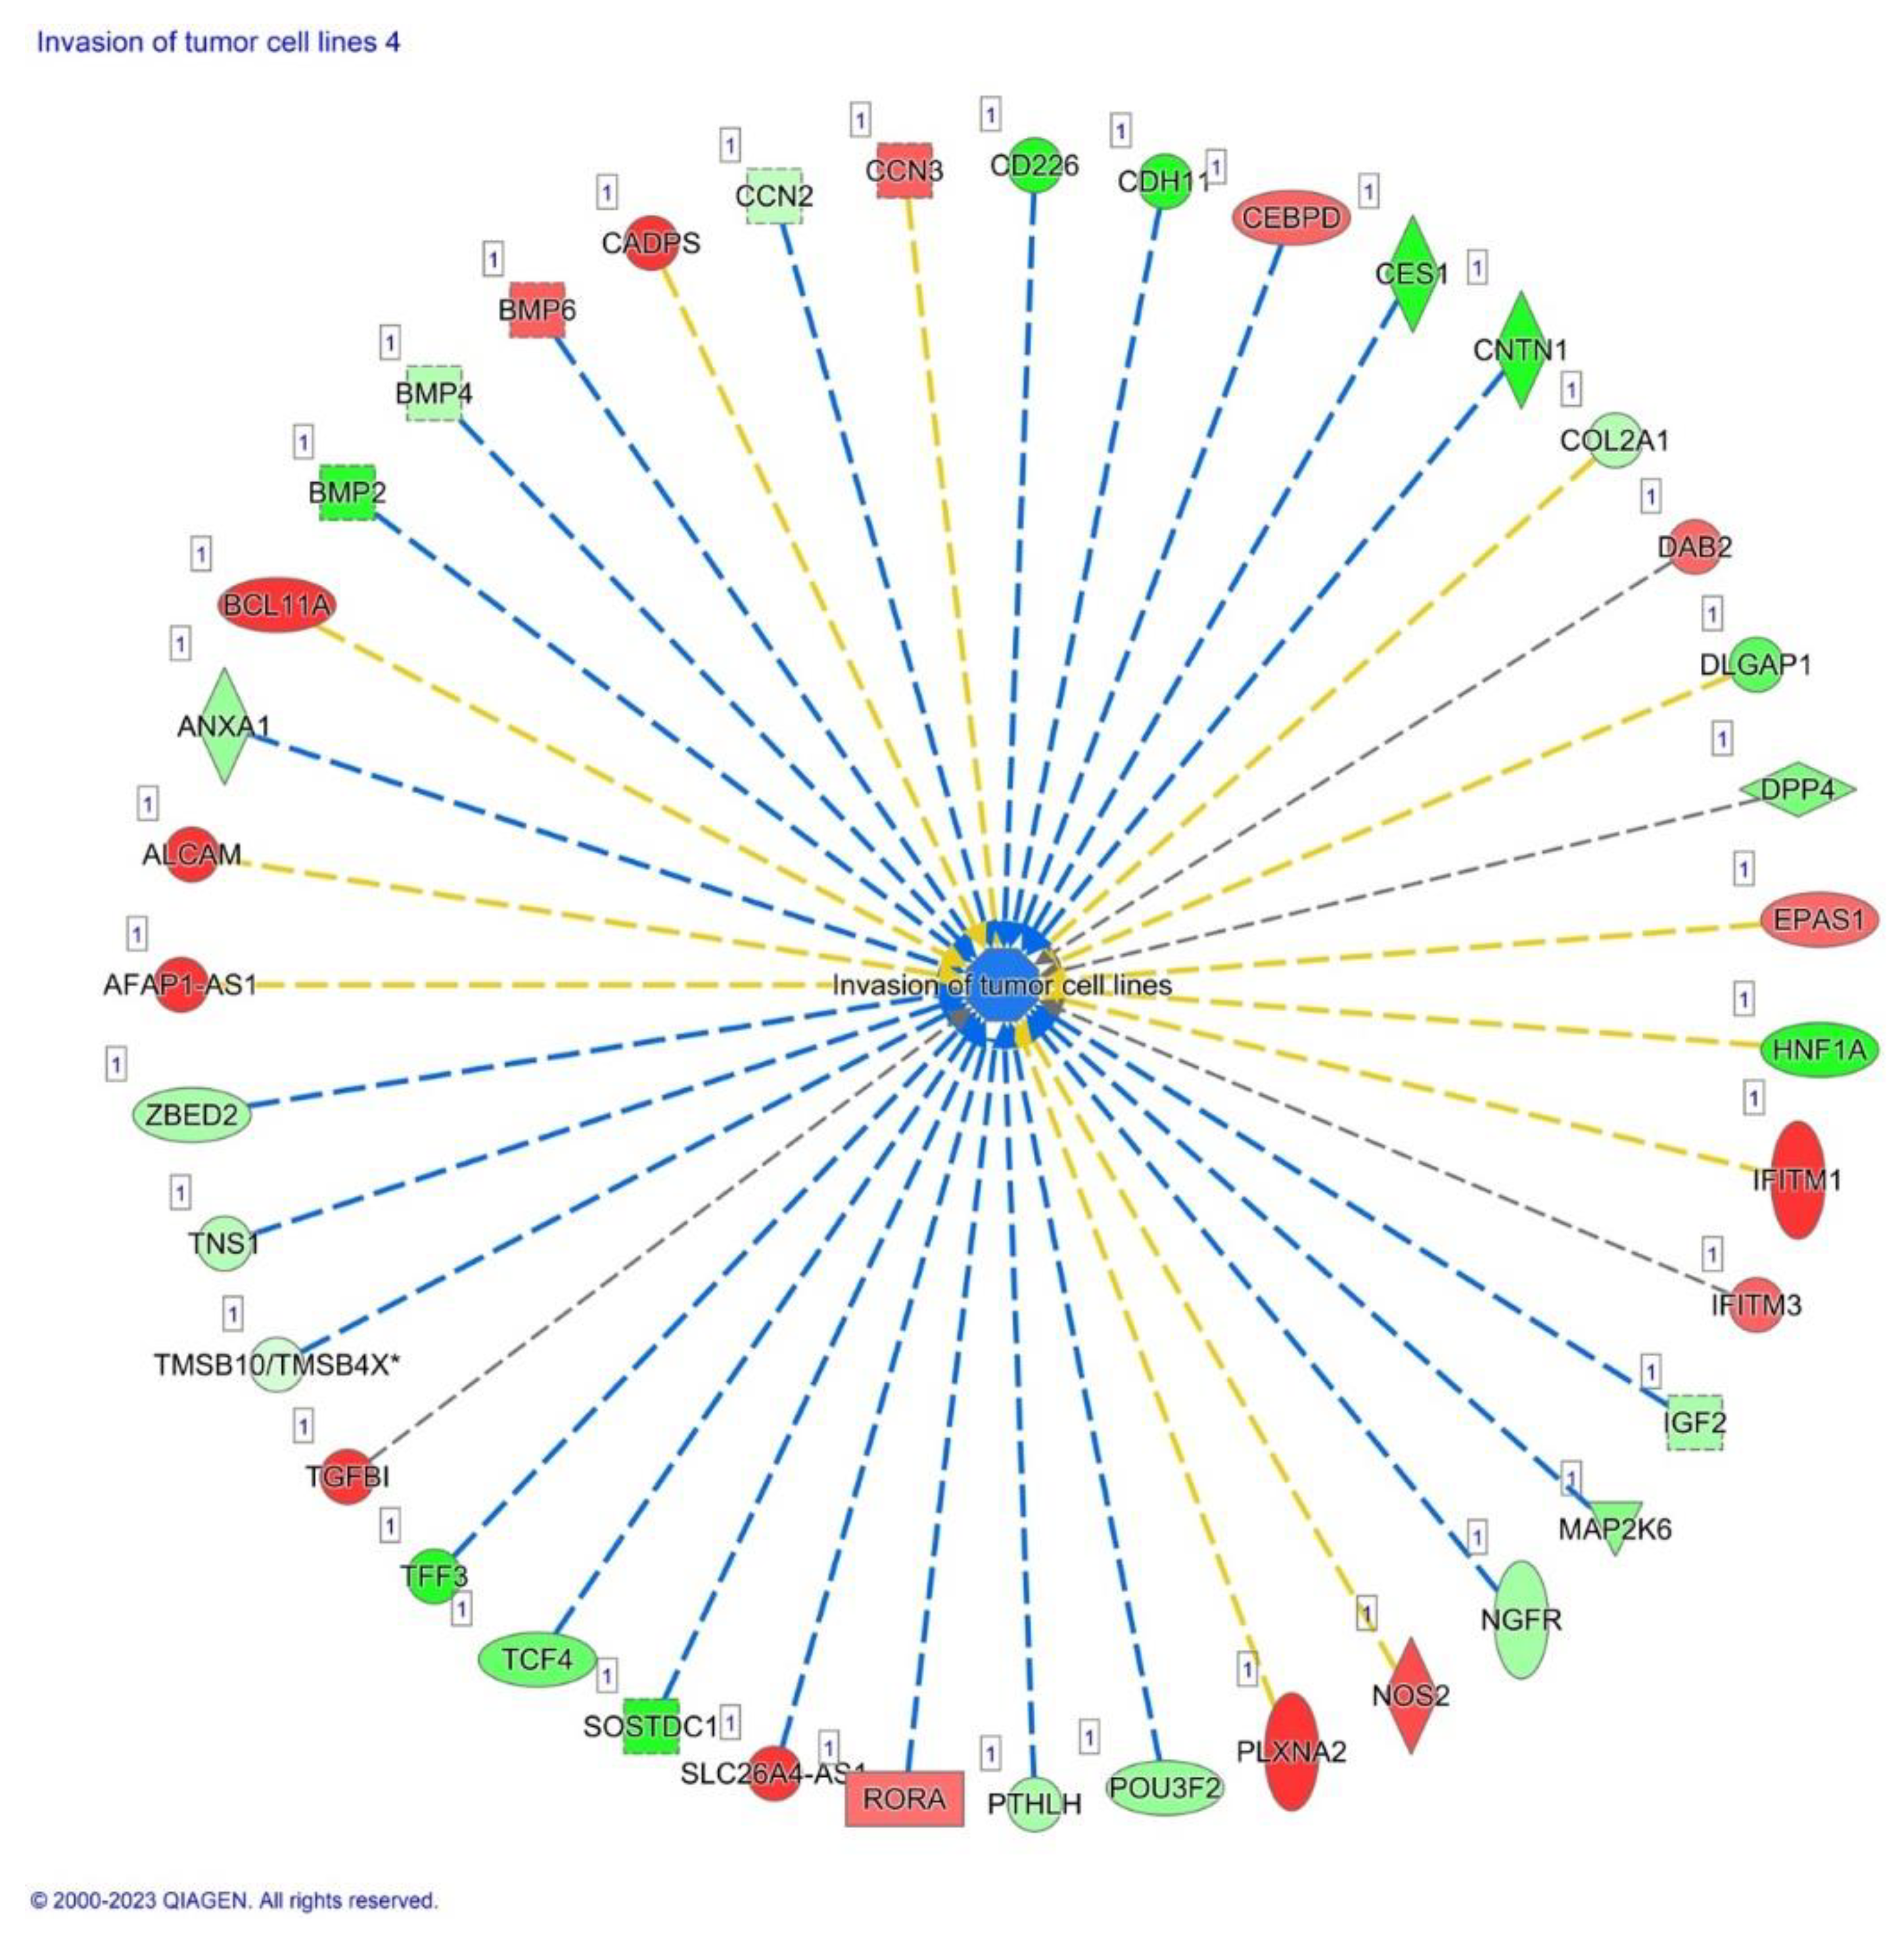
Figure 13.
Western blotting results.
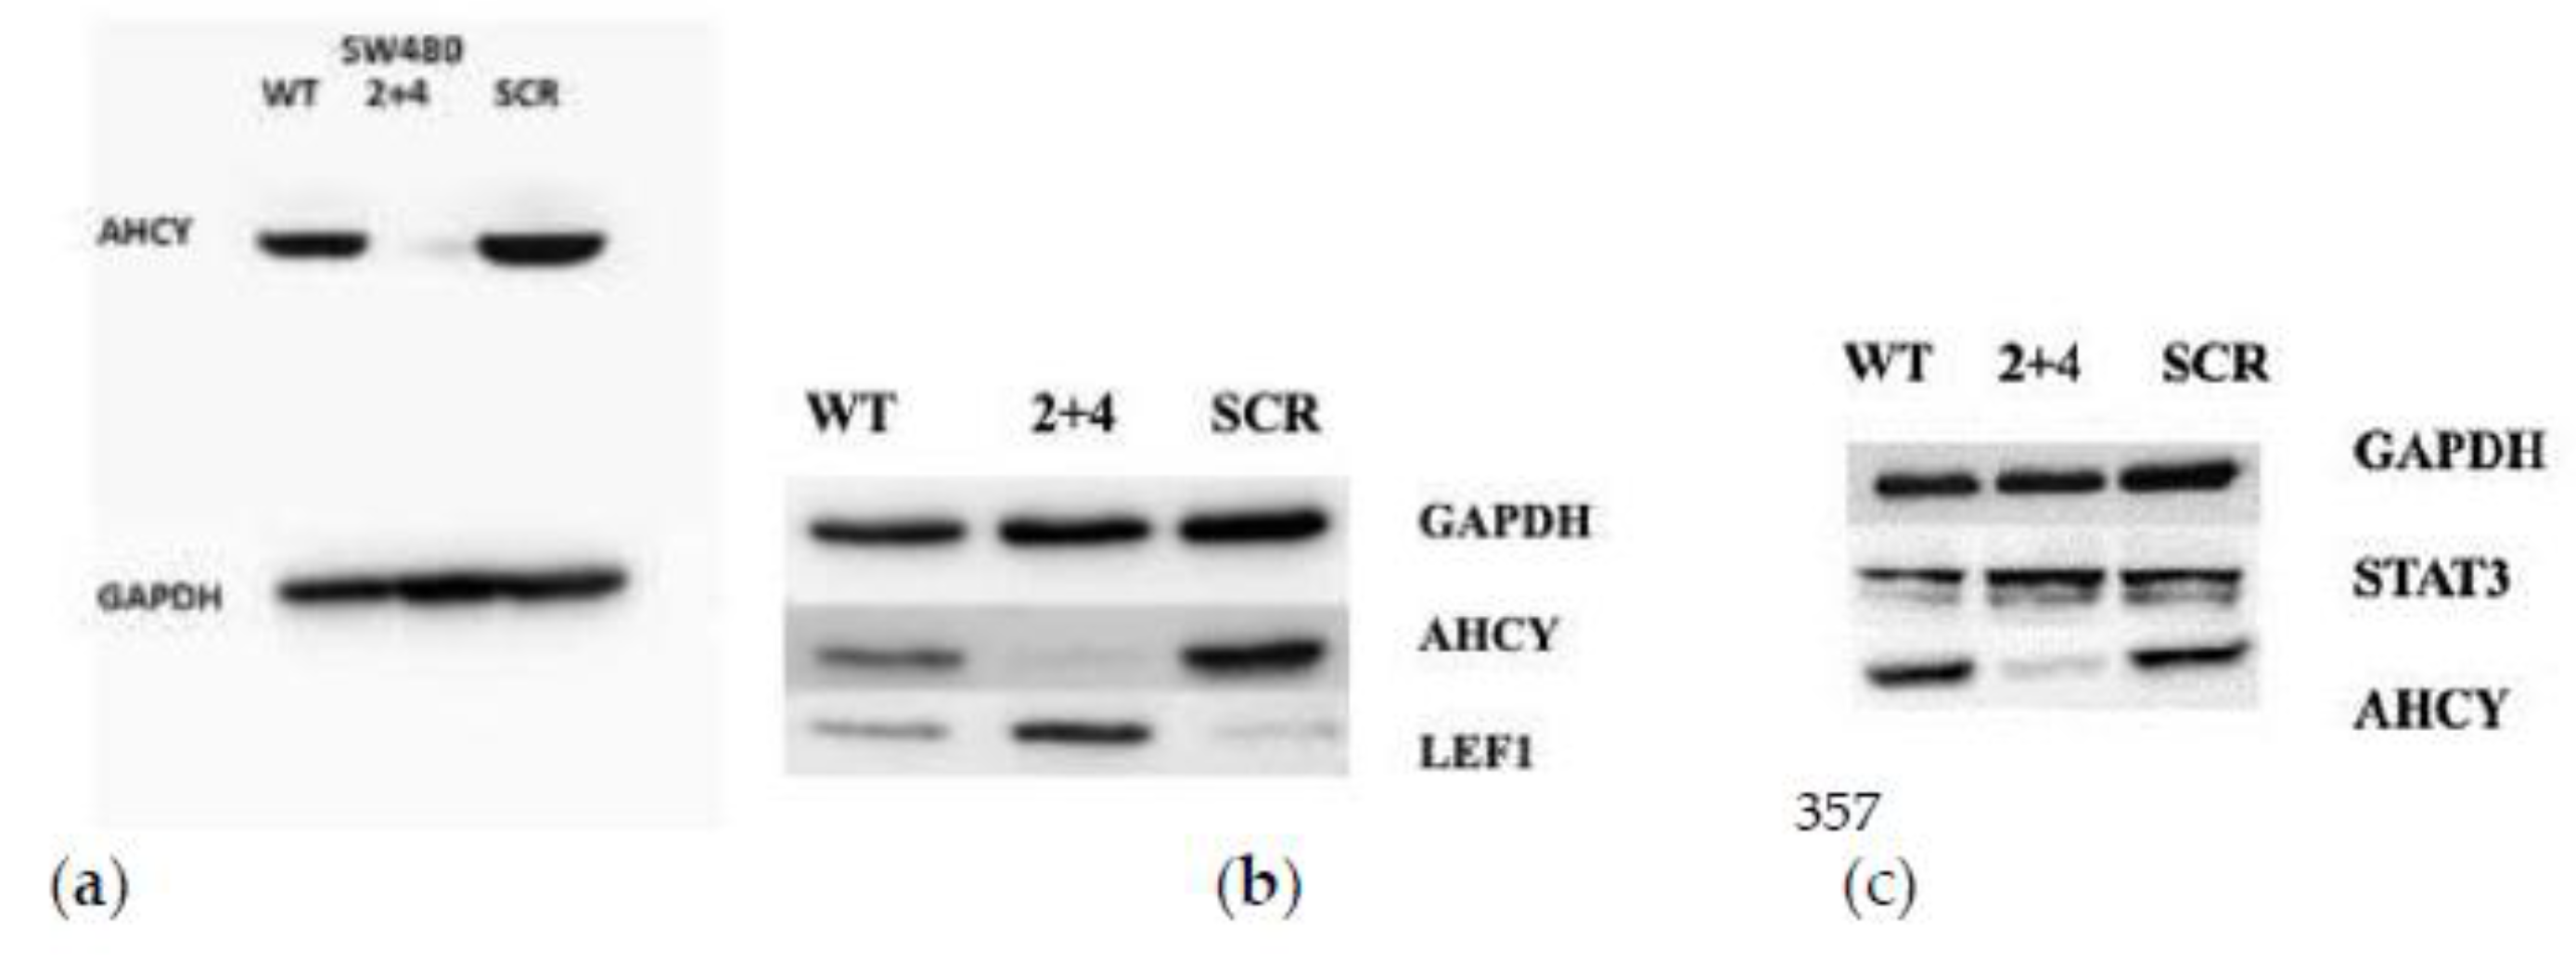

Table 1.
Summary of IPA analysis; Molecular and Cellular Functions wt-vs-siAHCY. .
| Name | p-value range | Molecules |
|---|---|---|
| Cellular movement | 6.00E-04-2.48E-13 | 73 |
| Cell death and survival | 6.18E-04-2.31E-08 | 66 |
| Cellular development | 5.77E-04-2.45E-07 | 76 |
| Cellular growth and proliferation | 5.77e-04-2.45E-07 | 70 |
| Cell morphology | 4.14E-04-3.07E-07 | 48 |
Table 2.
Summary of IPA analysis; Molecular and Cellular Functions scr-vs-siAHCY.
| Name | p-value range | Molecules |
|---|---|---|
| Cellular movement | 2.11E-12-5.74E-41 | 523 |
| Cell death and survival Cellular functions and maintenance Cellular growth and proliferation |
3.76E-13-8.59E-28 | 553 |
| 2.30E-12-1.96E-25 | 520 | |
| 1.51E-8.38E-23 | 605 | |
| 1.11E-04-8.38E-23 | 600 |
Table 3.
Differentially Expressed Genes in Wnt Signaling Pathway based on acquired RNAseq data. The table is summarizing the differentially expressed genes identified in the Wnt signaling pathway using IPA (Ingenuity Pathway Analysis) software after performing differential expression analysis. The table provides insights into the transcriptional changes observed in key genes associated with Wnt signaling in SW480 AHCY deficient cells.
| Symbol | Expr Log Ratio | q-value | Type(s) |
|---|---|---|---|
| CDH12 | -11,706 | 6,97E-13 | Other |
| HNF1A | -13,408 | 3,71E-17 | Transcription regulator |
| MAP2K6 | -6,754 | 2,01E-39 | kinase |
| TCF4 | -3,915 | 0,00245 | Transcription regulator |
Table 4.
Differentially Expressed Genes in Regulation of the Epithelial-Mesenchymal Transition Pathway. The table provides insights into the transcriptional changes observed in key genes associated with Regulation of the Epithelial-Mesenchymal Transition Pathway under AHCY deficient conditions. Differentially expressed changes concerning the TCF/LEF complex, similar as in the Wnt signaling pathway analysis are present.
| Symbol | Expr Log Ratio | q-value | Type(s) |
|---|---|---|---|
| APC2 | 3,428 | 0,0135 | Enzyme |
| CDH12 | -11,706 | 6,97E-13 | other |
| DKK1 | -3,416 | 0,0000255 | Growth factor |
| DKK3 | 3,316 | 5,54E-08 | Cytokine |
| DKK4 | -3,791 | 1,81E-08 | Other |
| FZD7 | 4,134 | 5,66E-20 | G-protein coupled receptor |
| GJA1 | -5,544 | 0,00000566 | Transporter |
| HNF1A | -13,408 | 3,71E-17 | Transcription regulator |
| POU5F1 | -5,964 | 0,00976 | Transcription regulator |
| RARB | -7,753 | 0,001 | Nuclear receptor |
| SFRP5 | 3,362 | 5,03E-12 | Transmembrane receptor |
| SOX5 | -8,898 | 0,00000315 | Transcription regulator |
| SOX6 | -3,842 | 0,00000333 | Transcription regulator |
| TCF4 | -3,915 | 0,00245 | Transcription regulator |
| TLE1 | 4,455 | 4,53E-11 | Transcription regulator |
| TLE4 | 4,145 | 2,28E-25 | Transcription regulator |
| WNT6 | 4,078 | 1,28E-21 | other |
Table 5.
The table presents a systematic analysis of the diverse functions of the Epithelial Adherens Junctions Signaling based on RNAseq data and IPA Core analysis. It highlights roles of Epithelial Adherens Junctions Signaling in cellular processes such as: cell adhesion, cell to cell contact formation, and remodeling of actin cytoskeleton.
| From Molecule(s) | Relationship Type | To Molecules |
|---|---|---|
| 14-3-3 | protein-protein interactions | YAP1 |
| AFDN | causation | Recruitment of actin cytoskeleton |
| AKT | causation | Cell proliferation |
| AKT | causation | TC proliferation |
| ARHGAP35 | inhibition | RHOA |
| ARHGEF17 | activation | RHOA |
| α-catenin | activation | Central spindlin |
| α-catenin | activation | NF2 |
| α-catenin | activation | VCL |
| α-catenin | causation | AJ organization |
| α-catenin | causation | Recruitment of actin cytoskeleton |
| α-catenin | inhibition | PP2A |
| α-catenin | protein-protein interactions | 14-3-3 |
| α-catenin | protein-protein interactions | NF2 |
| α-catenin | protein-protein interactions | VCL |
| Ampk | activation | RHOA |
| Arp2-3 | causation | Actin polymerization |
| Arp2-3 | membership | ACTR2 |
| Arp2-3 | membership | ACTR3 |
| BAIAP2 | activation | WAS |
| BAIAP2 | activation | WASF1 |
| BAIAP2 | protein-protein interactions | WASF1 |
| CDC42 | activation | BAIAP2 |
| CDC42 | activation | PAK |
| CDC42 | activation | WAS |
| CDC42 | inhibition | IQGAP1 |
| CDC42 | protein-protein interactions | IQGAP1 |
| CDH1 | activation | RAPGEF1 |
| CDH1 | activation | STK11 |
| CDH1 | causation | Cell adhesion |
| CDH1 | inhibition | EGFR |
| CDH1 | inhibition | IGF1R |
| CDH1 | inhibition | MET |
| CDH1 | protein-protein interactions | RAPGEF1 |
| CDH2 | activation | PRKAA1 |
| CDH2 | protein-protein interactions | CDH2 |
| CDH2 | protein-protein interactions | CTNNB1 |
| CDH2 | protein-protein interactions | PRKAA1 |
| CRK | activation | RAPGEF1 |
| CTNNB1 | activation | α-catenin |
| CTNNB1 | activation | CDH1 |
| CTNNB1 | activation | MAGI1 |
| CTNNB1 | activation | MAGI2 |
| CTNNB1 | activation | NF2 |
| CTNNB1 | activation | TNS1 |
| CTNNB1 | molecular cleavage | CDH1 |
| CTNNB1 | protein-protein interactions | α-catenin |
| CTNNB1 | protein-protein interactions | CDH1 |
| CTNNB1 | protein-protein interactions | MAGI1 |
| CTNNB1 | protein-protein interactions | MAGI2 |
| CTNNB1 | protein-protein interactions | TNS1 |
| CTNNB1 | reaction | α-catenin, FER |
| CTNNB1 | reaction | α-catenin, FYN |
| CTNNB1 | reaction | CTNNB1, EGFR; MET |
| CTNNB1 | reaction | MAGI2, VCL |
| CTNND1 | activation | CDH1 |
| CTNND1 | molecular cleavage | CDH1 |
| CTNND1 | protein-protein interactions | CDH1 |
| CTNND1 | protein-protein interactions | RHOA |
| CTNND1 | reaction | CTNND1, CDH1 |
| CTNND1 | reaction | CTNND1, NANOS1 |
| CTNND1 | translocation | CTNND1 |
| CTNN,β-CDHE/N | activation | ARHGEF17 |
| CTNN,β-CDHE/N | activation | TIAM1 |
| CTNN,β-CDHE/N | causation | Cell adhesion |
| CTNN,β-CDHE/N | causation | Cell-cell contact formation |
| CTNN,β-CDHE/N | membership | CDH1 |
| CTNN,β-CDHE/N | membership | CDH2 |
| CTNN,β-CDHE/N | membership | CTNNB1 |
| CTNN,β-CDHE/N | membership | CTNND1 |
| CTNN,β-CDHE/N | protein-protein interactions | CDH1 |
| Ca2+ | activation | CDH1 |
| Ca2+ | chemical-protein interactions | CDH1 |
| Central spindlin | activation | ECT2 |
| Central spindlin | inhibition | ARHGAP35 |
| Cofilin | causation | Stabilization of actin network |
| DIAPH1 | causation | Stress fiber formation |
| DLL1 | activation | NOTCH |
| ECT2 | activation | RHOA |
| EGF | activation | EGFR |
| EGFR | activation | FER |
| EGFR | activation | FYN |
| EGFR | activation | RAS |
| EGFR | causation | Epithelial barrier disruption |
| EGFR | causation | Proliferation of cell |
| EGFR | inhibition | CTNND1 |
| EGFR | phosphorylation | CTNND1 |
| EGFR | phosphorylation | FER |
| EGFR | phosphorylation | FYN |
| FARP2 | activation | CDC42 |
| FGF1 | activation | FGFR1 |
| FGFR1 | activation | RAS |
| HGF | activation | MET |
| IGF1R | causation | Proliferation of cell |
| IQGAP1 | inhibition | CTNNB1 |
| IQGAP1 | protein-protein interactions | CTNNB1 |
| LATS | inhibition | YAP1 |
| LIMK | inhibition | Cofilin |
| LIMK | phosphorylation | Cofilin |
| LPS | causation | Endothelial barrier function |
| MAGI1 | activation | DLL1 |
| MAGI1 | protein-protein interactions | DLL1 |
| MAGI2 | activation | PTEN |
| MAGI2 | molecular cleavage | PTEN |
| MAGI2 | protein-protein interactions | PTEN |
| MER-WWC1-FRMD6 | activation | MST/KRS |
| MER-WWC1-FRMD6 membership | membership | NF2 |
| MET | activation | RAS |
| MET | causation | Proliferation of cell |
| MET | inhibition | CDH1 |
| MET | phosphorylation | CDH1 |
| MST/KRS | activation | LATS |
| Myosin2 | causation | AJ stabilization |
| Myosin | causation | Cell adhesion structure clustering |
| NF2 | inhibition | EGFR |
| NOTCH | causation | Neuron differentiation |
| Nectin | activation | AFDN |
| Nectin | activation | SRC |
| Nectin | causation | Cell adhesion |
| Nectin | protein-protein interactions | AFDN |
| Nectin | protein-protein interactions | Nectin |
| Nectin | protein-protein interactions | SRC |
| PAK | activation | LIMK |
| PAK | phosphorylation | LIMK |
| PIP2 | inhibition | AKT |
| PIP3 | reaction | PIP2 PTEN |
| PRKAA1 | causation | Endothelia barrier function |
| RAC1 | activation | BAIAP2 |
| RAC1 | activation | PAK |
| RAC1 | activation | WASF1 |
| RAC1 | inhibition | IQGAP1 |
| RAC1 | protein-protein interactions | IQGAP1 |
| RAP1 | activation | CTNND1 |
| RAP1 | activation | FARP2 |
| RAPGEF1 | activation | RAP1 |
| RAS | expression | SNAI1 |
| RAS | expression | SNAI2 |
| RHOA | activation | DIAPH1 |
| RHOA | activation | Myosin2 |
| RHOA | activation | ROCK |
| ROCK | activation | LIMK |
| ROCK | phosphorylation | LIMK |
| SNAI1 | expression | CDH1 |
| SNAI2 | expression | CDH1 |
| SRC | activation | CRK |
| SRC | activation | FARP2 |
| SRC | activation | VAV2 |
| SRC | phosphorylation | FARP2 |
| SRC | phosphorylation | VAV2 |
| STK11 | activation | Ampk |
| STK11 | phosphorylation | Ampk |
| TCF/LEF | causation | Cell differentiation |
| TCF/LEF | causation | Cell proliferation |
| TGFB2 | activation | TGFBR |
| TGFBR | expression | SNAI1 |
| TIAM1 | activation | RAC1 |
| TNS1 | causation | Recruitment of actin cytoskeleton |
| VAV2 | activation | CDC42 |
| VAV2 | activation | RAC1 |
| WAS | activation | Arp2-3 |
| WASF1 | activation | Arp2-3 |
| YAP1 | reaction | YAP1 LATS |
| YAP1 | reaction | YAP1 PP2A |
| ZBTB33 | inhibition | TCF/LEF |
Table 6.
Differentially Expressed Genes in the Tumor Cell Microenvironment Pathway in AHCY-Downregulated SW480 Cells. The table summarizes the differentially expressed genes, highlighting upregulated and downregulated genes involved in extracellular matrix re-modeling, immune cell recruitment, cell migration, and cell survival. Significant changes in genes associated with the tumor cell microenvironment pathway are revealed.
| Symbol | Expr Log Ratio | q-value | Type(s) |
|---|---|---|---|
| CSF2 | -4,435 | 7,37E-13 | Cytokine |
| CXCLR8 | -3,762 | 6,67E-10 | Cytokine |
| CXCR4 | 3,8 | 2,03E-25 | G-protein coupled receptor |
| FGF21 | -3,51 | 0,00409 | Growth factor |
| IL10 | 4,254 | 4,4E-14 | Cytokine |
| MMP16 | -6,32 | 0,00443 | Peptidase |
| MMP17 | -3,808 | 9,57E-09 | Peptidase |
| MMP19 | 3,196 | 0,00133 | Peptidase |
| MMP24 | 3,114 | 9,03E-07 | Peptidase |
| NOS2 | 3,881 | 1,34E-19 | Enzyme |
| PDGFC | -3,482 | 1,34E-06 | Growth factor |
| PIK3R5 | 4,778 | 0,015 | Kinase |
| PLAU | 3,487 | 6,53E-11 | Peptidase |
| SLC2A3 | 3,254 | 1,67E-12 | Transporter |
| TIAM1 | 3,836 | 5,84E-27 | Other |
Table 7.
The table presents a systematic analysis of the diverse functions of STAT3 signaling based on RNAseq data and IPA Core analysis. It highlights roles of STAT3 signaling in cellular processes such as proliferation, survival, and differentiation.
Table 7.
The table presents a systematic analysis of the diverse functions of STAT3 signaling based on RNAseq data and IPA Core analysis. It highlights roles of STAT3 signaling in cellular processes such as proliferation, survival, and differentiation.
| From Molecule(s) | Relationship Type | To Molecules(s) |
|---|---|---|
| BCL2 | Causation | Anti-Apoptosis |
| BCR-ABL1 | activation | STAT3 |
| CDKN1A | Inhibition | Stat3-Stat3 |
| Cytokine | activation | Cytokinereceptor |
| Cytokine | protein-protein interactions | Cytokinereceptor |
| Cytokinereceptor | activation | JAK2 |
| Cytokinereceptor | activation | SRC |
| Cytokinereceptor | activation | TYK2 |
| Cytokinereceptor | protein-protein interactions | JAK2 |
| Cytokinereceptor | protein-protein interactions | TYK2 |
| ERK1/2 | activation | JAK2 |
| ERK1/2 | translocation | TYK2 |
| Growthfactor | chemical-protein interactions | Stat3-stat3 |
| Growthfactor | activation | ERK 1/2 |
| Growthfactor receptor | protein-protein interaction | RAS |
| Growthfactor receptor | activation | Growthfactor receptor |
| Growthfactor receptor | activation | Growth factor receptor |
| Growthfactor receptor | protein-protein interaction | JAK2 |
| JAK2 | protein-protein interaction | SRC |
| JAK2 | activation | JAK2 |
| JNK | reaction | SRC |
| MAP2K1/2 | activation | STAT3 |
| MLK | activation | STAT3 |
| MYC | activation | Stat3-Stat3 |
| Mapkkinase | activation | ERK ½ |
| Mapkkinase | activation | Mapkkinase |
| NDUFA13 | activation | CDC25A |
| P38MAPK | activation | JNK |
| PIAS3 | protein.protein interactions | P38MAPK |
| PIAS3 | activation | STAT3 |
| PIM1 | inhibition | Stat3-stat3 |
| PTPN2 | protein-protein interactions | Stat3-stat3 |
| PTPN6 | activation | Stat3-stat3 |
| RAC1 | inhibition | BCL2 |
| RAF1 | inhibition | Stat3-stat3 |
| RAS | activation | JAK2 |
| RAS | activation | MLK |
| SOCS | activation | MAP2K1/2 |
| SRC | activation | RAC1 |
| SRC | inhibition | RAF1 |
| STAT3 | activation | JAK2 |
| STAT3 | activation | RAS |
| Stat3-stat3 | reaction | STAT3 |
| Stat3-stat3 | translocation | Stat3-stat3 |
| Stat3-stat3 | activation | STAT3 |
| Stat3-stat3 | activation | CDKN1A |
| Stat3-stat3 | activation | MYC |
| Stat3-stat3 | causation | PIM1 |
| TYK2 | membership | Transcription |
Disclaimer/Publisher’s Note: The statements, opinions and data contained in all publications are solely those of the individual author(s) and contributor(s) and not of MDPI and/or the editor(s). MDPI and/or the editor(s) disclaim responsibility for any injury to people or property resulting from any ideas, methods, instructions or products referred to in the content. |
© 2023 by the authors. Licensee MDPI, Basel, Switzerland. This article is an open access article distributed under the terms and conditions of the Creative Commons Attribution (CC BY) license (http://creativecommons.org/licenses/by/4.0/).
Copyright: This open access article is published under a Creative Commons CC BY 4.0 license, which permit the free download, distribution, and reuse, provided that the author and preprint are cited in any reuse.


