Submitted:
13 September 2023
Posted:
15 September 2023
You are already at the latest version
Abstract
ABSTRACT
In the quest for decarbonisation, it's essential for different sectors of the economy to collaborate and invest significantly. This study presents an innovative approach that merges technological insight with philosophical considerations at a national scale, with the intention of shaping national policy and practice. The aim of this research is to assist in formulating decarbonisation strategies for intricate economies. Libya, a major oil exporter aiming to diversify its energy revenue sources, is used as the case study, although the principles can be applied to create decarbonisation strategies across the globe.
The decarbonisation framework evaluated in this study encompasses wind based renewable electricity, hydrogen, and gas turbine combined cycles. A comprehensive set of both official and unofficial national data was assembled, integrated and analysed to conduct this study. The developed analytical model considers a variety of factors including consumption in different sectors, geographical data, weather patterns, wind potential, and consumption trends, amongst others. Even when gaps and inconsistencies were encountered, reasonable assumptions and projections were used to fill these. This model is seen as a valuable foundation for developing replacement scenarios that can realistically guide production and user engagement towards decarbonisation. The aim of this model is to maintain the advantages of the current energy consumption, assuming a 2% growth rate, and to assess changes in energy consumption in a fully green economy. While some level of speculation is present in the results, important qualitative and quantitative insights emerge, with the key takeaway being the use of hydrogen and the anticipated considerable increase in electricity demand. Two scenarios were evaluated: achieving energy self-sufficiency and replacing current oil exports with hydrogen exports on an energy content basis.
This study offers, for the first time, a quantitative perspective on the wind-based infrastructure needs resulting from the evaluation of the two scenarios. In the first scenario, energy requirements were based on replacing fossil fuels with renewable sources. In contrast, the second scenario included maintaining energy exports at levels like the past, substituting oil with hydrogen. The findings clearly demonstrate that this transition will demand vast changes and substantial investments. The primary requirements identified are 14876 or 24532 square kilometres (for self-sufficiency and exports), and 47 single-shaft 600 MW combined-cycle gas turbines. This foundational analysis could represent the commencement of the research, investment, and political agenda on the journey to decarbonisation.

Keywords:
Gas Turbine
1. Energy Demand Prediction for Libya In 2050
The urgency, global nature, and necessity for substantial investments for decarbonisation are widely recognized (Economist 2021, Dray 2022). These investments are crucial to preserve the significant progress achieved over the past century in reducing global poverty (Rosling 2019). Hence, environmental preservation, sustained economic growth, and the wise use of natural resources are inextricably linked. Major investors are already gearing up for this transition (UNPRI 2021). The philosophy of concurrent economic and environmental sustainability, the recognition of the issue’s global nature, and the urgency to engage young talent are paramount (Parker & Pilidis 2021). Collaborative efforts spanning multiple sectors in large economic entities can yield significant economies of scale and experiential learning. This necessitates comprehensive and coordinated transition strategies that span across many economic sectors. In this study, a knowledge gap is addressed by introducing a novel technophilosophical approach (Nielsen, 2012), providing a clear understanding of the challenges and requirements, thereby informing these strategies. A comprehensive and quantitative country-level replacement analysis of this kind has not been previously reported in public literature.
Libya, a leading oil exporter and the home country of one of the authors, has been selected, here, as a case study for decarbonisation by 2050. Given its size and the planned replacement of hydrocarbon exports with green energy, Libya is a suitable candidate for decarbonisation, permitting an analysis that is both useful and representative. The volatile political situation in the country posed challenges in selecting a baseline for the study. However, in hopeful anticipation for the country’s journey towards peace and prosperity, national and international data were accessed to estimate future energy demands and daily consumption patterns (OAPECORG 2014, USEIA, 2022, Global Economy 2022, Country Economy 2022, Our world in data 2022, Rawesat and Sannuga 2022).
The urgency to decarbonise is a global matter that necessitates significant investments (Economist 2021, Dray 2022). These investments are required to preserve the remarkable progress made in reducing global poverty over the past century (Rosling 2019). As a result, environmental
conservation, sustained economic growth, and prudent use of natural resources must proceed in tandem. Major investors have already begun preparing for these transitions (UNPRI 2021). The philosophy of concurrent economic and environmental sustainability, the recognition of the issue’s global nature, and the imperative to engage emerging talent are crucial (Parker & Pilidis 2021). Collaborative efforts across a variety of sectors in large economic entities will yield significant economies of scale and experiential learning. This calls for comprehensive and coordinated transition strategies that span numerous economic sectors. In this study, a knowledge gap is filled by offering a novel technophilosophical method (Nielsen, 2012) which provides a clear perspective on the challenges and requirements, thereby guiding these strategies.
A holistic and quantitative country-level replacement analysis of this kind has not been previously seen in public literature. In hopeful anticipation of the country finding a path to peace and prosperity, national and international data were used to estimate future energy demands and daily consumption patterns.
Through the details of the Libyan Oil Industry (S&P Global 2023, OPEC 2021) and publications on the use of renewable energy (Ibrahim 2006, Ramelli et al 2006, Statista 2022, Reksten et al 2022), it was possible to estimate Libyan energy demand and consumption. With an analysis of age demographics (Statista 2022) and optimism about Libya’s future, a 2% growth rate was adopted. This rate considers optimistic assumptions, as actual growth has been inconsistent due to the country’s volatile political situation (World Bank, 2023). As anticipated, there were gaps and inconsistencies in the data. Consequently, an integration process was undertaken, where judgement and experience were used to establish a 2020 baseline and a 2050 scenario. One of the main adjustments needed was reconciling the consumption patterns (Figure 1) with the total consumption (Table 1).
The consumption patterns were integrated to match the total in Table 1. Furthermore, the information obtained was presented in various units, so the consumption patterns and sector entries were all converted to PJ and GW for consistency and ease of manipulation. A future risk analysis will be conducted to examine the impact of these corrections and adjustments. It is expected that this more detailed analysis will slightly alter some quantitative outputs, but it is not anticipated to significantly change the magnitude of the results or the main conclusions.
The 2050 decarbonisation analysis was conducted in two steps: assessing annual demand and adjusting the demand to the daily requirement based on current consumption patterns. The premise of the study is to maximise the utilisation of solar farms considering illumination and operational factors. This is one of many possible greening alternatives and the objective here is to produce a view of the outcomes of this single scenario, not to offer it as the best solution. Column 1 of Table 1 shows the 2020 baseline resulting from the compilation and integration exercise outlined above. The total requirement value calculated for Column 1 (809.47 PJ) does not include the last two items (Gas electricity and liquid fossil fuel for electricity) because these are already included in the fuel energy input (Gas for electricity and liquid fossil fuel for electricity). Column 2 shows an interim step for energy requirements in 2050 based on the consistent annual growth of 2% used for this investigation. This is the hydrocarbon-based demand to be decarbonised and the basis of the calculations for the subsequent columns. Items 5 and 6 have been removed on the premise that fossil fuels would not be used for electricity. The total of Column 2 now includes the electricity demand currently delivered by fossil fuels even though this would be produced using solar power in the replacement scenario.
Columns 3, 4 and 5 display the replacement philosophy to retain the same level of benefit. For instance, the energy delivered by jet fuel would be replaced by electricity for short-range flights and hydrogen for medium and long-range flights. For aviation, the assumption is made that post-Covid, the civil aviation sector will need to convert to non-carbon fuels and will grow, given the vast cultural, economic and social benefits it brings, particularly in business and tourism (EU Parliament 2021, Visual Capitalist 2021). In 2050, the Libyan jet fuel requirement would be (The pressing need for decarbonisation is a global issue that will demand significant investments (Economist 2021, Dray 2022).
These investments are critical for preserving the considerable progress achieved in reducing worldwide poverty over the last century (Rosling 2019). As such, environmental conservation, sustained economic growth, and responsible use of natural resources must coexist. Major investors are already preparing for these shifts (UNPRI 2021). This philosophy of simultaneous economic and environmental sustainability, coupled with the need to globalise the issue and attract young talent, is of paramount importance (Parker & Pilidis 2021). Collaborative measures across diverse sectors in large economies will yield crucial economies of scale and learning through experience. This calls for detailed and coordinated strategies for transitioning across various economic sectors. This study addresses a knowledge gap by introducing a new technophilosophical method (Nielsen, 2012), providing a clear understanding of the challenges and necessities, thereby informing these strategies.
A comprehensive and quantitative country-level replacement analysis of this type has not been previously seen in public literature. Libya, a leading oil exporter and the home country of two of the authors, has been selected for decarbonisation by 2050. Given its size and the planned replacement of hydrocarbon exports with green energy, Libya is a suitable candidate for decarbonisation, ensuring that the analysis is both useful and representative. The unpredictable political situation in the country posed difficulties in selecting a baseline for the study.
However, in hopeful anticipation of the country finding a path to peace and prosperity, national and international data were utilised to estimate future energy demands and daily consumption patterns (OAPECORG 2014, USEIA, 2022, Global Economy 2022, Country Economy 2022, Our world in data 2022, Rawesat and Sannuga 2022).
Using this information, along with details about the Libyan Oil Industry (S&P Global 2023, OPEC 2021) and publications regarding the use of renewable energy sources (Ibrahim 2006, Ramelli et al 2006, Statista 2022, Reksten et al 2022), an estimate of Libyan energy demand and consumption was generated.
With an exploration of age demographics (Statista 2022) and an optimistic outlook on Libya’s future, a 2% growth rate was adopted. This rate incorporates hopeful assumptions, as actual growth has been inconsistent due to the country’s volatile political reality (World Bank, 2023). As expected, there were gaps and inconsistencies in the data. Consequently, an integration process was undertaken, where judgement and experience were applied to establish a 2020 baseline and a 2050 scenario. One of the main adjustments needed was reconciling the consumption patterns (Figure 1) with the total consumption (Table 1). The consumption patterns were integrated to match the total in Table 1.
Furthermore, the information obtained was presented in various units, so the consumption patterns and sector entries were all converted to PJ and GW for consistency and ease of manipulation. A future risk analysis will be conducted to examine the impact of these corrections and adjustments. It is expected that this more detailed analysis will slightly alter some quantitative outputs, but it is not anticipated to significantly change the magnitude of the results or the main conclusions.
The 2050 decarbonisation analysis was conducted in two steps: assessing annual demand and adjusting the demand to the daily requirement based on current consumption patterns. The premise of the study is to install solar farms that are utilised to their maximum capacity considering illumination and operational factors. This is one of many possible greening alternatives and the objective here is to produce a view of the outcomes of this single scenario, not to offer it as the best solution. Column 1 of Table 1 shows the 2020 baseline resulting from the compilation and integration exercise outlined above. The total requirement value calculated for Column 1 (809.47 PJ) does not include the last two items (Gas electricity and liquid fossil fuel for electricity) because these are already included in the fuel energy input (Gas for electricity and liquid fossil fuel for electricity). Column 2 shows an interim step for energy requirements in 2050 based on the consistent annual growth of 2% used for this investigation. This is the hydrocarbon-based demand to be decarbonised and the basis of the calculations for the subsequent columns. Items 5 and 6 have been removed on the premise that fossil fuels would not be used for electricity.
The total of Column 2 now includes the electricity demand currently delivered by fossil fuels even though this would be produced using solar power in the replacement scenario. Columns 3, 4 and 5 display the replacement philosophy to retain the same level of benefit. For instance, the energy delivered by jet fuel would be replaced by electricity for short-range flights and hydrogen for medium and long-range flights. For aviation, the assumption is made that post-Covid, the civil aviation sector will need to convert to non-carbon fuels and will grow, given the vast cultural, economic, and social benefits it provides, particularly in business and tourism (EU Parliament 2021, Visual Capitalist 2021).
By 2050, the Libyan jet fuel requirement would amount to 44.3 PJ of fuel energy (Item 3, column 2). Based on the evaluation in Huete et al (2021) relying on (Schafer 2021), it is projected that 15% of the aviation jet fuel energy requirement would be met by electric propulsion and the remaining 85% by hydrogen gas turbine propulsion systems. These replacement factors are shown in Item 3 Col 3 as 0.15 and 0.85. As such, 15% of this would be replaced by electricity and the remaining 85% by hydrogen (columns 3 and 4). To deliver the same benefit, the amounts of energy required would change. 15% of the 2050 jet fuel energy requirement is 6.6 PJ. If the same propulsive power were to be delivered by electricity, the energy requirement would be much smaller. Conversion from fuel energy to propulsive power is relatively low due to the need to use a thermodynamic cycle (the gas turbine) to convert the heat input of the fuel into propulsive power.
In the present analysis, a levelised average value of 30% is used for the thermal efficiency of the gas turbines used for smaller airliners. If electrical power is used, the conversion from electrical power at source, allowing for larger weight, transmission losses, and electrical equipment losses were estimated at 70%. Hence the electrical power needed to deliver the same propulsive power as 6.6 PJ of fuel energy (Item 3, Col 4) is much lower: 2.85 PJ (Item 3, Column 6). On the other hand, the amount of energy delivered by hydrogen would increase. Based on the evaluation in Huete et al (2021), airliners of the first innovation wave would have more voluminous bodies, resulting in higher drag.
Thus, the hydrogen energy needed would be larger, in this analysis by 10%. So, to replace the propulsive power obtained from 37.7 PJ of conventional fuel for 2050 (Item 3, Col 4), 41.45 PJ of hydrogen would be needed (Item 3, Column 8). This hydrogen, in the present analysis, is produced using seawater electrolysis and needs to be liquefied with a combined efficiency of electrolysis and liquefaction, estimated here, of 55%. So, the production of 41.45 PJ of hydrogen, 345.4 kilotonnes per annum (Item 3, Column 9), would require 75.36 PJ (Item 3, Column 7). Therefore, to provide the 2050 propulsive power requirement for aviation, 44.33 PJ of conventional fuel energy would be needed. In a decarbonised scenario, the same requirement would be delivered by 2.850 PJ of electrical energy generation and 41.45 PJ of hydrogen. This hydrogen, in turn, would require 75.36 PJ of electrical energy to be generated.
Similar assessments were performed across the list of items, facilitating the calculation of the electrical and hydrogen requirements. The hydrogen requirements, in turn, led to their respective electrical requirements (column 7). It was assumed that aviation would exclusively require liquid hydrogen, while all other sectors would utilise hydrogen gas. Decker (2019) states that the global liquid production of hydrogen is slightly more than 100 ktonnes p.a., which is about 0.15% of global hydrogen production, making this approximation reasonably precise for the current analysis. Table 1 (col 10) shows that 28.5 percent of the produced hydrogen is liquid hydrogen for aviation. This proportion will remain constant throughout the study, and the global efficiency of hydrogen production will be maintained at 0.65 due to the proportion of the produced hydrogen being liquid.
Therefore, for a decarbonised Libya of 2050 (Table 1), without restricting economic growth, the total energy required would be 630 PJ of electrical energy, of which 407 PJ would be used directly as electrical energy and the remainder used to produce hydrogen. It’s noteworthy that the decarbonisation of a country has resulted in a reduction (from 809 PJ to 630 PJ) of primary energy and a sizeable increase (from 108 PJ to 630 PJ) in electrical energy requirement. The main reason for the reduction in primary energy is that a large portion of fossil fuel energy is currently used in thermodynamic cycles with thermal efficiencies ranging from 0.15 to 0.6, which often leads to substantial waste of thermal energy. This may change in the future as additional hydrogen production requirements are included.
2. Adjustments for Daily Demand Considerations
When transitioning from traditional fossil fuel energy sources to wind energy, it’s crucial to ensure demand is met even when wind conditions are not optimal. In the current scenario, this issue is addressed using Hydrogen Combined Cycle Gas Turbines (H2CCGTs), which combust hydrogen using the low NOx combustor designs being evaluated in ENABLEH2 (2020). The current state-of-the-art thermal efficiency stands at 62-64% (Siemens 2023, General Electric 2023, Mitsubishi 2023). By 2050, machinery with an efficiency exceeding 65% is expected to be available. Combined with electrolyser efficiencies surpassing 70%, this can deliver efficiencies from electricity to electricity of 0.45 to 0.5. Moreover, H2CCGTs generate a substantial stream of thermal energy, which can be beneficially used in various areas, including desalination. This advantage is not included in this analysis. It is anticipated that these H2CCGTs will be situated near the electrolysing stations and use gaseous hydrogen. In this study, the H2CCGTs are assumed to be 600 MW single shaft units delivering an average of 500 MW (accounting for hot days, off-design performance, degradation, and operational availability) with a thermal efficiency of 60%. Thus, in addition to the hydrogen produced for the replacement scenario depicted in Table 1, additional hydrogen will need to be generated for use in these gas turbines. While it can be argued that other energy storage mechanisms could be used in place of H2CCGTs, H2CCGTs are a very suitable alternative for this scenario evaluation and are the only ones considered here. The hydrogen required for these H2CCGTs is additional to the hydrogen demand evaluated in Table 1. Moreover, a 4% hydrogen backup is included to run the H2CCGTs for 2 weeks in case no wind energy is available.
Figure 1 presents the demand curves for this study. The patterns used are based on Libyan operating information (Rawesat and Sannuga 2021) and have been adjusted to meet the total annual requirement of 406.89 PJ for 2050, as evaluated in section 3 and shown in Table 1. Altogether, the grid evaluated here needs to deliver:
- -
- The electricity demand of 406.89 PJ in the daily patterns is shown in Figure 1.
- -
- The 1210.7 ktonnes of hydrogen (3.32 k tonnes/day, liquid & gas), require 223.7 PJ annually.
- -
- Additional Hydrogen for use in H2CCGTs to generate electricity when wind is not available.
- -
- The 4% H2 margin (2 weeks of operation) for the H2CCGTs peak and non-windy day demand duty.
3. Assesments of Requirements Based on The Summer Season
The basic premise of this investigation is that wind farms will be constructed and operated at full capacity, considering the location and wind characteristics. The coastal areas of Libya, bordering the Mediterranean coast, which extends for about 2000 km, were selected for this purpose. The demand patterns represented in Figure 1 were used, representing the year as four equal seasons of 91.25 days each. The first season analysed was summer, since it is the “disc” season where demand peaks and wind power are at its lowest due to low wind speeds.
The first step was an iterative process of determining the area needed for the wind farm to supply the total electricity demand.
This area was determined to be 14876 km2. To fulfil the electricity needs for this area, the study estimates that 44436 wind turbines would be required with a capacity of wind turbine 4200 kw. The wind efficiency used is conservative, and some of the other factors may be higher than expected. A key item is shown in the bottom row of column 5. This is the daily hydrogen requirement of 3.7 ktone/day augmented by 4% (as stated above) to 3694 tonnes/day to provide a buffer for peaks and long spells of windless days. Column 1 of Table 2 shows the electrical power demand, also shown in Figure 1 for the summer season. Column 2 shows the energy required as a consequence of this demand.
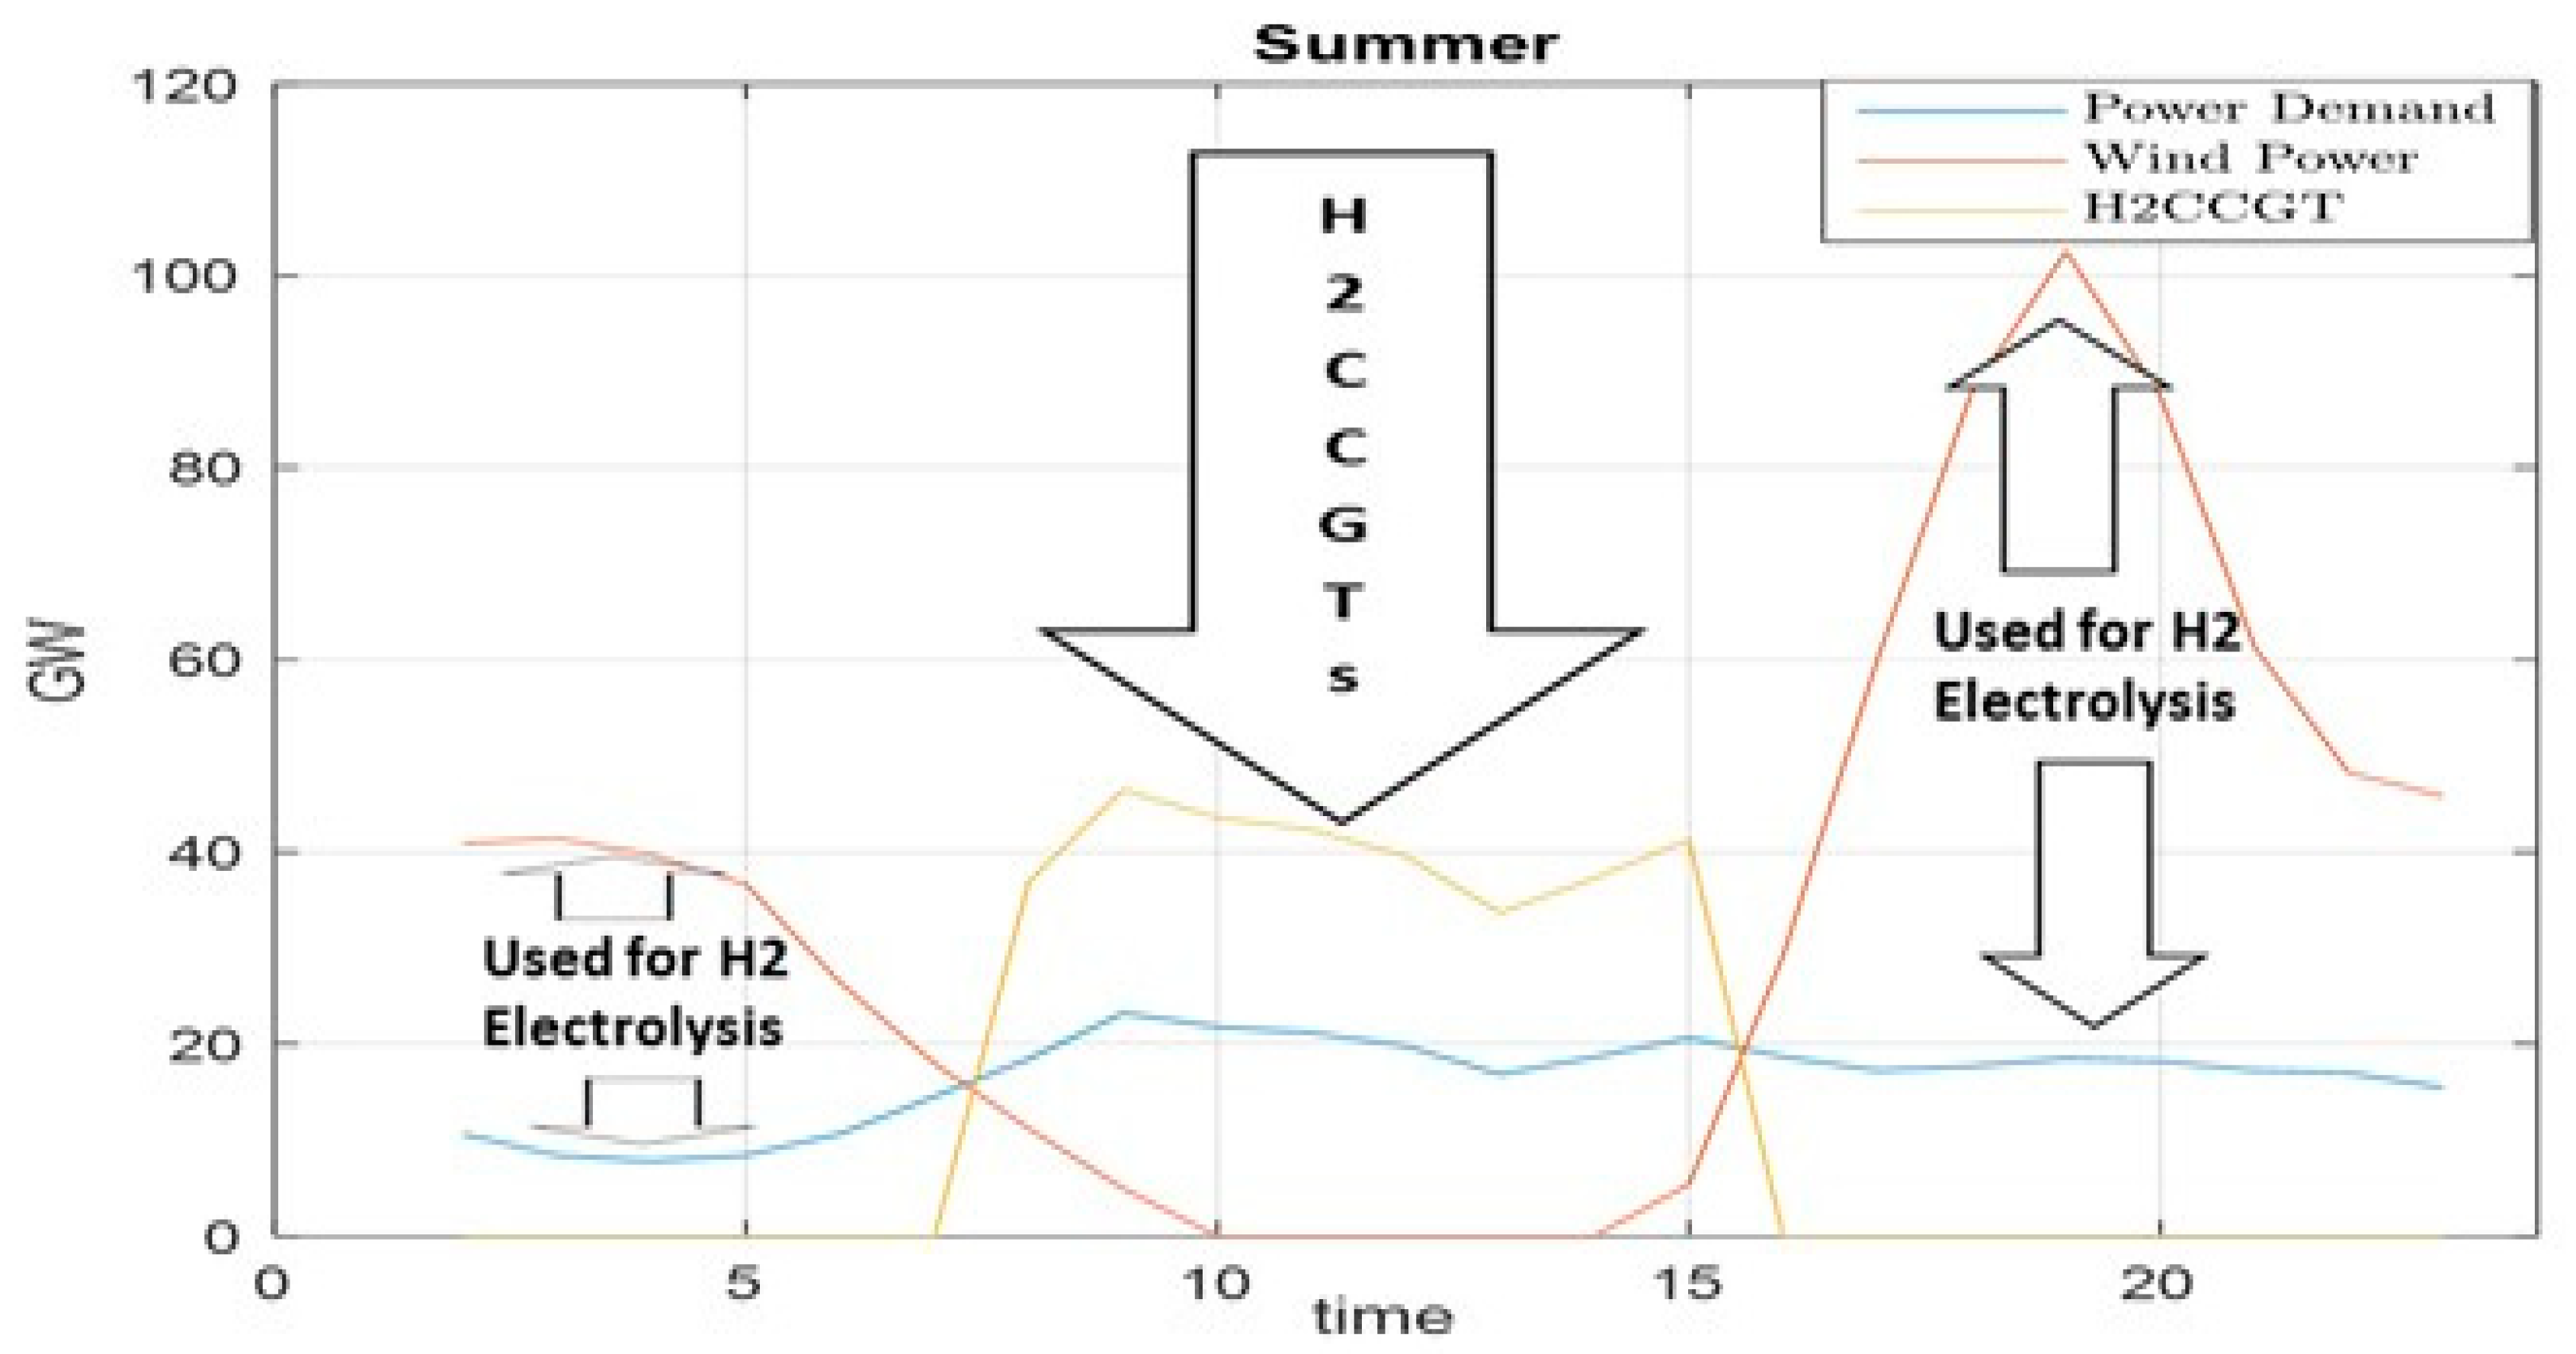
Figure 2.
Electrical Supply and demand on a summer day.
The next evaluation is wind energy production which is dependent on the speed of the wind and how this varies during the day and the seasons. Column 3 shows the Wind power density for each hour of the day The next evaluation is wind energy production which is dependent on the speed of the wind and how this varies during the day and the seasons. Column 3 shows the Wind power density for each hour of the day (Farhan,Hassanpour,Burns and Ghaffari 2019) (Reserve, 2016). The power converted through the wind into rotational energy in the turbine can be calculated using the following equation:
Where:
P is the power of wind (in watts, W)
ρ is the air density (in kilograms per cubic meter, kg/m³)
V is the wind speed (in meters per second, m/s)
Cp is Power Coefficient
Column 4 shows the power delivered using the wind farm of 14876 km^2. Of course, a wind farm only produces electricity when there is wind that starts at a speed from 3 m/s, and it is assumed that at the speed under that value, there is no will be useful output.
The wind turbine power curve was taken to find the power for each wind speed, as display in Figure 3. The percentage of hourly wind speed was specified by using the Weibull probability distribution function f(v) given through the Equation.
where 𝑓 𝑉 is the probability density function, k is the scale factor, c is the shape factor, and v is wind velocity (m/s).
The Renewables Ninja website for the year 2022 was used to obtain hourly wind speed data. the percentage of hourly wind speed was specified by using the Weibull probability distribution function f(v) given through Eq (2). for each month.
Furthermore, the output of energy for all duration was calculated by the following equation:
Where E is energy, P is power, and T is time.
Afterward, to find accurate final energy output, the wind turbine cut in and cut out should be taken into consideration. The following equation was used to calculate this, utilizing Excel.
Power output = If wind speed < 3 (cut in) put 0, or If wind speed > 13 (rated speed) put rated power or put the energy in specific wind speed found by using the following equation:
Excel software was utilised to extract specific equations for each wind turbine power curve using only figures between cut in and rated wind speed in order to obtain accurate results for the power output of each hour during the year. Figure 4 demonstrate the equations for turbine 4200 kW (Eq 4) (where x is the wind speed for each hour through whole the year).
Where the above analysis was included in the calculation to obtain the power of wind farm (GW). This variation is clearly visible in column 4 where the wind power produced is 0 when the wind speed less than 3m/s, starts at 3m/s and rises to nearly 103 GW at 17 PM (Table 2).
When the wind speed is below the 3m/s the demand is satisfied using the H2CCGTs (col 14) that consume hydrogen produced through excess energy from the wind turbine during the day (column 10). Column 15 shows the number of 600 MW single shaft H2CCGTs (delivering an effective 500 MW to allow for several operational factors). The largest value in column 15 indicates the number of these powerplants needed, 47 (arising from the value of 46.44 rounded up). One of the constraints of the evaluation is the hydrogen production of 3699 tonnes/day explained above. The bottom row shows that for a summer day, 11.724 ktonnes of hydrogen are produced, 8.024 of these are consumed by the H2CCGTs to satisfy the demand experienced during the sunless hours and the remainder is the 3693 tonnes/day requirement. Column 8 offers a view to estimating the electrolysis capacity and Column 11 offers information helpful for storage requirements. A particular assumption in this study is that the 3693 tonnes of hydrogen needed every day is consumed very quickly.
This assumption simplifies the calculations, includes the availability of this hydrogen for most of the day and offers a useful numerical buffer for storage requirements.
Figure 2 shows the electrical supply and demand patterns. The dotted line is the demand. This demand is satisfied when there is no power from wind with the H2CCGTs. The very large excess of supply over demand is used to electrolyse hydrogen for use in other economic sectors and to produce the hydrogen needed for the night operation of the H2CCGTs.
4. Winter, Spring and Autumn Seasons
The evaluation of the other seasons followed next. In these, the wind farm was assumed to continue to deliver its maximum output, now larger because wind speeds are generally higher in the other three seasons compare with summer season. Wind Energy in North Africa ample wind energy potential that is expected to play an important role in generating electric power. For example, the installed capacity of wind energy has reached the production of electricity In Morocco, Egypt and Tunisia to 610, 787 and 245 MW on respectively, by the end of 2015(Fallis, “Global Wind Statisitcs 2015. GWEC,” Brussels, Belgium, 2015).
Wind power is directly dependent on wind speed the energy density generated by the wind increases with the increase in the cubic value of the wind speed, which means that It directly affects the cost of producing a unit of electrical energy. The higher the speed Wind has increased the amount of electrical energy produced, and thus costs have decreased energy per kWh. Many regions in Libya are characterized by the availability of quantities Wind energy resources are reasonable and can be used to generate electricity (W. El-osta,Y.Kalifa, 2003 ).
As for the sites that were chosen, most of them were in the north of the country, where wind speeds exceeding 5 m / s are very frequently available, and they are considered suitable sites for generating electric power. Wind energy, by its nature, is abundant and its prices are low compared to the latest renewable energy technologies. Table 3 shows the details of the spring season. This season has a lower demand (Fig 1) (this evident when comparing columns 3 of Table 2 and 3). There is a surplus production of hydrogen that can be exported, 53.16ktonne/day. Like the daily need, this is assumed to be removed from storage. Table 4 and Table 5 show the results for the other seasons.
5. A View of the Whole National System
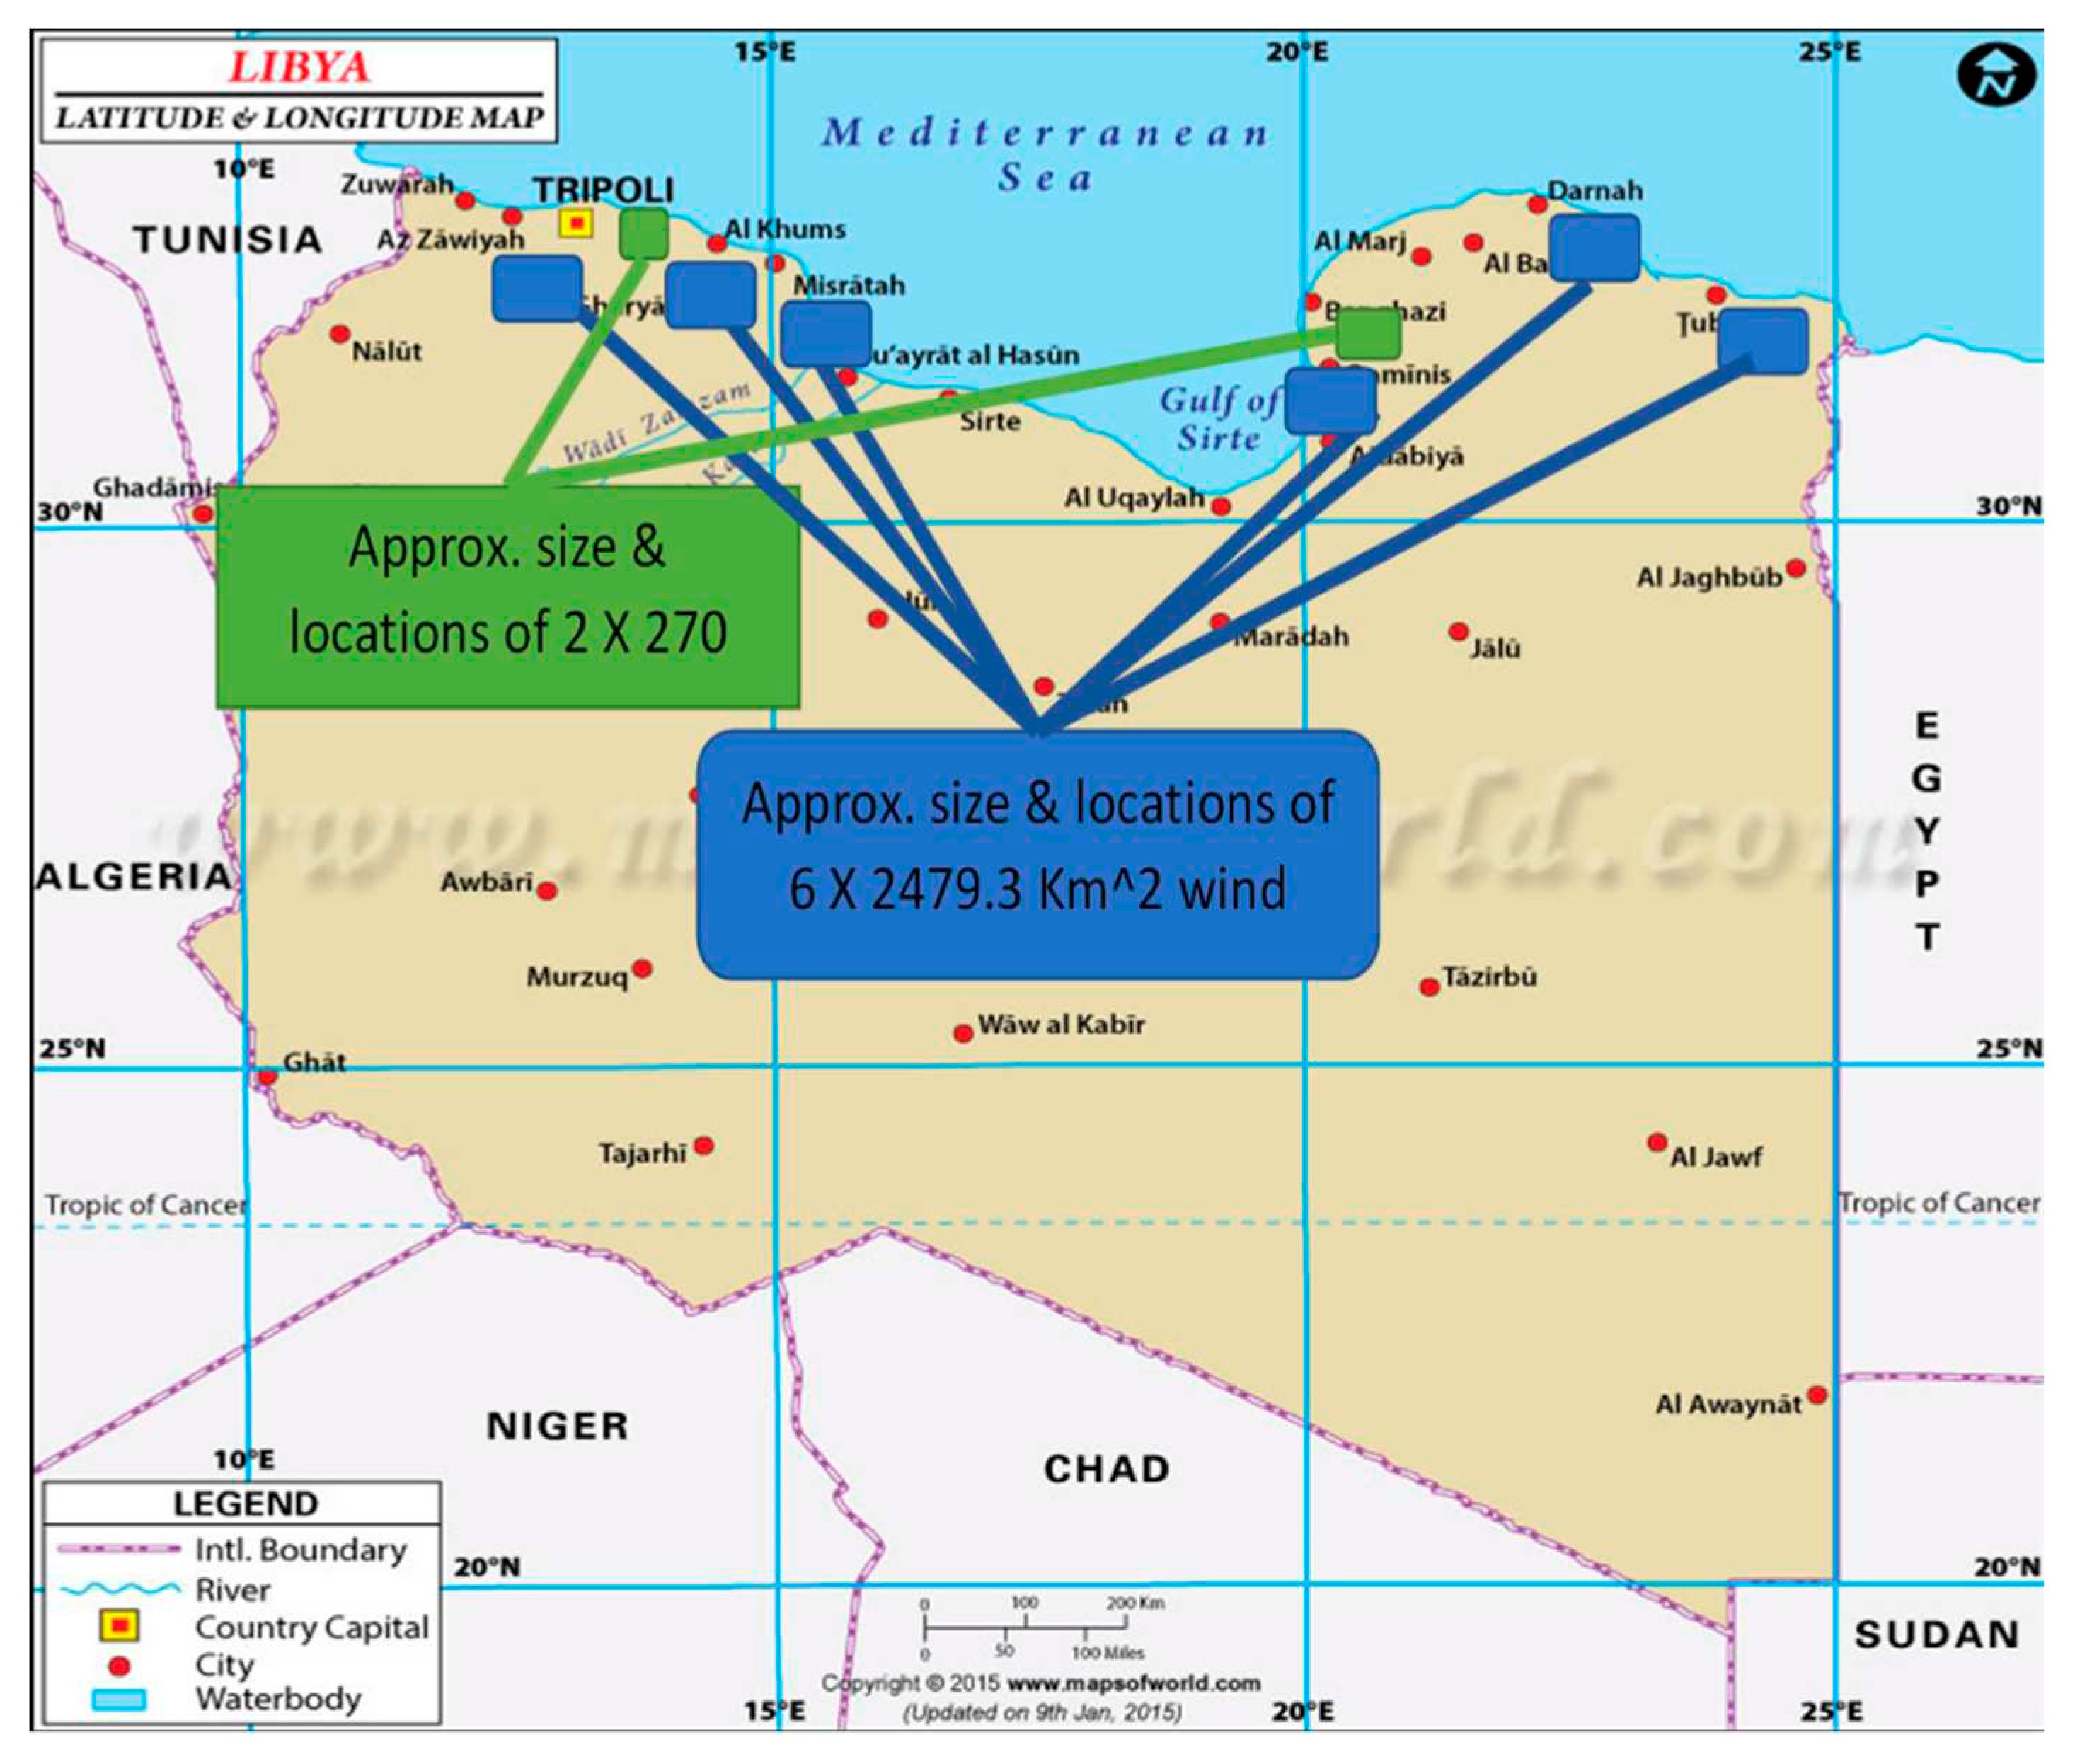
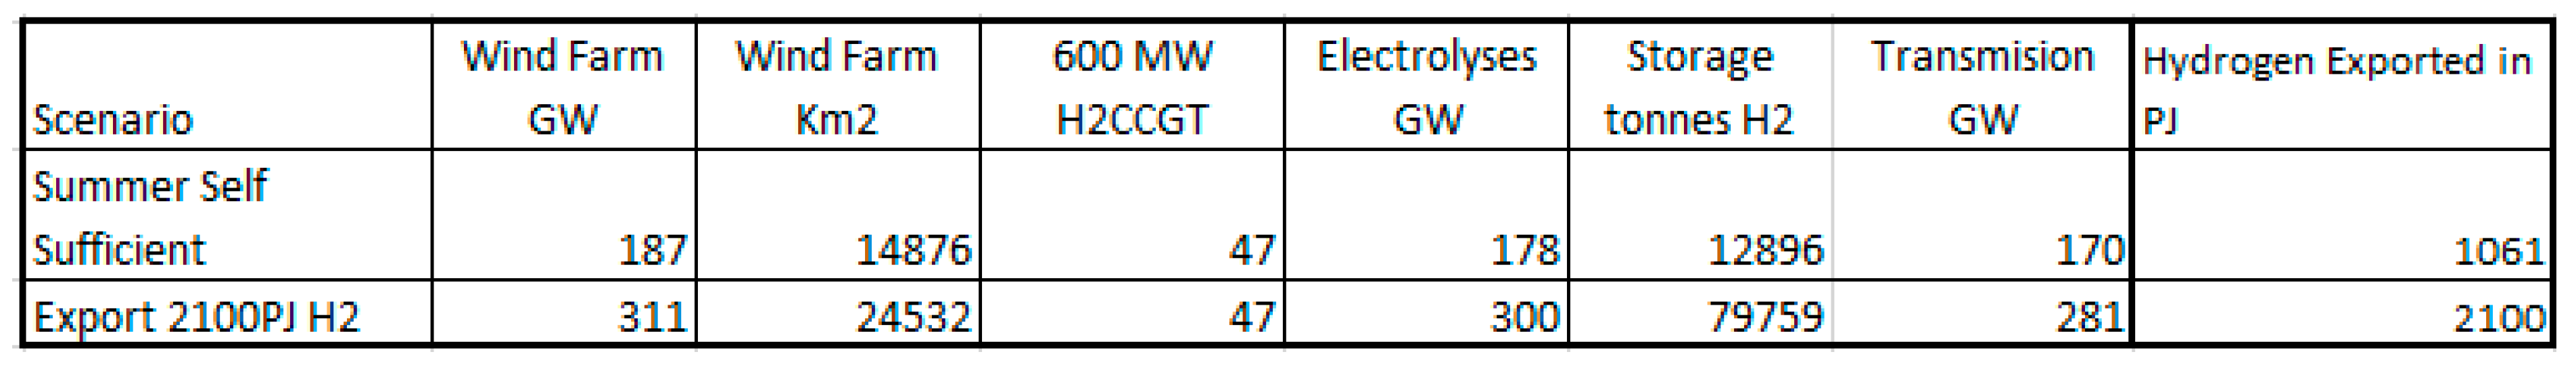
An examination of the above information reveals a great deal of useful detail to provide foundation knowledge for, among other things, policymaking and national investments. The size of the wind farm is 14876 km2, this is shown in Figure 4 as seven farms of 2125 km2 each on the coast north of Libyan. The installed nominal output needed is 187 GW, delivering less as a result of the maintenance factors.
The number of the H2CCGTs is determined by the maximum requirement (column 15, summer at 7:00). This number will need to be rounded up to 47 units. The electrolyser requirement is determined by the maximum that takes place in the winter at 2:00 (column 8, Table 4) this is 178 GW. The Hydrogen storage requirement is determined by the maximum taking place in the winter at 23:00 (column 11, Table 4); it is 57310 tonnes. Similarly, the grid capacity needed is for the winter maximum at 02:00 (column 4, Table 4) and is 187 GW. Table 6 shows a summary of these requirements with the electrolyser requirement adjusted by an availability factor of 0.95 and the storage and transmission requirements adjusted by an availability factor of 0.9. These factors may seem high, but the predictability, periodicity and seasonality of wind energy should permit scheduling most of the maintenance when the wind speed is under 3m/s and in seasons where there is excess capacity. Current electricity capacity in Libya is 11 GW (Irena 2022) and the transmission grid is of a commensurate size.
The vast increase in electricity capacity needed for the decarbonisation objective is partly due to the replacement of land transport fossil fuels by electric systems and partly due to the replacement of high utilisation fossil fuel electricity generating plant with medium utilisation renewable systems. The geographic location of the wind farms was chosen to be in the northern region of the country offering better speed of wind and more productive use of the wind farms. It is beneficial to locate the hydrogen grid very close to the coast on the premise that seawater will be used for electrolysis. An evaluation is needed to select between direct seawater electrolysis or to desalinate seawater and electrolyse it subsequently.
The use of seawater to produce hydrogen is a necessity given the scarcity (or geographical maldistribution) of fresh water in many parts of the world. The location of electrolysers, H2CCGTs and storage farms can be placed near the coast to minimise hydrogen transmission inland. So, in this scenario, the electrical grid and hydrogen grid would be distributed throughout the country would be concentrated near the Mediterranean coast.
The author propose it is logical to group the hydrogen infrastructure in hydrogen farms by the Mediterranean coast to capitalise on economies of scale and integration; also reducing hydrogen transmission costs. These hydrogen farms could be located close to the main cities, Tripoli and Benghazi where an important fraction of the demand is located. These cities also have the largest airports in the country where most of the liquid hydrogen will be used, noting that hydrogen for aviation will comprise 28% of the hydrogen demand (Table 1). These hydrogen farms would comprise the electrolysers, if adopted the desalination plant, the H2CCGTs, the storage facilities and where appropriate the liquefaction plant. Reviewing electrolyser and associated technologies (ITM 2017, H2FUTURE 2022, REFHYNE 2022, Herzog 2017, Mohammed-Ibrahim and Moussab 2020). The authors concluded that two hydrogen farms of approximately 270 km2 each would meet the requirements of the demand and the solar energy produced. Figure 4 shows the proposed location of the hydrogen farms and the wind farms.
In the scenario evaluated here, the premise is that this hydrogen-electrical green grid meets the summer requirements of the nation. For the rest of the year the author propose that wind farms are utilised to the maximum. The higher spped of wind experienced in the other three seasons delivers excess electrical energy that is used to produce hydrogen for export. The excess hydrogen produced daily is shown in column 7 at the bottom of the table for each season. The values are: 25936, 53616, 17381 tonnes for winter, spring and autumn. This delivers a total of 8.84 Megatonnes of Hydrogen each year, which equates to1061 TJ each year, exported in three seasons.
North Africa is seen to have great potential for energy exports (Mohamed et al 2015), green and conventional. In 2021 Libya used exported slightly over 1 million barrels/day of crude oil (ceicdata 2023); this is approximately 49 Megatonnes of oil each year with an energy content of 2100 PJ per year. A reasonable ambition would be to retain Libya’s international position as an energy exporter. Then a similar analysis can be carried out using this method for a scenario where Libya is exporting 2100 PJ of Hydrogen each year. This could be exported by tankers (Alkhaledi et al 2022) or by pipeline. The corresponding results for this energy export scenario are shown in the lower row of Table 6. This type of analysis could be used for different levels of export to deliver the appropriate quantitative results.
The wind power unit area proposed here is somewhat higher, at 3 MW/km². It is indicated that the installed capacity is 187 gigawatts, and the maximum generation is 44 gigawatts (in the winter season). This is the result of estimates and margins arising from weather and operating factors referred to in Section 5.
Furthermore, the grid transmission capacity is needed to minimise the impact of curtailment (Roadnight Taylor 2022). Curtailment may be needed for maintenance, excess power over demand and lack of transmission lines. Additionally, in this investigation, very few instances of excess power over demand are expected given that the basis of the generation system presented here relies on ample excess power to produce hydrogen for internal use and export.
One more detail to highlight is that the total wind electricity generated is much larger than the 630 PJ (407 PJ of electrical demand plus 223 PJ for hydrogen) required to satisfy the national demand. This is because of the need to produce additional Hydrogen for the H2CCGTs and exports. In the two scenarios examined the total wind electricity produced is 2420 PJ and 4000 PJ.
6. A Foundation Baseline for Future Policy nd R&D Investements
The present study has the appropriate accuracy for setting national and international research, development and financial agendas. It offers valuable insights in a single electricity generation solution and single energy storage approach, wind energy and H2CCGTs with their necessary ancillary systems. It also provides a quantitative platform for evaluation of alternatives. This is a very useful baseline for cascading and evaluation of alternatives and R&D requirements necessary for the decarbonisation agenda of a country. There are uncertainties and alternatives, described below, that will require further analysis. These evaluations will yield refinements but will not alter the main conclusions. For example, a key R&D issue that arises is how to produce hydrogen. Here seawater is advocated as the feedstock, to protect scarce freshwater supplies, currently an issue in many parts of the world. Advances are taking place in seawater electrolysis (Mohammed-Ibrahim, & Moussab 2020). Another alternative is to produce hydrogen in two steps, first desalination, followed by electrolysis of the resulting water stream. Another important source of water is from the combustion products of hydrogen in the H2CCGT exhaust, where suitable cooling and extraction equipment could provide a recirculating system, greatly reducing the need for electrolysis. A techno-economic analysis of the options is needed to make an appropriate selection. Solutions are likely to vary, dependent on the features of different geographic locations and it is likely that depending on circumstances, a portfolio approach will be needed. Within this context, there is also a choice to be made of the right electrolyser from the options available. In the current research, the demand patterns were maintained as constant. Demand management emerges as a viable strategy that could potentially offer cost advantages by shifting peak consumption times to align more closely with wind energy production, therefore diminishing the need for equipment. If demand could be transitioned from calm periods to windy periods, from seasons with less wind to those with more, and from still days to breezy ones, this would lessen the necessity for auxiliary power and storage solutions. A managed decrease in demand is also a feasible approach. For instance, the UK has noticed a 25% decline in electricity demand from 2003 to 2022 (BEIS 2023).
Every oil exporting country has a social duty to consider its wealth generation abilities once the demand for oil dwindles as a result of environmental requirements and policies. Libya currently exports about 80% of the oil it produces to Europe (OEC 2021). It is logical to expect that these energy exports will continue to be beneficial. Europe is a large energy consumer and is on a clear road for decarbonisation. So, there will be a clear demand for Libya’s energy exports as these become greener. The question then arises. Should Libya export liquid hydrogen by ship or gaseous hydrogen by pipeline or electricity to Europe? In the present study the export hydrogen is assumed to be gas. However, the likely solution is a mixture of the three. The importance of each of the three opportunities can be made visible following a detailed TERA evaluation of the costs, risks and benefits of the exporting technologies and markets.
Figure 6.
Location of facilities in Libya courtesy mapsoftheworld.com, annotated by the authors.
Another area that will influence the results is the selection of alternative storage energy alternatives. The technology proposed here, via the use of H2CCGTs is useful as a baseline, is competitive (Abudu et al 2021) but not the only option. Technologies such as batteries, pumped storage compressed air storage (Igie et al 2021) and others must be considered in the future. Each one of them presents its own technical and economic advantages, disadvantages and challenges.
Libya possesses various regions with favourable wind speeds for generating electricity, and among these regions stands out Derna, where a wind farm with a 60-megawatt capacity has been planned. Other areas like Al-Asaba, Tarhuna, and Al-Maslatah also experience abundant winds at suitable speeds. This article focuses on a study conducted to design a wind farm in the Torhuna region (Omar,Nouri and Abdalnasser 2019)..
Development of a wind power plant results in a variety of temporary and permanent disturbances, including land occupation by wind turbine pads, access roads, substations, service buildings, and other infrastructure which physically occupy land area, or create impermeable surfaces (Arnett et al. 2007).
Furthermore, the pace of technology progress and improved learning is expected to influence the benefits and economic features in a differential way. Often different geographic areas will require different solutions and a portfolio approach could be the outcome.
Given the scale of investment envisaged and influence of global geographic opportunities this is an exercise that will require extensive and bespoke TERA (Nalianda 2012) evaluations. Worldwide, there has been a significant surge in wind power capacity over the past ten years, with a yearly average increase of 22%. By the end of 2015, this figure had reached a staggering 432 GW. Most of this capacity - around 73% - was contributed by just five countries: China, the United States, Germany, India, and Spain (Global Wind Energy Council, 2016). At present, wind turbines can be broadly categorized into two types: onshore and offshore. The former is typically located on land, while the latter are situated in bodies of water like lakes and seas. Wind turbine design and operational principles, including factors such as orientation, variable foundations.
Wind conditions were assessed based on local, seasonal, and hourly variations, factoring in redundancy measures for maintenance and weather events. Wind turbines could be engineered to generate electricity optimally, altering demand and supply patterns. The design and operation of wind farms could be enhanced considering the relatively low usage (plus the cyclical nature of the operation) of the capital equipment. Through technological advancement and meticulous maintenance scheduling, significant cost benefits can be realized. Expected improvements in these areas will come from accumulated experience, volume, and technology acquisition.
The design of hydrogen systems in large wind farms or parks is another area receiving and will continue to receive considerable focus. Consolidating hydrogen systems within wind farms or parks will offer economies of scale and experience, resulting in reduced hydrogen transmission, health and safety investments, operational scale, and cost benefits from experience acquisition. Unit costs of hydrogen tanks become more economical as capacity increases. In some studies, using both the best-worst method and a hierarchical analytical process, five proposed sites in Libya were evaluated based on six criteria of fossil fuel dependence.
The standard of safety and quality emerged as the most important, and the city of Derna in the northeast was identified as the best option followed by the city of Tarhuna, in the west of the country, demonstrating the robustness of the model even when expert opinions about standards change. (Ibrahim, Dragan, Željko, L.J. 2023) Another crucial aspect that warrants further exploration is the source of electricity. The choice of wind energy is highly rational in the case of Libya, given its substantial coastal wind resources. However, the capacity requirements for both generation and storage within the system are substantial. Other energy sources will be evaluated. In addition to wind energy, Libya could potentially harness wave energy due to its extensive coastline, and other opportunities that necessitate a detailed Techno-Economic Resource Assessment (TERA).
Realistic assumptions were made regarding the redundancy needed, availability, and other capacity-constraining factors for several inputs. Similarly, ample opportunities exist to explore in terms of techno-economic performance. As such, this study serves as a foundation for a more detailed techno-economic optimization that examines the opportunities and options outlined above. It also enables the beginning of cost estimation for the highly expensive transition towards a decarbonized economy.
7. Conclusions
In the current research, a knowledge gap gets bridged by introducing a unique, quantitative technophilosophical method. This method provides a statistical perspective on energy requirements and economic growth to inform decarbonization strategies. No such comprehensive and quantitative country-level replacement analysis has been found in the public domain before. Therefore, the contribution lies in the quantitative visualization of infrastructure requirements, derived from the evaluation of two scenarios: energy self-sufficiency and matching current oil exports.
The foundational study gets presented as a demonstrative example, without making judgments, recommendations, or optimizations. However, several pertinent conclusions surface. The first, despite numerous uncertainties and a singular solution examination, is that the cost and infrastructure requirements will be enormous. A cost estimate will get conducted shortly, but even before that, Table 6 illustrates the tremendous equipment needs; these will come with a high price tag. Even though the current investigation is based on singular choices, these are competitive, validating the order of magnitude of the requirement.
While the study was conducted with Libya - a country with abundant wind resources - as a focus, the principles, outcomes, and impacts have global applicability. An important conclusion is that, due to the periodic and seasonal nature of wind speed, the general utilization of the equipment lies in the medium range. This can get mitigated by demand management, adoption of improved technologies, execution of advanced maintenance techniques, and other strategies offering beneficial outcomes. The substantial increase in electricity capacity required for decarbonization is partly due to the replacement of transport fossil fuels with electric and hydrogen systems, and partly due to the replacement of high-utilization fossil fuel electricity-generating plant with medium-utilization renewable systems.
The concept of the hydrogen farm warrants detailed future scrutiny. It holds the promise of reducing costs, even though the order of magnitude of the overall decarbonizing investment isn’t expected to change significantly. Careful integration of different elements will also yield savings. Moreover, the strict Health and Safety measures necessary for hydrogen operations will be confined to a small number of specific areas, namely the locations of hydrogen farms within a country. A comprehensive Techno-Economic Resource Assessment (TERA) represents the next stage in this research.
The process of transitioning to more sustainable practices will necessitate a large-scale increase in electrification. This foundational analysis can serve as a starting point for research and development, investment planning, and policymaking at the beginning of the road to decarbonization.
Nomenclature
FCV – Fuel Calorific Value
GJ/T – Gigajoules/tonne
H2 - Hydrogen
H2TGTCC – Hydrogen fuelled gas turbine combined cycle
kTonne – kilotonne = 1000 tonnes
MT – mega tonnes (million tonnes)
MTOE – Million tonne oil equivalent
NOx – Nitrogen Oxides
PJ – Petajoules = 1015 Joules
Pw – wind power
R&D – Research and Development
TERA – Technoeconomic Environmental Risk Analysis
TJ – Terajoule = 1012 Joule
References
- Abudu K, et al (2021) Impact of gas turbine flexibility improvements on combined cycle gas turbine performance, Applied Thermal Engineering, 189 (May) Article No. 116703.
- A. Farhan, A. Hassanpour*, A. Burns, Y. Ghaffari Motlagh (2019) Numerical study of effect of winglet planform and airfoil on a horizontal axis wind turbine performance.
- A. Fallis, “Global Wind Statisitcs (2015). GWEC,” Brussels, Belgium.
- Alkhaledi, A et al (2022) A hydrogen fuelled LH2 tanker ship design, Ships and Offshore Structures, 17:7, 1555-1564.
- Arnett, E.B.; Inkley, D.B; Johnson, D.H.; Larkin, R.P.; Manes, S.; Manville, A.M.; Mason, R.; Morrison, M.; Strickland, M.D.; Thresher, R. (September 2007). “Impacts of Wind Energy Facilities on Wildlife and Wildlife Habitat.” Wildlife Society Technical Review 07-2, 49 pp. The Wildlife Society, Bethesda, Maryland, USArab Energy 10th Conference Proceedings – 2014, https://oapecorg.org/media/c48589f8-07e1-4745-b82f-a62ff4085333/558960152/Presentations/%D9%84 (accessed 19 March 2022).
- BEIS – Department for Business, Education and Skills, UK 2022, https://www.gov.uk/government/statistical-data-sets/historical-electricity-data (accessed 10 April 2023).
- Badi a , Dragan Pamucar ˇ b,∗ , Željko Stevic’ c , L.J. Muhammadd (2023) Wind farm site selection using BWM-AHP-MARCOS method: A case study of Libya Ibrahim.
- https://www.ceicdata.com/en/indicator/libya/crude-oil-exports accessed (accessed 8 October 2022).
- https://countryeconomy.com/energy-and-/electricity-generation/libya (accessed 8 October 2022).
- Decker, L 2019 Latest Global Trend in Liquid Hydrogen Production HYPER Closing Seminar Brussels, December 10, 2019 https://www.sintef.no/globalassets/project/hyper/presentations-day-1/day1_1430_decker_latest-global-trend-in-liquid-hydrogen-production_linde.pdf (accessed 19 January 2023).
- Dray, L., et al (2022). Cost and emissions pathways towards net-zero climate impacts in aviation. Nature. Climate Chang. 12, 956–962.
- EnableH2 Website – https://www.enableh2.eu/ (accessed 11th April 2020).
- 13. https://www.ge.com/gas-power/products/gas-turbines (accessed 20 January 2023).
- https://www.theglobaleconomy.com/Libya/electricity_production_capacity (accessed 8 October 2022). [CrossRef]
- Global Wind Energy Council (GWEC), (2016). Global Wind Report 2015 – Annual market update. Available online: Harwood, R.G., Shuttleworth, E.P., 1988. Grouted and Mechanical Strengthening and Repair of Tubular Steel Offshore Structures (report OTH 88). Department of Energy - Offshore Technology, London, UK, 283. http://www.gwec.net/publications/global-wind-report-2/. (accessed 20 January 2023).
- Herzog, B (2017). Moglichkeiten von Wasserstoff-Elektrolyseuren in Flexibilitatsmarkten. Technical Report Siemens AG.
- Huete, J; Nalianda, D, Pilidis, P. Propulsion system integration for a first-generation hydrogen civil airliner? The Aeronautical Journal, ISABE Special Issue 2021.
- H2FUTURE project site https://www.h2future-project.eu/ (accessed Nov Dec 07,2022).
- Igie U, et al (2021) Impact of compressed air energy storage demands on gas turbine performance, Proceedings of the Institution of Mechanical Engineers, Part A: Journal of Power and Energy, 235 (4) 850-865.
- ITM Power, 2017. 100MW Electrolyser. https://www.youtube.com/watch?v=eku0GuSKiIc. (accessed Nov 22, 2022).
- International - U.S. Energy Information Administration (EIA) (accessed 20 July 2022).
- Libya_Africa_RE_SP.pdf (irena.org) 2022 (accessed 10 April 2023).
- Mohamed, AMA et al Towards exporting renewable energy from MENA region to Europe: An investigation into domestic energy use and householders’ energy behaviour in Libya, Applied Energy, Volume 146, 2015, Pages 247-262, ISSN 0306-2619.
- Mohammed-Ibrahim, J & Moussab, H, Recent advances on hydrogen production through seawater electrolysis, Materials Science for Energy Technologies, Volume 3, 2020, Pages 780-807, ISSN 2589-2991, https://www.sciencedirect.com/science/article/pii/S2589299120300537.
- Nalianda D (2012) Impact of environmental taxation policies on civil aviation - a techno-economic environmental risk assessment, Doctoral Thesis, Cranfield University.
- Crude Petroleum in Libya | OEC - The Observatory of Economic Complexity (accessed 3 April 2023).
- OPEC https://www.opec.org/opec_web/en/about_us/166.htm - data for Libya 2021 (accessed 3 April 2023).
- Omar Guma Mrehel,Nouri Ali Daw and Abdalnasser Farj Ali Jbail 2019) Design and Simulation of Wind Farm in Tarhuna Region with Economic Analysis. https://ourworldindata.org/energy/country/libya (accessed 25 November 2022).
- 29. Parker, RJ and Pilidis, P; The Light Beyond the Clouds, The Aeronautical Journal , Volume 125 , Issue 1291: The 25th ISABE Conference special issue , September 2021 , pp. 1467 – 1468.
- 30. https://power.mhi.com/products/gasturbines/lineup/m701j accessed 20 January 2023.
- 31. R.Ramelli, O. M. Shalabiea, I.Saleh, and J.O. Stenflo, eds., PROSPECTS OF RENEWABLE ENERGY IN LIBYA, International Symposium on Solar Physics and Solar Eclipses (SPSE) 2006.
- Rawesat, Y & Sannuga, S, Private Communication 2021) REFHYNE project site https://refhyne.eu/ (accessed Dec 13, 2022). [CrossRef]
- Reserve, C.W., 2016. World’s first carbon nanotube reinforced polyurethane wind blades. https://engineering.case.edu/emac/news/Carbon-Nanotube-Reinforced (Accessed 31 July 2023).
- Reksten, AH et al Projecting the future cost of PEM and alkaline water electrolysers; a CAPEX model including electrolyser plant size and technology development, International Journal of Hydrogen Energy, Volume 47, Issue 90, 2022, Pages 38106-38113, ISSN 0360-3199.
- What is curtailment in electricity networks and how does it work? (roadnighttaylor.co.uk) (accessed 8 April 2023).
- Rosling, H et al; Factfulness: Ten Reasons We’re Wrong About The World - And Why Things Are Better Than You Think, by Sceptre, 27 Jun 2019.
- Renewable UK, 2017. Wind Energy Statistics; Available online: Wind Energy Statistics - RenewableUK. (Accessed 06. August.23).
- Renewables Ninja Renewables.ninja . (Accessed 30. May.23).
- Saleh, I, 2006/01/01, Prospects of Renewable Energy in Libya, The International Symposium on Solar Physics and Solar Eclipses (SPSE 2006).
- Schafer, AW; Barrett, SRH; Doyme, K; Dray, LM; Gnadt, AR; Self, R; O’Sullivan, A; Synodinos, AP; Torija; Technological, Economic and Environmental Prospects of All-electric Aircraft. Nature, Article No 15020 I DOI:10.1038 – 11 January 2016.
- https://www.siemens-energy.com/global/en/offerings/power-generation/gas-turbines/sgt5-9000hl.html accessed (20 January 2023).
- S&PGlobal 2023 https://www.spglobal.com/commodityinsights/en/market-insights/latest-news/oil/072122-libyan-oil-minister-expects-crude-output-to-double-to-12-mil-bd-in-10-days - (accessed 7 April 2023).
- Statista Libya: age dependency ratio 2010-2021 | Statista (accessed 25 November 2022).
- The Economist - Achieving net-zero carbon emissions will be eye-wateringly expensive, July 17, 2021.
- UNPRI https://www.unpri.org/inevitable-policy-response/what-is-the-inevitable-policy-response/4787.article; (accessed 23 Sept 2021).
- https://en.wikipedia.org/wiki/Hydrogen_production#Electrolysis (accessed 24 Jan 2022).
- World Bank data: https://data.worldbank.org/indicator/NY.GDP.MKTP.KD.ZG?locations=LY - (accessed 7 April 2023).
- worlddata.info)Statistics and data of all countries in Africa (accessed 20 July 2022). 2021.
- J. N. Nielsen The Emerging School of Techno-Philosophy | Grand Strategy: The View from Oregon (wordpress.com) (accessed 7 April 2023)’.
- What is curtailment in electricity networks and how does it work? (roadnighttaylor.co.uk) (accessed 8 April 2023).
- W. El-osta,Y.Kalifa, “Prospects of wind power plants in Libya: a case study,” Renew. Energy, vol. 28, pp. 363–371, 2003).
Figure 1.
Demand curves for 2050 used in the study.
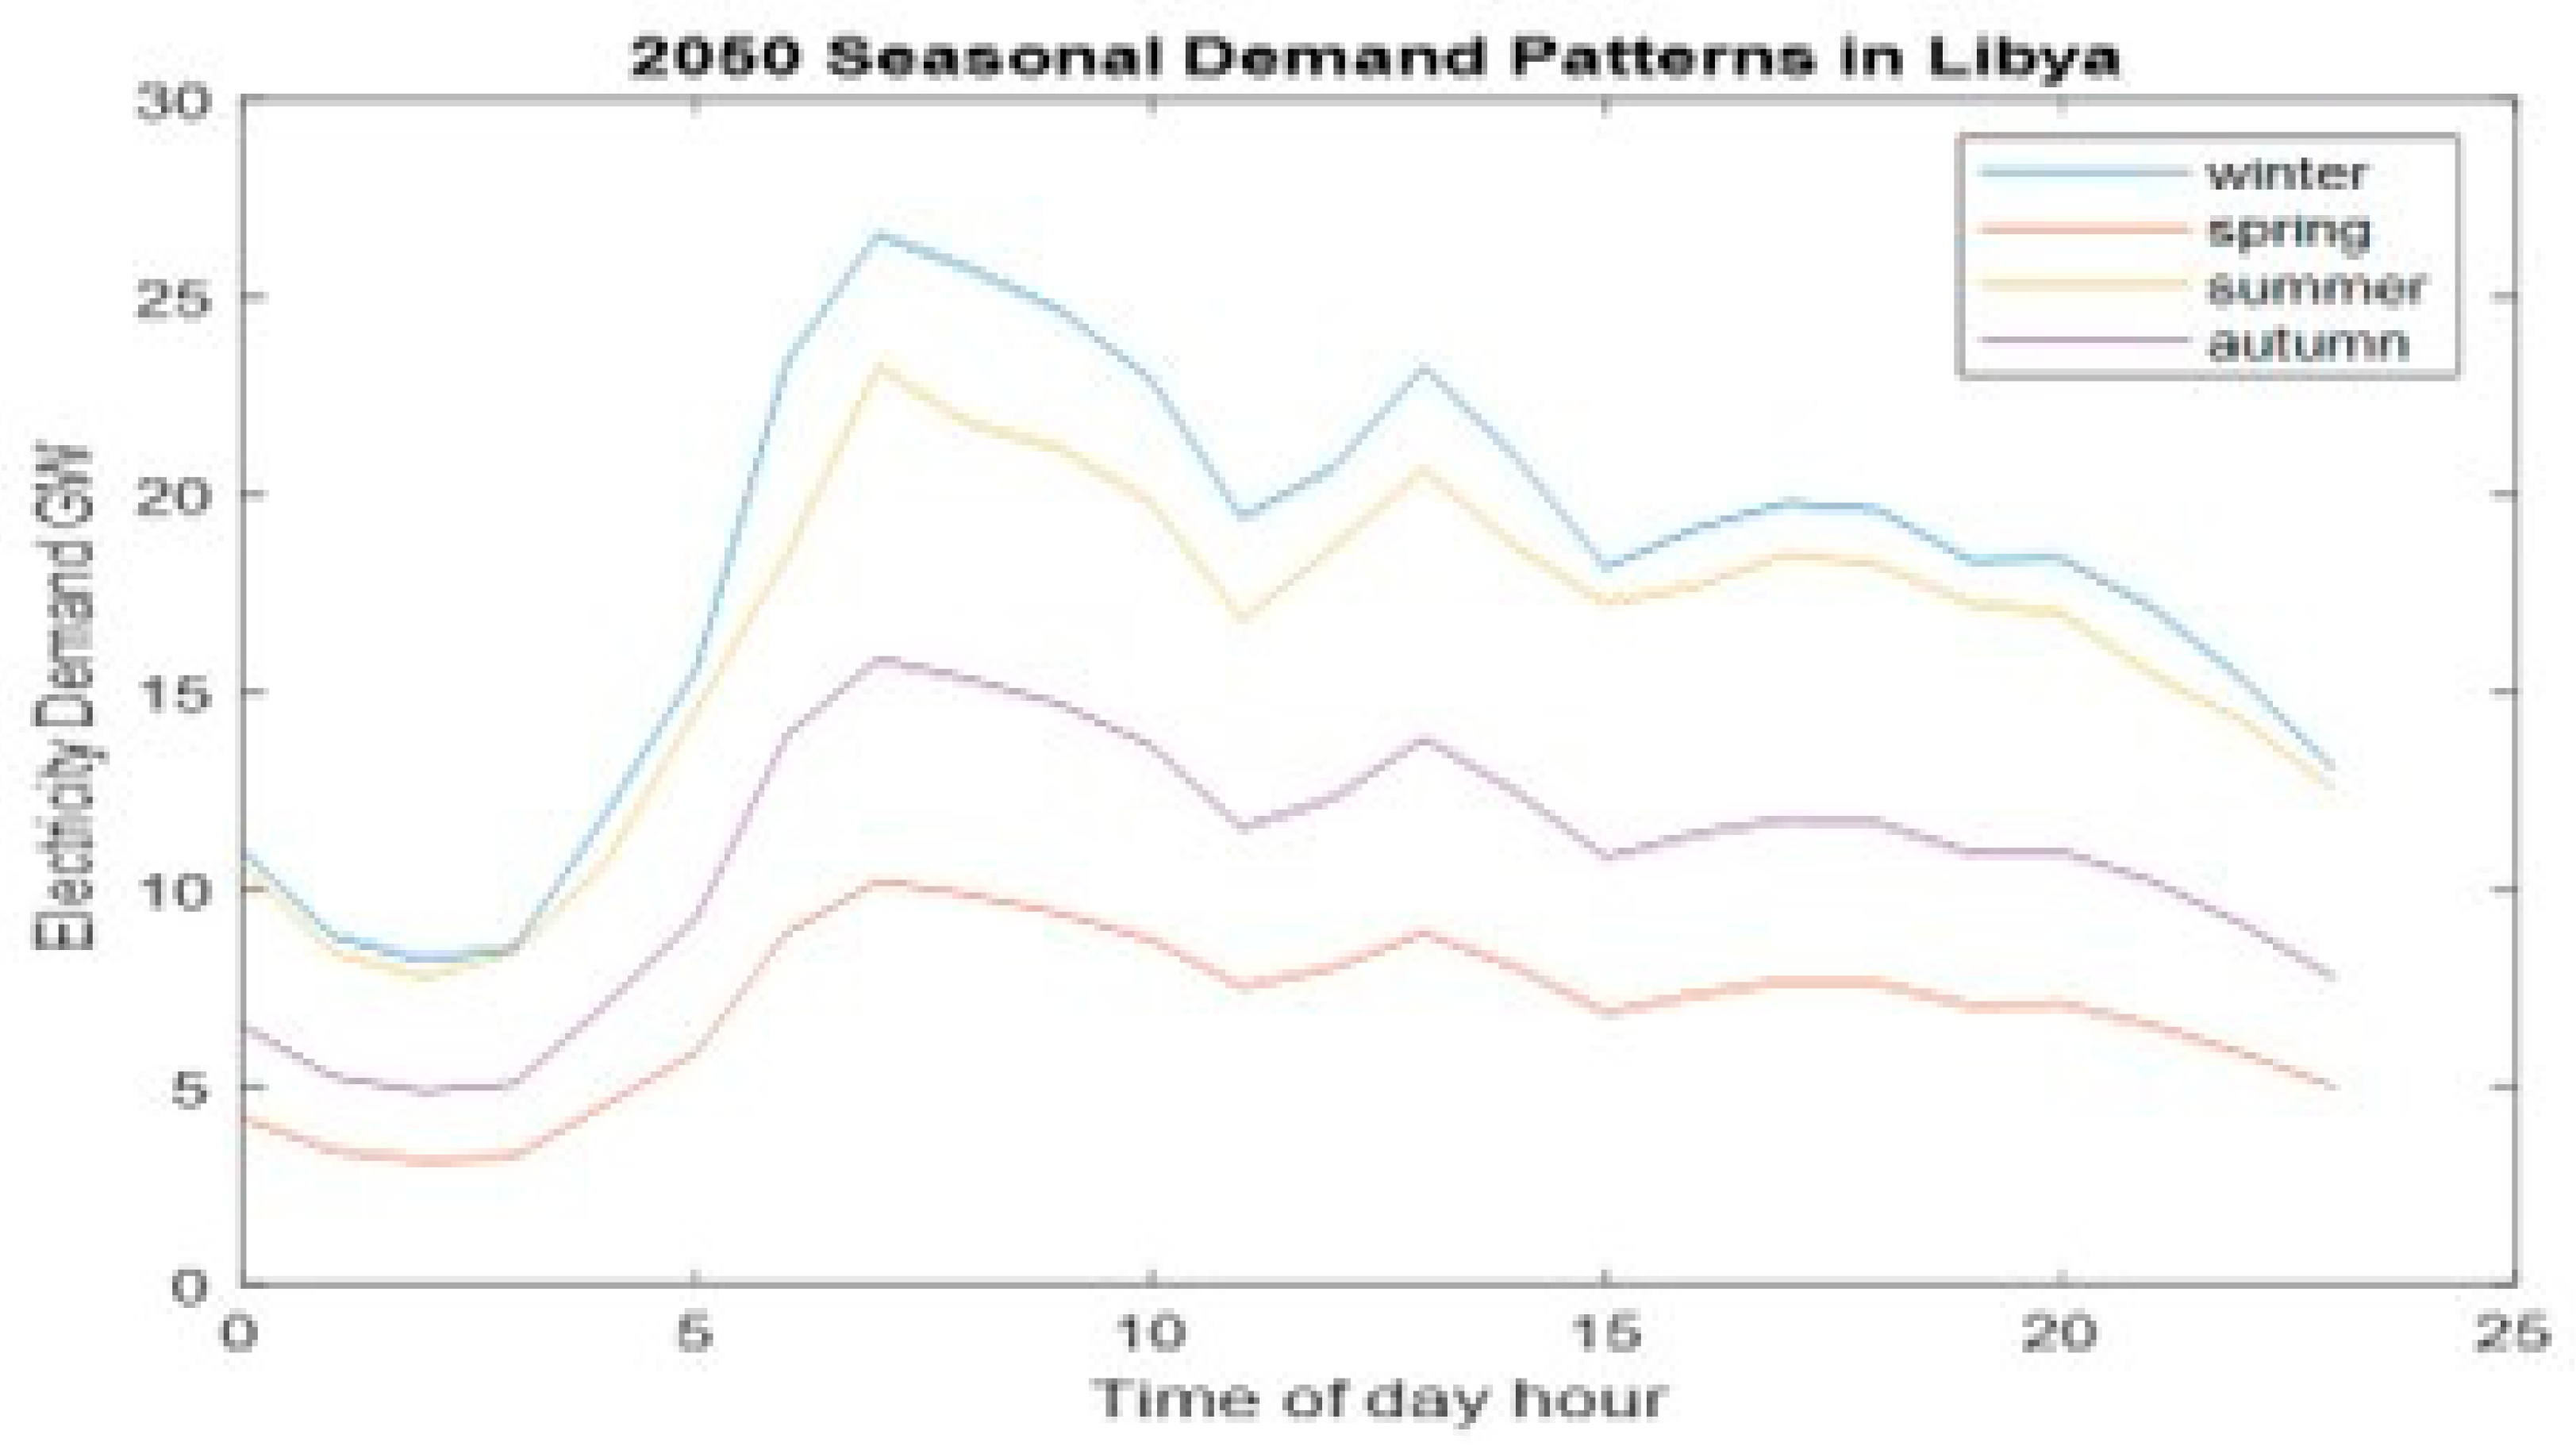
Figure 3.
Power curve of 4200 kW wind turbine.
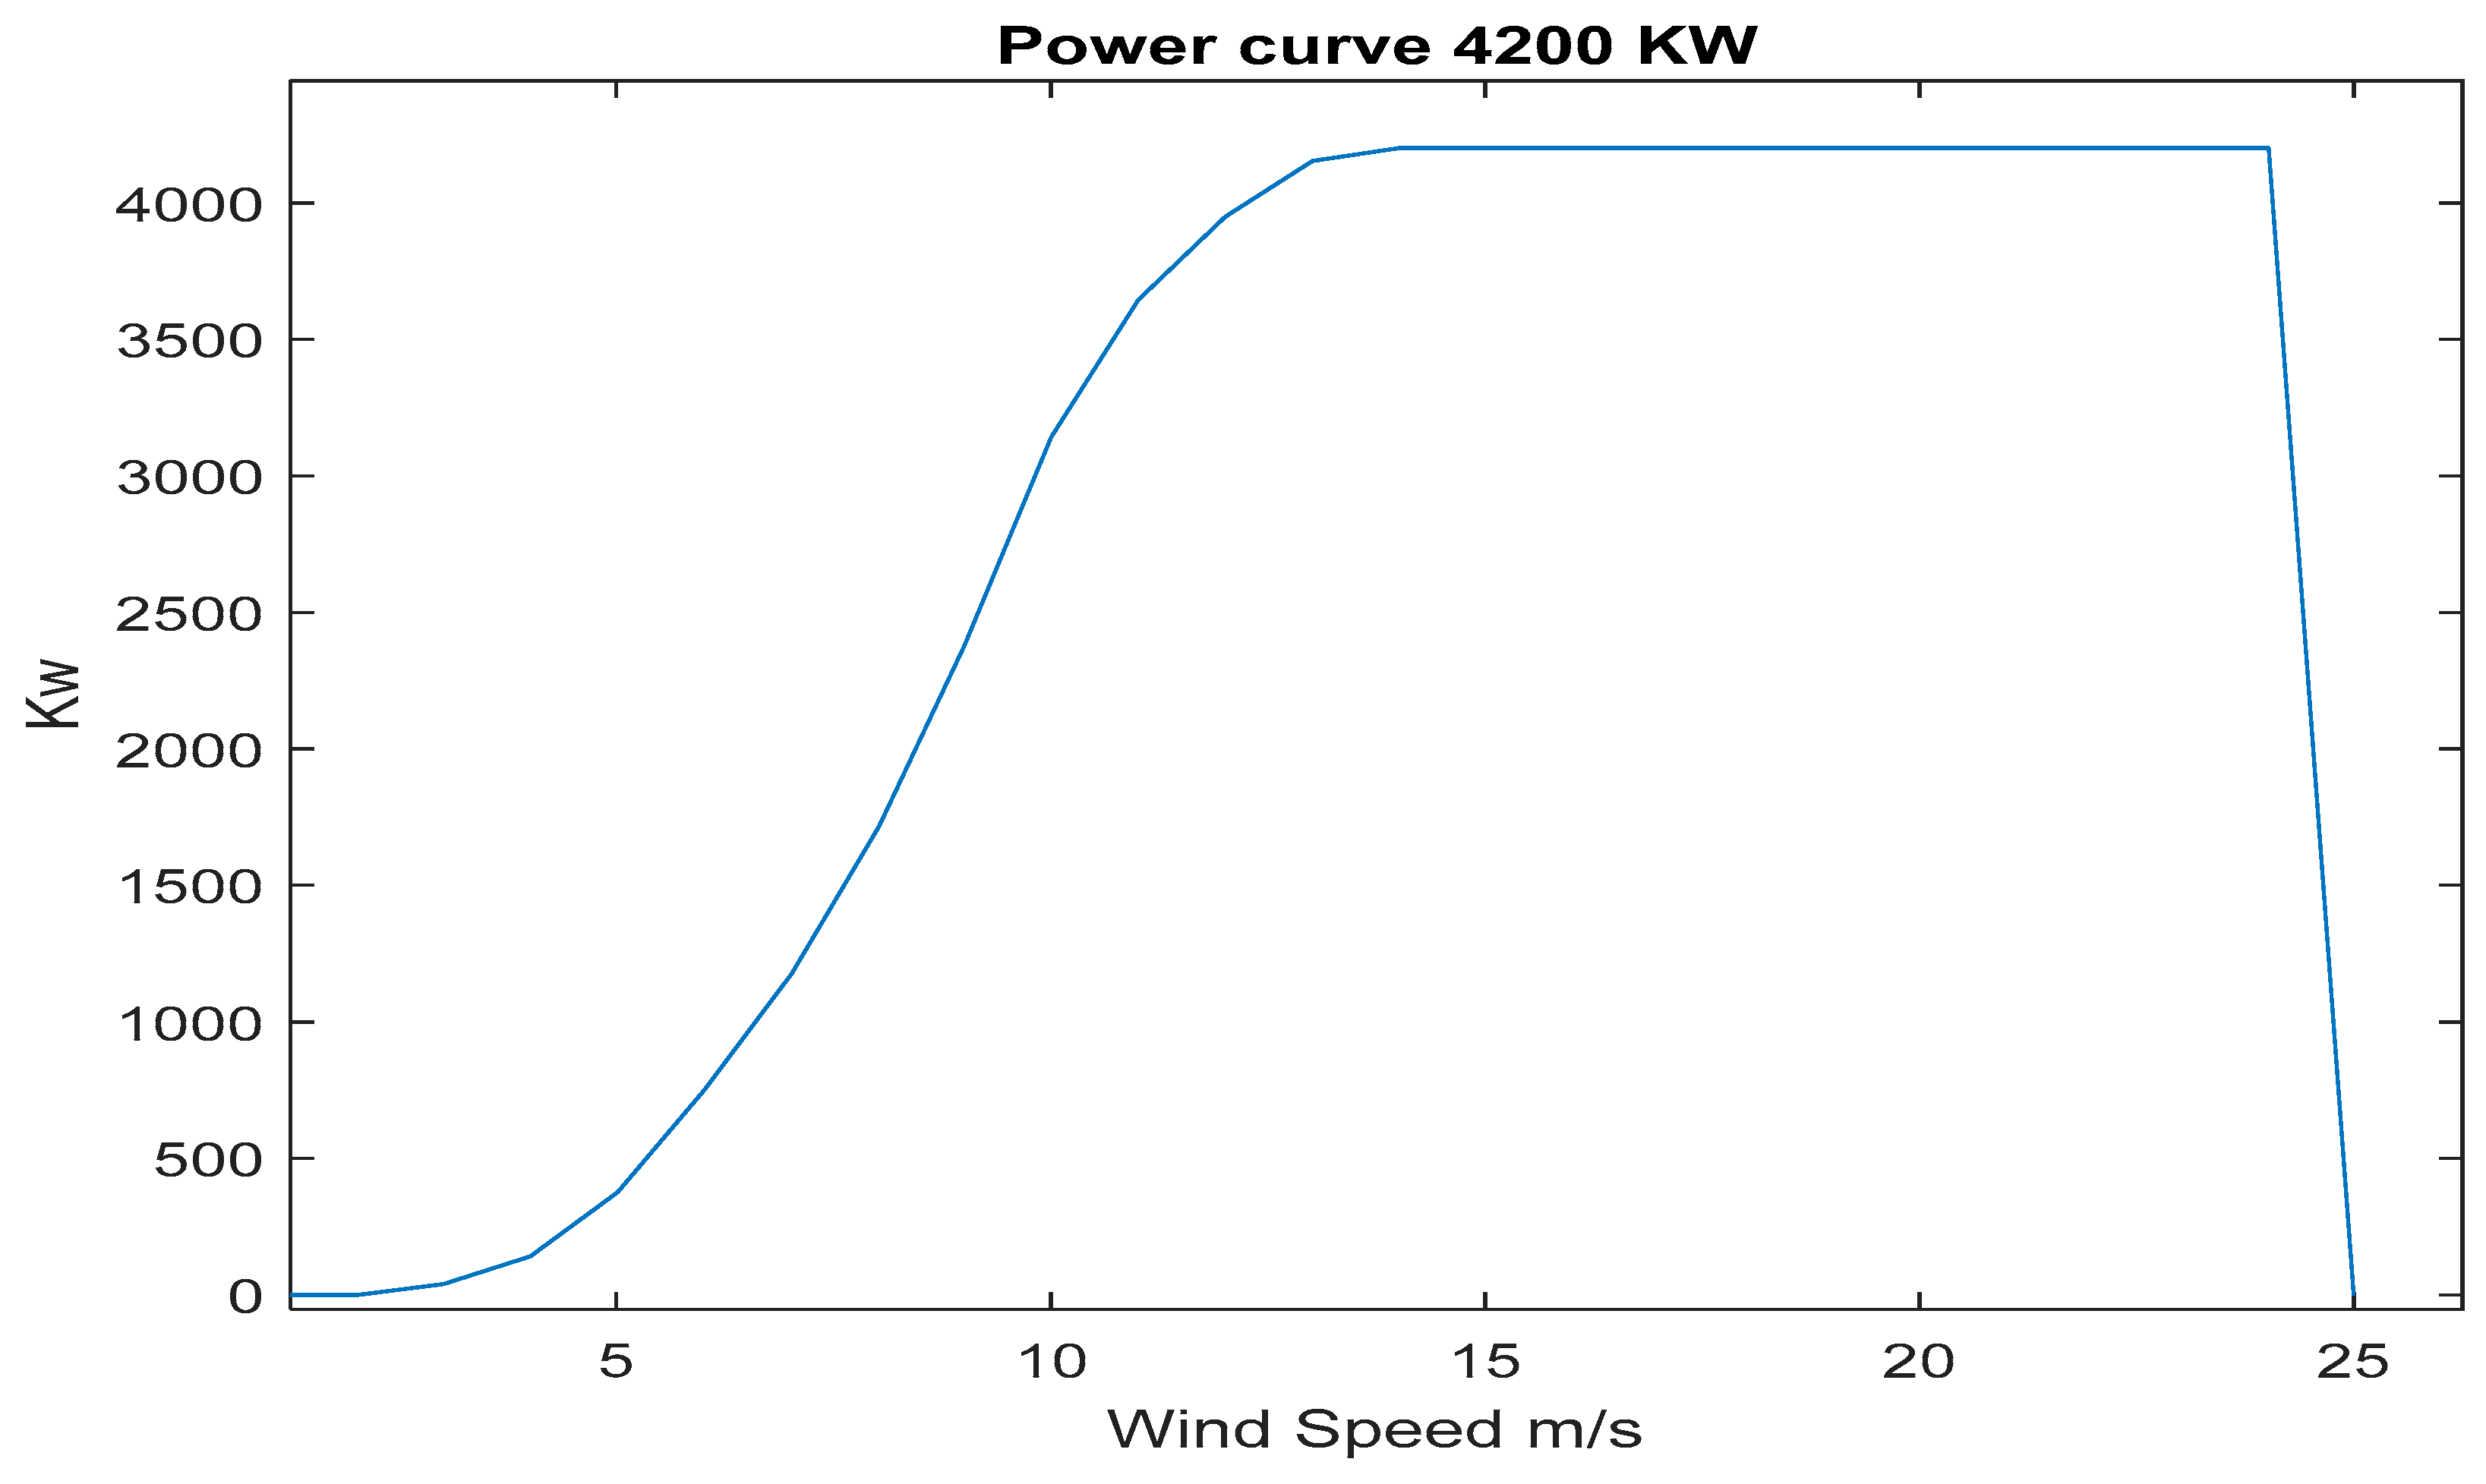
Figure 4.
4200 kW wind turbine.
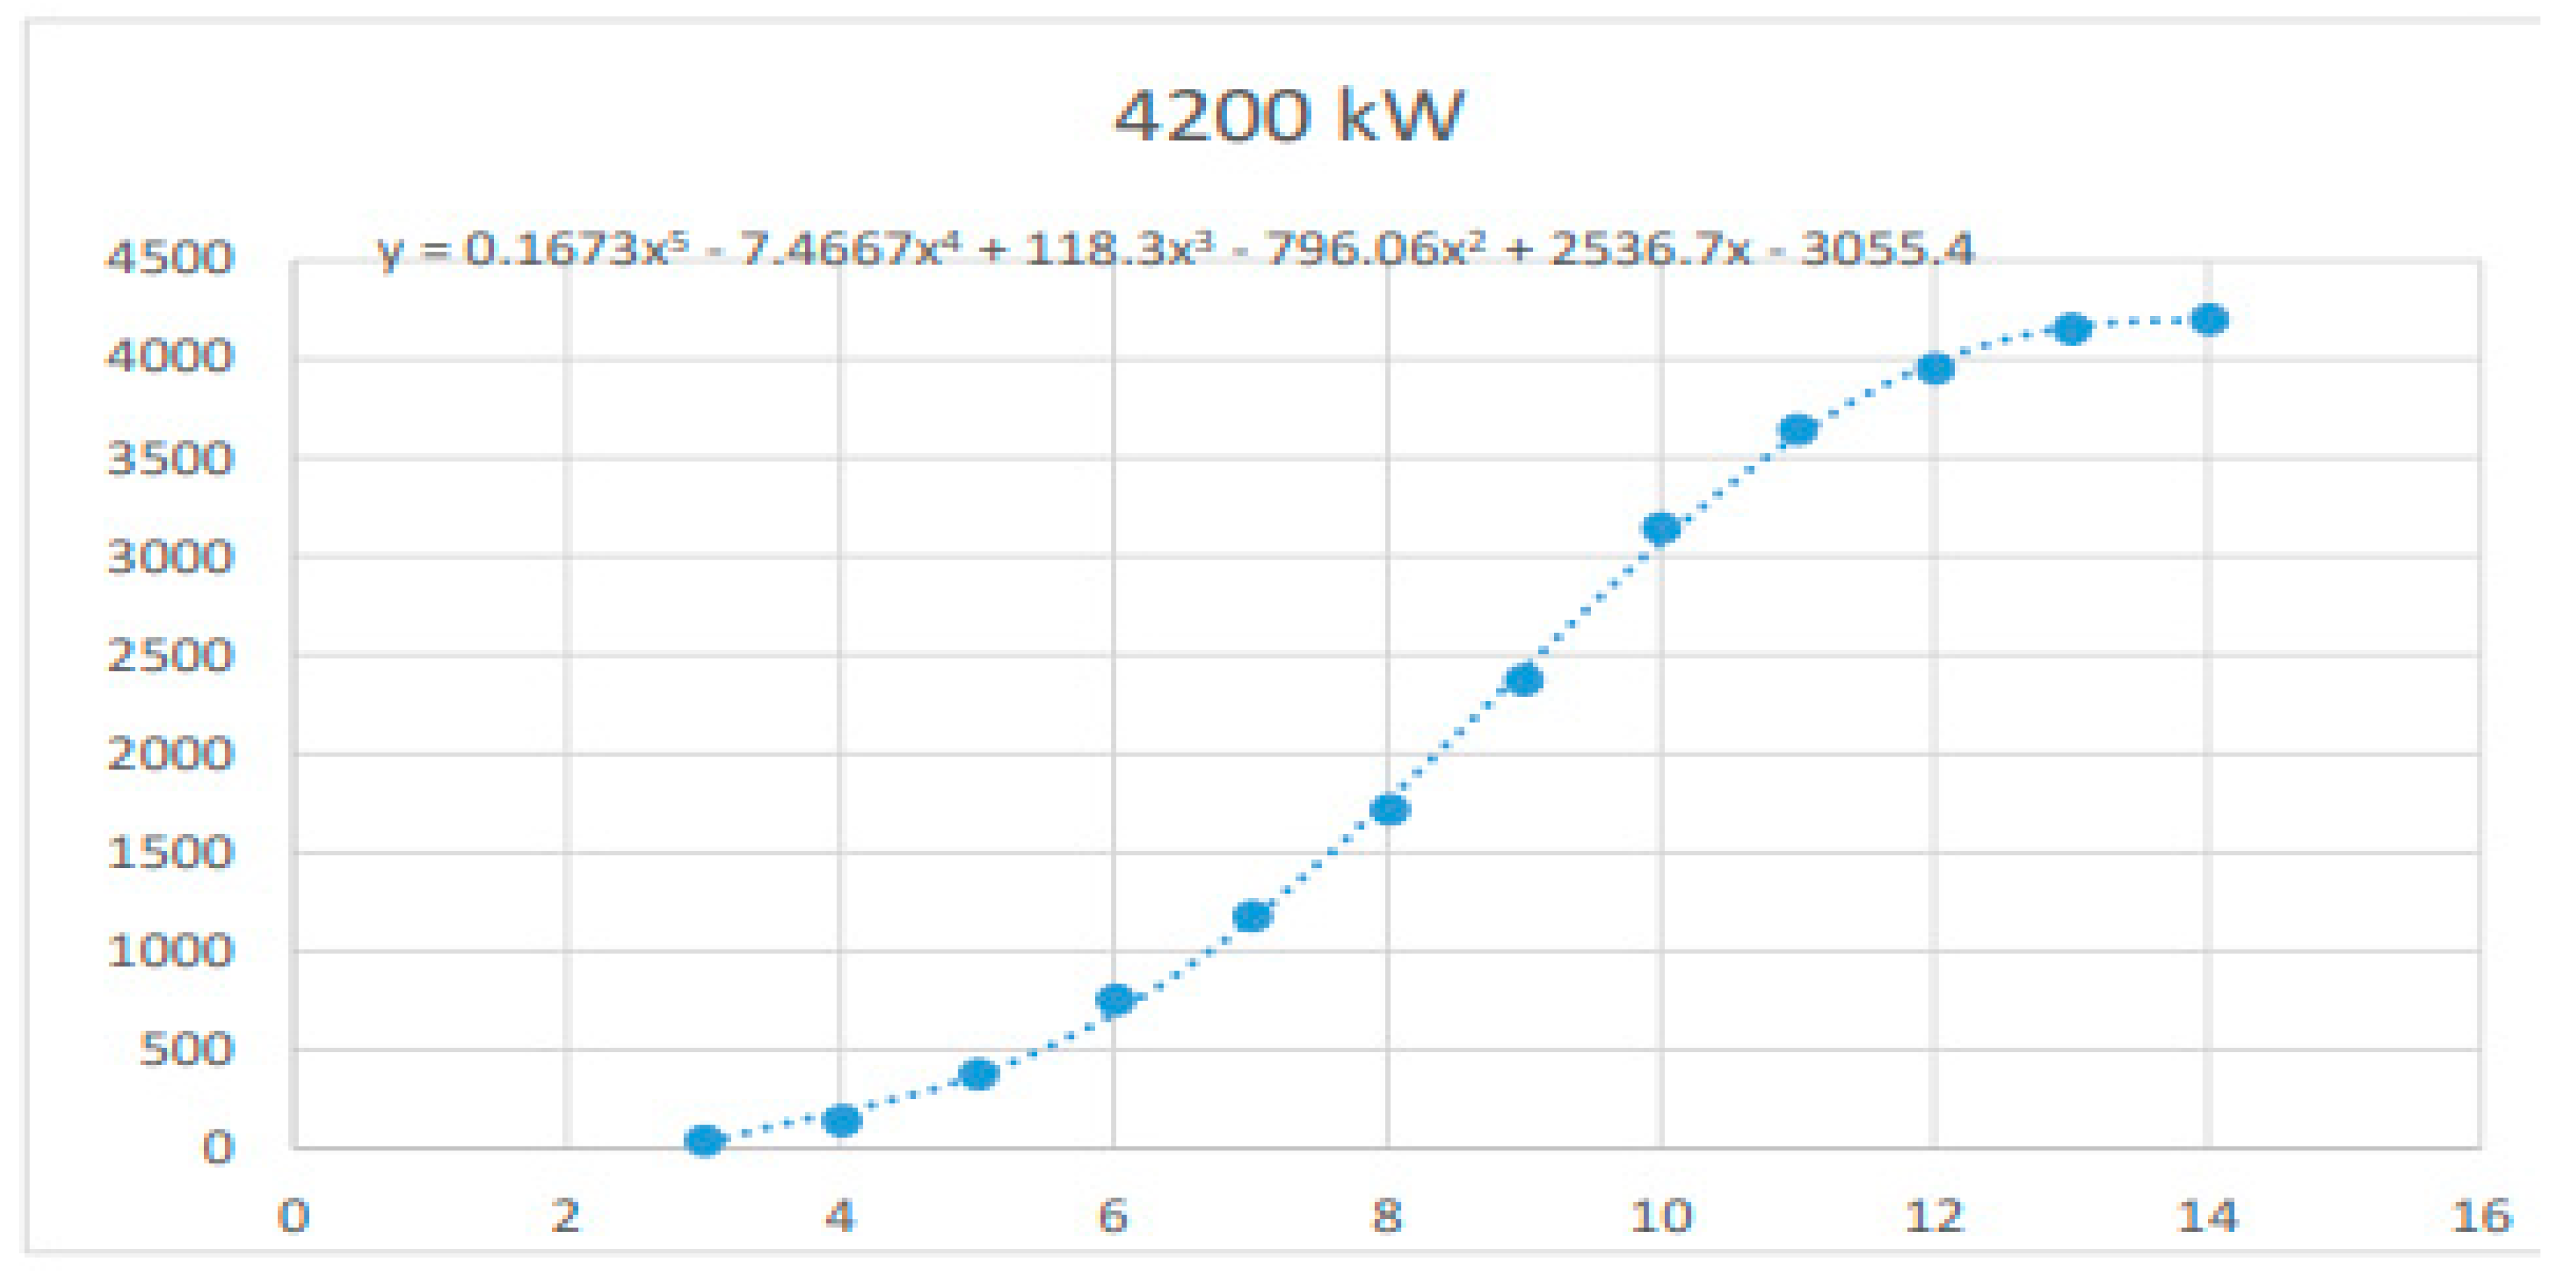
Figure 5.
Electrical Supply,demand and H2CCGT for the year.
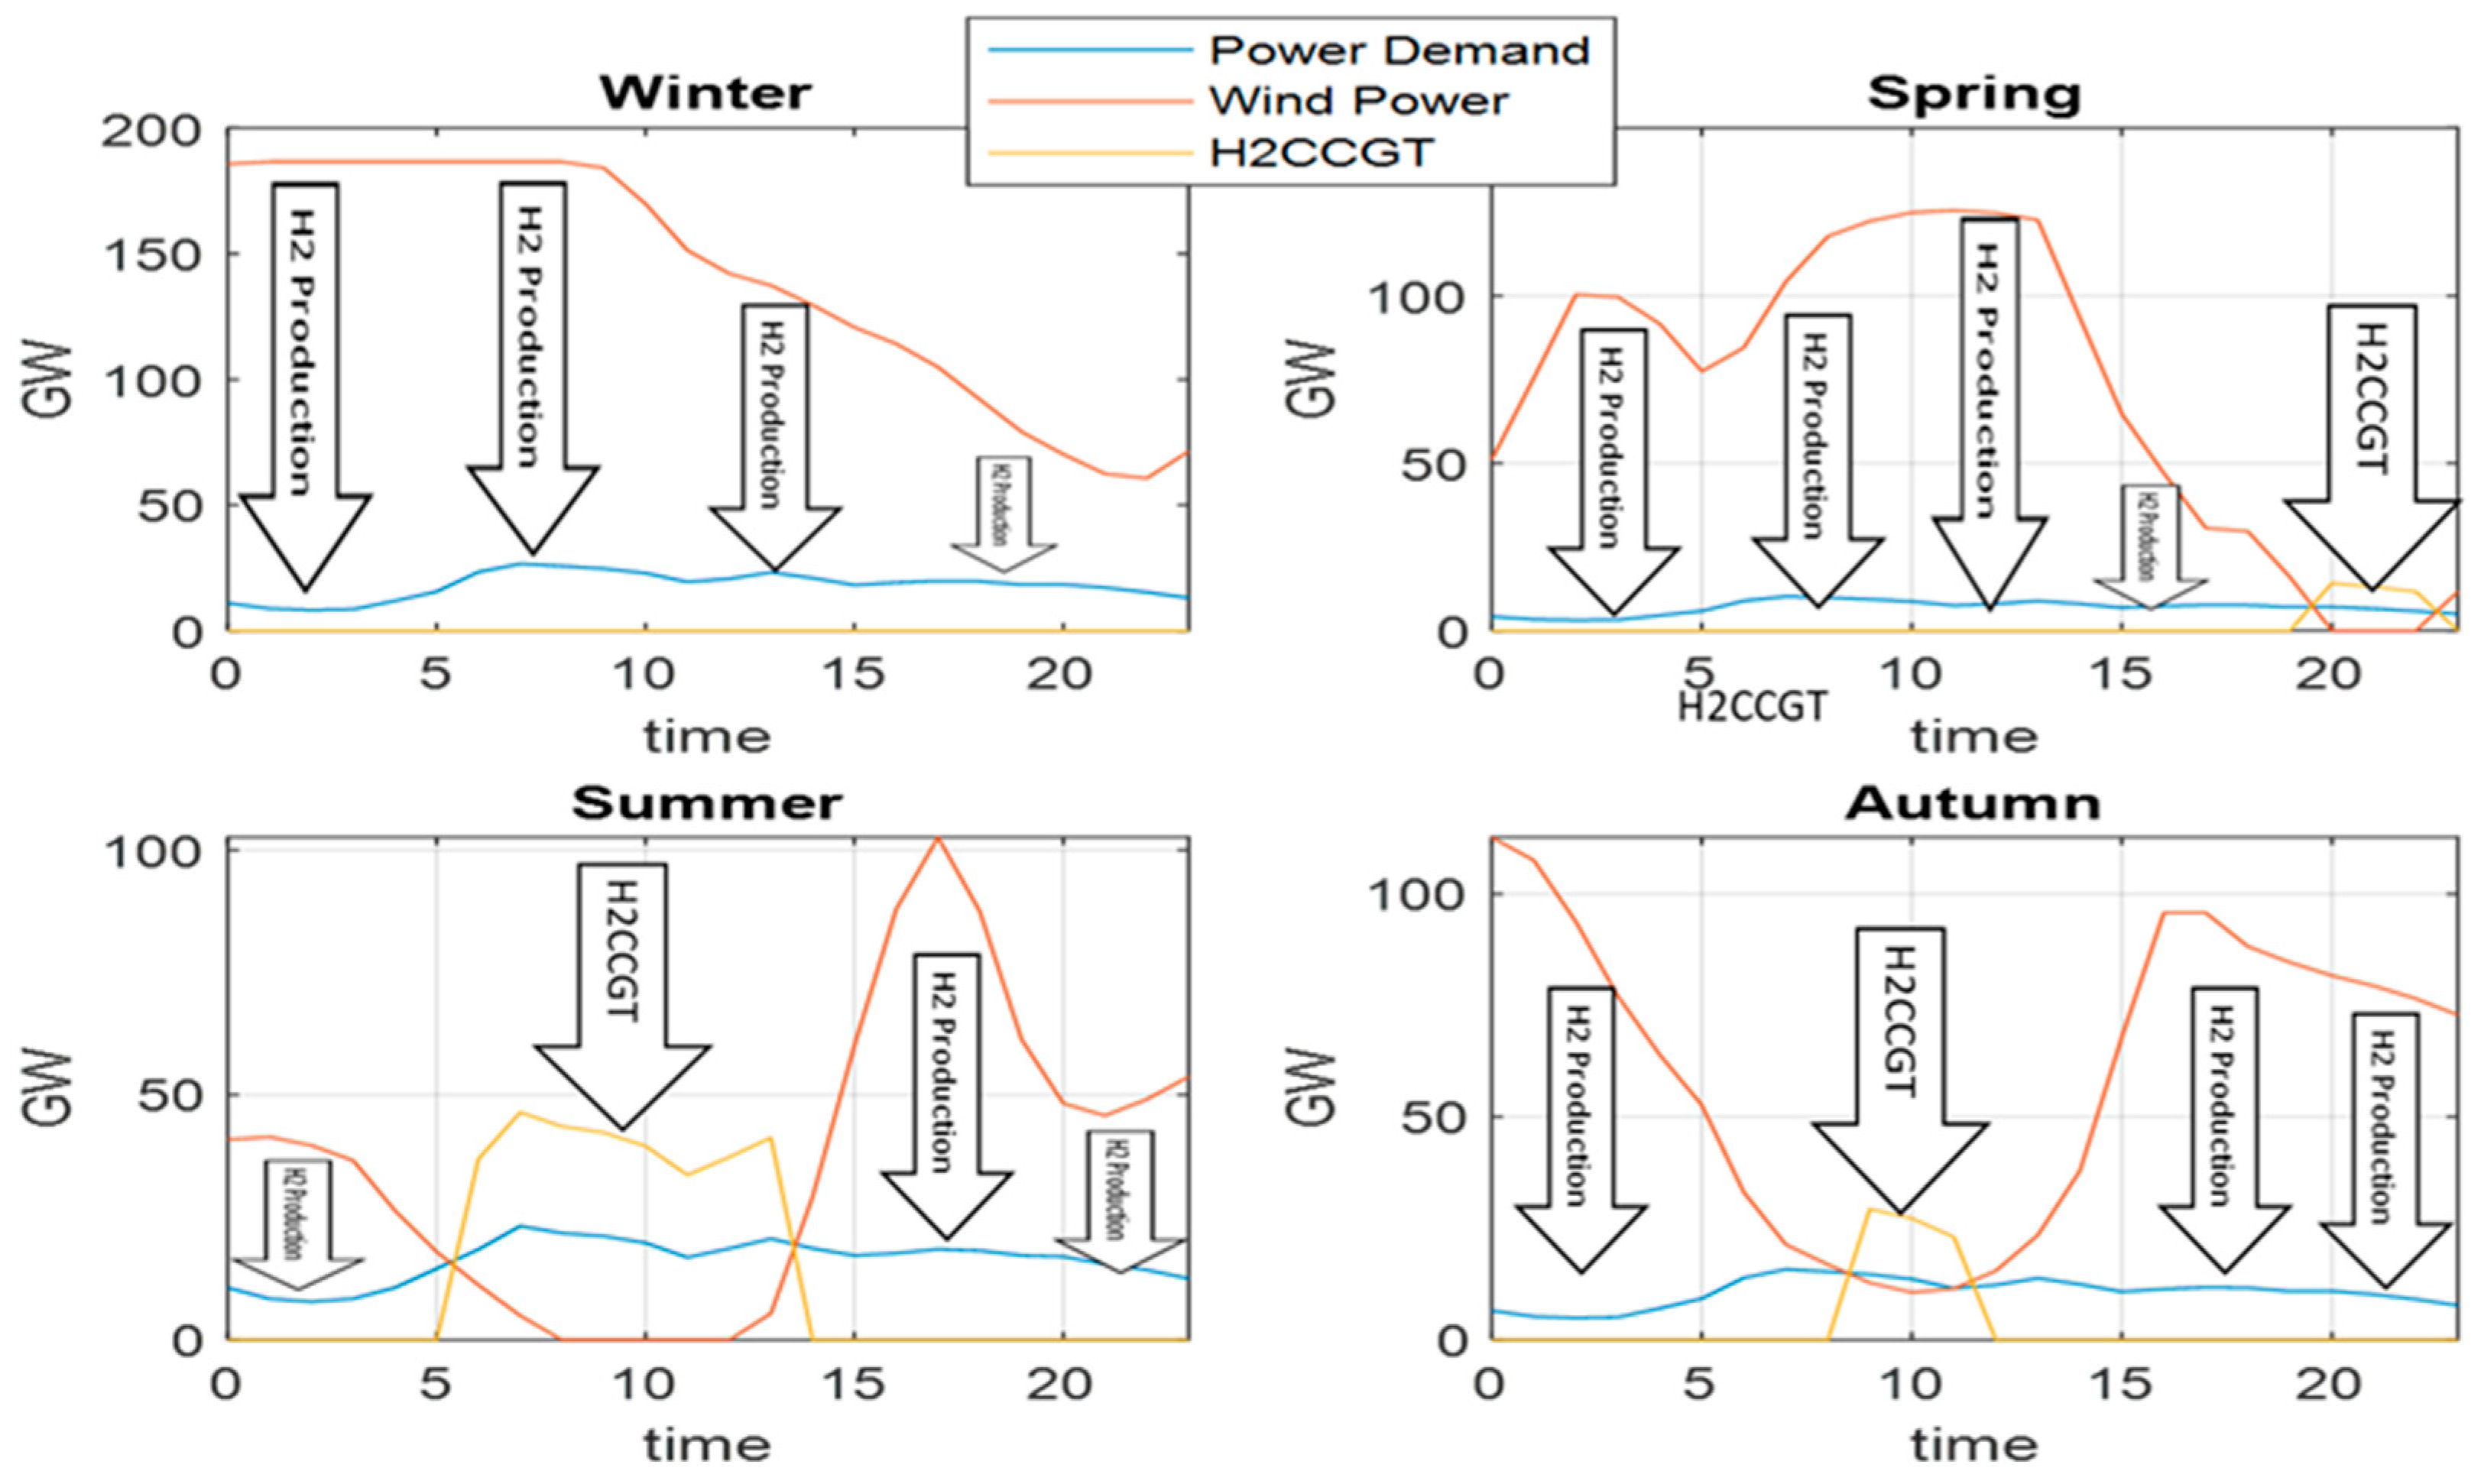

Table 1.
Decarbonised Libyan Energy Consumption for 2050 based on current energy needs.
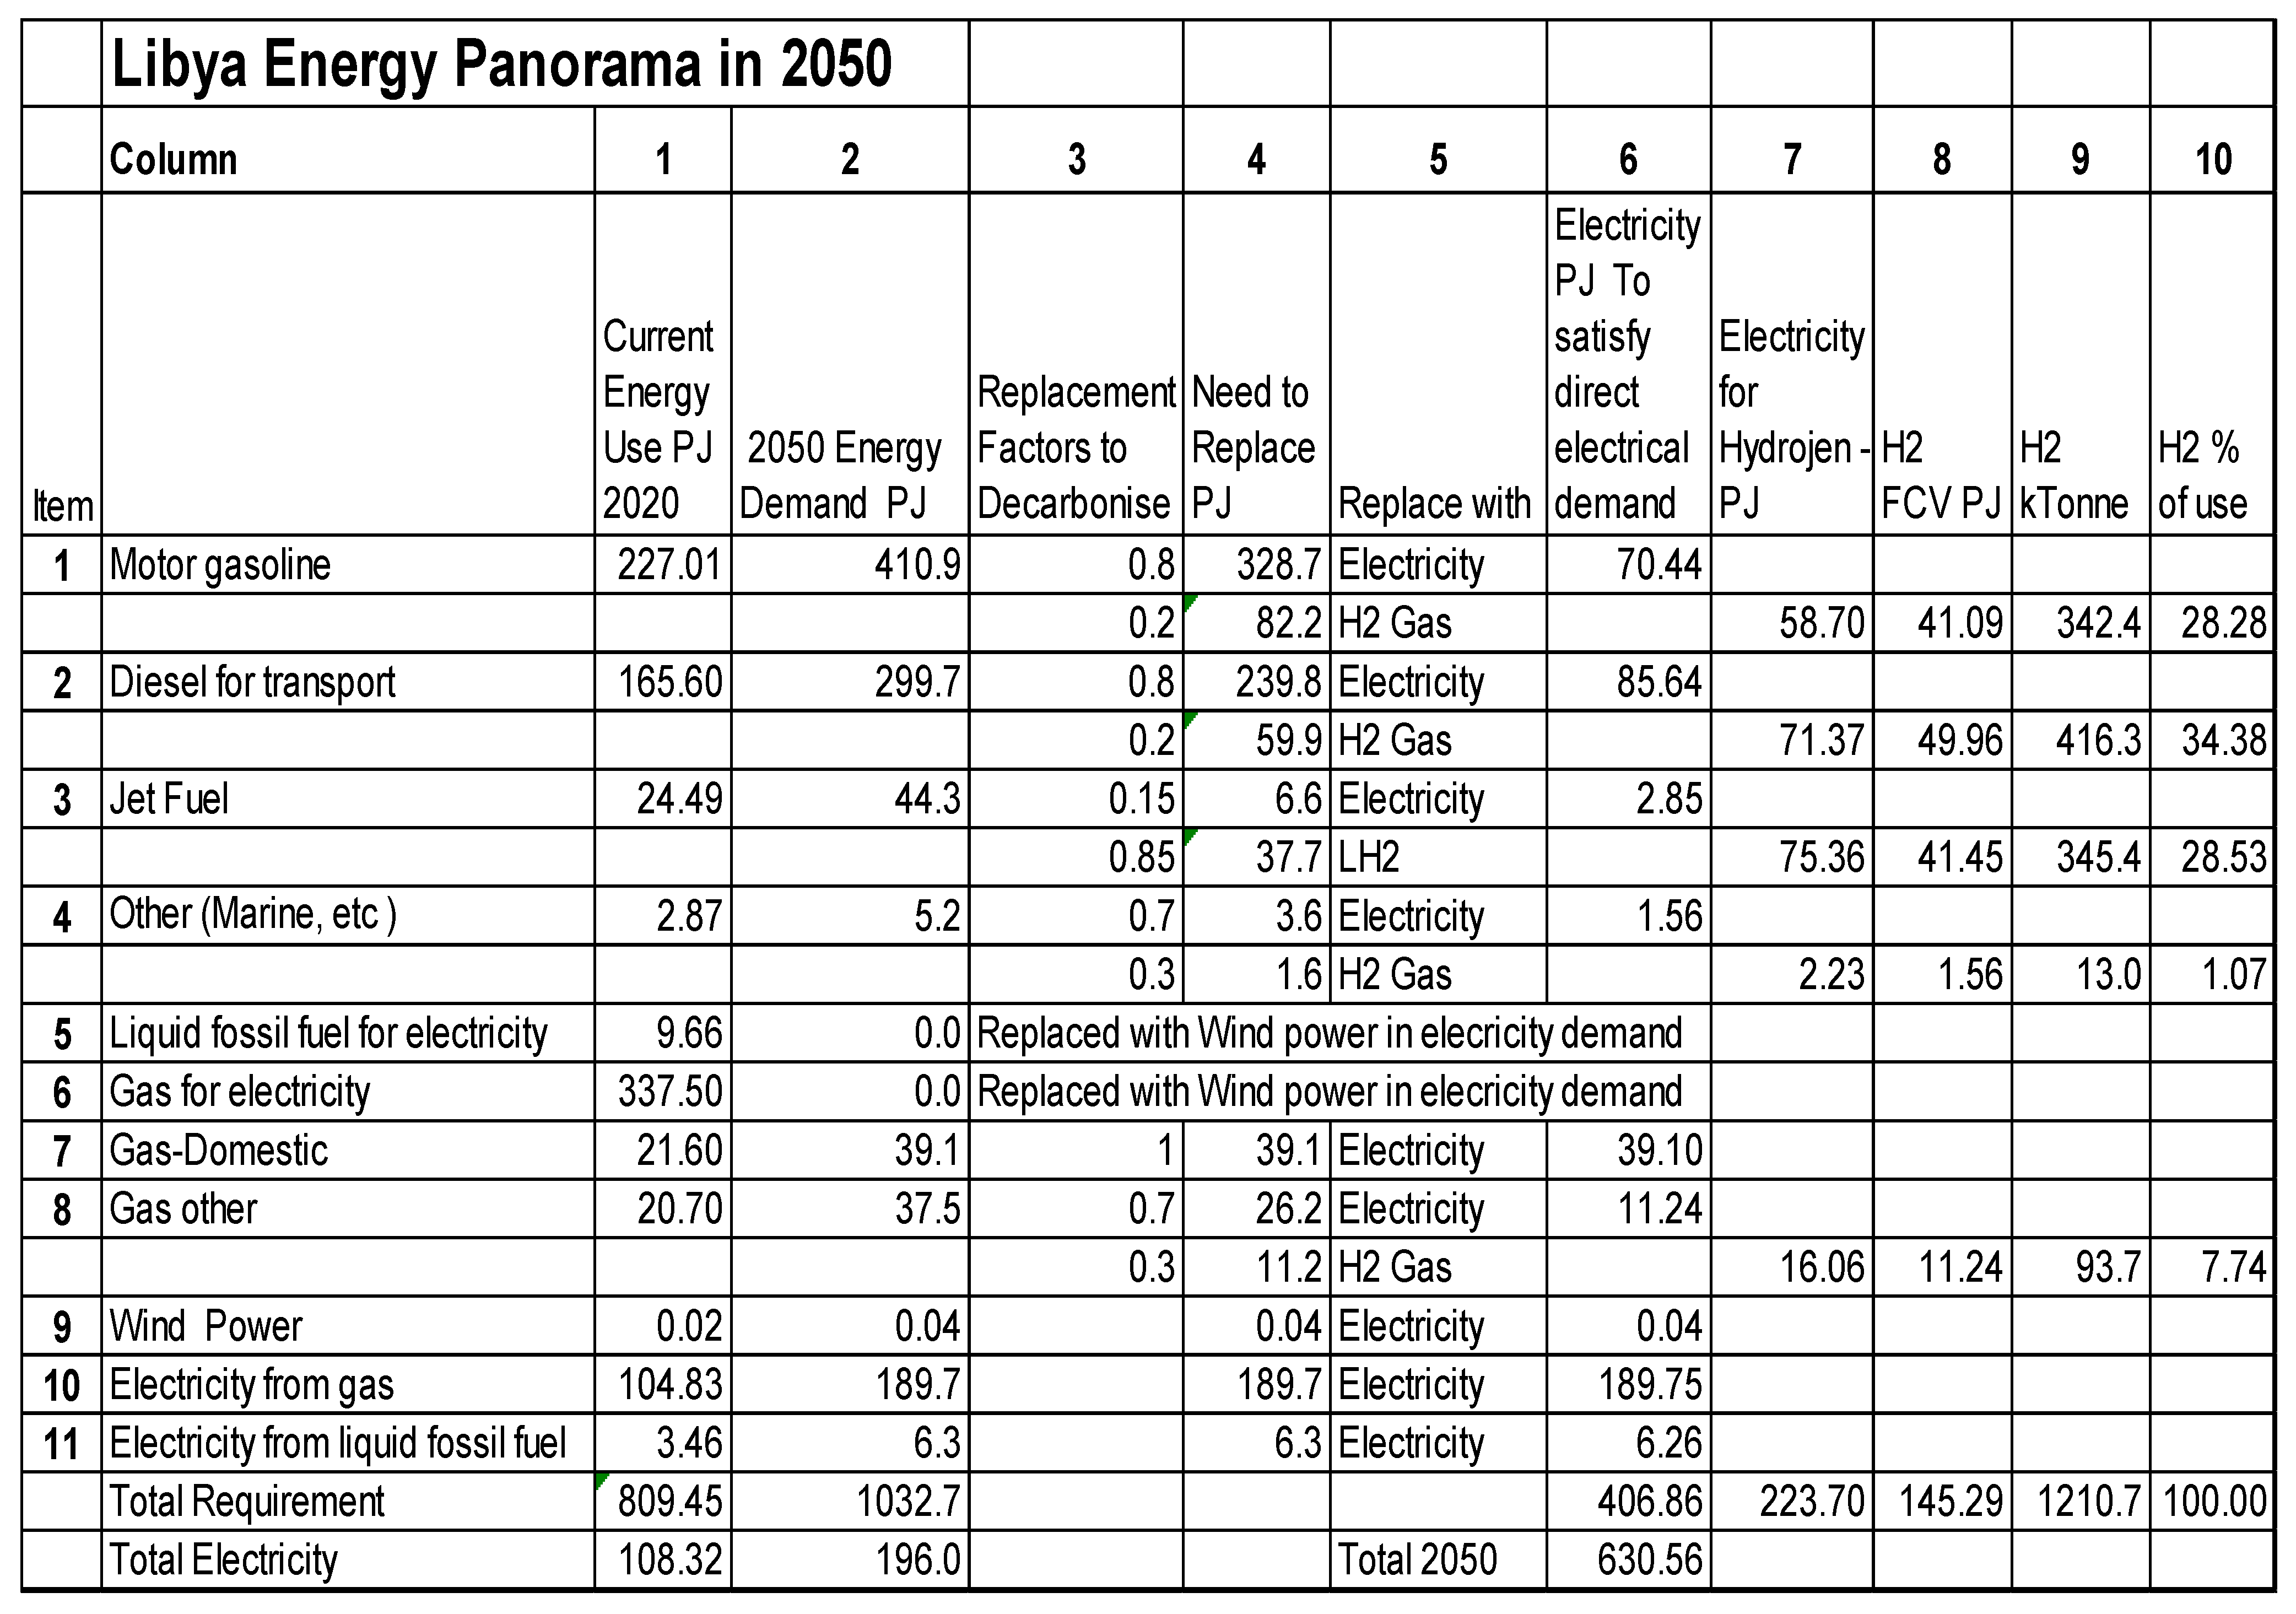
Table 2.
Analysis for the summer season.
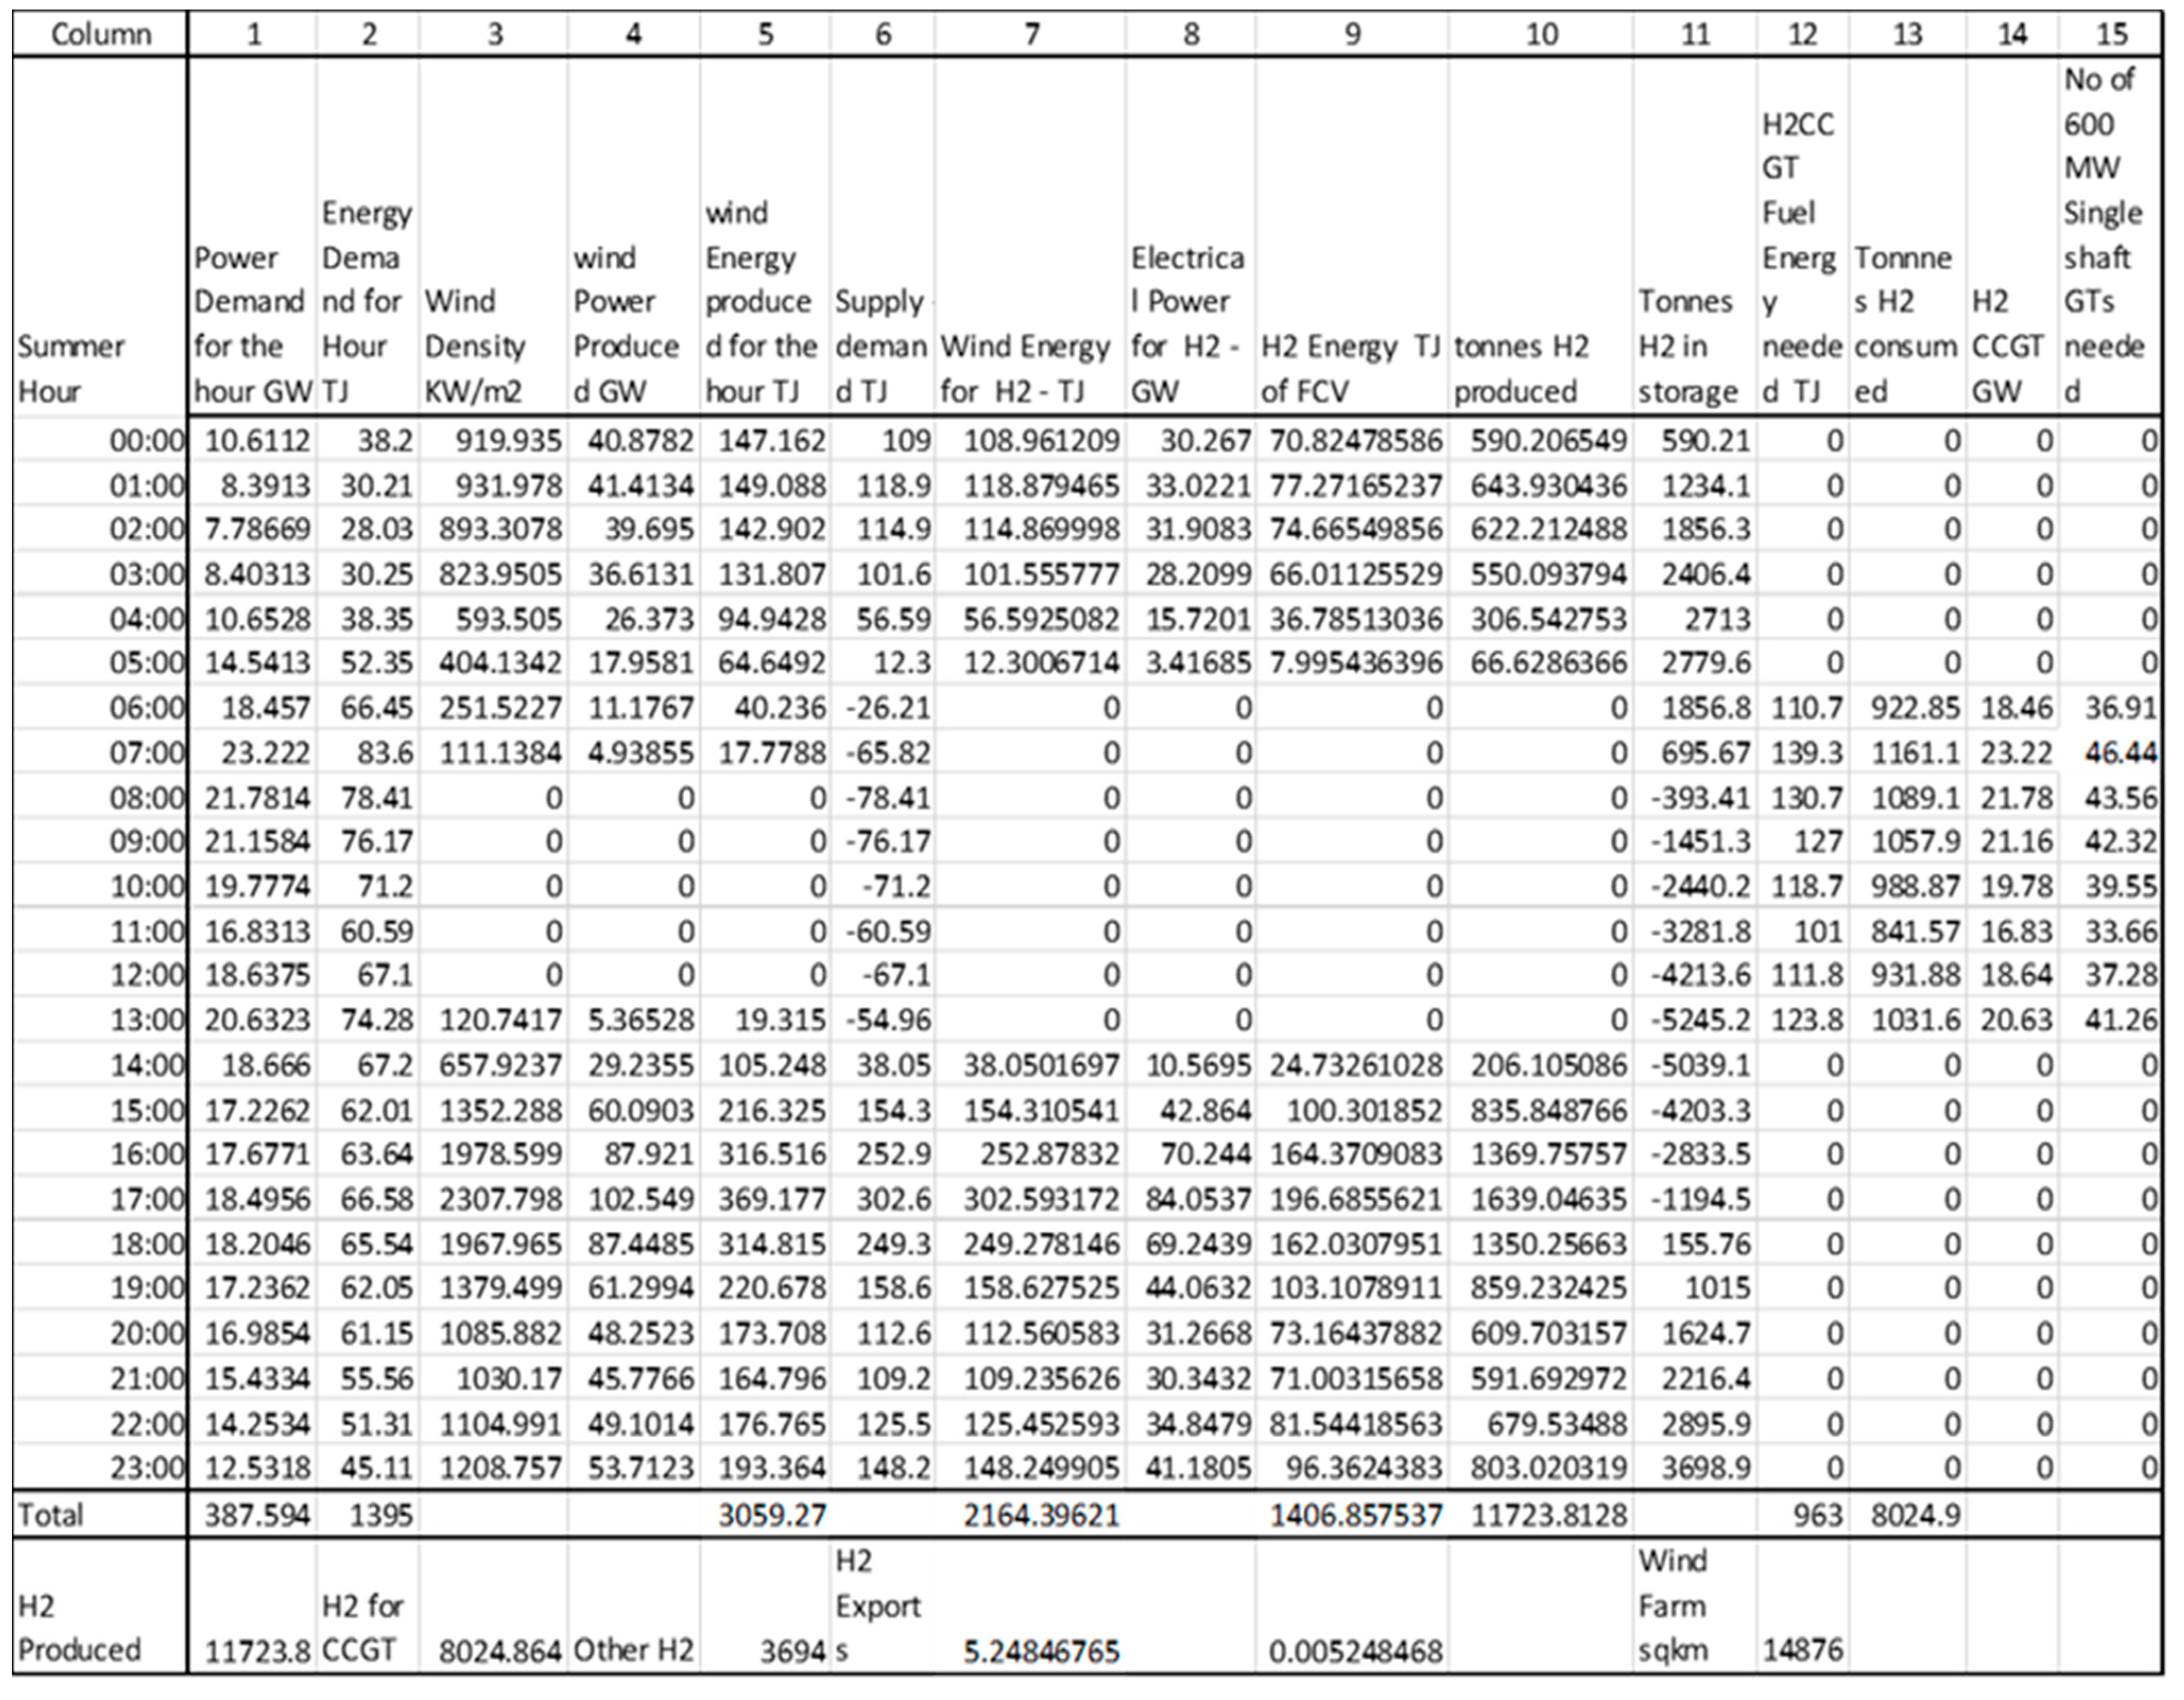
Table 3.
Analysis for the spring season.
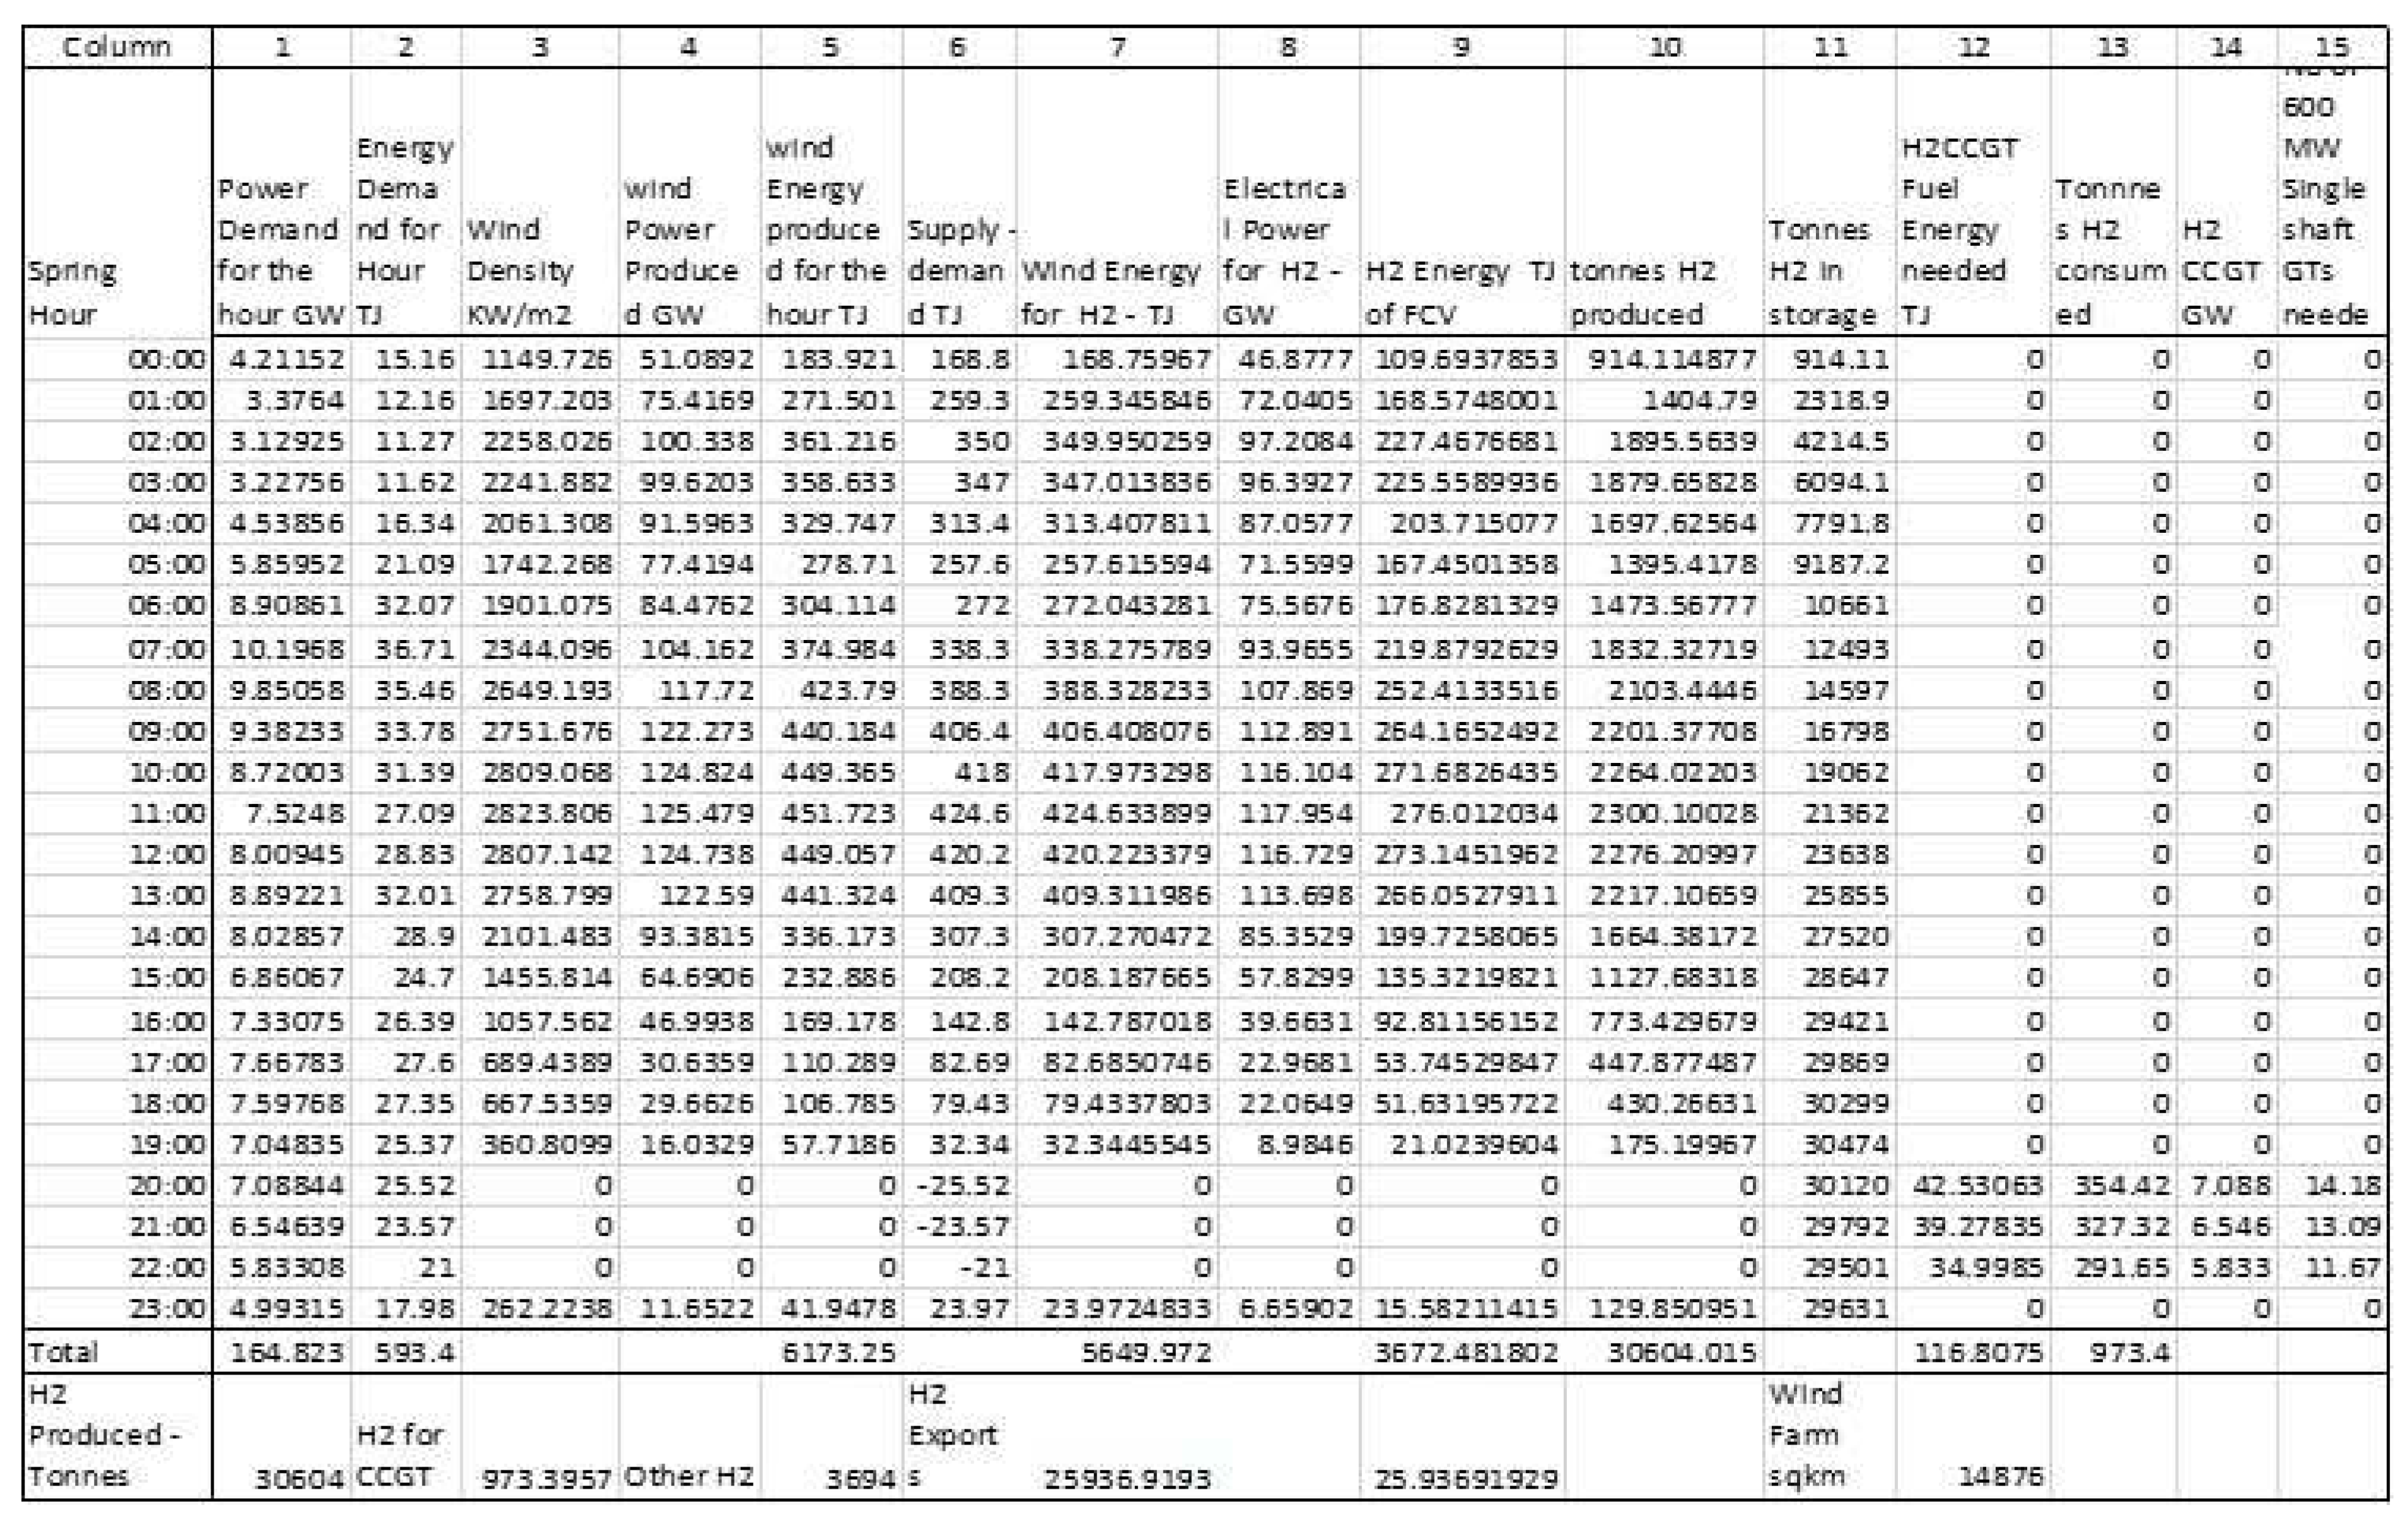
Table 4.
Analysis for the winter season.
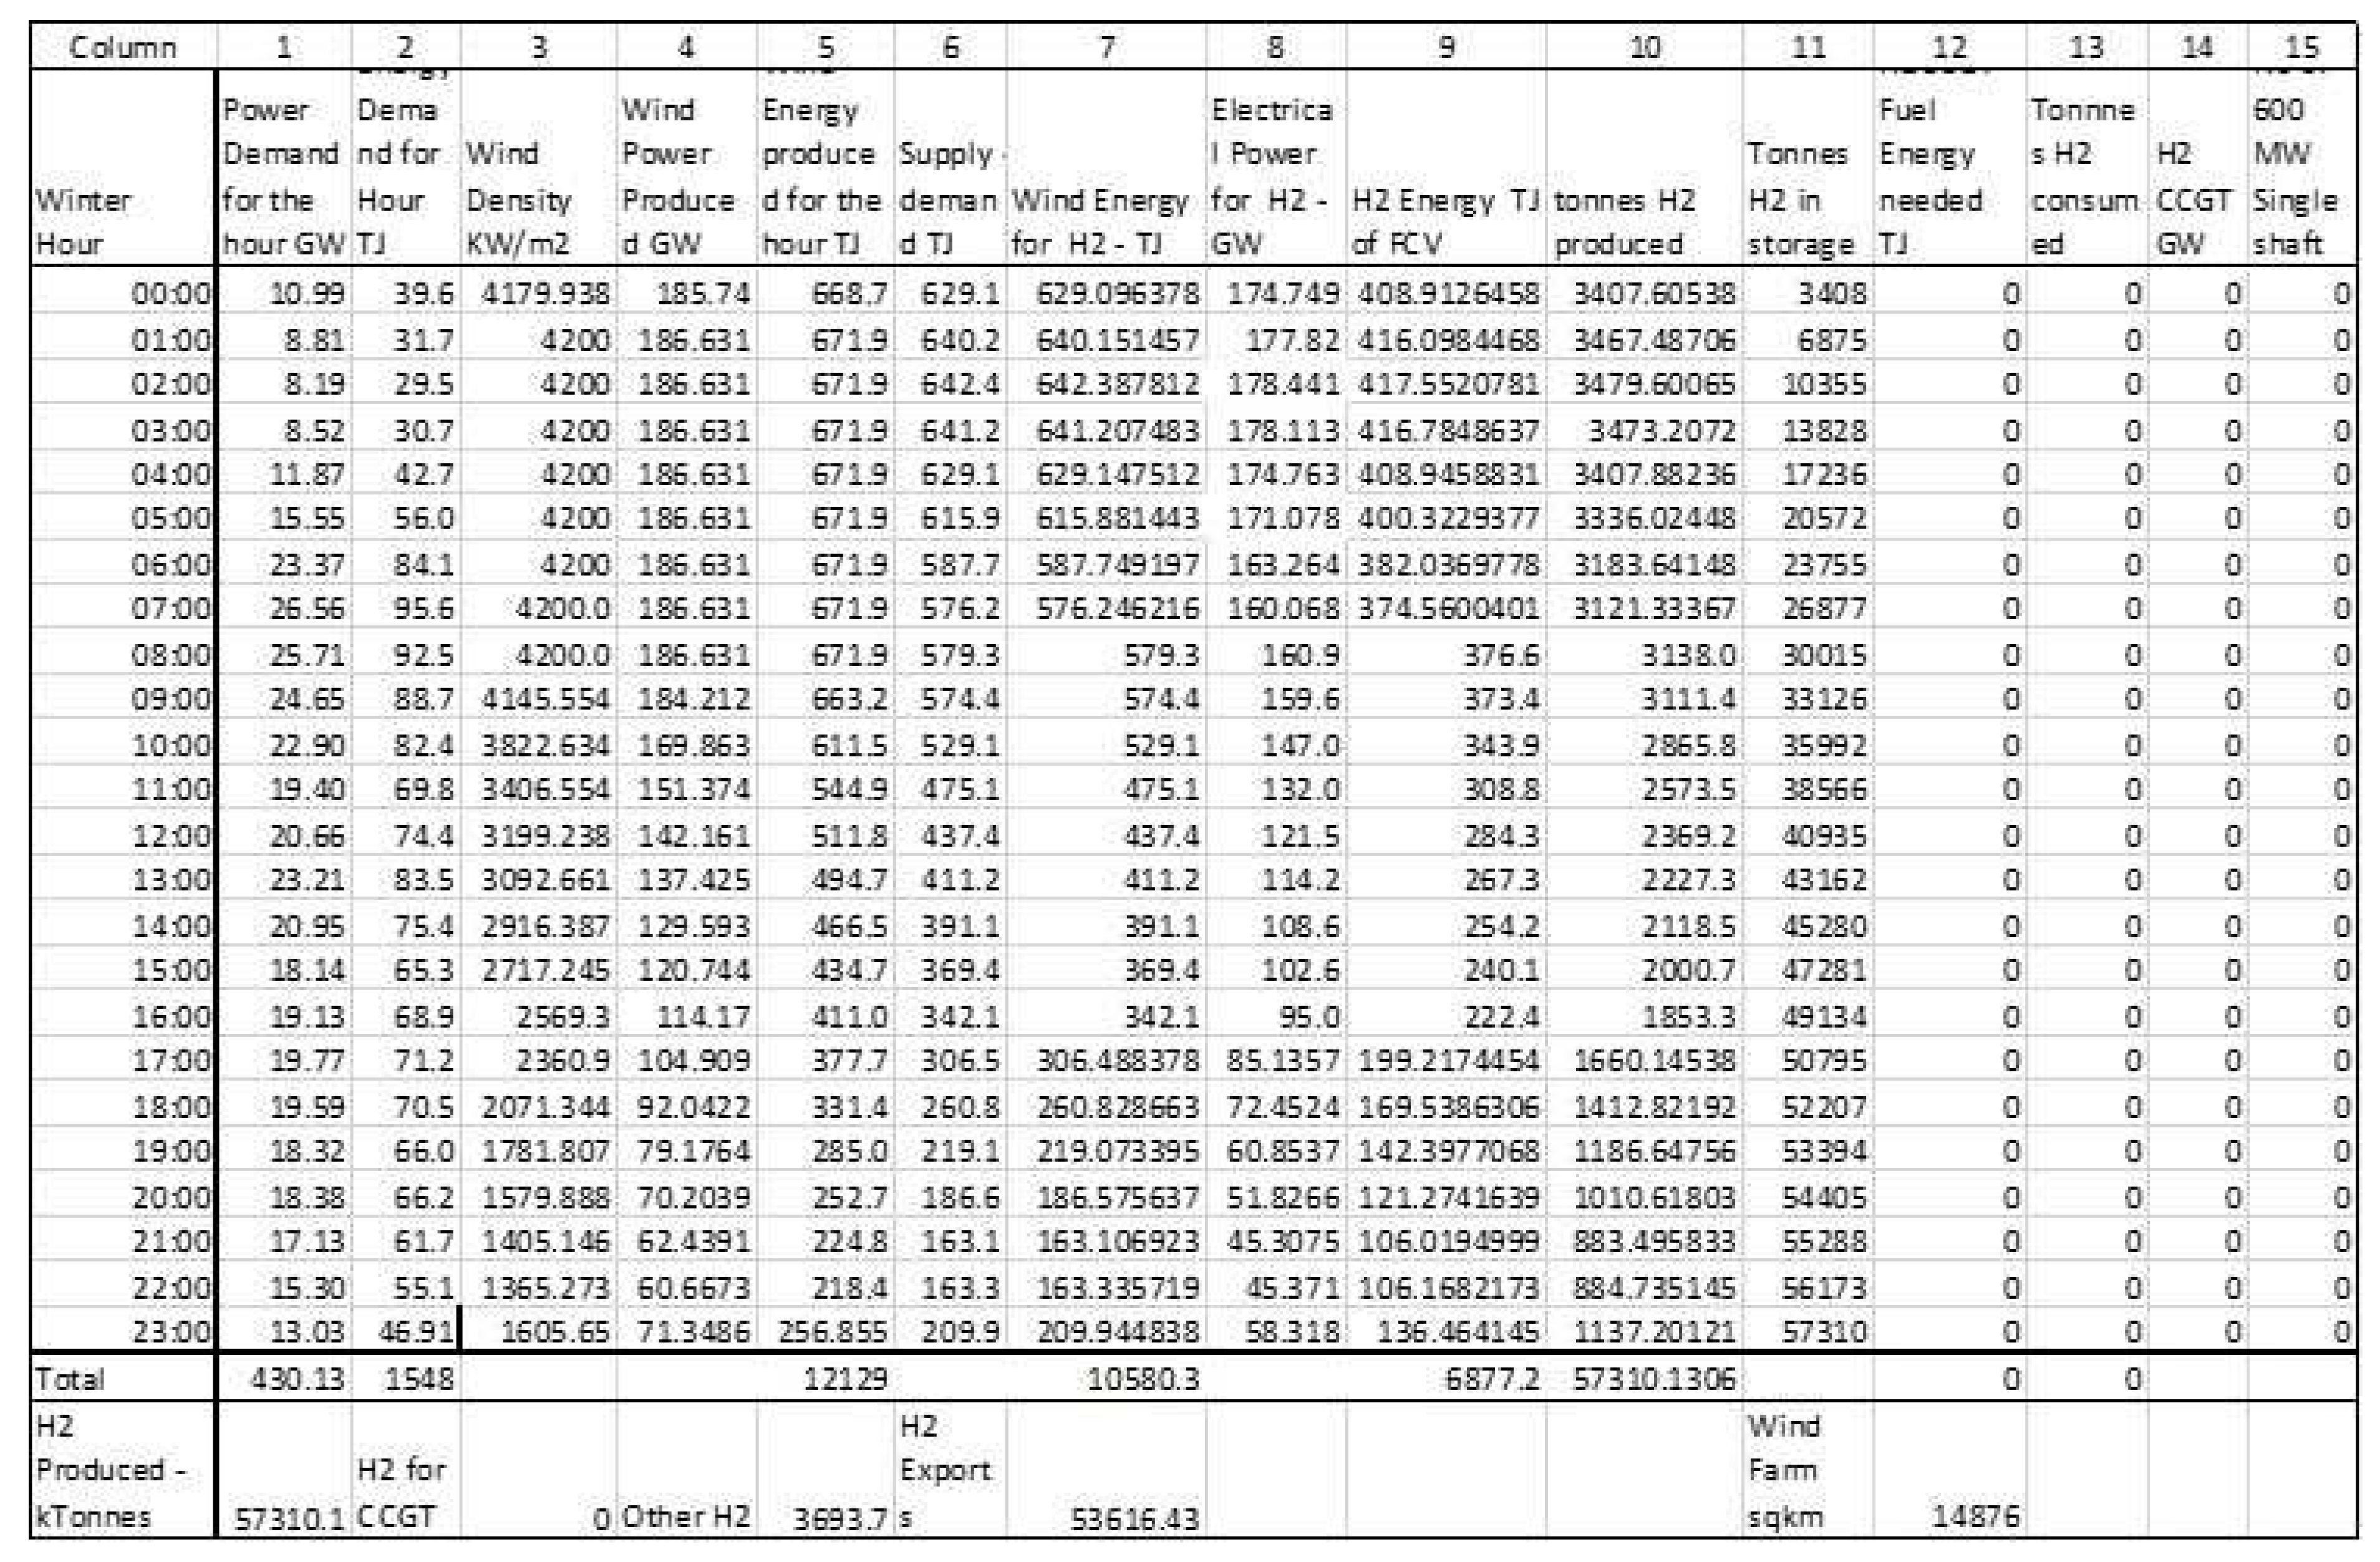
Table 5.
Analysis for the autumn season.
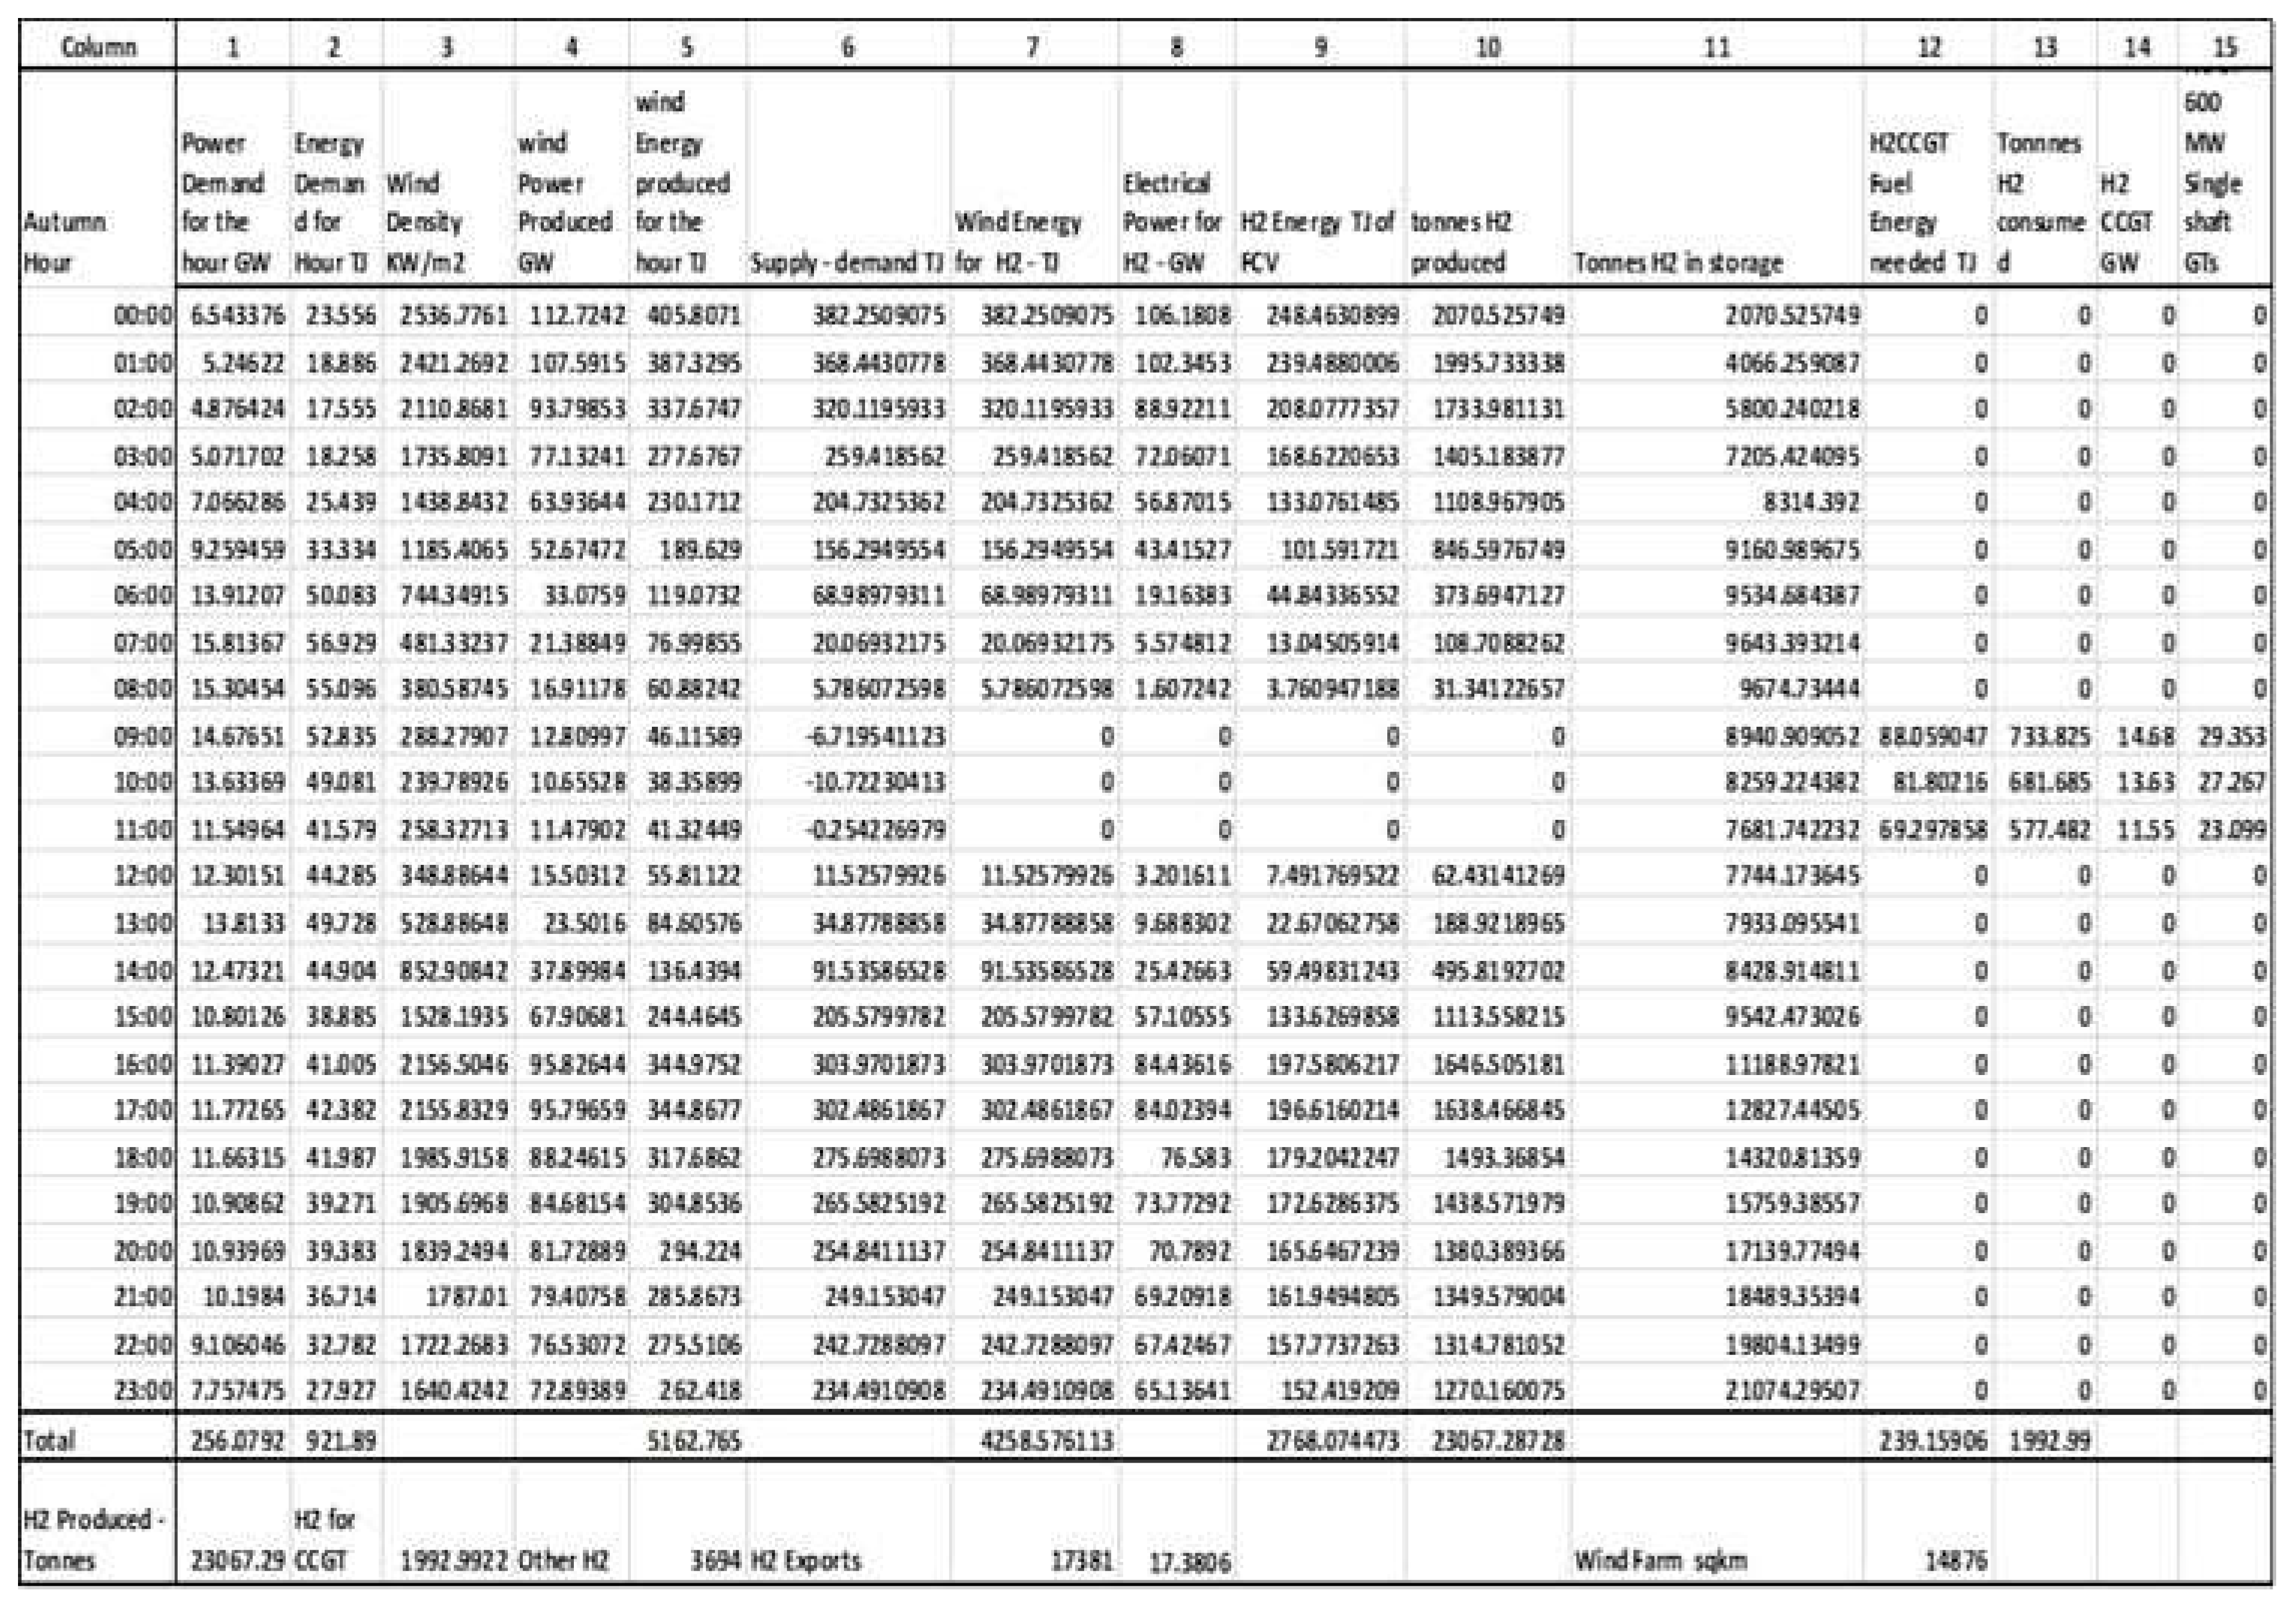
Table 6.
National requirements – two scenarios: meeting summer demands and using wind farms to
their full capacity and exporting yearly 2100 PJ of hydrogen using Wind farms to their full capacity.
Table 6.
National requirements – two scenarios: meeting summer demands and using wind farms to
their full capacity and exporting yearly 2100 PJ of hydrogen using Wind farms to their full capacity.
Disclaimer/Publisher’s Note: The statements, opinions and data contained in all publications are solely those of the individual author(s) and contributor(s) and not of MDPI and/or the editor(s). MDPI and/or the editor(s) disclaim responsibility for any injury to people or property resulting from any ideas, methods, instructions or products referred to in the content. |
© 2023 by the authors. Licensee MDPI, Basel, Switzerland. This article is an open access article distributed under the terms and conditions of the Creative Commons Attribution (CC BY) license (http://creativecommons.org/licenses/by/4.0/).
Copyright: This open access article is published under a Creative Commons CC BY 4.0 license, which permit the free download, distribution, and reuse, provided that the author and preprint are cited in any reuse.


