
Submitted:
13 September 2023
Posted:
14 September 2023
You are already at the latest version
Abstract
(1) Background: Little research is done on the link of diabetic kidney disease (DKD) progression and diabetic gastroenteropathy in type 1 diabetes (T1D). (2) Methods. We performed a cross-sectional study with 100 T1D patients, 27 of them had progressive DKD, defined as estimated glomerular filtration rate (eGFR) decline≥3 ml/min/year or increased albuminuria stage over the mean follow-up time of 5.89±1.73 years. Newly developed score with 17 questions on gastrointestinal (GI) symptoms was used. Faecal calprotectin was measured by ELISA. Lower GI endoscopies were performed in 21 patients. (3) Results: Gastrointestinal symptom score demonstrated high reliability (Cronbach's α=0.78). Patients with progressive DKD had higher GI symptom scores compared to those with stable DKD (p=0.019). The former group demonstrated more frequent bowel movement disorders (p=0.04). The scores correlated negatively with eGFR (r = -0.335; p = 0.001), positively with albuminuria (r=0.245; p=0.015), Hba1c (r=0.305, p=0.002), diabetes duration (r=0.251, p=0.012). Faecal calprotectin levels did not differ between DKD groups significantly. The most commonly reported histopathological findings of enteric mucosa were infiltration with eosinophils, lymphocytes, plasmacytes, presence of lymphoid follicles and lymphoid aggregates. Conclusion: progression of DKD positively correlated with gastrointestinal symptoms, but more research is needed to clarify the causal relationships of the gut-kidney axis in T1D.
Keywords:
Type 1 diabetes
; gastrointestinal symptoms
; calprotectin
; gastrointestinal endoscopy
1. Introduction
The prevalence of type 1 diabetes (T1D) is constantly rising throughout the world. T1D is associated with increased morbidity and mortality, mainly due to its vascular complications, including diabetic kidney disease (DKD), which is the main reason for end-stage renal disease (ESRD) in the developed world [1]. Despite the progress in the understanding of pathophysiology of DKD [2]., and constantly improving diabetes care allowing to control for the main clinical risk factors of the disease, it is still largely unclear which patients are at increased risk of rapidly progressing DKD (estimated glomerular filtration (eGFR) loss of ≥3 ml min-1[1.73 m]-2 year- [1].
Diabetic gastroenteropathy is a condition characterized by various oesophageal, gastric, intestinal and anorectal symptoms caused by diabetes [3,4]. Gastrointestinal symptoms in T1D are twice as common as in the general population and were associated with worse glycaemic control and lower quality of life in studies [5,6]. A hypothesis was proposed that diabetic gastroenteropathy might predispose affected individuals to augmented intestinal inflammation and permeability, and higher levels of systemic inflammation [7]. Low grade systemic inflammation in turn is associated with progression of complications of diabetes, including DKD [8,9]. To support the concept of this so-called gut-kidney axis, it was described that patients with T1D and macroalbuminuria have higher level of faecal inflammatory marker calprotectin compared to normoalbuminuric patients [10,11]. Unfortunately, the latter studies did not report symptoms of gastroenteropathy. Existing data on possible associations between DKD and gastrointestinal symptoms in T1D are currently limited to ESRD patients [12]. In the latter case, severe electrolyte imbalance, uraemia, oedema of the mucosa, medications and generally very poor health might potentiate the symptoms. That’s why data obtained in ESRD can hardly be extrapolated to patients with initial DKD stages.
Gastrointestinal symptoms are insufficiently recognized and investigated both in clinical practice and research. Specifically, endoscopic examination of the gastrointestinal tract might be avoided by T1D patients despite indications due to increased risk of hypoglycaemia and other complications [13]. Indirectly supporting the latter statement, we found only two papers reporting data on histological and immunohistochemical examination of intestinal mucosal biopsies of patients with T1D [12,14].
To summarize, diabetic gastroenteropathy as assessed by gastrointestinal symptom scores, instrumental examinations and using biomarkers (such as calprotectin) remains to be little studied as a factor predisposing to or potentiating progression of DKD. However, such data are of extreme importance for clinical practice, as they could promote development of novel treatment and prevention options for DKD [15].
To fill this gap, the aim of this work was to analyse the prevalence of gastrointestinal symptoms, history of previous gastrointestinal conditions, data of endoscopic gastrointestinal investigations and levels of faecal calprotectin in patients with T1D and different velocity of DKD progression in a cross-sectional study.
2. Materials and Methods
2.1. Patients and ethics
This study is a part of the longitudinal LatDiane study, initiated in 2013 (and participating in the international InterDiane consortium). LatDiane recruits adult patients with T1D diagnosed before age of 40 years, with insulin treatment initiated within one year of diagnosis and C-peptide levels below 0.3 nmol/L. Patients with history of chronic kidney disease apart from DKD are excluded from LatDiane. Follow-up visits and re-assessment of the status of complications of diabetes take place every three years. Currently, more than 400 patients have been recruited with approximately 150 patients who have attended one or more follow-up visits. Study protocol includes recording of diabetes and other disease history, basic clinical and anthropometric investigation, collection of blood samples for preparation of serum and plasma and DNA extraction, collection of urine, as well as assessment of dietary and physical activity habits, socioeconomic factors and psychologic condition with the help of questionnaires[16,17,18,19,20,21,22,23,24]. The protocol of the general LatDiane and sub-study devoted to gut health described here were approved by the Latvian Central Ethics Committee and received permissions No 01-29.1/3 (dated 10.07.2013), Nr. A-17/19-10-17 (dated 17.10.2019) and Nr. 01-29.1/2226 (dated 30.04.2020).
Recruitment of the study participants, biobanking, and sample storage were performed in agreement with the procedures of the Genome Database of the Latvian population [25] and are described in detail in [22]. The study is in line with the 1964 Declaration of Helsinki and its later amendments. Written informed consent was obtained from all study participants prior to inclusion in the study.
Recruitment for this study took place between 15th of January 2021 and 31st of August 2022 in Latvia, Riga, Pilsoņu 13 str., building 10 (in the rooms of the Laboratory for Personalized medicine of the University of Latvia). Information about the study was disseminated via webpage and social media of the University of Latvia.
Inclusion criteria for this study were: T1D duration of at least 8 years and available data on progression of DKD (at least three yearly serum creatinine measurements and albuminuria measurements available between the baseline visit of the LatDiane study in 2013-2019 and this study) (Figure 1).
As for exclusion criteria, they were: pregnancy, subjects with a history of inflammatory bowel disease (Crohn disease or Ulcerative colitis) and coeliac disease, acute intestinal infection within 2 months of the planned faecal collection, asymptomatic coeliac disease (detected via screening of serum transglutaminase IgA antibodies), clinical signs of acute inflammation, fever.
On the study day, patients were investigated for collection of anthropometric measures and questionnaires were filled in, blood samples were collected, and subjects received instructions and vials for collection of the faecal sample.
2.2. Clinical investigation and monitoring of diabetic complications and co-morbidities.
Clinical investigation included assessment of weight and height to calculate the body mass index (BMI, weight (kg)/height (m)2.). We also measured blood pressure. Patients with systolic blood pressure ≥140mmHg (18.7 kPa) or diastolic blood pressure ≥ 90mmHg (12.0 kPa), or a history of antihypertensive drug usage were defined to have arterial hypertension.
Smoking was self-reported in the questionnaire, the “smokers” group referred to patients currently smoking at least one cigarette per day.
Assessment of cardiovascular disease (CVD) and complications of diabetes such as retinopathy, neuropathy and DKD was based on medical files. We defined CVD as a history of acute myocardial infarction, coronary bypass/percutaneous transluminal coronary angioplasty stroke, amputation, peripheral vascular disease.
Albumin-to-creatinine ratio in morning spot urine samples was used for the definition of albuminuria at each study visit during the follow-up. The estimated glomerular filtration rate (eGFR) was calculated according to Chronic Kidney Disease Epidemiology Collaboration (CKD-EPI).
ESRD was defined as eGFR<15 ml/min/1.73m2, dialysis or kidney transplantation.
Progressive DKD was defined as eGFR decline exceeding 3 ml/min/1.73 m 2/year [2] and/or increase in albuminuria stage over the follow-up period. At least three yearly serum creatinine measurements were used for calculation of least three eGFR values during the follow-up period. These data were used for eGFR slope plotting. The number of serum creatinine measurements ranged from three to fifteen during the follow-up for each patient.
2.3. Blood samples and faecal collection
The blood samples were collected via venous puncture. Blood samples and morning spot urine samples were sent for assessment of clinical markers (blood count, clinical chemistry, albuminuria) to a certified clinical lab.
Except for several patients who could collect the stool sample during recruitment visit, stool samples were collected within two weeks after blood collection and assessment of gastrointestinal symptoms. Participants collected their faecal samples at home, using sterile collection tubes without buffer (collection date and time were marked). Within 24 hours samples were delivered to the laboratory for calprotectin measurement in unfrozen samples.
Faecal calprotectin was measured by Alegria® Calprotectin Elisa kit (Organotech Diagnostika GmbH, REF ORG280) in a certified clinical lab.
2.4. Monitoring of gastrointestinal disease and symptoms.
The history of gastrointestinal disease was self-reported via assisted study questionnaire in the majority of cases and this information was supported by medical files. For reporting in this paper, we defined upper gastrointestinal disease as gastritis/duodenitis, peptic ulcer, gastroesophageal reflux disease, gastroparesis, diaphragmal hernia, Haelicobacter pylori infection; lower gastrointestinal disease was defined as hemorrhoids, appendicitis, coeliac disease, irritable bowel syndrome, lactose intolerance; liver and pancreas disease were defined as history of fatty liver, pancreatitis, viral hepatitis, gallstones, diverticulitis, irritable bowel syndrome.
A newly developed scale questionnaire for assessment of gastrointestinal symptoms was filled in during the study visit. It was elaborated on the basis of the Diabetes and bowel symptom questionnaire [26], which previously demonstrated good test-re-test reliability and concurrent validity (median kappa: 0.63 and 0.47 respectively) for the gastrointestinal items. Our newly developed scale questionnaire included 17 questions about pain, discomfort, impaired bowel movement such as diarrhoea and constipation (Supplement 1)
2.5. Endoscopy in patients with indications and ‘’red flag’’ symptoms.
Patients who had increased calprotectin levels and persistent symptoms of gastrointestinal disorders in the last 2 months, were referred to gastroenterologist for evaluation of indications for endoscopic examination (colonoscopy and/or endoscopy according to indications). As indications for endoscopy, the following criteria were used: unexplained weight loss, clinical suspicion of inflammatory bowel disease, unclear abdominal pain, unclear anaemia (especially iron deficiency anaemia), unclear diarrhoea, constipation or changing bowel movements, bowel movements with mucus admixture, family history inflammatory bowel disease or colorectal cancer, history of polyps, elevated faecal calprotectin > 50 µg/g or as a screening colonoscopy for subjects over the age of 50 [27-29]. From 100 T1D patients 47 were selected to undergo endoscopic examination, and 21 of them accepted the invitation and went through the procedure. Endoscopic biopsy specimens were examined by a histopathologist. H. pylori was identified by rapid urease test (RUT) and histological staining (Giemsa).
Patients who consented to lower endoscopy received recommendations from endocrinologist for preparation for the procedure based on international recommendations [13,30-32]. It included advice for food choices in the week preceding colonoscopy (“white foods”, avoidance of fibre-containing and red foods etc), frequent blood glucose monitoring during reduced nutritional intake period and fasting to avoid hypoglycaemia, approach to correction of hyper- and hypoglycaemia during the preparation (Supplement 2). Patients were prescribed polyethylene glycol (PEG) based osmotic laxative (PEG-3350, Sodium Sulfate, Sodium Chloride, Potassium Chloride, Sodium Ascorbate and Ascorbic Acid for Oral Solution) for bowel cleaning.
2.6. Statistical analysis.
Descriptive statistics were performed for all study variables. For group variables, we presented numbers and percentages from the whole study sample. For the continuous variables, we presented medians and interquartile ranges (IQR).
We performed the univariate analysis to assess the difference in socio-demographic variables between the study groups: we used Chi-square test for the group variables, Mann-Whitney test for continuous variables).
We calculated the mean value from the 17 questions of the gastrointestinal symptom score to assess the mean frequency and intensity of all investigated gastrointestinal symptoms, as well as the mean value of frequency of use of medications. The Cronbach Alpha test was applied to check the reliability of this scale.
In addition, we evaluated the answers to questions about upper and lower gastrointestinal disease, history of liver and pancreas diseases, history of gastrointestinal malignancy, history of abdominal surgery.
We investigated the difference in between those with stable and progressive DKD in gastrointestinal symptoms (Cramer’s V test), symptom intensity (Mann-Whitney test), in use of medications (Mann-Whitney test), and in presence and history of diseases (Chi-square test).
Spearman correlation was performed to identify the relationship between markers of kidney disease and demographic and blood / urine parameters. The p values < 0.05 were considered statistically significant.
We built multiple logistic regression models to assess the association between the progression of DKD and gastrointestinal symptoms. We adjusted the model for the variables that displayed statistical significance in the univariate analysis or had clinical relevance. The full adjustment set included sex, diabetes duration, HbA1c and BMI.
3. Results
3.1. Description of the study groups and inflammatory markers
The study sample consists of 100 patients with T1D, mostly women 62 (62%) with a mean age of 42.59±13.18 and a mean BMI 25.98±4.69 1 kg/m2. Mean follow-up time in the cohort is 5.89±1.73 years. Most of the participants were non-smokers 63 (63%) and with hypertension 53 (53%). The mean duration of diabetes was 24.38±11.92 years, mean HbA1c was 8.28±1.74 %. 52 (52%) of subjects had retinopathy, 27 (27%) - autoimmune thyroid disease and 16 (16%) - CVD. Study groups (with stable DKD disease and with progressive DKD) differed by smoking (more smokers among those with progressive DKD), hypertension (more patients with hypertension among those with progressive DKD), length of diabetes (longer history of diabetes for patients with progressive DKD), retinopathy, HbA1c, CVD, eGFR, albuminuria, serum bilirubin, blood haemoglobin concentration and erythrocyte counts. The level of calprotectin in faeces and serum CRP did not differ between the groups of patients with progressive DKD and patients with stable DKD statistically significantly (Table 1). Moreover, from 100 patients in the study, only 10 had faecal calprotectin ≥50 µg/g.
Continuous variables are presented as median (IQR). DKD – diabetic kidney disease. eGFR – estimated glomerular filtration rate. Diabetic retinopathy – history of any stage retinopathy based on medical recordings. Arterial hypertension - systolic blood pressure ≥140mmHg (18.7 kPa) or diastolic blood pressure ≥ 90mmHg (12.0 kPa), or a history of antihypertensive drug treatment. Autoimmune thyroid disease – Hashimoto’s thyroiditis or Graves’ disease. Other autoimmune disease – history of autoimmune rheumatologic disease such as rheumatoid arthritis, sacroiliitis, psoriasis, asthma etc. CVD – cardiovascular disease, defined as a history of acute myocardial infarction, coronary bypass/percutaneous transluminal coronary angioplasty stroke, amputation, peripheral vascular disease.
3.2. Gastrointestinal diseases and symptoms
Gastrointestinal symptom score demonstrated high reliability (Cronbach's α=0.78). Patients with progressive DKD had higher gastro-intestinal symptoms scores (supplement 1), compared to those with stable DKD (p=0.019). In addition, 14 (52%) of patients with progressive DKD had bowel movement disorders versus 16 (22%) in patients with stable DKD (p<0.01) (Table 2.)
There was no statistically significant difference between the patients with progressive DKD and patients with stable DKD on previous upper and lower gastrointestinal disease (p = 0.50 and p = 0.35, respectively). There was no difference between groups in history of liver and pancreas diseases (p = 0.74) as well as in history in gastrointestinal malignancy (p = 0.10). History of abdominal surgery was more frequent in patients with progressive DKD at the significance level of p = 0.07. There were no statistically significant differences between DKD patients with progressive DKD and patients with stable DKD in their use of medications for gastrointestinal disorders (p = 0.54).
3.3. Correlation between gastrointestinal symptom scores with clinical markers and regression analysis
We investigated correlations between gastrointestinal symptom score and several clinical markers in the study sample. The scores correlated negatively with eGFR (r = -0.335; p = 0.001), weight (r =-0.236, p=0.018), blood erythrocyte counts (r=-0.313, p=0.002) and blood haemoglobin (r=-0.321, p=0.001) and positively with albuminuria (r=0.245; p=0.015), Hba1c (r=0.305, p=0.002), diabetes duration (r=0.251, p=0.012).
Faecal calprotectin did not correlate with gastrointestinal symptom score, eGFR and albuminuria.
In univariate regression analysis, higher scores in gastrointestinal symptoms were associated with higher odds of DKD progression (3.086 (1.209, 7.879), p=0.018). The association remained significant when the model was adjusted for sex and BMI. However, the association was no longer significant when the model was adjusted for sex, BMI, diabetes duration, HbA1c, with diabetes duration remaining as the only significant predictor of DKD (odds ratio 1.058 (1.011, 1.106), p=0.014) in the model and HbA1c demonstrating association at a significance level of 0.075 (odds ratio 1.302 (0.978,1.734). The results of logistic regression analysis are summarized in Table 3.
Results of the logistic regression analysis with the presence of progressive diabetic kidney disease as the response variable. Data are presented as odds ratios with 95% CI and p-values. Model 1 - univariate. Model 2 was adjusted for sex, BMI. Model 3 was adjusted for sex, BMI and diabetes duration. Model 4 was adjusted for sex, BMI, diabetes duration and HbA1c.
3.4. Endoscopy
Prevalence of indications for colonoscopy did not differ between the patients with and without DKD progression.
From 47 patients who were selected to undergo colonoscopy, 13 had progressive DKD and 34 did not (48.1% and 46.5% of the progressive DKD and non-progressive DKD group respectively). Only 21 patient (4 patients with progressive DKD and 17 patients with stable DKD) accepted the invitation and went through the procedure. The reasons for non-acceptance of the invitation included complicated preparation procedure for the colonoscopy with necessity for fasting and intensive glucose control, fear of hypoglycaemia, fear of complications during anaesthesia. Many patients refused to undergo the investigation because of poor health status due to complications of diabetes and co-morbidities.
Among patients who underwent the endoscopic examination, the most frequent indications for endoscopic examination were abdominal pain (n=17; 81%), bowel movement disorders (n=9; 43%) and elevated faecal calprotectin (>50µg/g) (n=5; 24 %).
Of the 10 individuals who underwent upper GI endoscopy, 7 (70%) had abnormal macroscopic findings and were analysed for H. pylori infection by rapid urease tests (RUT). None of the patients had positive RUT, however histopathology identified 2 patients with H.pylori visible on special stain. Most of the gastric lesions were minor endoscopic findings (Table 4). Of the 5 endoscopically reported hyperaemic gastropathy and duodenopathy patients, two had active gastritis and two - chronic atrophic gastritis. Of the three patients with macroscopically normal upper GI endoscopy, one had chronic atrophic gastritis and one had active gastritis with erosive gastropathy.
In total 21 colonoscopy was performed. Five (24%) of the colonoscopies performed showed abnormal macroscopic findings (Table 4). The most commonly reported histopathological findings were infiltration with eosinophils, lymphocytes, plasmacytes, presence of lymphoid follicles and lymphoid aggregates. We also observed stromal fibrosis, mononuclear cell and macrophage infiltration and tubular adenomas in several patients. Active inflammation was found in 6 patients and one patient had active colitis on histopathological examination. No malignancies were found.
4. Discussion
The main finding of our study is that in patients with T1D and progressive DKD the frequency and severity of gastrointestinal symptoms is higher, compared to patients with stable kidney markers, as assessed by gastrointestinal symptom score. The link between progressive DKD and diabetic gastroenteropathy was additionally confirmed by statistically significant correlations between gastrointestinal symptom scores, eGFR and albuminuria and in the logistic regression models.
We demonstrate in our work that gastrointestinal disorders start to manifest already in the initial stages of DKD progression, as the median eGFR is 72.81(40.72-105.27) ml/min/1.73m2 in the group of progressive DKD in our study. Our findings can not be directly compared to previous data due to deficiency of studies on association of diabetic gastroenteropathy with progressive DKD in T1D. We only found one paper by D’Addio et al reporting higher scores of gastrointestinal symptoms in patients with T1D and DKD. However, that paper investigated diabetic gastroenteropathy only in patients with ESRD compared to healthy individuals and did not cover subjects with DKD and initial stages of chronic kidney disease[12]. More pronounced gastrointestinal symptoms in ESRD from any cause were reported already and might result from metabolic disorders and treatment of ESRD [27]. D’Addio et al also reports that gastrointestinal symptoms of patients subsided significantly several years after successful treatment with kidney-pancreas transplantation. However, this was not the case in patients who only received kidney transplant indicating hyperglycaemia per se as the main factor for diabetic gastroenteropathy. Although we think that immunosuppressive treatment after transplantation might be one of the factors alleviating the gastrointestinal derangements in the above study, our results of the regression analysis with fully adjusted model agree with the latter finding of D’Addio et al. Specifically, after adjustment of the regression model for diabetes duration, gastrointestinal symptom scores were no longer significant predictor of progressive DKD. However, due to rather low number of subjects included and the cross-sectional nature of our study, a larger longitudinal study is needed to obtain more conclusive results about mutual associations between gastrointestinal derangements and DKD progression in T1D.
In contrast to some previous studies in T1D reporting higher calprotectin level in patients with DKD [10,11,33] we did not observe higher faecal calprotectin levels in patients with progressive DKD compared to subjects with stable kidney markers. Moreover, faecal calprotectin did not exhibit any correlations with gastrointestinal symptom score, eGFR and albuminuria in our study. Our findings might mean that gastrointestinal symptoms in our patients were not associated with neutrophil-mediated inflammation resulting in calprotectin increase and severe inflammatory reaction which is observed in inflammatory bowel disease [34]. Indeed, in histological investigation of colon biopsies of patients who underwent endoscopic examination, eosinophilic infiltration, lymphoid follicles/ lymphoid aggregates and lymphoplasmacytic infiltration were the most frequent findings. In 21 subject who underwent colonoscopy, infiltration with polymorphonuclear neutrophils was not registered, mononuclear cell infiltration was observed only in two patients, active inflammation was reported only in six subjects (only one of them with progressive DKD). Thus, histologic changes observed by us indicate increased reactivity of the mucosa and chronic pathology [35] , when increased calprotectin levels are unlikely. On the other hand, lymphoplasmacytic infiltration is a predictor of more severe colitis in the future [35] and a study in T1D with ESRD reports more severe histologic changes of the mucosa as compared to our findings [12]. Thus, it is possible that calprotectin increase is observed in more advanced DKD stages.
Our study's limitations include a relatively low number of subjects, especially in the group of progressive DKD, which might have influenced the results. Further, the cross-sectional nature of the study does not allow us to evaluate the causal relationship between symptoms of diabetic gastroenteropathy and DKD. Other limitations include the self-evaluation of gastrointestinal symptoms in the study and self-reporting of the previous gastrointestinal diseases in a subset of patients due to unavailable central medical records in Latvia. We also did not perform evaluation of autonomic neuropathy, which might have influenced the gastrointestinal symptoms, but to our opinion these data would not alter our conclusions and the clinical value of our study due to unavailable treatment for autonomic neuropathy nowadays. Lack of endoscopic evaluation in all study participants in another limitation. However, all study participants did not have indications for endoscopy. In addition, not all of the invited patients responded to invitation due to complicated preparation procedure, fear of hypoglycaemia, fear of complications during anaesthesia or generally poor health status.
The major strength of the study is the analysis of gastrointestinal symptoms in patients of different rate of progression of DKD in contrast to previous studies addressing either patients with T1D generally, or patients with T1D and ESRD in comparison to healthy subjects. In addition, we have demonstrated results on histological colon biopsies in 21 patients with T1D, previously described only in one study [12].
To conclude, in patients with T1D and progressive DKD the frequency and severity of gastrointestinal symptoms is higher, compared to patients with stable kidney markers, as assessed by gastrointestinal symptom scores. Moreover, gastrointestinal symptom scores correlate with kidney markers. Further research is needed to clarify the causal relationships of the gut-kidney axis in T1D.
Supplementary Materials
Supplement 1: Gastrointestinal symptom score, Supplement 2: Instructions for patients with type 1 diabetes for preparation for lower endoscopy, Figure 1: Recruitment scheme.
Author Contributions
F.A. recruited subjects, analysed data, wrote the paper; T.L. consulted on study design, analysed data, edited the paper; Z.P. participated in the study design, development of questionnaires and instructions, recruited the patients, edited the paper; I.S. worked with data and recruited patients, edited the paper, B.R. worked with data and recruited patients, edited the paper J.J. participated inpatients’ surveillance, participated in study design, edited the paper; K.L. participated inpatients’ surveillance, participated in study design, edited the paper, K.E. performed endoscopic examinations, edited the paper; S.J. designed the study and wrote the paper.
Funding
Funding. Postdoctoral project Nr. 1.1.1.2/VIAA/3/19/525 “Intestinal inflammation as a potentially modifiable risk factor for complications in type 1 diabetes”.
Institutional Review Board Statement
Study protocol of the general LatDiane and sub-study devoted to gut health described here were approved by the Latvian Central Ethics Committee and received permissions No 01-29.1/3 (dated 10.07.2013), Nr. A-17/19-10-17 (dated 17.10.2019) and Nr. 01-29.1/2226 (dated 30.04.2020).
Informed Consent Statement
All study participants provided written informed consent for their participation.
Data Availability Statement
All data are not available publicly due to restrictions of privacy. The data are available from the corresponding author on request.
Acknowledgments
We thank Irēna Puzirevska for coordination of patient recruitment.
Conflicts of Interest
Authors declare no conflict of interests.
References
- Global, regional, and national burden of chronic kidney disease, 1990-2017: a systematic analysis for the Global Burden of Disease Study 2017. Lancet 2020, 395, 709–733. [CrossRef] [PubMed]
- Colombo, M.; Valo, E.; McGurnaghan, S.J.; Sandholm, N.; Blackbourn, L.A.K.; Dalton, R.N.; Dunger, D.; Groop, P.H.; McKeigue, P.M.; Forsblom, C.; et al. Biomarker panels associated with progression of renal disease in type 1 diabetes. Diabetologia 2019, 62, 1616–1627. [Google Scholar] [CrossRef]
- Du, Y.T.; Rayner, C.K.; Jones, K.L.; Talley, N.J.; Horowitz, M. Gastrointestinal Symptoms in Diabetes: Prevalence, Assessment, Pathogenesis, and Management. Diabetes Care 2018, 41, 627–637. [Google Scholar] [CrossRef] [PubMed]
- Lomer, M.C. Review article: the aetiology, diagnosis, mechanisms and clinical evidence for food intolerance. Aliment Pharmacol Ther 2015, 41, 262–275. [Google Scholar] [CrossRef]
- Leeds, J.S.; Hadjivassiliou, M.; Tesfaye, S.; Sanders, D.S. Lower gastrointestinal symptoms are associated with worse glycemic control and quality of life in type 1 diabetes mellitus. BMJ Open Diabetes Res Care 2018, 6, e000514. [Google Scholar] [CrossRef] [PubMed]
- Porter, J.A.; MacKenzie, K.E.; Darlow, B.A.; Pearson, J.F.; Day, A.S. A questionnaire-based assessment of gastrointestinal symptoms in children with type 1 diabetes mellitus. Transl Pediatr 2020, 9, 743–749. [Google Scholar] [CrossRef]
- Lehto, M.; Groop, P.H. The Gut-Kidney Axis: Putative Interconnections Between Gastrointestinal and Renal Disorders. Front Endocrinol (Lausanne) 2018, 9, 553. [Google Scholar] [CrossRef]
- Ni, Y.; Zheng, L.; Nan, S.; Ke, L.; Fu, Z.; Jin, J. Enterorenal crosstalks in diabetic nephropathy and novel therapeutics targeting the gut microbiota. Acta Biochim Biophys Sin (Shanghai) 2022, 54, 1406–1420. [Google Scholar] [CrossRef]
- Guo, W.; Song, Y.; Sun, Y.; Du, H.; Cai, Y.; You, Q.; Fu, H.; Shao, L. Systemic immune-inflammation index is associated with diabetic kidney disease in Type 2 diabetes mellitus patients: Evidence from NHANES 2011-2018. Front Endocrinol (Lausanne) 2022, 13, 1071465. [Google Scholar] [CrossRef]
- Winther, S.A.; Mannerla, M.M.; Frimodt-Møller, M.; Persson, F.; Hansen, T.W.; Lehto, M.; Hörkkö, S.; Blaut, M.; Forsblom, C.; Groop, P.H.; et al. Faecal biomarkers in type 1 diabetes with and without diabetic nephropathy. Sci Rep 2021, 11, 15208. [Google Scholar] [CrossRef]
- Lassenius, M.I.; Fogarty, C.L.; Blaut, M.; Haimila, K.; Riittinen, L.; Paju, A.; Kirveskari, J.; Järvelä, J.; Ahola, A.J.; Gordin, D.; et al. Intestinal alkaline phosphatase at the crossroad of intestinal health and disease - a putative role in type 1 diabetes. J Intern Med 2017, 281, 586–600. [Google Scholar] [CrossRef] [PubMed]
- D'Addio, F.; La Rosa, S.; Maestroni, A.; Jung, P.; Orsenigo, E.; Ben Nasr, M.; Tezza, S.; Bassi, R.; Finzi, G.; Marando, A.; et al. Circulating IGF-I and IGFBP3 Levels Control Human Colonic Stem Cell Function and Are Disrupted in Diabetic Enteropathy. Cell Stem Cell 2015, 17, 486–498. [Google Scholar] [CrossRef] [PubMed]
- Hochberg, I.; Segol, O.; Shental, R.; Shimoni, P.; Eldor, R. Antihyperglycemic therapy during colonoscopy preparation: A review and suggestions for practical recommendations. United European Gastroenterol J 2019, 7, 735–740. [Google Scholar] [CrossRef]
- Pellegrini, S.; Sordi, V.; Bolla, A.M.; Saita, D.; Ferrarese, R.; Canducci, F.; Clementi, M.; Invernizzi, F.; Mariani, A.; Bonfanti, R.; et al. Duodenal Mucosa of Patients With Type 1 Diabetes Shows Distinctive Inflammatory Profile and Microbiota. J Clin Endocrinol Metab 2017, 102, 1468–1477. [Google Scholar] [CrossRef]
- Paul, P.; Kaul, R.; Chaari, A. Renal Health Improvement in Diabetes through Microbiome Modulation of the Gut-Kidney Axis with Biotics: A Systematic and Narrative Review of Randomized Controlled Trials. Int J Mol Sci 2022, 23. [Google Scholar] [CrossRef] [PubMed]
- Ahola, A.J.; Radzeviciene, L.; Zaharenko, L.; Bulum, T.; Skrebinska, S.; Prakapiene, E.; Blaslov, K.; Roso, V.; Rovite, V.; Pirags, V.; et al. Association between symptoms of depression, diabetes complications and vascular risk factors in four European cohorts of individuals with type 1 diabetes - InterDiane Consortium. Diabetes Res Clin Pract 2020, 170, 108495. [Google Scholar] [CrossRef]
- Tzivian, L.; Sokolovska, J.; Grike, A.E.; Kalcenaua, A.; Seidmann, A.; Benis, A.; Mednis, M.; Danovska, I.; Berzins, U.; Bogdanovs, A.; et al. Quantitative and qualitative analysis of the quality of life of Type 1 diabetes patients using insulin pumps and of those receiving multiple daily insulin injections. Health Qual Life Outcomes 2022, 20, 120. [Google Scholar] [CrossRef]
- Svikle, Z.; Pahirko, L.; Zariņa, L.; Baumane, K.; Kardonaite, D.; Radzeviciene, L.; Daugintyte-Petrusiene, L.; Balciuniene, V.J.; Verkauskiene, R.; Tiščuka, A.; et al. Telomere Lengths and Serum Proteasome Concentrations in Patients with Type 1 Diabetes and Different Severities of Diabetic Retinopathy in Latvia and Lithuania. J Clin Med 2022, 11. [Google Scholar] [CrossRef]
- Salna, I.; Salna, E.; Pahirko, L.; Skrebinska, S.; Krikova, R.; Folkmane, I.; Pīrāgs, V.; Sokolovska, J. Achievement of treatment targets predicts progression of vascular complications in type 1 diabetes. J Diabetes Complications 2021, 35, 108072. [Google Scholar] [CrossRef]
- Rostoka, E.; Salna, I.; Dekante, A.; Pahirko, L.; Borisovs, V.; Celma, L.; Valeinis, J.; Sjakste, N.; Sokolovska, J. DNA damage in leukocytes and serum nitrite concentration are negatively associated in type 1 diabetes. Mutagenesis 2021, 36, 213–222. [Google Scholar] [CrossRef]
- Sokolovska, J.; Stefanovics, J.; Gersone, G.; Pahirko, L.; Valeinis, J.; Kalva-Vaivode, S.; Rovite, V.; Blumfelds, L.; Pirags, V.; Tretjakovs, P. Angiopoietin 2 and Neuropeptide Y are Associated with Diabetic Kidney Disease in Type 1 Diabetes Mellitus. Exp Clin Endocrinol Diabetes 2020, 128, 654–662. [Google Scholar] [CrossRef] [PubMed]
- Sokolovska, J.; Dekante, A.; Baumane, L.; Pahirko, L.; Valeinis, J.; Dislere, K.; Rovite, V.; Pirags, V.; Sjakste, N. Nitric oxide metabolism is impaired by type 1 diabetes and diabetic nephropathy. Biomed Rep 2020, 12, 251–258. [Google Scholar] [CrossRef] [PubMed]
- Salem, R.M.; Todd, J.N.; Sandholm, N.; Cole, J.B.; Chen, W.M.; Andrews, D.; Pezzolesi, M.G.; McKeigue, P.M.; Hiraki, L.T.; Qiu, C.; et al. Genome-Wide Association Study of Diabetic Kidney Disease Highlights Biology Involved in Glomerular Basement Membrane Collagen. J Am Soc Nephrol 2019, 30, 2000–2016. [Google Scholar] [CrossRef]
- Sviklāne, L.; Olmane, E.; Dzērve, Z.; Kupčs, K.; Pīrāgs, V.; Sokolovska, J. Fatty liver index and hepatic steatosis index for prediction of non-alcoholic fatty liver disease in type 1 diabetes. J Gastroenterol Hepatol 2018, 33, 270–276. [Google Scholar] [CrossRef]
- Zamora-Ros, R.; Biessy, C.; Rothwell, J.A.; Monge, A.; Lajous, M.; Scalbert, A.; López-Ridaura, R.; Romieu, I. Dietary polyphenol intake and their major food sources in the Mexican Teachers' Cohort. Br J Nutr 2018, 120, 353–360. [Google Scholar] [CrossRef]
- Quan, C.; Talley, N.J.; Cross, S.; Jones, M.; Hammer, J.; Giles, N.; Horowitz, M. Development and validation of the Diabetes Bowel Symptom Questionnaire. Aliment Pharmacol Ther 2003, 17, 1179–1187. [Google Scholar] [CrossRef]
- Karahan, D.; Şahin, İ. Comparison of gastrointestinal symptoms and findings in renal replacement therapy modalities. BMC Nephrol 2022, 23, 261. [Google Scholar] [CrossRef] [PubMed]
- Bouri, S.; Martin, J. Investigation of iron deficiency anaemia. Clin Med (Lond) 2018, 18, 242–244. [Google Scholar] [CrossRef] [PubMed]
- Lewandowski, K.; Rydzewska, G.; Ledwoń, T.K. Preparation for endoscopic examinations in patients with diabetes and hypoglycaemia. Prz Gastroenterol 2021, 16, 297–305. [Google Scholar] [CrossRef]
- Hassan, C.; Bretthauer, M.; Kaminski, M.F.; Polkowski, M.; Rembacken, B.; Saunders, B.; Benamouzig, R.; Holme, O.; Green, S.; Kuiper, T.; et al. Bowel preparation for colonoscopy: European Society of Gastrointestinal Endoscopy (ESGE) guideline. Endoscopy 2013, 45, 142–150. [Google Scholar] [CrossRef]
- Hinkelbein, J.; Lamperti, M.; Akeson, J.; Santos, J.; Costa, J.; De Robertis, E.; Longrois, D.; Novak-Jankovic, V.; Petrini, F.; Struys, M.; et al. European Society of Anaesthesiology and European Board of Anaesthesiology guidelines for procedural sedation and analgesia in adults. Eur J Anaesthesiol 2018, 35, 6–24. [Google Scholar] [CrossRef] [PubMed]
- Saltzman, J.R.; Cash, B.D.; Pasha, S.F.; Early, D.S.; Muthusamy, V.R.; Khashab, M.A.; Chathadi, K.V.; Fanelli, R.D.; Chandrasekhara, V.; Lightdale, J.R.; et al. Bowel preparation before colonoscopy. Gastrointest Endosc 2015, 81, 781–794. [Google Scholar] [CrossRef] [PubMed]
- Schön, E.-M.; Winter, D.; Escalona, M.J.; Thomaschewski, J. Key Challenges in Agile Requirements Engineering; 2017; pp. 37-51.
- Shi, J.T.; Chen, N.; Xu, J.; Goyal, H.; Wu, Z.Q.; Zhang, J.X.; Xu, H.G. Diagnostic Accuracy of Fecal Calprotectin for Predicting Relapse in Inflammatory Bowel Disease: A Meta-Analysis. J Clin Med 2023, 12. [Google Scholar] [CrossRef] [PubMed]
- Rezazadeh Ardabili, A.; Goudkade, D.; Wintjens, D.; Romberg-Camps, M.; Winkens, B.; Pierik, M.; Grabsch, H.I.; Jonkers, D. Histopathological Features in Colonic Biopsies at Diagnosis Predict Long-term Disease Course in Patients with Crohn's Disease. J Crohns Colitis 2021, 15, 1885–1897. [Google Scholar] [CrossRef]
Figure 1.
Recruitment scheme. eGFR – estimated glomerular filtration rate; DKD – diabetic kidney disease; CRP – C-reactive protein.
Figure 1.
Recruitment scheme. eGFR – estimated glomerular filtration rate; DKD – diabetic kidney disease; CRP – C-reactive protein.
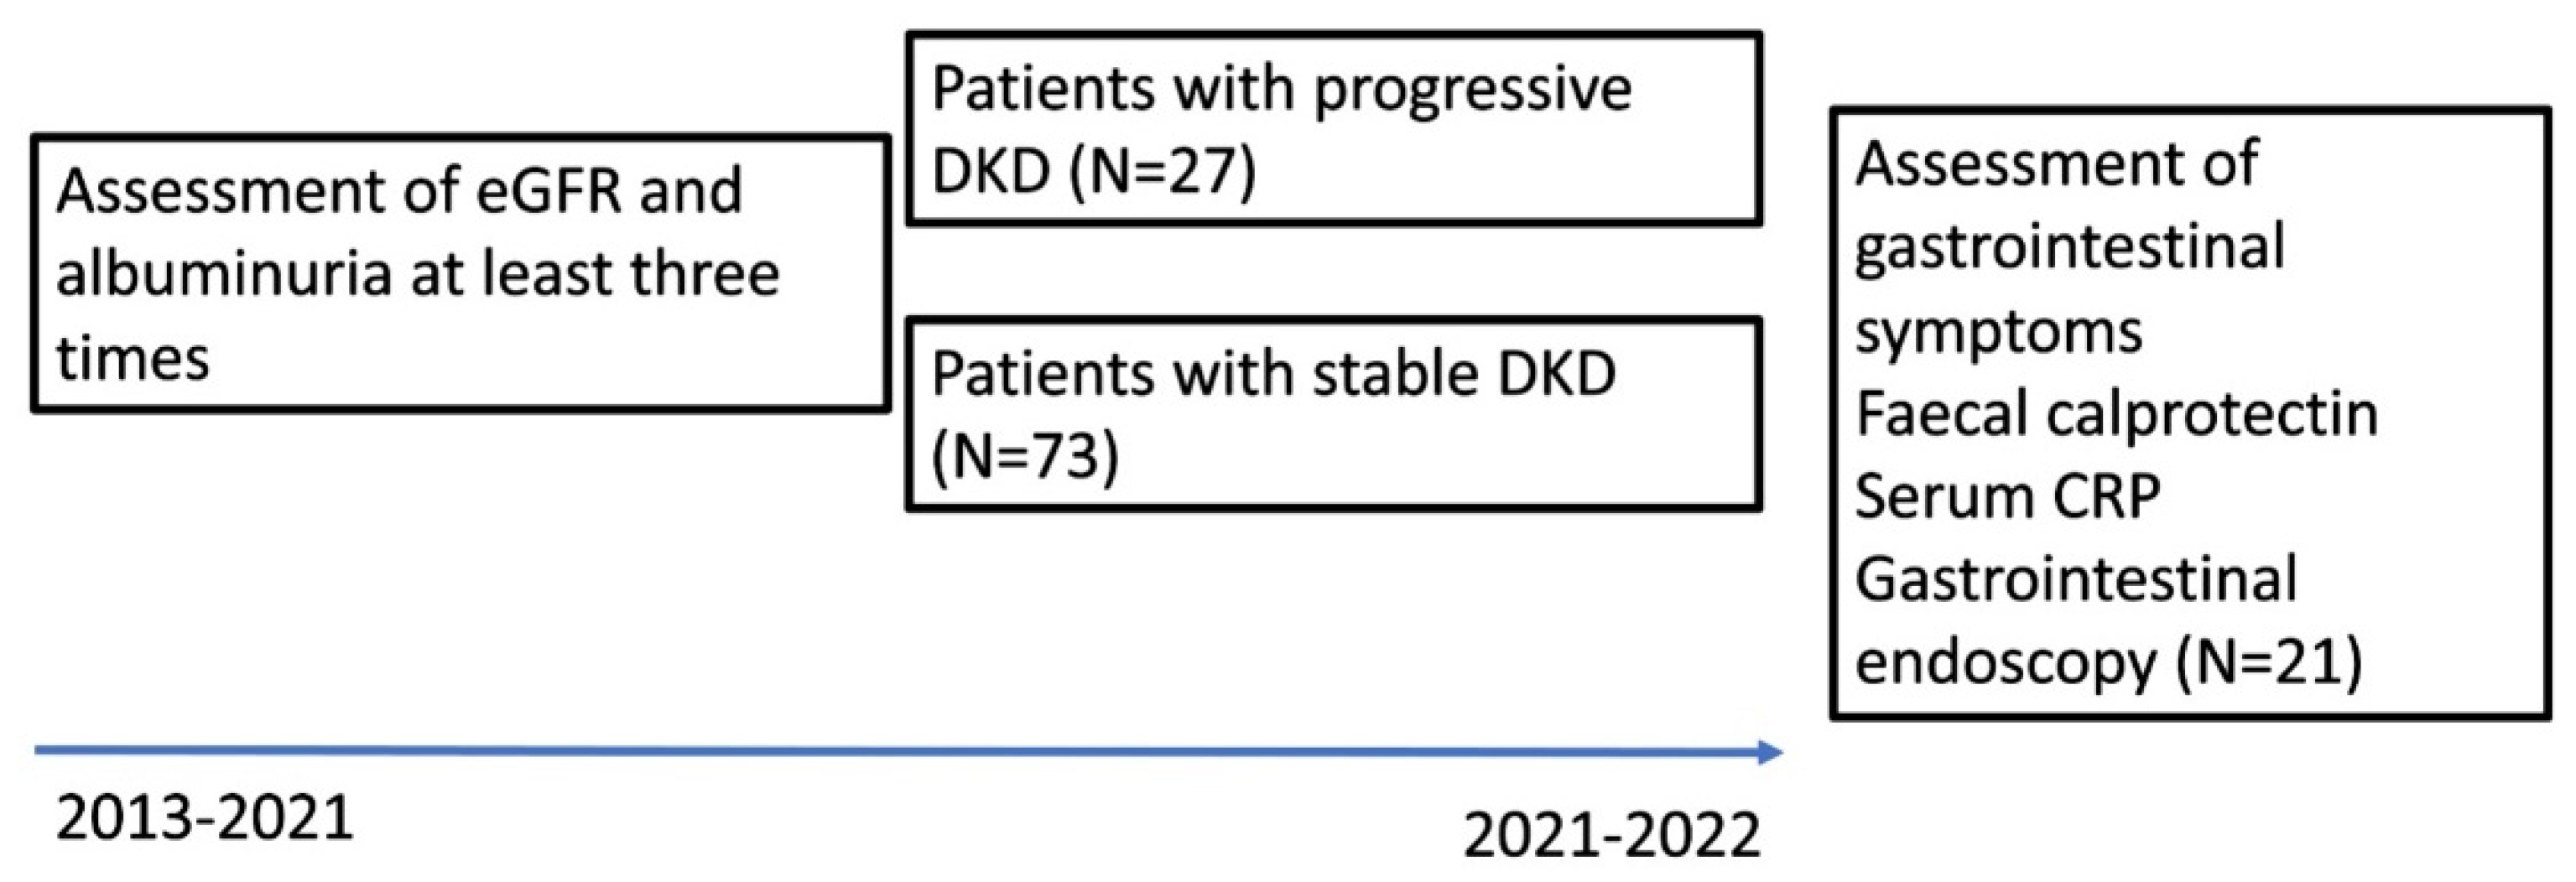

Table 1.
Differences in socio-demographic and disease-related data of study groups.
| Title 1 | DKD stable, N = 73 |
DKD progressive, N = 27 |
P value |
|---|---|---|---|
| Male gender, N (%) | 31 (42.5%) | 7 (25.9%) | 0.99 |
| Age, years, | 44.0 (31.5 - 52.0) | 39.0 (34.0 – 50.0) | 0.86 |
| BMI, kg/m2 | 24.85 (22.63-28.15) | 25.40 (22.60-28.40) | 0.95 |
| Smokers, N (%) | 13 (17.8%) | 6 (22.2%) | < 0.01 |
| Hypertension, N (%) | 32 (43.8%) | 21 (77.8%) | < 0.01 |
| Length of diabetes, years | 21 (13-31) | 27 (24-37) | < 0.01 |
| Mean follow-up, years | 7.00 (5.50-7.00) | 7.00 (3.00-7.00) | 0.72 |
| Retinopathy, N (%) | 30 (41.1%) | 22 (81.5%) | < 0.01 |
| Cardiovascular disease, N (%) | 7 (9.6%) | 9 (33.3%) | < 0.01 |
| On ACEI/ARB N (%) | 12 (16.4%) | 8 (29.6%) | 0.14 |
| On lipid lowering medication N (%) | 17 (23.3%) | 10 (37.0%) | 0.16 |
| Autoimmune thyroid disease, N (%) | 18 (24.7%) | 9 (33.3%) | 0.27 |
| Other autoimmune disease N (%) | 11 (15.1%) | 5 (18.5%) | 0.67 |
| Haemoglobin A1C, % | 7.60 (7.00-8.70) | 8.90 (07.54-10.30) | 0.02 |
| Haemoglobin A1C mmol/mol | 59.56 (53.00-71.58) | 73.77 (58.90-89.07) | 0.02 |
| Estimated glomerular filtration rate, ml/min/1.73m2 | 107.98(92.52-117.63) | 72.81(40.72-105.27) | < 0.01 |
| End stage renal disease, N (%) | 0 (0%) | 4 (14.8%) | < 0.01 |
| Albumin/creatinine ratio in urine, mg/mmol | 0.45(0.19-0.99) | 19.65 (4.98-112.50) | <0.01 |
| C-reactive protein, mg/l | 0.9 (0.5-2.8) | 1.5 (0.5-3.48) | 0.72 |
| Faecal calprotectine, µg/g | 7.60 (2.75-23.20) | 16.20 (5.80-22.00) | 0.21 |
| Faecal calprotectine>50 µg/g, N(%) | 8 (11.0%) | 2 (7.4%) | 0.59 |
| Total cholesterol, mmol/l | 5.02(4.30-5.79) | 4.96(4.12-5.88) | 0.95 |
| Low density lipoproteins, mmol/l | 2.87(2.10-3.40) | 3.04(2.10-3.46) | 0.41 |
| Triglycerides, mmol/l | 1.14(0.85-1.45) | 1.31(0.86-2.11) | 0.14 |
| Alanine transaminase, U/l | 19.00(15.50-29.00) | 21.00(17.00-24.00) | 0.64 |
| Gamma-glutamyl Transferase, U/l | 16.00(13.00-25.50) | 17.00(15.00-26.00) | 0.41 |
| Bilirubin, µmol/l | 9.30(7.80-12.40) | 6.51(5.10-9.20) | 0.001 |
| Haemoglobin, g/l | 140.00(132.00-150.00) | 129.00(120.00-141.00) | 0.001 |
| Erythrocytes, 10x12\L | 4.70(4.40-5.00) | 4.40(4.00-4.73) | 0.002 |
| Leukocytes, 10x9/L | 6.13(5.01-7.22) | 6.53(5.71-7.64) | 0.14 |
| Thrombocytes, 10x9/L | 259.00(228.00-284.00) | 231.00(200.00-299.00) | 0.21 |
Table 2.
Gastrointestinal conditions and symptoms in the study groups.
| Title 1 | DKD stable, N = 73 |
DKD progressive, N = 27 |
P value |
|---|---|---|---|
| History of upper gastrointestinal disease, N (%) | 29 (39.7%) | 13 (48.1%) | 0.50 |
| History of lower gastrointestinal disease, N (%) | 24 (32.9%) | 12 (44.4%) | 0.28 |
| History of gastrointestinal malignancy, N (%) | 0 (0.0%) | 1 (3.7%) | 0.10 |
| History of liver and pancreas disease, N (%) | 27 (37.0%) | 9 (33.3%) | 0.74 |
| History of abdominal surgery, N (%) | 21 (28.8%) | 13 (48.1%) | 0.07 |
| Mean value of gastrointestinal symptom score | 1.05(0.73-1.35) | 1.27(1.00-1.82) | 0.019 |
| Bowel movement disorders, N (%) | 16 (21.9%) | 14 (51.9%) | <0.01 |
| Usage of medications for gastrointestinal disorders | 0.16 (0.00-0.50) | 0.33(0.00-0.66) | 0.54 |
Continuous variables are presented as median (IQR). Bowel movement disorders – constipation, diarrhoea, intermittent constipation and diarrhoea. DKD – diabetic kidney disease.
Table 3.
Association between progression of diabetic kidney disease and gastrointestinal symptoms.
| Variable | Model | Odds ratio, OR | 95% confidence interval (CI) | pvalue |
| Mean Symptoms | 1 | 3.086 | 1.20; 7.87 | 0.02 |
| Mean Symptoms | 2 | 2.77 | 1.06; 7.24 | 0.04 |
| Mean symptoms | 3 | 2.394 | 0.886; 6.467 | 0.085 |
| Mean Symptoms | 4 | 1.99 | 0.71; 5.54 | 0.18 |
Table 4.
Summary of macroscopic and microscopic lesions identified during gastrointestinal endoscopic examination.
Table 4.
Summary of macroscopic and microscopic lesions identified during gastrointestinal endoscopic examination.
| Procedure | Macroscopic lesions | Histopathologic lesions |
| Upper endoscopy, N=10 | 1)Hyperaemic gastropathy (n=4) 2)Hyperaemic duodenopathy (n=1) 3) oesophageal candidiasis (n=1) 4) gastric intestinal metaplasia (n=1) |
1)active gastritis (N=3) 2)chronic atrophic gastritis (N=3) |
| Colonoscopy, N=21 | 1)polyps (n=2) 2)diverticulosis (n=1) 3)erosion of sigmoid colon (n=1) 4)perianal papilloma (n=1) |
1)eosinophilic infiltration (n=8, 38%) 2)lymphoid follicles/ lymphoid aggregates (n=7, 33%) 3)lymphoplasmacytic infiltration (n=5, 24%). 4)lymphocyte and macrophage infiltration (n=3, 14 %) 5) stromal fibrosis (n=3, 14%) 6) mononuclear cell infiltration (n=2, 9.5%) 7) tubular adenomas (n=2, 9.5%). 8)Active inflammation 6 (29 %) 9) active colitis 1 (4.76 %) |
Disclaimer/Publisher’s Note: The statements, opinions and data contained in all publications are solely those of the individual author(s) and contributor(s) and not of MDPI and/or the editor(s). MDPI and/or the editor(s) disclaim responsibility for any injury to people or property resulting from any ideas, methods, instructions or products referred to in the content. |
© 2023 by the authors. Licensee MDPI, Basel, Switzerland. This article is an open access article distributed under the terms and conditions of the Creative Commons Attribution (CC BY) license (http://creativecommons.org/licenses/by/4.0/).
Copyright: This open access article is published under a Creative Commons CC BY 4.0 license, which permit the free download, distribution, and reuse, provided that the author and preprint are cited in any reuse.


