
Submitted:
07 September 2023
Posted:
11 September 2023
You are already at the latest version
Abstract
Public health suffers from noxious gas of beached Sargassum algae. Floating barrages containing them at sea will be useful provided efficiently catch them and resist to hydrodynamic pressure. Nowadays design and installation of algae barrages are empiric. Structural break, anchor and mooring chain drifts can arise. We provide a mechanical model to evaluate stresses and loads on a structure made of nets and moorings. Hydrodynamic uncertainties occur through catches, fouling, and a range of sea currents appearing in lagoons or sheltered bays. We consider a nonlinear finite-element model of elastic membrane in large displacements and small strains. We study some forcings fixed a priori on a standard section of barrage. A section 50 m long, 1 m high, with two net-faces is examined at low and moderate current velocities, 0.05 and 0.35 m.s-1, while assuming specific vertical and horizontal catch pressures. A barrage installed in lagoon at Le François on Martinique Island and being observable by satellite imagery could benefit of the computed net and mooring tensions.
Keywords:
algae
; thin shell
; membrane
; fluid structure interaction
; net
; catch
; lagoon
; hydrodynamics
; a priori hypotheses
1. Introduction
The massive arrival of Sargassum algae, issue from the Atlantic Ocean surface, between Africa and South America, holds a crucial problem for most Caribbean countries. To contain algae, living organisms, drifting on the sea surface with their self-buoyancies, empirical floating barrages are suitable to collect and avoid beaching. Well known by the oil-spill community as booms, when the sea current exceeds a threshold, the pollution containment fails and even more the barrage could break. In case of heavy current, operators can place the algae barrage like for boom with an angulation with the flow to reduce drag. Algae are then deviated, eventually to collect point near shore.
Usage of oil-spill booms exists for algae containment (Chávez et al., 2020). For algae, a barrage is a permanent structure, differing an oil spill boom intended temporary which lasts the time of the accident and the recovery of pollution. A main drawback of this temporal difference is the fouling of the structure, which implies heavy disassembling cleaning and reassembly costs. Without a barrage continuous maintenance (Swain and Shinjo, 2014), both its weight and hydrodynamic drag could increase significantly. Booms are enducted fabric while algae barrages use fishing net materials eventually recycled ones. Booms containing oil avoid beaching which would induce 10-times more of waste weight, here keeping algae on sea and collect them enhances public health because when beached their decomposition gives noxious gases harming population (Resiere et al., 2018).
The Figure 1 depicts five drifting algae rafts αm and two narrow pass in coral reef pcr . The site is located up north in the Pointe Cerisier on Martinique Island. Raft boundary can be smooth or non-smooth on the ocean, trough coral reef pass or in lagoon. A raft located up south at the bottom right of the Figure 1 has a smooth boundary (Ody et al., 2019). A significant accumulation α- of algae beached on the shore but still on sea water is also shown at the bottom left of the Figure 1.
Our study concerns the barrage structural analysis. To that end, we use a non-linear large displacements membrane model (Schoop et al., 2002). We consider a linear elastic constitutive material and a static regime without dynamic force (Jenkins and Leonard, 1991). A four-node bilinear quadrilateral finite-element mesh approximates the membrane surface (Haug, 1971). We suppose the material isotropic that is not the case in the orthotropic cable pattern proposed for a trawl net (Priour, 1999). The advantage of our hypothesis is to consider an homogenous material which will provide the natural mechanical stress map without any bias inside the membrane.
We organize the paper as follows. First, we present the structural model of the barrage where the fluid-algae/structure interaction is set in an uncertain hydrodynamic environment. Secondly, we detail the hypotheses taken for a case study. Finally, we discuss about the numerical results for different cases of hydrodynamic loadings induced by catch.
2. Material and methods
We situate the theoretical background in solid mechanics, fluid-structure interaction and finite-element method.
2.1. Non-linear elastic membrane model
Let ω be the membrane surface defining the floating barrage and u its displacement under applied forces. We denote by x(u) the non-linear strain tensor and σ(u) the stress tensor. The internal elastic strain energy (Bletzinger and Ramm, 2001) e(u) is defined by
where tr is the trace operator.
The potential energy l of the applied forces is the summation of three terms defined respectively by the normal hydrodynamic pressure p, the density by thickness ρω of the barrage constitutive material and the buoyancy of the undersea barrage domain ω- at depth h
where ρw is the water density and g is the gravity. We note that the pressure p, the normal vector and the depth h depend on the displacement u.
The equilibrium equation of the barrage is given by
where v is a virtual cinematically admissible displacement field.
In the sequel, we denote the internal strain energy derivative by
The Figure 2 illustrates the notations, the barrage ω , its anchoring line head sa and the algae catch αc on the sea surface s. Seagrass herbier sh and sunk algae αs are located on the seabed b.
2.2. Fluid-structure interaction
The continuous equilibrium Equation (3) by using definition (4) can be written in the following way in term of the displacement u
We introduce the dependency of the normal pressure p with the angle between the sea current vector V and the normal vector at the surface. The Equation (5) becomes
The flow angulation with the normal vector of a fish net panel influences the drag force (Santo, 2022).
In addition, the normal at the surface depends on the displacement u. The Equation (6) takes the form
Defining an initial displacement u0, we could construct an iterative scheme from Equation (7)
Numerically, we consider a second order polynomial function u0 ∈ K2[IR]. An explicit dependency of u1 in term of u0 arises at the first iteration
Remark: To reduce the barrage longitudinal stress, generally the operators take the initial unstressed length L of the barrage higher than the distance C between its end-points:
The oil-spill boom state of the art recommends the following slack prestress ratio
Unlike trawl tests in flume tank (Thierry et al., 2020), investigations on twine diameters, different mesh sizes, and geometrical shapes are not performed in this study.
2.3. Finite-element approximation
A finite-element mesh approximates the surface by using a set of N quadrilateral finite-elements
On each element ωe , the displacement is estimated by a bilinear interpolation using four shape functions Ni
where Ui represents the displacement of the node i of the element ωe.
The summation of a function f , like in Equations (1)-(2) is performed numerically over an element by using a four-node Gauss integration
where λk is the weight of the integration node k.
The discrete non-linear equilibrium equation can be written
in term of the nodal displacement vector U, where Fint and Fext are respectively the equivalent internal and external forces at the finite-element nodes.
The discrete Equation (15) is solved by using the Newton-Raphson method
where the derivative of the internal forces in term of nodal displacement U represents the stiffness matrix of the barrage.
3. Barrage case study
We depict a first case study about a standard barrage section and hypotheses on a priori loadings. We proceed without hydrodynamic modelling of coastal water (Iouzzi et al., 2023), drag measurements on algae specimen and barrage (Violeau et al., 2007), and satellite imagery of polluted lagoon (Rajendran et al., 2021).
3.1. Geometry
Algae barrages possess generally two nets. A first one provides the structural stiffness, and a second one, hermetic, less stiff, and less high, crossing the free surface catches algae. Several complementary filaments can reinforce longitudinal stiffness, adapt mass and add buoyancy.
To obtain easily the two nets, we construct the barrage mesh from a flattened boom, which is a cylinder closed by two cones. A cylinder 50 m long and diameter 1 m gives a standard barrage section. Cones are 1 m height. Two triangles, initially the two cones, folded 90° along their bases generate the two mooring devices between the barrage and anchoring line heads sa.
The flattened cylinder fits under the sea surface s. We obtain a closed surface ω with two net-faces, one up-stream and another one down-stream, connected on top and bottom. We do not consider contact and friction between the net-faces.
The surface ω defining the barrage and mooring devices is without boundary,
because a cylinder closed at both ends, here two cones, is a closed surface and the flattening is a continuous process which leaves the topology invariant and therefore closed.
∂ ω = ∅
To reduce the internal stress σ(u), we use the standard ratio of 7% between the length of the curve of the barrage and its chord length, Equation (11). Thus, the initial geometry is transformed so that it follows a parabola, a choice rather than a catenary, cord 50 m long, curve 53.5 m long, point of width at -9.52 m according to Y-upstream axis. Figure 3 shows the undeformed quadrilateral finite-element mesh.
To present the results in the sequel, we divide the section in four quarters, Qi, i=1,4, Figure 3.
3.2. Boundary conditions
3.2.1. Cinematic
To allow a perfect buoyancy, we block the Z-vertical displacement of the nodes located at the sea surface s, Equation (18). As effect of adjacent sections, the two flattened cones X-longitudinal displacements are blocked, Equation (19). We neglect the behavior of the mooring lines and consider the heads of anchoring lines sa as fixed points, Equation (20).
The drift and chafe (deradage, ragage) on sea bottom b, of dead masses, anchors and blocks used in moorings are not detailed.
3.2.2. Reaction forces
The Dirichlet boundary conditions, Equations (18-20) give the following resultant forces whose directions are opposite to the reactions. The Z-vertical buoyancy resulting force BZ associated to Equation (18) defines the exact buoyancy balancing external forcings and internal stresses. The tension TX is the summation of the X-longitudinal resulting forces, Equations (19-20), which determines the load transfer between two adjacent sections. It estimates the working force deployed by operators during a deployment or dismantling. The anchoring Y-upstream force AY in sa results from Equation (20).
3.3. Hydrodynamic
We assume a non-porosity of the barrage to the flow, meaning a total nets saturation by the algae catch and fouling. That corresponds to the topology of the surface ω , Equation (17). The drag coefficient considered is 1.65 as for hermetic vertical skirt (Muttin, 2008).
We neglect the effects of the seabed b, waves and wind (Putman et al., 2023) on the forcings, as well as weather variability and even cyclonic conditions. We will study two uniform sea current velocities. The low velocity 0.05 m.s-1 corresponds to sheltered area in lagoon. The second and moderate velocity 0.35 m.s-1 coincides with the oil-spill boom efficiency thresholds.
More precisely, oil viscosity and density bear on the velocity limit of containment by barrage. Both algae raft density and internal algae cohesion remain to be study. We note that leakage appears at 0.15 m.s-1 for high viscous oils and that rigid or flexible barriers have been studied at mean approaching flow velocity 0.2°m.s-°1 (Amini and Schleiss, 2009). We mention that aquaculture cage moorings are studied experimentally and numerically for current velocities less than 0.25 m.s-1 (Tang et al., 2021).
Remark: From the hydrostatic point of view, we suppose that the gravity force balances the buoyancy force in Equation (2), thus the vertical reaction force RZ arises only from hydrodynamic pressure. The gravity force involves the barrage, fouling and intertwined algae catch in nets.
3.4. Material
The nets are polyethylene. The stress-strain relationship of nets tangling intertwined algae is supposed linear, elastic and isotropic. We assume a low Young modulus and that a strain of 2% corresponds to a force 1000 N for stretching a band 5 cm wide. We consider the same elastic properties on the two net-faces. Knot resistance between net twines is not studied here. Table 1 gives the barrage properties used.
3.5. Numeric stability
To trap the two net-faces of the cylindrical mesh, we introduce a disjoined thickness of 1e-3 m. The usage of a flattened and closed surface possesses a numerical justification. We expect that an elastic surface without free boundary favours the non-linear equilibrium resolution, which otherwise would be prone to flappings.
Due to zero initial stress σ, we apply a scaling on the first updates of Equation (16) to limit at 0.05 m the maximal displacement. We use eight iterations of Equation (16) for the 0.05 m.s-1 flow velocity to solve the non-linear elastic membrane Equation (15), and ten iterations for 0.35 m.s-1. We will perform only the first iteration of the fluid-structure interaction, Equation (9).
3.6. In-situ example
This section presents an illustration with a barrage already existing in the Antilles Françaises. Figure 4 depicts a 3D view of a Sargassum barrage surface ω having 611.5 m long as sum of section chords. This barrage is moored at North of Pointe Madeleine and South of Pointe Cerisier in Martinique. The lagoon is open at North-East through a coral reef pass pcr at Lat 14°35’58”N, Lon 60°50’46” W, Figure 4. On the left of Figure 4, we observe an algae catch αc along the surface ω . Two mooring points sa at the South of the barrage are equally shown.
At north of the mooring points sa on Figure 4 could be observed a long curve of the barrage. It could be interpreted as the consequence of the drifting of the mooring masses on the seabed, until the barrage tension acts principally on moorings at South and North sections that have been stronger.
The coordinates of the North mooring point of the barrage section used as illustration (Figure 4) are Lat 14°35’29”N, Lon 60°50’58”, the South mooring point coordinates are Lat 14°35’28”N, Lon 60°50’57”. The cord of this section is 44.98 m long. The barrage section length is 45.4 m, giving a 0.93% slack ratio, lower than the standard, Equation 11.
The global hydrodynamic study of the Martinique Island published in 1992 mentions a current of 0.1 to 0.2 m.s-1 at the La Caravelle site (Pujos et al., 1992), but this is a large-scale study which is not suitable for bay currents.
Remark: The movements of anchors, chains, can potentially damage seagrasses. On right of the Figure 4, seagrass loss under another floating barrage has been reported, where remain two “herbiers” sh . The loss of seagrass beds depends on the lack of light, the reduction of photosynthesis and the mooring chain chafing.
4. Results and discussion
We present three situations, first a uniform distribution along the barrage of catch and fouling at low or moderate velocities, then two vertically and horizontally non-uniform distributions of catch without fouling and both at moderate velocity.
4.1. Uniform catch and fouling distribution at low and moderate velocities
The hydrodynamic pressure is uniform vertically for both velocities. To present the results, we use four quarters, Qi, i=1,4 showed on Figure 3 and giving five positions reported in Table 2. We conserve the symmetry to check the results.
The barrage middle moves back because of the non-equilibrium shape of the initial parabola to balance the hydrodynamic pressure. The resulting vertical buoyancy BZ is negative at both end-nodes on the top of the barrage, especially for the moderate velocity. We suggest adequate ballasting loads to sink the barrage on its ends.
The hydrodynamic flow stresses the two mooring line heads. We suggest planning sufficient horizontal strength of the anchorages to support the anchoring upstream resultant AY. The longitudinal tensions TX between adjacent sections are respectively 58.95 and 2842 N for the low and moderate velocities.
Figure 5 shows the stressmap in the barrage and its mooring devices for 0.35 m.s-1. The principal stress maximum is located at both mooring line heads. The figure colour unit is N.m-1.
4.2. Two vertically non-uniform catch distributions at moderate velocity
The vertical hydrodynamic pressure distribution is difficult to handle in tests and in situ measurements on a barrage with fouling and catch. We note a non-uniform vertical distribution for floating oil contained by booms and observe a concentration near the skirt top (Chebbi, 2009). On the other hand, catch in fishing net impacts locally the flow near the deformed surface (Pichot et al., 2009). Finally, we find out uncertainties about successive algae raft arrival depths (Ody et al., 2019) and catch accumulation heights. The following a priori hypotheses define two cases of vertically non-uniform pressure. Firstly, we transfer the hydrodynamic pressure from the lower half of the barrage, i.e. equalling zero on this part, to add it to that of the upper half. Secondly, we continue this transfer of pressure from the bottom of the upper half, where the pressure will become zero, to add it to the highest part of the barrage, the "top band" of finite-elements. In the first case, the external force resultant remains identical, the two half parts having the same surface. In the second case, the external force resultant will decrease because of the straight height of the “top band” of finite-elements. These transfers are defined on both upstream and downstream net-faces. On the two net-faces, the sign of the pressure change because the normal vector directions are opposite.
We compare these cases with the uniform pressure in Table 3. We present the principal stress mean over the four Gauss integration nodes (Equation 14) for a central and vertical band of finite-elements (elements n°67 to 78 on Q2 neighbouring Q3). The flow velocity is 0.35 m.s-1.
The pressure transfer on the half-upper part has little influence on horizontal displacement. The y-coordinate of barrage centre remains at -9.49 m on s. Along the central band of the mesh, the vertical repartition of the principal stress varies in the interval [1680, 2017] N.m-1 instead of being 1849.7 N.m-1, Table 3. The pressure acting only on the half-upper part influences the buoyancy Z-vertical forces BZ particularly around mooring nodes. The Table 4 compares the Z-vertical buoyancy forces along the floating line nodes in term of pressure distributions.
The pressure transfer to the “top band” of finite-elements influences weakly the y-coordinate of barrage centre remaining at -9.42 m. Buoyancy variations are located near moorings, Table 4. The main observation is the stress vertical repartition which belongs to the interval [654, 969] N.m- 1 from the bottom to the top of the barrage, Table 3. We recall that in this case the overall resultant force is reduced.
We interpret the results on vertically variable pressure. Our motivation came from the difficulty to handle the vertical distribution and the horizontal accumulation of algae catch. We study two transfers of the sea current pressure through algae catch behavior on netting barrage.
The pressure case on half-upper part corresponds to partial contact between the barrage and its catch. Our main observation is the independence on the net structure geometry but a large influence on stress along the vertical and buoyancy near moorings. Mooring heads position below the sea surface could favour these effects.
The pressure concentrated on the “top band” is a limit case having low catch thickness. In that situation, the barrage stress varies vertically. The net barrage must be designed with a more stiff upper part if this case of catch is encountered. If this situation is rare, a uniform net structure is suggested.
4.3. Two horizontally non-uniform catch distributions at moderate velocity
At contrary of a vertical section which remains rather straight, the horizontal shape has a significant curvature, giving catch concentration in barrage central part. The horizontal catch distribution can be observed on sea surface, by example on the left of Figure 3. Nevertheless, an uncertainty persists on net obstruction by catch. The hydrodynamics pressure could vary in term of captured raft sizes. Therefore, we present two a priori hypotheses handling non-uniform horizontal pressure distributions. Two basic symmetrical mathematics functions having same summation are studied: a Heaviside-rectangular and a triangular pressure distributions. These choices should give a first trend on the behavior of the barrage according to the central position of the catches.
We detail the two case studied with variable horizontal pressure, corresponding to different catch domain geometries. Firstly, the catch pressure is supposed to vanish on the left and right horizontal quarters of the barrage. We suppose a hypothetical concentration of the catch on the barrage centre. Consequently, we assume that the catch pressure is double over its two central quarters. We define a density function distributing the previously used uniform barrier pressure. This Heaviside density equals 0 in quarters Q1 and Q4 and 2 in quarters Q2 and Q3.
The second case corresponds to a density function increasing linearly 0.25, 0.75, 1.25 until 1.75 along the finite-element vertical bands located respectively in Q1 and Q2. By symmetry, the density decreases linearly from 1.75, 1.25, 0.75 to 0.25 in Q3 and Q4. The catch forcing follows a Triangular continuous density, which is maximal at the barrage centre and minimal at its boundaries.
The summation of both Heaviside and Triangular density functions over the barrage X-longitudinal axis is still equal to 1. The flow velocity considered in both cases remains moderate at 0.35 m.s-1. Table 5 compares the BZ buoyancy Z-vertical forces along the barrage at the sea surface.
The BZ buoyancy forces increase significantly with the Heaviside density compared to the Uniform density. It suggests that a catch leakage under the barrage could happen if a large amount of catch concentrated at the centre lifts the barrier. In the case of a Triangular repartition, the BZ buoyancy forces increase with a minor amplitude only at barrage ends compared to the Uniform case.
In all cases, the principal stress in the netting structure remains quasi constant along the barrage, but compared to the Uniform case, a low variance appears longitudinally for the two non-uniform densities. At barrage centre, the stress reaches 2575 N.m-1 in Heaviside case and 2286 N.m-1 in Triangular case, compared to 1849.7 N.m-1 in the Uniform pressure. It suggests that a uniform catch repartition decreases stress.
In the Uniform case, the barrage centre position on the sea surface is -9.49 m on the Y-upstream axis. This position reaches -10.13 m in the Heaviside case and -9.99 m in the Triangular case. A barrage is a flexible structure and consequently we observe a strong dependency of its equilibrium geometry in term of catch horizontal repartition.
In the Uniform case, the AY anchoring Y-upstream force is -2387.2 N at anchoring line heads. This resultant is -2402.3 N in Heaviside case and -2458.9 N in Triangular case. That suggests a reduced mooring tension when a uniform catch repartition occurs.
5. Conclusion
To estimate the anchoring forces on algae barrages, we used a nonlinear membrane model allowing large displacements. We considered several a priori hydrodynamic forcings. We performed a stable and simple finite-element numerical method and pursued the numerous hazards and uncertainties associated in Sargassum algae beaching. We indicated stress levels, which could benefit for a first barrage design.
For saturated nets i.e. fully hermetic by algae catch and fouling, we obtain a Y-upstream anchor force of 2387.2 N at 0.35 m.s-1, (48.8 N at 0.05 m.s-1). The influences of horizontal and vertical variations on catch geometry were discussed on resulting stresses, buoyancy and anchoring forces. With the uniform catch distribution over the barrage, its two superposed net-faces are stressed from 1842.7 to 1854 N.m-1 at 0.35 m.s-1.
In situ measurements on existing barrages in complex coastal environment could track geometries, stresses, lagoons hydrodynamic, forcings and catches behaviours. Direct observations of catches, rafts and barrages can be explored from observation satellite by revisit period at a given location. In laboratory, to refine hydrodynamic forcing, we could observe the internal mechanics in the catch and the boundary layer on its bottom. Wave action could also be taken into account. An optimization problem arises in the deployment of barrage in term of algae arrivals and nautical conditions forecasting.
Acknowledgments
We thank the fruitful exchanges at the origin of this work, with DEAL Martinique and mission sargasses, Direction de la Mer de la Martinique, and Parc Naturel Marin de Martinique.
References
- Chávez, V.; Uribe-Martínez, A.; Cuevas, E.; Rodríguez-Martínez, R.E.; van Tussenbroek, B.I.; Francisco, V.; Estévez, M.; Celis, L.B.; Monroy-Velázquez, L.V.; Leal-Bautista, R.; Álvarez-Filip, L.; García-Sánchez, M.; Masia, L.; Silva, R. Massive Influx of Pelagic Sargassum spp. on the Coasts of the Mexican Caribbean 2014–2020: Challenges and Opportunities. Water 2020, 12, 2908. [Google Scholar] [CrossRef]
- Swain, G.; Shinjo, N. Comparing biofouling control treatments for use on aquaculture nets. International Journal of Molecular Sciences 2014, 15, 22142–22154. [Google Scholar] [CrossRef] [PubMed]
- Resiere, D.; Valentino, R.; Nevière, R.; Banydeen, R.; Gueye, P.; Florentin, J.; Cabié, A.; Lebrun, T.; Mégarbane, B.; Guerrier, G.; Mehdaoui, H. Sargassum seaweed on Caribbean islands: an international public health concern. The Lancet 2018, 392, 2691. [Google Scholar] [CrossRef] [PubMed]
- Ody, A.; Thibaut, T.; Berline, L.; Changeux, T.; André, J.-M.; Chevalier, C.; et al. From In Situ to satellite observations of pelagic Sargassum distribution and aggregation in the Tropical North Atlantic Ocean. PLoS ONE 2019, 14, e0222584. [Google Scholar] [CrossRef] [PubMed]
- Schoop, H.; Taenzer, L.; Hornig, J. Wrinkling of nonlinear membranes. Computational Mechanics 2002, 29, 68–74. [Google Scholar] [CrossRef]
- Jenkins, C.H.; Leonard, J.W. Nonlinear dynamic response of membranes: State of the art. Appl. Mech. Rev. 1991, 44, 319–328. [Google Scholar] [CrossRef]
- Haug, E. Finite element analysis of nonlinear membrane structures. Proceedings of IASS Pacific Symposium Part II on Tension Structures and Space Frames; 1971; pp. 165–176. [Google Scholar]
- Priour, D. Calculation of net shapes by the finite element method with triangular elements. Communications in Numerical Methods in Engineering 1999, 15, 755–763. [Google Scholar] [CrossRef]
- Bletzinger, K.-U.; Ramm, E. Structural optimization and form finding of light weight structures. Computers & Structures 2001, 79, 2053–2062. [Google Scholar]
- Santo, H. On the application of current blockage model to steady drag force on fish net. Aquacultural Engineering 2022, 97, 102226. [Google Scholar] [CrossRef]
- Thierry, N.N.B.; Tang, H.; Achile, N.P.; Xu, L.; Hu, F.; You, X. Comparative study on the full-scale prediction performance of four trawl nets used in the coastal bottom trawl fishery by flume tank experimental investigation. Applied Ocean Research 2020, 95, 102022. [Google Scholar] [CrossRef]
- Iouzzi, N.; Ben Meftah, M.; Haffane, M.; et al. Modeling of the Fate and Behaviors of an Oil Spill in the Azemmour River Estuary in Morocco. Water 2023, 15, 1776. [Google Scholar] [CrossRef]
- Violeau, D.; Buvat, C.; Abed-Meraïm, K.; et al. Numerical modelling of boom and oil spill with SPH. Coastal engineering 2007, 54, 895–913. [Google Scholar] [CrossRef]
- Rajendran, S.; Vethamony, P.; Sadooni, F.N.; et al. Detection of Wakashio oil spill off Mauritius using Sentinel-1 and 2 data: Capability of sensors, image transformation methods and mapping. Environmental Pollution 2021, 274, 116618. [Google Scholar] [CrossRef] [PubMed]
- Putman, N.F.; Beyea, R.T.; Iporac, L.A.R.; et al. Improving satellite monitoring of coastal inundations of pelagic Sargassum algae with wind and citizen science data. Aquatic Botany 2023, 103672. [Google Scholar] [CrossRef]
- Amini, A.; Schleiss, A.J. Numerical modeling of oil-water multiphase flow contained by an oil spill barrier. Engineering Applications of Computational Fluid Mechanics 2009, 3, 207–219. [Google Scholar] [CrossRef]
- Muttin, F. Structural analysis of oil-spill containment booms in coastal and estuary waters. Applied ocean research 2008, 30, 107–112. [Google Scholar] [CrossRef]
- Pujos, M.; Gonzalez, J.L.; Pons, J.C. Circulation des eaux sur les plateaux insulaires de Martinique et Guadeloupe. In : Prost Marie-Thérèse (ed.). Evolution des littoraux de Guyane et de la zone caraïbe méridionale pendant le quaternaire. Paris: ORSTOM, 1992, p. 415-435. Symposium PICG 274/ORSTOM, Cayenne (GUF), 1990/11/09-14. ISBN 2-7099-1109-4.
- Tang, H.-J.; Yang, R.-Y.; Yao, H.-C. Experimental and numerical investigations of a mooring line failure of an aquaculture net cage subjected to currents. Ocean Engineering 2021, 238, 109707. [Google Scholar] [CrossRef]
- Chebbi, R. Profile of oil spill confined with floating boom. Chemical engineering science 2009, 64, 467–473. [Google Scholar] [CrossRef]
- Pichot, G.; Germain, G.; Priour, D. On the experimental study of the flow around a fishing net. European Journal of Mechanics-B/Fluids 2009, 28, 103–116. [Google Scholar] [CrossRef]
Figure 1.
Five drifting sargassum rafts αm before and after entrance through two narrow pass pcr in the coral reef near the Baie du Simon, and beached sargassum accumulation α- still on sea water at North of Pointe Cerisier – Martinique, from satellite images by CNES/Airbus and Google-Earth.
Figure 1.
Five drifting sargassum rafts αm before and after entrance through two narrow pass pcr in the coral reef near the Baie du Simon, and beached sargassum accumulation α- still on sea water at North of Pointe Cerisier – Martinique, from satellite images by CNES/Airbus and Google-Earth.
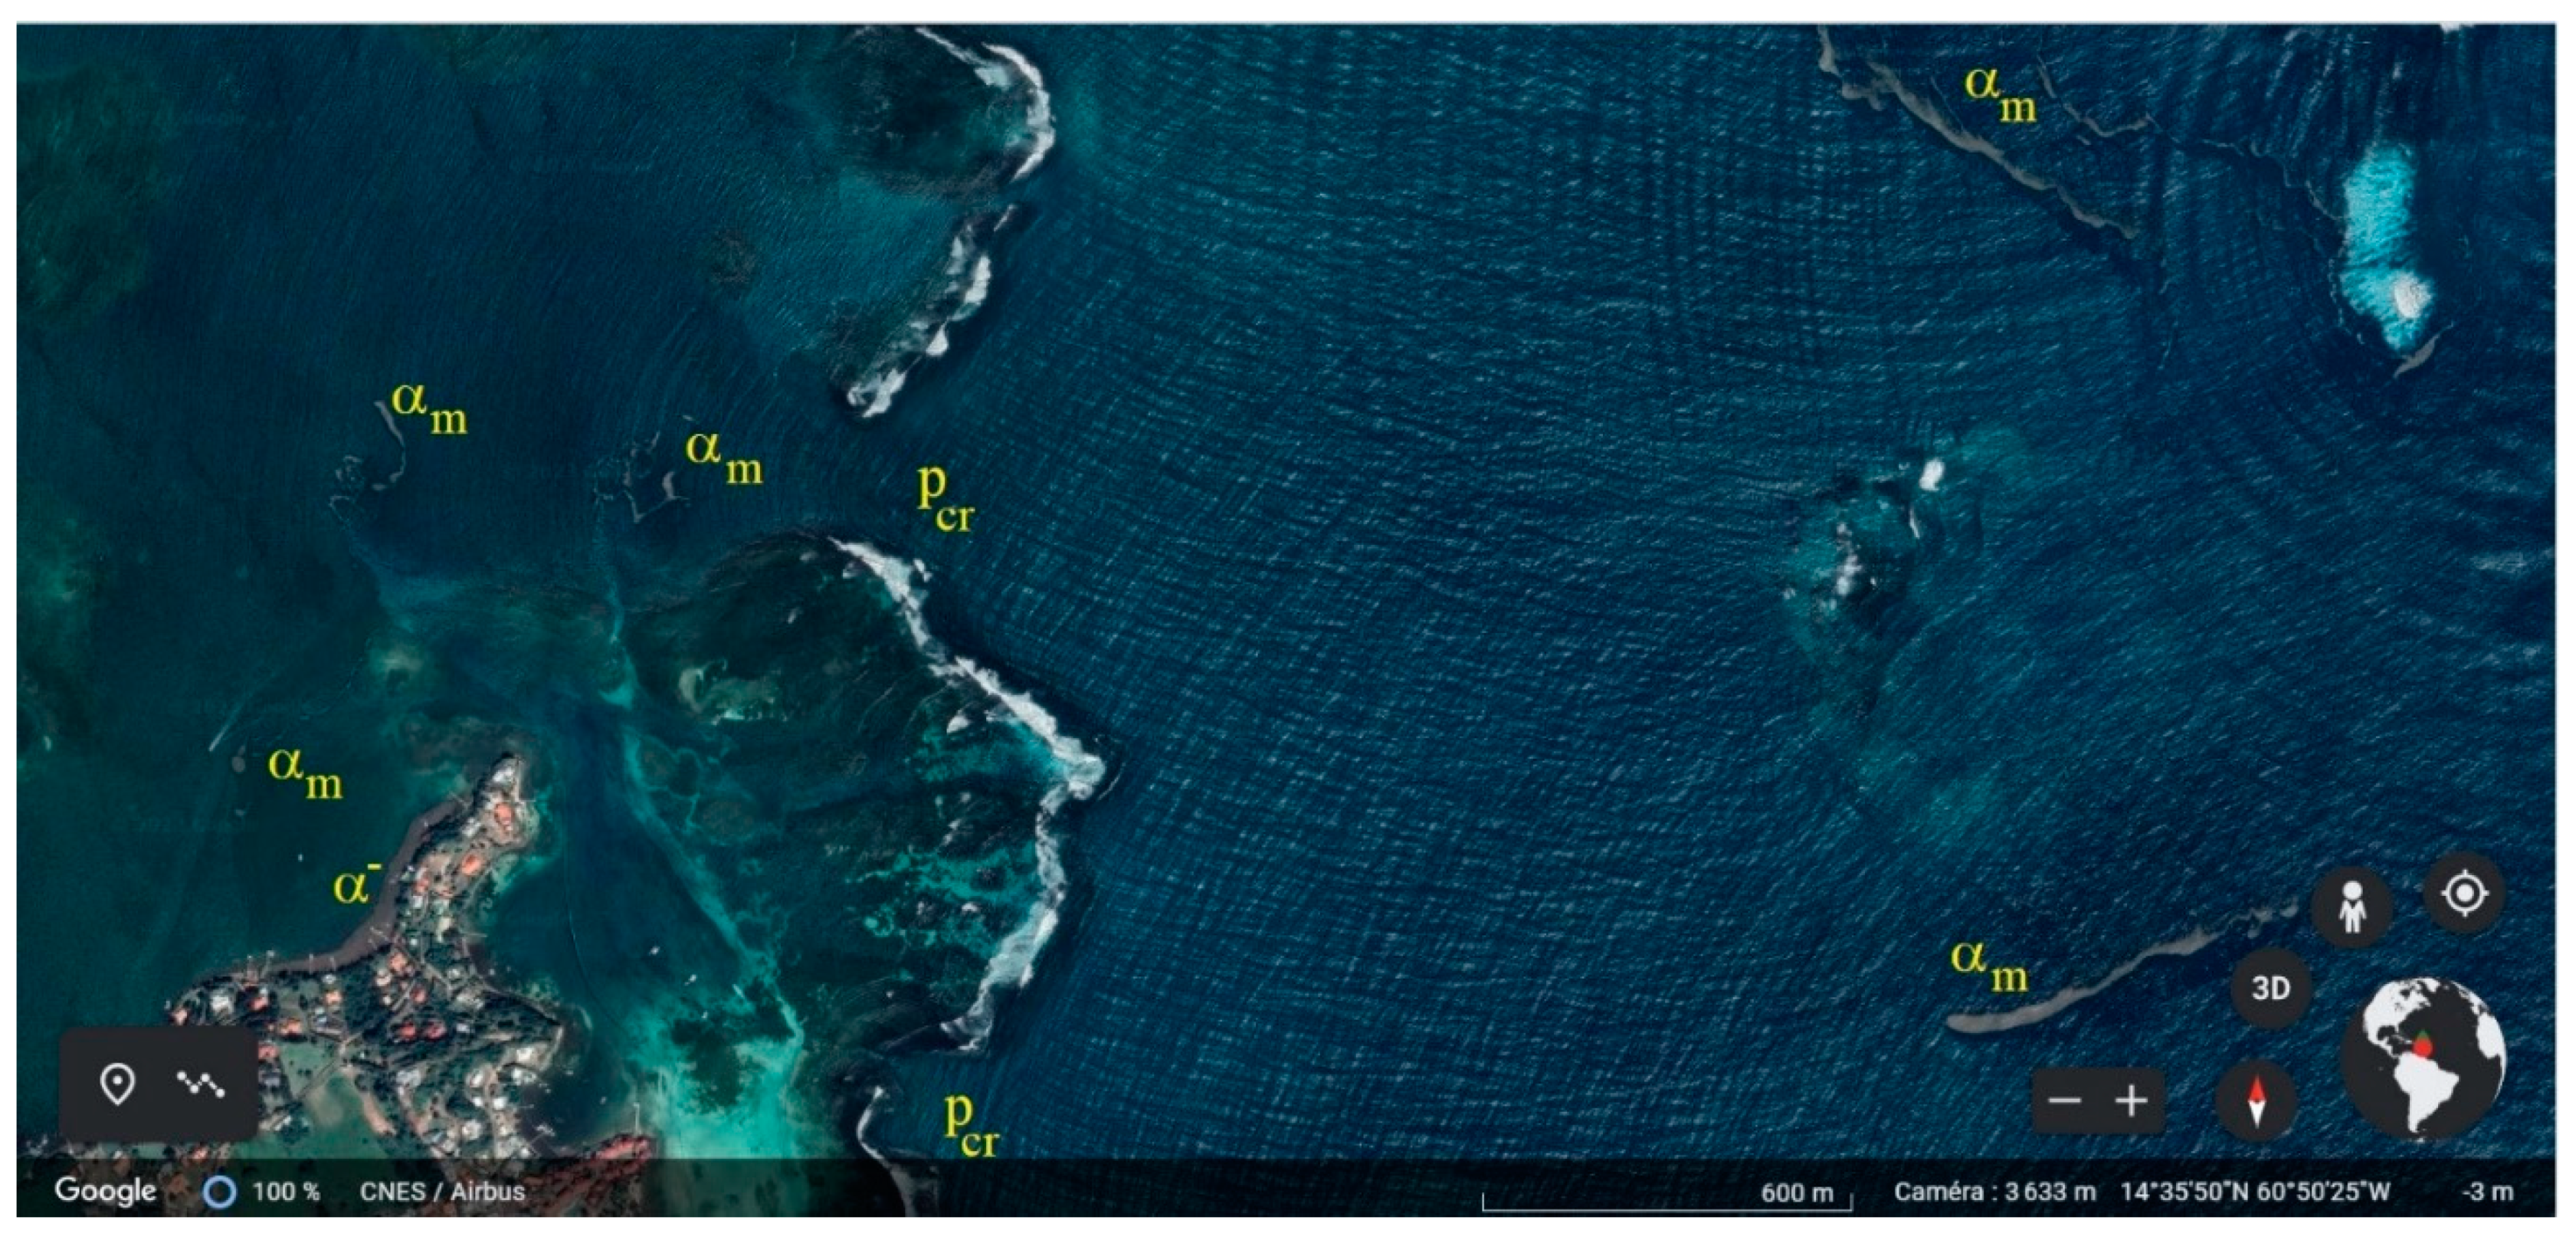
Figure 2.
Notations for the barrage surface ω, mooring device between ω and the head of the anchoring line sa, and different stages of algae rafts: moving and drifting αm, catch αc, beached on water α-, beached on land α+ and sunk αs.
Figure 2.
Notations for the barrage surface ω, mooring device between ω and the head of the anchoring line sa, and different stages of algae rafts: moving and drifting αm, catch αc, beached on water α-, beached on land α+ and sunk αs.
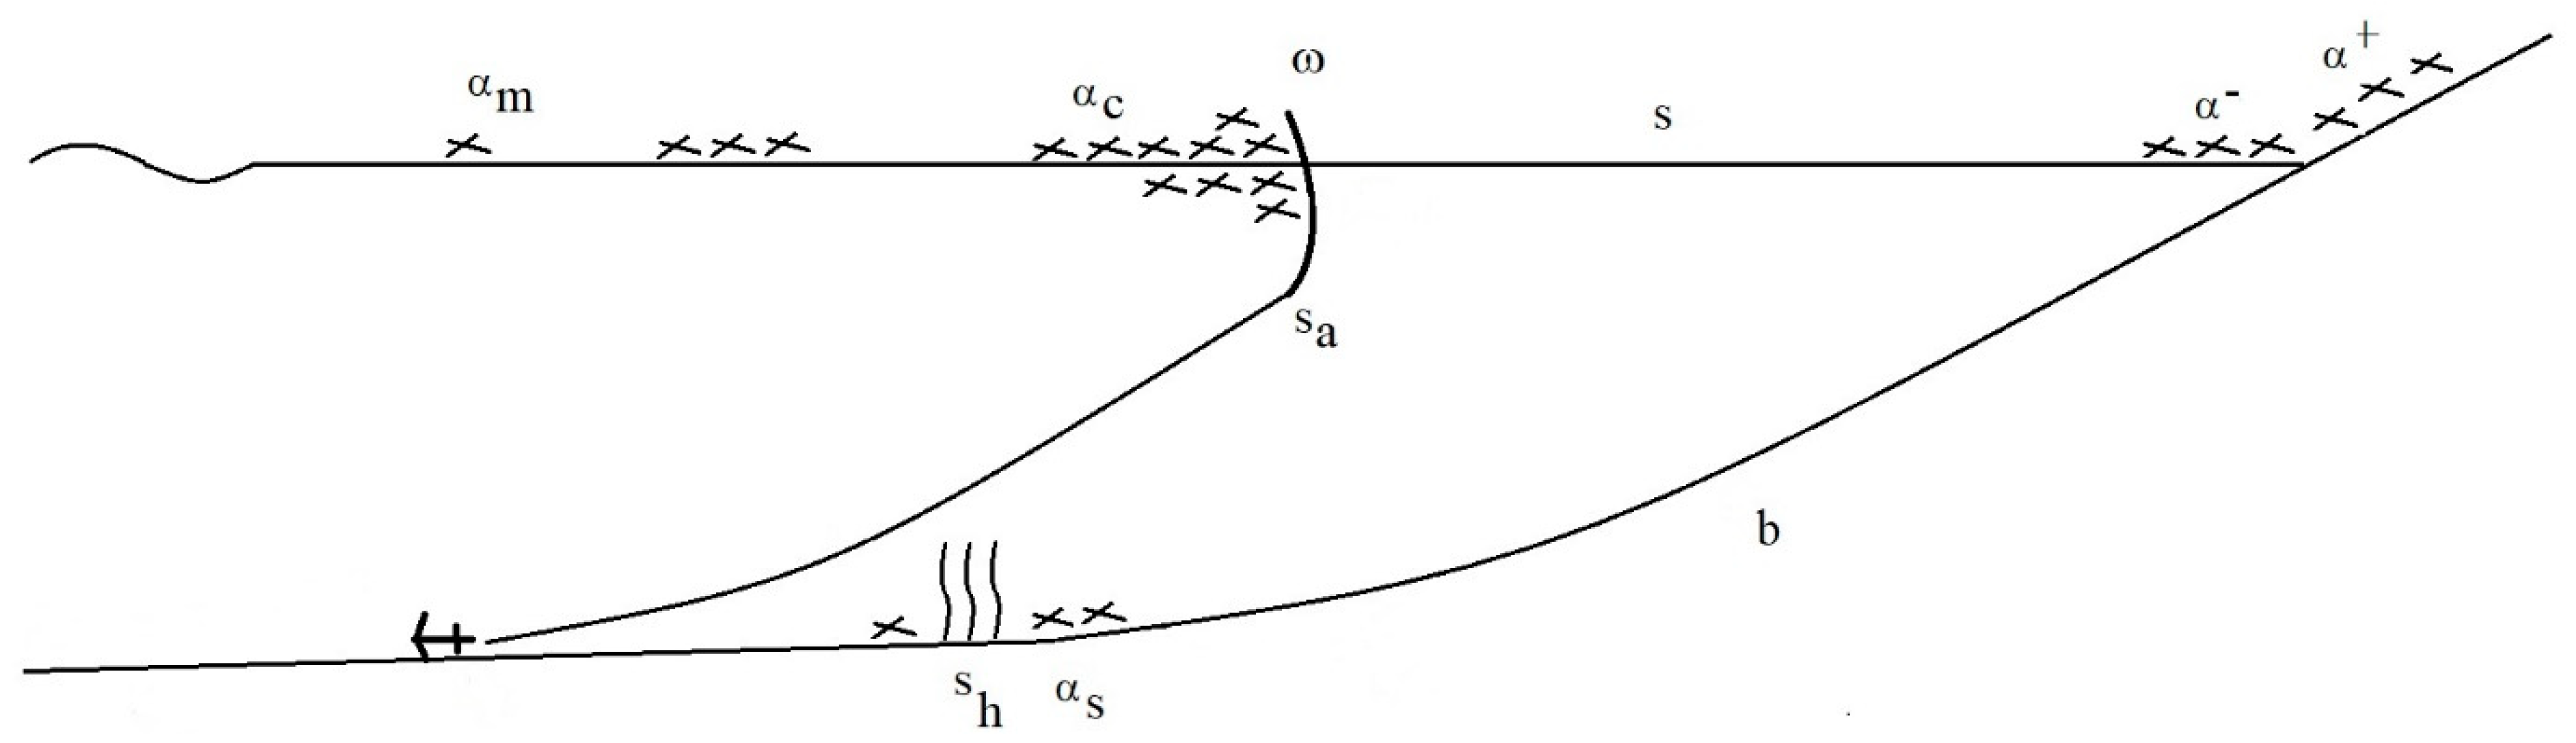
Figure 3.
Finite-element mesh, parabolic initial geometry, 158 nodes, N=156 elements, flattened cylinder with two cones folded at 90° giving the two mooring devices in the X-°longitudinal Y-°upstream and Z-°vertical axes.
Figure 3.
Finite-element mesh, parabolic initial geometry, 158 nodes, N=156 elements, flattened cylinder with two cones folded at 90° giving the two mooring devices in the X-°longitudinal Y-°upstream and Z-°vertical axes.
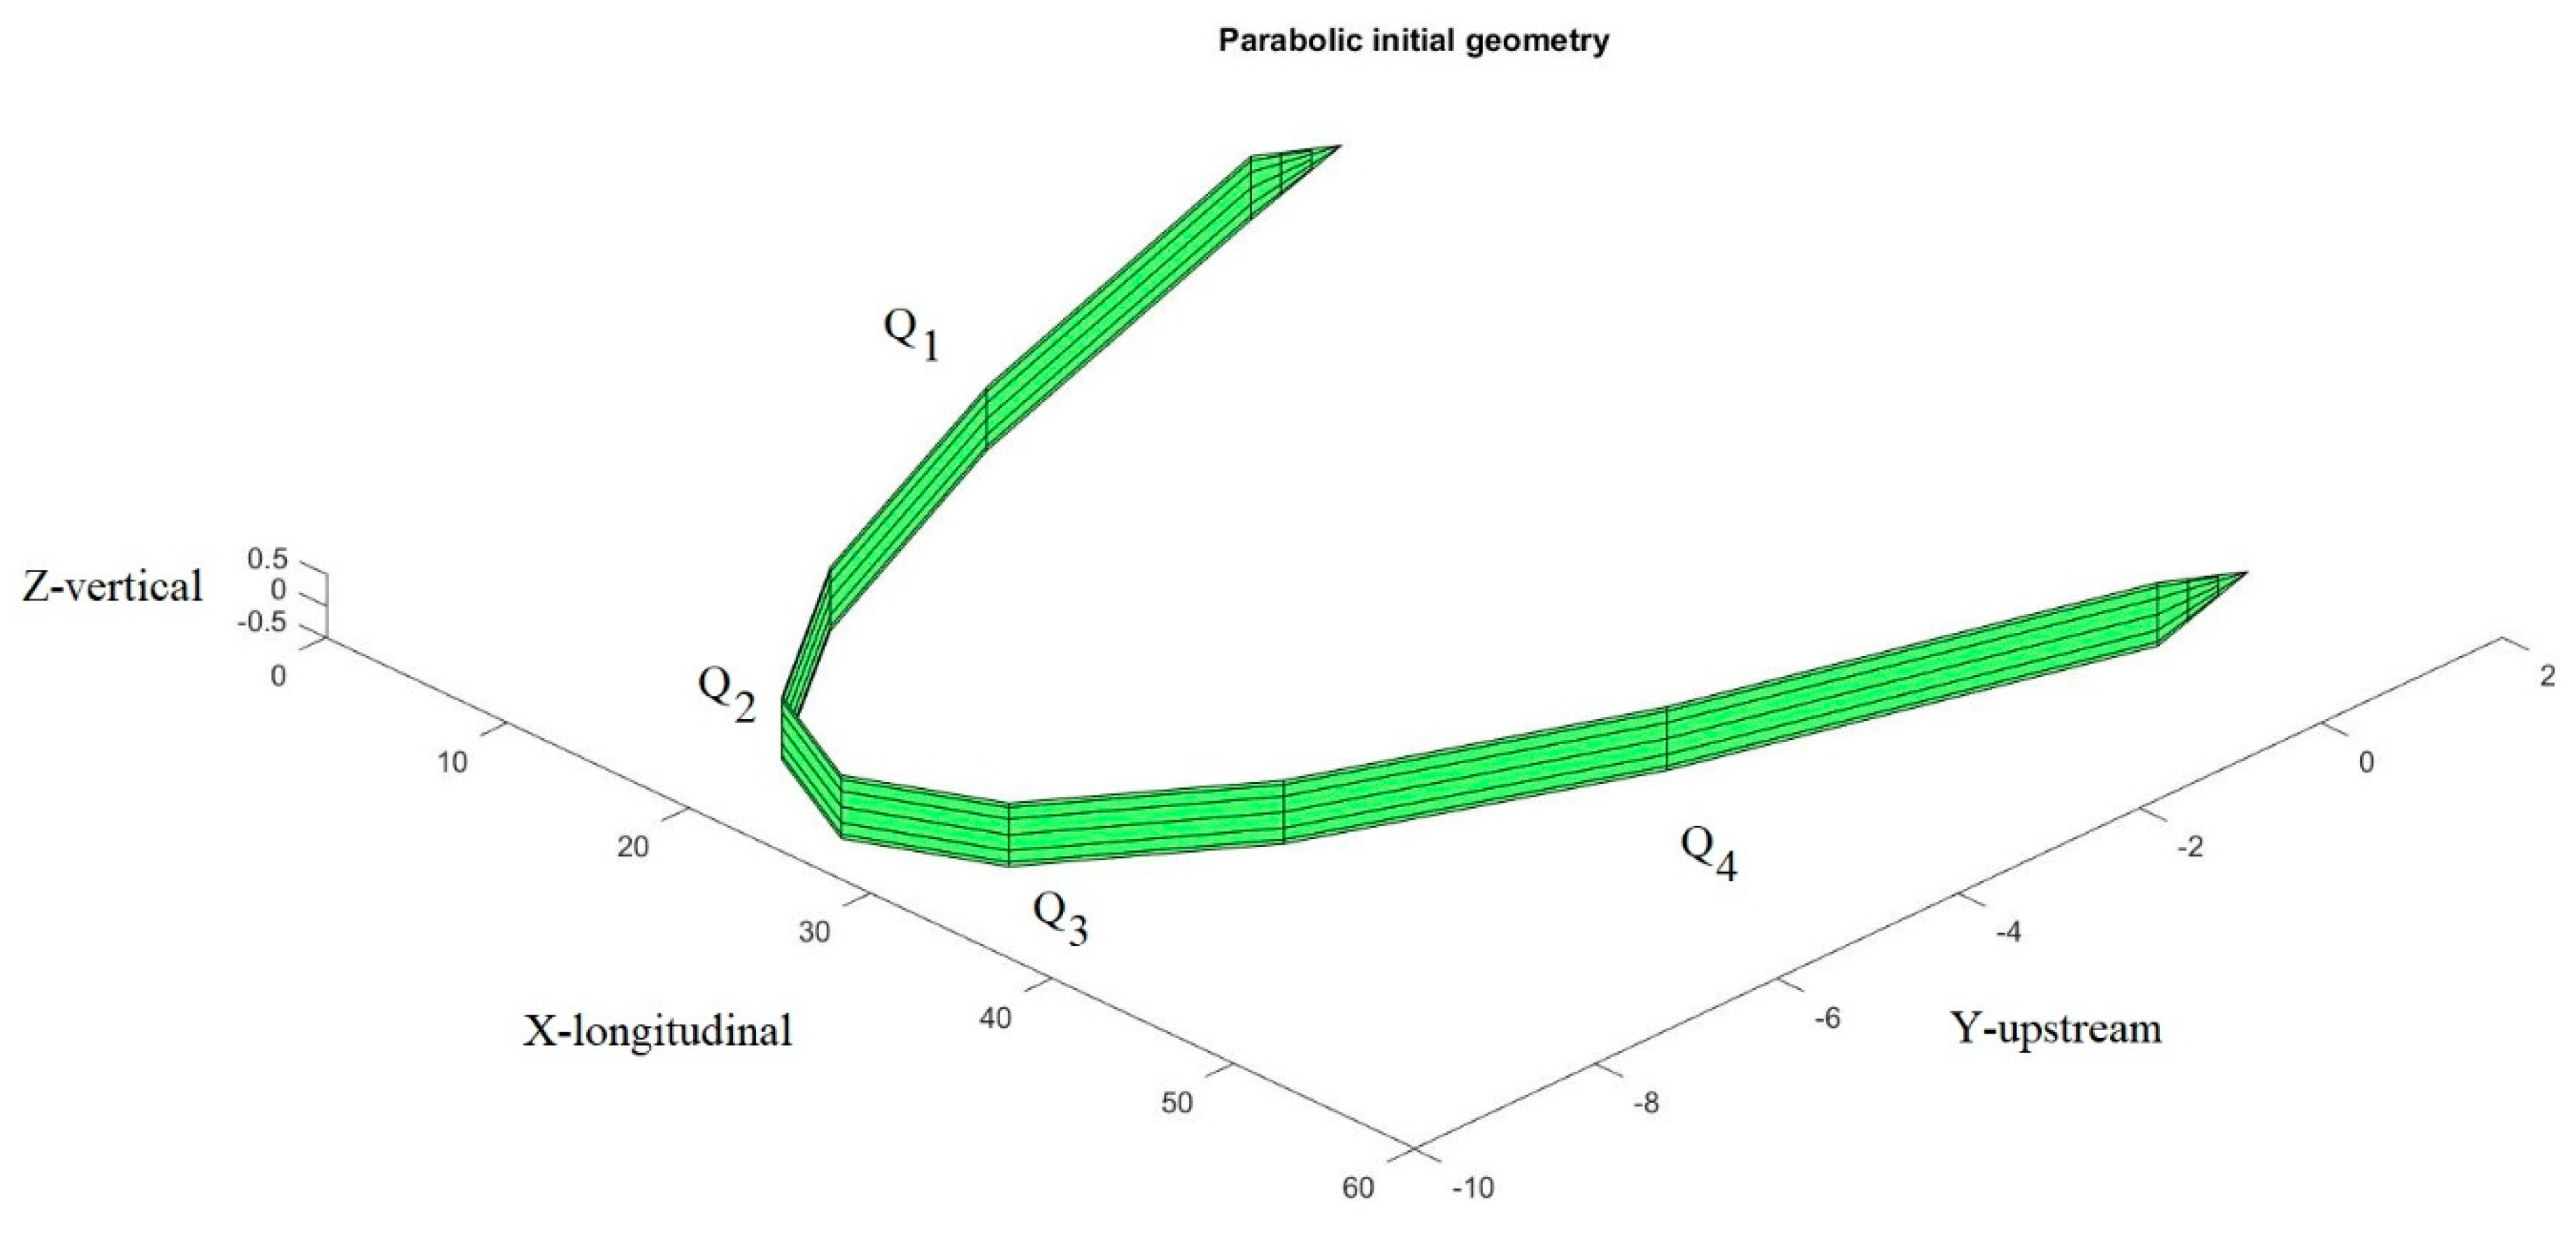
Figure 4.
Sargassum floating barrage ω moored at the South of Pointe Madeleine – Martinique in a lagoon closed by a coral reef on the right of the figure, containing an algae catch αc, and showing two mooring points sa at its South ends, two seagrass beds sh are shown on the right of the figure, from satellite images by CNES/Airbus and Google-Earth.
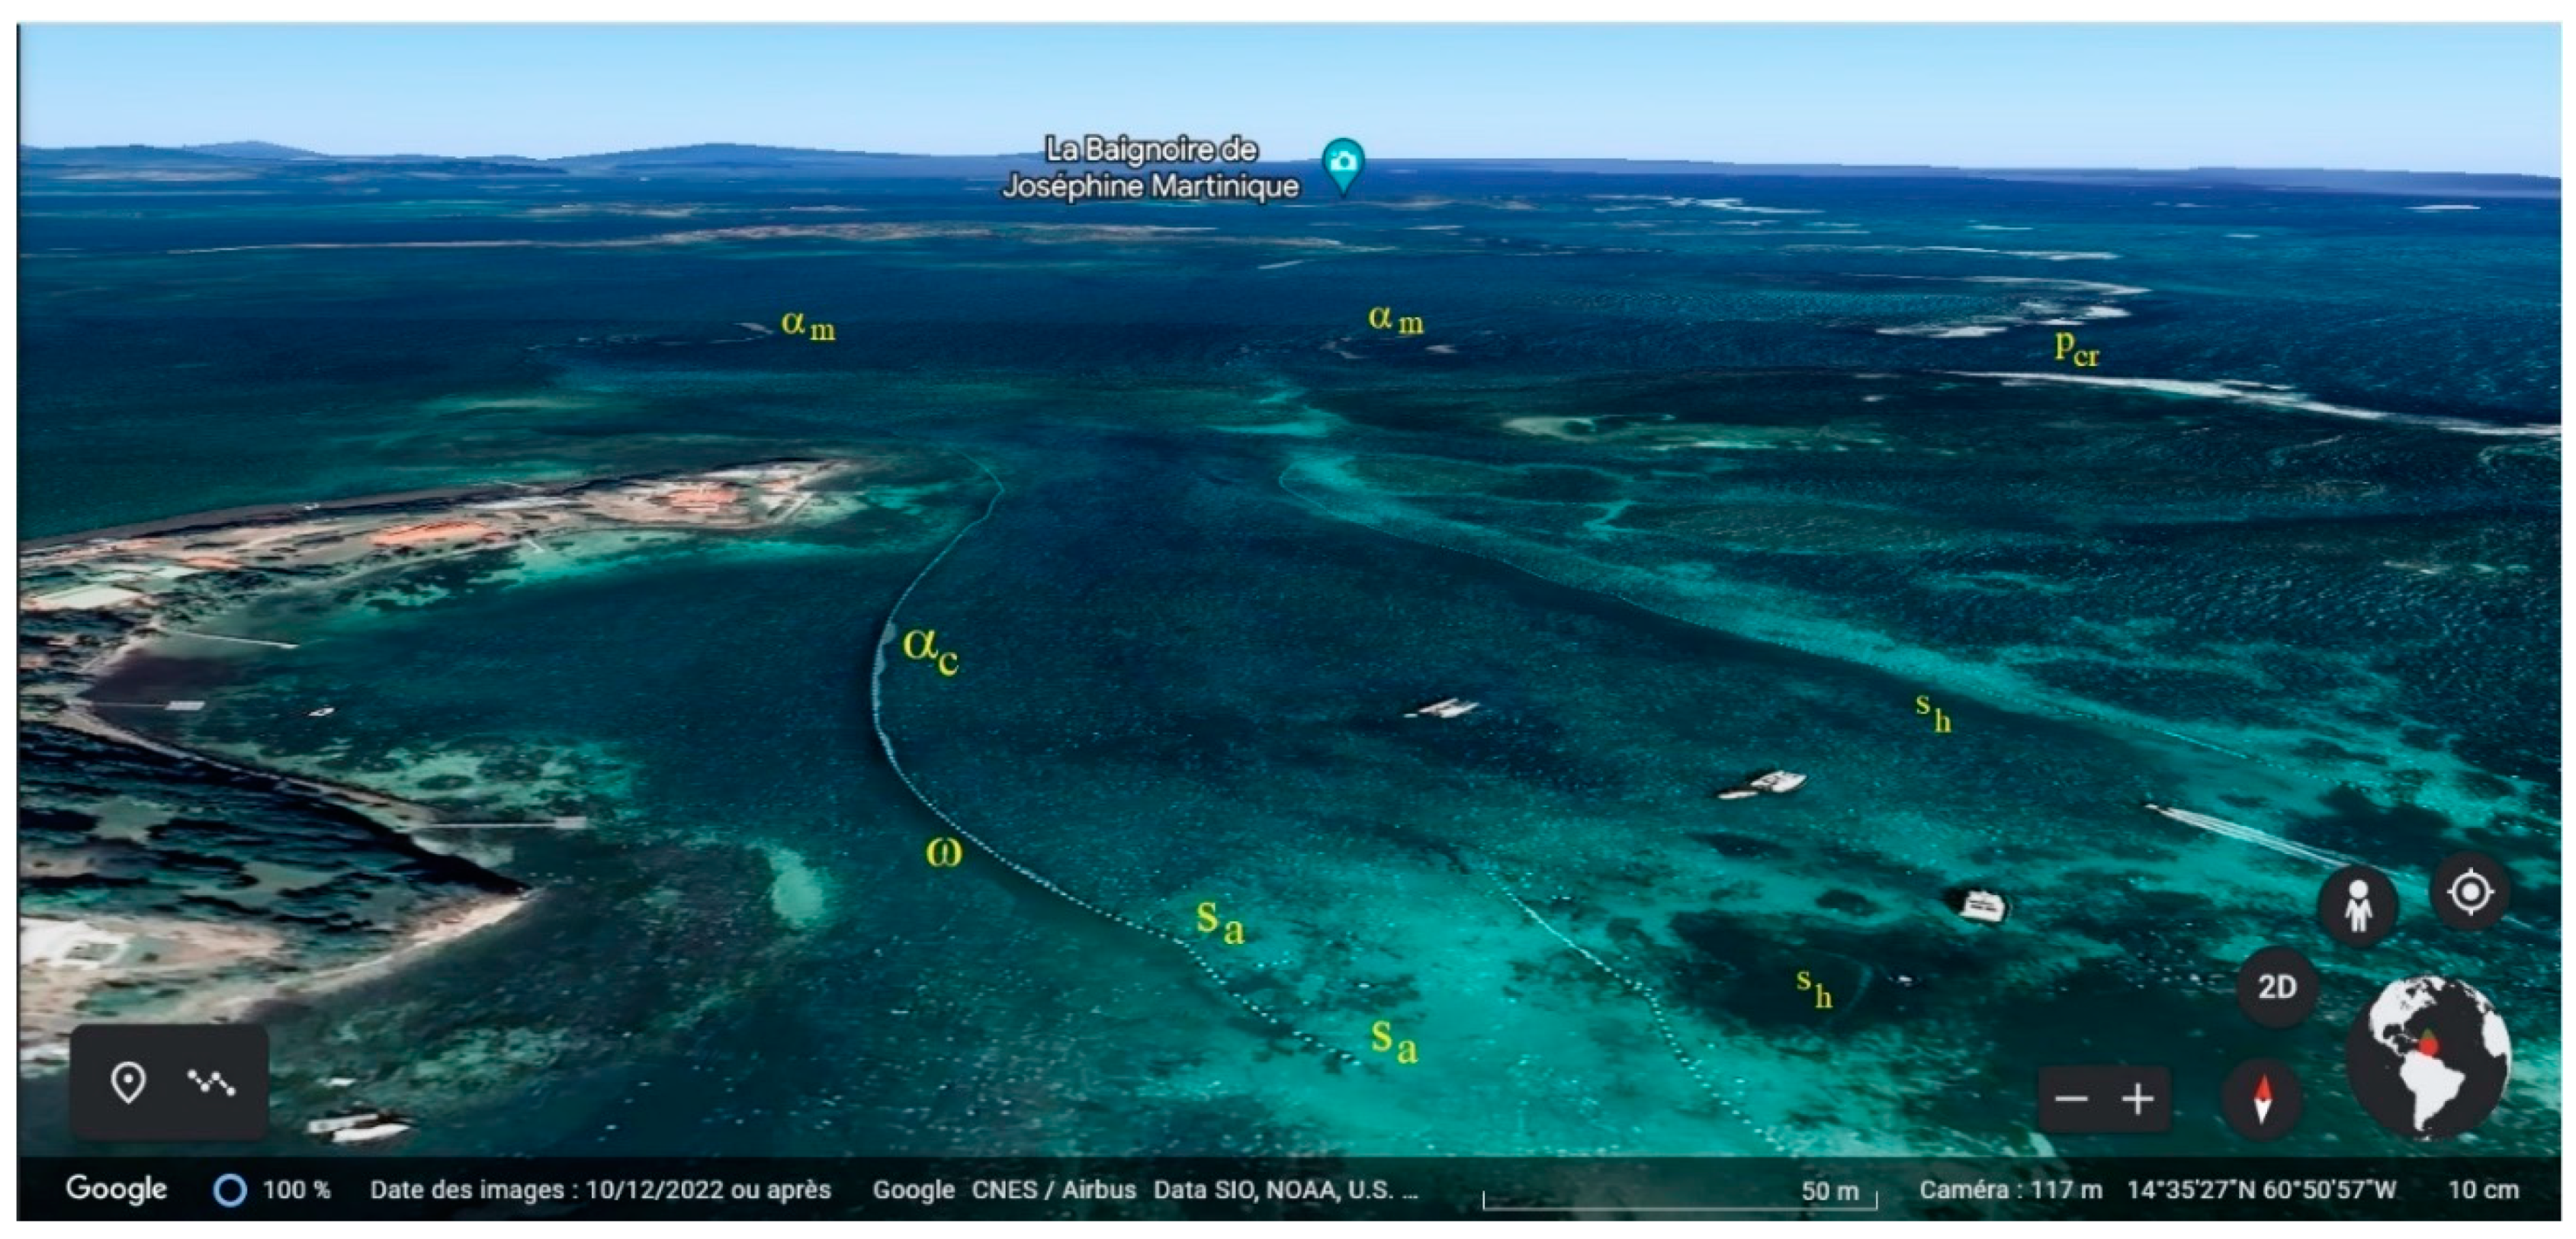
Figure 5.
Stressmap (N.m-1) in the barrage, velocity 0.35 m.s-1.
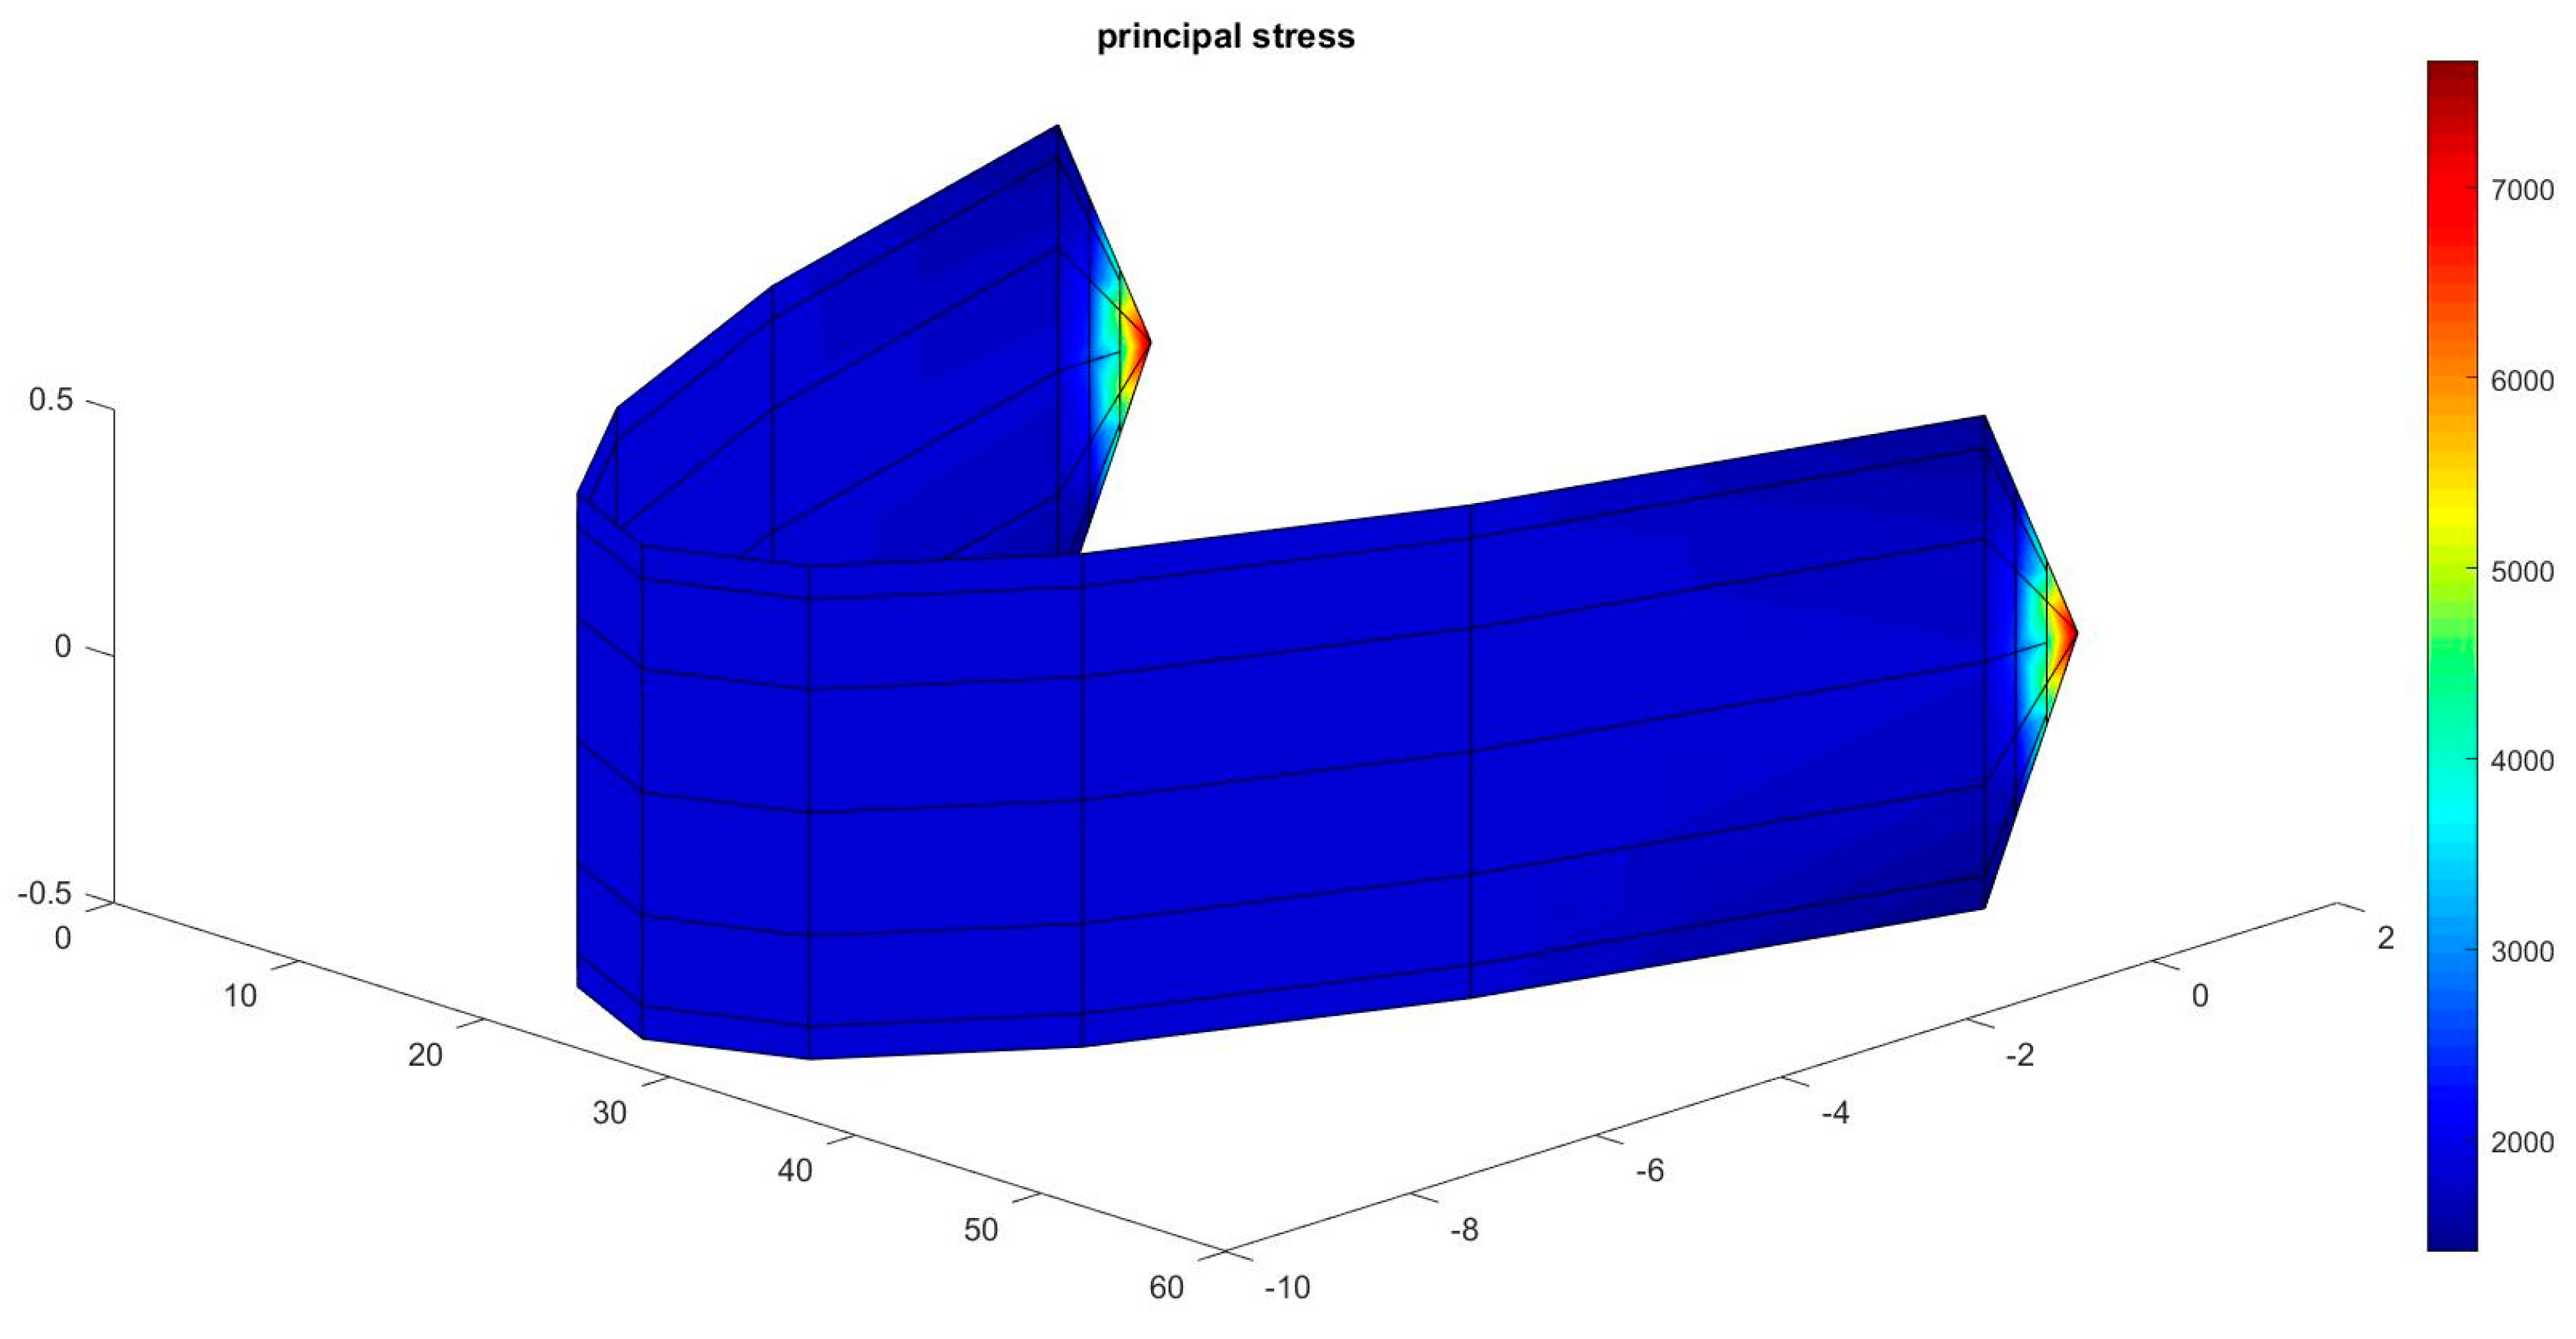

Table 1.
Barrage and hydrodynamic properties.
| Barrage | |||
| height | 1 | m | |
| cord lenght | 50 | m | |
| parabola width | 9.52 | m | |
| height mooring cone | 1 | m | |
| Young modulus by thickness | 1.e+6 | N.m-1 | |
| Poisson ratio | 0.3 | ||
| Hydrodynamic | |||
| volumic mass | 1025 | kg.m-3 | |
| drag coefficient | 1.65 | ||
| velocities | 0.05 & 0.35 | m.s-1 |
Table 2.
Equilibrium geometry and resulting forces giving reactions at five positions for two velocities.
Table 2.
Equilibrium geometry and resulting forces giving reactions at five positions for two velocities.
| Barrage Y-position on sea surface (m) | 0 | L/4 | L/2 | 3L/4 | L | |
| Initial | -7.14 | -9.52 | -7.14 | |||
| 0.05 m.s-1 | -7.17 | -9.38 | -7.17 | |||
| 0.35 m.s-1 | -7.25 | -9.49 | -7.25 | |||
| BZ buoyancy Z-vertical (N) | ||||||
| 0.05 m.s-1 | -0.6 | 0 | 0 | 0 | -0.6 | |
| 0.35 m.s-1 | -29.8 | -0.02 | 0 | -0.02 | -29.8 | |
| AY anchoring Y-upstream (N) | ||||||
| 0.05 m.s-1 | -48.8 | -48.8 | ||||
| 0.35 m.s-1 | -2387.2 | -2387.2 | ||||
| TX tension X-longitudinal (N) | ||||||
| 0.05 m.s-1 | 58.95 | -58.95 | ||||
| 0.35 m.s-1 | 2842.0 | -2842.0 |
Table 3.
Hydrodynamic pressure (N.m-2) and Principal stress mean (N.m-1) in a central and vertical band of finite-elements, elements n°67 to 78 on Q2 neighbouring Q3, for the uniform pressure and two vertically non-uniform pressures: transfer on the half-upper part from the deepest half-part, transfer from bottom of the upper half to the “top band”. The right column indicates the initial element heights (m) on this central and vertical band of finite-elements.
| Uniform pressure | Half-upper part | Top band | Initial height | |||
| Pressure | Stress | Pressure | Stress | Pressure | Stress | |
| -51.5616 | 1849.7 | -103.1232 | 2006.9 | 0 | 969.9376 | 0.183 |
| -51.5616 | 1849.7 | -103.1232 | 2017.5 | -309.3695 | 944.9682 | 0.067 |
| 51.5616 | 1849.7 | 103.1232 | 2017.4 | 309.3695 | 940.6419 | 0.067 |
| 51.5616 | 1849.7 | 103.1232 | 2006.9 | 0 | 966.0305 | 0.183 |
| 51.5616 | 1849.7 | 103.1232 | 1976.8 | 0 | 831.1845 | 0.25 |
| 51.5616 | 1849.7 | 0 | 1853.1 | 0 | 721.1583 | 0.25 |
| 51.5616 | 1849.7 | 0 | 1713.9 | 0 | 667.0879 | 0.183 |
| 51.5616 | 1849.7 | 0 | 1680.7 | 0 | 654.2728 | 0.067 |
| -51.5616 | 1849.7 | 0 | 1680.7 | 0 | 657.9784 | 0.067 |
| -51.5616 | 1849.7 | 0 | 1713.9 | 0 | 671.0823 | 0.183 |
| -51.5616 | 1849.7 | 0 | 1853.1 | 0 | 725.4754 | 0.25 |
| -51.5616 | 1849.7 | -103.1232 | 1976.8 | 0 | 835.4869 | 0.25 |
Table 4.
Z-vertical buoyancy force (N) along the floating line nodes for a uniform vertical pressure, a pressure transfer to the half-upper part and a pressure transfer to the “top band” finite-elements.
Table 4.
Z-vertical buoyancy force (N) along the floating line nodes for a uniform vertical pressure, a pressure transfer to the half-upper part and a pressure transfer to the “top band” finite-elements.
| BZ buoyancy Z-vertical (N) | 0 | L/4 | L/2 | 3L/4 | L | ||||
| Uniform | -29.81 | 5.49 | -0.02 | 0.0 | 0.0 | 0.0 | -0.02 | 5.49 | -29.81 |
| Half-upper | 153.61 | -144.9 | -7.88 | -7.64 | -7.79 | -7.64 | -7.88 | -144.9 | 153.61 |
| Top band | 123.23 | -108.92 | -2.74 | -2.45 | -2.53 | -2.45 | -2.74 | -108.92 | 123.23 |
Table 5.
Z-vertical buoyancy force (N) along the floating line nodes for a uniform, Heaviside and Triangular horizontal pressure densities considered along each vertical finite-element bands.
Table 5.
Z-vertical buoyancy force (N) along the floating line nodes for a uniform, Heaviside and Triangular horizontal pressure densities considered along each vertical finite-element bands.
| BZ buoyancy Z-vertical (N) | 0 | L/4 | L/2 | 3L/4 | L | ||||
| Uniform | -29.81 | 5.49 | -0.02 | 0.0 | 0.0 | 0.0 | -0.02 | 5.49 | -29.81 |
| Heaviside | -80.97 | -49.16 | -63.19 | -49.58 | -13.22 | -49.58 | -63.19 | -49.16 | -80.97 |
| Triangular | -35.72 | 7.21 | -0.11 | 0.01 | 0.0 | 0.01 | -0.11 | 7.21 | -35.72 |
Disclaimer/Publisher’s Note: The statements, opinions and data contained in all publications are solely those of the individual author(s) and contributor(s) and not of MDPI and/or the editor(s). MDPI and/or the editor(s) disclaim responsibility for any injury to people or property resulting from any ideas, methods, instructions or products referred to in the content. |
© 2023 by the authors. Licensee MDPI, Basel, Switzerland. This article is an open access article distributed under the terms and conditions of the Creative Commons Attribution (CC BY) license (http://creativecommons.org/licenses/by/4.0/).
Copyright: This open access article is published under a Creative Commons CC BY 4.0 license, which permit the free download, distribution, and reuse, provided that the author and preprint are cited in any reuse.


