
Submitted:
06 September 2023
Posted:
08 September 2023
Read the latest preprint version here
Abstract
In recent years, Vehicular Ad-hoc Networks (VANETs) have become a popular subject of research due to their ability to enhance safety and improve travel comfort. However, VANETs relies on wireless technology for safety messaging exchange, jamming detection and recovery strategies. This dependence on receiving these metrics can lead to security threats that are either unique to VANETs or observed in ad-hoc networks, resulting in significant challenges in Dedicated Short-Range Communication (DSRC). To address these challenges, this paper proposes a novel recovery strategy for detecting jammers in Dedicated Short-Range Communication (DSRC) within VANETs. The proposed model contains algorithms that can detect deceptive jammers and switch the Safety Application to a fail-safe mode. Additionally, the paper introduces a recovery strategy to facilitate faster transitioning of the Safety Applications from fail-safe mode to an operational mode, thereby minimizing the impact of jamming. This recovery strategy dynamically adjusts message rates in situations where communication anomalies, such as jamming, are detected. The experimental results indicate that this recovery strategy helps Safety Applications transition to be more efficient and reliable compared to earlier operational models in the literature.
Keywords:
vehicular networks
; jammer recovery
; DSRC
; VANET
1. Introduction
Lately, A vehicular ad hoc network or (VANET), received a lot of attention for its futuristic potential innovation that enables of groups of moving or stationary vehicles and other devices to connect to each other’s via wireless network to create a smart service environment for these vehicles to reduce accidents and help managing these vehicles while in operation or static. Dedicated short-range communications also known as (DSRC) is a technology for direct wireless exchange of vehicles and other intelligent transportation systems (ITS) data. The other intelligent transportation systems may include toll ways, other vehicles, traffic signals, etc.
Since VANET is a type of wireless network, it is subject to the same attacks and threats that any wireless network encounters. One of the most popular attacks that this network encounters is jamming attack. A jamming attack is the transmission of radio signals (RF) that disrupt communications by decreasing the SINR or the Signal to Interference plus Noise ratio. SINR also can be calculated by determining the ratio of the signal power to the sum of the interference power.
This study proposes a new algorithmic program model for detecting electronic jamming in DSRC wireless technology safety applications for VANET. The model optimizes reliability by using jamming detection behavior to transition to fail-safe mode without changing existing protocols. The study investigates the impact of deceptive jam rates and the jammer's data rate on VANETs using actual area measurements. The results show that the jam detection algorithmic rule using field information enables a wide range of applications that could reduce traffic accidents, enhance mobility, and improve fuel efficiency. However, there are inherent challenges in VANETs, such as security and reliability that need to be addressed. To ensure the security of VANET communications and applications, the paper presents a recovery algorithm that dynamically adjusts message rates, power levels, and data rates in situations where communication anomalies like jamming are detected. The recovery strategy helps Safety Applications transition from fail-safe mode to operational mode earlier. The paper also discusses the impact of message rates, power levels, and data rates on reliability and channel efficiency, showing the effect of increased safety message rates on channel performance. Finally, the paper addresses the issue of electronic jamming in wireless communication, which is a popular attack that can disrupt legitimate transmission by emitting radio waves that interfere with communication. The study characterizes different types of jammers, from constant jammers to intelligent jammers that are protocol-aware and presents a recovery algorithm that addresses the issue of electronic jamming.
2. Related Work
To overcome the impact of jamming, an approach of message and channel redundancy has been demonstrated in [7,8] for the case of constant, random and intelligent jamming. This approach implies using alternative messages, namely the À la Carte (ACM) and Probe Vehicle Data (PVD) to deliver safety related data using redundant channels. These messages were defined in SAE J2735 [9] and they facilitate Basic Safety Message (BSM) functional redundancy, i.e., communicating the BSM-relevant data on any service channel. In addition, these messages can be used along with the BSMs in a dual and triple redundancy scheme.
The redundant channels were carefully selected to ensure wide separation in the frequency spectrum. While this approach was shown to be effective, using redundancy imposes extra overhead/usage of the dedicated limited bandwidth, which is intended to be used by multiple DSRC applications. Furthermore, Serageldin [8] has not dealt with the challenges such as MAC layer efficiency, the channel congestion as fail-safe operation of the security Applications.
A solution for VANET based on coefficient of correlation that is activity accordant for Between periods of error and therefore the correct of reception times, Hamieh projected [10]. The method solely depend upon reactive electronic jamming attacked and the transmitter transmits solely once sensing legitimate space activity that The approach is barely uses the Error chance like a metric, that isn't enough to incorporate electronic jamming [11] and the Jamming electronic in platoons is addressed on [12], The method alone rely on reactive ECM attacked and the transmitter transmits alone once sensing legitimate area activity that The approach is barely uses the Error likelihood sort of a metric, that may not enough to include ECM [13] which gift an answer to notice electronic jamming by depend upon the packed delivery magnitude relation PDR and its rate of fixing . However, supported packed delivery magnitude relation PDR alone is not enough with the amendment of PDR it is often a resolve factors than alternative electronic jamming like poor link quality as a result of the massive of distance between the sender and also the receiver.
Pereira [14] have argue that the detection ways rely upon the metrics such like (RSSI) Received Signal Strength Indicator that relative position packed delivery quantitative relation PDR may be reveal of presence the jam as way as their messages have been received. this metric could it not be accessible and there for jam electronic measures |ECM} detection methods that dependence on receiving this metric could as merely fail and to counter for this effective therefore in our propose answer it uses a path prediction to seem future locations prediction by exploitation the messages received before build coming into a jamming space.
In [15], Prove that continuous and periodic electronic jamming and reaction detective which might cowl to sure zone that would result in temporary and vanishes as cars traverse through the infested zone region. Once the electronic jamming affects reach to sure thresholds thus, the communication isn't any longer chance. This might imply that jamming electronic measures ECM detection applications won't happen any longer once within the sure jamming thresholds that exceeded. But crucial to own economical electronic jamming detection, like electronic jamming state thus, this may make it attainable to modify the security Application to maneuver to a fail-safe state. As an alternative, a lot of refined state model could also be permitting in several states, rely upon the severity or attainable result of electronic jamming, as considering the criticality for the security Applications. The answer for VANET relies on the Correlation of constant that activity dependence among several amounts of the error and proper reception in period times, that projected in [16].
This methodology considers the reactive ECM that the transmitter transmits when sensing legitimate o activity. The approach uses solely the Error likelihood as a metrics, that's not enough to conclude ECM [17]. jamming within the units is proposed in [18], which an easy formula model for in period detection in VANET rely on supposed beacons is given. As well as this approach is for specific cases of platoons of cars solely. The authors in [19] present an answer to notice the ECM depend upon the packed delivery quantitative relation PDR and the rates of fixing that it bases on PDR alone isn't enough as modification in packed PDR that may be resolve of things in others than jamming, and the poor link quality thanks to giant distance between receiver and sender [6]. In [14] argued that detection electronic jamming ways base on metrics such like (RSSI) Received Signal Strength Indicator are relative positions furthermore as PDR, might reveal of the presence electronic jamming as way as their messages that being received. So, once the PDR drops to 1/3 this metric might not be longer be obtainable and there the electronic jamming detection ways base on receiving this metric it's going to be merely fail. On the other hand, solutions for Broadcast Base Safety Message BSM Through VANET Based on Transmit Packet Coding (TPC) was introduced in [35] and IDS or intrusion detection system classifier for VANET introduced in [14] and [36] with a brief explanation and did not covered Jamming attack thoroughly.
3. Classification of Jamming Attacks
There are many classifications of interference attacks on Ad Hoc networks, among which the classifications recognized by many researchers are as follows [4]:
- Constant jamming: Constant jamming is an interference attack where an attacker continuously transmits a random radio signal on the communication channel, without following the MAC protocol. As a result, legitimate users perceive the channel to be busy even when it is not.
- Deceptive jamming: Discusses deceptive ECM attacks and contrasts them with persistent ECM attacks. It states that deceptive ECM attackers do not send random bit streams but instead send semi-efficient knowledge packets. The paragraph implies that the information header of these packets is valid, but the payload is useless. It goes on to suggest that these attacks may keep the channels perceived by legitimate users busy all the time, making it difficult for legitimate users to communicate properly. The language used is generally clear and concise, but there are some areas where the meaning is unclear, or the wording could be improved for clarity. For example, the phrase "underneath constant police investigation" is unclear and could be revised to improve clarity. Additionally, the sentence "This makes legitimate users unable to enter. Communicate wrongfully." is unclear and could be rewritten to more clearly express the intended meaning.
- Random jamming: This type of attack consumes less power than the previous two types of attackers. Random jamming attacks operate by carrying out jamming attacks for a specific period (attack mode) and then stopping the jamming at another period (sleep mode). The amount of power lost due to the attack is determined by the ratio of the attack period to the sleep period. “Overall, the paragraph provides a good explanation of random jamming attacks and their power consumption characteristics.
- Reactive jamming: This type of jamming attack is triggered by the attacker only when they detect communication transmission in the network. The attacker does not expend resources other than jamming, and their focus is on jamming the receiving node rather than the signal transmitting node. In vehicular networks, the primary method of jamming attack is through the transmission of high-power interference signals by nodes. This action submerges the genuine communication signals in the interference signals, causing the receiving nodes to lose or significantly reduce their ability to receive signals. Such an attack is an example of a blocking active interference attack.
4. Jamming Detection and Description Scenario
4.1. Predication Location
Figure 1 supports the assumption that each vehicle equipped with an On-Board Unit (OBU) occupies one lane under normal operating conditions without electronic jamming. At time t, the Host Vehicle (HV) receives a Basic Safety Message (BSM) from the Remote Vehicle (RV) containing information such as vehicle ID, location, type, heading, speed, and acceleration. The HV generates the same set of information about its own status. Using this information, the HV can calculate the current distance (Distance (t)) between the two vehicles and the Packet Delivery Ratio (PDR) at time t (PDR (t)), as shown in Figure 1a. As time passes, the vehicles move, and new BSMs from the RV provide updated information on its actual movement. The HV can use this information to predict the future distance between the two vehicles and the corresponding PDR values at time t+Δt, as shown in Figure 1b. As time passes, the two vehicles will move to different locations, as depicted in Figure 1c. Consequently, new Basic Safety Messages (BSMs) will be transmitted from the Reference Vehicle (RV) to indicate the actual movement. By comparing the estimated values with the actual values derived from these BSMs, any inconsistencies can be identified, indicating abnormal behavior.
4.2. PDR Evaluation
The Packet Delivery Ratio (PDR) is analyzed as a secondary metric for consistency checks. In order to simplify the process, a line-of-sight link budget is utilized for estimating the link quality. The main factor that causes losses in the signal is the free space path loss.
FSPLdB represents the free space path loss in decibels, while d represents the distance between the receiver and transmitter in meters, f represents the frequency of the channel in hertz, and c represents the speed of light [20]. The received power can be expressed as the difference between the gains and losses.
PRX = PTX + GTX + GRX − FSPLdB
The received power is denoted by P_RX in dBm, while PTX represents the transmitter output power in dBm, GTX represents the transmitter antenna gain in dBi, and GRX represents the receiving antenna gain in dBi [20]. To calculate the ratio of signal-to-noise, we can use the following equation:
SNR = (P_RX - PTX + GTX + GRX) - N
So, the calculate ratio of signal-to-noise can be represent by
The signal-to-noise ratio (SNR) for signal r in dB is denoted as SNR_db, while P_noise represents the power of the noise in dB. DSRC uses Phase Shift Keying (PSK), which enables the calculation of energy per bit and the Bit Error Rate (BER) at both 3 Mbps and 6 Mbps. The equation for this is shown below:
BER = 0.5 * erfc(sqrt(0.5 * (Eb/N0)))
Where Eb/N0 represents the energy per bit to noise power spectral density ratio.
The energy per bit to the noise power spectral density ratio is represented as Eb/N0, where B is the channel capacity bandwidth in Hz, and R represents the data rate in bits per second [20]. The Bit Error Rate (BER) can be calculated as follows:
Where N is length of the packed in bits and the PDR follows directly from the Pp.
5. Model Designed to Detect Jamming Attacks on VANETs
To describe the operation of a jamming attack detection model, shown in Figure 2, in a VANET from the perspective of the Host Vehicle (HV). The algorithm model is triggered at time t if no BSM messages have been received during a time interval of Δt. When a BSM message is received within this interval, the status of the Remote Vehicle (RV) is updated with details such as the RV's location, speed, heading, and distance from the HV. The Packet Delivery Ratio (PDR) is also calculated based on the predicted packet rate of BSM, which is assumed to be 100ms. The PDR indicates the fraction of BSMs received during the designated time interval. If the flag value is not 1, the algorithm model has received its first BSM packet from the RV, and it will predict future distance (t+Δt) and PDR (t+Δt). The current time t is replaced, and the flag status is set to 1, indicating the RV's existence. The algorithm model continues to wait for additional BSM messages. The algorithm utilizes a flag, initially set to flag=0, to determine its current state. When a new BSM message is received, the flag information is updated, and the expected status becomes available. Once the flag is set to 1, the algorithm compares the current distance between the HV and RV with the distance calculated from the prediction status. If these distances are inconsistent, it may indicate that the GPS is malfunctioning or that the information was injected, and the system enters a fail-safe application mode. In Figure 2, the consistency check is calculated by taking the absolute value of the difference between Distance(t) and Distance(t+Δt), where Distance(t) is the distance measured by GPS coordinates at time t and Distance(t+Δt) is the predicted distance. To account for GPS accuracy deviations, a tolerance factor α is introduced. Additionally, the algorithm performs a PDR check, which calculates the PDR for a window with an estimated PDR, and predicts the PDR based on the predicted link quality or previously measured behavior. If the calculated PDR is inconsistent with the expected PDR, it could indicate jamming, and the system enters fail-safe application mode. The notation used for the calculated versus expected PDR is similar to that used for distances above, i.e., |PDR(t)-PDR(t+Δt)|, where PDR(t) is the calculated PDR at time t=t+Δt, and PDR(t+Δt) is the expected PDR. A tolerance of β is introduced to account for deviations in PDR values. If both consistency checks pass and the algorithm models assume normal operation, the flag value is updated to 2, and the system continues to receive new BSMs. If a new BSM is received, the algorithm performs two checks to determine if the expected distance is out of range. If the RV is out of range, the algorithm starts over. Otherwise, jamming is suspected, and the system enters fail-safe application mode.
6. Jamming Attack Recovery Algorithm for Dedicated Short-Range Communications (DSRC) Safety Applications in Vehicular Ad-Hoc Networks (VANET)
6.1. Reliability and Redundancy
At a regular interval of 100 milliseconds, every On-Board Unit (OBU) transmits a Basic Safety Message (BSM) on the safety channel (CH172), resulting in a message frequency of 10 BSMs per second [25] and [26]. To assess the impact of redundancy on the dependability and overhead of Safety Applications, we increase the BSM message rate. Let us consider the forward collision warning application where the Recreational Vehicle (RV) abruptly applies the brakes to evade an obstacle, resulting in a brake system status alert in the RV's BSM. To inform the driver sufficiently in advance, allowing adequate reaction time, the Host Vehicle (HV) needs to receive at least one BSM containing this status. As a result, the reliability of the Safety Application pertains to the probability of the HV receiving at least one BSM message before the reaction time threshold, i.e., at time t_react.
Following the standard definition of reliability, where R(t) is the probability of the system performing in accordance with the specifications throughout the time interval [0, t] [27], we define our application reliability R(t)app as the probability of receiving at least one BSM message before at timet_react. Assuming the i^th BSM as BSM_i, at least one of the BSM_i, i = 1... X, must be received, where BSM_x refers to the last BSM before at timet_react. Consequently, the application fails only if no BSM message is received before t_react. The unreliability 〖Q(t)〗_(app =1- 〖R(t)〗_app ) i.e., the probability of not receiving anyBSM_i, i = 1... X, can be expressed as:
Where is the probability that BSM_i was not received at t_i. It should be noted that is the packet error probability of. If N redundant channels are used, then
Where represents the unreliability for each channel, as
Equation .3, introduced in [22], can be used to calculate the Safety Application's unreliability and channel redundancy for a single channel. Increasing the BSM rate has the potential to improve the system's reliability, but the impact depends on the intensity of jamming, as illustrated in Figure 3. If the left region experiences jamming, the jamming detection will activate the Safety Application's fail-safe mode. The right region remains unaffected by jamming. However, the central region is crucial, as increasing the BSM rate can mitigate moderate jamming. This strategy is not only applicable to the safety channel (CH172) but can also be extended to other channels, such as CH178 using ACM in a dual redundant approach or incorporating CH184 using PVD for a triple redundant scheme.
6.2. Effectiveness of Various BSM Rates
The MAC layer can face additional strain with an increase in BSMs due to higher BSM rates, which may lead to a decrease in PDR as a result of collisions. Determining the upper limit of BSM rates is dependent on several critical factors, including the number of vehicles in the vicinity, data rate, and message size. To gain insight into this upper limit, Figure 4 illustrates the maximum available BSM rates for different data rates and two sample BSM sizes, 300 and 180 Bytes, using a PHY Preamble of 32μs, DIFS of 64μs, and PLCP header of 8μs. For instance, when sending a 300 Bytes message at a data rate of 6Mbps.
And now by adding all delays 32μs + 64μs + 8μs + 400μs, these sums up to a total delay of 504μs per message. As BSM data rates higher than 6Mbps have been shown to be too unreliable in the presence of jamming, the data rates that should be used by DSRC Safety Applications are 3Mbps and 6Mbps [65]. For a 6Mbps data rate, the maximum number of messages the media can handle is 1984 BSM/s for 300 Bytes message size.
This can be calculated considering..
Thus, when sending a BSM of size 300 Bytes (2400 bits), the total messages that can be handled by the media is. Likewise, at 6 Mbps and for a message.
Assuming a message size of 180 bytes, the media can handle a maximum of 2906 BSMs per second. With each vehicle sending 10 BSMs per second, one can estimate the upper limit of vehicles that the media can handle. However, it is important to note that these calculations do not take into account the potential collisions that may occur when multiple vehicles attempt to send BSMs simultaneously. Collisions can lead to packet corruption, bandwidth consumption, and a decrease in PDR, particularly as the number of vehicles increases. It is worth noting that VANET uses the DCF and CSMA/CA protocols of the IEEE 802.11 standard. Despite these considerations, the maximum number of messages shown in Figure 4 was calculated without accounting for collisions, and it is important to consider the impact of redundant BSMs on the medium in a more realistic scenario.
Collisions in VANETs can occur through direct collisions or hidden terminals. Direct collisions happen when the sender and receiver are within each other's transmission range, and they send messages simultaneously due to similar back-off times. In contrast, hidden terminal collisions occur when three or more nodes are positioned such that the outer nodes are not within each other's transmission range, but they are within the range of the middle node. This leads to more collisions since the outer nodes cannot sense each other's presence, resulting in simultaneous communication with the middle node. To prevent these collisions, wired and wireless networks use several mechanisms, including physical carrier sensing and virtual sensing. Physical carrier sensing involves the sender monitoring the medium and deferring transmission if the medium is busy. Only when the medium is idle, the sender transmits the data frame after a random back-off time to avoid direct collisions with other nodes competing for the medium.
Physical carrier sensing involves monitoring the medium and waiting for an idle period before transmitting data to avoid direct collisions. Virtual sensing, on the other hand, sets a Network Access Vector (NAV) based on Request-to-Send and Clear-to-Send (RTS/CTS) frames. Before transmitting data, a source node sends an RTS and waits for a CTS reply from the destination, and hidden nodes outside the source range can still hear the CTS reply and set their NAV accordingly to reduce collisions in hidden terminal situations. However, virtual sensing is not suitable for safety applications in VANETs, where minimal delay is crucial for broadcasting BSMs to high-speed vehicles. Therefore, hidden terminal situations have a more severe impact on safety applications in VANETs. The impact of transmission collisions on Packet Delivery Ratio (PDR) is studied using the IEEE 802.11p MAC protocol in [30], which measures performance for both hidden and direct collision cases. The average number of vehicles in the transmission range is denoted by N_tr.
Which β represents the density of vehicle [vehicles/km] and R is transmission range. The queue utilization ρ can be expressed as
Where λ is the packet generation rate [packets/sec] and E[S] is the average of the servant time.
Now let as τ be a probability of that a transmit vehicle in the slot random considering which a packet in a queue,
Where is the average number of back-off slots. The probability of direct collision is calculated as follows,
Note that represents the probability that a channel is sensed busy when a new packet arrives,
Where T is the complete transmission time of a packet including DIFS period.
Finally, the for direct collision case is,
As for the hidden terminal case, let represents the probability of a hidden terminal collision,
Where, S1 denotes the event where none of the hidden terminals transmit, considering the number of hidden terminals is this probability can be expressed as,
and denotes the case where a vehicle starts its transmission,
Where, is the transmission time for a packet, and is the duration of DIFS period. Finally, the for hidden terminal case is expressed as,
To compute the PDR in direct collision and hidden terminal scenarios, we employ Equations 13 and 17, respectively, using the collision parameters outlined in Table 1. The model used in this study, as presented in, examines Safety Applications for vehicles traveling on a multi-lane highway, where the inter-lane distances are negligible compared to the overall network length.
The impact of direct collisions on the PDR with varying vehicle densities is illustrated in Figure 5 With an increase in vehicle density from 2 to 200 vehicles/km, the PDR declines for all three tested BSM rates. However, the impact of direct collisions on the PDR is insignificant for the 10 BSM/s message rate, even at a vehicle density of 200 vehicles/km, with a PDR of 92%. On increasing the BSM rate to 20 BSM/s, the PDR decreases to 72%, and further increasing the rate to 30 BSM/s results in a PDR of only 4%. Such a low PDR would make the Safety Application ineffective at high vehicle densities. The high BSM rates can only be used at lower vehicle densities, e.g., sending 20 BSM/s at vehicle densities below 115 vehicles/km, or 30 BSM/s for 78 vehicles/km.
In this analysis, we examine the effect of hidden terminal collisions on PDR at different vehicle densities, as depicted in Figure 6. The results show that when transmitting at a rate of 10 BSM/s, a PDR of over 90% can only be achieved at a density of 20 vehicles/km. When using higher BSM rates, significant degradation in PDR is observed, which raises concerns about the suitability of the 802.11p MAC layer in dense environments.
7. Jammer Fail-Safe Mode and Recovery Algorithm
In this section, we present a strategy for mitigating jamming attacks in DSRC Safety Applications. The approach involves jamming detection as a means of transitioning the applications to fail-safe mode, and a recovery algorithm to transition back to functional mode. Jamming detection is based on the jamming attack detection model described in Figure 2, which uses vehicle location and PDR estimations. If jamming is detected, the Safety Application transitions to fail-safe mode and the driver is notified that the application is no longer dependable. The recovery algorithm, as shown in Figure 7, is initiated when jamming is detected and the Safety Application transitions to fail-safe mode. The algorithm first calculates Max.Rate, which is the maximum number of BSMs a vehicle can send based on the last observed number of vehicles before entering the jammed area. The algorithm then compares the current BSM rate, BSM.Rate, with Max.Rate. If BSM.Rate is less than Max.Rate, the algorithm increases the BSM rate while ensuring that the upper bound of channel capacity is not exceeded. The algorithm then waits for Δt duration to receive BSMs. If no BSMs are received during this time, the algorithm further increases the BSM.Rate, if possible. If a BSM is received through Δt, its content is examined to see if it is a high priority BSM indicating a hazard. For high priority BSMs, a warning is passed to the driver. For other BSMs, no warning is issued.
For each successful BSM reception, the confidence level is increased. Once a threshold of confidence is reached, the BSM.Rate is reset, and the algorithm issues a mode switch from fail-safe to normal operational mode. However, if the threshold is not met, the recovery mode waits for another Δt to receive more messages at the same increased rate, and the process is repeated. We note that the increase in BSM rates only occurs during execution of the recovery algorithm, and the standard 10 BSM/s rate is used otherwise.
8. Performances Evaluation
The study assessed the influence of jamming on VANETs by conducting a field experiment involving both high and regular vehicles equipped with on-board units (OBU) that employed the LocoMate basic OBU Arada framework [21]. To simulate interference, deceptive OBUs were created by modifying them to generate a constant stream of false packets that would disrupt other OBUs from accessing the network, using the DCF distributed coordination function of the IEEE 802.11p protocol. These deceptive OBUs were capable of jamming at varying data rates. Table 2 displays the parameters employed in the field trial.
8.1. Indigenous PDR
The experiment aimed to assess the impact of jamming on the Packet Delivery Ratio (PDR) of communication between high and regular vehicles. A jamming detection algorithm was utilized to forecast potential outcomes. The experiment was conducted in an unobstructed area to ensure accurate outcomes. The PDR was measured under normal (non-jamming) communication conditions as the distance between Basic Safety Messages (BSMs) received by the high and regular vehicles was increased.
The findings of the PDR measurements are displayed in figures 8 and 9, demonstrating that the experimental results align with the predicted evaluations.
8.2. The Effect Jamming for PDR
To evaluate the impact of jamming on PDR, a test was conducted with two vehicles (RV followed by HV) driving straight on a two-lane road with a stationary jammer present on the road. During the test, BSM messages were logged by the OBU in the HV for data rates of 3 and 6 Mbps, while being subjected to deceptive jamming at rates of 3, 6, and 12 Mbps. It should be noted that a data rate of 12 Mbps was deemed inappropriate for BSM communication in the presence of jamming in previous studies [22-24]. Figure 10 illustrates the PDR for 3 Mbps BSM communications under different jamming rates in a standard test scenario. As the HV and RV approached the jammer stationed at 600m, the HV could not receive BSMs at a distance of about 375-425m. The impact of the jammer diminished at around 750-800m. The transmission rate of the jammer had only a modest effect on the PDR. It is not recommended to draw conclusions from small variations in these experiments due to the nature of this type of jammer.
The assessment of the impact of jamming on the PDR was carried out by testing two vehicles (RV followed by HV) driving on a straight two-lane road, while a deceptive jammer was located in a stopped car on the side of the road. During the tests, BSM messages were logged by the OBU in the HV for data rates of 3, 6 Mbps while being subjected to deceptive jamming with rates of 3, 6, and 12 Mbps. It should be noted that a data rate of 12 Mbps is considered unsuitable for BSM communication in the presence of jamming. Figure 10 shows the PDR for 3 Mbps BSM communication at different jamming rates for a typical test scenario. As the HV and RV approached the jammer stationed at 600m, the HV was unable to receive BSMs from about 375-425m. The effect of the jammer dropped off at around 750-800m, and the transmission rate of the jammer had only a modest effect on the PDR. However, it should be noted that a sample size of these small variations is needed for further experimentation. The results for the normal test with a data rate of 6 Mbps are shown in Figure 11. Again, the PDR was only modestly influenced by the rate of the deceptive jammer. Interestingly, a peculiar situation was observed during the 3 Mbps jamming test. After the HV was caught in the jamming zone, it was able to receive messages from the RV again at around 475m. This was because a small truck passed the test cars and positioned itself temporarily between the vehicles and the jammer, thereby reducing the effect of the deceptive jammer.
To sum up, the field test results indicated that the transmission rate of the deceptive jammer had a minor impact on the transmissions. However, further tests are necessary to determine how the transmission of different data rates is affected. Although the overall effect of jamming was significant, no clear pattern in the impact of the jamming on different data rates of the vehicles and the jammer was observed. This is in contrast to continuous jamming, which significantly reduces the PDR for higher data rates.
8.3. Jamming Detection Evaluation of Algorithm
The outcomes of the jamming detection algorithm assessment for the 3, 6, and 12 Mbps region test data are shown in Figure.12. The algorithm was successful in detecting jamming as soon as the PDR drop was identified by the consistency test, which was based on distance and PDR. The algorithm did not detect any inconsistencies in distances and GPS, indicating that only one of the two detections mechanisms used in the region test was sufficient. Moreover, PDR inconsistencies were detected.
9. Discussion and Results
Here, we will evaluate the effectiveness of the recovery algorithm in mitigating the impact of jamming, by testing it against two types of jammers: constant and deceptive jammers.
9.1. Constant Jammer
Consider the scenario illustrated in Figure 13, where an RV is followed by an HV on a single-lane road. Suppose that the RV suddenly brakes due to a hazard, resulting in the dissemination of BSMs carrying braking information to surrounding vehicles. Assuming that the vehicles' speed is 35 mph (15.6 m/s), and the safety distance between them is 3 seconds, the reaction time is 1 second (typical reaction times are around 0.95 seconds). Thus, the HV will have only 2 seconds to receive BSMs about the braking event before it needs to react. We will assume a constant jammer as the source of a malicious attack in this scenario, positioned behind the HV,, we define the unreliability Q(t) of the Safety Application as the inability of the HV to successfully receive at least one BSM before , The inability of the HV to receive BSMs from the RV is directly attributed to the jammer's signals overpowering the legitimate communication signals. We will now analyze how BSM rates, power levels, and data rates affect the unreliability Q(t) of the Safety Application. It is important to note that we assume all BSM communication occurs in the safety channel (CH172).
9.2. The Impact of BSM Rats
In order to investigate the effect of BSM rates on the reliability of the safety application, we examined three different BSM rates: 10, 20, and 40 BSM/s, as illustrated in Figure 14. During this experiment, the transmission power was set to P_t=21 dBm, the jammer power was set to P_j=15 dBm, and the data rate was set to R = 6 Mbps. The figure demonstrates how jamming affects Q(t) for different BSM rates. As shown, Q(t) almost reaches 1, indicating complete failure, for the entire time frame leading up to 0.4s before t_react. High BSM rates demonstrate me improvement, but unreliability only decreases when there is almost no time left to react. BSM rates of 10 and 20 BSM/s resulted in unacceptable unreliability of more than 0.2 and 0.45, respectively. At t_react . (0 in the figure), only a message rate of 40 BSM/s met the safety application's unreliability requirements with , implying a safety application reliability of 0.96. However, generally, this is too close to the threshold for reacting. On the other hand, in the context of saving lives using safety applications, this could still be helpful. The above analysis only considers BSM rates and does not take into account the impact of other adjustments, such as transmission power and data rates, which will be discussed next.
9.3. The effect of Transmission Power
To examine the impact of transmission power levels on Q(t), we tested three power levels: 21 dBm, 23 dBm, and 25 dBm. For this experiment, we kept the BSM rate fixed at 40 BSM/s, the jammer power was set to 15 dBm, and the data rate was set to R = 6 Mbps. In Figure 15, the impact of different transmission power levels on Q(t) is presented. The experiment was conducted by examining three power levels, namely 21 dBm, 23 dBm, and 25 dBm, while keeping the BSM rate fixed at 10 BSM/s, the jammer power at 15 dBm, and the data rate at 6 Mbps. The results show that, for a transmission power of 21 dBm, the unreliability remains high until around 0.4s prior to , making it insufficient for the safety application. However, when the transmission power is increased to 23 dBm, Q(t) starts dropping earlier, around 0.9s prior to, and reaches an acceptable unreliability level around 0.4s before . Further increasing the transmission power to 25 dBm results in even earlier drop in Q(t), starting around 1.4s prior to, and reaching acceptable Q(t) about 0.9s before . The improvement in reliability is attributed to the increase in Signal-to-Jamming Ratio (SJR) as the transmission signals become stronger. This increase allows the safety application to receive at least one BSM before , contributing to more time for drivers to react. It is worth noting that the chosen transmission power levels are in line with the FCC amendment [32], which states that transmission power levels for public safety operations in CH172 should not exceed 33 dBm EIRP.
9.4. The effect of Data Rate
To investigate the effect of data rates on Q(t), two data rates were examined, namely 3 Mbps and 6 Mbps. During the experiment, the power of the jammer, P, was set to 15 dBm, the transmission power was set to P = 21 dBm, and the BSM rate was fixed at the standard 10 BSM/s. Due to their unreliability in the face of constant jamming [33], higher data rates were not considered. Figure 16 illustrates how jamming affects the reliability of the safety application for the two data rates. When using 6 Mbps, Q(t) begins to decline only 0.4s prior to and never reaches an acceptable level of unreliability. However, when the lower data rate of 3 Mbps was used, Q(t) starts to decline before 1.1s and meets the application's unreliability requirements before 0.6s from, providing the driver with additional time to react. The benefit of employing lower data rates stems from the fact that 3 Mbps data rate employs Binary Phase Shift Keying (BPSK) with a coding rate of 1/2, while 6 Mbps uses Quadrature Phase Shift Keying (QPSK) with a coding rate of 1/2, as specified by the ASTM E2213 standard. Higher modulation modes are generally more susceptible to transmission errors.
9.5. Deceptive Jammer
In Subsection 9, we examine the recovery concepts for the case of a deceptive jammer. Specifically, we investigate how the BSM rates, transmission power levels, and data rates impact the recovery time. While in the case of a constant jammer, we measured the impact of each parameter on the Safety Application using the unreliability, in the case of a deceptive jammer, we conducted actual field experiments to obtain the results. Therefore, we could no longer calculate the individual which represents the probability that was not received. Instead, we used the recovery time, defined as the time required for the HV to resume steady reception after passing the jammer, to measure the impact of BSM rates, transmission power, and data rates. It is important to note that we considered the communication fully recovered only when a steady reception was resumed, even though intermittent reception of BSMs may occur after passing the jammer. The field experiments were conducted on a straight 2-lane road with an average speed of 35 mph (15.6 m/s), with an RV followed by an HV passing a stationary deceptive jammer on the roadside. The moderate speed allowed us to better understand the impact of the tested parameters in the presence of the jammer while not exceeding the speed limit of the test road. Additionally, a third vehicle was included to collect extra data and investigate its impact on the two communicating vehicles when leaving the jammed zone. We focused on the HV's reception of the alert messages during the experiments, as our main concern was the vehicle receiving the messages. Figure 17 shows the position of the test vehicles, with the RV being the first vehicle exposed to the jammer's impact in Figure 17a. The impact of the jammer on the RV is different when the vehicles have passed, as shown in Figure 17b, where the last two vehicles provide a shielding effect on the RV. The figures presenting the results of the field test depict the impact of the jammer on the RV in two scenarios, i.e., moving towards or leaving from the jammer position. Table 3 provides details on the specific parameters utilized in the field tests. However, it is important to acknowledge the challenges involved in conducting these experiments. Conducting field experiments presents several challenges, such as ensuring safety during the tests, controlling testing conditions, and obtaining reliable and accurate data. To address these challenges, the test road was carefully selected, safety measures were implemented, and various data collection methods were employed, such as GPS and video recordings. Furthermore, due to the unpredictable nature of road and traffic conditions, multiple tests were conducted to obtain statistically significant results. The collected data were then analyzed to draw conclusions regarding the impact of BSM rates, transmission power levels, and data rates on recovery time.
9.6. The Impact of BSM Rates
To examine how different BSM rates affect recovery time, we conducted field tests using rates of 10, 20, and 40 BSM/s. Results for each rate are displayed in Figure 19 and Figure 20, respectively. The number of BSMs received by the HV was measured over the entire test area (Figure 23) from start to finish, with the time at which the HV passes the jammer indicated by a dashed line. Although passing times varied slightly across trials due to slight speed variations, recovery times were consistent within each test. Figure 18 shows results for a typical experiment using the standard 10 BSM/s rate. When the HV passed the jammer at t = 31s, no BSMs were received because the jamming impact was at its peak and the HV was nearly parallel to the jammer. Steady reception of BSMs resumed only after 12 seconds following the passage of the jammer, with only intermittent reception prior to that time.
Figure.19 illustrates the impact of sending at 20 BSM/s on the recovery time. During this experiment, the RV increased its sending rate to 20 BSM/s, and the HV passed the jammer at t = 31s. As shown in the figure, the HV resumed steady reception at t = 41s, resulting in a recovery time of 9s for this trial.
In the last trial, 40 BSM/s was used, and the HV passed the jammer at t = 29s, as depicted in Figure 20. The HV started receiving BSMs continuously from the RV at t = 39s, leading to a recovery time of 9s.
9.7. The Impact of Transmission Power
To investigate the impact of transmission power on the recovery time in the presence of a deceptive jammer, three different power levels have been investigated, i.e., 21, 23 and 25 dBm. The impact of these
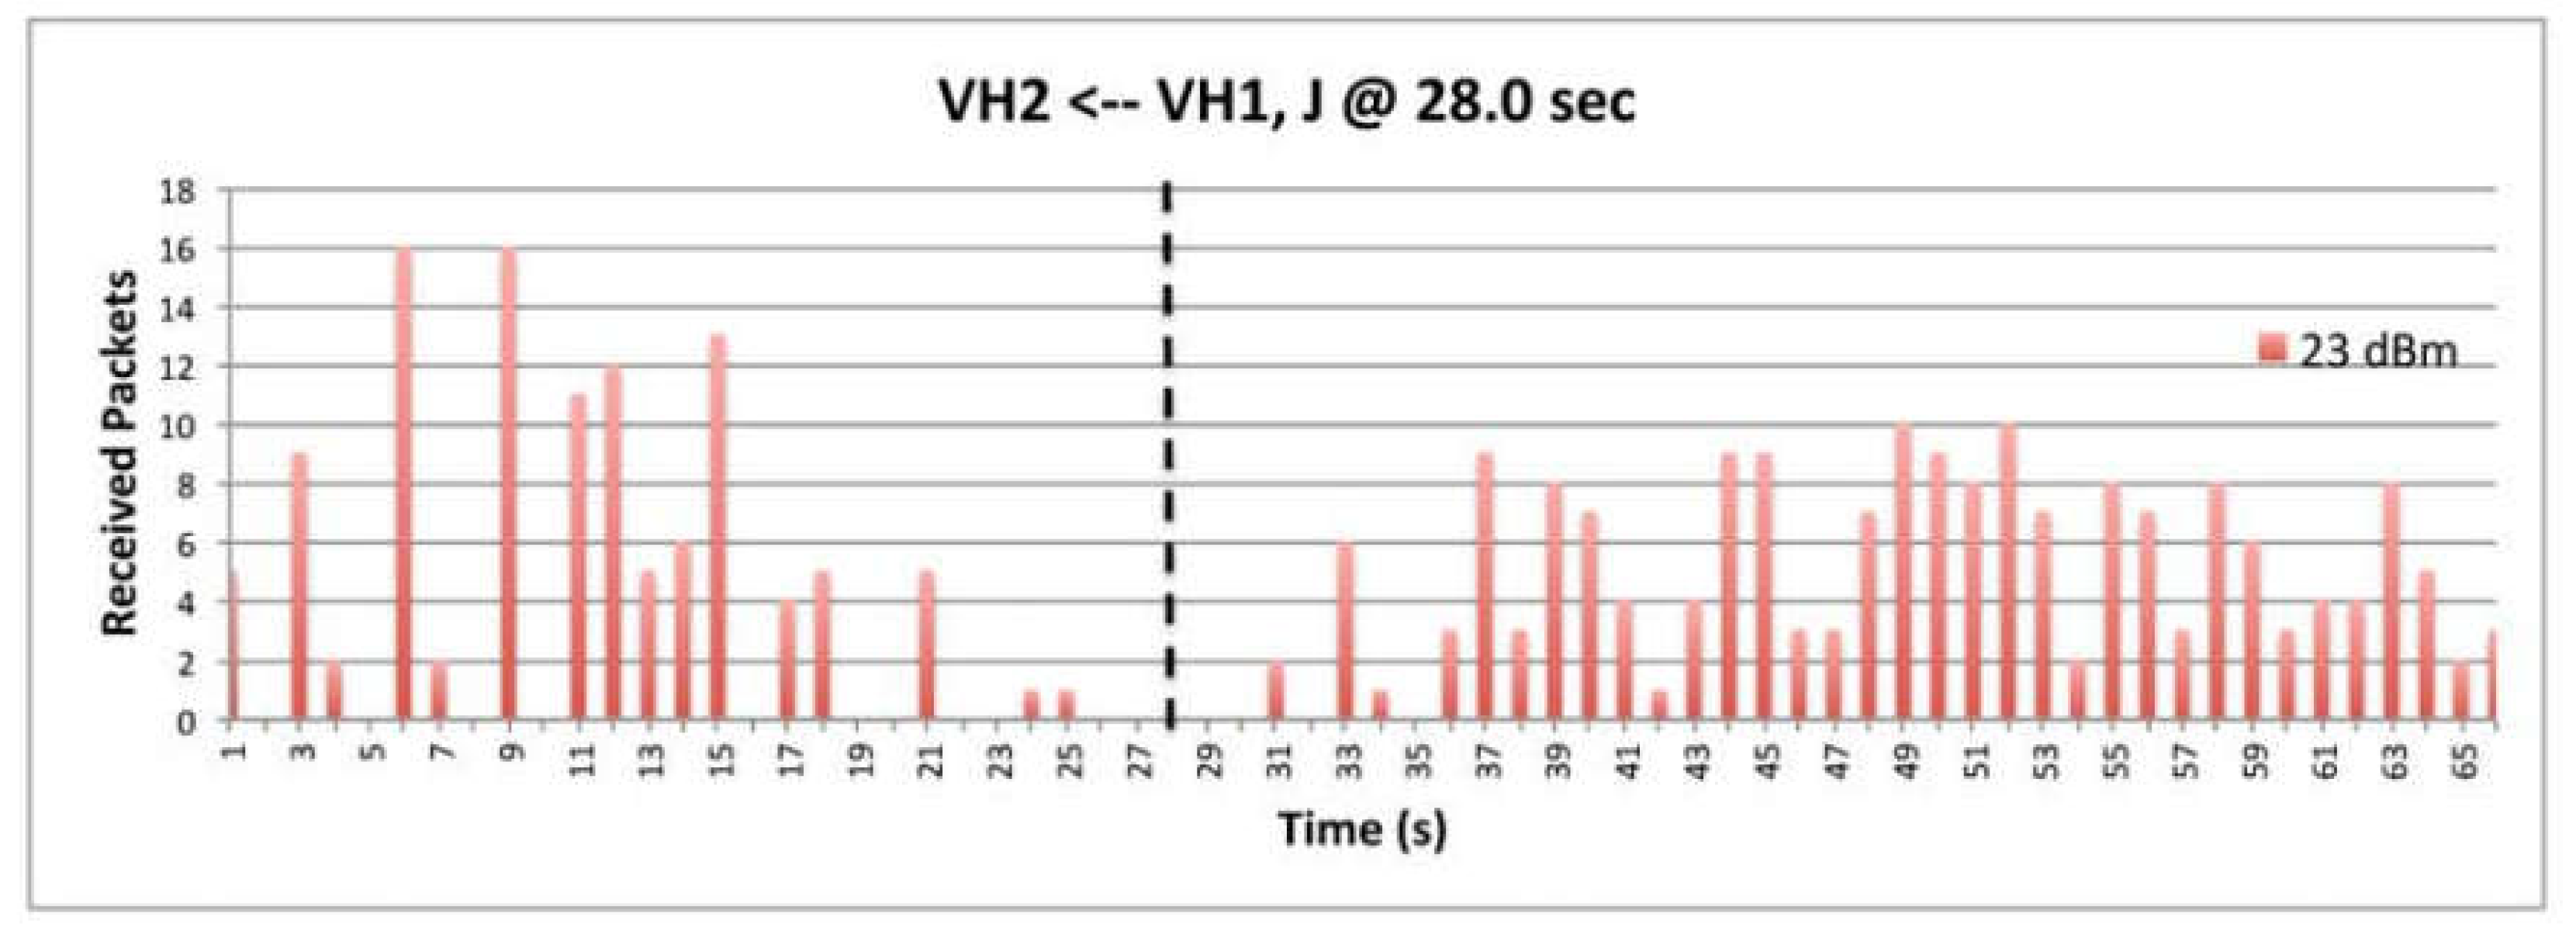
Studying the impact of different power levels on recovery time in typical test runs is presented in Figure 21, Figure 22 and Figure 23. Figure 21 illustrates a scenario where transmissions were made at a power level of 21 dBm and the corresponding recovery time. At point t = 31s, the HV passed the jammer and communication was completely disrupted due to the deceptive jammer. However, at point t = 41s, a steady reception of BSMs was observed, resulting in a recovery time of 9s. Figure 22 depicts the case of transmission power level of 23 dBm, where the HV passed the jammer at point t = 28s, and steady reception was only resumed after 7s from the point of passing the jammer. Figure 23 considers a transmission power level of 25 dBm. The HV passed the jammer at t = 28s and regained steady reception at t = 34s, resulting in a recovery time of 6s.
Figure 21.
Reception using 21 dBm transmissions Power.
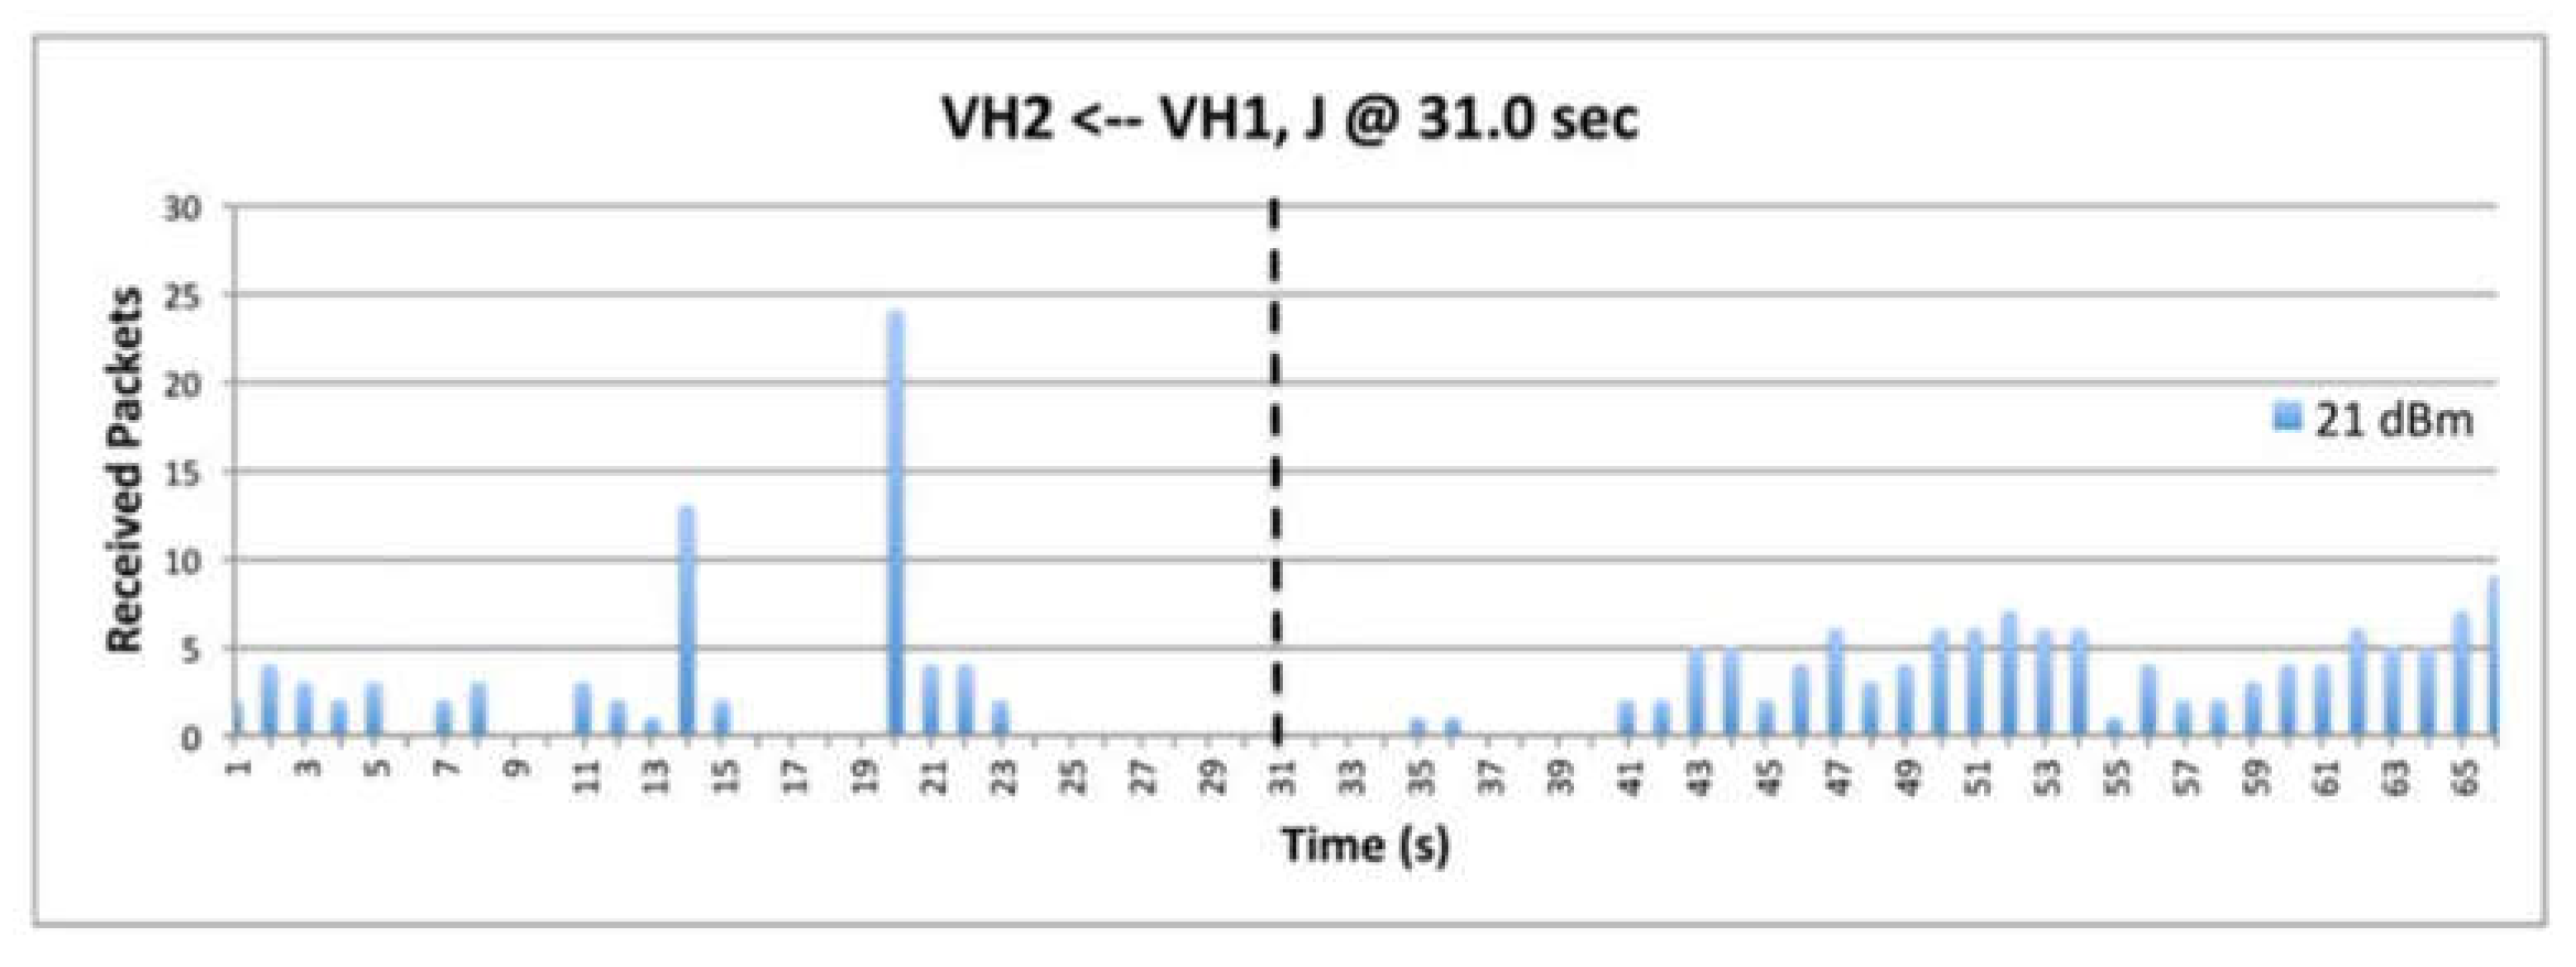
Figure 22.
Reception using 23 dBm transmissions Power.
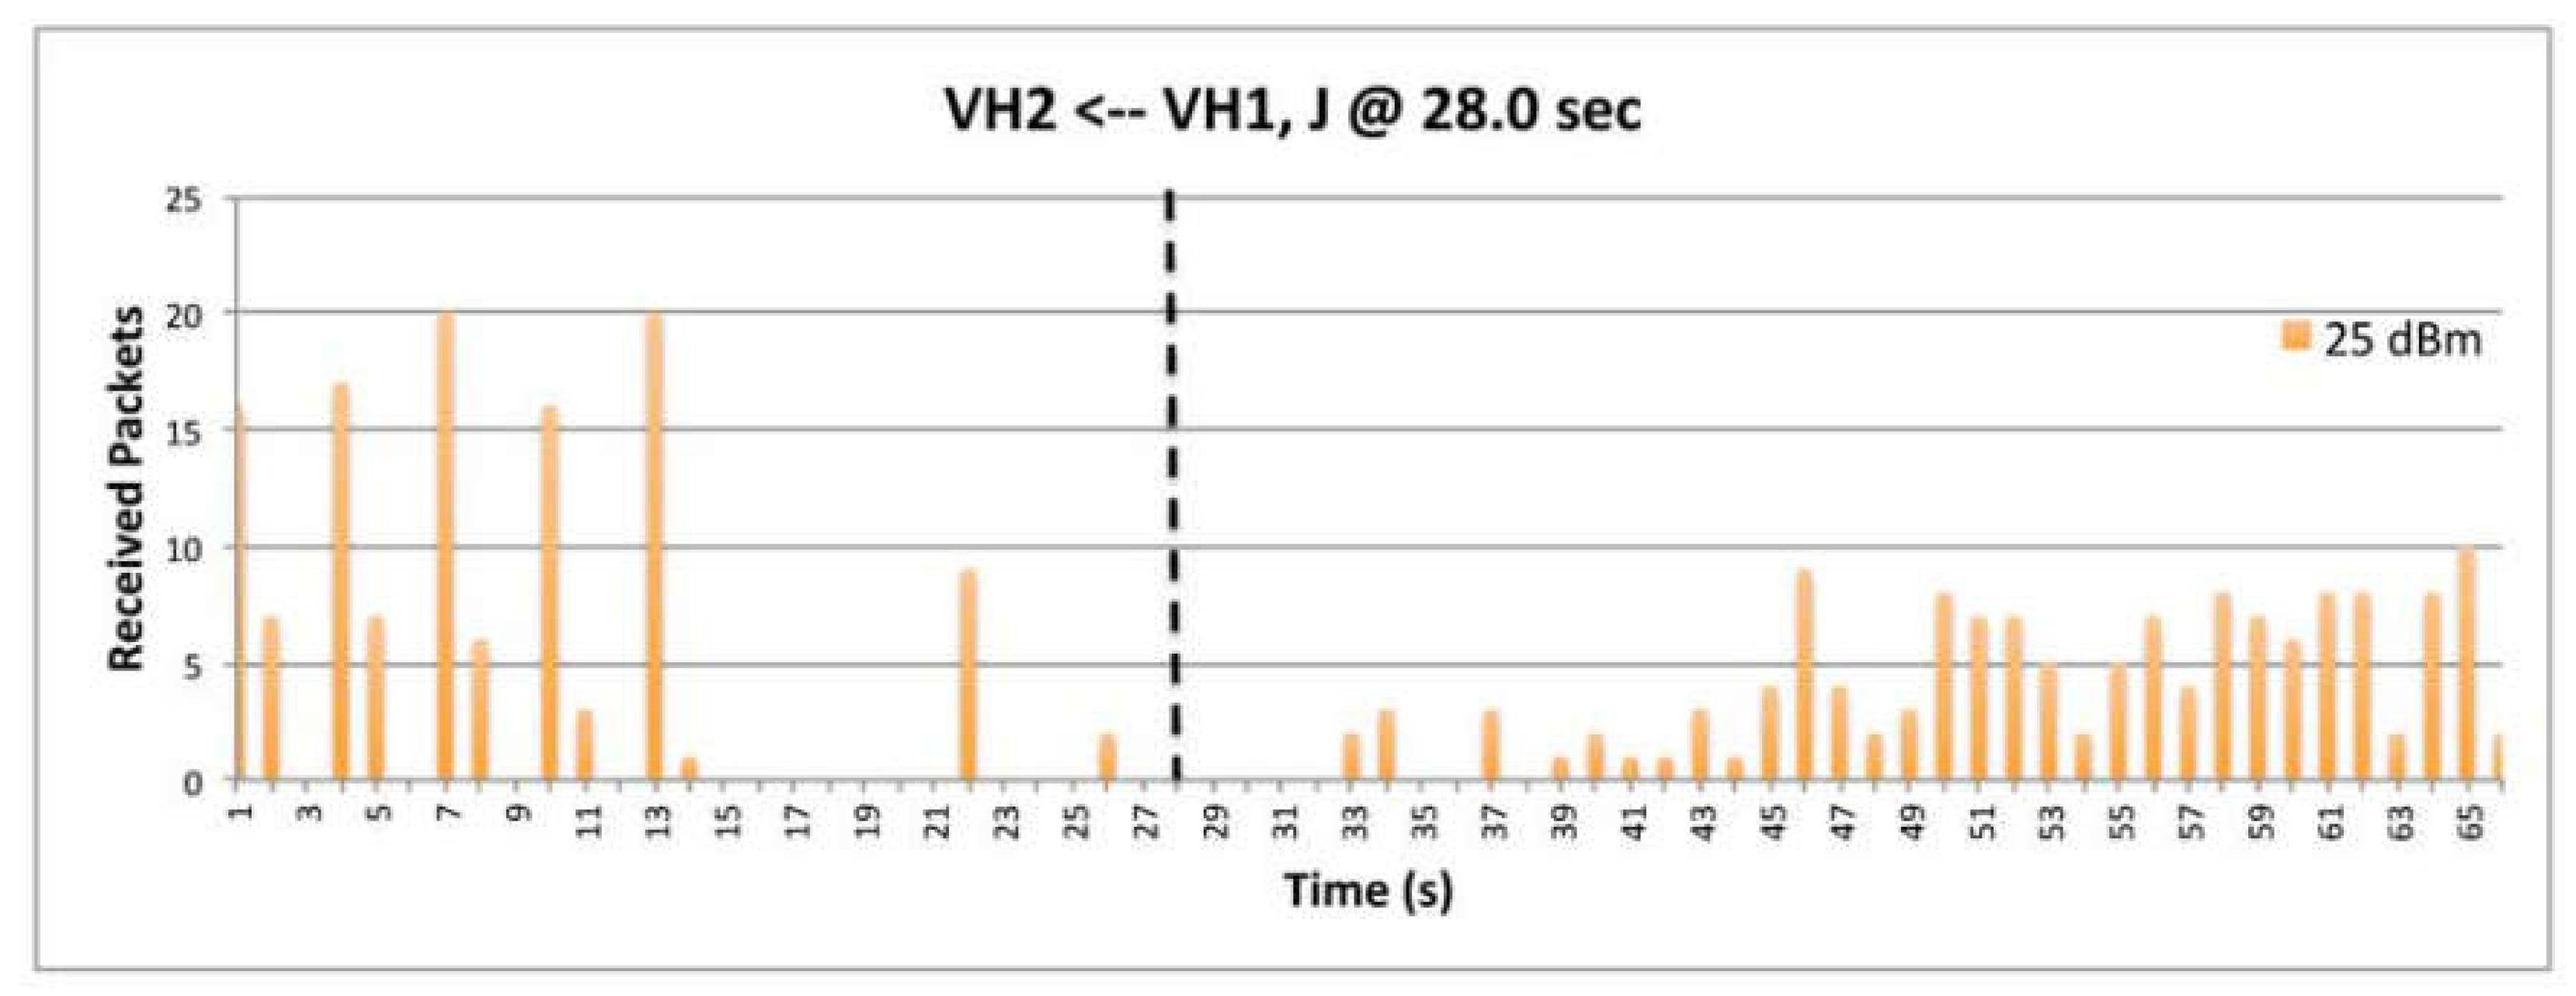
Figure 23.
Reception using 25 dBm Transmissions Power.
9.8. The Impact of Data
To study the effect of data rates on the recovery time, two different rates, namely 3 Mbps and 6 Mbps, were tested, and the results are presented in Figure 24 and Figure 25, respectively. Figure 24 shows an example of the recovery time using a data rate of 3 Mbps, where the HV passed the deceptive jammer at t = 30s and resumed reception of BSMs from the RV at 42s, resulting in a recovery time of 11s. In contrast, Figure 25 depicts the recovery time using a data rate of 6 Mbps, where the HV passed the jammer at t = 31s, and a constant reception of BSMs was regained at t = 44s, accounting for a recovery time of 12s.
However, an abnormal behavior was observed during the field experiments, as spikes in the number of received BSMs were detected. This behavior suggests that the number of received BSMs exceeded the number of transmitted ones. For instance, in Figure 25 at t = 24s, the number of received BSMs was more than 25, while only 10 BSMs were transmitted. This unusual behavior is due to the deceptive jammer preventing the OBU from accessing the media, which causes packets generated by the application layer to accumulate in the OBU's queue for deferred sending. When the OBU eventually gains access to the media, the queued packets are transmitted simultaneously, resulting in the observed spikes. This effect is particularly noticeable at the beginning of the test period when the communication was partially affected by the jammer.
Upon analyzing the data collected from the field experiments, we noticed abnormal spikes in the number of received BSMs, which exceeded the number of transmitted BSMs. This behavior can be observed in Figure 25, where at t = 24s, the number of received BSMs was more than 25, while the number of transmitted ones was only 10. This abnormal behavior is due to the fact that the deceptive jammer is preventing the OBU from accessing the media. As a result, the OBU queues the packets generated by the application layer for deferred sending. However, since the jamming persists, packets were not sent in time and accumulated over a period. This is especially evident at the beginning of the test period when the communication was partially affected by the jammer. Once the OBU gains temporary access to the media, all queued packets are pushed at once, resulting in the observed spikes. It's worth noting that the queue has a certain capacity, which prevents it from buffering all packets during prolonged inaccessibility to the media.
Table 4 presents the recovery times and distances between HV and RV for the representative cases. However, due to unavoidable differences in distances and environmental conditions, the observed results cannot be generalized.
The results obtained from the presented scenarios confirm the predictions made by the mathematical models and intuition. For instance, the increase in recovery time when the power level was increased from 23 dBm to 25 dBm was due to the actual distances observed in the post-analysis of the data. Therefore, the reader should consider the "Distance" column when examining the recovery times. Despite our best efforts to maintain consistent distances between different trials, it was challenging to achieve this without a towrope between vehicles. Nonetheless, due to the unavailability of a facility that could accommodate such a test range length, we were unable to maintain consistent distances.
Also, Table 4 shows the recovery times and distances for the representative cases that were examined. But, due to differences in environmental conditions and distances, these results are not conclusive and cannot be generalized. To provide a fair comparison with similar test conditions, one can simulate different BSM rates in a post-analysis based on a single field trial. Figure 26 shows the comparison of different BSM rates (10, 20, and 40 BSM/s) using the data from the field test with 40 BSM/s. This allows us to understand the impact of BSM rates while maintaining almost the exact same test conditions, such as environmental and physical factors, including distances and antenna positions. However, the conditions using this approach are not entirely identical, as the transmitter queue behavior for 40 BSM/s is unlikely to be the same for rates of 10 and 20 BSM/s. Our results indicate that sending at a rate of 10 BSM/s resulted in a 11s recovery time, while sending at higher rates of 20 and 40 BSM/s resulted in a shorter recovery time of 9s. These results are consistent with our previous observations during the field experiments, as summarized in Table 4. However, we were unable to directly observe the impact of transmission power levels for the deceptive jammer due to variations in inter-vehicle distances during the field experiment. These variations in distances resulted in different levels of SNR, which in turn impacted the reception of BSMs and affected the change in recovery times that we observed during the field test.
To better understand the impact of higher transmission powers, we analyzed the relationship between signal-to-noise ratio (SNR) levels and inter-vehicle distances, as shown in Figure 27. By assuming a fixed distance of 100 m between the vehicles, we were able to observe the real impact of using higher transmission power. Comparing the results for 23 dBm and 25 dBm at a distance of 100 m, we found that using a higher transmission power resulted in improved SNR levels. Higher SNR levels translate to lower bit error rates (BER) and overall higher chances of successfully receiving messages. In contrast to the field experiments with the deceptive jammer, where maintaining consistent physical conditions was challenging, we were able to control the physical conditions in this analysis. Therefore, these results provide valuable insights into the potential benefits of using higher transmission powers in similar scenarios.
10. Conclusion
In this study jamming discovery a strategy for measurements DSRC Security applications in VANET communication to a fail-safe mode. We have proposed a new recovery strategy based on adjusting the communication parameters, i.e., BSM rates, transmission power levels and data rates only when jamming is detected. This has shown to help increase the reliability of the Safety Applications, by transitioning them from the jammed to the non-jammed state faster. We have also studied the tradeoff between channel efficiency and reliability by investigating the impact of increased number BSMs in the safety channel. The maximum possible number of BSMs obtained for both cases, direct and indirect collisions. Direct collisions result from what is known as the hidden terminal situation. It was shown that for the case of hidden terminal case, the safety channel will struggle supporting high number of vehicles when sending at rates higher than 10 BSM/s. We furthermore studied the concepts behind the recovery algorithm, by considering the impact of BSM rates, transmission power and data rates on the reliability of the Safety Applications, for both constant and deceptive jammers. For the constant jammer, increasing the BSM rates slightly improved the reliability of the Safety Application. The results, based on mathematical analysis and data collected during field tests show that this recovery strategy can help the Safety Applications to transition from fail-safe mode to operational mode earlier. In the context of safety critical applications, this has the potential to reduce accidents and save lives.
Author Contributions
Conceptualization, Ayoob Aziz and Zuzan Ayoub; methodology, Ayoob Aziz and Zuzan Ayoub ; software, Zuzan Ayoub and Ayoob Aziz; validation, Ghaith Khalil., Ayoub Aziz and Zuzan Ayoub; formal analysis, Ayoob Aziz and Ghaith Khalil; investigation, Ayob Aziz and Ghaith Khalil; resources, Zuzan Ayoub.; data curation, Ayoub Aziz; writing—original draft preparation, Ayoub Aziz; writing—review and editing, Ghaith Khalil; visualization, Zuzan Ayoub; supervision, Ghaith Khalil; project administration, Ghaith Khalil; funding acquisition, Ghaith Khalil All authors have read and agreed to the published version of the manuscript.
Funding
This research received no external funding.
Conflicts of Interest
The authors declare no conflict of interest.
References
- J. Puñal, Ó.; Pereira, C.; Aguiar, A. Experimental characterization and modeling of RF jamming attacks on VANETs. IEEE Trans. 2015, 64, 524–540. [Google Scholar]
- A. Devi, L.; Suganthi. Denial of Service Attacks in Wireless Networks. Case Jammers. Int. J. Comput. Sci. Mob. Comput. 2014, 3.
- M. Mohammad; Norrozila Sulaiman. A New Broadcast Algorithm to Optimize Routing Protocol in Mobile Ad Hoc Networks. J. Appl. Sci. 2013, 13.
- S. R.; A. LN. A Multi-channel Defense Against Jamming Attacks in Wireless Sensor Networks. In the Proceedings of the 3rd ACM Workshop on QoS and Security, 2007. .
- M. A.; R. Kieckhafer. Exploiting Omissive Faults in Synchronous Approximate Agreement. IEEE Trans. Comput. 2000, 49, 1031–1042. [CrossRef]
- T. Xu; W., Trappe, W., Zhang, Y.; Wood. The feasibility of launching and detecting jamming attacks in wireless networks. In the Proceedings 6th ACM Int. Symp. Mob. ad hoc Netw. Comput, 2005.
- C. C. SU; Hung min; HSU Shihpu. Mobile Jamming Attack and Its Countermeasure. In the proceeding of the Wireless Sensor Networks. dvanced Information Networking and Application Workshops, AINA W’ 07. 21st Int. Conf., 2007.
- A. Serageldin; A.; Krings. The impact of dissimilarity and redundancy on the reliability of DSRC safety applications. In the proceeding of 28th International Conference on IEEE In Advanced Information Networking and Applications Workshops (WAINA). 2014. 2014.
- S.J. Dedicated Short Range Communications (DSRC) Message Set Dictionary. Society of Automotive Engineers.
- L. Hamieh, A; Ben-Othman, J.; Mokdad. Detection of radio interference attacks in VANET. In the proceeding of Global Telecommunications Conference GLOBECOM, IEEE. 2009.
- A. E2213-03. Standard Specification for Telecommunications and Information Exchange Between Roadside and Vehicle Systems - 5 GHz Band Dedicated Short-Range Communications (DSRC) Medium Access Control (MAC) and Physical Layer (PHY) Specifications. 2018.
- J. Lyamin; N. Vinel; A. V.; Jonsson M; Loo. Real-Time Detection of Denial-of-Service Attacks in IEEE 802.11. Veh. Networks. IEEE Commun. Lett. 2015, 18, 110–113.
- J. Nguyen; A. T.; Mokdad, L.; Ben Othman. Solution of detecting jamming attacks in vehicle ad hoc networks. In the proceeding of the of the 16th ACM,” Int. Conf. Model. Anal. Simul. Wirel. Mob. Syst. 2013.
- Ayoob, A.A.; Su, G.; Al, G. Hierarchical Growing Neural Gas Network (HGNG)-Based Semicooperative Feature Classifier for IDS in Vehicular Ad Hoc Network (VANET). J. Sens. Actuator Netw. 2018, 7, 41. [Google Scholar] [CrossRef]
- J. G. O. Puñal; A. Aguiar. Characterizing RF Jamming in Vehicular Networks. In the proceeding of the ninth ACM international workshop on Vehicular inter-networking, systems, and applications, VANETs we Trust. 2012.
- J. O; L. Hamieh. Detection of Radio Interference Attacks in VANET. In the proceeding of IEEE Glob. Telecommun. Conf.2009.
- T. Xu; W. Trappe; Y. Zhang. The Feasibility of Launching and Detecting Jamming Attacks in Wireless Networks. In the proceeding of the 6th ACM Int. Symp. Mob. ad hoc Netw. Comput. 2005.
- M. J.; J. Lyamin; A. Vinel. Real-Time Detection of Denialof-Service Attacks in IEEE 802.11p Vehicular Networks. IEEE Commun. Lett. 2014, 18, 110–113. [CrossRef]
- J. B.-O; A.T. Nguyen; L. Mokdad. Solution of Detecting Jamming Attacks in Vehicle Ad Hoc Networks. In the proceeding of the 16th ACM Int. Conf. Model. Anal. Simul. Wirel. Mob. Syst. MSWiM. 2013.
- B. Sklar. Digit. Commun. Fundam. Appl, 2nd Ed. Prentice Hall PTR, 2011. .
- A. Systems. Available online: www.aradasystems.com (accessed on 22 08 2023).
- H. A.; A. Serageldin. On the Reliability of DSRC Safety Applications: A Case of Jamming, In the proceeding of the IEEE Int. Conf. Connect. VehExpo. 2013.
- A. S.; A. Krings. The Impact of Redundancy on DSRC Safety Application Reliability under Different Data Rates. In the proceeding of the Int. Conf. New Technol. Mobil. Secur..2014.
- A. S.; A. Krings. The Impact of . Dissimilarity and Redundancy on the Reliability of DSRC Safety Applications, In the proceeding of 28th Int. Conf. Adv. Inf. Netw. Appl. Work. 2014.
- D. S. R. C.; M. S. Dictionary. Dedicated Short Range Communications (DSRC) Message Set Dictionary, Society of Automotive Engineers, SAE J2735. 2009.
- DOT HS 811 492 A. U.S. Department of Transportation, NHTSA, Veh. Saf. Commun, Final Report, USA. 2011.
- W. B. Johnson. Design and Analysis of Fault-Tolerant Digital Systems. AddisonWesley Publ. Company, NewYork,USA. 1989.
- L. C.; B. Peng. A Wireless MAC Protocol with Collision Detection. IEEE Trans. Mob. Comput. 2007, 6, 1357–1369. [CrossRef]
- IEEE Standard for Information Technology--Telecommunications and Information Exchange between Systems - Local and Metropolitan Area Networks--Specific Requirements- Part 11, Wireless LAN Medium Access Control (MAC) and Physical Layer (PHY) Specifications," in IEEE Std 802.11.2021.
- T. S. M.I. Hassan; H.L.Vu. Performance Analysis of the IEEE 802.11 MAC Protocol for DSRC Safety Applications. IEEE Trans. Veh. Technol. 60, 3882–3896. [CrossRef]
- G. J.; K. Rumar. Drivers? Brake Reaction Times, in HumanFactors. The Journal of the Human Factors and Ergonomics Society 1971, 1, 23–27.
- Amendment of the Commission’s Rules Regarding Dedicated Short-Range Communication Services in the 5.850-5.925 GHz Band (5.9 GHz Band). Available online: www.fcc.gov (accessed on 22 08 2023).
- A. Serageldin, A.; Krings. The impact of redundancy on DSRC safety application reliability under different data rates. In the proceeding of the 6th International Conference on New Technologies, Mobility and Security (NTMS), Dubai, United Arab Emirates, 2014.
- ASTM E2213-03 Standard Specification for Telecommunications and Information Exchange Between Roadside and Vehicle Systems - 5 GHz Band Dedicated Short Range Communications (DSRC) Medium Access Control (MAC) and Physical Layer (PHY) Specifications. Available online: www.standards.its.dot.gov (accessed on 22 08 2023).
- M. S. R.; A. R. I. R. A. Shafik. On the Extended Relationships Among EVM, BER and SNR as Performance Metrics. In the proceeding of the Int. Conf. Electr. Comput. Eng. ICECE. 2006.
- A. Ayoob; G. Khalil, L. Yingzhuang; M. Chowdhury; T. Al. Efficiency Broadcast Base Safety Message BSM Through VANET Based on Transmit Packet Coding (TPC). In the proceeding of the IEEE 2nd Global Conference on Life Sciences and Technologies (LifeTech), Kyoto, Japan. 2020.
- Ayoob, A.; Khalil, G.; Chowdhury, M.; Doss, R.. Intrusion detection system classifier for VANET based on pre-processing feature extraction. In the proceeding of the Future Network Systems and Security 5th International Conference, FNSS2019, Melbourne, VIC, Australia. 2019.
Figure 1.
Jamming Detection Scenario.
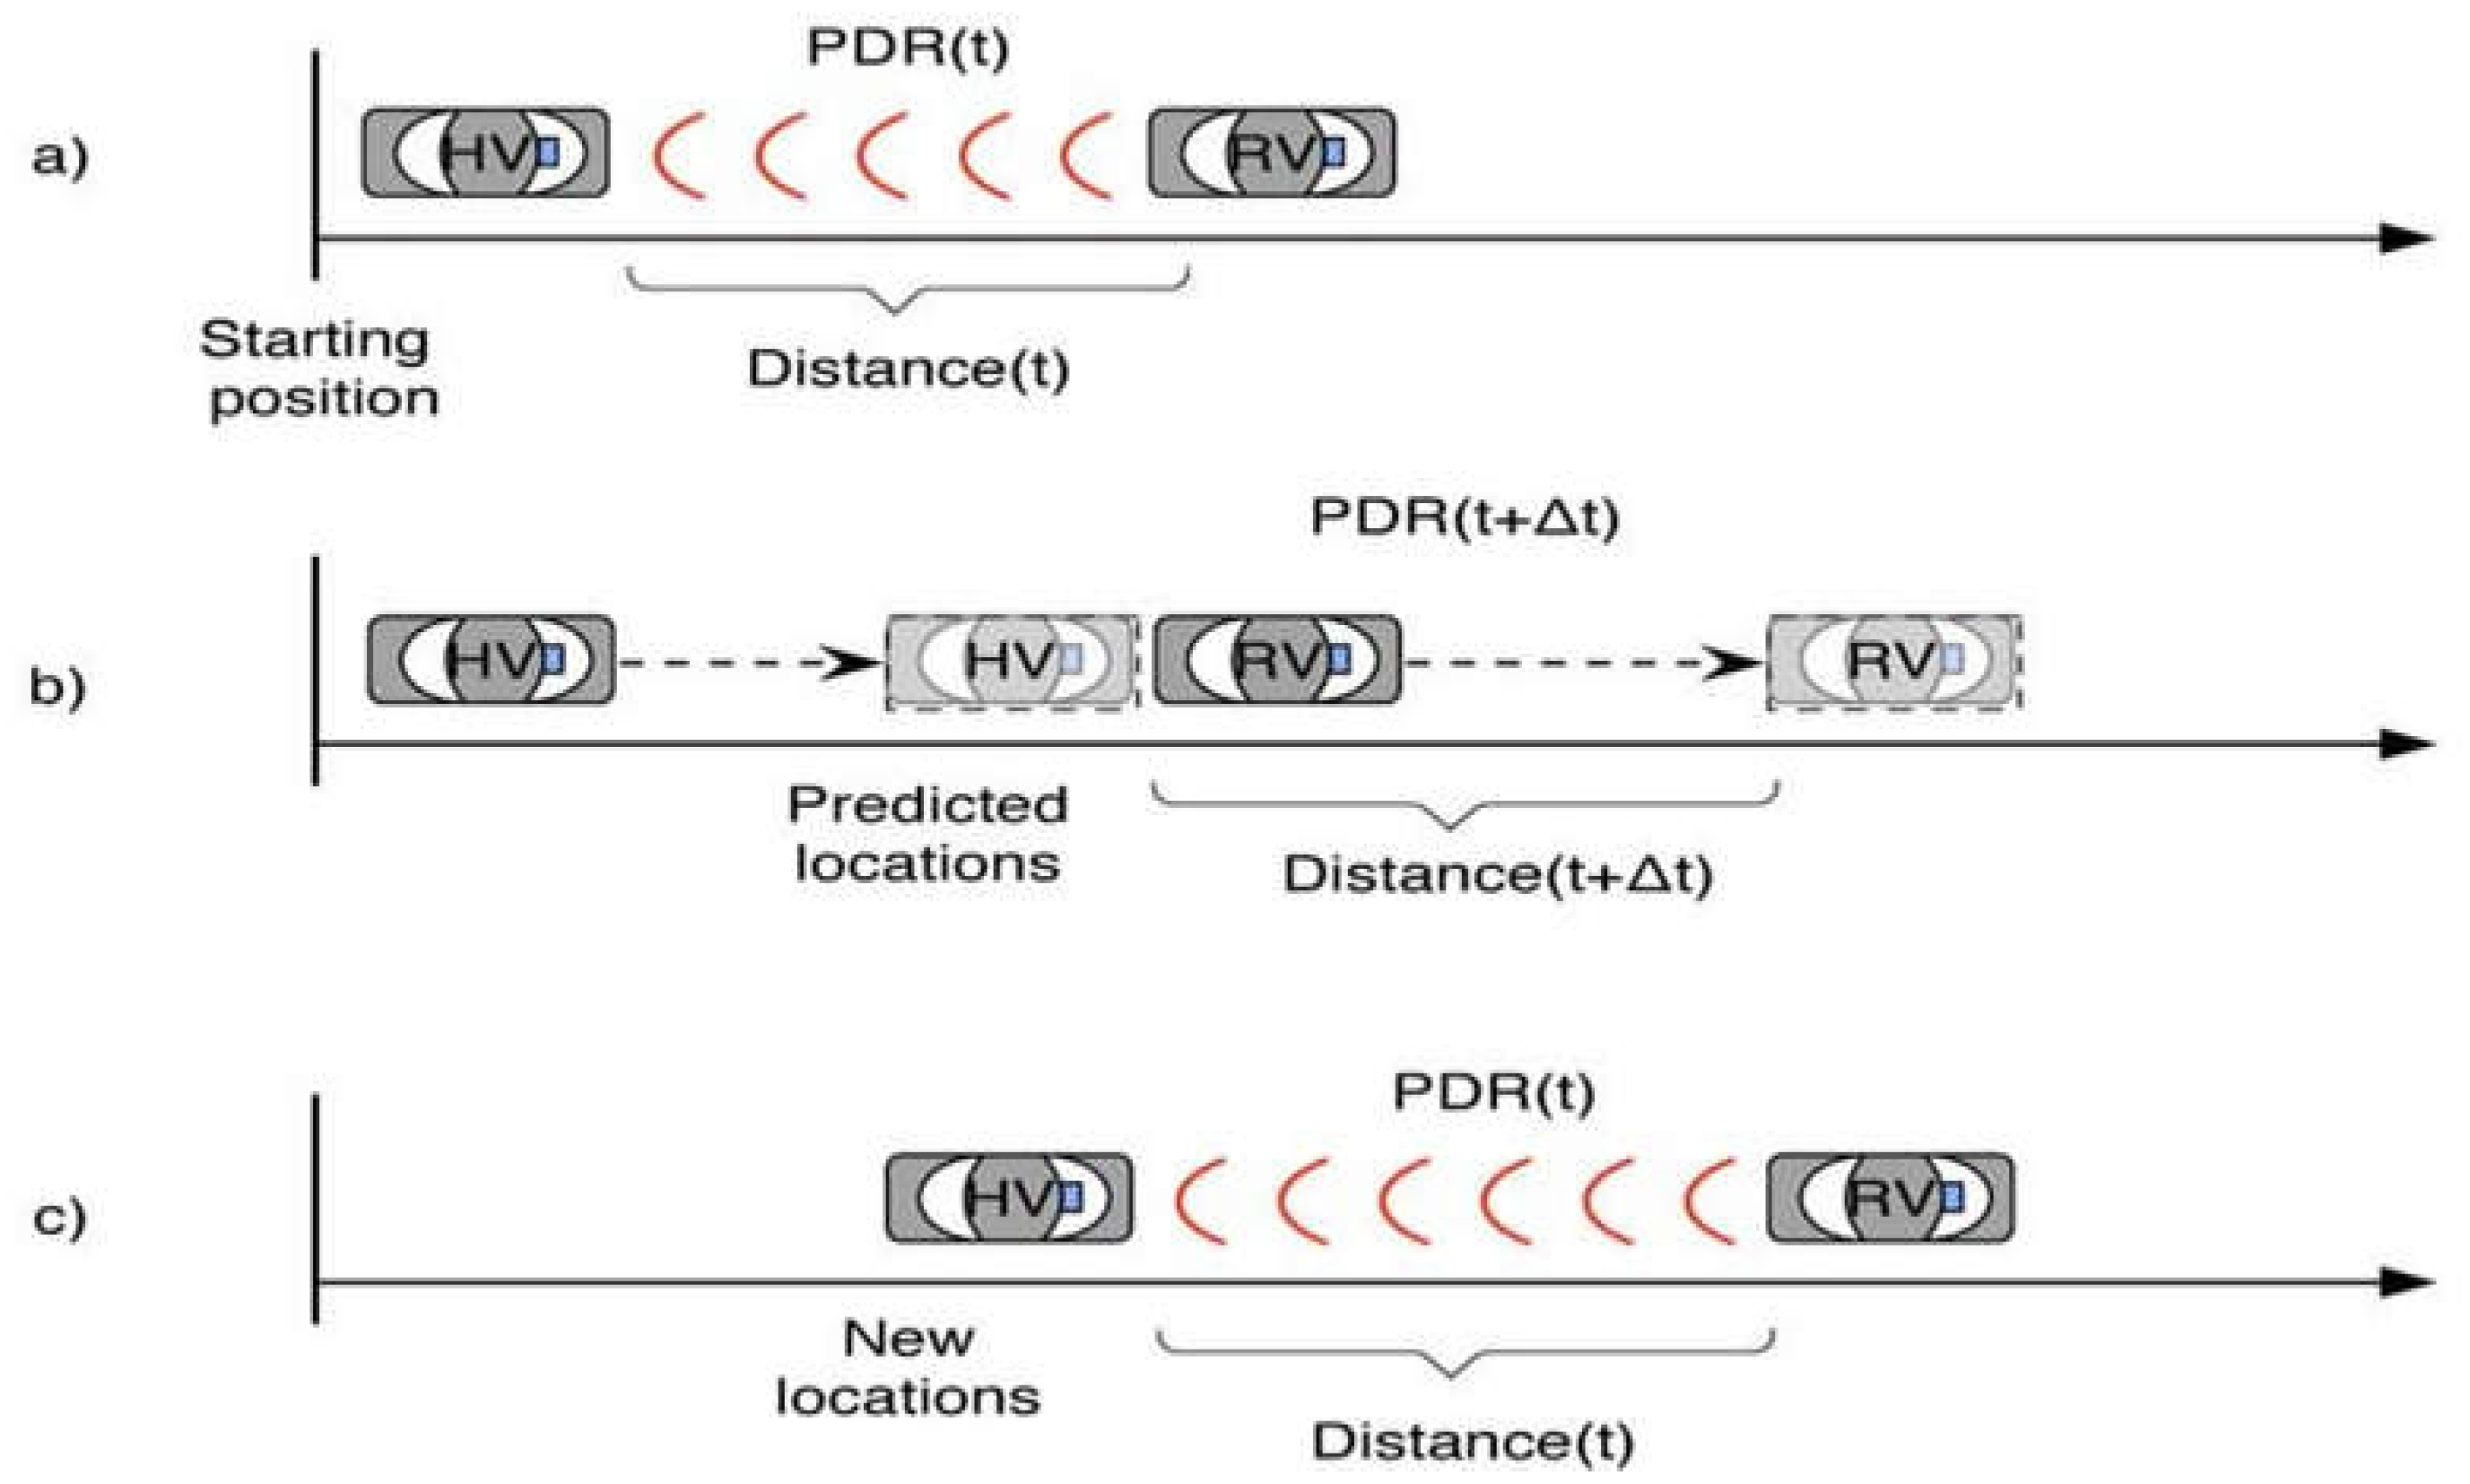
Figure 2.
model designed to detect jamming attacks.
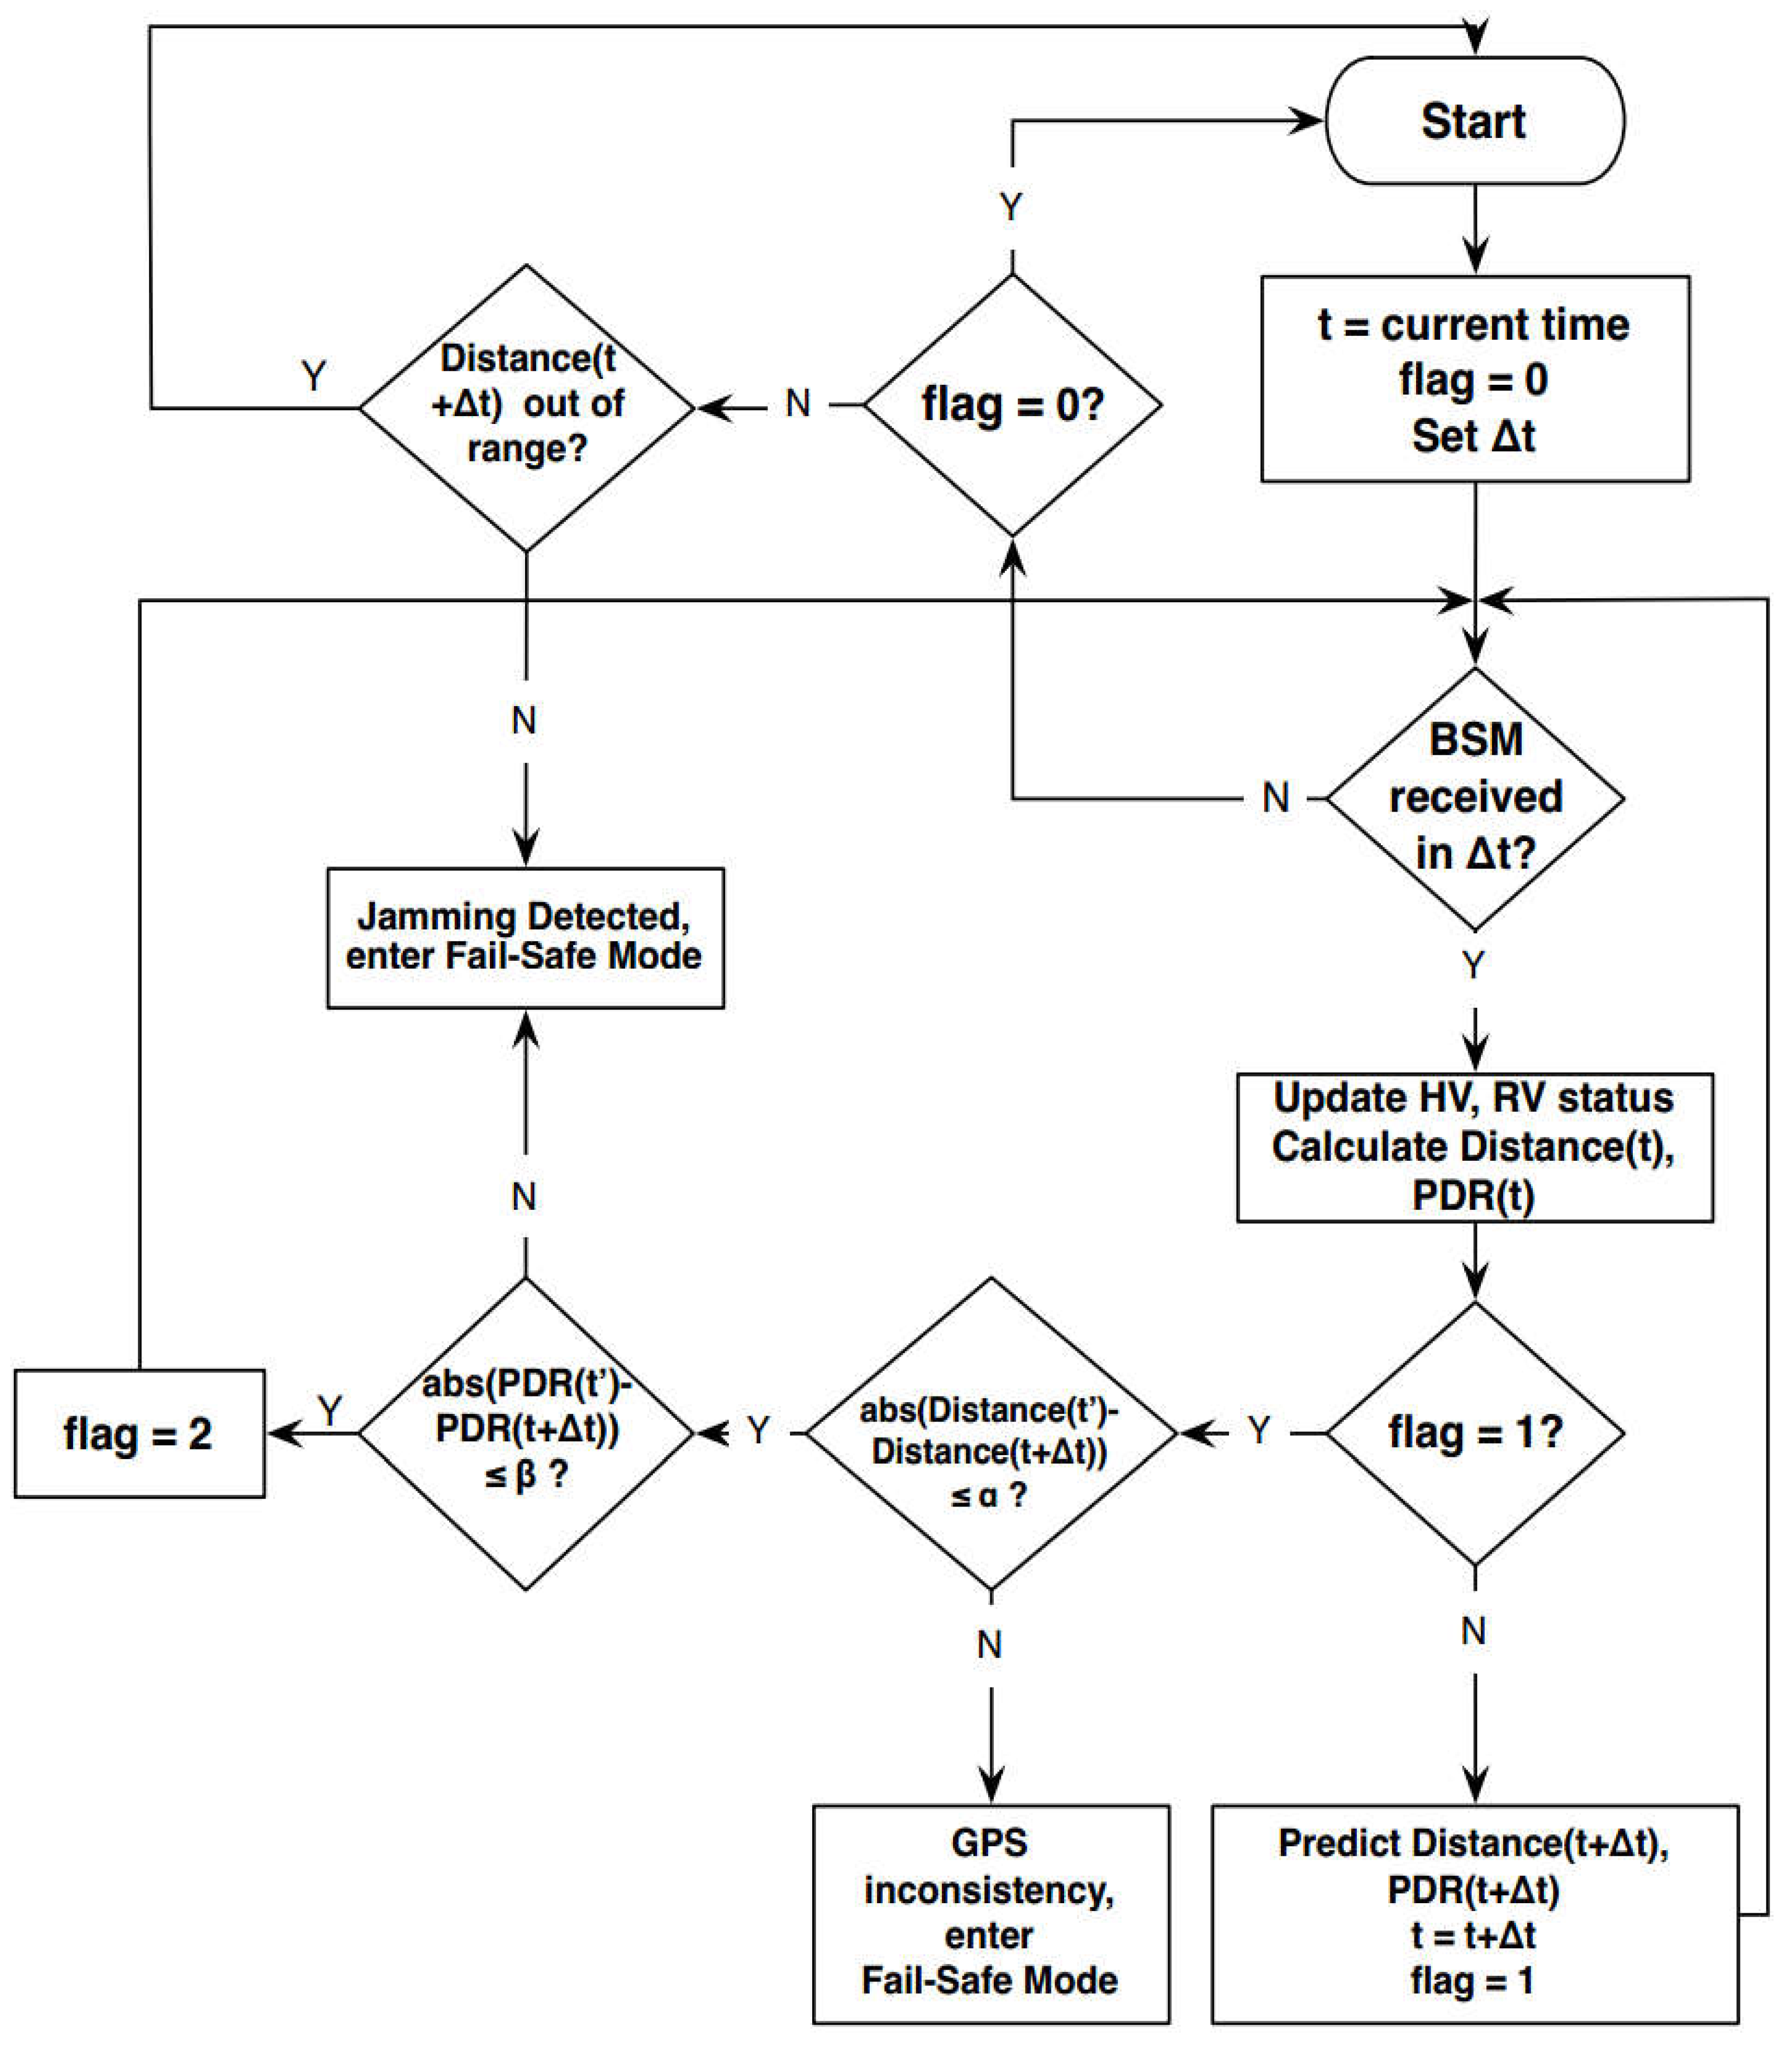
Figure 3.
Jamming impact regions.
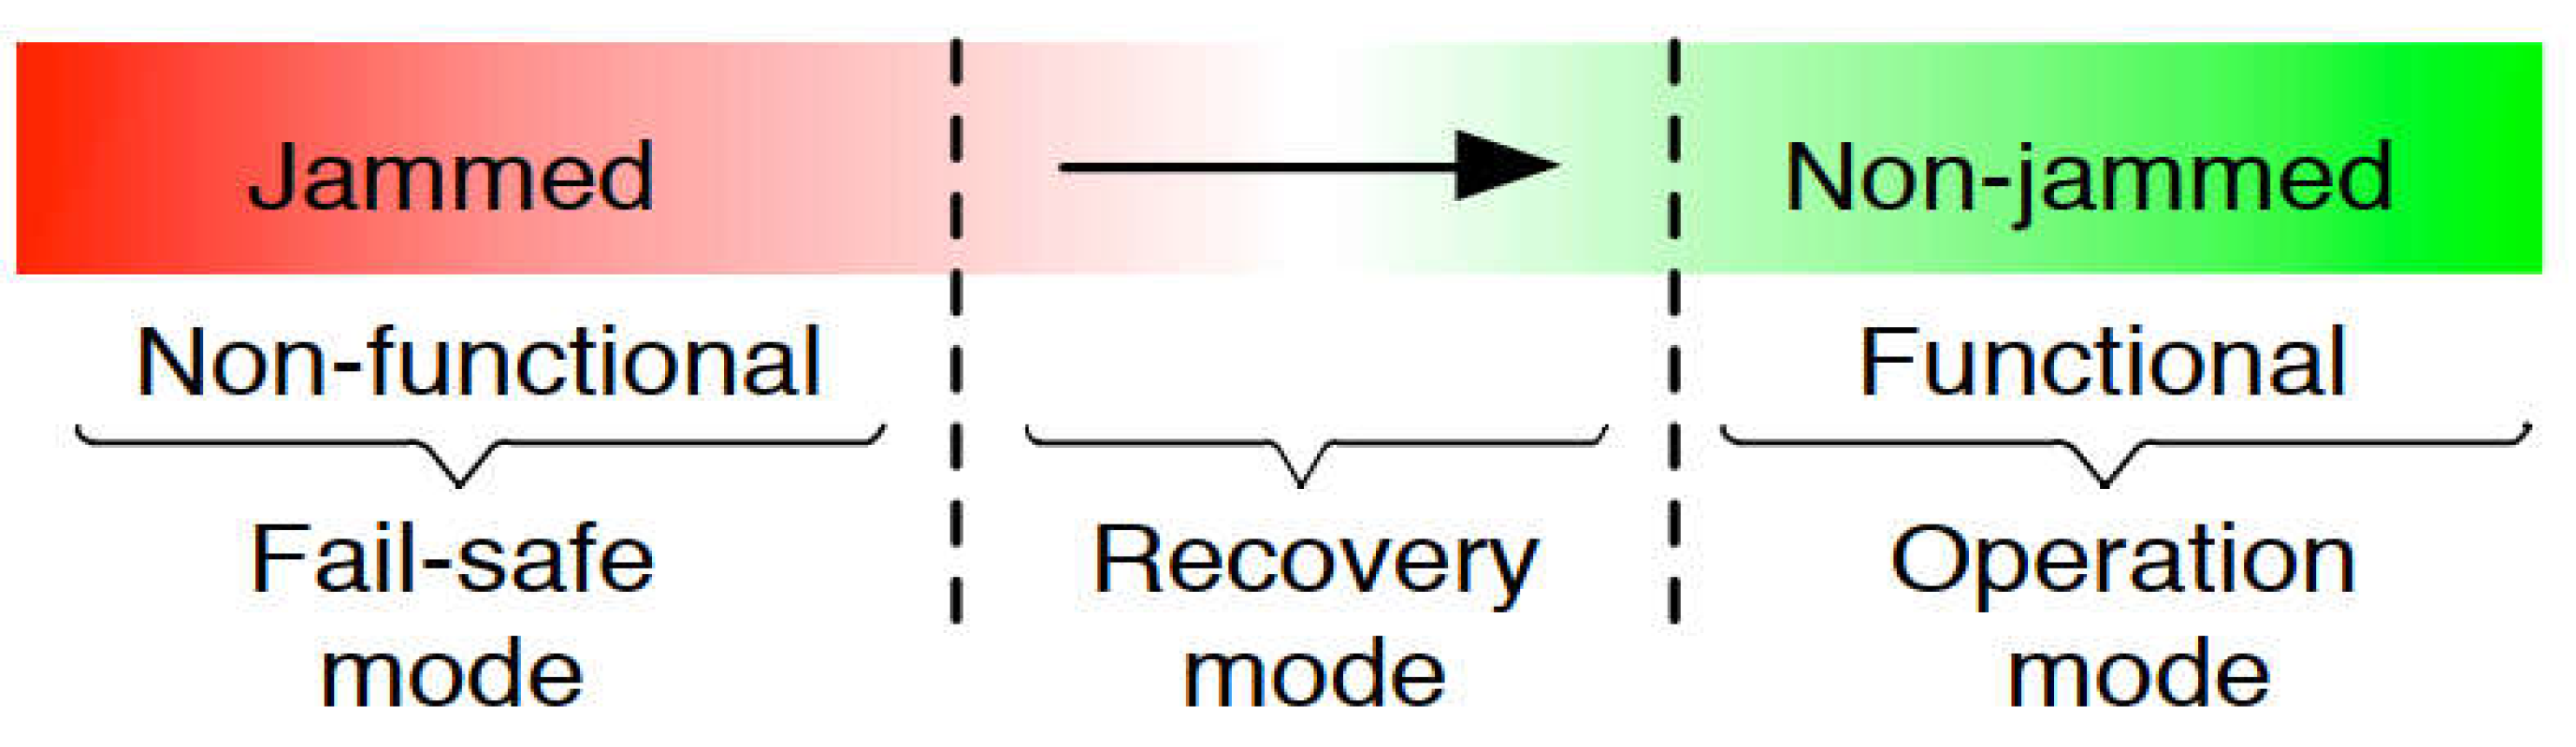
Figure 4.
Upper bound on BSM rates for different data rates.
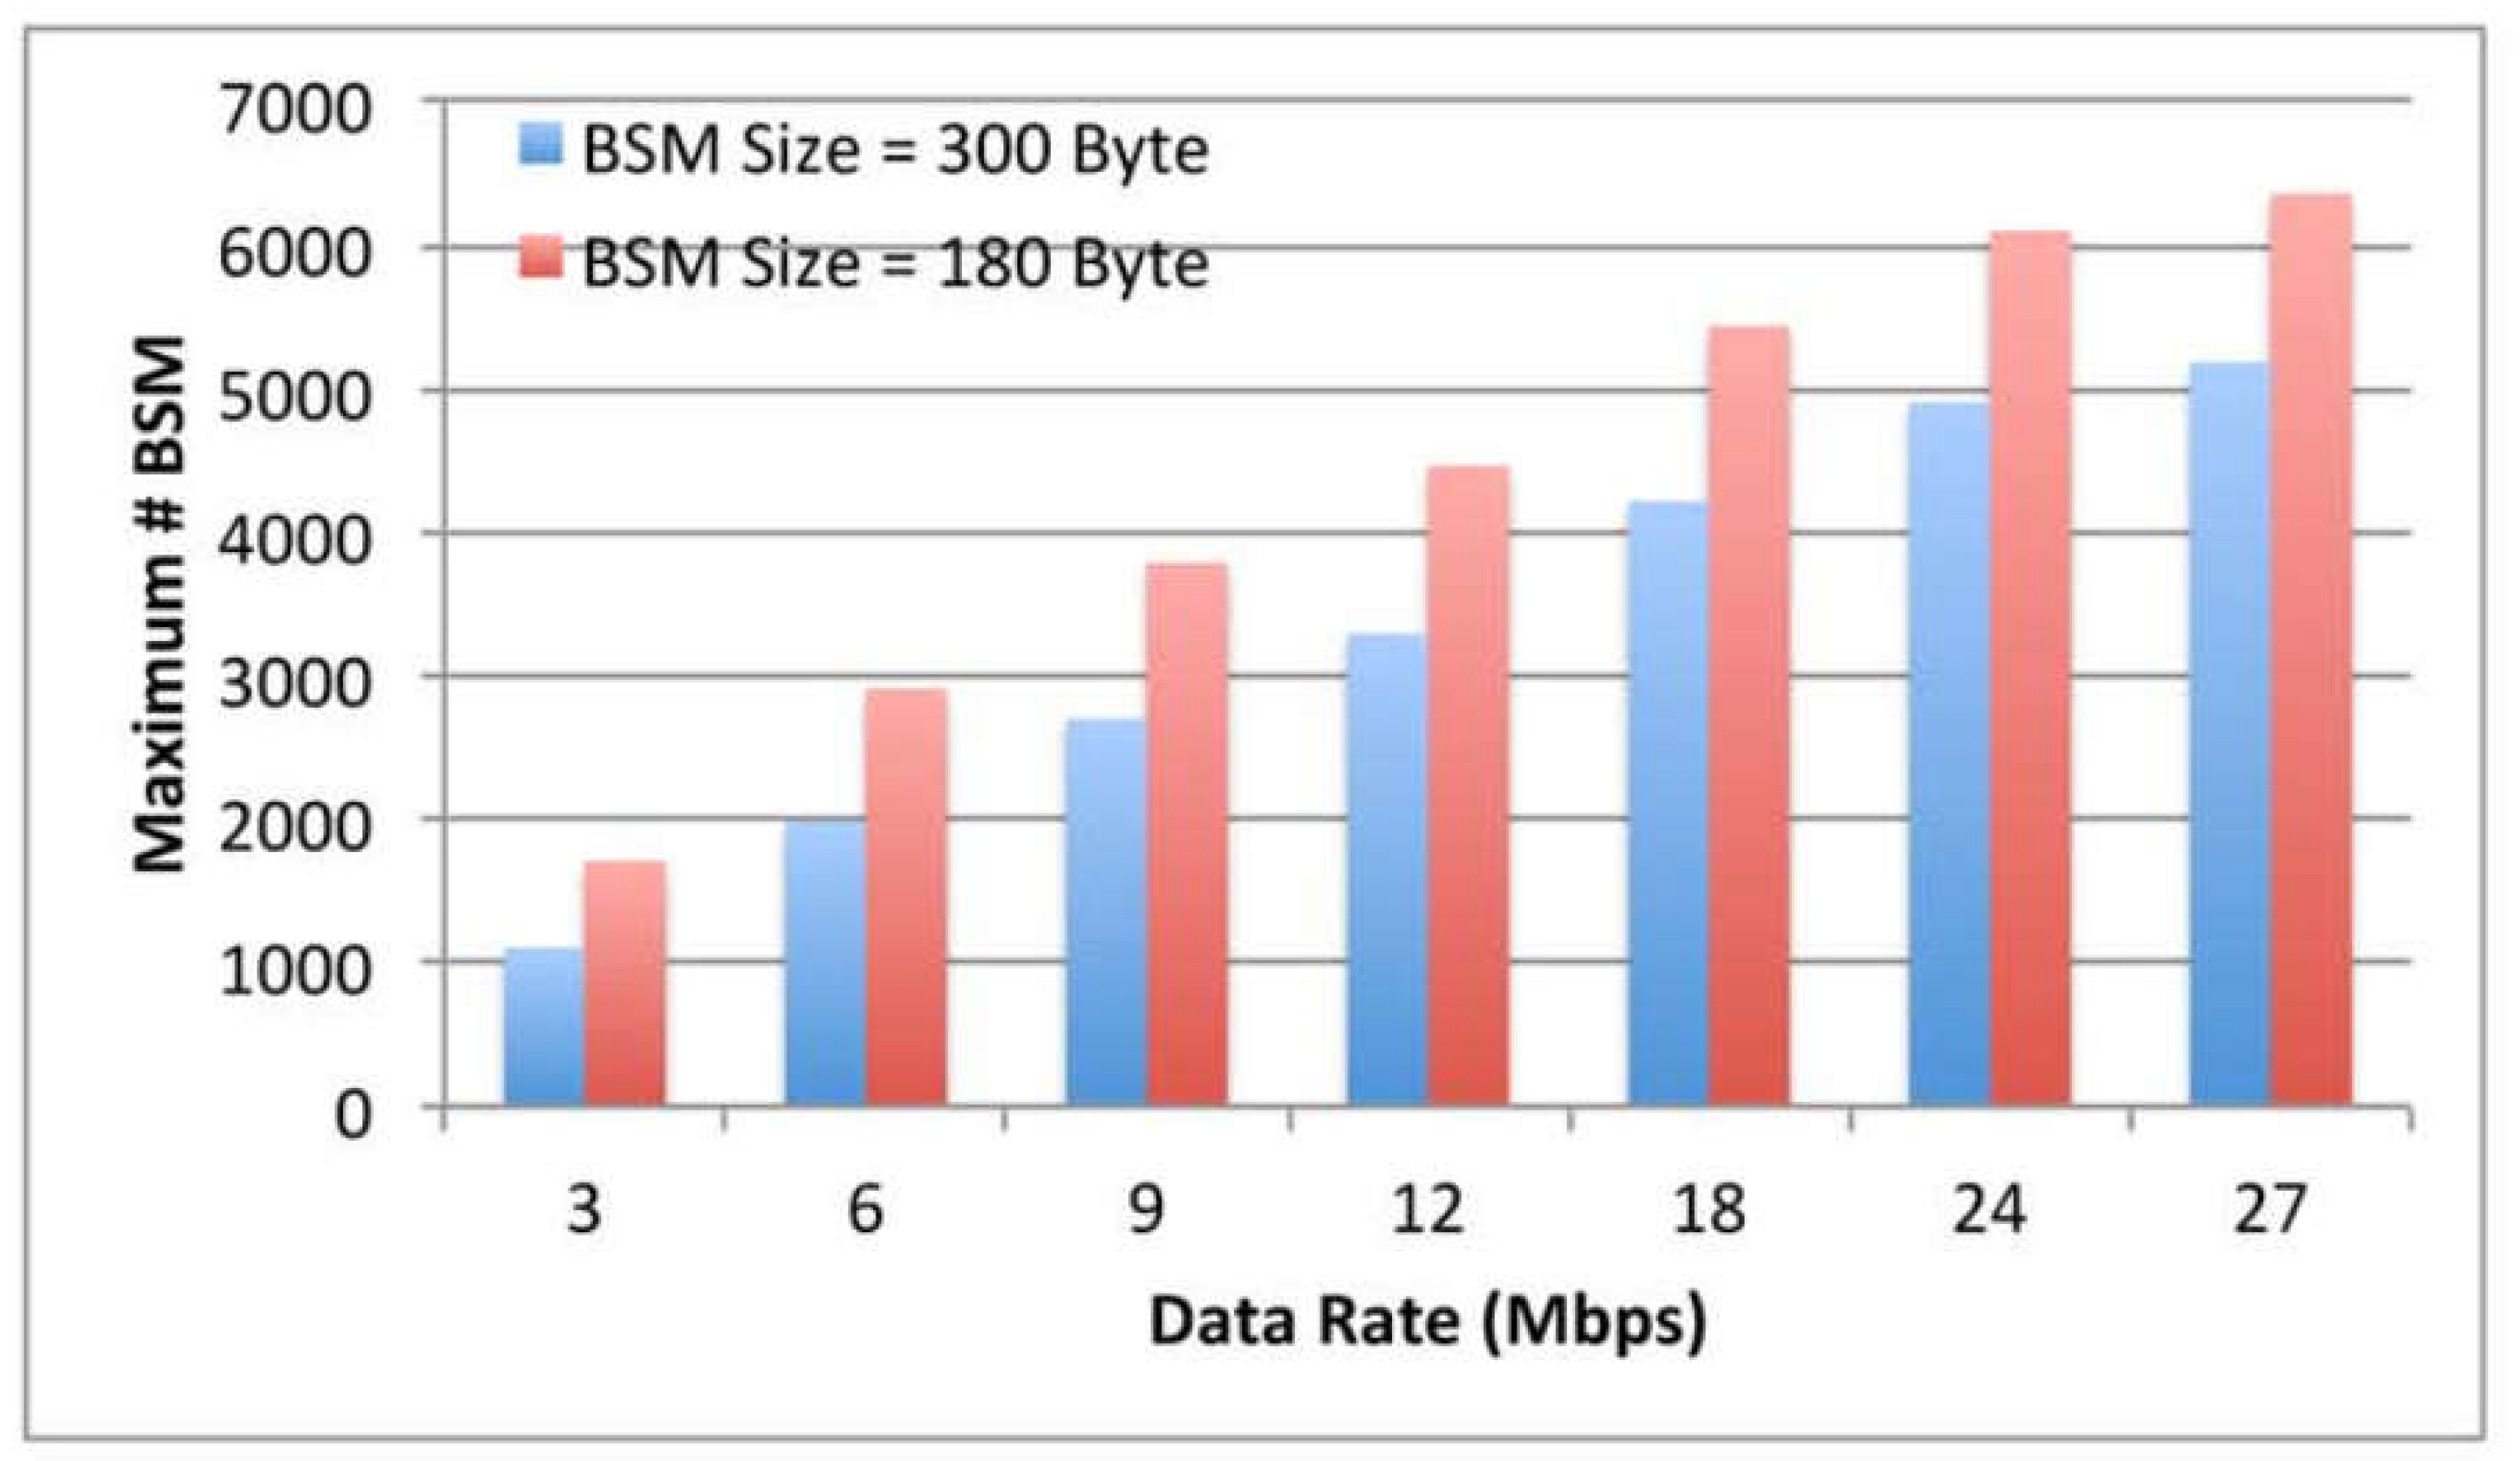
Figure 5.
Impact of direct collisions on PDR (BSM size=180 Byte, data rate=6Mbps, BSM rate= 10, 20, 30 BSM/s).
Figure 5.
Impact of direct collisions on PDR (BSM size=180 Byte, data rate=6Mbps, BSM rate= 10, 20, 30 BSM/s).
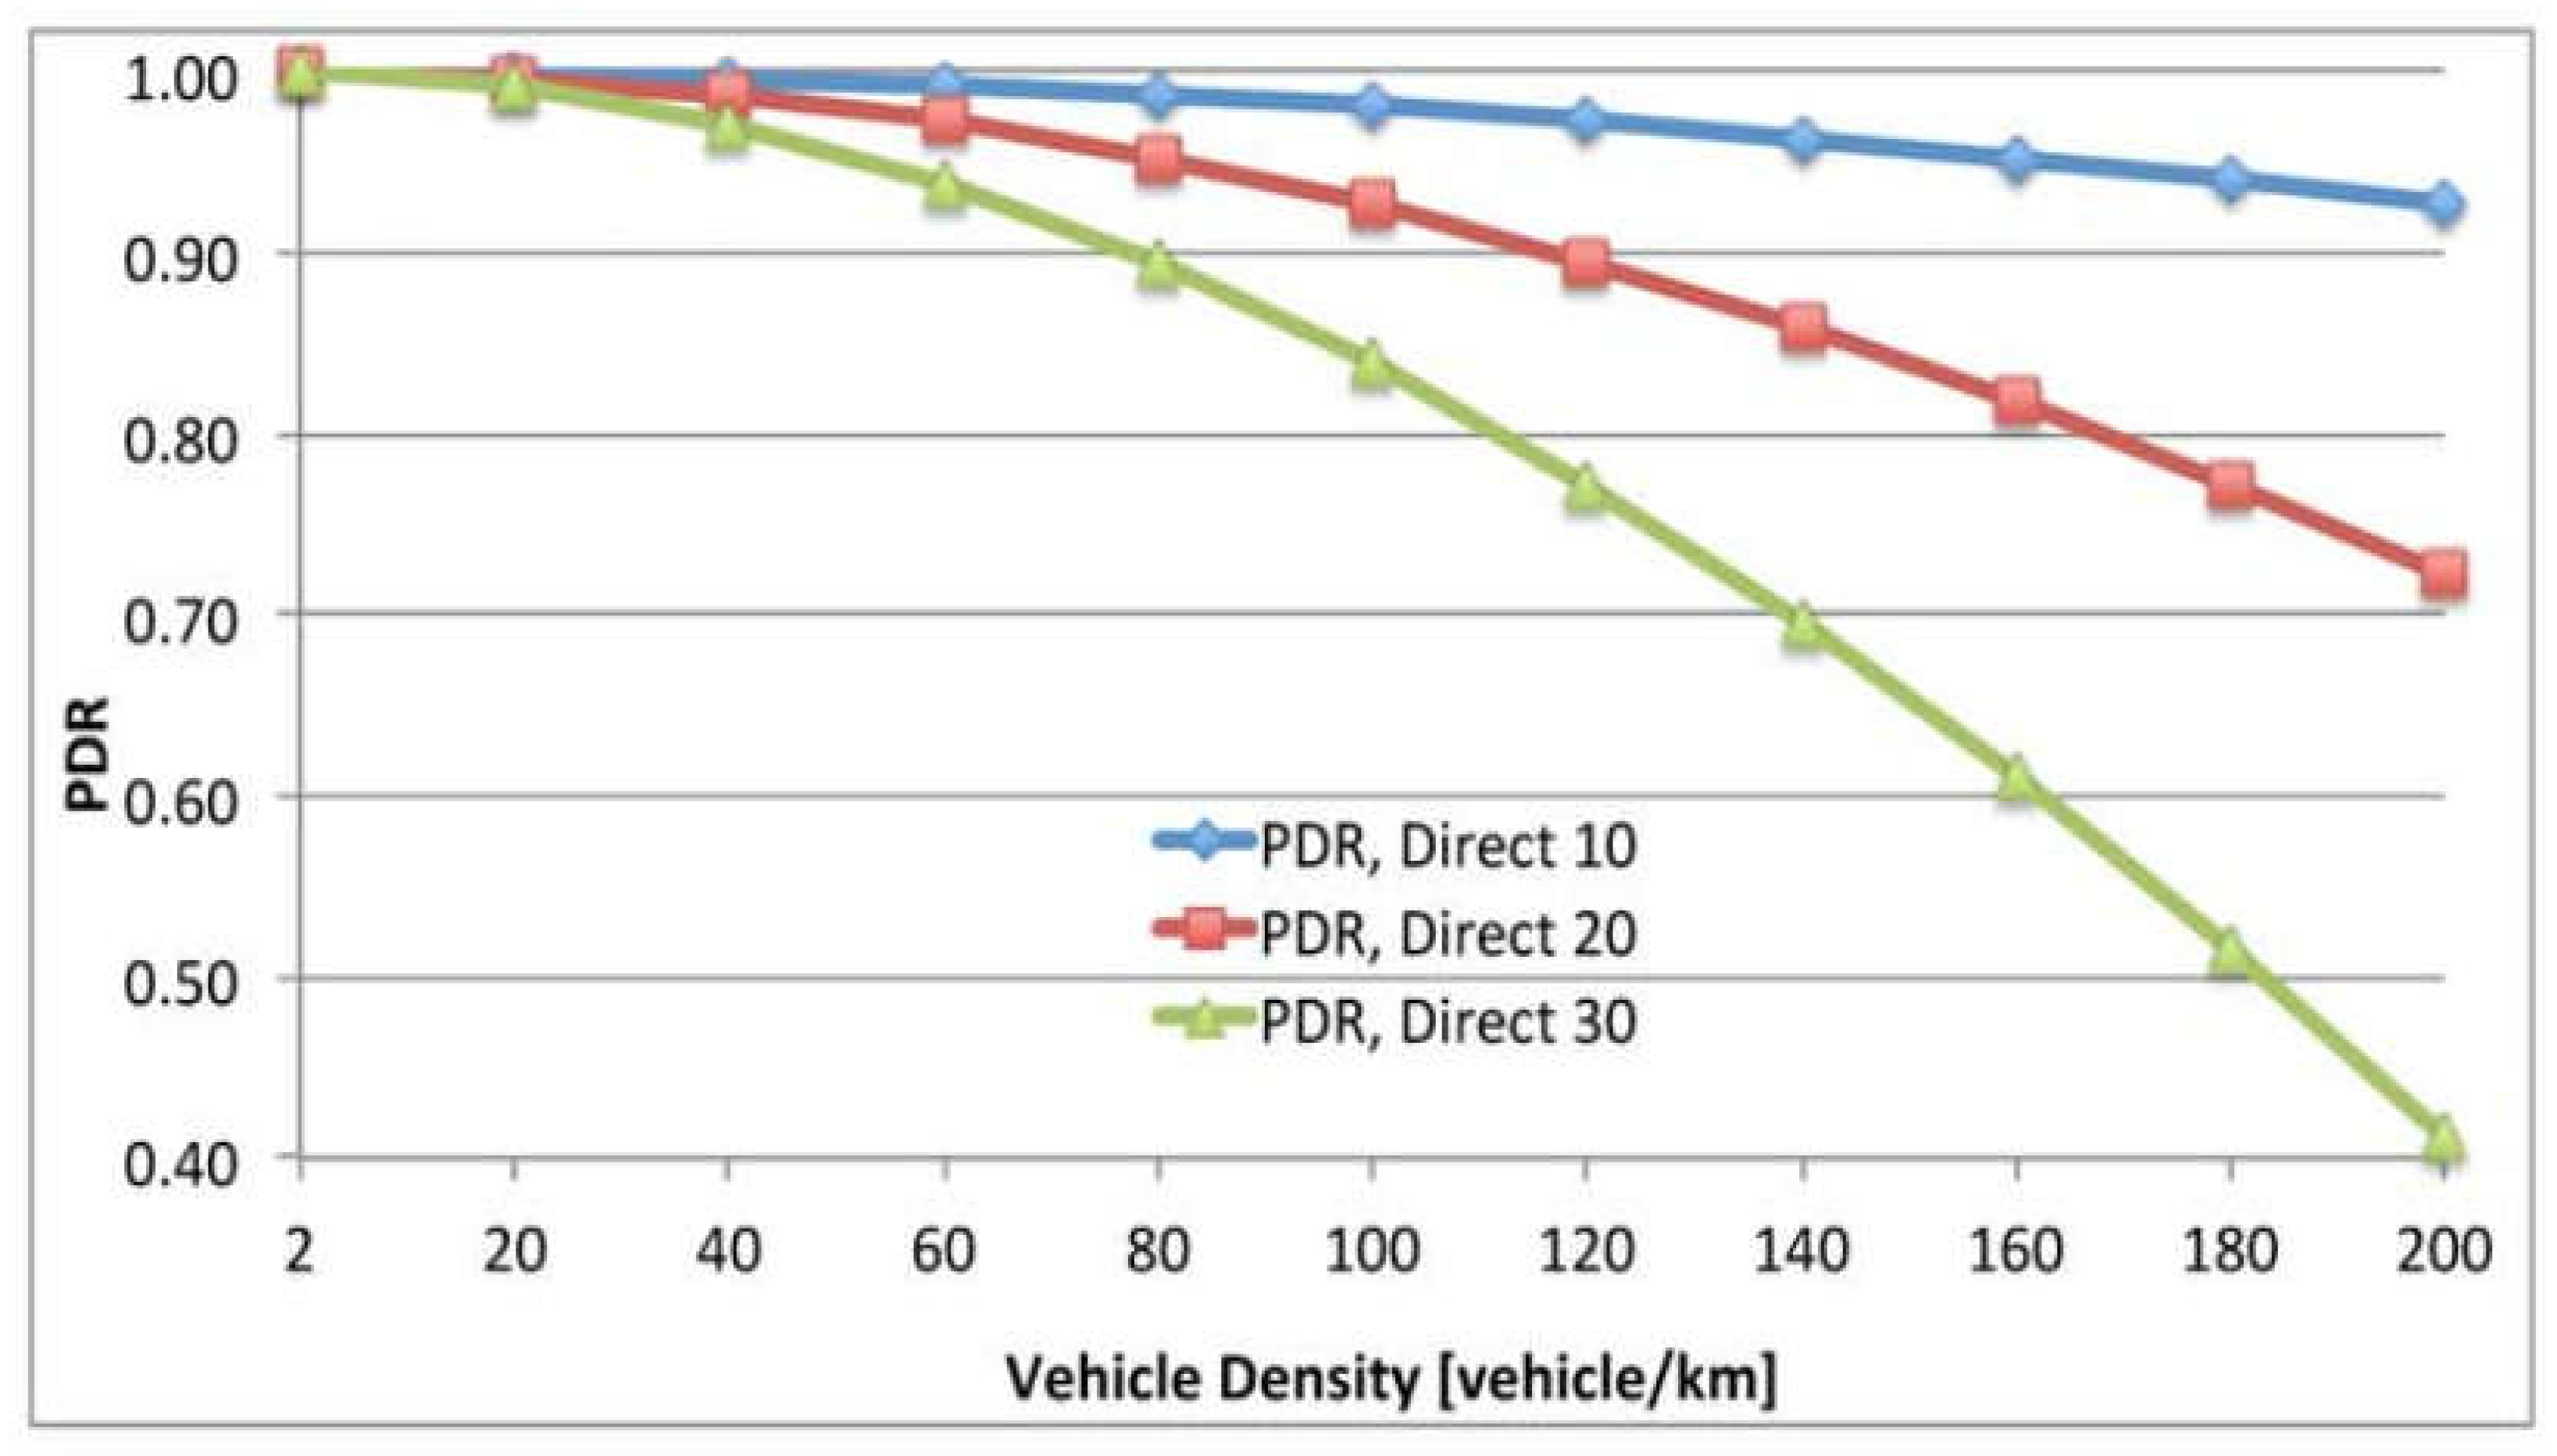
Figure 6.
Impact of collisions resulting from hidden terminals (BSM size=180 Byte, data rate=6Mbps, BSM rate=10, 20,30 BSM/s).
Figure 6.
Impact of collisions resulting from hidden terminals (BSM size=180 Byte, data rate=6Mbps, BSM rate=10, 20,30 BSM/s).
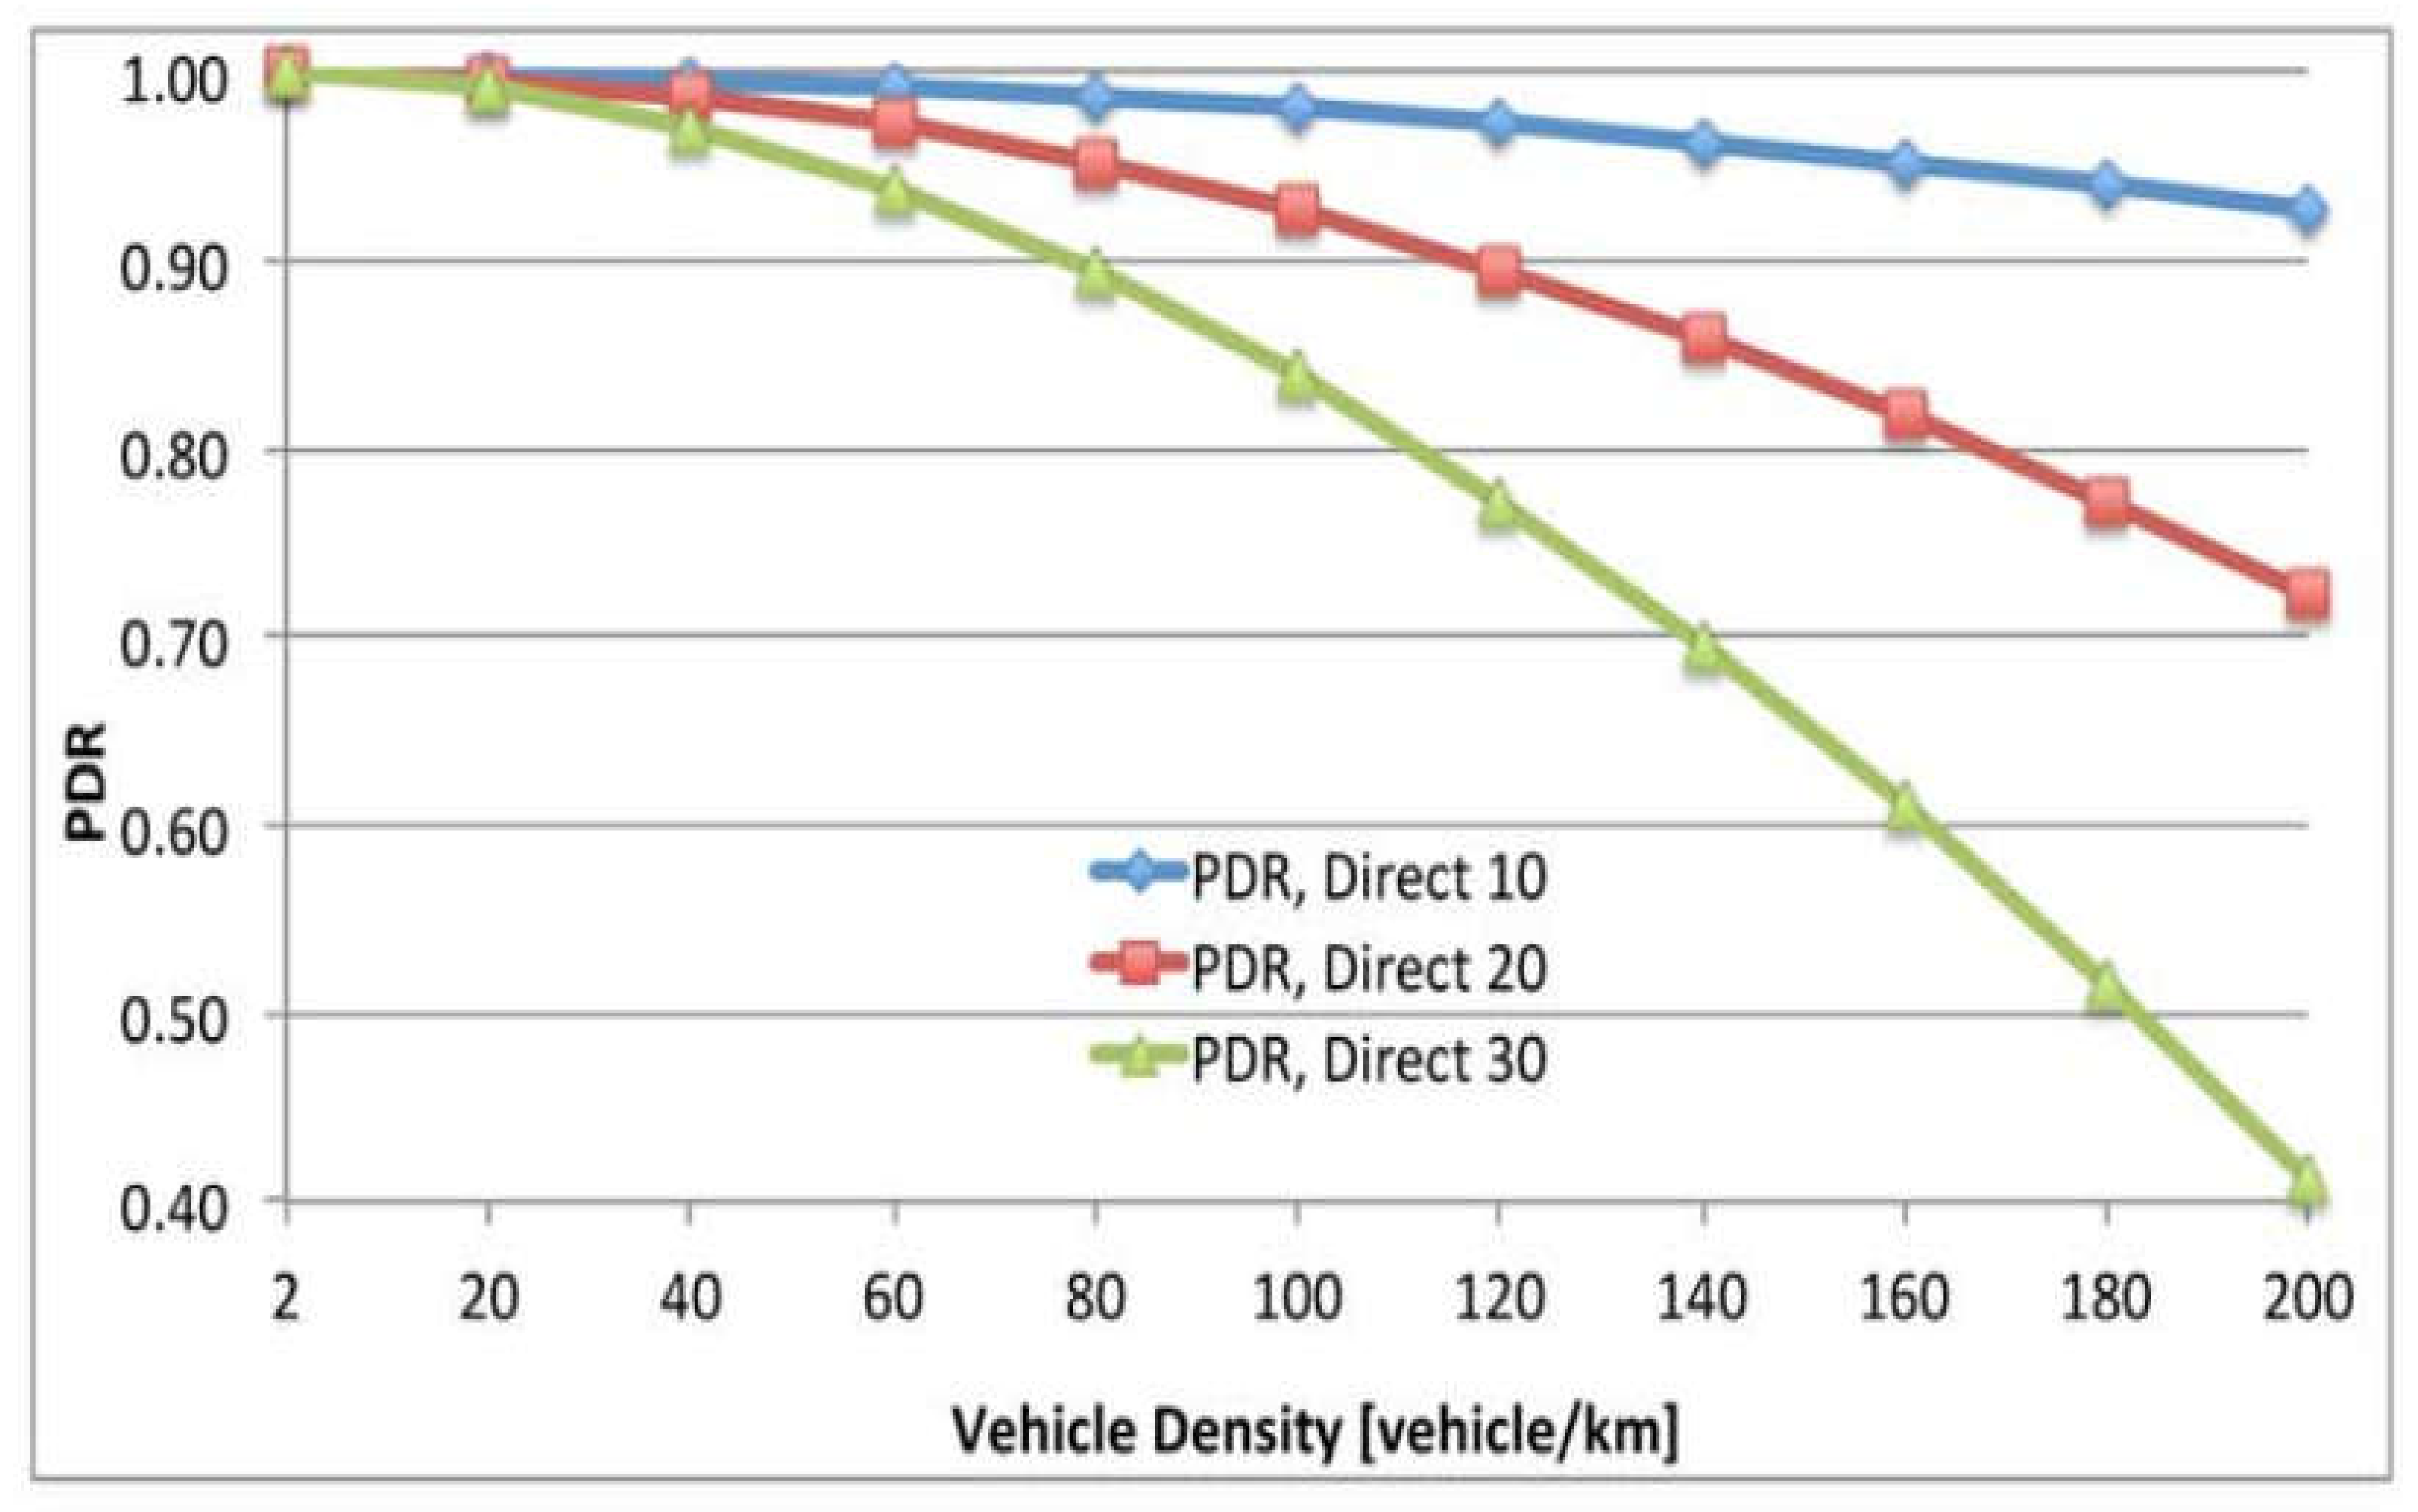
Figure 7.
The jammer recovery model Algorithm.
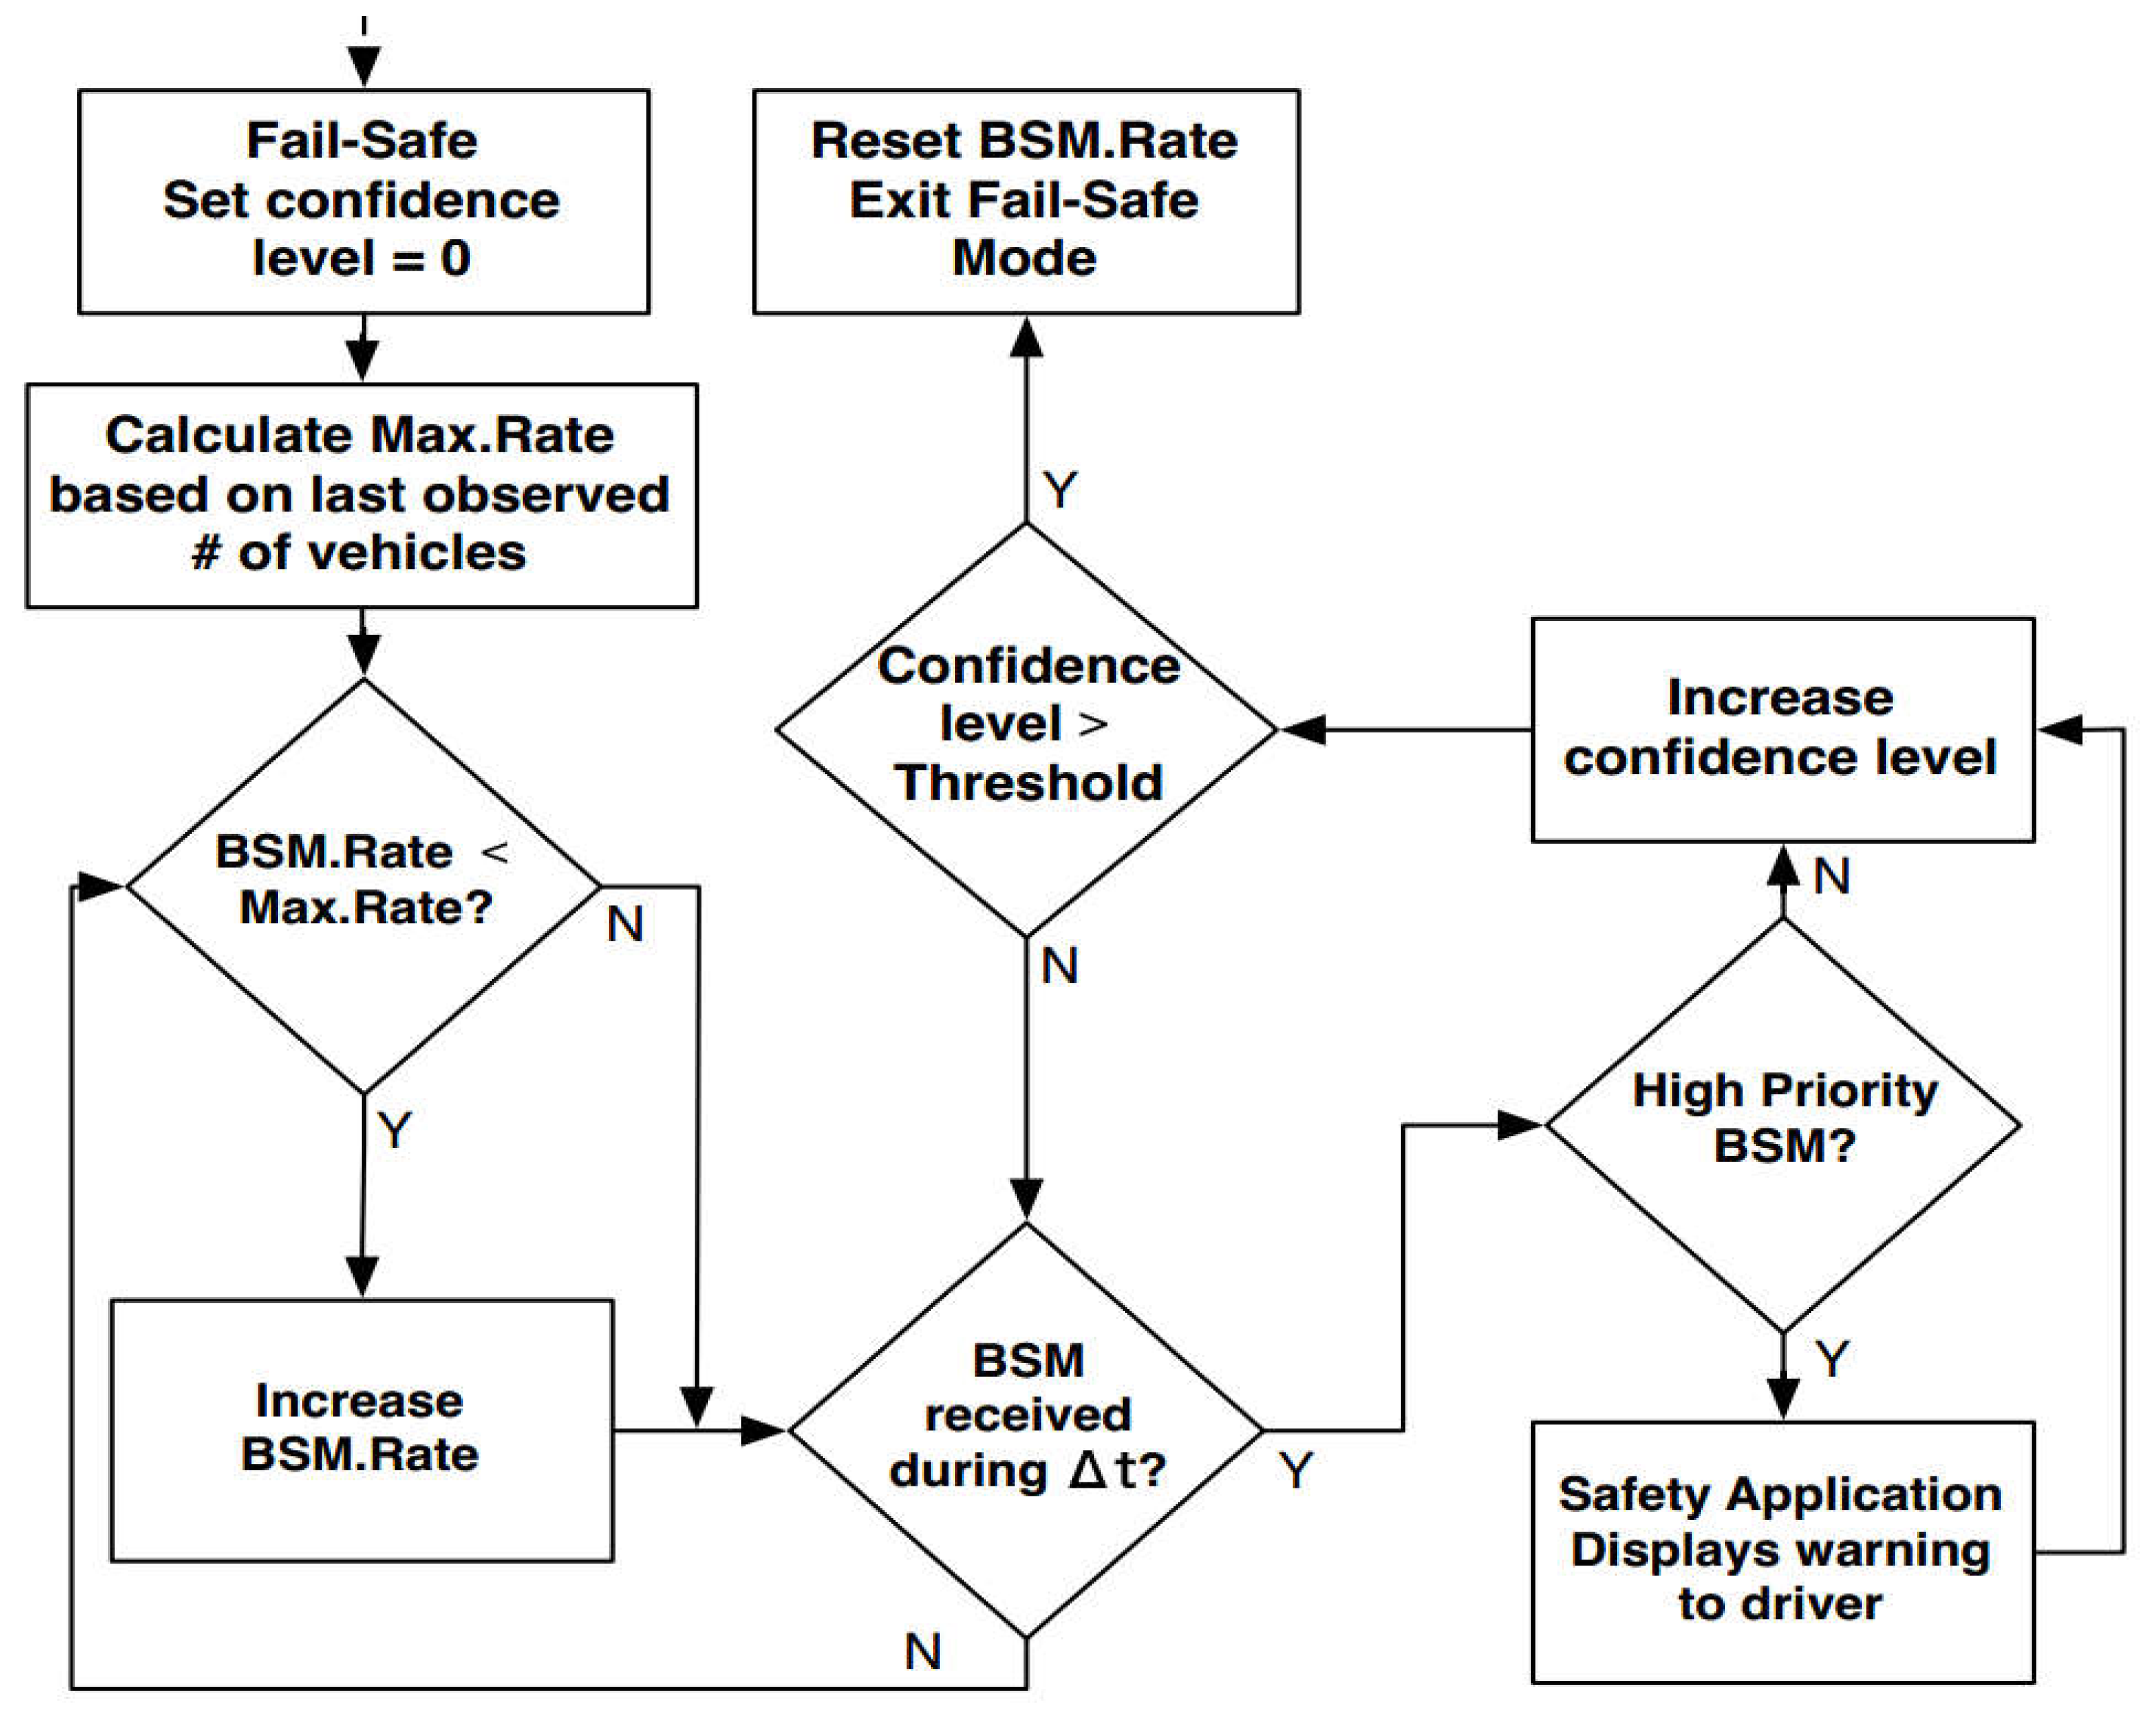
Figure 8.
Estimated PDR for 3 Mbps.
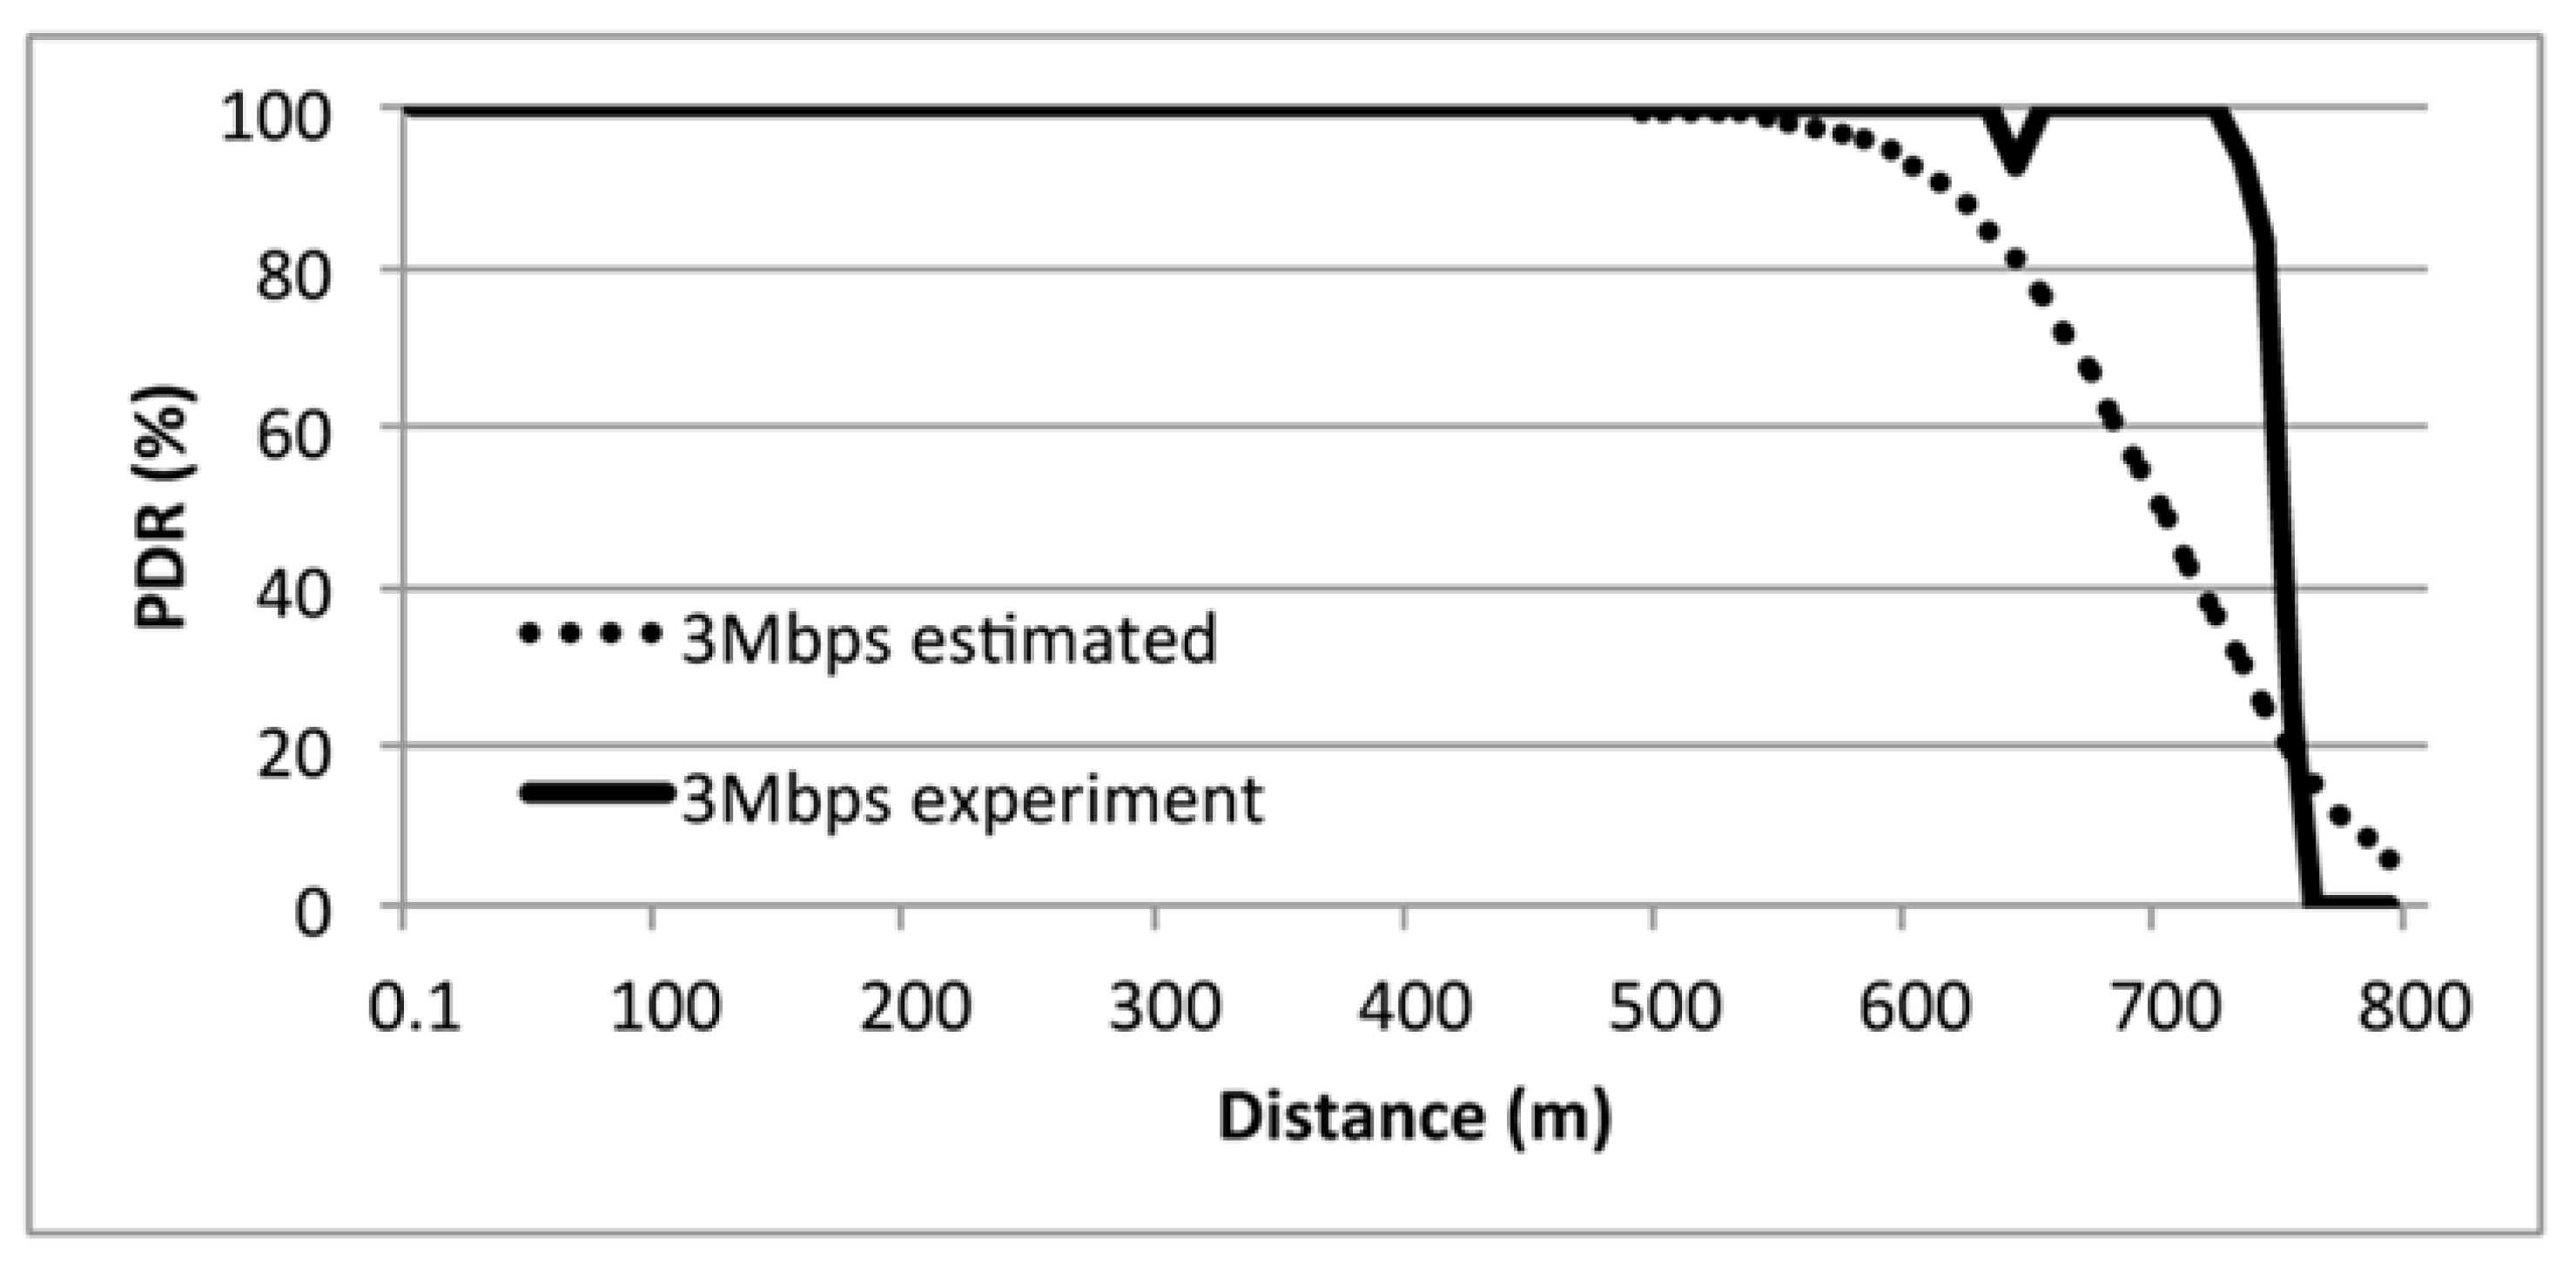
Figure 9.
Estimated PDR for 6 Mbps.
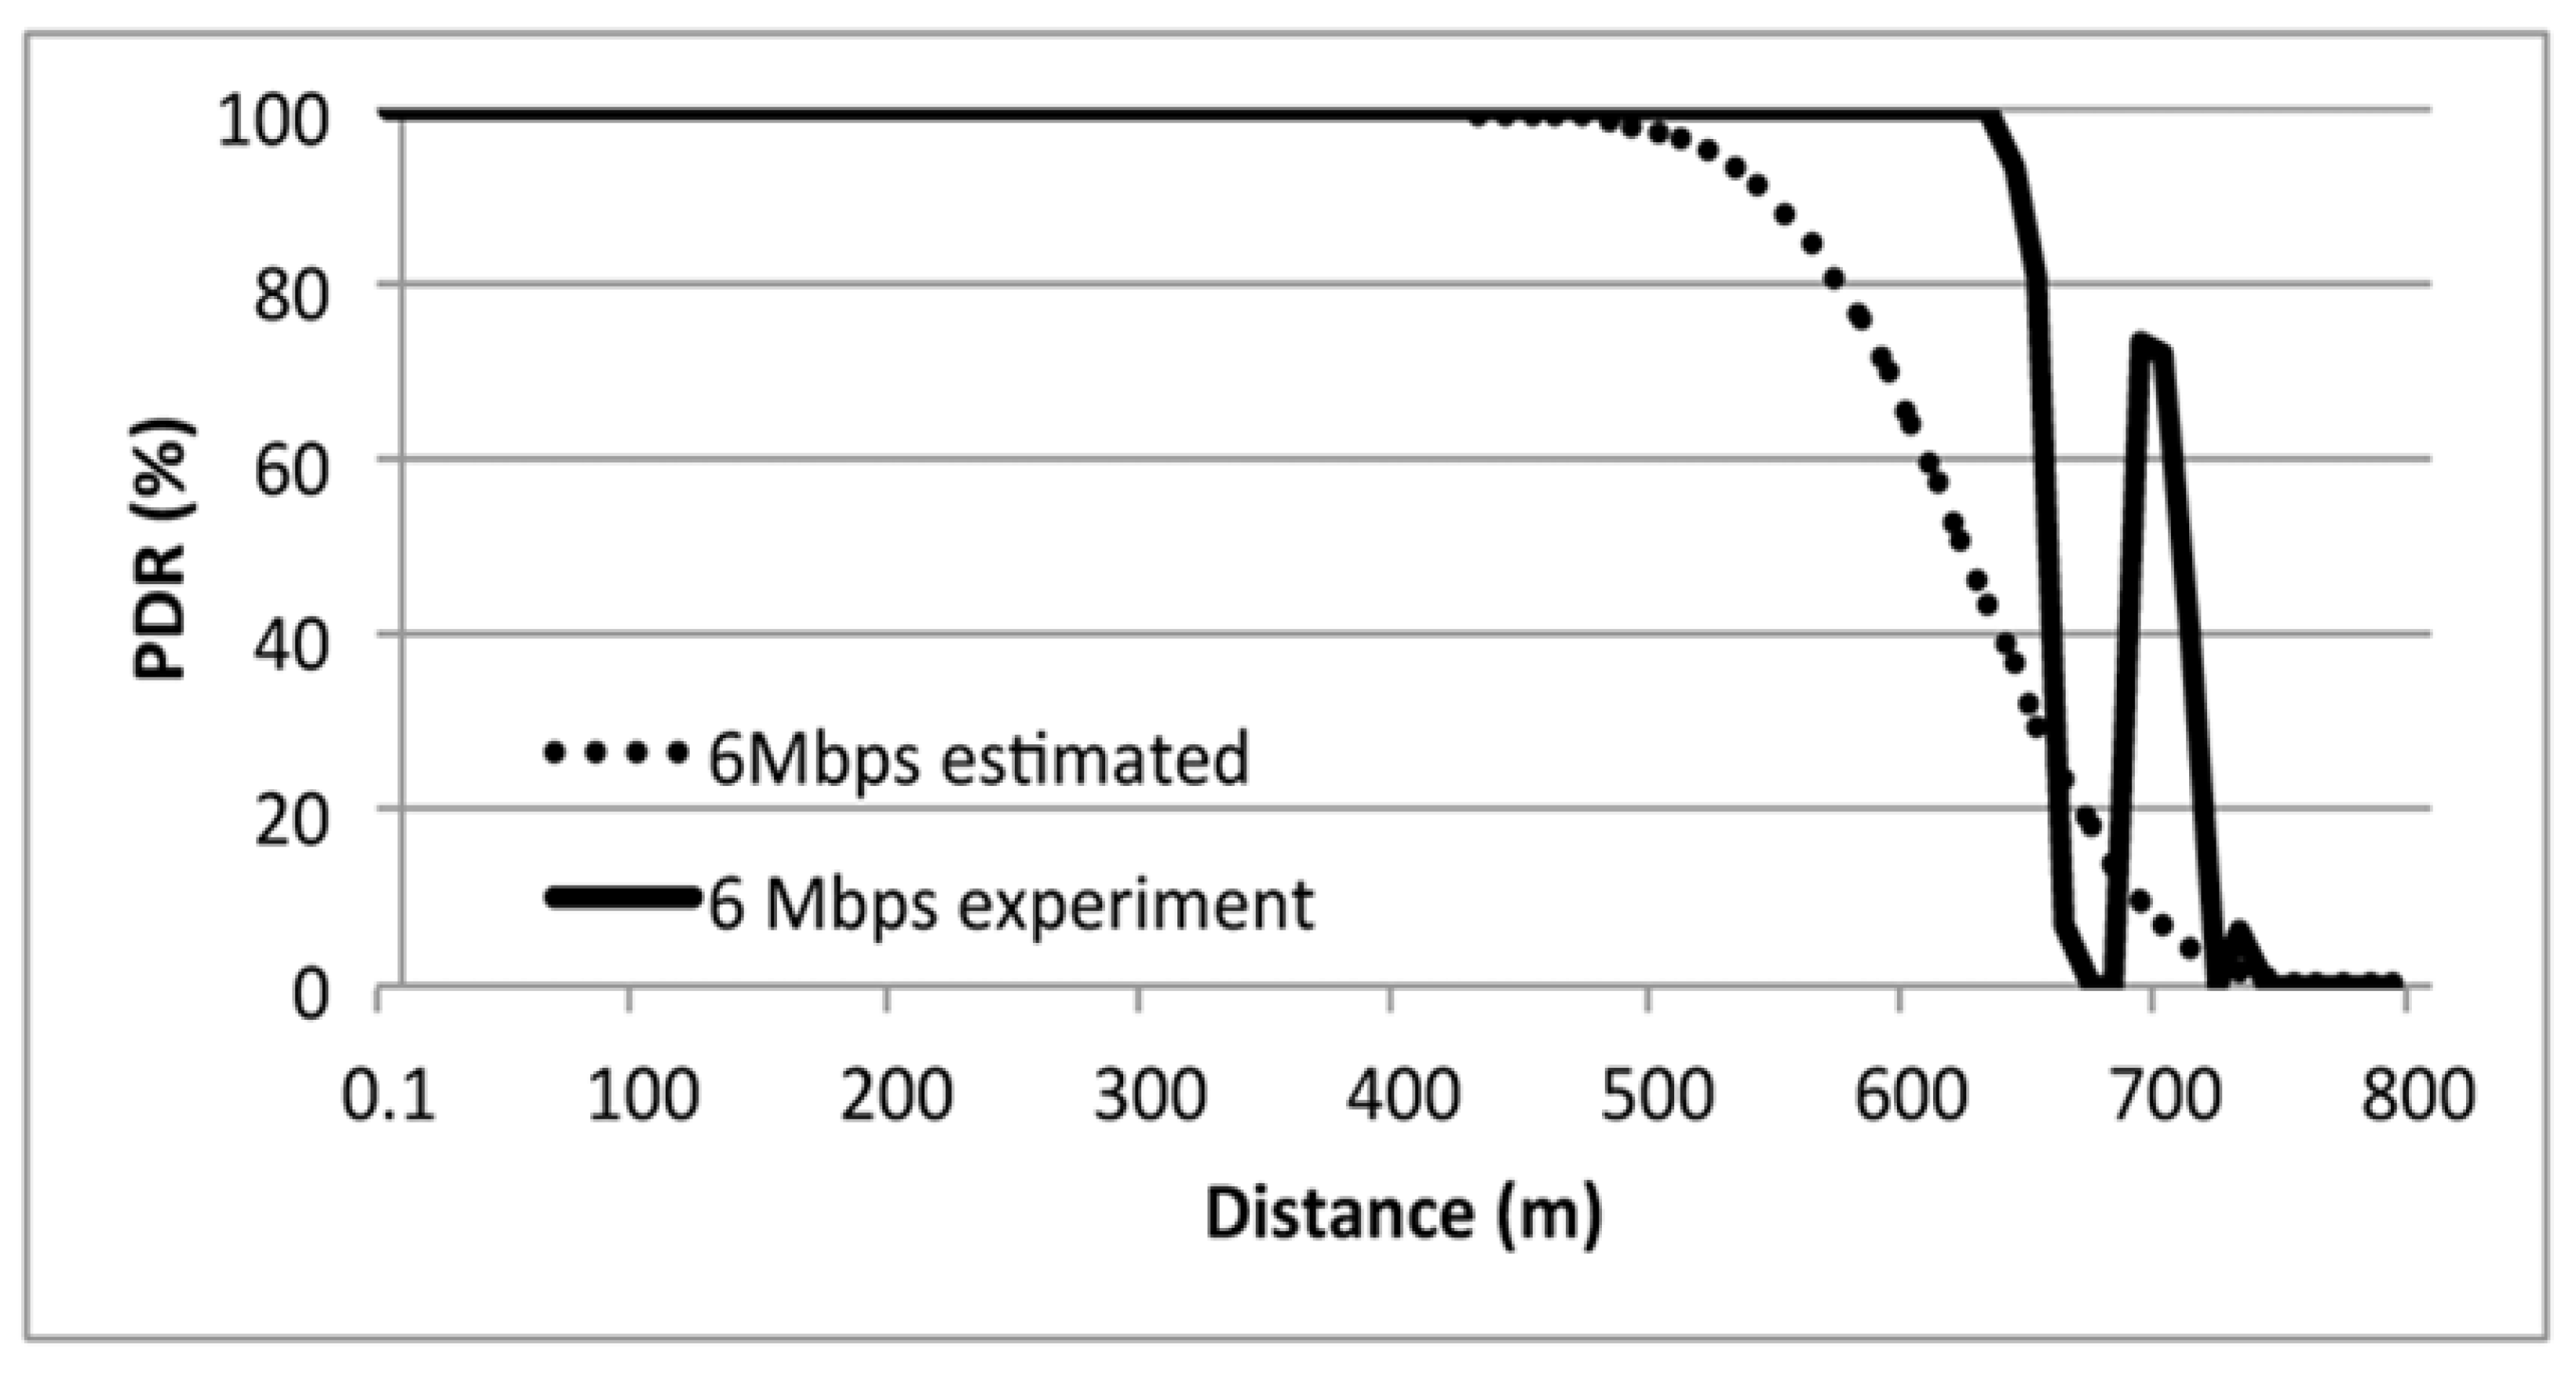
Figure 10.
PDR at 3 Mbps with deceptive jamming.
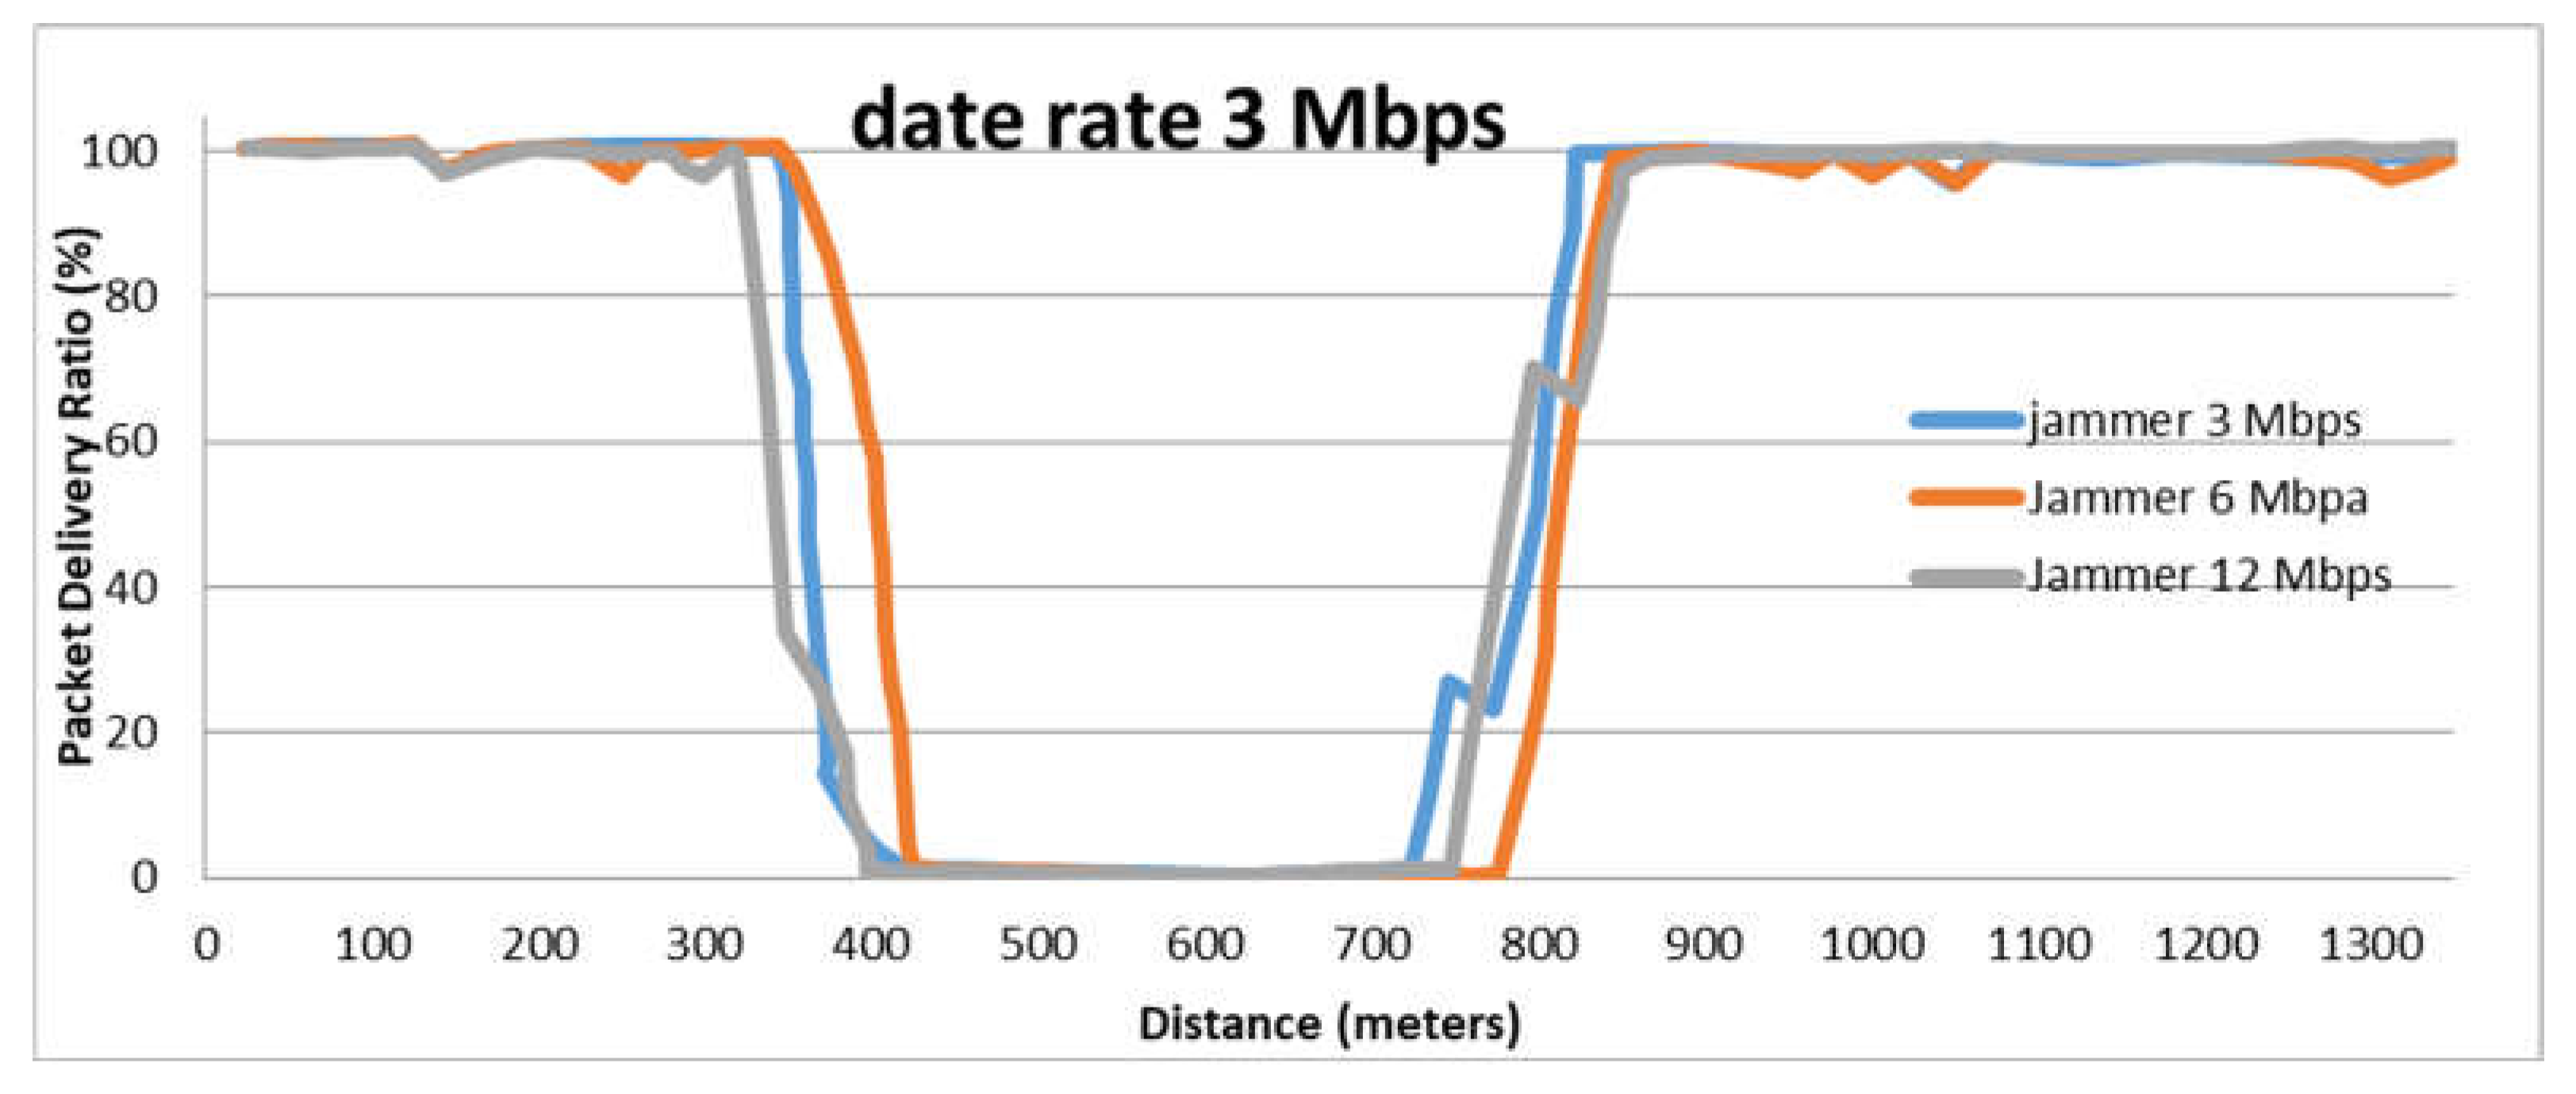
Figure 11.
PDR at 6 Mbps on jamming deceptive.
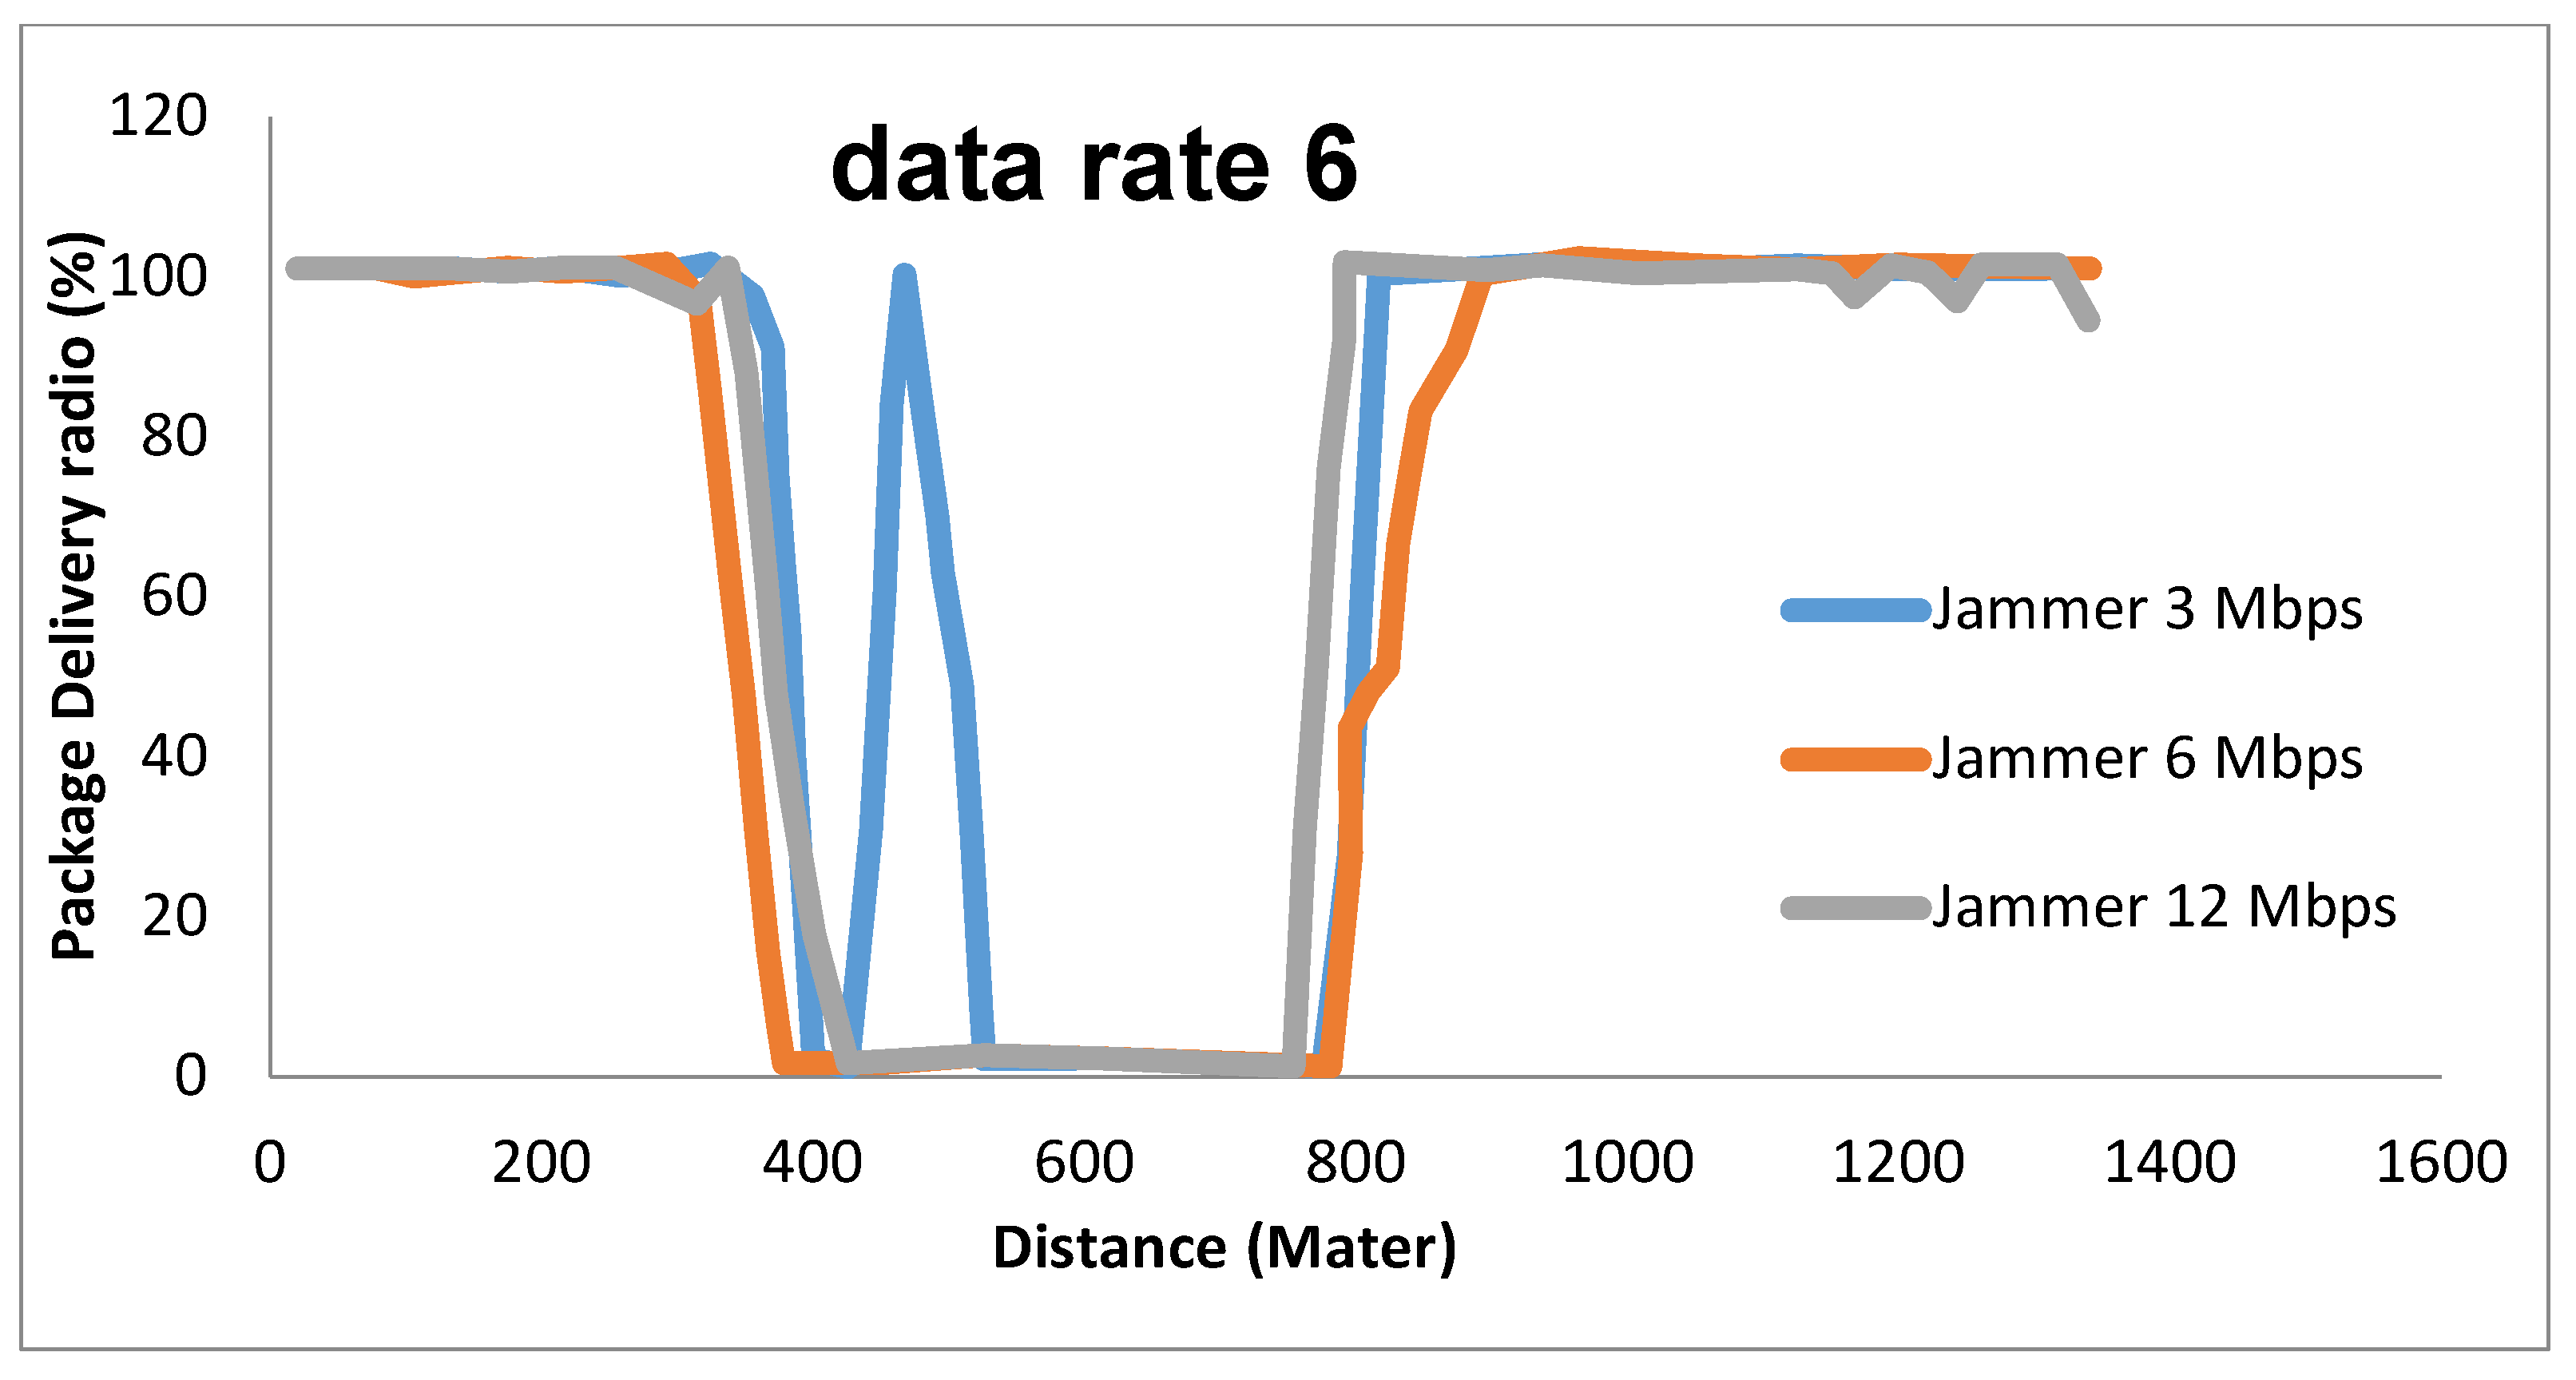
Figure 12.
of Jamming Attack Evaluation Algorithm in Data rate.
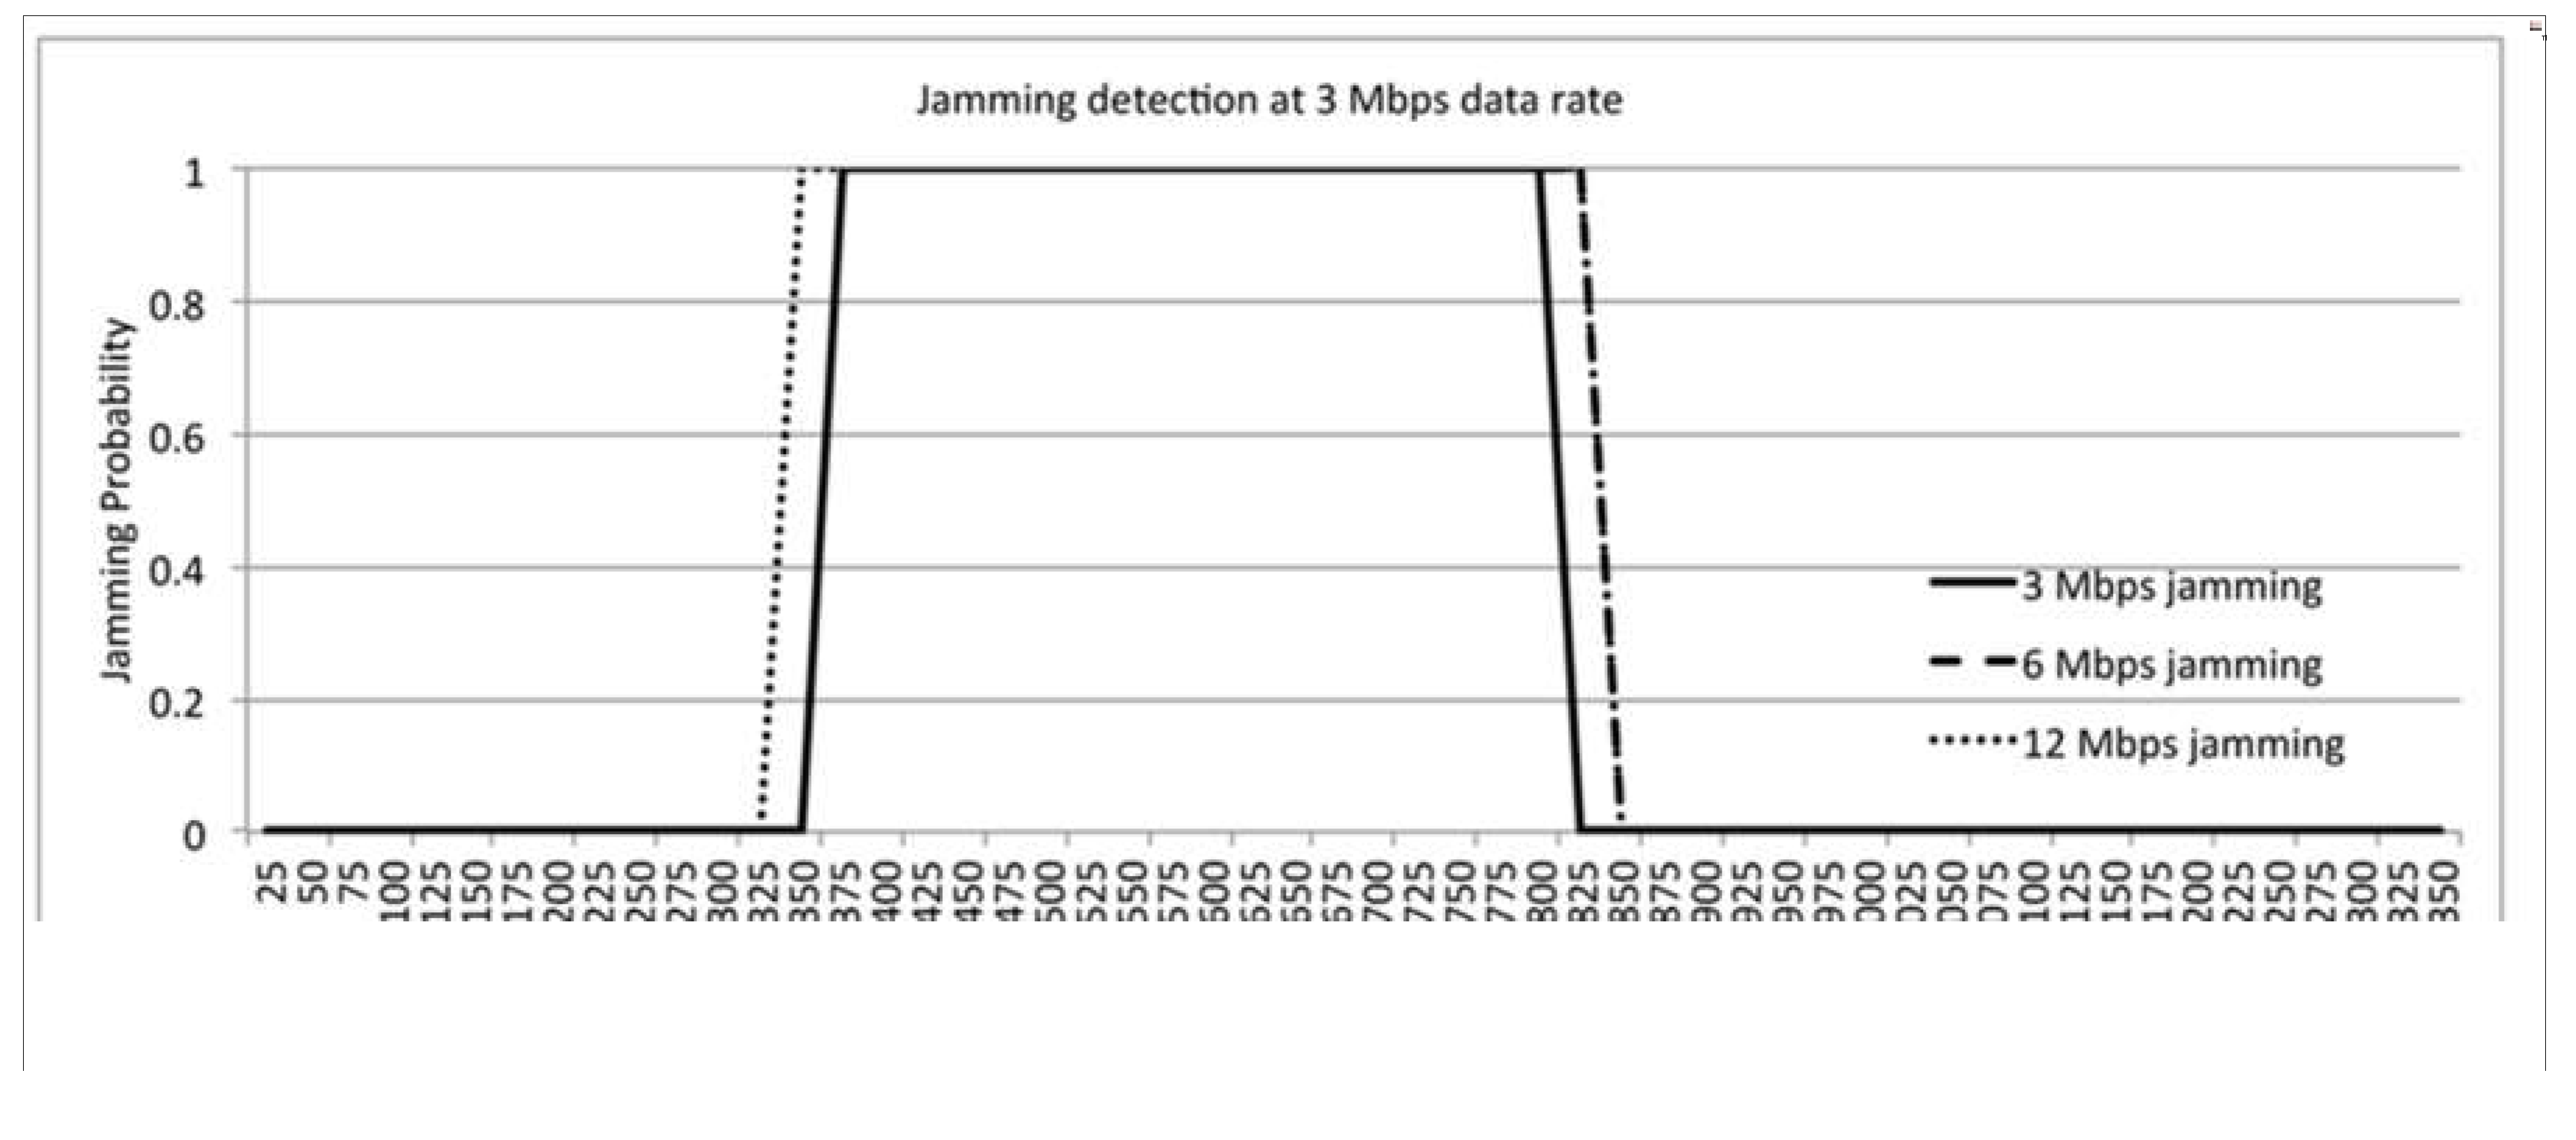
Figure 13.
of Jamming Attack Evaluation Algorithm in Data rate.
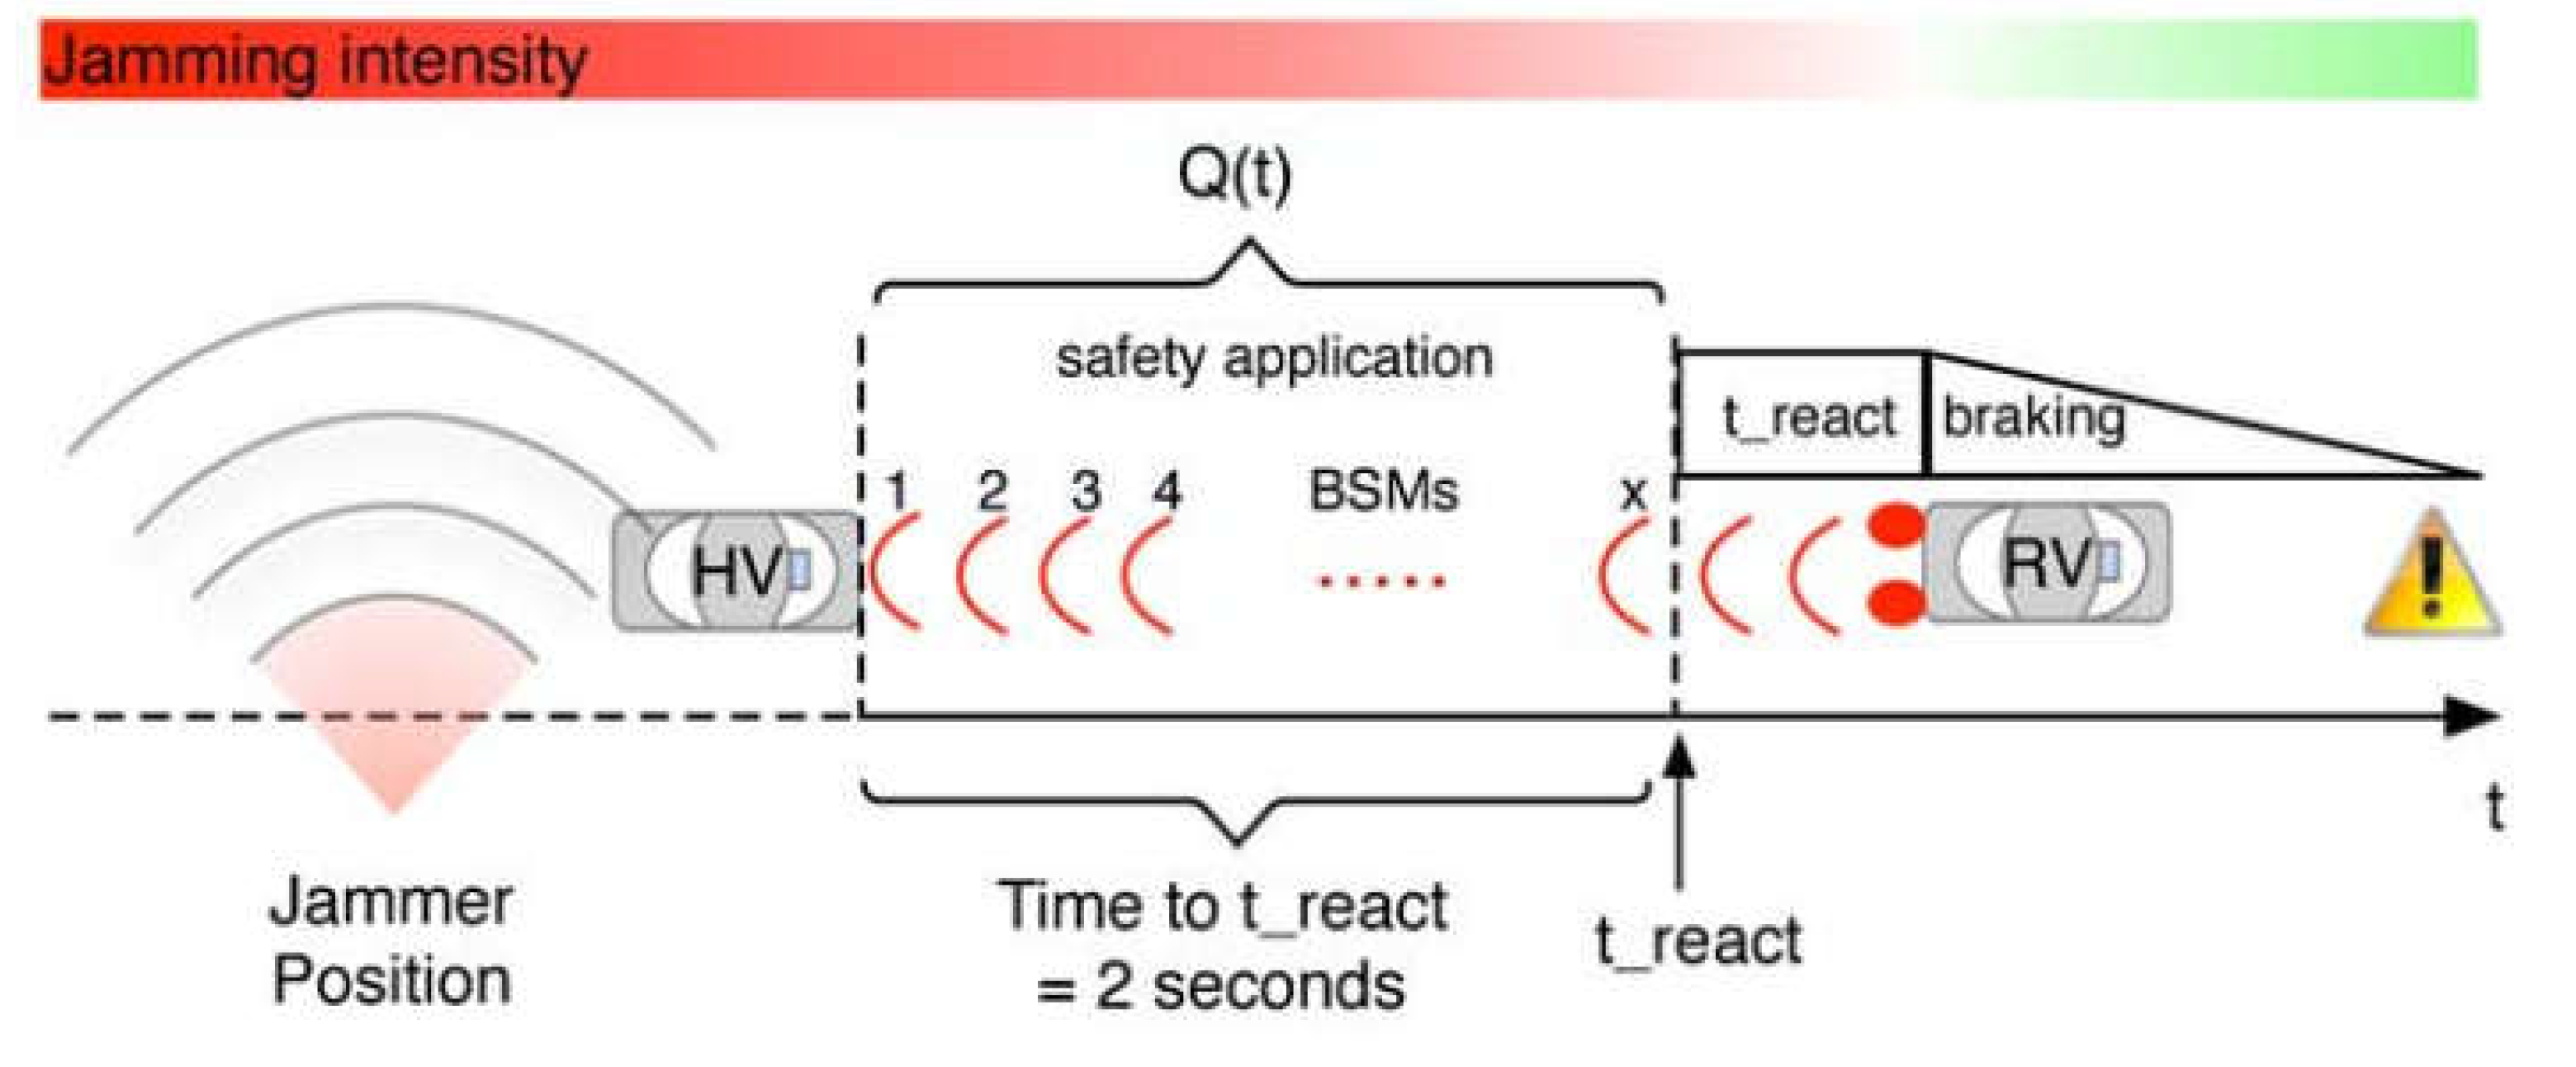
Figure 14.
The impact of BSM Rates on Q (t).
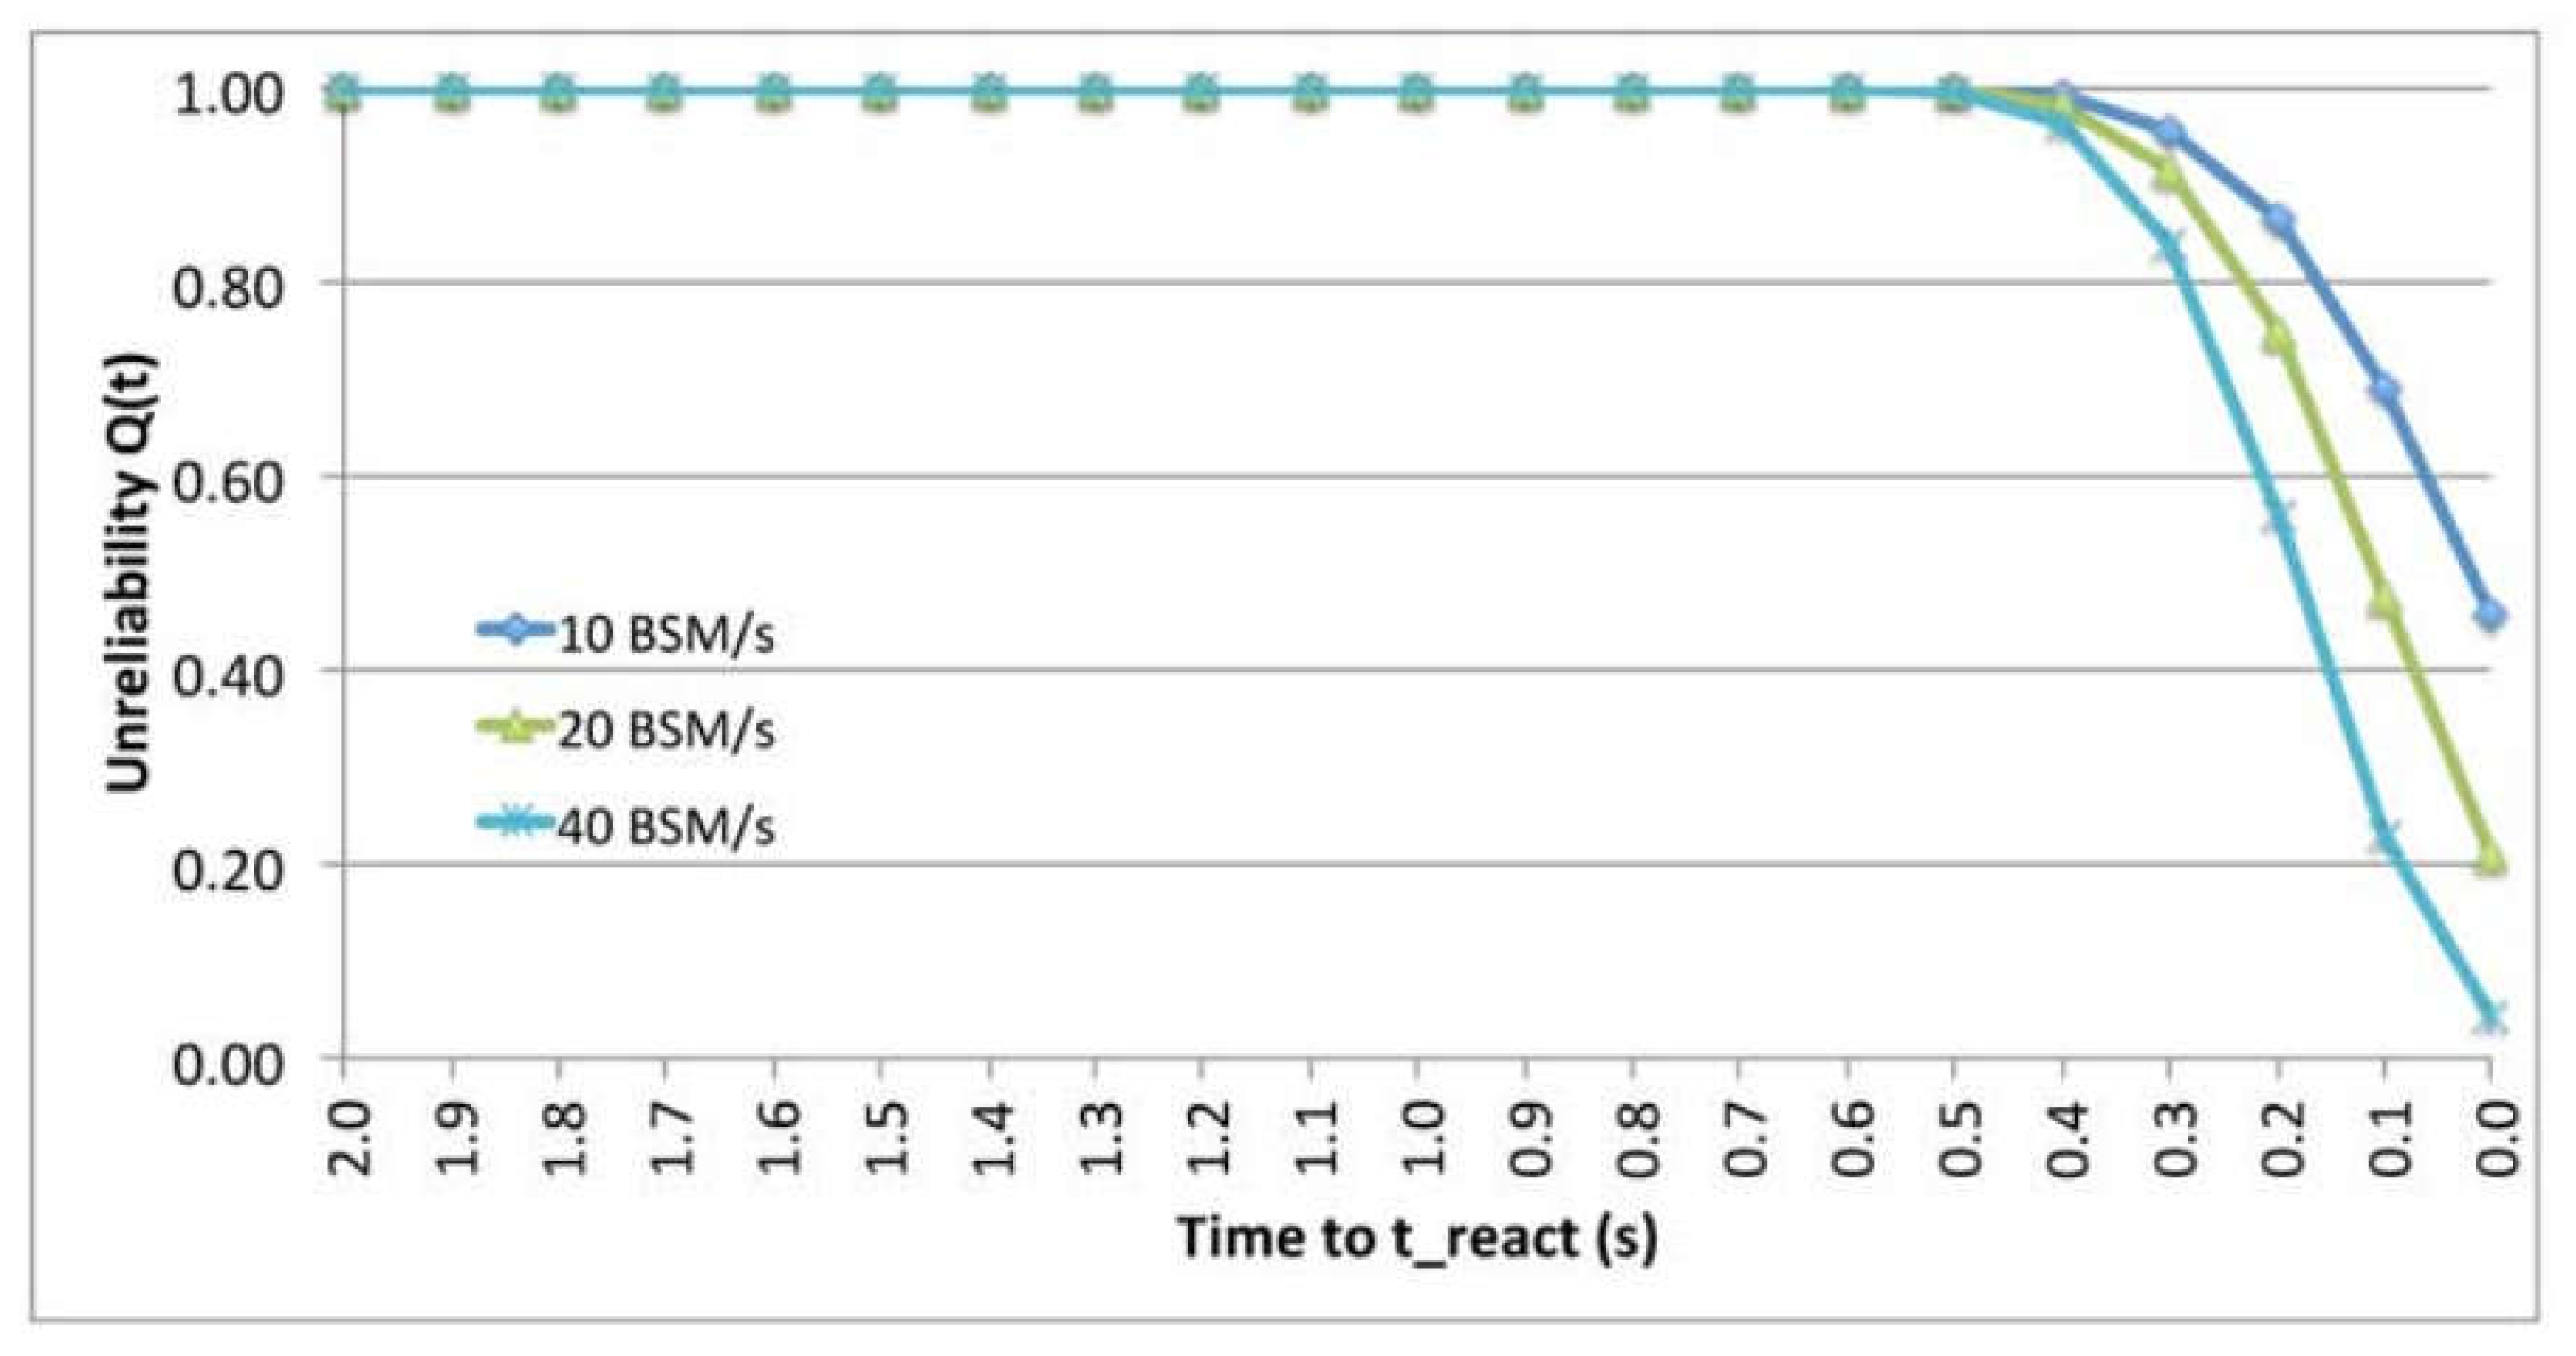
Figure 15.
The impact of Transmission Power on Q(t).
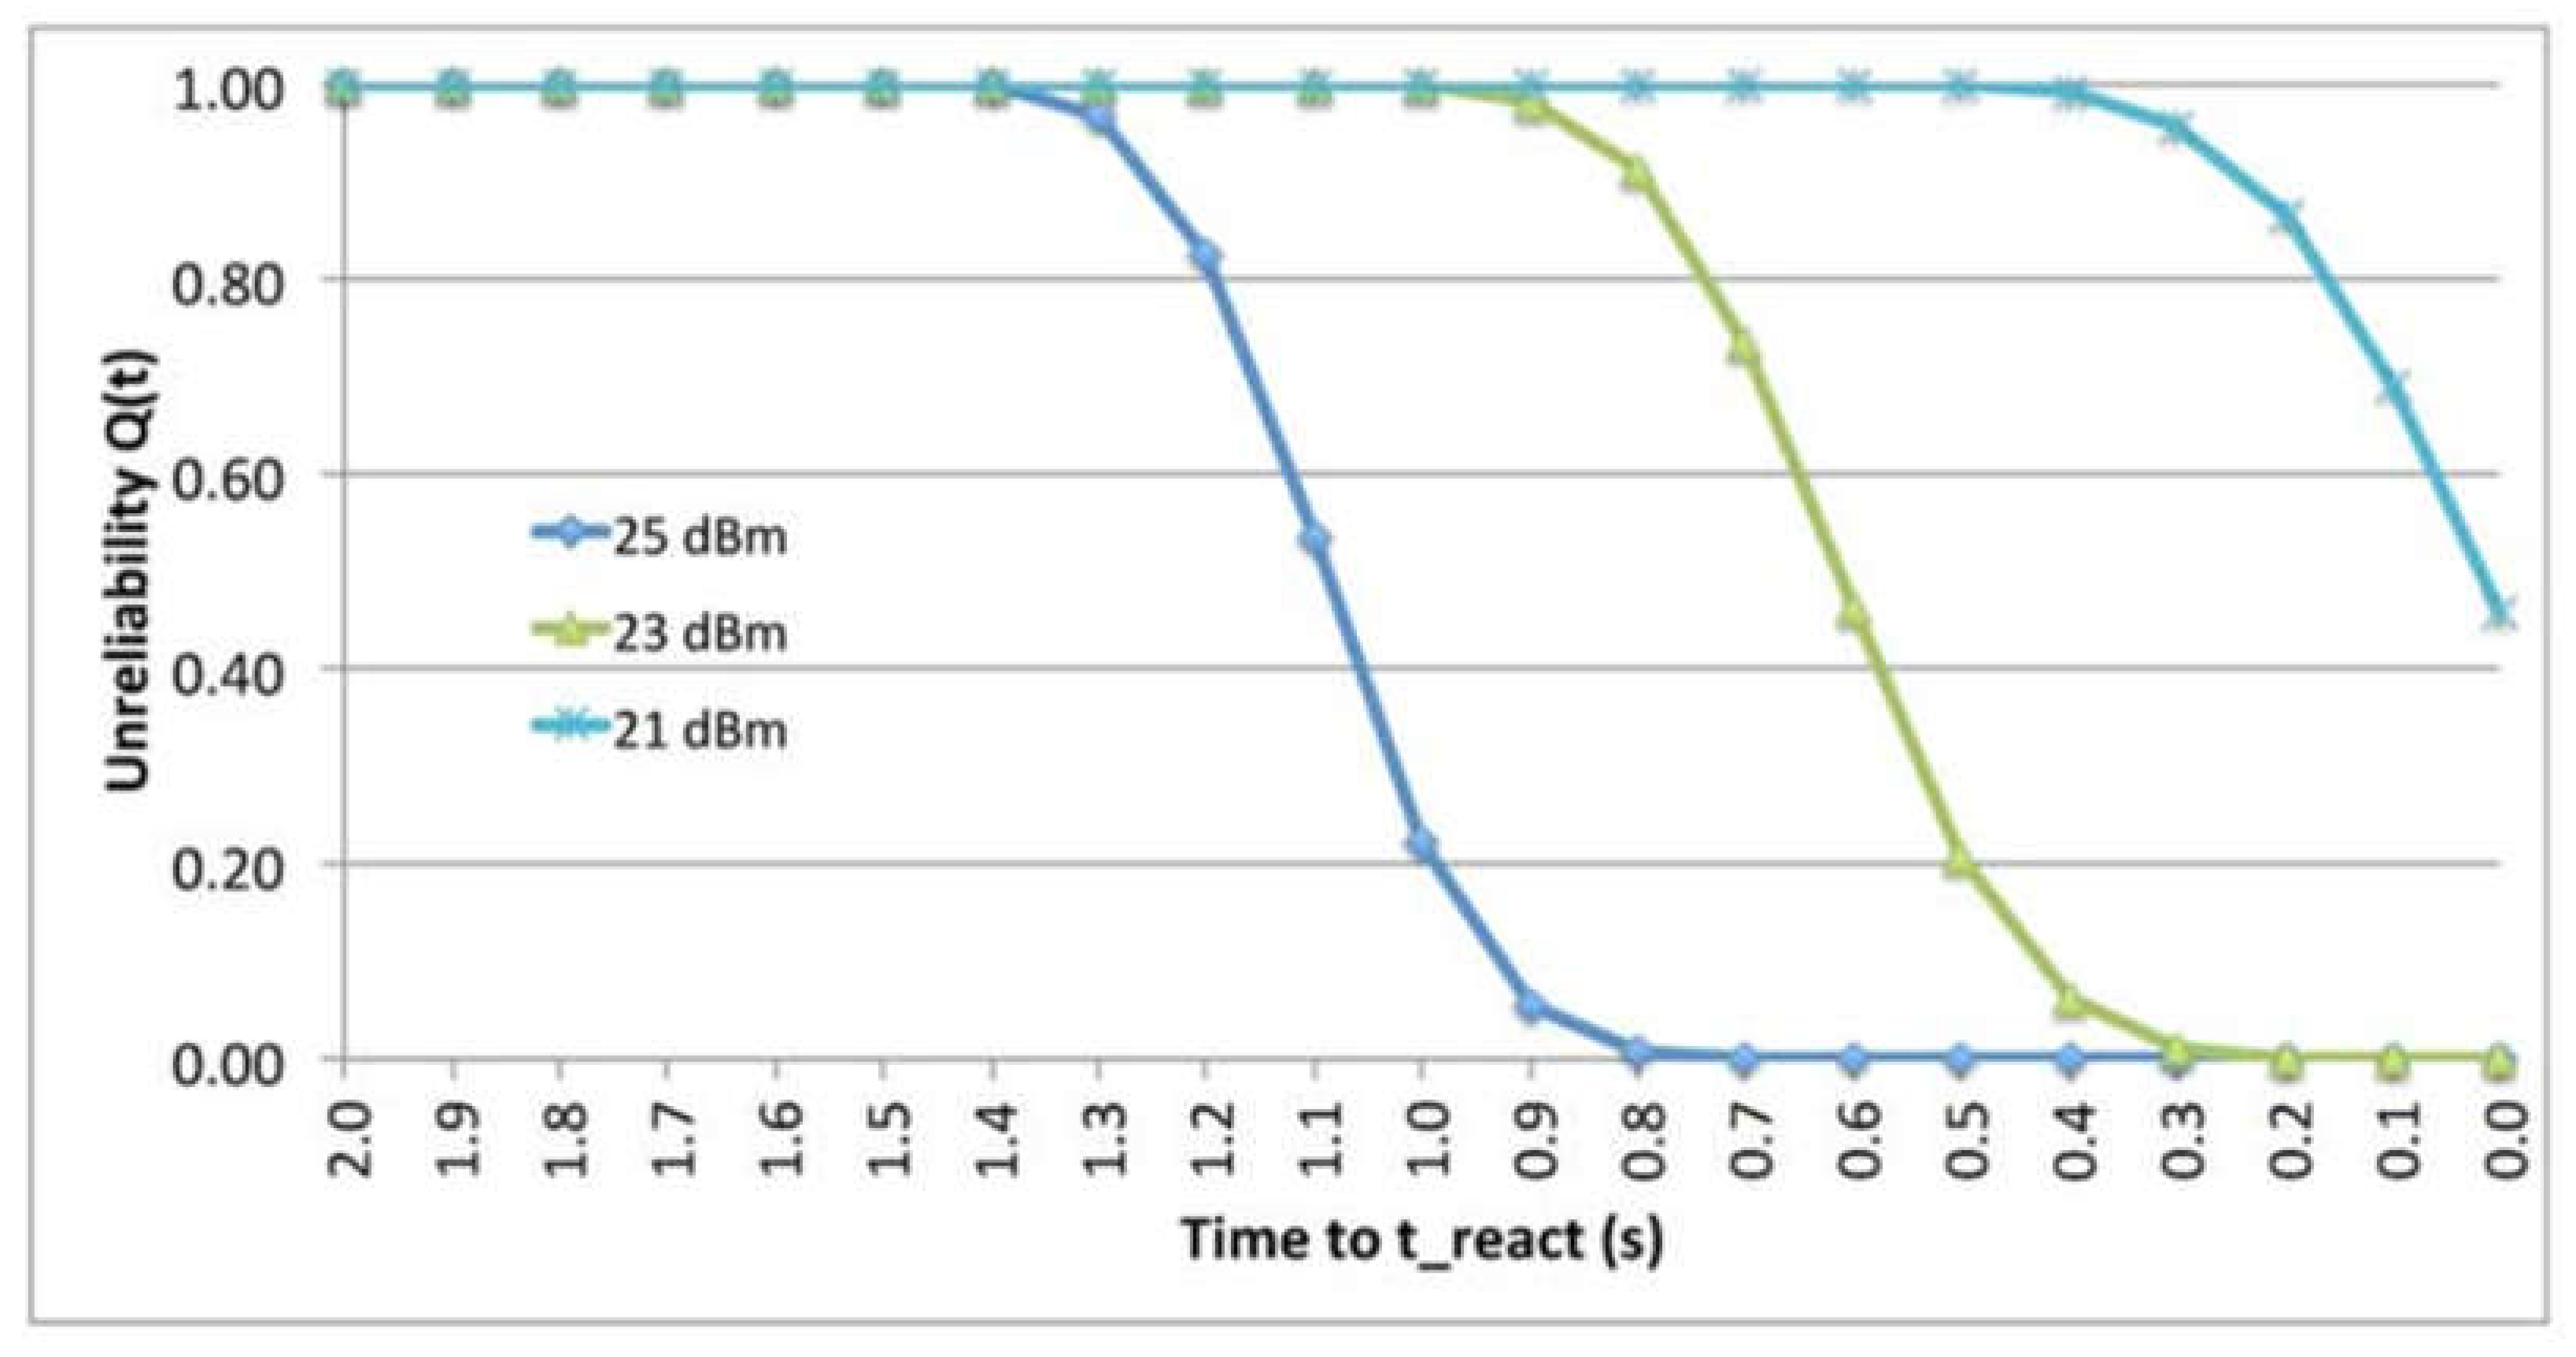
Figure 16.
The impact of Data Rate on Q(t ).
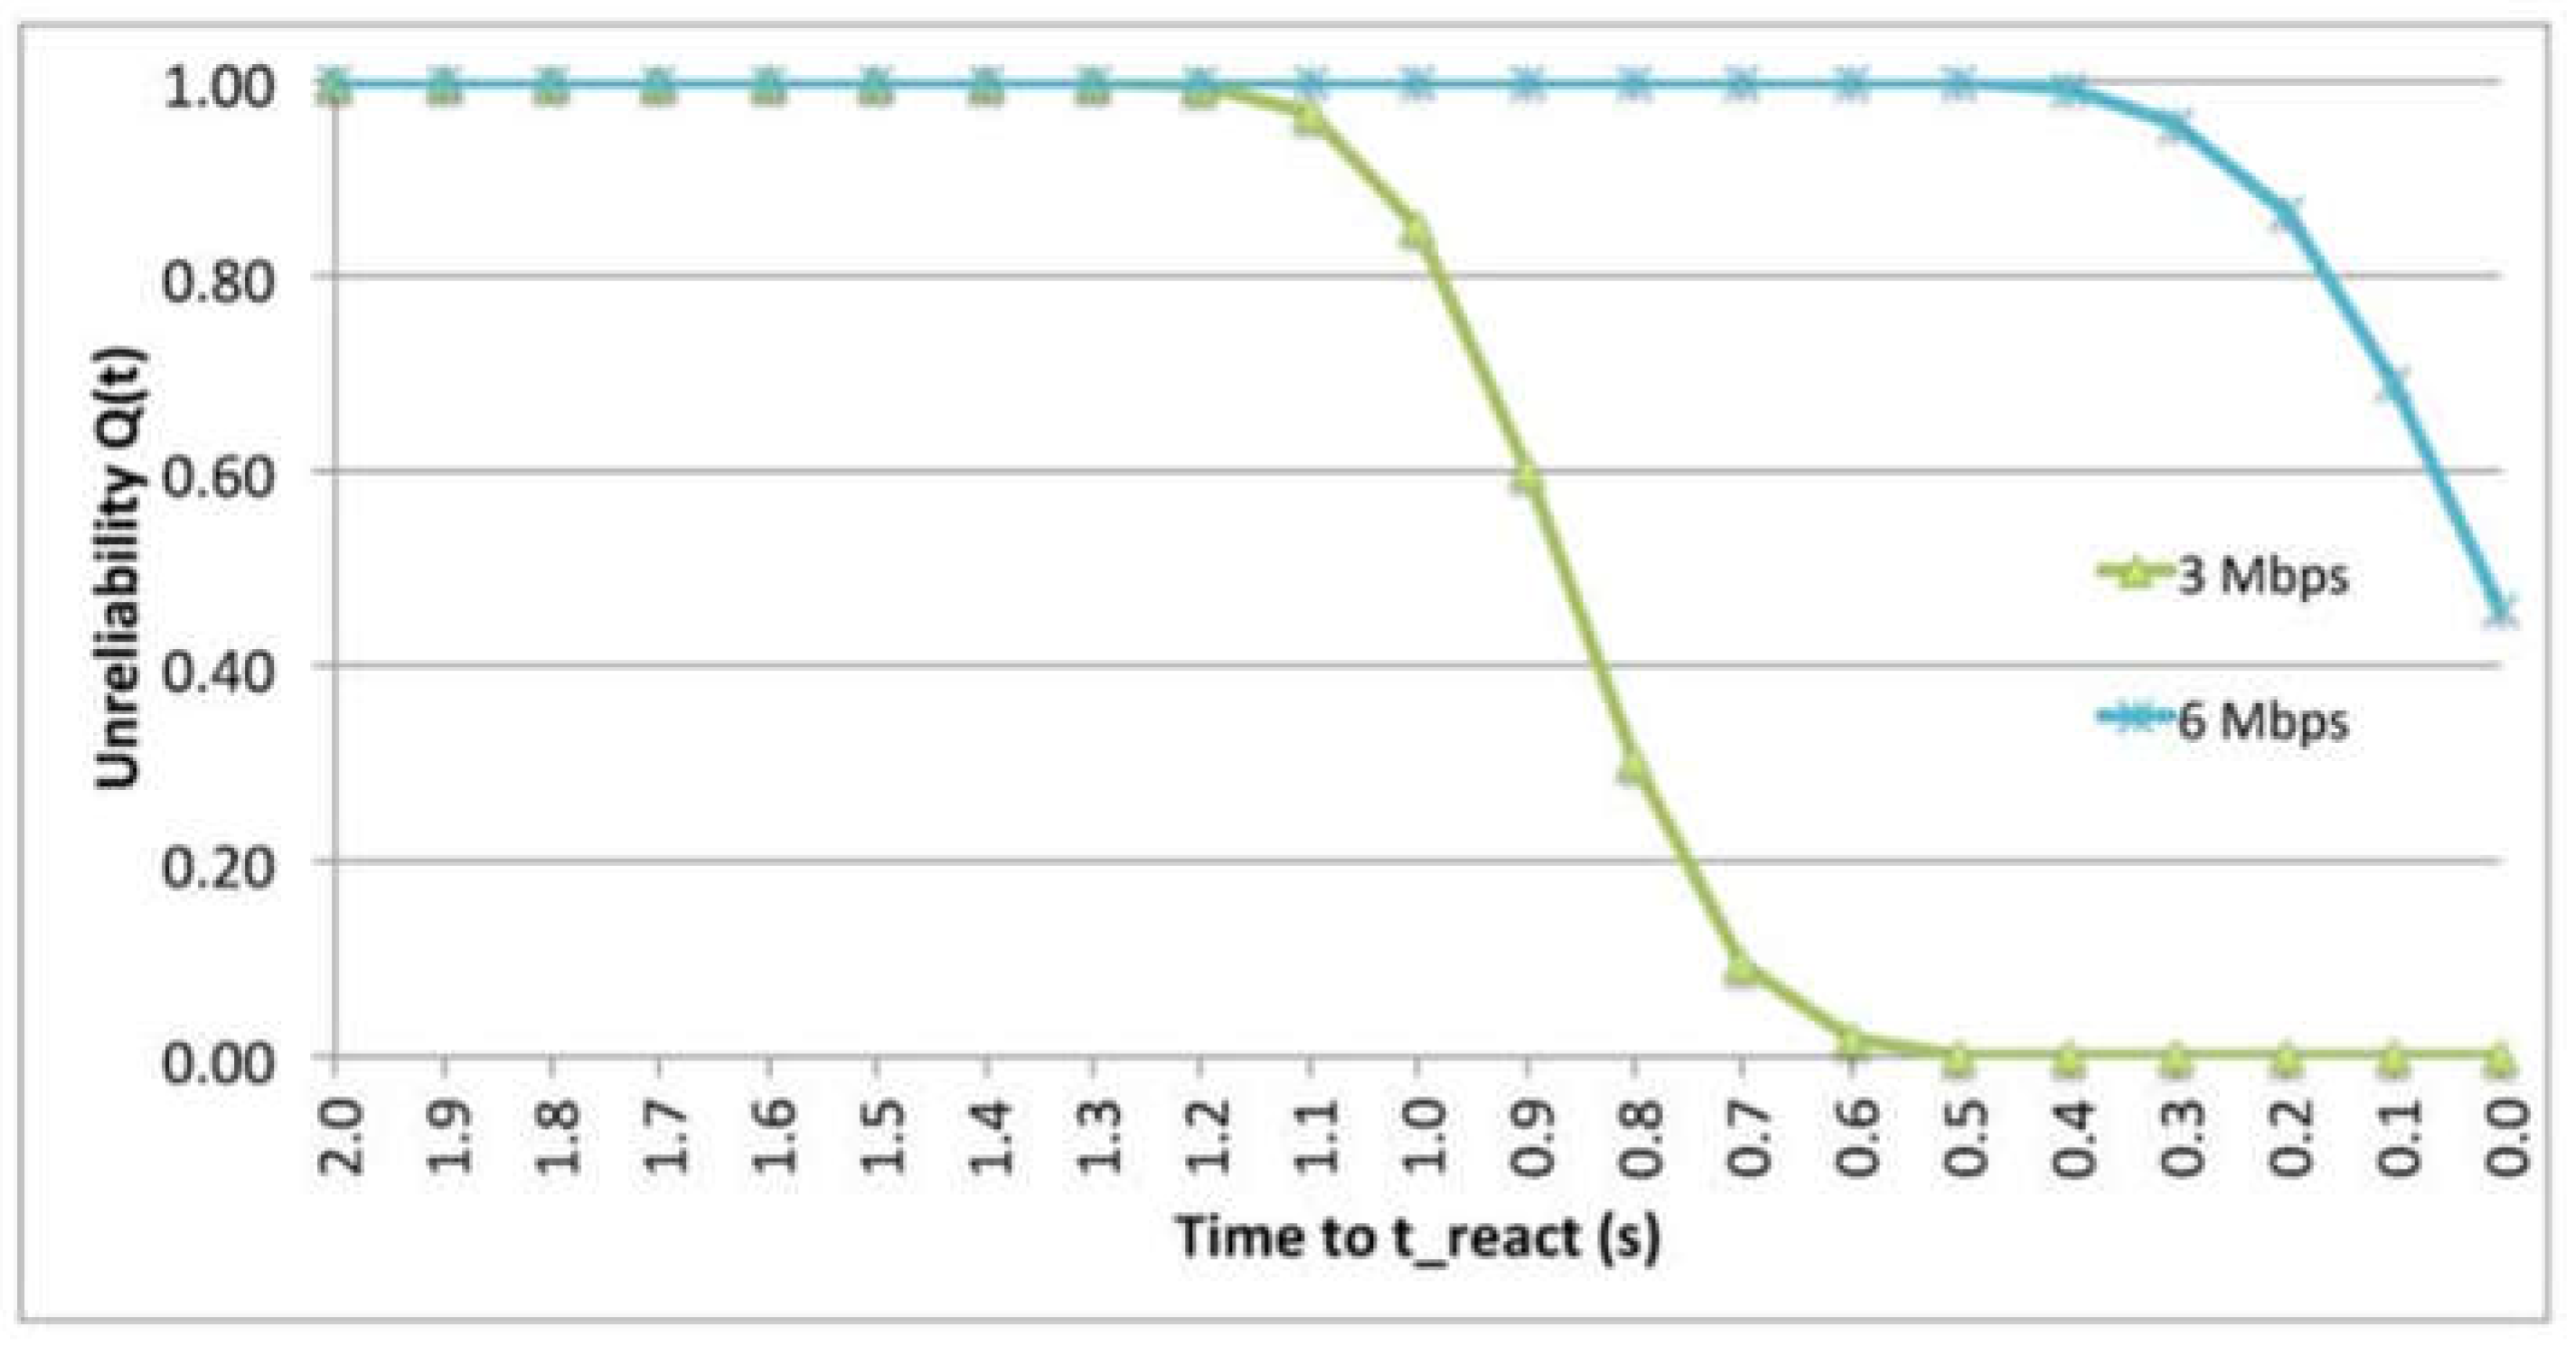
Figure 17.
The position of the test vehicles prior to and after encountering the jammer.
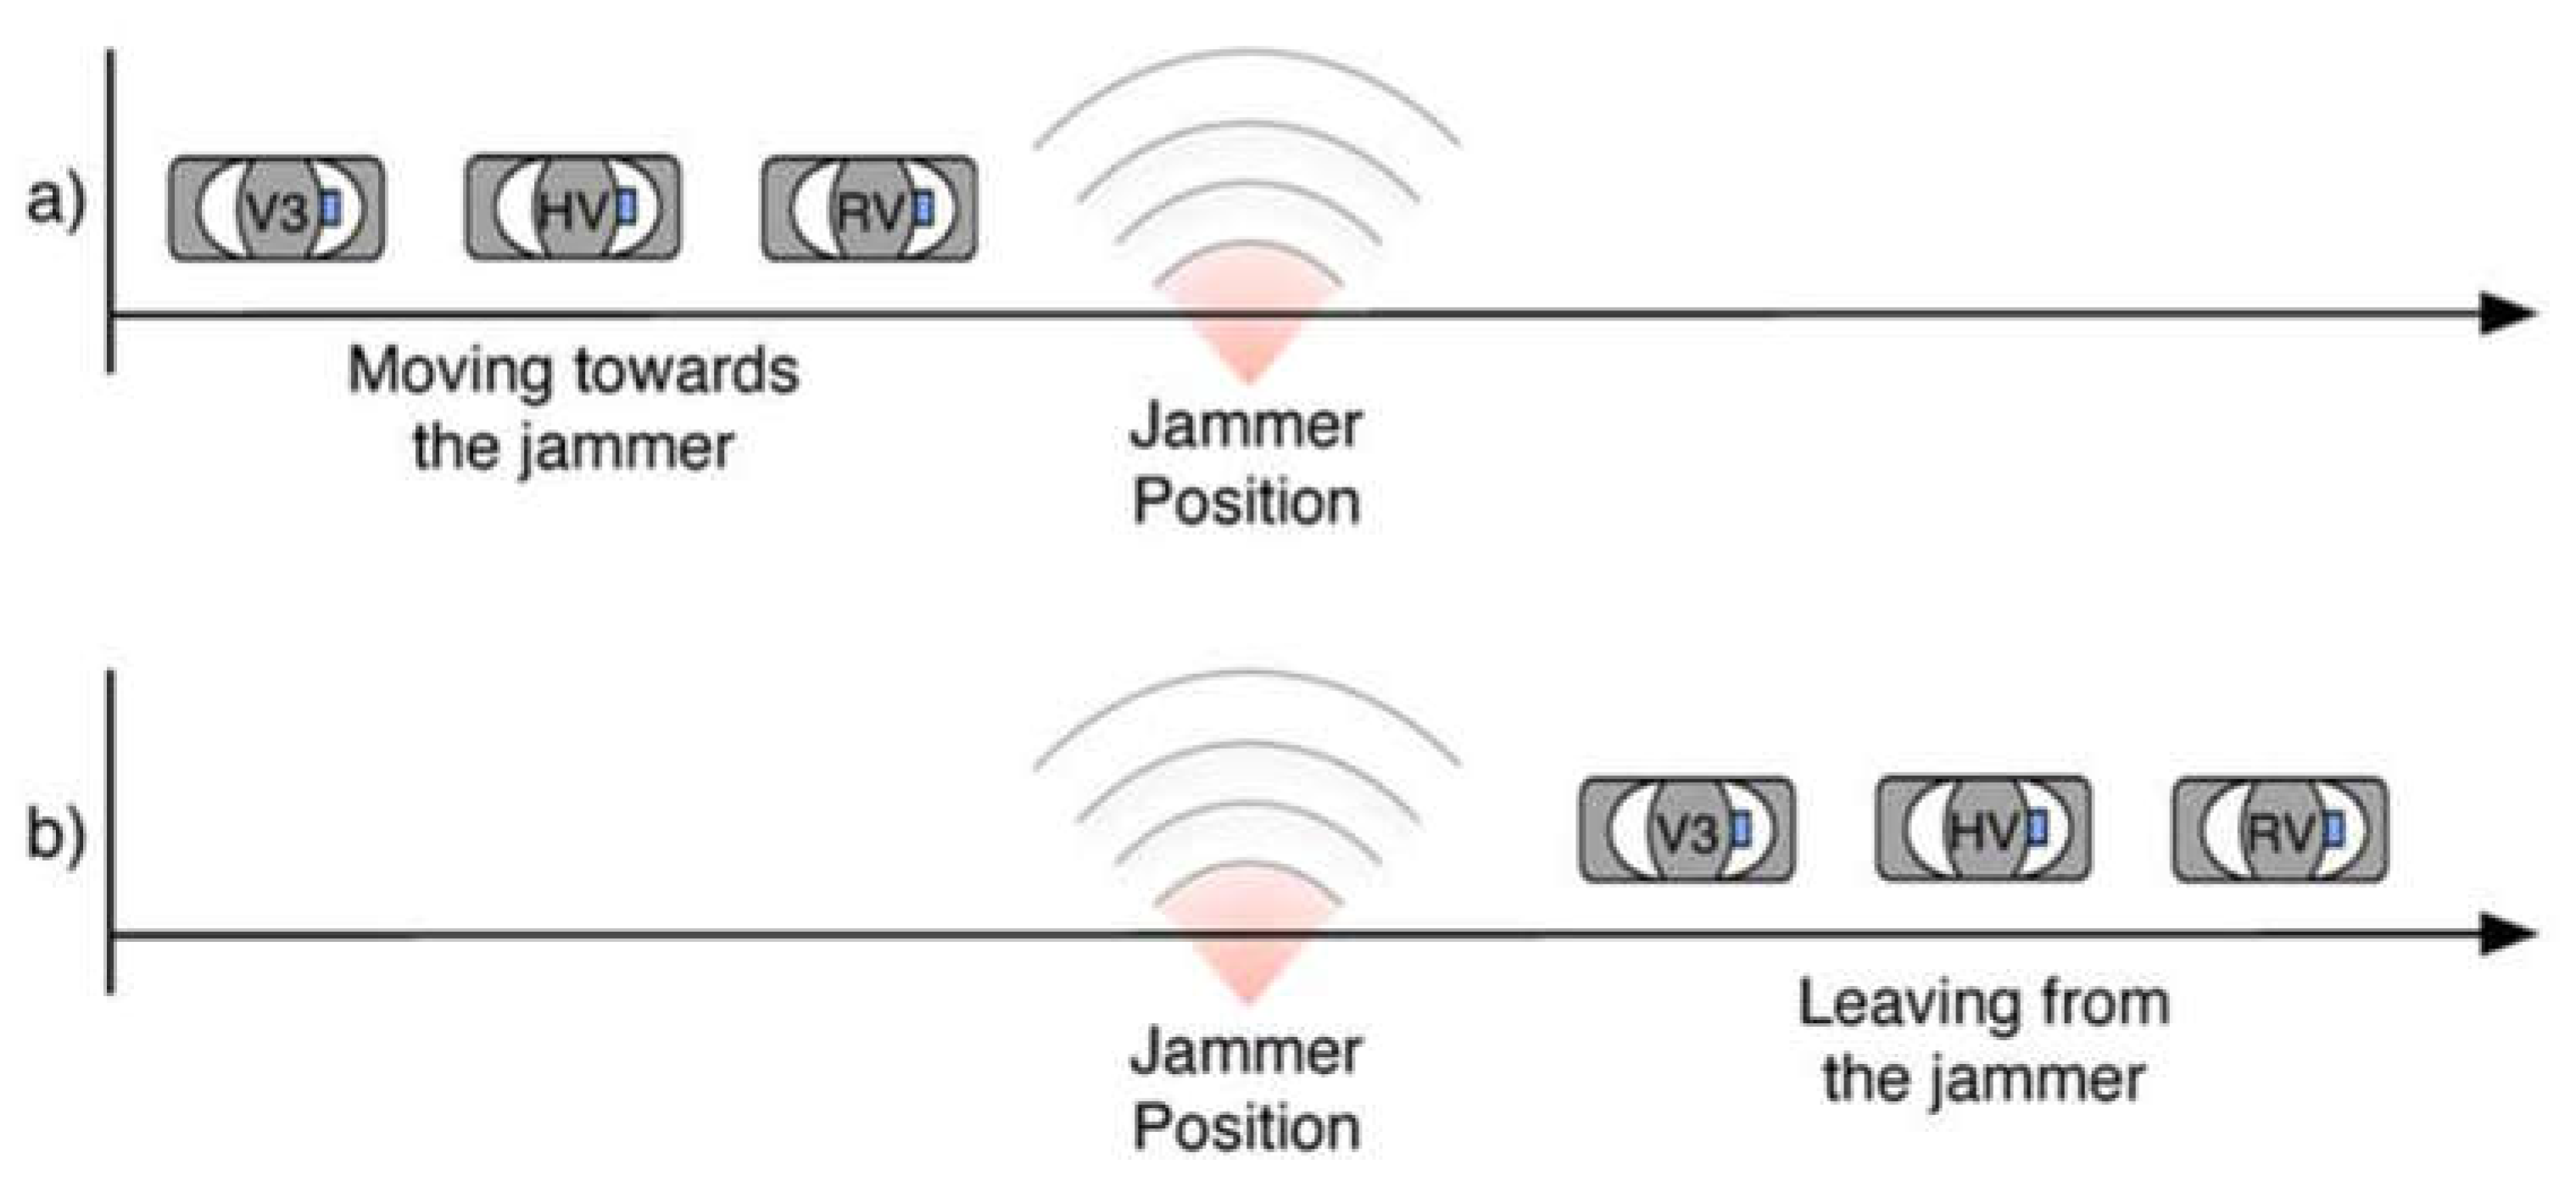
Figure 18.
Reception using 10 BSM/s.
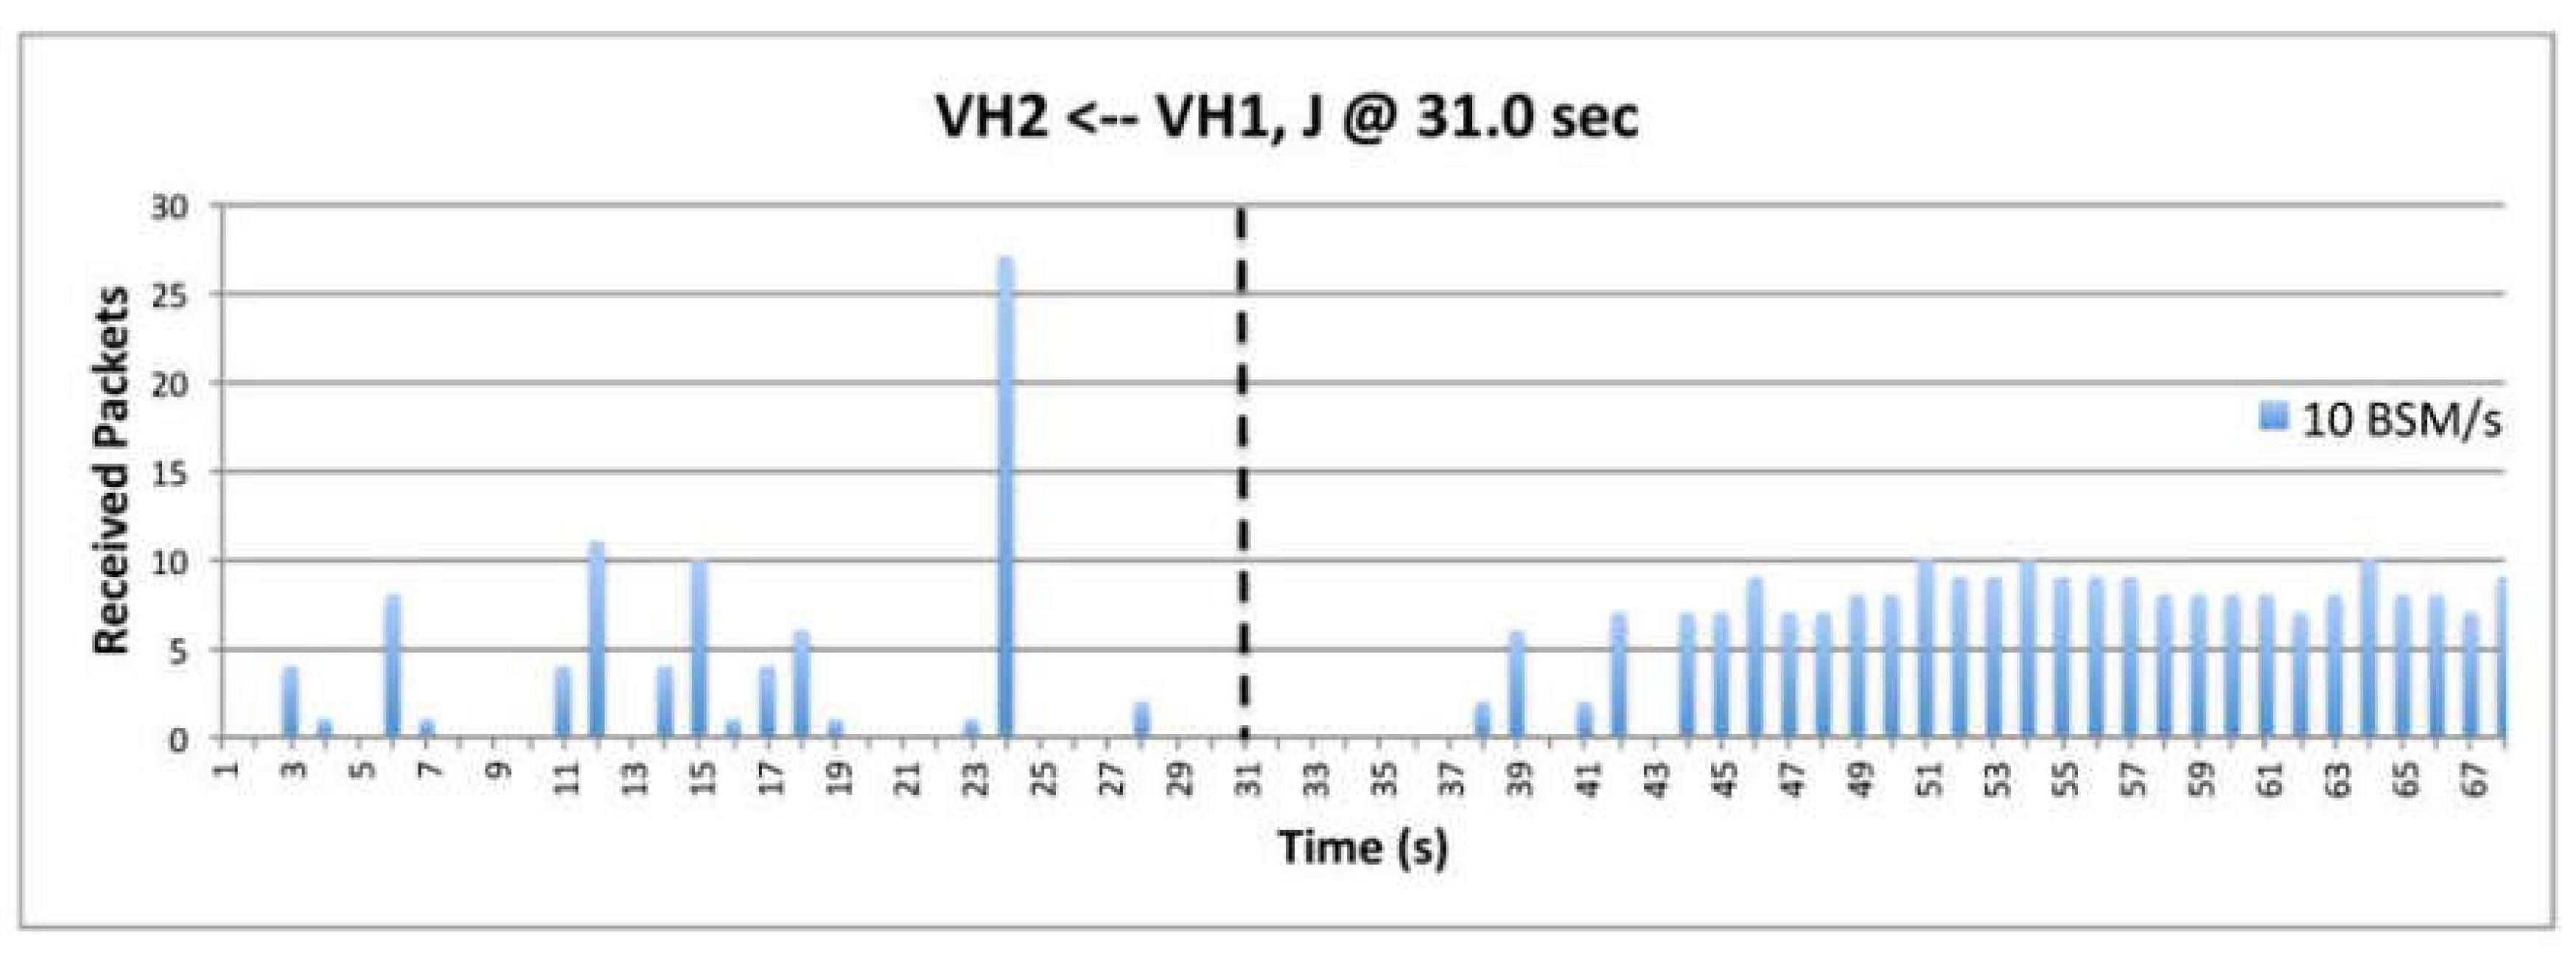
Figure 19.
Reception using 20 BSM/s.
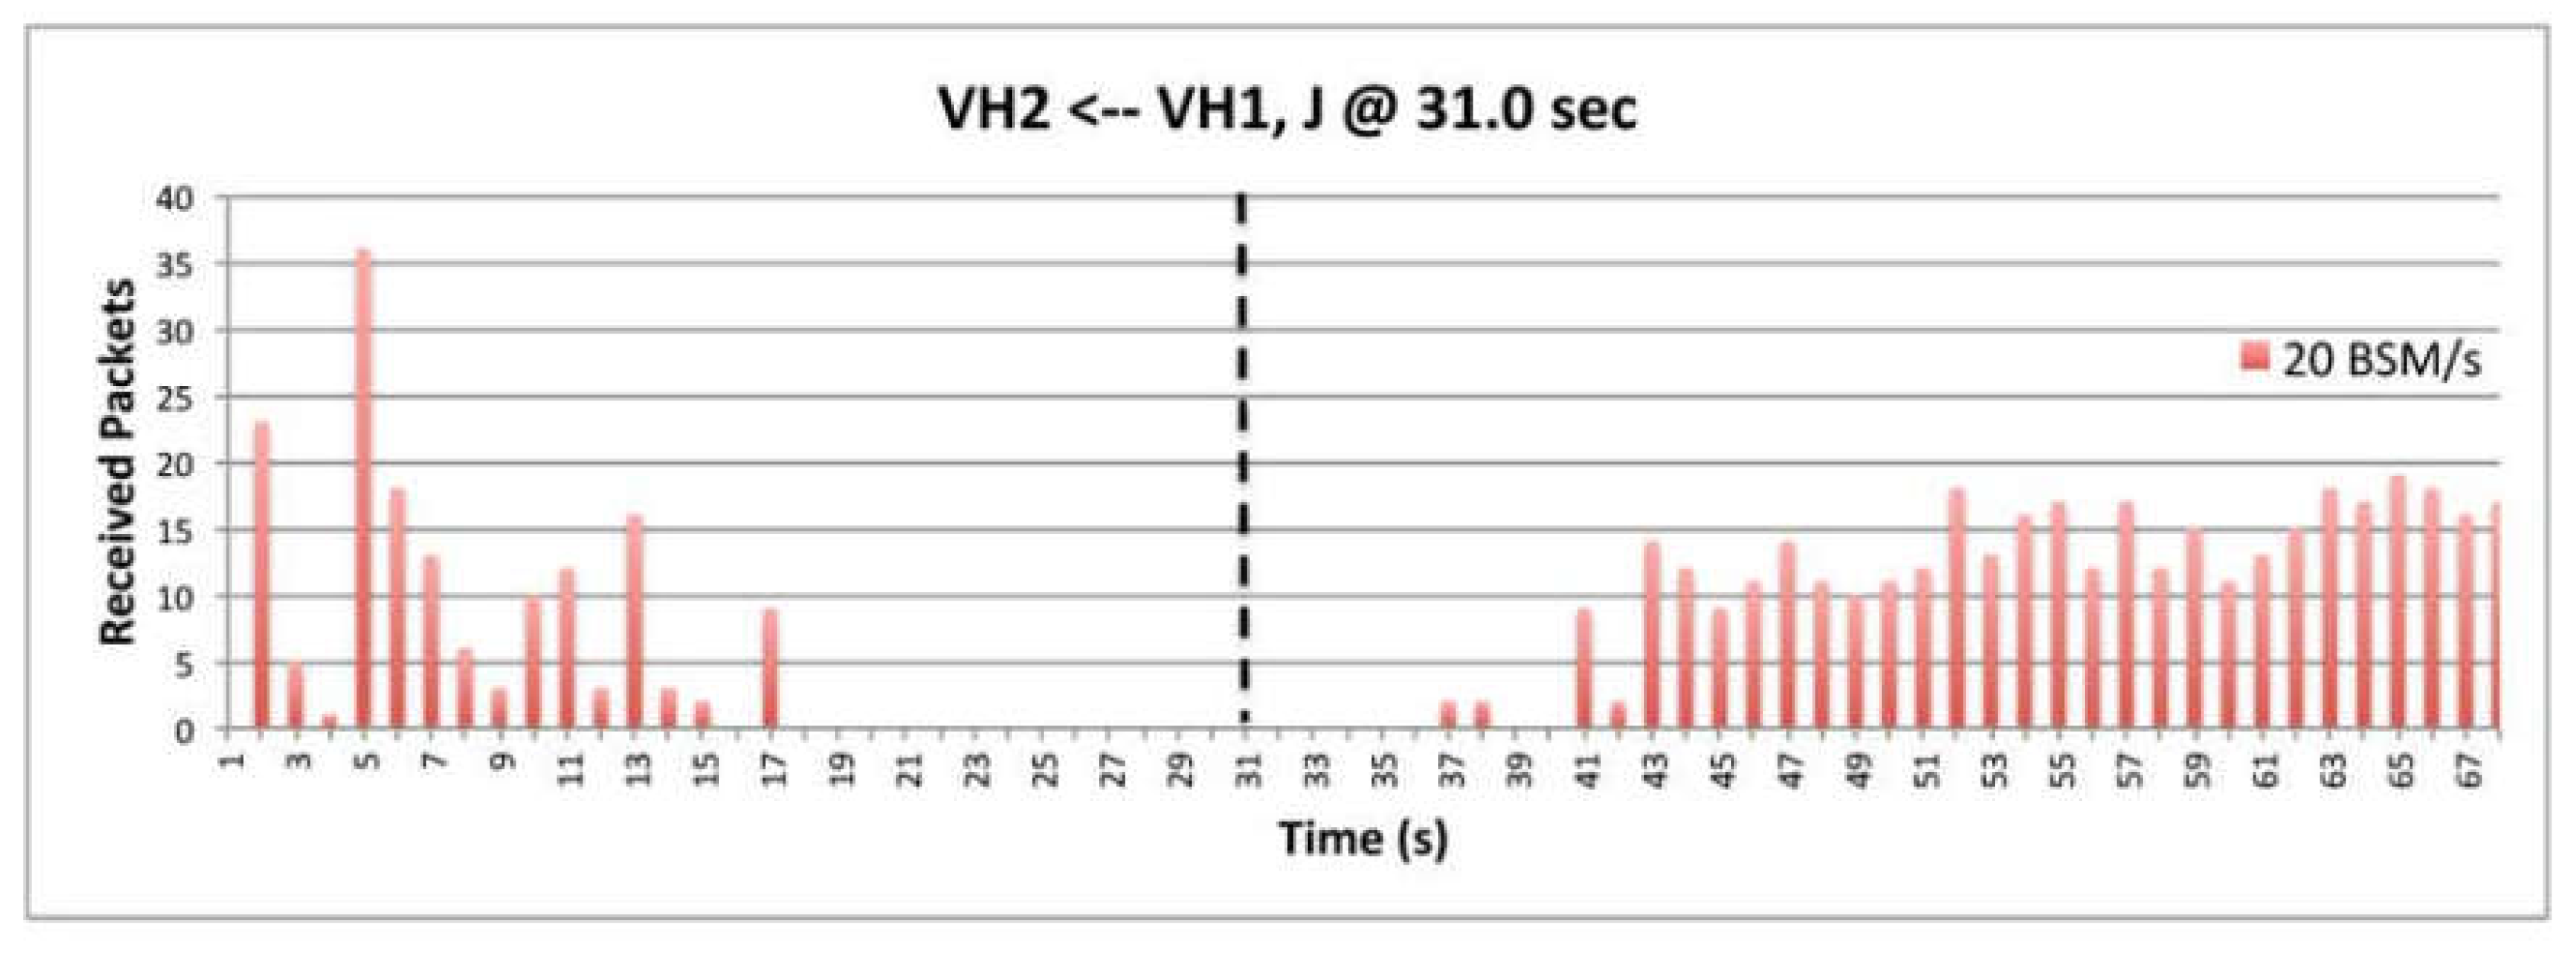
Figure 20.
Reception using 40 BSM/s.
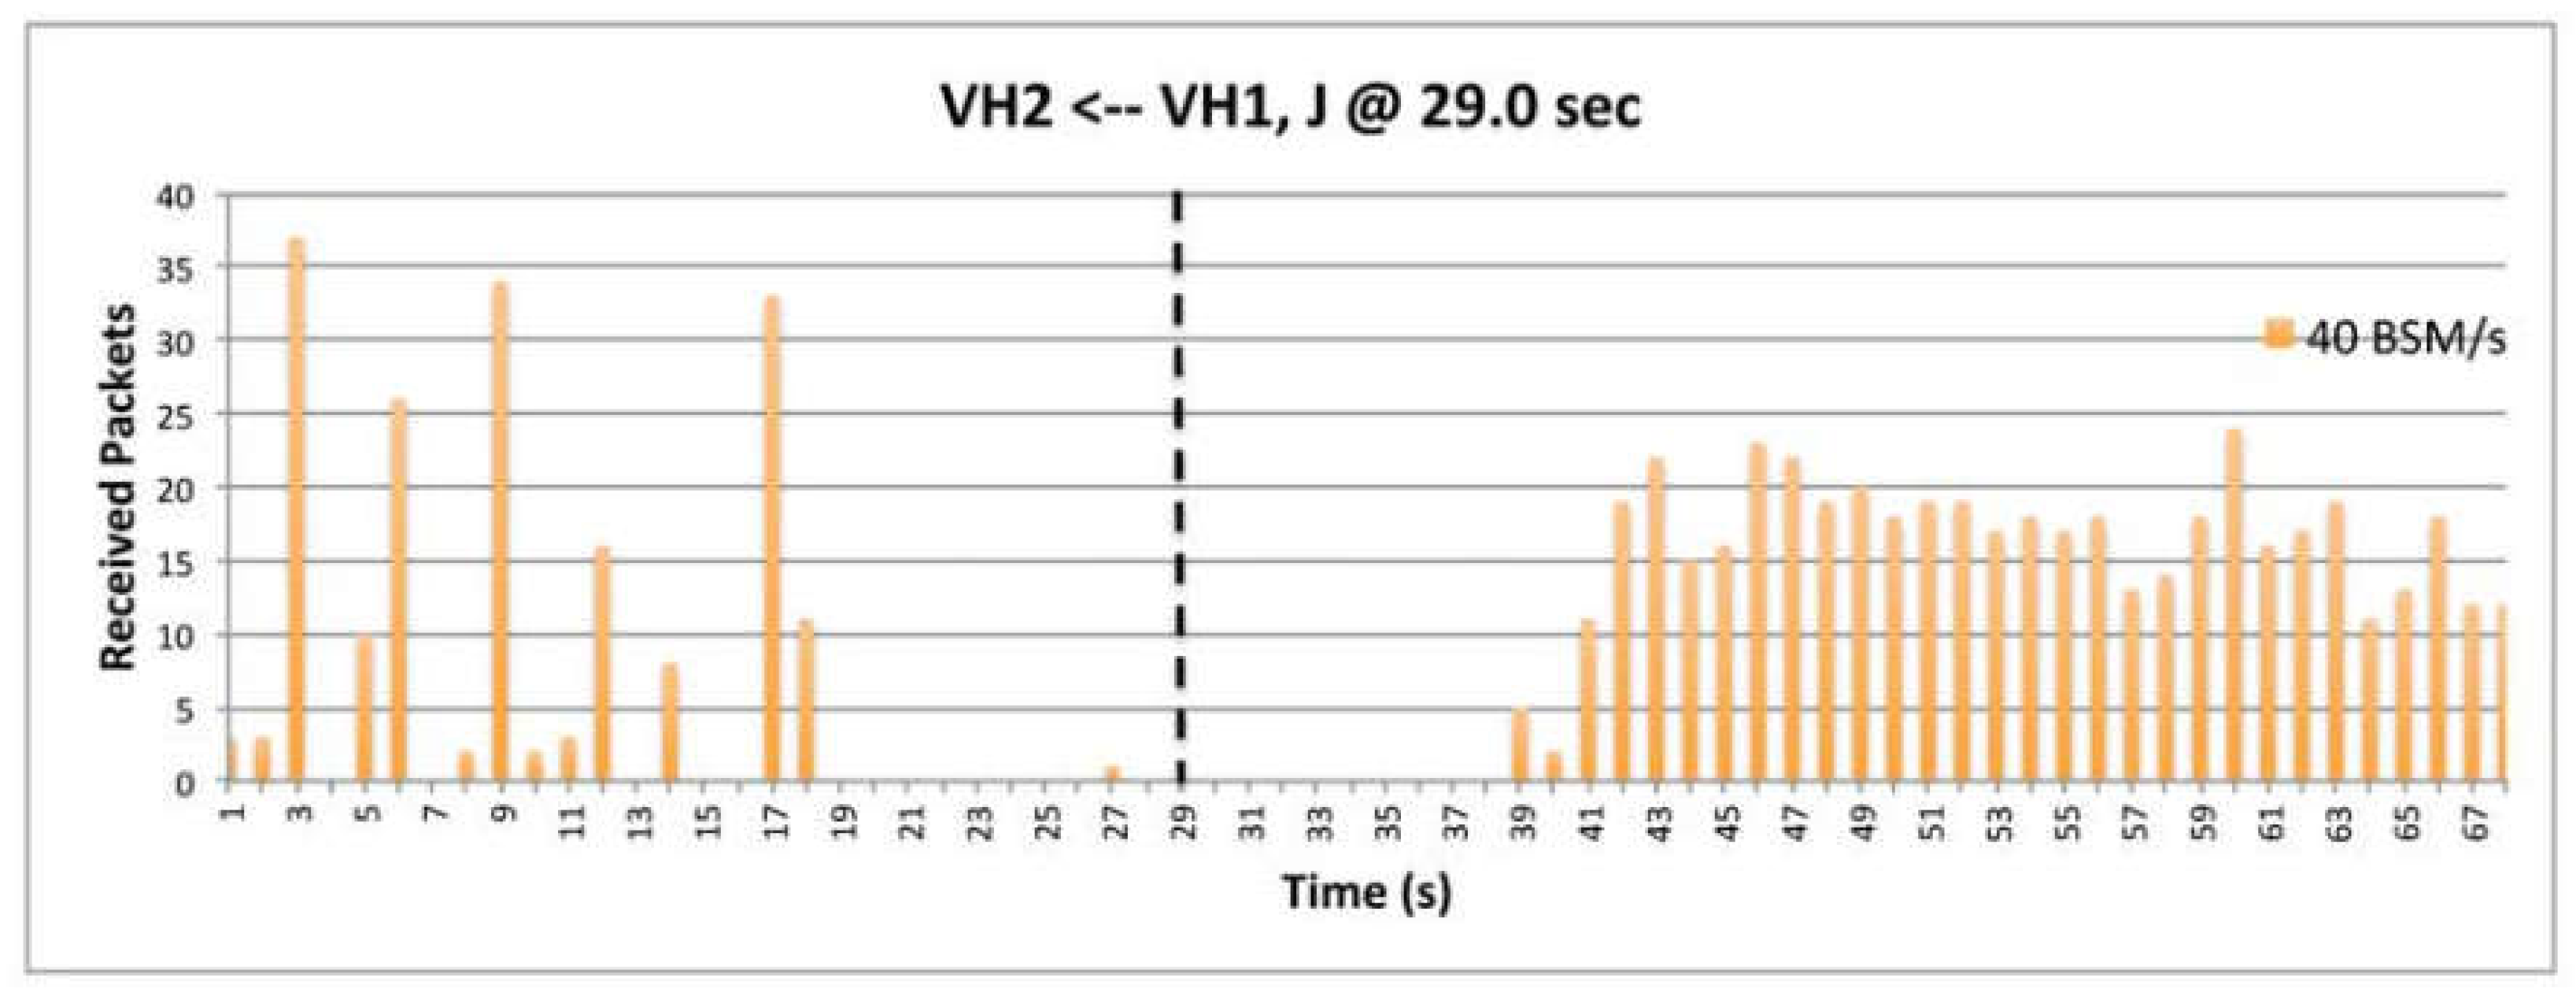
Figure 24.
Reception using 3 Mbps data rate.
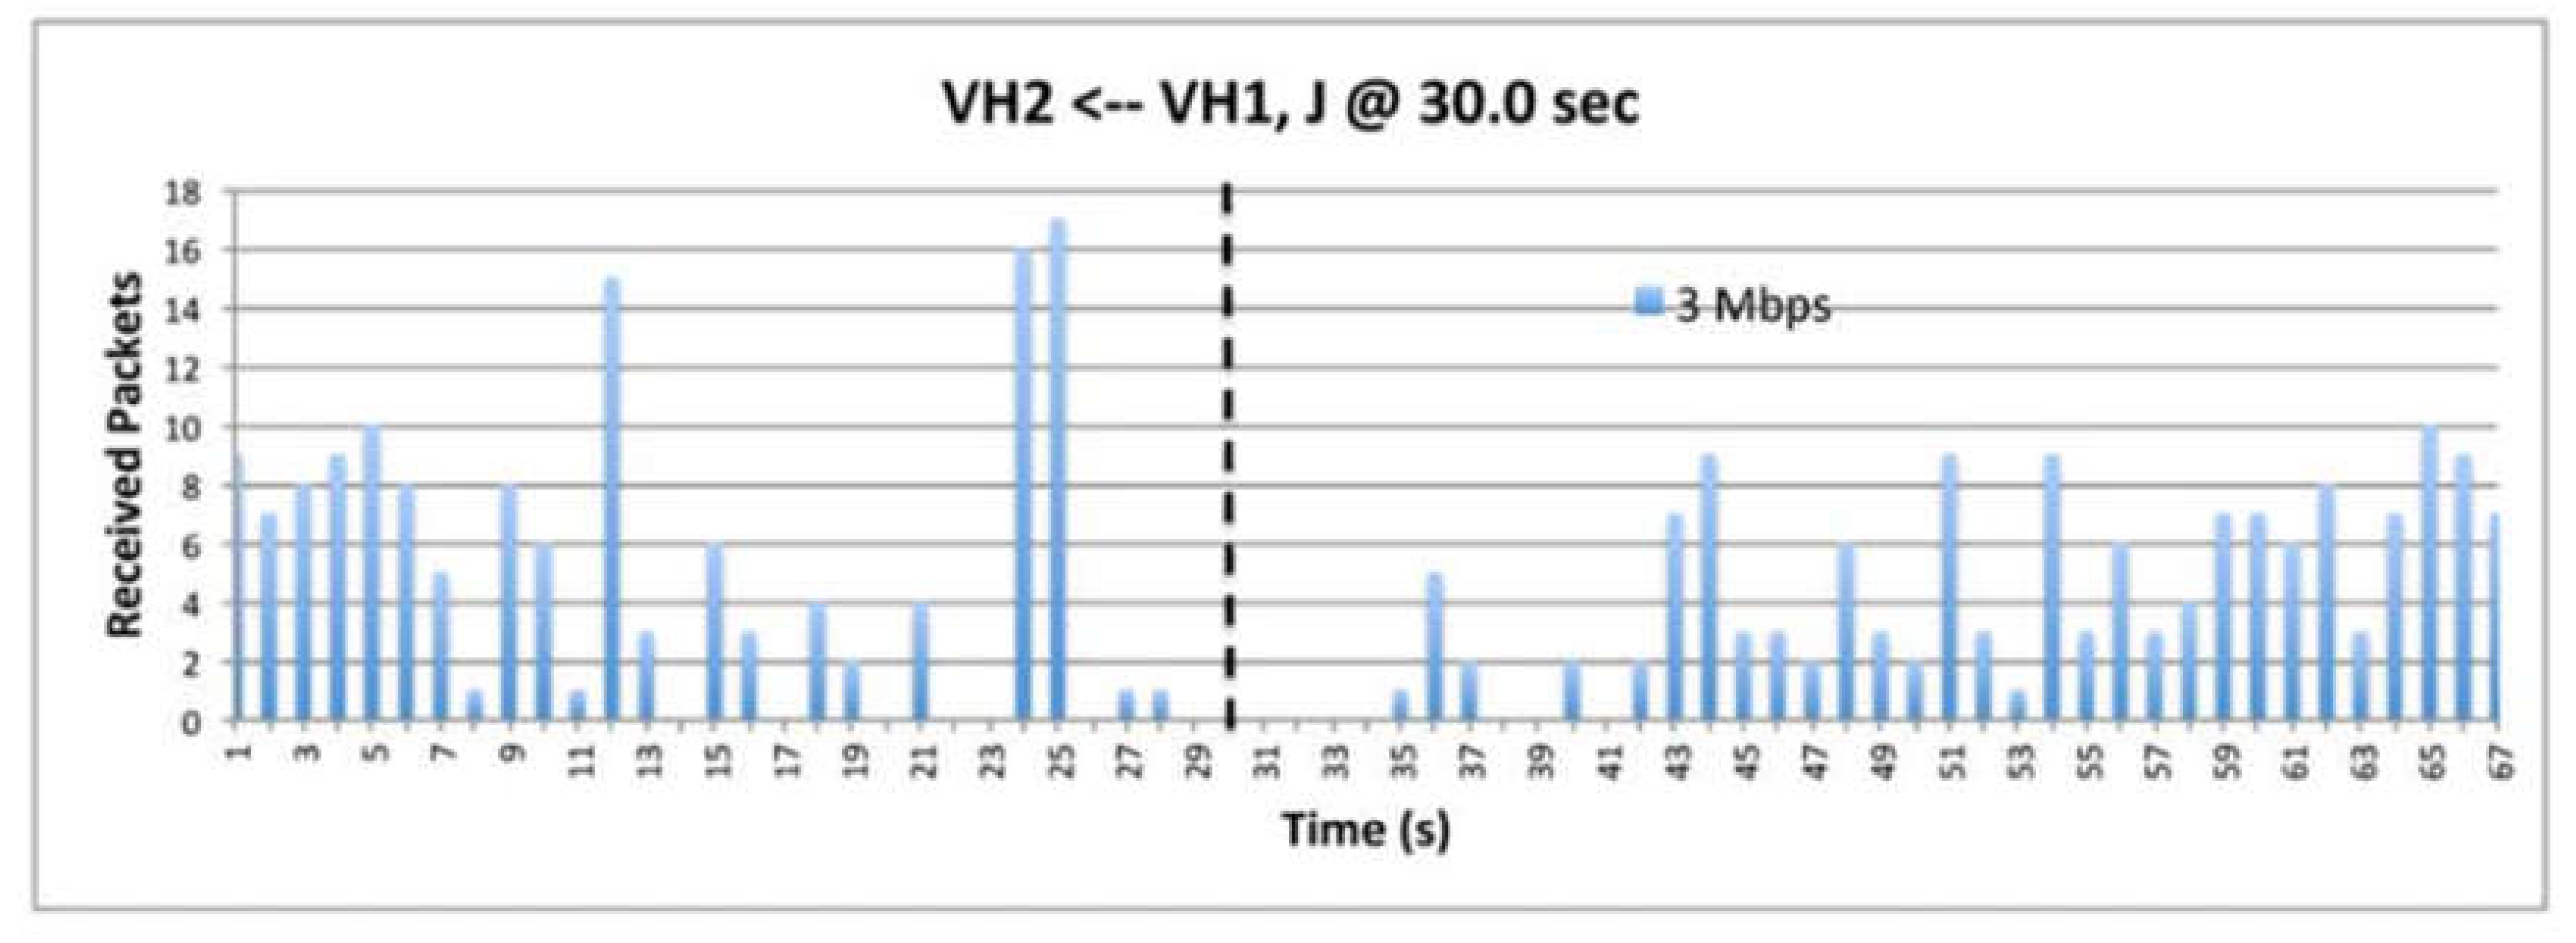
Figure 25.
Reception using 6 Mbps data rate.
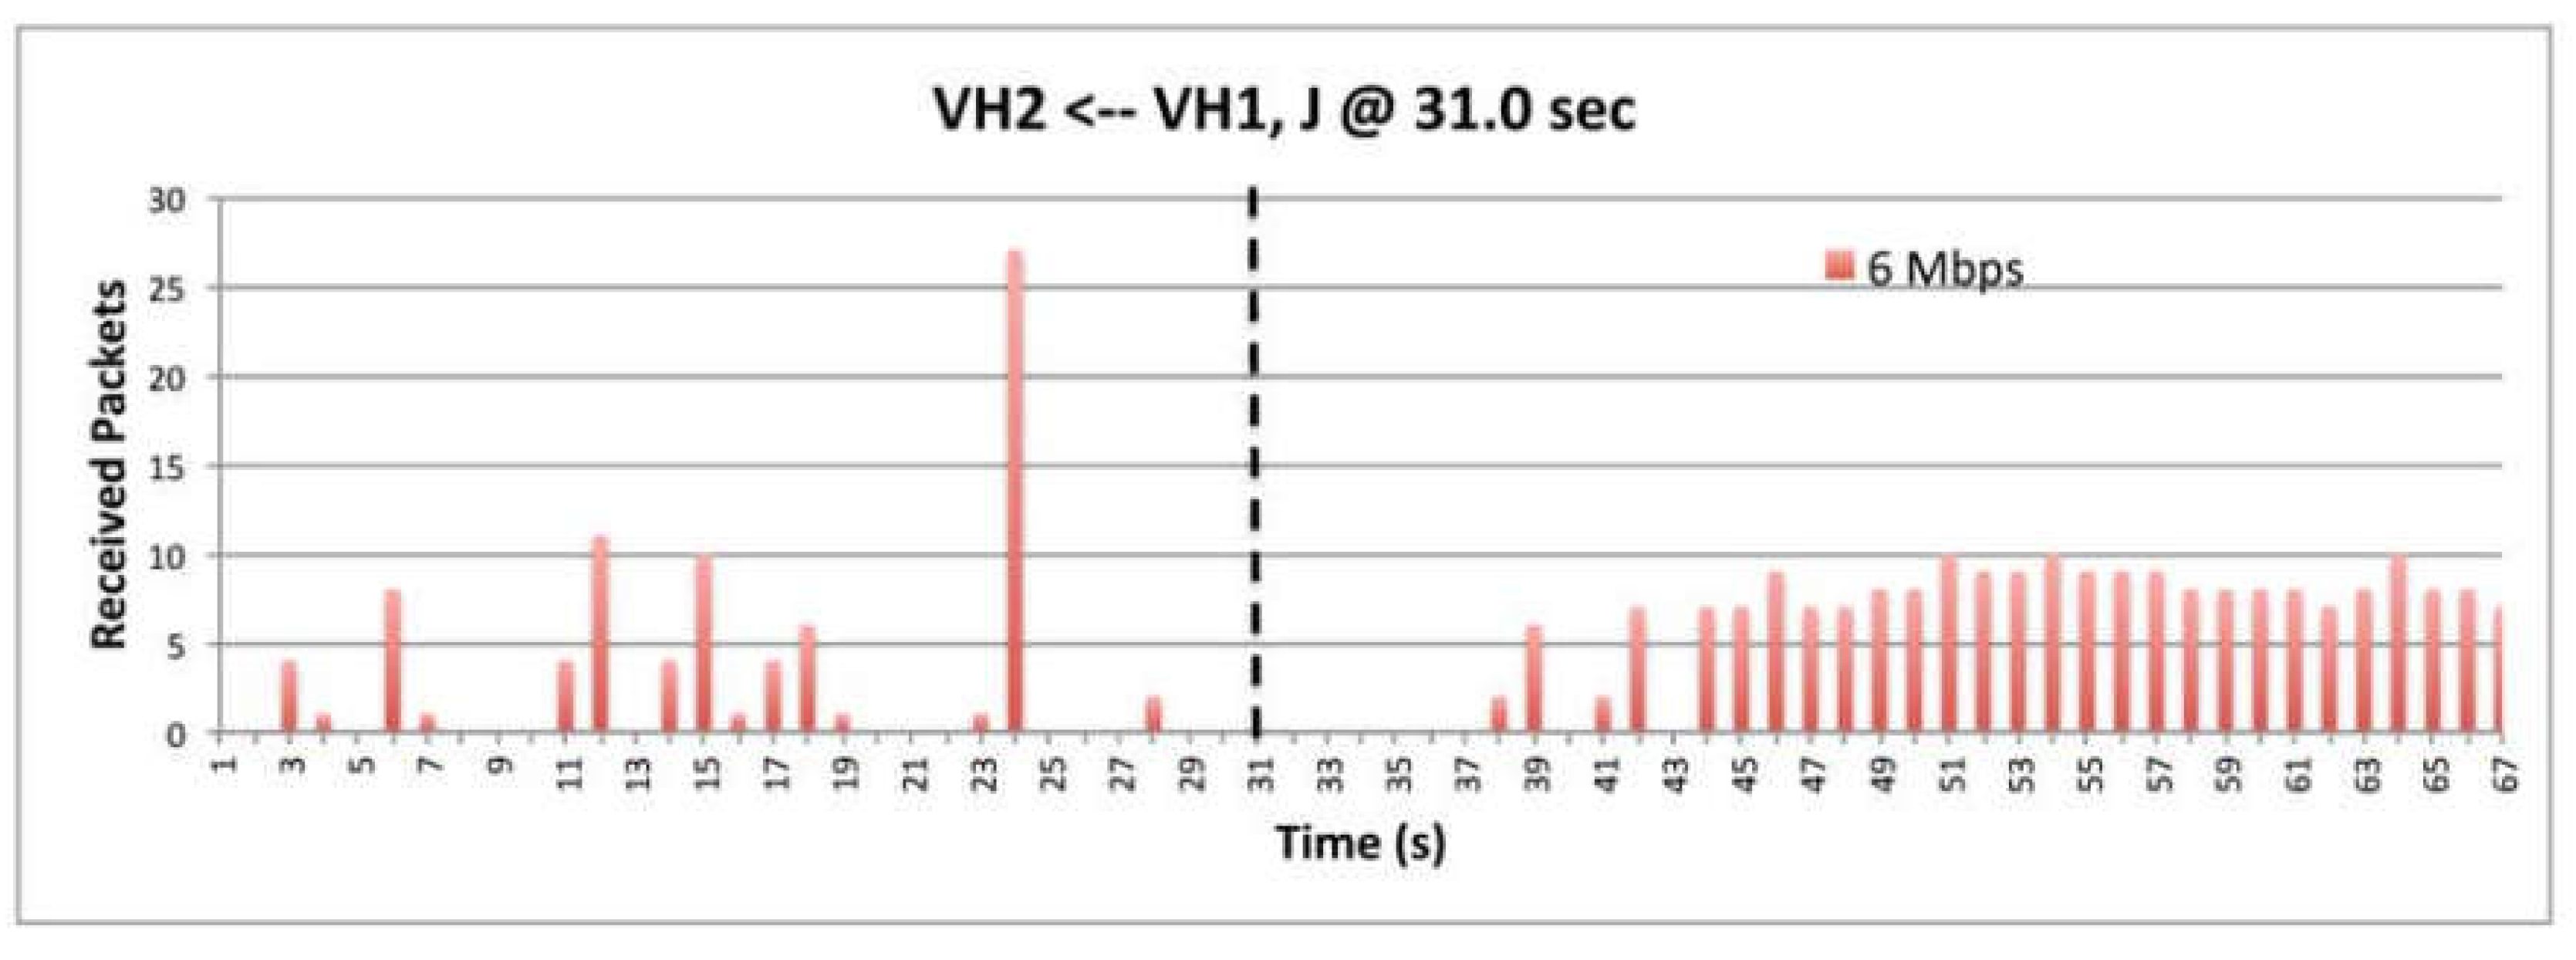
Figure 26.
Comparing the impact of BSM rates.
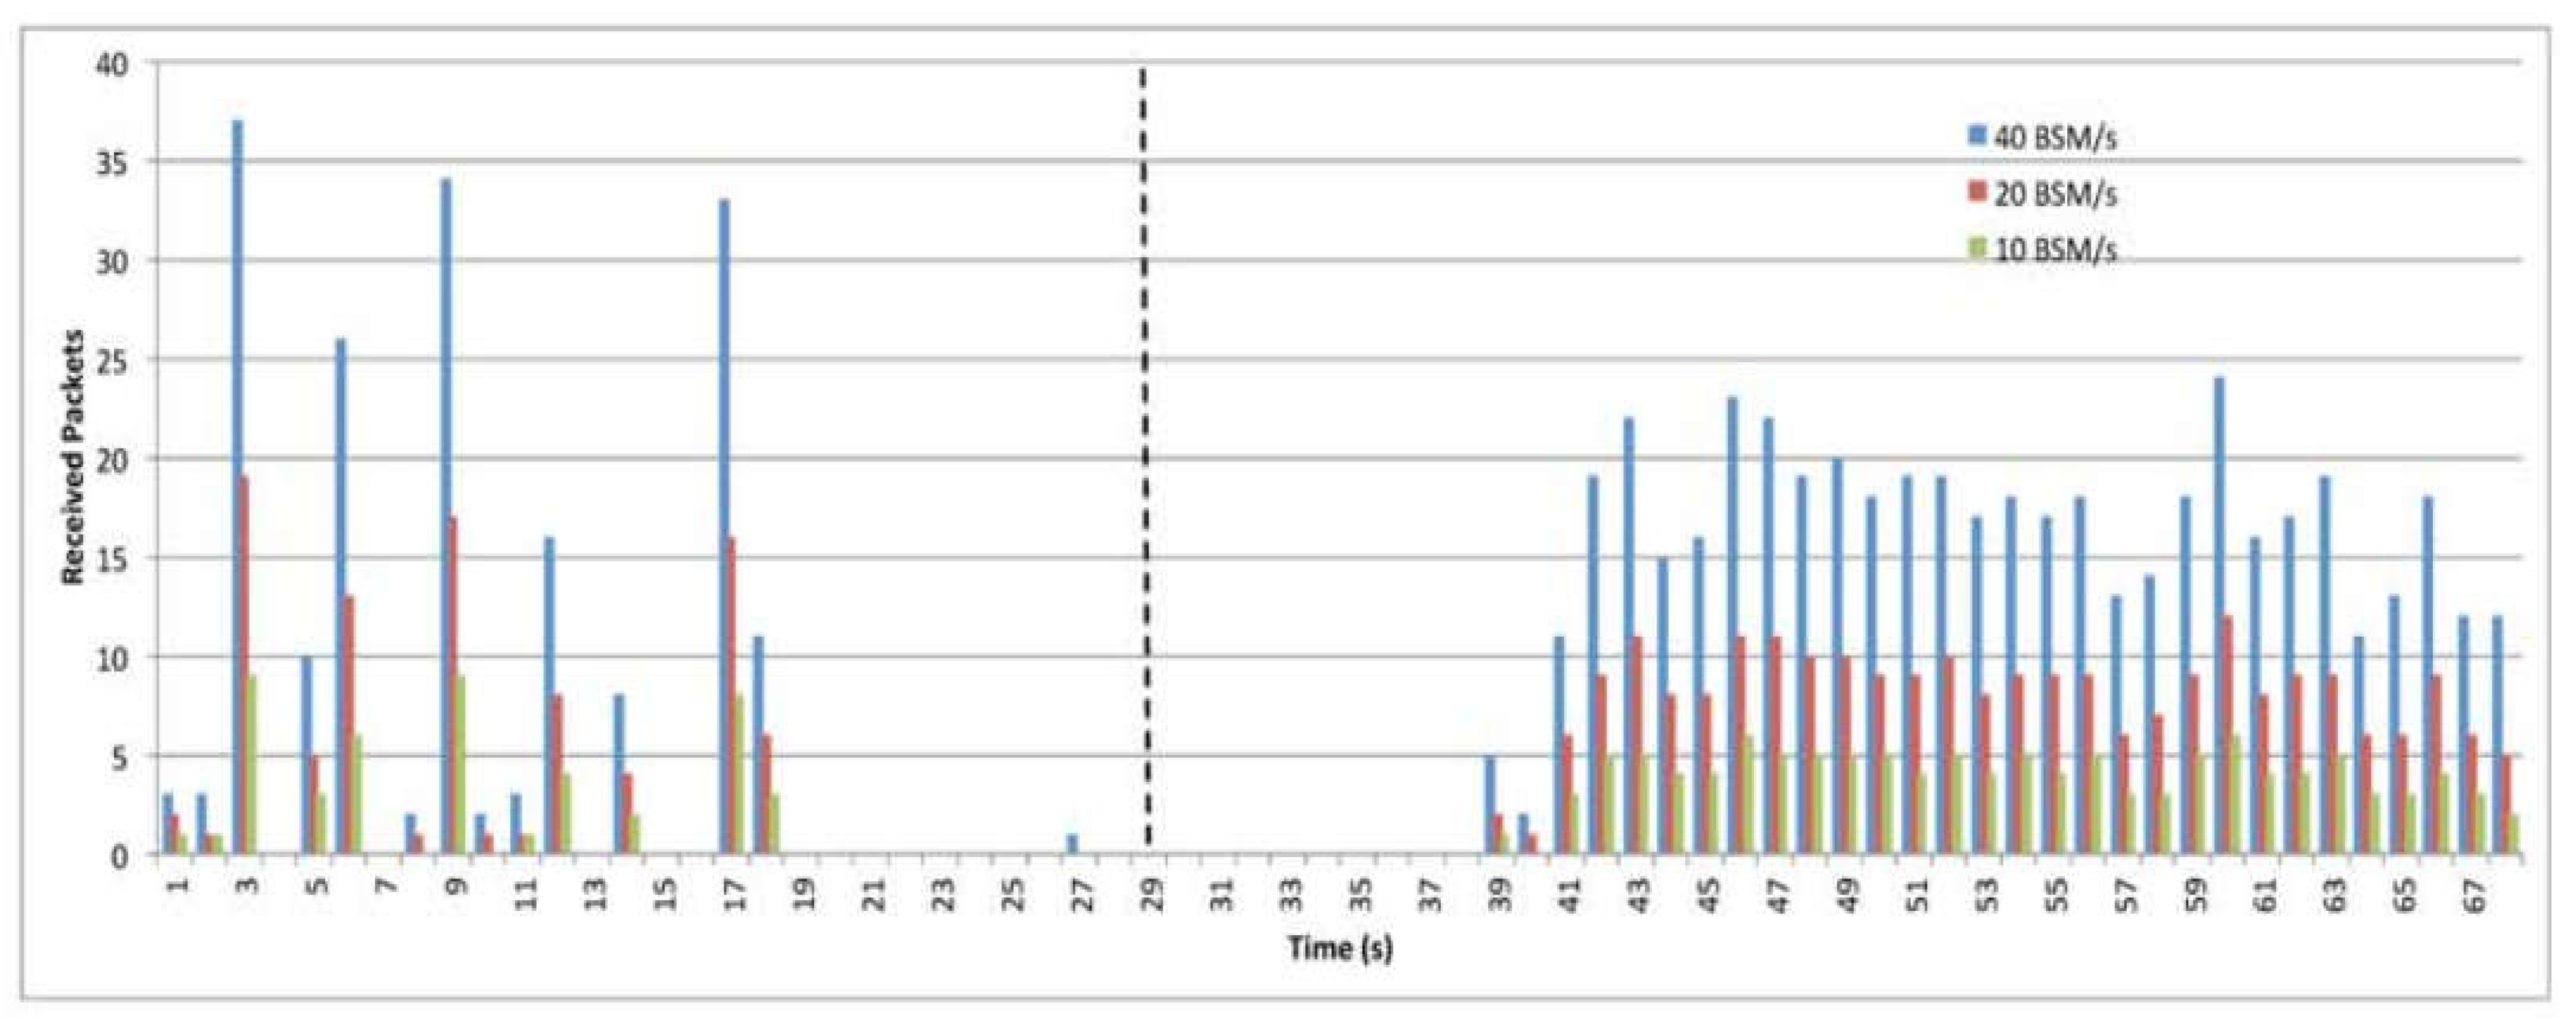
Figure 27.
The impact of relative distance between vehicles on SNR.
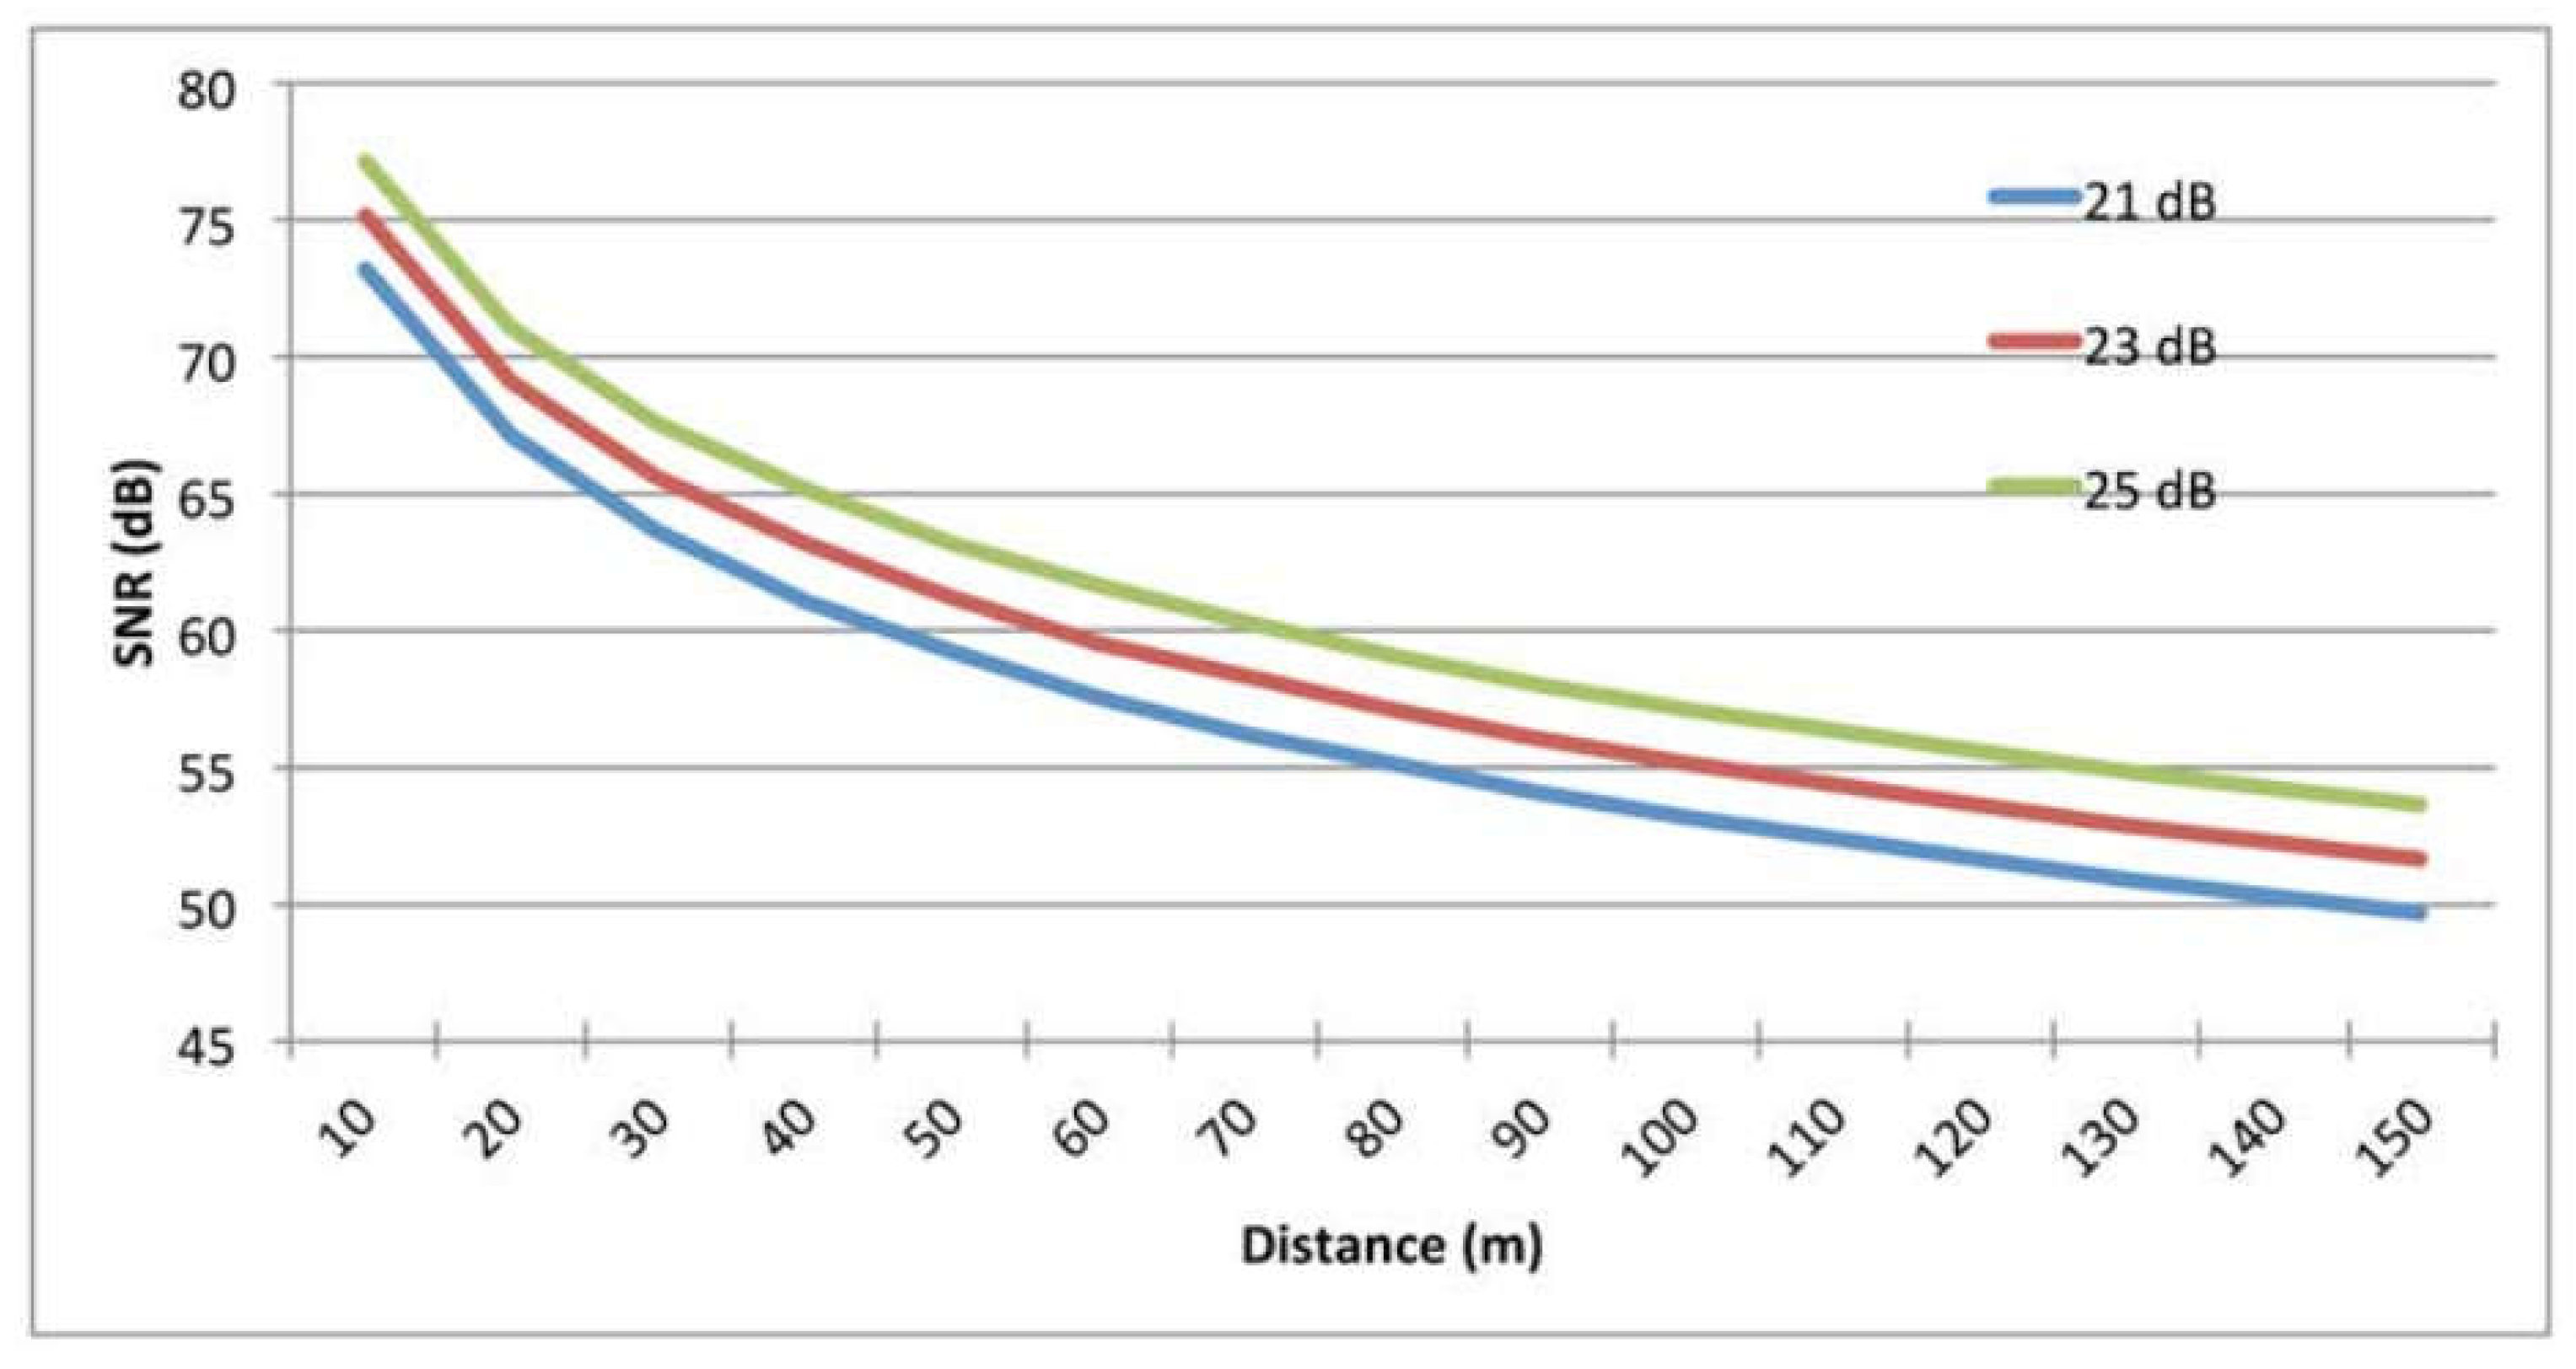

Table 1.
MAC model parameters.
| Average number of back-off slots, W | I6 |
| Transmission range, R | 6oo m |
| DIFS time | 64 micro s |
| Data rate | 6 Mbps |
| BSM rates | IO, 2o and 3o BSM/s |
| BSS size | i8o Bytes |
| Vehicle density | z-zoo vehicles/km |
Table 2.
Field test parameters.
| Vehicle speed | 16.6 m/s |
| OBU | Arada Systems LocoMate Classic |
| Length test range | 1.53 km |
| Test range | Straight of 2-lane road |
| Rate of BSM | 10 BSM/s (the BSM for every 100ms) |
| Jammer position | 700 m from starting point |
| Effective bandwidth | 8.3 MHz |
| Channel | Safety Channel 172 |
| Rate of Data | 6and 3 Mbps |
| Power Transmitter | 19 dBm |
| Data rates jammer | 3, 6,, 12 Mbps |
| Jammer power | 18 dBm |
Table 3.
Field test parameters.
| OBU Model | Arada Systems LocoMate Classic |
| Vehicle speed | 20 m/s |
| Range test | Two lines for the road |
| Test range length | 1000 m |
| Jammer position | 500 m from starting point |
| BSM generation | 10,20 and 40 BSM/s |
| Channel | Safety Channel 172 |
| Effective bandwidth | 8.3 MHz |
| Transmitter power | 21,23 and 25 dBm |
| Data rate Transmission | 3 and 6 Mbps |
| Data rate Jammer power | 6 Mbps and 18 dBm |
Table 4.
Recovery times for deceptive jammer of the trials presented.
| Deceptive Jammer (Field Experiment} | BSM /s | Power (dBm) |
Data Rate (Mbps) |
||||||
| 10 | 20 | 40 | 21 | 23 | 25 | 3 | 6 | ||
| Recovery Time (Seconds) | 12.0 | 9.0 | 9.0 | 9.0 | 9.0 | 7.0 | 10.0 | 11.0 | 12.0 |
| Distance (meters) |
145 | 115 | 125 | 106 | 68.5 | 120 | 125 | 150 | |
Disclaimer/Publisher’s Note: The statements, opinions and data contained in all publications are solely those of the individual author(s) and contributor(s) and not of MDPI and/or the editor(s). MDPI and/or the editor(s) disclaim responsibility for any injury to people or property resulting from any ideas, methods, instructions or products referred to in the content. |
© 2023 by the authors. Licensee MDPI, Basel, Switzerland. This article is an open access article distributed under the terms and conditions of the Creative Commons Attribution (CC BY) license (http://creativecommons.org/licenses/by/4.0/).
Copyright: This open access article is published under a Creative Commons CC BY 4.0 license, which permit the free download, distribution, and reuse, provided that the author and preprint are cited in any reuse.


