Submitted:
04 September 2023
Posted:
05 September 2023
You are already at the latest version
Abstract
With an increasing concern for global warming, there have been many attempts to reduce greenhouse gas emissions. About 30 % of total energy has been consumed by buildings and much attention has been paid to reducing building energy consumption. While there are many ways of reducing building energy consumption, accurate energy consumption prediction becomes more significant. As mechanical systems are the most energy-consuming components in the building, the present study developed the energy consumption prediction model for a direct-fired absorption chiller by using the ANN technique for the short term. The ANN model was optimized and validated with the actual data collected through a BAS. For the optimization, the numbers of input variables and neurons, and the data size of training were applied. By changing these parameters, the predictive performance was analyzed. In sum, the outcome of the present study can used to predict the energy consumption of the chiller as well as improve the efficiency of the energy management. The outcome of the present study can be used to develop a more accurate prediction model with a few datasets in that it can improve the efficiency of building energy management.
Keywords:
ANN
; energy consumption
; optimization
; direct fired absorption chiller
; validation
1. Introduction
According to energy consumption statistics, the building sector accounts for about 30 % of total energy consumption and 80 % of greenhouse gas emissions [1]. To reduce building energy consumption, many attempts have been made to design energy-efficient buildings by improving the thermal performance of building envelopes, using energy-efficient mechanical systems, and installing renewable energy systems. In addition, the optimized control and efficient operation of mechanical systems can make more energy-efficient buildings. Specifically, about half of the building energy was consumed by heating, ventilation, and air conditioning (HVAC) to maintain thermally comfortable indoors [2]. Thus, it is needed to manage the energy consumption of HVAC systems more efficiently in building operations. Recently, the use of building energy management systems (BEMS) can be practically used to manage building energy consumption by providing specific information on building energy usage. It is therefore required to predict accurate building energy consumption for optimizing building energy performance from the building design to operation [3].
In 2014, the Korean government regulated to installation of an energy management system (EMS) to strengthen building energy management. In addition, the Korean government has regulated to installation of BEMS in newly constructed public buildings or extensions, where the gross floor area is bigger than 10,000 m2 from 2017 [4,5]. According to the new laws in 2019 in South Korea, the regulation for the BEMS installation become more significant to strengthen building energy management. Regarding this law, it is required for building energy management to predict building energy consumption by implementing regression analyses or machine learning for hourly and daily energy usage and energy sources [5].
In South Korea, recent studies have been conducted to predict building energy load [6,7] and consumption[8,9], energy usage patterns[10,11], etc. by using machine learning or artificial intelligence (AI). Moreover, they pointed out that much attention should be paid to the accuracy of predictions by these techniques. Most of those techniques required a number of datasets to predict building energy consumption. If buildings do not equip BEMS or building automation systems (BAS), data generated by simulation tools are generally used. However, the simulated data are different from the measured data. In addition, it is even difficult to achieve the number of measured data for a short period. Thus, an effort needs to be made to improve the accuracy of the prediction with a few datasets for a short period.
The purpose of the present study is to develop the energy consumption prediction model for the short term based on the artificial neural networks (ANN) technique. After optimizing the ANN model, it is validated with the energy consumption data collected from an operation of a direct-fired absorption chiller. The outcome of the present study can be used to develop a more accurate prediction model with a few datasets in that it can improve the efficiency of building energy management.
2. Optimization and Validation of an ANN-based prediction model
The present study used an ANN technique to predict energy consumption for the short term. Since it requires a number of datasets to optimize the ANN model, the energy simulation was performed to generate datasets. Considering the correlation among data, input variables were chosen and preprocessed. The number of inputs and neurons and the data size of training and learning parameters were determined to optimize the ANN model. After optimizing the model, it was validated with measured data. Figure 1 shows the study process for the present study.
2.1. ANN model
Among ANN models, the present study implemented NARX(Nonlinear Autoregressive Network with eXogenous) Feedforward Neural Net-works model which was generally used to predict time-series data due to its high accuracy [3]. According to the results of several studies, the NARX model can be used to model non-linear dynamic systems and time-series forecasting models [12,13]. For the ANN model, Neural Networks Toolbox of MATLAB(R2020a) was used to create neural network. NARX Feedforward Neural Networks model was a multi-layer perceptron ANN model, which consists of an input layer, hidden layer, and output layer [14]. In addition, Levenberg-Marquardt algorithm was used to find a minimum of a function over a space of parameters, which is a popular trust algorithm. A similar structure of the ANN model used in the previous studies was used for the present study and the structure is shown in Figure 2 [14,15].
2.2. Assessment of the prediction model
In general, the performance of prediction models can be validated with ASHRAE (American Society of Heating, Refrigerating and Air-Conditioning Engineers) Guideline 14, FEMP (US DOE Federal Energy Management Program), IP-MVP (International Performance Measurement and Verification Protocol)’s M&V (Measurement and Verification) guideline [16,17,18]. These provide their M&V protocol and have the performance evaluation indicators (Table 1). Among those, the present study evaluated the performance of the prediction model based on ASHRAE Guideline 14. CV(RMSE) refers to the degree of scattering of estimated values in consideration of variance, and MBE is an error analysis index that identifies errors by tracking how close estimates form clusters through data bias, which are presented below as Equations 1 and 2. By using CV(RMSE), the performance evaluation indicators of the predictive model were validated.
where n is the number of data points, p is the number of parameters, is the utility data used for calibration, is the simulation predicted data, and is the arithmetic mean of the sample of n observations. In addition, the suitability of the model was evaluated by using R2. After 10 times of learning, the average, maximum, minimum, and standard deviation were used to evaluate the predictive performance of the ANN-based prediction model.
3. The optimization of the ANN-based model using the simulation data
To improve the predictive performance of ANN models, it generally requires a number of data[19]. For the present study, data generated by simulations were used. The data generated by simulations have the advantage of choosing the data for certain periods when it is not able to gather data from buildings over a long period.
3.1. Energy simulation for generating data
In the present study, an office building was chosen. The reference building has 18 floors with a gross floor area of 41,005 m2. For heating and cooling, 2 direct-fired absorption chillers were equipped and one chiller was operated. Each chiller’s cooling capacity was 600 USRT. For the energy simulation, EnergyPlus 9.3.0 was used. The reference building (a in Figure 3) was modeled by using Openstudio as shown in b in Figure 3. The inputs for the energy simulation such as the operation schedule, occupancy, etc. were the same as the reference building. In addition, the climate data collected from the BAS installed at the reference building were synthesized into TRY format. Table 2 shows the specific inputs for the energy simulation.
3.2. The optimization process for improving the predictive performance of the ANN model
3.2.1. Input variables
In this stage, input variables were chosen among the data generated by the energy simulation for training. Using the Spearman rank-order correlation coefficient, the correlation between input and output was analyzed. The high prioritized correlated value was chosen as input values. The input layer for a direct-fired absorption chiller consisted of outside dry-bulb temperature, dew-point temperature, outside wet-bulb temperature, supply chilled water temperature, supply chilled water flow rate, condenser water temperature, and seasonal data. In the hidden layer, data were received as an input signal from the input layer through the internal neurons. The output layer predicted the energy consumption from the direct-fired absorption chillers based on the hidden layer calculation result. Table 3 presents the calculation results and ranks from the correlation between input variables (x(t)) and the predicted gas consumption of the direct-fired absorption chiller (y(t)).
3.2.2. Input parameters
The number of hidden layers was set at 3. As one of the learning parameters, the number of epochs was 100. Since the number of neurons in the hidden layers mainly influences the calculation prediction and time, the number of neurons was changed from 2 to 20 by 2. While the number of input variables was changed from 3 to 7, the size of datasets ranged from 50 %–90 %. Detailed parameter conditions are summarized in Table 4.
3.3. The result and discussion
3.3.1. The predictive performance by the number of input variable changes
Figure 4 shows the result of the predictive performance by changing the number of input variables to find the optimized number of input variables. For this work, the number of neurons and the data size of training were set at 10 and 60 %, respectively. As the number of input variables increased, the average values of CVRMSE were in the range of 5.69 %–8.43 % and 12.25 %–24.04 % for the training and testing period, respectively. These were within the acceptable values of 30 % by ASHRAE Guideline 14. When the number of input variables was 4, the average value of CVRMSE was the lowest (5.69 %) for the training period. In the case of the testing period, the average value of CVRMSE was the lowest (13.25 %) when the number of input variables was 5. Moreover, the average, minimum, and maximum values of CVRMSE were 12.25 %, 8.56 %, and 16.05 %, when the number of input variables was 5. This showed the most accurate predictive performance. When the minimum number of input variables of 3 was used, the average values of CVRMSE were decreased to 0.58 % and 3.74 % for the training and testing period, respectively. The standard deviation was 2.44 which showed constant predictive performance. When the number of input variables was above 5, the average value of CVRMSE was increased, while the accuracy of the predictive performance was lowered. This can be seen that the predictive performance of the ANN model is lowered when the input variables are not correlated with the input layer. Therefore, the predictive performance was the most acceptable when the number of input variables was 5. According to the result, it is important to consider the correlation between the input layer and input variables rather than increasing the number of input variables. Table 5 shows the values of average, minimum, maximum, and standard deviation with the increase in the number of input variables.
3.3.2. The predictive performance by the number of neurons changes
In this stage, the predictive performance of the model was analyzed by changing the number of neurons (Figure 5). The number of input variables was 5 and the size of the learning data was set at 60 %. As the number of neurons was increased, the average values of CVRMSE were in the range of 5.61 %–22.44 % and 12.25 %–27.14 % for the training and testing period, respectively. These were within the acceptable values of 30 % by ASHRAE Guideline 14. When the number of neurons was 20, the average value of CVRMSE was the lowest (5.61 %) for the training period. In the case of the testing period, the average value of CVRMSE was the lowest (12.25 %) when the number of neurons was 10. Moreover, the most accurate predictive performance was obtained when the number of neurons was 10 in which, the values of average, minimum, and maximum CVRMSE were 12.25 %, 8.56 %, and 16.05 % respectively. When comparing the number of neurons between 10 and 2, the average values of CVRMSE for the training and testing period were decreased to 16.66 % and 12.55 %, respectively. When the number of neurons was 10, the predictive performance was improved by decreasing the values of CVRMSE gradually, while it was lowered by increasing the value of CVRMSE when the number of neurons was higher than 12. This indicated that the weight was increased with the increase in the number of neurons in that overfitting was obtained. When the number of neurons was higher than 10, the standard deviation was in the range of 1.42-2.84, which showed more constant predictive performance than that originated from the number of neurons below 10. It showed that the most acceptable predictive performance was obtained when the number of neurons was 10. It can be seen that the increase in the number of neurons was not able to improve the predictive performance of the ANN model. Thus, it is important to find a suitable number of neurons by observing the predictive performance. Table 6 shows the values of average, maximum, minimum, and standard deviation by increasing the number of neurons.
3.3.3. The predictive performance by the data size changes of training
Figure 6 presents the values of CVRMSE by changing the data size of training. Based on the previous results, the number of input variables and neurons was set at 5 and 10, respectively. The data size of training was increased from 50 % to 90 % by 5 %. The average values of CVRMSE were in the range of 5.36 % - 7.74 % and 8.93 % - 17.69 % for the training and testing period, respectively. These were all within the acceptable range of ASHRAE Guideline 14. In addition, it showed a suitable predictive performance of 20 %. When the data size of the training was set at 65 %, the average value of CVRMSE was the lowest (5.36 %) for the training period, while it was 8.93 % for the testing period when the data size of the training was 85 %. Moreover, the average, minimum, and maximum values of CVRMSE were 8.93 %, 6.69 %, and 11.23 %, when the data size of training was 85 %. That showed the most accurate predictive performance. When the data size of training was increased to 85 %, the predictive performance was improved, while the CVRMSE was decreased gradually. However, the predictive performance was degraded with 90 % of the training data size. The standard deviation ranged from 1.88–1.45 when the data size of training was set between 70 % - 85 %. Thus, the ANN model showed the most acceptable predictive performance when the data size of training was set between 80 % - 85 %. Table 7 presents the predictive values of maximum, minimum, and standard deviation by changing the data size of training.
4. The validation of the ANN model for a short term with measured data
Based on the obtained results, the predictive performance of the ANN model for a direct-fired absorption chiller for a short term was validated with actual data. The specific conditions were 5 and 10 for the input layer and neurons, respectively. The size of training was set in the range of 70 % - 85 %. The actual data were collected from the BAS installed in the reference building during the summer (July 1–August 8, 40 days), which was about 952 hours of datasets. The data were preprocessed by using data transformation considering the unit of building energy consumption.
4.1. The validation of the ANN model with measured data
Figure 7 shows the comparison result of the predictive performance by changing the size of the training of measured data. By changing the data size of training, the average values of CVRMSE were in the range of 18.68 % - 21.11 % and 19.99 % - 26.06 % for the training and testing period, respectively. These values were all within the acceptable range of ASHRAE Guideline 14. As shown previously, the predictive performance was improved by increasing the data size of training. The most acceptable predictive performance was obtained with 85 % of the training data size. Specifically, the average, maximum, and minimum values of CVRMSE for the testing period were 19.99 %, 22.02 %, and 17.5 %, respectively. However, the CVRMSE values obtained from the ANN model with the actual data were higher than those obtained from the ANN model with data generated by the simulation. This was caused by the decrease in the number of datasets from 8,760 to 952. In addition, it can be also a result of the quality difference between the simulated and measured data. Table 8 과 같. Even though the average values of CVRMSE obtained by the ANN model with the actual data were higher than that obtained by the model with simulated data, the standard deviation was in the range of 1.36–1.62, constantly. Table 8 shows the average, maximum, minimum, and standard deviation of predictive performance by changing the size of training.
4.2. The prediction result of the energy consumption for a short term by using measured data
Figure 8 shows the energy consumption comparison between the prediction obtained by the ANN model and the reference building for 952 hours. As shown previously, the standard deviation difference between the prediction and measured data was decreased as the size of training was increased.
Figure 9 shows the energy consumption comparison between the prediction and the actual data by changing the data size of training including the error rate difference. The total energy consumption of the direct-fired absorption chiller was 998.22 GJ. The error rate difference was 2.16 %, 1.82 %, 1.44 %, and 1.11 % for the training data size of 70 %, 75 %, 80 % and 85 %, respectively. This indicates that the predictive performance of the model was improved by increasing the data size of training data. As shown above, the training data size plays a significant role in the predictive performance of the model with the actual data. Thus, it is important to find a suitable training data size for improving the predictive performance. The summarized predictive performance of the model with the actual data is presented in Table 9.
5. Conclusions
The present study developed the ANN model by using the collected data and the developed model was optimized. By using the energy consumption of the direct-fired absorption chiller, the predictive performance of the ANN model was validated.
When the number of input variables and neurons was set at 5 and 10, and the data size of training was 85 %, the average value of CVRMSE was the lowest in that the predictive performance was the most acceptable. By using the measured data, the ANN model was validated. As a result, the average value of CVRMSE was 19.99 %. Even though the CVRMSE was somewhat increased, the error rate was less than 1 %. This indicated that the predictive performance of the ANN model was acceptable. In sum, the outcome of the present study can used to predict the energy consumption of the chiller as well as improve the efficiency of the energy management.
The present study developed the ANN model to predict the energy consumption of the chiller. However, an HVAC system consists of many components such as air handling units, fans, boilers, pumps, etc. Therefore, it requires to develop ANN models for these components for further study. By applying the methodology used in this study, it can expect to improve the predictive performance of the model for the energy consumption of these components.
Author Contributions
N.S. contributed to conceptualization, methodology, writing—original draft preparation, formal analysis, visualization,; G.H. performed writing—review and editing, funding acquisition. All authors have read and agreed to the published version of the manuscript.
Funding
This research was supported by Basic Science Research Program through the National Research Foundation of Korea (NRF) funded by the Ministry of Education (No.2021R1A6A3A01087034).; This work was supported by the National Research Foundation of Korea (NRF) grant funded by the Korea government (MSIT) (No. 2020R1C1C1010801)
Data Availability Statement
Not applicable.
Acknowledgments
Not applicable.
Conflicts of Interest
The authors declare no conflict of interest.
References
- Iea. global status report for buildings and construction 2019; Iea: Paris, France, 2019. [Google Scholar]
- Us department of energy, an assessment of energy technologies and research opportunities. Quadrennial technology review, 2015.
- Kim, J.-H.; Seong, N.-C.; Choi, W. Cooling load forecasting via predictive optimization of a nonlinear autoregressive exogenous (narx) neural network model. Sustainability. 2019, 11, 6535. [Google Scholar] [CrossRef]
- Regulations on the promotion of rational use of energy in public institutions ministry of trade, industry and energy, 2017. Available online: http://www.Motie.Go.Kr/.
- Regulations for the operation of energy management system installation and confirmation. Available online: https://www.Energy.Or.Kr/.
- Seong, N.; Hong, G. Comparative Evaluation of Building Cooling Load Prediction Models with Multi-Layer Neural Network Learning Algorithms. KIEAE Journal. 2022, 22, 35–41. [Google Scholar] [CrossRef]
- Seong, N.-C.; Hong, G. An Analysis of the Effect of the Data Preprocess on the Performance of Building Load Prediction Model Using Multilayer Neural Networks. Journal of Korean Institute of Architectural Sustainable Environment and Building Systems. 2022, 16, 273–284. [Google Scholar]
- Lee, C.-W.; Seong, N.-C.; Choi, W.-C. Performance Improvement and Comparative Evaluation of the Chiller Energy Consumption Forecasting Model Using Python. Journal of Korean Institute of Architectural Sustainable Environment and Building Systems. 2021, 15, 252–264. [Google Scholar]
- Junlong, Q.; Shin, J.-W.; Ko, J.-L.; Shin, S.-K. A Study on Energy Consumption Prediction from Building Energy Management System Data with Missing Values Using SSIM and VLSW Algorithms. The transactions of The Korean Institute of Electrical Engineers 2021, 70, 1540–1547. [Google Scholar] [CrossRef]
- Yoon, Y.-R.; Shin, S.-H.; Moon, H.-J. Analysis of Building Energy Consumption Patterns according to Building Types Using Clustering Methods. Journal of The Korean Society of Living Environmental System. 2017, 24, 232–237. [Google Scholar] [CrossRef]
- Gu, S.; Lee, H.; Yoon, J.; Kim, D. Investigation on Electric Energy Consumption Patterns of Residential Buildings in Four Cities through the Data Mining. Journal of the Korean Solar Energy Society. 2022, 42, 127–139. [Google Scholar]
- Di Nunno, F.; Granata, F. Groundwater level prediction in apulia region (southern italy) using narx neural network. Environmental Research 2020, 190, 110062. [Google Scholar] [CrossRef] [PubMed]
- Koschwitz, D.; Frisch, J.; van Treeck, C. Data-driven heating and cooling load predictions for non-residential buildings based on support vector machine regression and narx recurrent neural network: A comparative study on district scale. Energy 2018, 165, 134–142. [Google Scholar] [CrossRef]
- Kim, J.-H.; Seong, N.-C.; Choi, W.-C. Comparative evaluation of predicting energy consumption of absorption heat pump with multilayer shallow neural network training algorithms. Buildings 2022, 12. [Google Scholar] [CrossRef]
- Kim, J.; Hong, Y.; Seong, N.; Kim, D.D. Assessment of ann algorithms for the concentration prediction of indoor air pollutants in child daycare centers. Energies 2022, 15. [Google Scholar] [CrossRef]
- American society of heating, refrigerating and air conditioning engineers, ashrae guideline 14-2002, measurement of energy and demand savings - measurement of energy, demand and water savings, 2002.
- M&v guidelines: Measurement and verification for performance-based contracts, federal energy management program. Available online: https://www.Energy.Gov/eere/femp/downloads/mv-guidelines-measurement-and-verification-performance-based-contracts-version.
- Evo. International performance measurement and verification protocol, concepts and options for determining energy and water savings; efficiency valuation, organization, Ed.; 2007; vol. 3. [Google Scholar]
- Seong, N.-C.; Kim, J.-H.; Choi, W. Adjustment of multiple variables for optimal control of building energy performance via a genetic algorithm. Buildings 2020, 10, 195. [Google Scholar] [CrossRef]
Figure 1.
The study process.
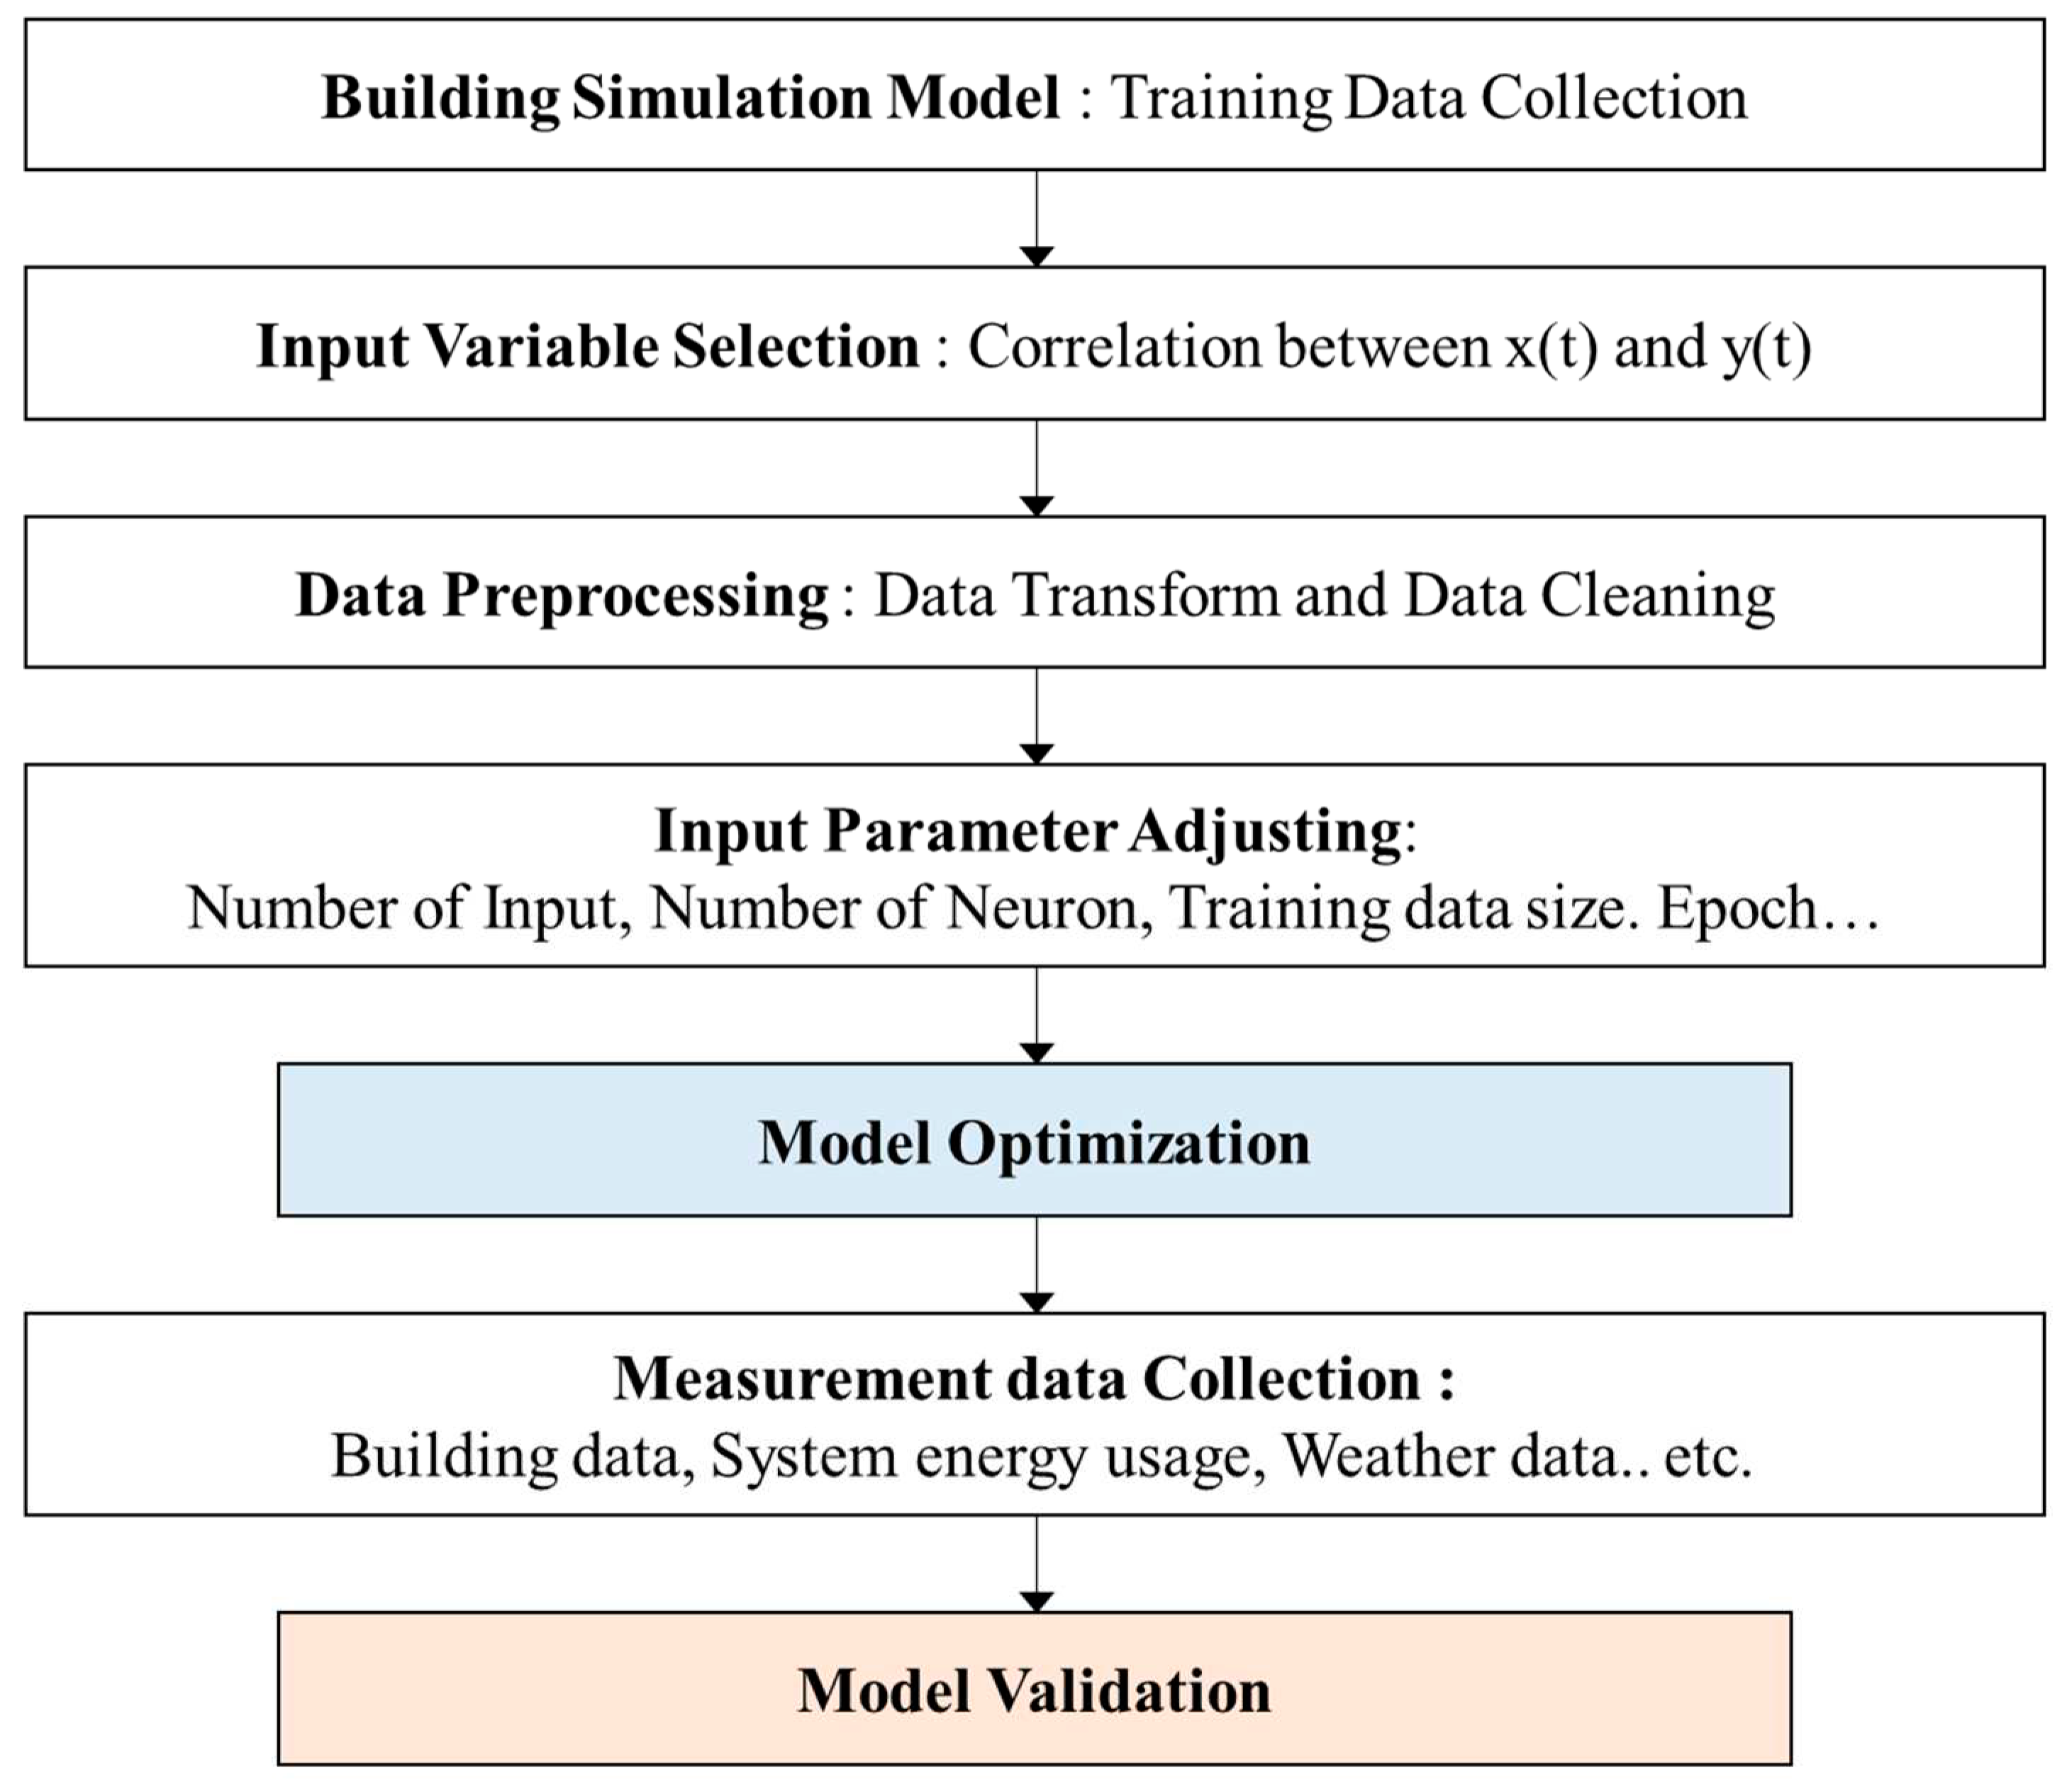
Figure 2.
Structure of a multilayer neural network model.
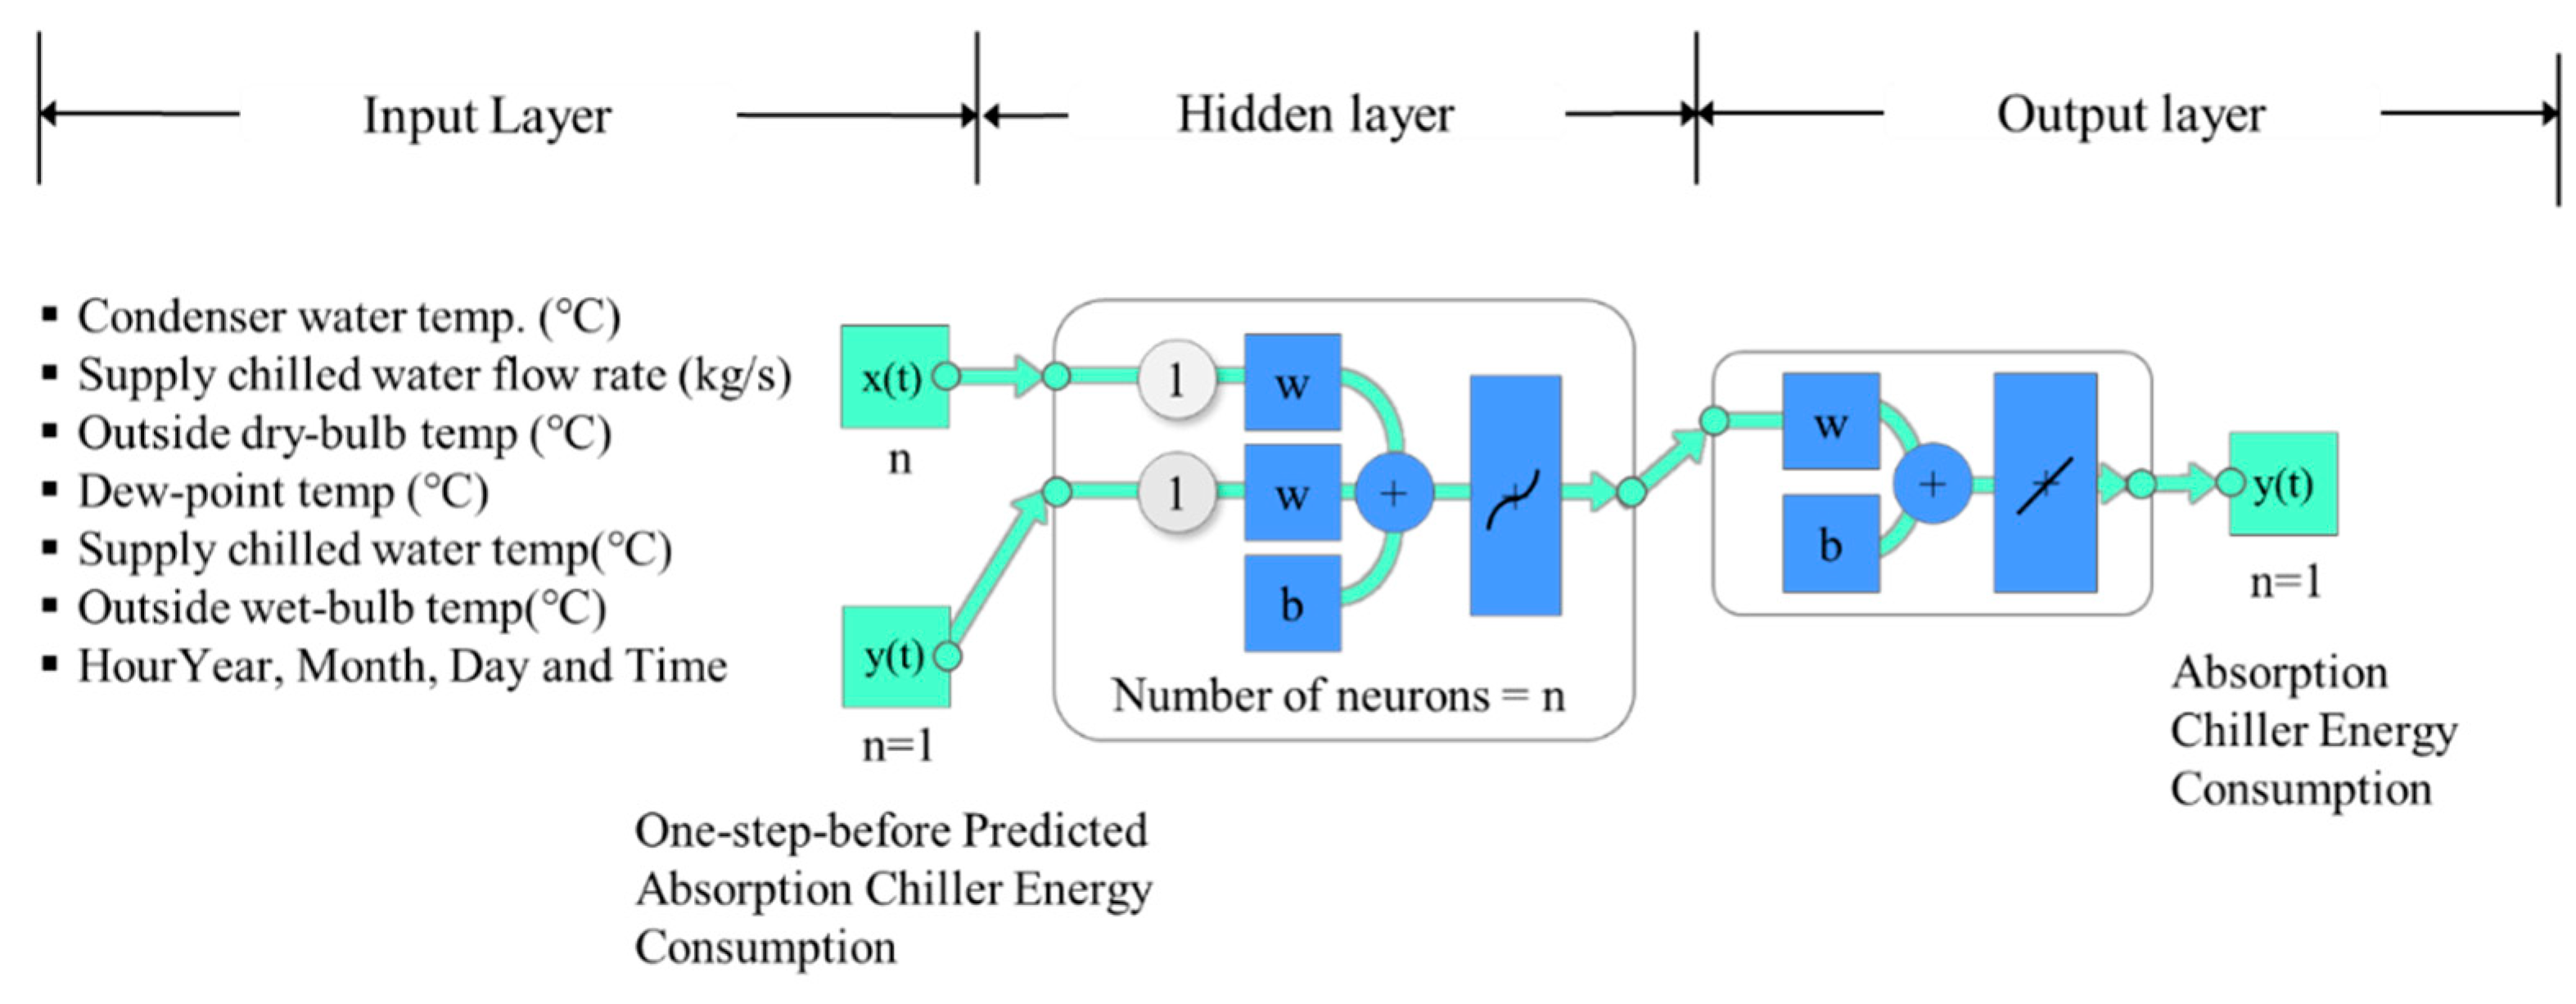
Figure 3.
The reference building overview and the model using Openstudio.
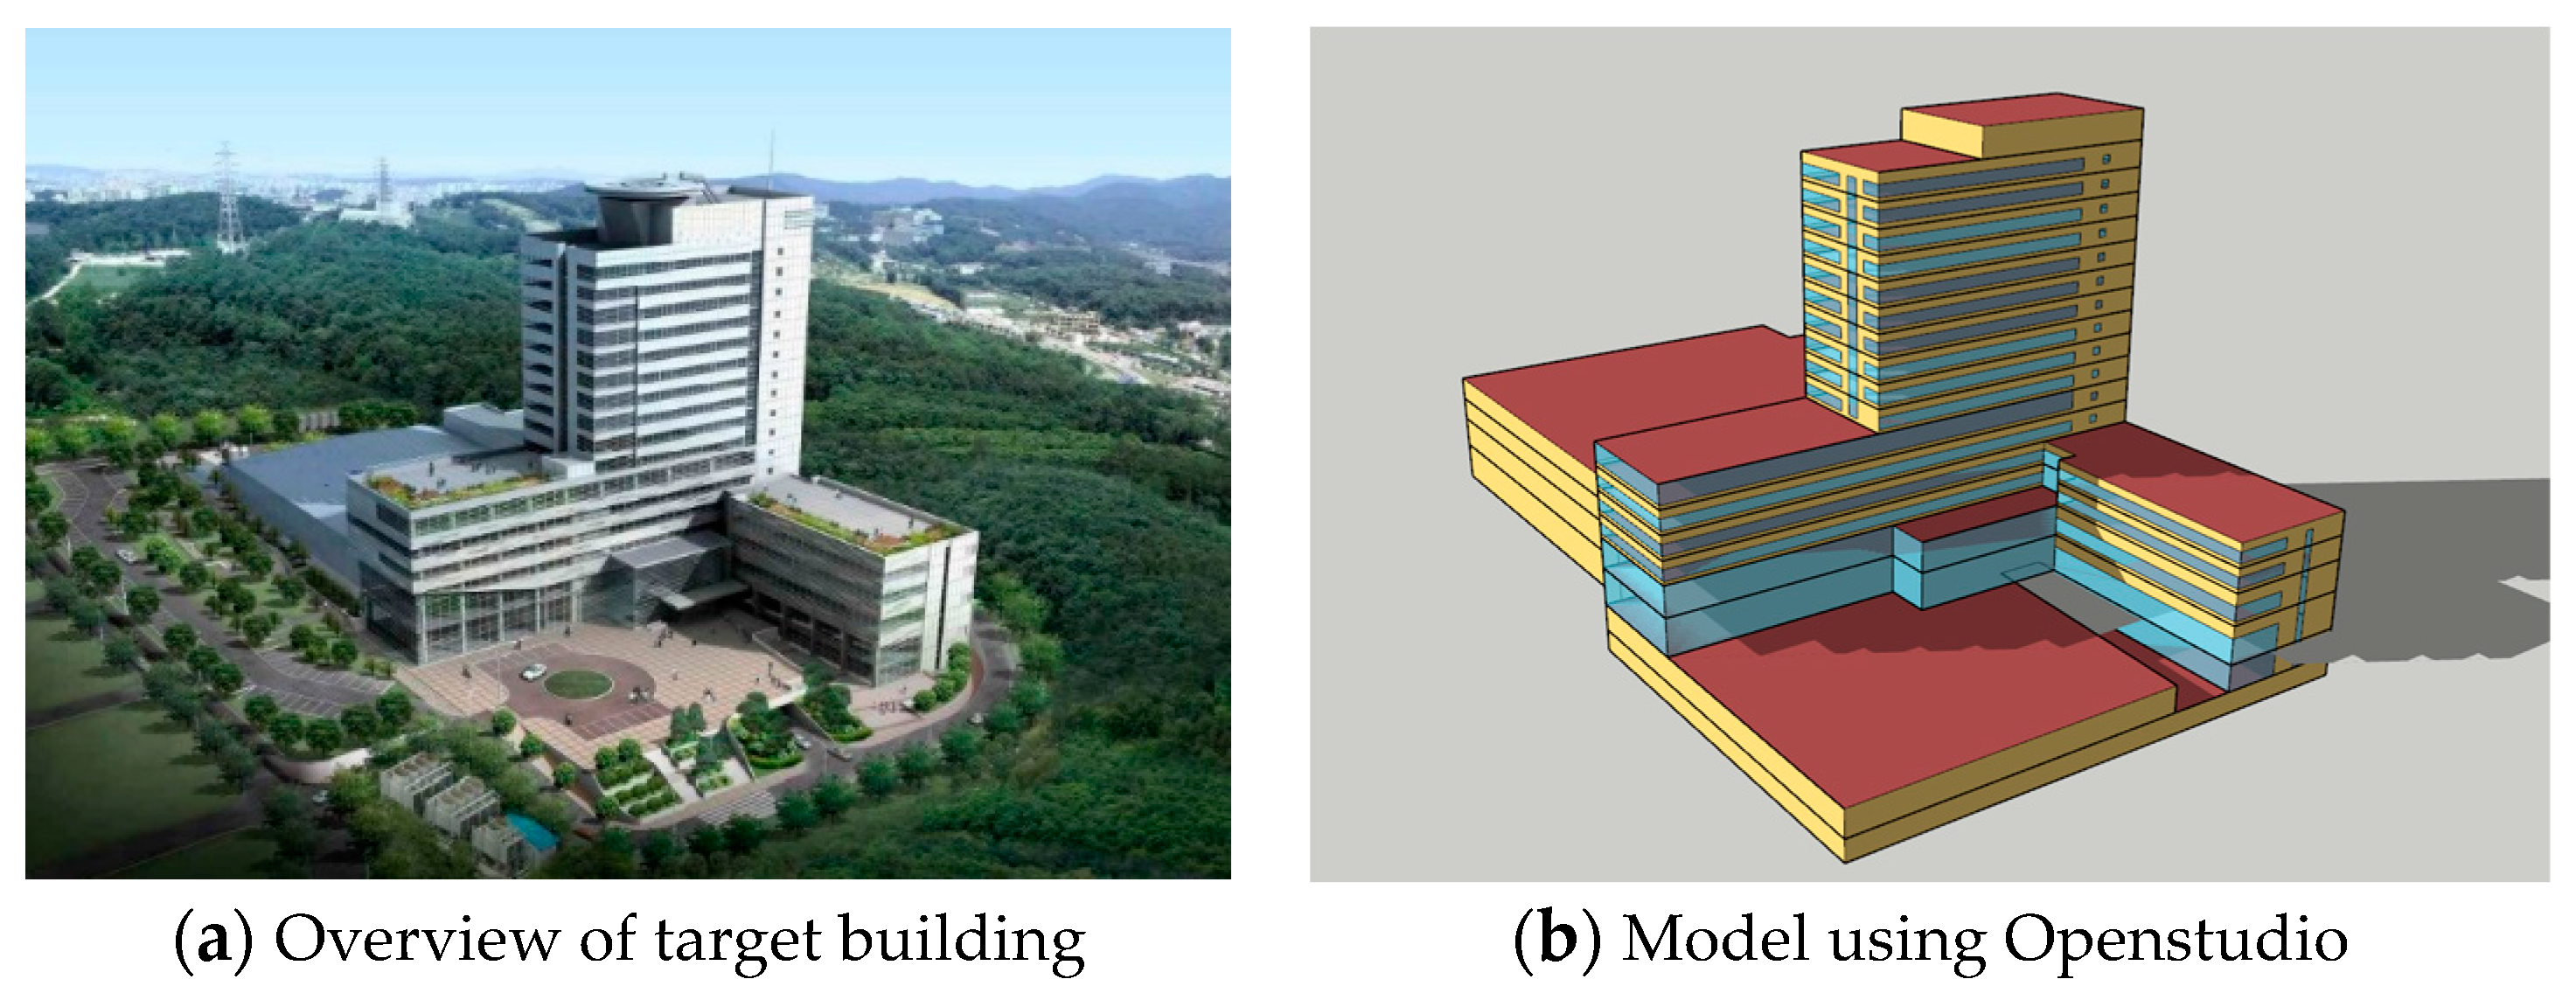
Figure 4.
The predictive performance by changing the number of input variables.
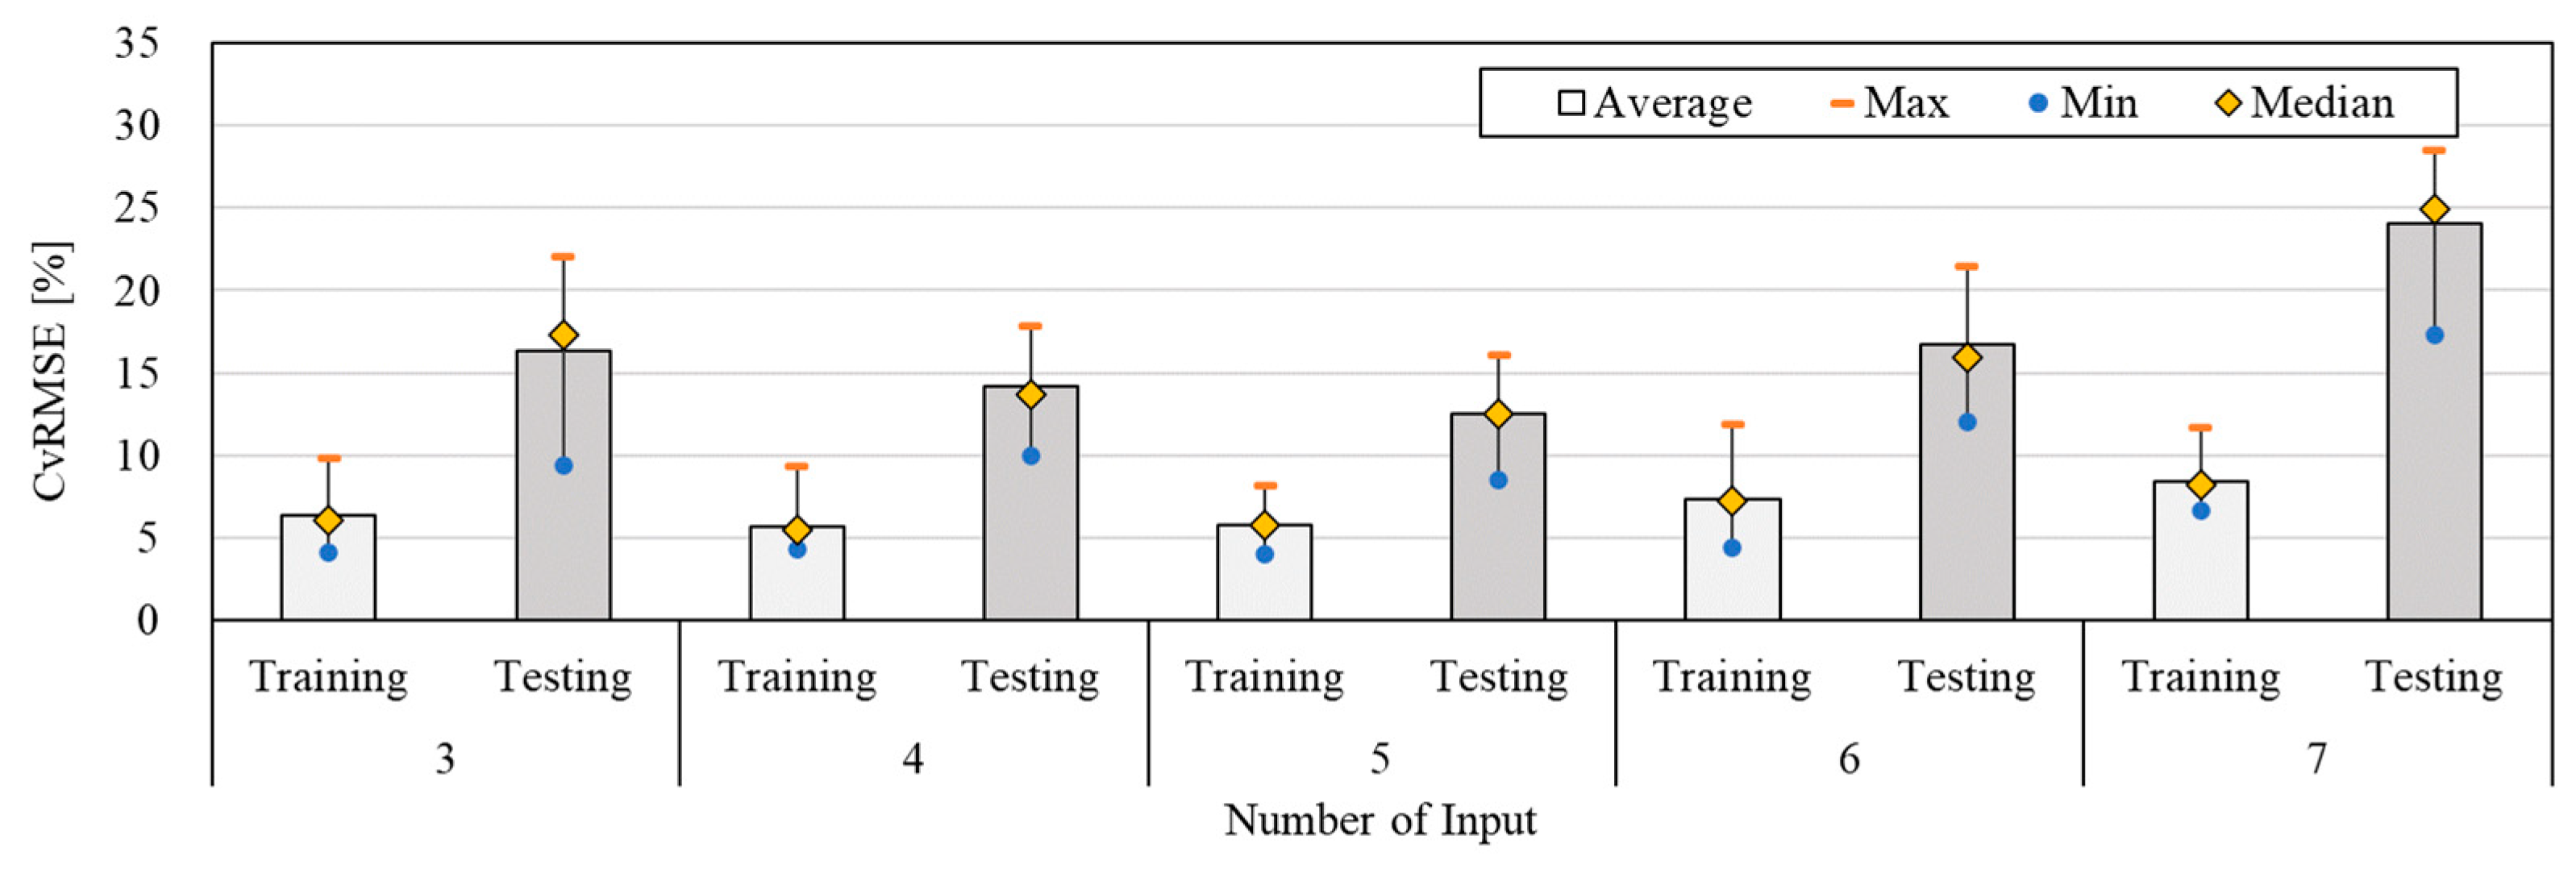
Figure 5.
The predictive performance by changing the number of neurons.
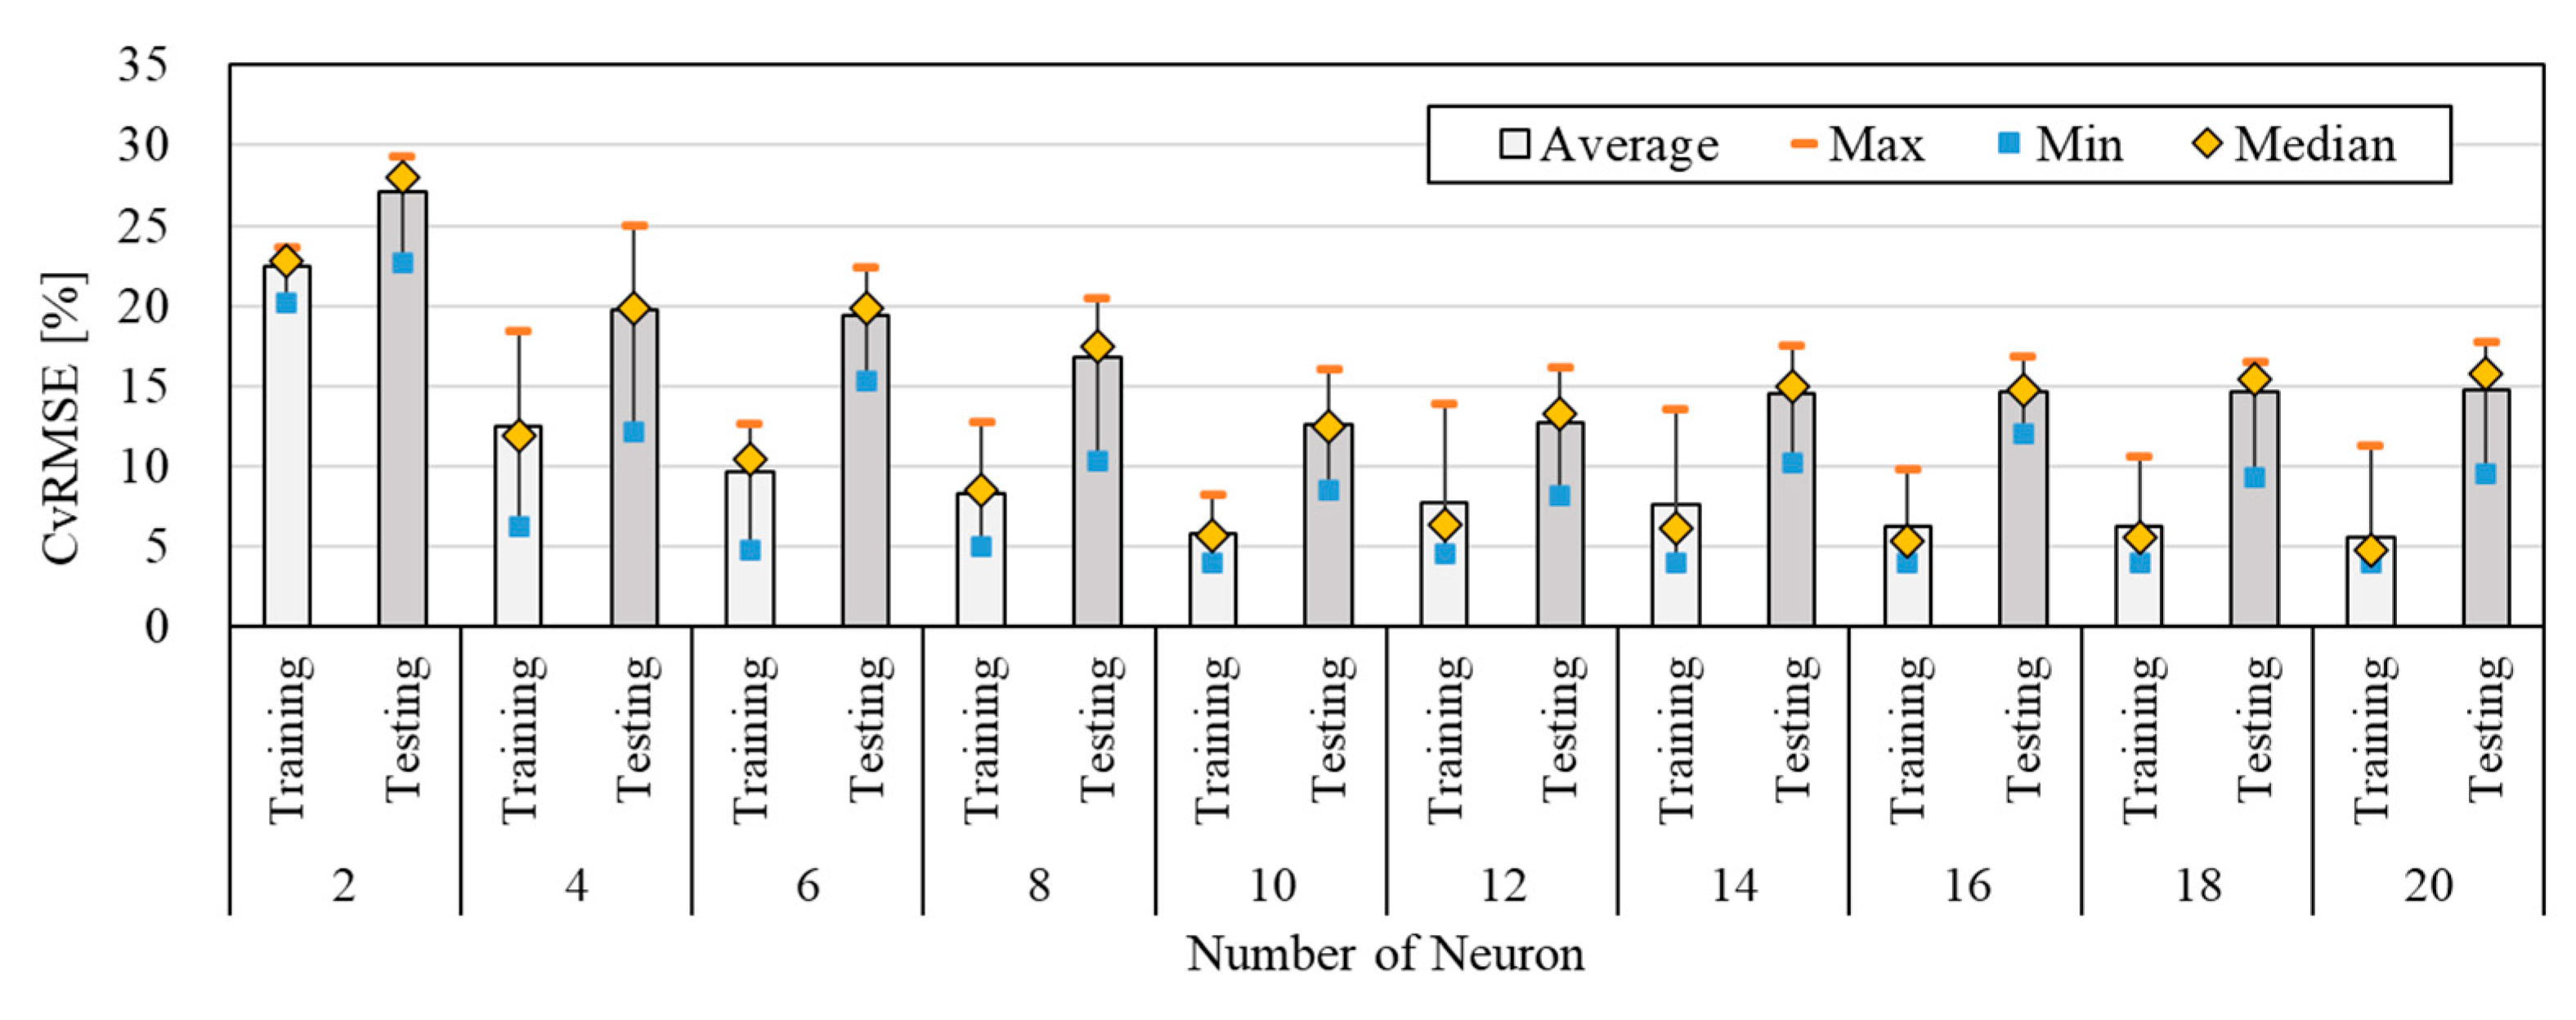
Figure 6.
The predictive performance by changing the data size of the training.
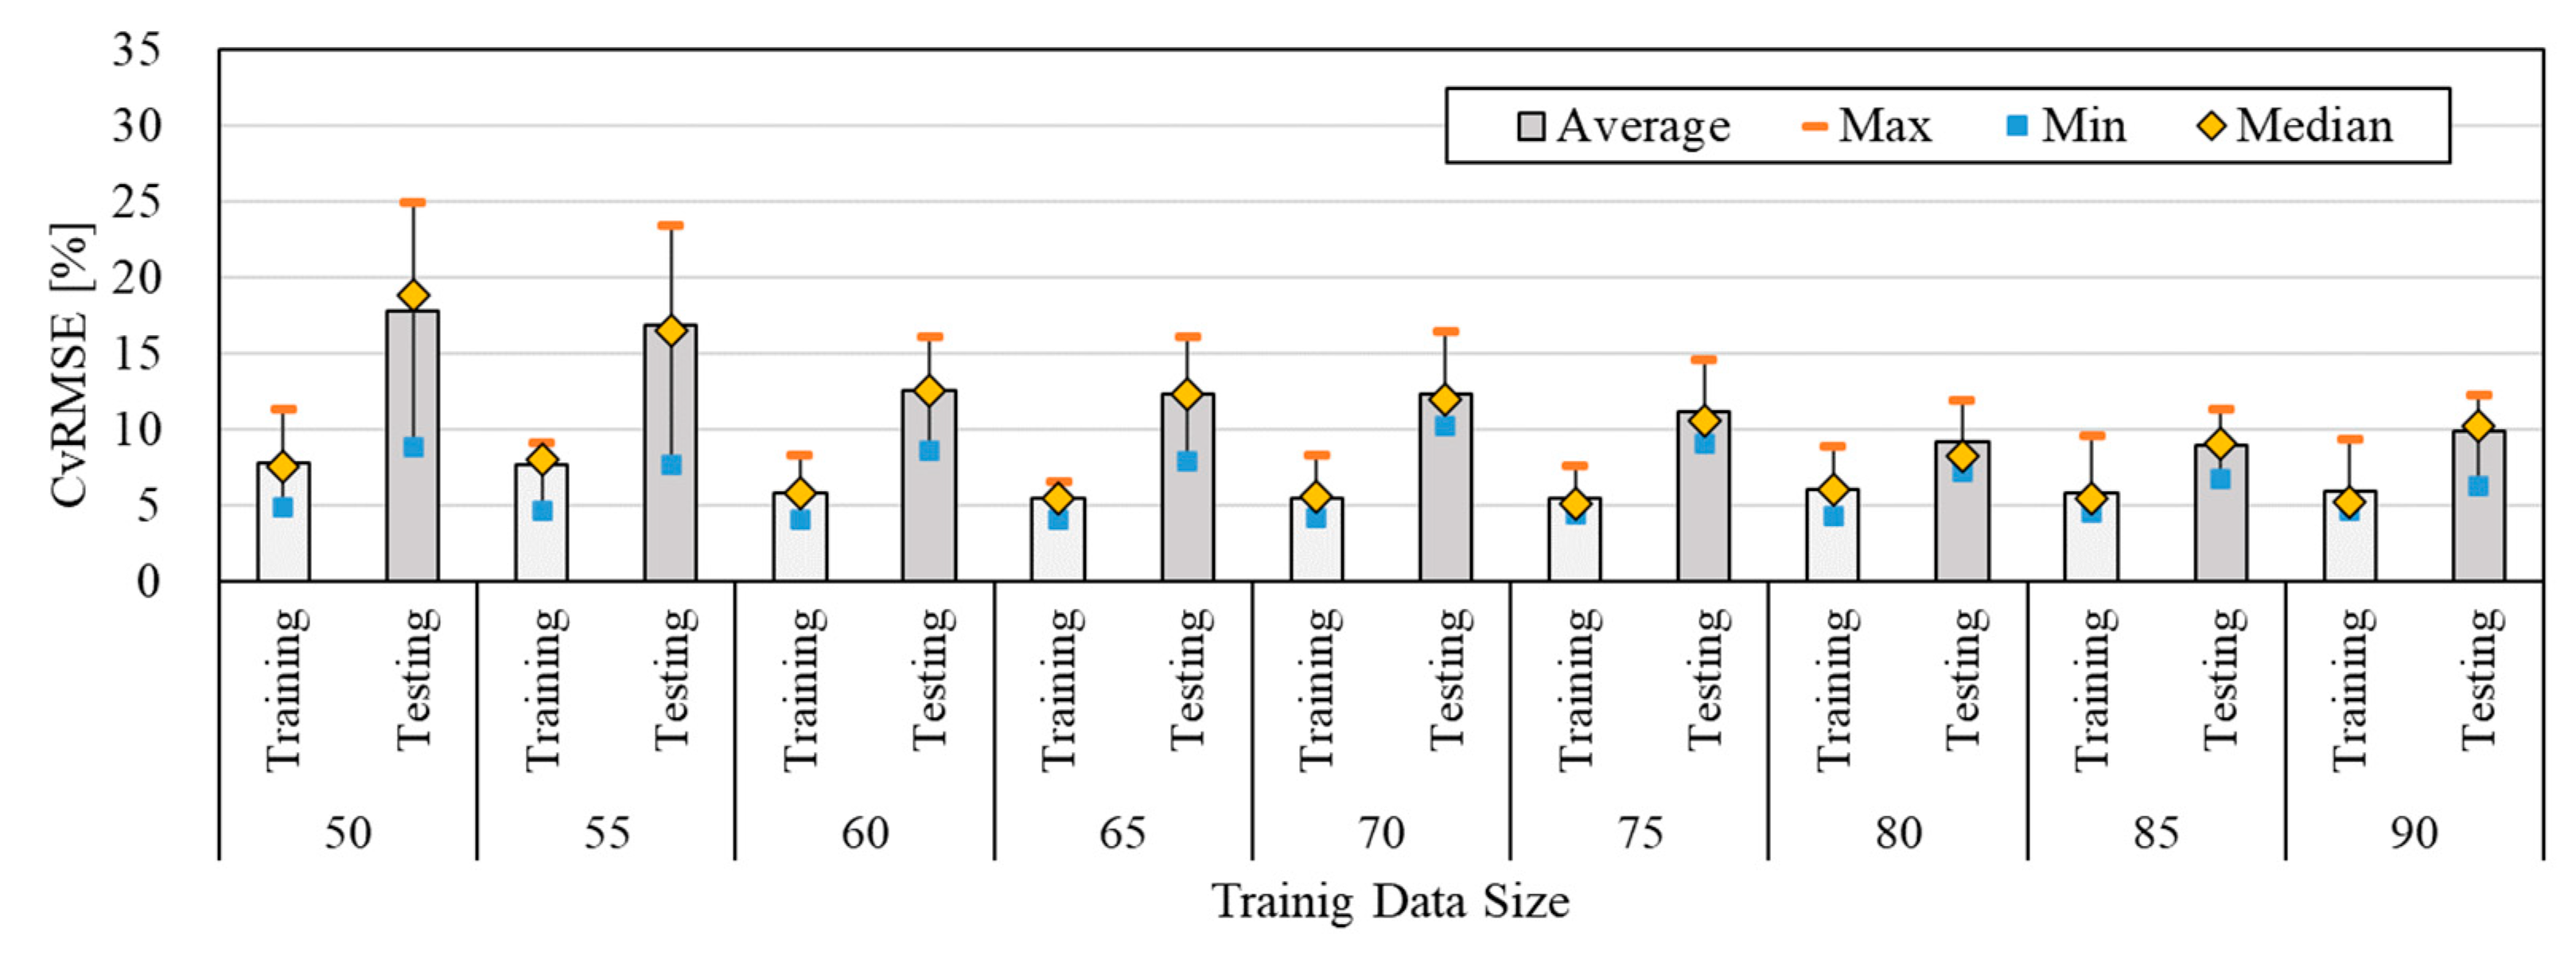
Figure 7.
The predictive performance by changing the data size of training by using the actual data.
Figure 7.
The predictive performance by changing the data size of training by using the actual data.
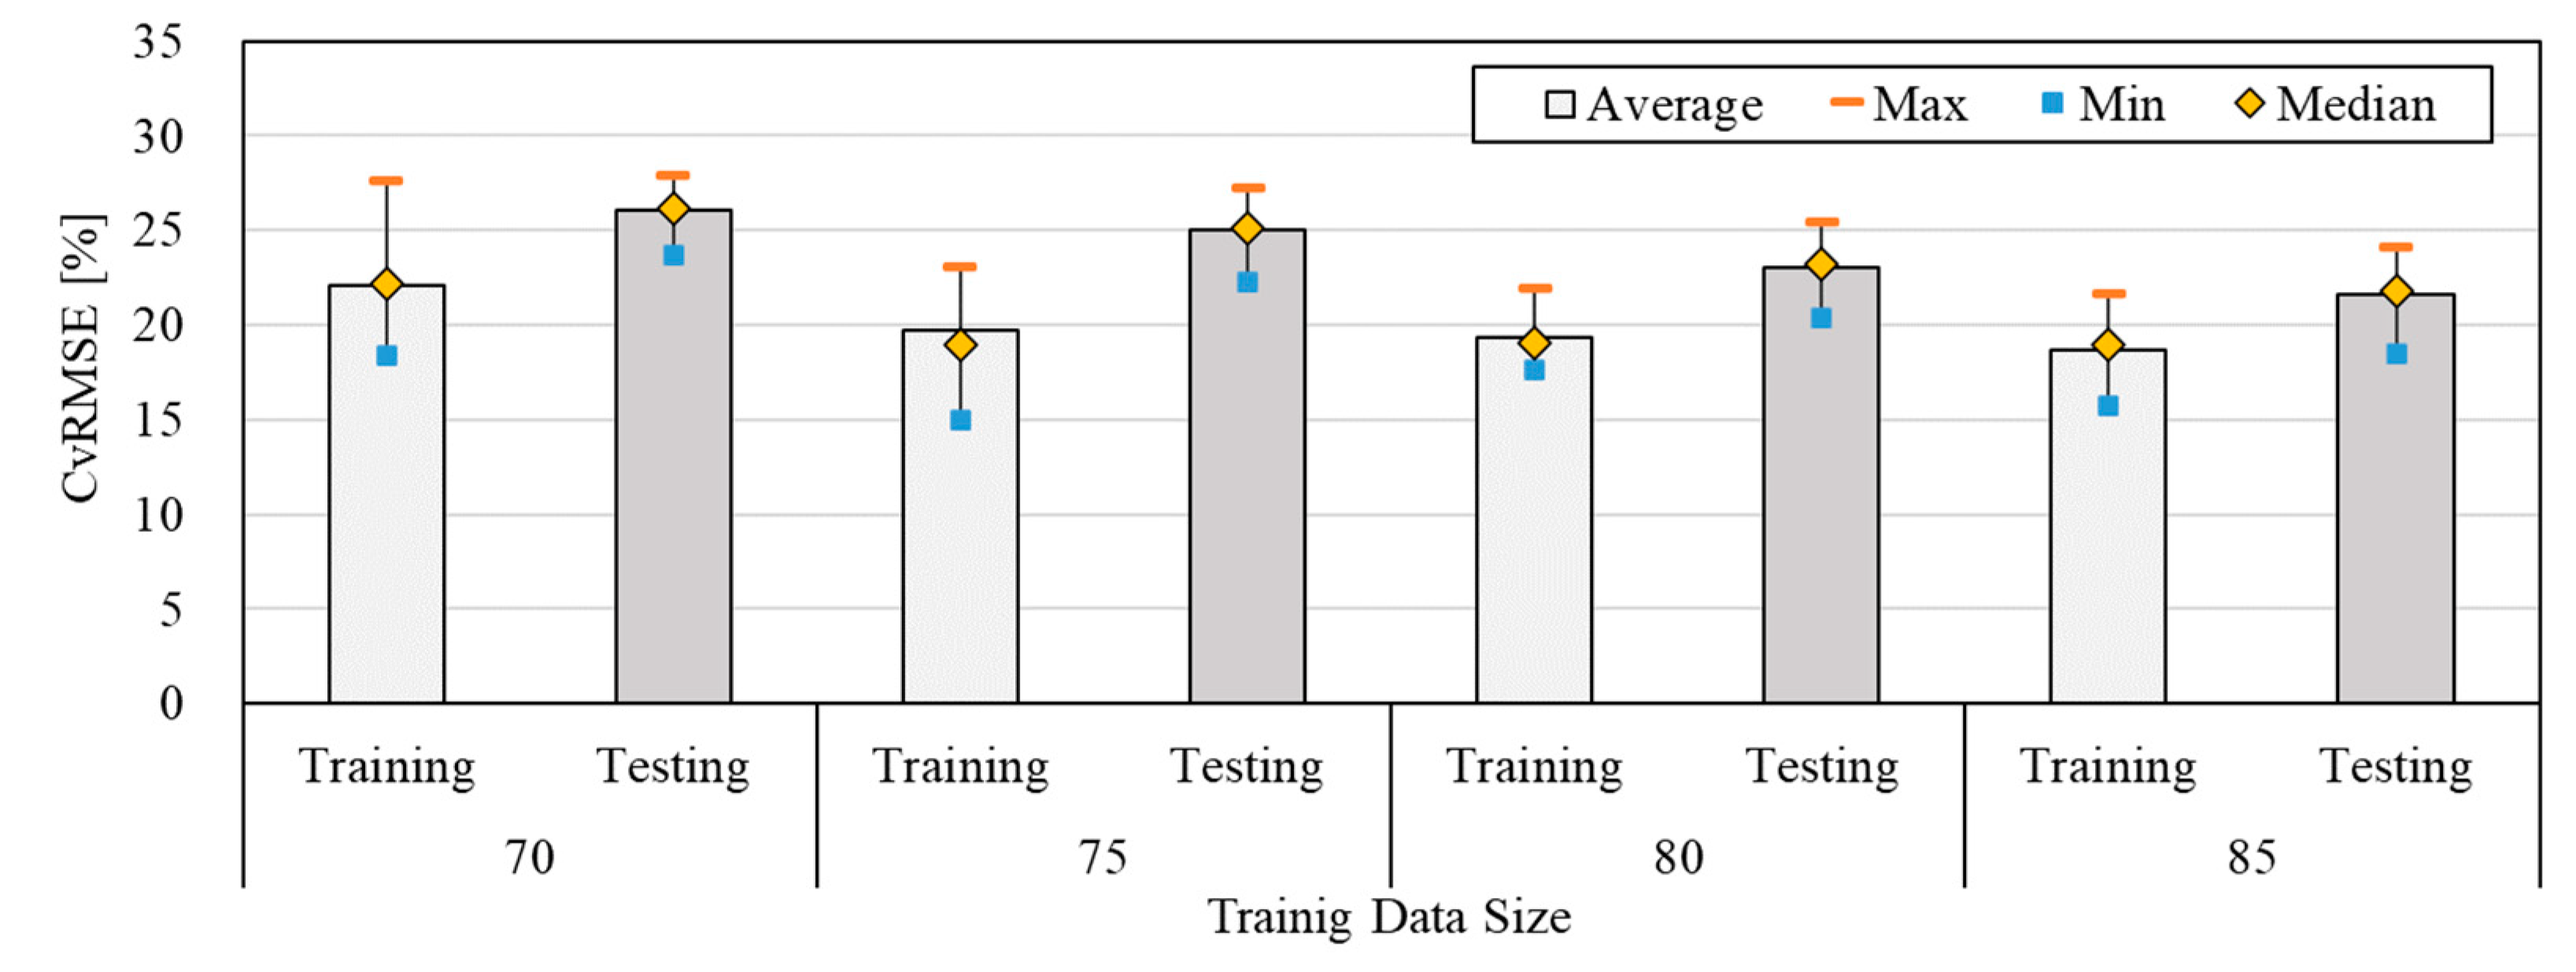
Figure 8.
The energy consumption prediction by using the actual data.
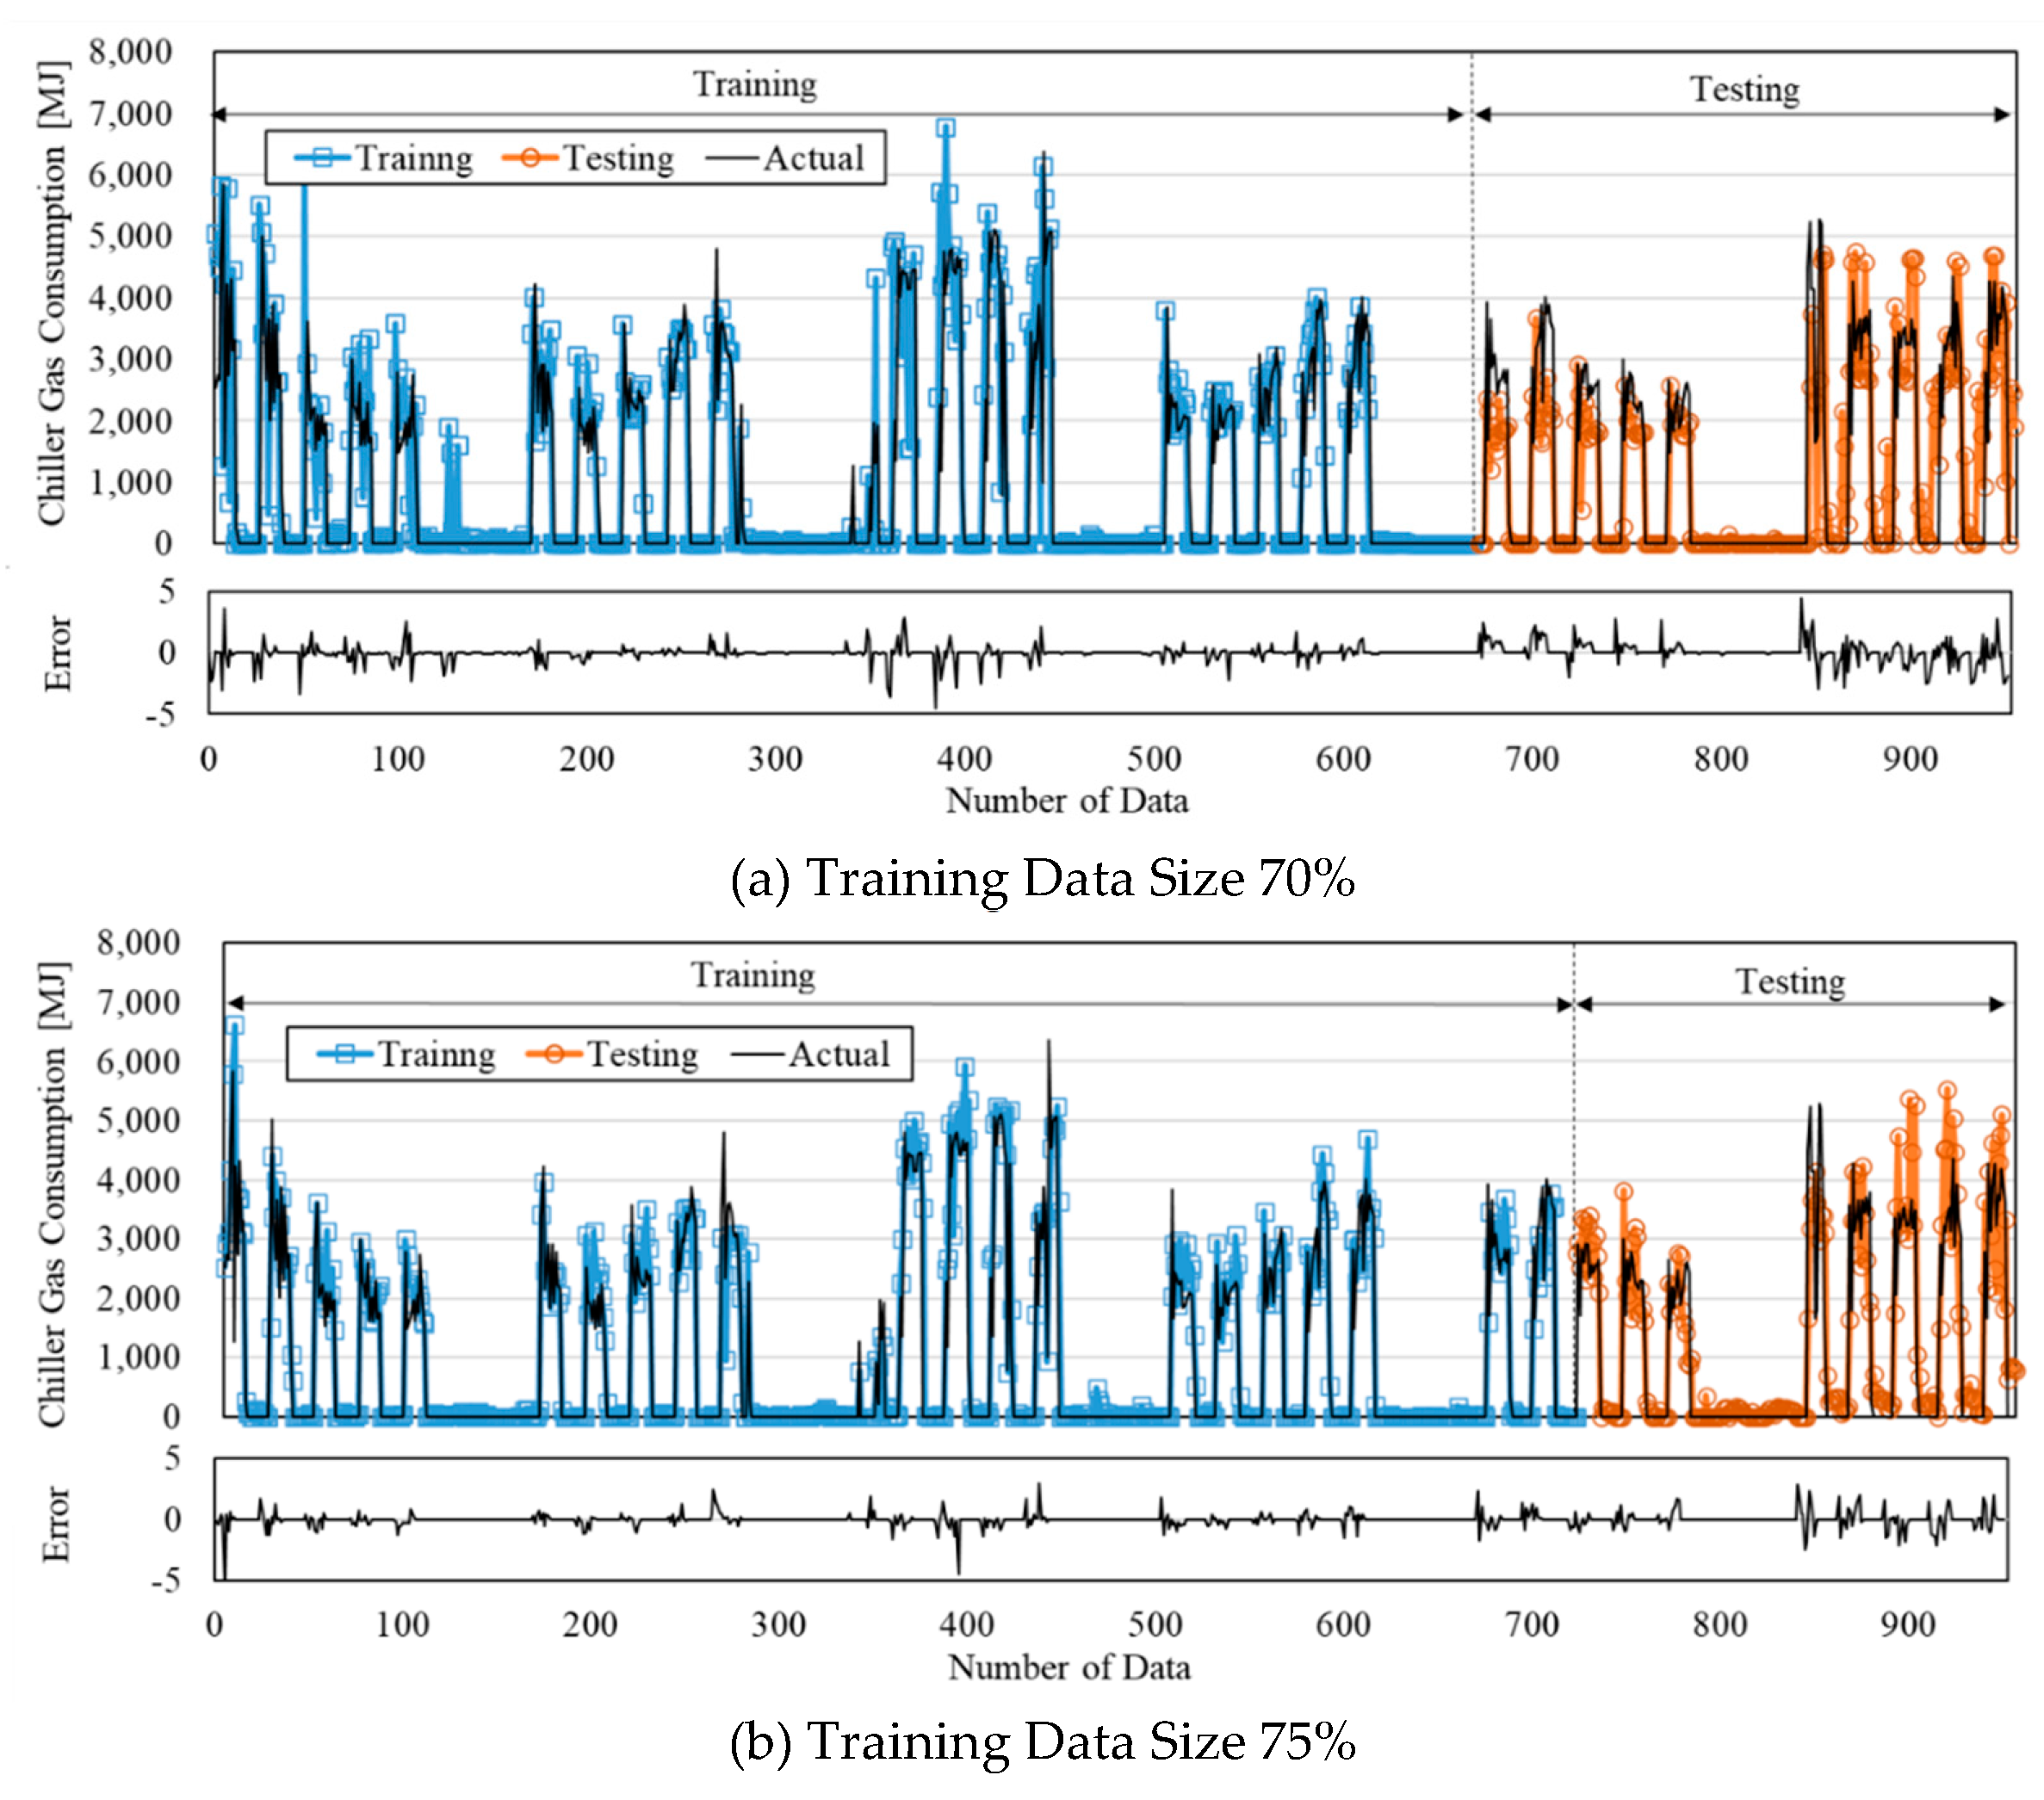
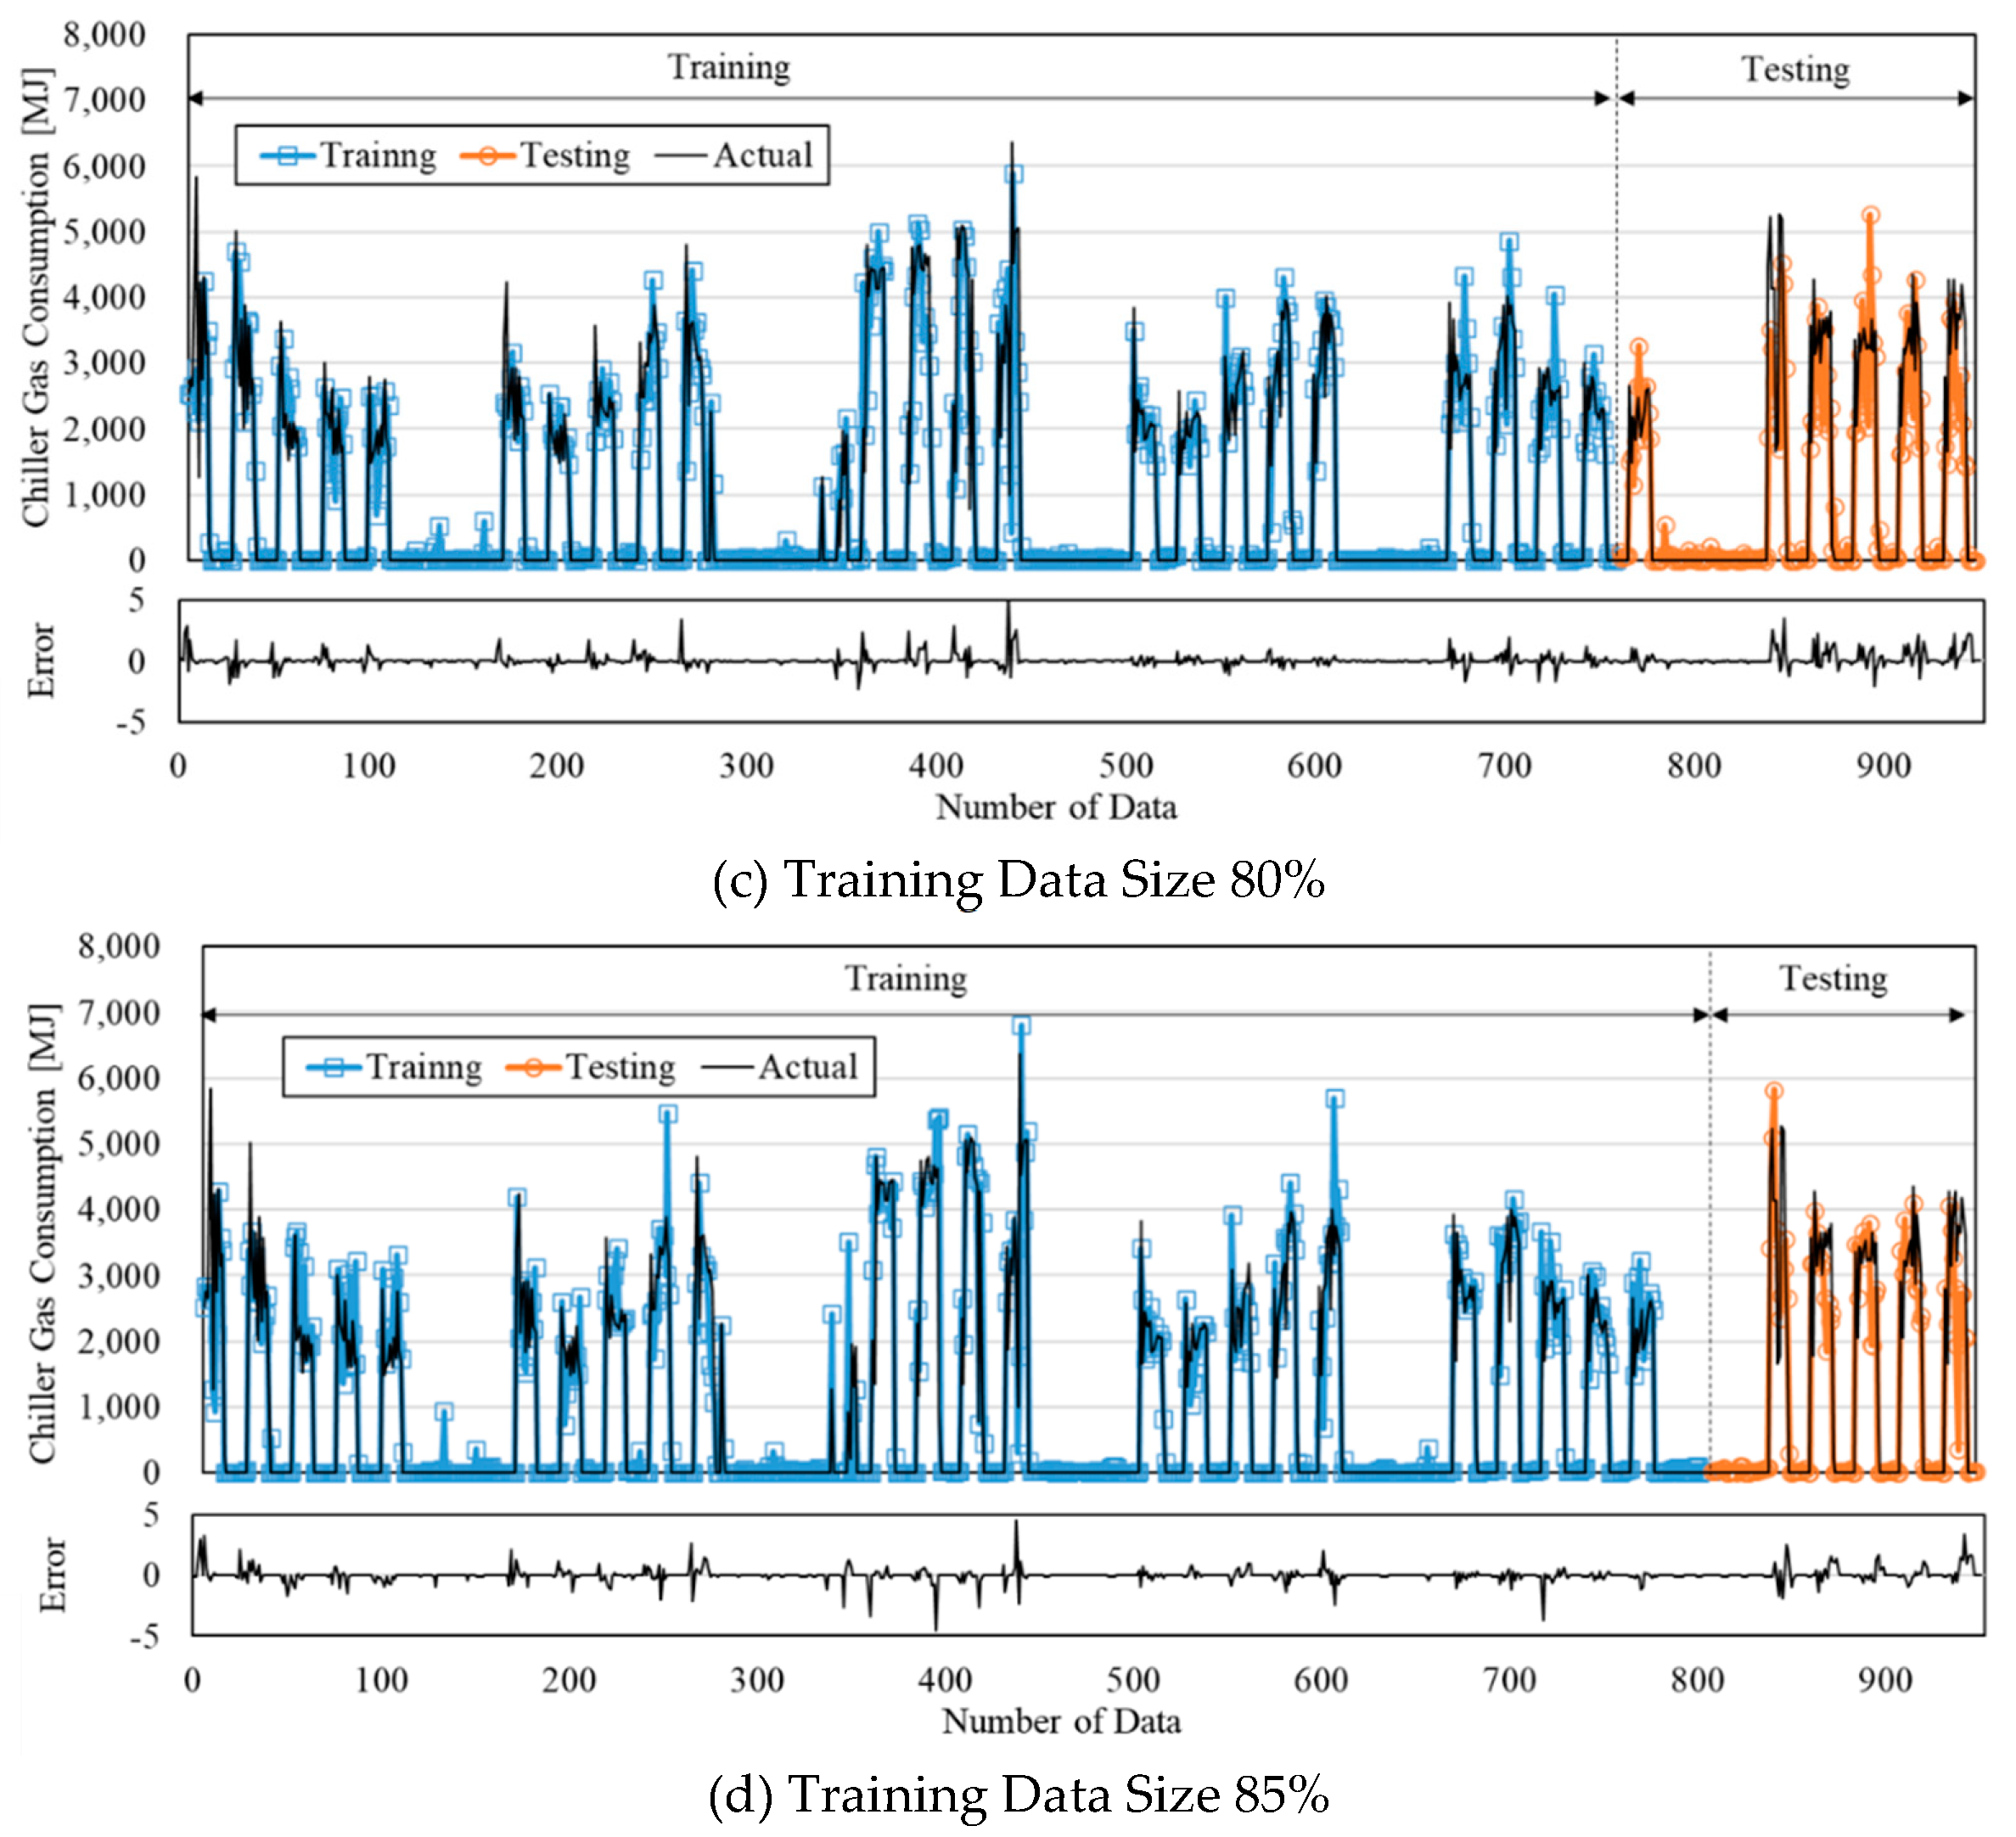
Figure 9.
The energy consumption comparison and error rate by changing the data size of the training.
Figure 9.
The energy consumption comparison and error rate by changing the data size of the training.
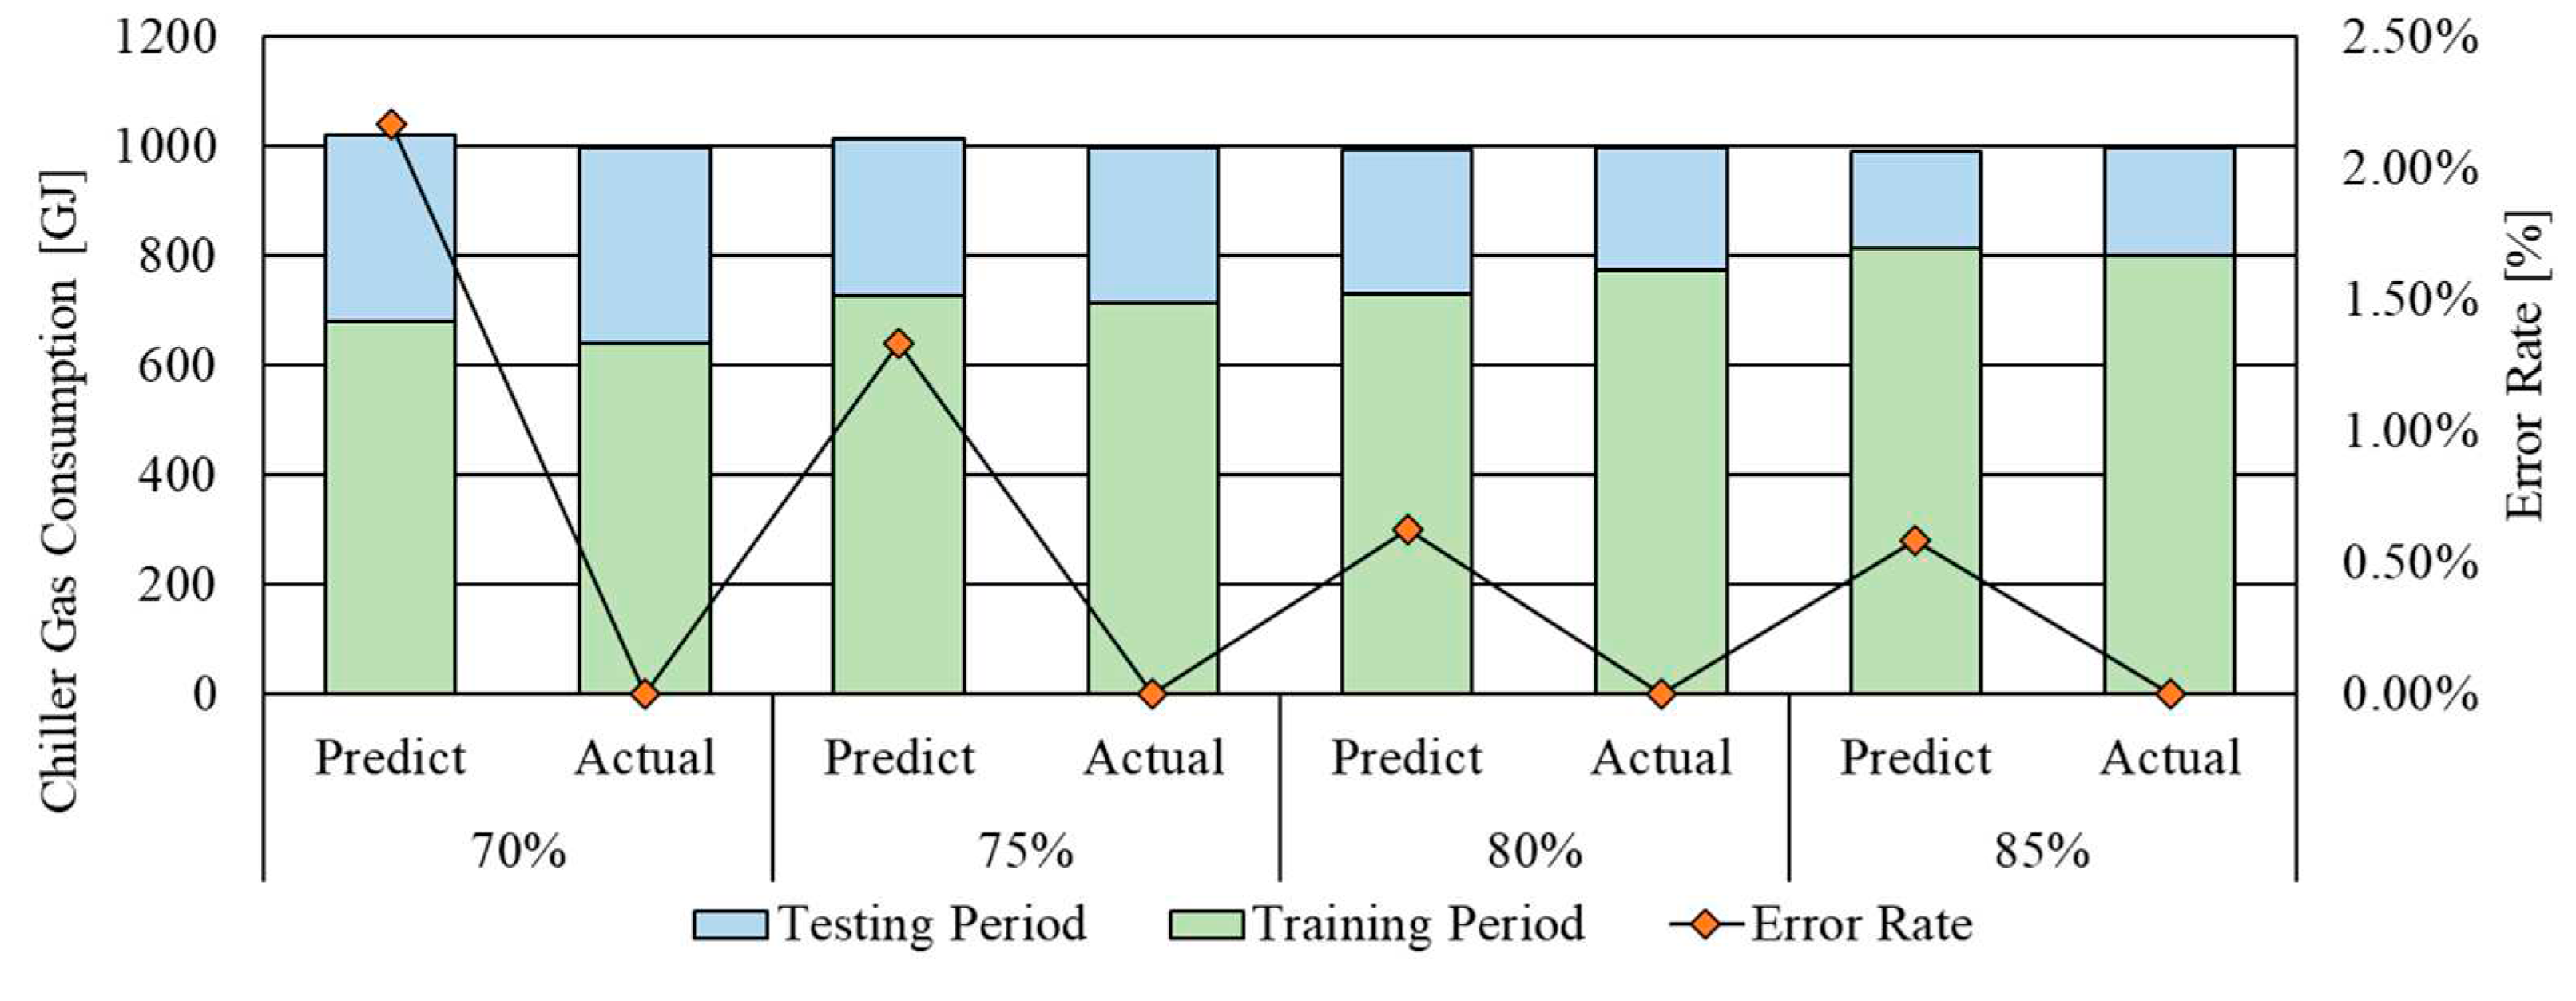

Table 1.
Acceptable calibration tolerances in building energy consumption prediction.
| Calibration Type | Index | ASHRAE Guideline 14 [10] |
FEMP [11] | IP-MVP [12] |
|---|---|---|---|---|
| Monthly | MBE_monthly | ± 5% | ± 5% | ± 20% |
| CvRMSE_monthly | 15% | 15% | - | |
| Hourly | MBE_hourly | ±10% | ±10% | ±5% |
| CvRMSE_hourly | 30% | 30% | 20% |
Table 2.
Simulation conditions.
| Component | Features |
|---|---|
| Site Location | Latitude: 37.27°N, Longitude: 126.99°E |
| Weather Data | TRY Suwon |
| Load convergence tolerance value | delta 0.04W (default) |
| Temperature convergence tolerance value | delta 0.4℃ (default) |
| Heat Balance algorithm | CTF (Conduction Transfer Function) |
| Simulated Hours | 8760 [hour] |
| Timestep | hourly |
| Internal Gain | Lighting 6 [W/㎡] People 20 [㎡/person] Plug and Process 8 [W/㎡] |
| Envelope Summary | Wall 0.36 [W/㎡·K], Roof 0.20 [W/㎡·K] Window 2.40 [W/㎡·K] SHGC 0.497 |
| Operation Schedule | 7:00~18:00 |
Table 3.
Correlation between Input variables and energy consumption.
| Input Variables [x(t)] |
Condenser water temp. (℃) | Supply chilled water flow rate (kg/s) | Outside dry-bulb temp. (℃) | Dew-point temp (℃) | Supply chilled water temp. (℃) | Outside wet-bulb temp. (℃) | Hour |
|---|---|---|---|---|---|---|---|
| Rank | 1 | 2 | 3 | 4 | 5 | 6 | 7 |
| Spearman correlation | 0.72 | 0.65 | 0.54 | 0.44 | -0.38 | 0.31 | 0.25 |
Table 4.
Parameter conditions for the optimization of the ANN model.
| Parameter | Value | |
|---|---|---|
| Fixed | Number of hidden layers | 3 |
| Epochs | 500 | |
| Variable | Number of Inputs | 3~7 |
| Number of neurons | 2~20 | |
| Training Data Size | 50%~90% | |
Table 5.
The predictive performance by changing the number of input variables (Maximum, minimum, average, and standard deviation).
Table 5.
The predictive performance by changing the number of input variables (Maximum, minimum, average, and standard deviation).
| Number of Input | Period | Average | Maximum | Minimum | SD |
|---|---|---|---|---|---|
| 3 | Training | 6.35 | 9.88 | 4.18 | 1.67 |
| Testing | 16.30 | 22.05 | 9.44 | 4.30 | |
| 4 | Training | 5.69 | 9.37 | 4.34 | 1.49 |
| Testing | 14.23 | 17.84 | 9.99 | 2.60 | |
| 5 | Training | 5.77 | 8.21 | 4.03 | 1.40 |
| Testing | 13.25 | 19.35 | 8.56 | 3.49 | |
| 6 | Training | 7.38 | 11.92 | 4.46 | 1.94 |
| Testing | 16.74 | 21.43 | 12.05 | 3.21 | |
| 7 | Training | 8.43 | 11.65 | 6.72 | 1.45 |
| Testing | 24.04 | 28.45 | 17.32 | 3.92 |
Table 6.
The predictive performance by changing the number of neurons (Maximum, minimum, average, and standard deviation).
Table 6.
The predictive performance by changing the number of neurons (Maximum, minimum, average, and standard deviation).
| Number of Neuron | Period | Average | Maximum | Minimum | SD |
|---|---|---|---|---|---|
| 2 | Training | 22.44 | 23.65 | 20.23 | 1.21 |
| Testing | 27.14 | 29.33 | 22.68 | 2.41 | |
| 4 | Training | 12.47 | 18.43 | 6.22 | 3.36 |
| Testing | 19.77 | 25.01 | 12.15 | 3.79 | |
| 6 | Training | 9.70 | 12.66 | 4.83 | 2.59 |
| Testing | 19.45 | 22.40 | 15.36 | 2.22 | |
| 8 | Training | 8.28 | 12.76 | 5.00 | 2.36 |
| Testing | 16.80 | 20.50 | 10.37 | 3.73 | |
| 10 | Training | 5.77 | 8.21 | 4.03 | 1.40 |
| Testing | 12.55 | 16.05 | 8.56 | 2.44 | |
| 12 | Training | 7.70 | 13.95 | 4.58 | 3.10 |
| Testing | 12.66 | 16.14 | 8.20 | 2.84 | |
| 14 | Training | 7.62 | 13.59 | 4.02 | 3.86 |
| Testing | 14.52 | 17.55 | 10.27 | 2.33 | |
| 16 | Training | 6.22 | 9.81 | 3.98 | 1.94 |
| Testing | 14.59 | 16.82 | 12.05 | 1.42 | |
| 18 | Training | 6.22 | 10.64 | 4.01 | 2.39 |
| Testing | 14.66 | 16.50 | 9.28 | 2.27 | |
| 20 | Training | 5.61 | 11.33 | 3.96 | 2.19 |
| Testing | 14.74 | 17.72 | 9.57 | 2.84 |
Table 7.
The predictive performance by changing the data size of training (Maximum, minimum, average, and standard deviation).
Table 7.
The predictive performance by changing the data size of training (Maximum, minimum, average, and standard deviation).
| Training Data Size [%] | Period | Average | Max | Min | SD |
|---|---|---|---|---|---|
| 50 | Training | 7.74 | 11.25 | 4.82 | 1.93 |
| Testing | 17.69 | 24.88 | 8.80 | 5.78 | |
| 55 | Training | 7.60 | 9.08 | 4.63 | 1.38 |
| Testing | 16.77 | 23.43 | 7.59 | 4.70 | |
| 60 | Training | 5.77 | 8.21 | 4.03 | 1.40 |
| Testing | 12.55 | 16.05 | 8.56 | 2.44 | |
| 65 | Training | 5.36 | 6.53 | 3.98 | 0.83 |
| Testing | 12.29 | 16.04 | 7.82 | 2.78 | |
| 70 | Training | 5.45 | 8.24 | 4.11 | 1.33 |
| Testing | 12.26 | 16.42 | 10.23 | 1.88 | |
| 75 | Training | 5.37 | 7.59 | 4.32 | 1.05 |
| Testing | 11.06 | 14.54 | 9.06 | 1.83 | |
| 80 | Training | 6.04 | 8.84 | 4.28 | 1.53 |
| Testing | 9.08 | 11.85 | 7.14 | 1.81 | |
| 85 | Training | 5.76 | 9.58 | 4.48 | 1.45 |
| Testing | 8.93 | 11.23 | 6.69 | 1.45 | |
| 90 | Training | 5.87 | 9.30 | 4.65 | 1.46 |
| Testing | 9.79 | 12.20 | 6.17 | 2.10 |
Table 8.
The predictive performance by changing the data size of training by using the actual data (Maximum, minimum, average, and standard deviation).
Table 8.
The predictive performance by changing the data size of training by using the actual data (Maximum, minimum, average, and standard deviation).
| Training Data Size | Period | Average | Max | Min | SD |
|---|---|---|---|---|---|
| 70 | Training | 22.11 | 27.52 | 18.41 | 2.48 |
| Testing | 26.06 | 27.85 | 23.68 | 1.53 | |
| 75 | Training | 19.73 | 22.96 | 14.95 | 2.64 |
| Testing | 24.87 | 26.91 | 22.27 | 1.62 | |
| 80 | Training | 19.34 | 21.81 | 17.65 | 1.46 |
| Testing | 22.77 | 25.34 | 20.41 | 1.57 | |
| 85 | Training | 18.68 | 21.62 | 15.74 | 1.72 |
| Testing | 19.99 | 22.02 | 17.50 | 1.36 |
Table 9.
The energy consumption comparison and error rate by changing the data size of the training.
Table 9.
The energy consumption comparison and error rate by changing the data size of the training.
| Training Data Size | Period | Predict [GJ] | Actual [GJ] | Error Rate [%] |
|---|---|---|---|---|
| 70% | Training Period | 678.83 | 639.39 | 5.81% |
| Testing Period | 341.46 | 358.83 | 5.09% | |
| Total Period | 1020.29 | 998.22 | 2.16% | |
| 75% | Training Period | 737.33 | 713.21 | 3.27% |
| Testing Period | 279.42 | 285.01 | 2.00% | |
| Total Period | 1016.75 | 998.22 | 1.82% | |
| 80% | Training Period | 754.86 | 772.42 | 2.33% |
| Testing Period | 229.17 | 225.80 | 1.47% | |
| Total Period | 984.03 | 998.22 | 1.44% | |
| 85% | Training Period | 812.06 | 799.14 | 1.59% |
| Testing Period | 197.38 | 199.08 | 0.86% | |
| Total Period | 1009.44 | 998.22 | 1.11% |
Disclaimer/Publisher’s Note: The statements, opinions and data contained in all publications are solely those of the individual author(s) and contributor(s) and not of MDPI and/or the editor(s). MDPI and/or the editor(s) disclaim responsibility for any injury to people or property resulting from any ideas, methods, instructions or products referred to in the content. |
© 2023 by the authors. Licensee MDPI, Basel, Switzerland. This article is an open access article distributed under the terms and conditions of the Creative Commons Attribution (CC BY) license (http://creativecommons.org/licenses/by/4.0/).
Copyright: This open access article is published under a Creative Commons CC BY 4.0 license, which permit the free download, distribution, and reuse, provided that the author and preprint are cited in any reuse.


