
Submitted:
01 September 2023
Posted:
05 September 2023
You are already at the latest version
Abstract
Coproporphyrins I and III (CP-I and CP-III) are established as substrates of hepatic sinusoidal organic anion transporting polypeptides (Oatps), multidrug resistance-associated protein 3 (Mrp3), and canalicular transporter Mrp2. We aimed to evaluate the potential of plasma CP-I and CP-III concentrations to indicate functional changes in hepatic transporters in nonalcoholic stea-tohepatitis (NASH) rodent models using modeling and simulation approach. Mechanistic copro-porphyrins (CP-I and CP-III) models in rats and mice were constructed based on metabolism, transport, and elimination pathways in rodents. To parameterize the rat mechanistic model, we measured CP concentrations in plasma, liver, bile, and urine in healthy control Sprague Dawley rats. The mouse mechanistic model was parameterized using published data. The rat and mouse CP models described the steady-state levels of CP-I and CP-III in plasma, liver, and bile. The model recapitulated the observed high plasma CP-III / CP-1 ratio (9- and 3-fold in rats and mice, respec-tively) and elimination pathways of CP-I (>90% via biliary secretion) and CP-III (equal via bile and urine). Rat CP model was further validated with the published rat fistula model. The simulated increased plasma CP-I concentrations (4-fold), resulted from decreased Oatp activity (0.6-fold) and increased Mrp3 activity (3-fold) were comparable to those observed in bile-duct ligated NASH model. Sensitivity analysis revealed that 90% inhibition of Oatp and Mrp2 leads to a 4-fold and 2.5-fold increase in plasma CP-I levels, respectively. Additionally, we demonstrated the utility of the mechanistic CP models in testing hypothesis and understanding the mechanisms of the ob-served plasma CPs disposition in the Oatp knockout (KO) mice, bile-duct ligation NASH mice, and Mrp2 deficient TR- rats. Collectively, using a mechanistic model, we conclude that CP-I is a robust and predictable marker for assessing change in the activity of Oatps and Mrps in animal models. Our analysis suggests that efflux transporters (Mrp2 and Mrp3) can play an important role in the disposition of CP-I along with Oatp transporters in rodents.
Keywords:
Coproporphyrin
; Oatps
; Mrp
; Endogenous biomarker
; Modeling and Simulation
1. Introduction
Non-alcoholic steatohepatitis (NASH) is an advanced liver disease characterized by high liver triglyceride accumulation (>5% of liver weight) and liver inflammation with or without fibrosis [1-2]. It is well recognized that liver drug transporters and drug metabolism enzymes get altered in NASH, thereby, increasing the susceptibility of these patients for low efficacy and increased toxicity [3]. The United States Food and Drug Administration (FDA) and the European Medicines Evaluation Agency (EMEA) recommended studying the effect of liver diseases on the pharmacokinetics of drugs under development [4]. The focus of the current study is on three hepatic transporters: uptake transporter (Oatp), efflux transporters (Mrp3) present on the sinusoidal side, and Mrp2 present on the canalicular side of the liver. The pharmacokinetics of the drugs which are substrates of Oatp and Mrp2 may get altered in NASH [5]. The common Oatp substrate drugs include statin, sulphonylurea, and methotrexate [6], whereas Mrp2 substrates include chemotherapeutics uricosurics and antibiotics [7]. Since many of these drugs are commonly used by NASH patients, the evaluations of the functional status of these transporters will help in the dosing adjustment of drugs and drug development.
CP-I and CP-III are the two isomers produced during heme biosynthesis and eliminated through hepatobiliary and renal excretion with limited metabolism [8]. CP-I and CP-III are substrates of hepatic drug transporters, specifically Oatp, Mrp2, and Mrp3 [9-11]. They are not substrates of efflux transporters such as multidrug resistance-associated protein 4 (MRP4), bile salt export pump (BSEP), breast cancer resistance protein (BCRP) or P-glycoprotein (P-gp) [12]. The proportion of CP-I to the total coproporphyrin (CP-I/(CP-I + CP-III)) in urine has been used as a diagnostic marker in Rotor syndrome (a rare genetic liver disease in humans deficient with OATP1B1 and OATP1B3) and Dubin-Johnson syndrome (a rare genetic liver disease in humans deficient with MRP2) [13]. Recently, there has been growing interest in evaluating these isomers as biomarkers for OATP1B function in preclinical species and humans in the context of disease pathology or drug-drug interactions [14-18]. A significant increase in plasma CP-I and CP-III was reported in various NASH animal models, that was related to changes in transporter expression and activity in these animal models. Taken together, the corresponding changes indicate that CP-I and CP -III concentrations are associated with liver dysfunction in the NASH state [11].
Assessment of the functional activity of drug transporters using endogenous metabolites offers many advantages such as it does not require exogenous drug/probe compound, and provides direct information regarding the changes in the functional activity of transporters in vivo. However, there are many challenges in the establishment of endogenous metabolites as a biomarker of drug transporters. These metabolites should be the specific substrates of the transporters and the magnitude of changes in the metabolites should be sufficient to be measured and sensitively interpreted in the context of changes in the activity of the transporters. The turnover of the endogenous metabolites should be well characterized, along with their association with age, sex, and disease status [19-20].
Mechanistic modeling is an appropriate approach to address the challenges in understanding the complexity involved in the evaluation of endogenous metabolites as biomarkers. This approach has been impactful in understanding the biomarkers in different spaces, viz; neuroscience, metabolic, oncology, and rheumatoid arthritis, in drug discovery and development [21]. One of the key applications of mechanistic modeling is to identify knowledge gaps and generate and test hypotheses to understand the observed data, which is relevant for evaluating the CP’s potential as a biomarker of transporter activity in NASH animal models and patients.
Previous modeling studies have primarily examined the role of hepatic drug transporters, such as OATP and MRP2, in drug-drug interaction studies using compartmental, physiologically-based pharmacokinetic (PBPK), and population pharmacokinetics modeling approaches. The plasma CP-I profile of subjects was used to compute the in vivo inhibition constant (Ki) for the drug uptake transporter OATP1B inhibition for further PBPK modeling and simulation in several studies [22-25]. Yoshikado et al. [23] computed inhibition constants for OATP1B and MRP2 using a plasma CP-I profile. In the current study, we have additionally included the hepatic sinusoidal drug efflux transporter (Mrp3) and investigated CPs potential to be biomarkers for drug transporters in the NASH disease state, which also play an important role in liver drug disposition.
The aims of the current work were to – 1) develop mechanistic models of CP-I and CP-III in rats and mice; 2) describe the observed CPs disposition data with altered sinusoidal transporters (Oatp and Mrps) activity in rat bile-duct NASH model using the mechanistic model 3; evaluate the roles of hepatic uptake(Oatp), and efflux transporters (Mrp2 and Mrp3) on plasma disposition of CPs in rodents in healthy and NASH state.
2. Materials and Methods
Model description
CPs are auto-oxidation products of coproporphyrinogens, a metabolic intermediate, during heme biosynthesis [26]. CP-I is produced from coproporphyrinogen-I, a metabolic by-product [27], whereas CP-III is produced from coproporphyrinogen-III, a precursor of heme [28]. CP-I and CP-III are considered dead-end by-products with no biological significance [29]. They are primarily produced in the bone marrow and liver [8] and eliminated in bile and urine [30]. The hepatic elimination of CP-I and CP-III occurs via both active and passive transport, with transporter-mediated elimination being the predominant form of transport [31]. They are substrates of hepatic uptake (Oatp) and efflux transporters-Mrp3 and Mrp2 [9-12, 32]. This information is used in the construction of the model shown in Figure 1. The model contains three compartments: plasma, liver, and intestine. The model includes following processes – 1. Synthesis of CP-I and CP-III (in liver and plasma) 2. Hepatic transport of CP-I and CP-III across the sinusoidal membrane and canalicular membrane involving both passive (diffusion-mediated) and active (transporter-mediated) processes. 3. Enterohepatic circulation of CP-I and CP-III from intestine to plasma compartment 4. Fecal excretion of CP-I and CP-III from intestine to feces and 5. Renal elimination of CP-I and CP-III from the plasma compartment to urine via kidney.
Modeling & Simulations
CP-I and CP-III data produced in Sprague-Dawley rats in different compartments, plasma, liver, bile, and urine, were used in the rat CP model parametrization. The biosynthetic rates of CP-I and CP-III in rat and mouse models were calculated using the flux-balance analysis [33]. The mouse CP model was parameterized using the published results [15]. Table 1 includes the key parameters used in the model, and supplementary file 1 contains further details regarding model assumptions and specific methodologies, including all the parameters used in the study. CP data from the rats-fistula and bile-duct ligation models were used to validate the rat CP model [30,36]. The CP models were used to analyze CP data from bile duct ligated (BDL) mice, mice knock out, and TR-rat models [11,15,37].
MATLAB R2018b was used for modeling and simulations. The model's specific details, such as the ordinary differential equations, fluxes, kinetics, and parameters, can be found in File S1.MATLAB scripts are available in File S2. Prism Graph Pad Version 5.02 was used to generate simulation plots.
3. Results
3.1. Steady-State Simulations
Concentrations of CP-I and CP-III were measured in healthy Sprague Dawley rats during the second, fourth, sixth, and eighth weeks following the start of the study. The experimental details of the study can be found in File S3 . Simulations were conducted using the parameter values listed in Table 1 to test if the rat CP model’s steady-state values represent the baseline values observed in healthy rats. The steady-state values for CP-I were 0.6 nM in plasma, 2.8 nM in the liver, and 143 nM in bile, while for CP-III, the values were 5.2 nM in plasma, 16.8 nM in the liver, and 369 nM in bile (Figure 2 (A-F)). The simulated urinary excretion rates for CP-I and CP-III were 0.04 nmol/h/kg and 1.0 nmol/h/kg, respectively (Figure 2A). The simulated biliary secretion rates for CP-I and CP-III were 0.37 nmol/h/kg and 0.87 nmol/h/kg, respectively (Figure 2A). CP-I was predominantly eliminated through bile, while CP-III was eliminated equally through bile and urine (Figure 2A–B). The simulated CP concentrations in different compartments and urinary and biliary secretion flux values fell within the experimentally measured range. However, the experimental CP-III values in different compartments were more variable than the CP-I values..
We simulated the mouse CP model with the parameters given in Table 1 to obtain the steady-state values and compare them to the published findings in Table 2. The simulated steady-state concentrations of CP-I in plasma, liver, and bile were 0.14 nM (vs. observed 0.14 ± 0.02 nM), 0.6 nM, and 32 nM, respectively. Similarly, the simulated steady-state concentrations of CP-III in these compartments were 0.56 nM (Vs. observed 0.56 ± 0.1 nM), 1.57 nM, and 43 nM, respectively. The simulated secretion rates of CP-I in urine and bile were 0.012 nmol/h/kg (vs. the observed 0.0123 ± 0.001 nmol/h/kg) and 0.1 nmol/h/kg, respectively. On the other hand, the simulated secretion rates of CP-III in urine and bile were 0.03 nmol/h/kg (vs. observed 0.034±0.006 nmol/h/kg) and 0.35 nmol/h/kg, respectively. The simulated biliary secretion ratio of CP-III and CP-I is 3.5, similar to the reported ratio in mice's feces [35].
The steady-state model values recapitulate the plasma concentration and urinary secretion rate of CP-I and CP-III in rats and mice.
3.2. Infusion Experiments in Rats
After showing that the model captures homeostasis values observed in healthy rats, we validated the model with the infusion experiments in rats to characterize the liver's transport process for CP-I and CP-III [31]. We simulated the rat CP model for CP-I and CP-III biliary secretions with an intravenous infusion with different amounts of these two isomers. Table 3 shows the simulated results of the CP-I and CP-III (CP-I/CP-III) biliary secretion ratio and the observed values in the experiment [31]. When the infusion mixture contained equal amounts (60 µg/h) of CP-I and CP-III, the simulated ratio of biliary secretion of CP-I and CP-III (CP-I/CP-III) was 2.5, while the observed mean ratio was 2. The higher simulated ratio for CP-I suggests that the liver prefers CP-I secretion more than CP-III in bile. Additionally, the simulated ratio changed when the amount of CP-I in the infusion mixture was varied. When the CP-I amount was halved, the simulated ratio decreased to 1.5, matching a mean ratio of 1 observed in the experiment. Conversely, when the CP-I amount was doubled, the simulated ratio increased to 4.6, which closely corresponds to the observed mean ratio of 4.2 (Table 3). These results indicate that the model accurately captures the liver's preference for CP-I secretion over CP-III in bile, as evidenced by the agreement between simulated and observed biliary secretion ratios under different infusion conditions.
Next, we simulated the effect of inhibition of the hepatic elimination on the biliary and urinary secretion of CP-I and CP-III. Moriondo et al.[36] used a bile fistula rat model to measure the effect of phenoldibromopthalein sulfonate (BSP), an inhibitor of Oatp and Mrp2 [38-39], on CPs excretion in bile and urine under equimolar infusions of CP isomers. We simulated the rat CP model with 4 hours equimolar CP infusion (50 µg/h) followed by concomitant 3 hour bromosulphophthalein (BSP) intravenous infusion as conducted in the study. The inhibitory effect of BSP on Oatp and Mrp2 was implemented as an exponential function of time. Figure 4 (A-C) compares the simulation and the experimental results. CP-I biliary secretion increases significantly upon the start of CP infusion and then decreases when BSP is introduced at the 4-hour mark (Figure 4A) Similarly, Figure 4B shows that CP-III biliary secretion also increases until 4 hours and subsequently declines. This observation aligns with the experimental results. Furthermore, the simulation indicates that CP-I biliary secretion remains higher than CP-III, which is consistent with the experimental findings. Additionally, the simulation reveals that as liver excretion of CPs decreases due to liver transportes inhibition due to BSP infusion, both CP-I and CP-III levels in urine increase (Figure 4C). Overall, the simulation successfully reproduces the dynamics of CPs in plasma following a decrease in hepatic elimination of CPs, as observed in the experimental study.
3.3. CP-I and CP-III Disposition, and Liver Transporters Changes in Bile Duct Ligated (BDL) Rats
After validating the model in healthy rats, we used the rat CP model to simulate the rat BDL study [11] by decreasing the canalicular elimination of both isomers. The study aimed to evaluate the biomarker potential of CP-I and CP-III for Oatp and Mrp3 in NASH.
Figure 5 (A–D) shows that the plasma and liver CP-I levels increased during BDL compared to the control. The increase was around 3.6-fold (vs. observed 3.3 ± 0.6 - fold) on day 1 and 4-fold (vs. observed 4.3±03 fold) on day 14 in the plasma and approximately 2-fold on day 3 (vs. observed 2.42±1.6-fold) and 14 (vs. observed 1.4±0.6 –fold) in the liver. The simulation of CP-I in both plasma and liver matched well with the observed data.
CP-III levels increased significantly in the plasma and liver during BDL. The increase was approximately 10-fold on day 1 and 7-fold on day 14 in the plasma and about 3-fold on day 2 and 2-fold on day 14 in the liver. However, the model could only adequately describe the CP-III profile in plasma and liver once it considered a decrease in the renal secretion of CP-III (Figure 5 C-D).
In a rat BDL study [11], protein expression of different isoforms of Oatp was reported. There was a significant decrease in Oatp1a1 (3.72 ±1.14 fmol/mg in control vs. 1.09 ± 0.36 fmol/mg in BDL rats), Oatp1a6 (1.52 ± 0.45 fmol/mg in control vs. 0.62 +/- 0.15 fmol/mg in BDL rats), Oatp1a4 (3.72 ± 1.14 fmol/mg in control vs. 1.09 ± 0.36 fmol/mg in BDL rats), but no change in expression was observed for Oatp1b2, on the 14th day in BDL rats. The simulation results indicate that Oatp activity decreased by 40% on the 14th day in the BDL rat (Figure 6), which falls within the range of the measured activity for different Oatp isoforms, considering Oatp1b2 being the major transporter for CPs [37]. The model simulated Mrp3 activity increased 3.2-fold (Figure 6) on the 14th day during bile duct ligation, comparable to the increased protein expression (5.77 ± 0.73-fold observed on the fifth day in an earlier rat BDL study [40].
3.4. Sensitivity Analysis
NASH can significantly impact the activity of Oatp, Mrp2, and Mrp3, thereby affecting the disposition of plasma CPs. To gain insight into the roles of these transporters on plasma CP-I, steady-state continuation analysis was done using the rat CP model. In this analysis, all the model parameters were kept constant except for the transporters activity. Figure 7 displays the result of the sensitivity analysis and demonstrates the effect of changes in the activity of Oatp, Mrp3, and Mrp2 activity on plasma CP-I. The analysis shows reduction in the activity of Oatp or Mrp2 increases plasma CP-I levels. A 90% decrease in Oatp activity leads to a 4-fold increase in plasma CP-I, while a 90% decrease in Mrp2 activity results in a 2.5-fold increase. In contrast, a 10-fold increase in Mrp3 activity causes a 3.8-fold increase in plasma CP-I. However, when Mrp3 activity is increased by the same amount (10-fold) in conjunction with a 90% decrease in Oatp and Mrp2 activity, the increase in plasma CP-I rises from 7-fold to 9.5-fold. This suggests that the sensitivity of Mrp3 decreases under reduced Oatp and Mrp2 activity. The analysis also highlights that Oatp is more sensitive compared to Mrp2 for regulating plasma concentration of CPs, as a 90% decrease in Oatp activity leads to a greater increase in plasma CP-I compared to a 90% decrease in Mrp2 activity. Overall, understanding the dependence of plasma CP-I on the combined changes in these three transporters (Oatp, Mrp3, and Mrp2) can aid in the interpretation of plasma CP-I levels concerning alterations in drug transporter activity.
3.4. Application of Models
3.4.1. Large Increase of Plasma CP-I and III Levels in BDL Mice
A 40-fold increase in plasma CP-I and a 60-fold increase in plasma CP-III on the tenth day during BDL in mice were reported [11]. A 200-fold on the third day and 67-fold on the seventh day in plasma CP-I was measured during BDL in mice (unpublished data). Such a high increase poses a question regarding the underlying mechanisms. To understand the mechanism behind these high increases, we proposed a hypothesis that a transient decrease in renal secretion in BDL mice might contribute to the observed elevations in CP-I and CP-III. Simulations were done by a reduction in the renal secretion of CP-I and CP-III and by reducing the canalicular transport of CPs to zero. The simulated profile of plasma CP-I (180-fold increase on the 3rd day and 35-fold increase on the 10th day, figure 8 A) and CP-III (100-fold increase on the 3rd day and 60-fold increase on the 10th day, figure 8 C) explains the observed fold increases of plasma CPs in BDL mice. Figure 8B and Figure 8D show the simulated renal secretion of CP-I and CP-III, respectively. The tubular necrosis on the fourth day following the bile-duct ligation in rats supports the hypothesis of a transient reduction in renal secretion of CPs [41].
3.4.2. CP-I and CP-III in Oatp Knock-out (KO) Mice
Shen et al. [15] measured CP-I and CP-III in Oatp KO mice to assess the CPs as potential markers for Oatp activity. To evaluate the impact of Oatp KO on plasma CP-I and III, we simulated the mouse CP model by reducing the Oatp activity to zero. Table 4 presents the comparison between simulated and observed values. The simulated plasma CP-I concentration (1.0 nM), and CP-I urinary secretion (0.08 nmol/h/kg) closely resembled the observed values (0.98 + 0.03 nM for plasma CP-I and 0.15+0.05 nmol/h/kg for CP-I urinary secretion). However, the simulated values for CP-III in plasma (5.3 nM) and urinary secretion (0.25 nmol/h/kg) were approximately 1.6 times lower than the observed values (8.76±0.92 nM for plasma CP-III and 0.61±0.17 nmol/h/kg for CP-III urinary secretion). We performed simulation with increased liver synthesis of CP-III to identify plausible mechanism. Our simulations revealed that a 7-fold increase in liver CP-III synthesis could account for the observed increase in plasma CP-III (simulation B, as shown in table 3). Therefore the mechanistic model helped identify gaps in the understanding of the experimental data but also provided a plausible mechanism to explain the observed results.
3.4.3. Increase in CP-I and CP-III Concentrations in TR- Rats
We used the rat CP model to investigate the possible mechanisms of increased CP-I and CP-III in the plasma and liver of Mrp2 deficient TR- rats [37]. The study found an increase in serum CP-I (~30-fold compared to control), serum CP-III (~ 8-fold compared to control), liver CP-I (0.15 nmol/mg in TR- vs. BLQ (below the limit of quantification) in control), and liver CP-III (0.10 nmol/mg in TR- vs. BLQ in control). The biliary excretion rate of CP-I was reduced by 40% (0.0051 ± 0.0018 and 0.0029 ± 0.0006 nmol/min control vs. TR- rats), and the biliary excretion rate of CP-III was reduced by > 99% (0.0051 ± 0.0018 and 0.0029 ± 0.0006 nmol/min control vs. TR- rats). The urine concentration of CP-I was ~ 30-fold higher than control rats, identical to the increase in plasma concentration. However, the urine concentration of CP-III in TR- rats was only ~ 2-fold higher, whereas the plasma concentration was ~ 8-fold higher compared to control rats. The lower increase in urine CP-III concentration suggests other mechanisms may be involved, such as a decrease in renal elimination for CP-III in TR-rats. Protein expression showed no differences in Oatps but a significant increase in Mrp3 in TR-rats compared to control rats. Mrp2 protein levels were not detected, as expected, in TR- rats.
Based on the above findings, we performed simulations using three mechanisms: (1) no change in Oatp activity, (2) a 10-fold increase in Mrp3 activity, and (3) reduced Mrp2 activity (set to zero). Figure 9A shows the simulation results for plasma CP-I and liver CP-I, showing only a ~ 7.6-fold increase in plasma CP-I (compared to the observed ~ 30-fold increase) and a 1.5-fold increase in liver CP-I. Figure 10 C shows the biliary clearance of CP-I was decreased by 84% (compared to the observed 40% decrease). However, the increase in plasma CP-III (simulated 6.6-fold increase vs. observed 8-fold increase) and decrease in CP-III biliary clearance (simulated 95% reduction vs. observed >99% reduction) is comparable to the observed CP-III disposition in TR- rats (Figure 10 B and C). We then hypothesized if increased hepatic synthesis of CPs could explain the observed data. We performed simulations (Simulation B) by including the increased CP hepatic synthesis with the three inputs used in earlier simulations (Simulation A) . A 15-fold increase in hepatic CP-I synthesis and a 1.8-fold increase in hepatic CP-III synthesis account for the increased plasma CP-I (~30-fold increase) and decrease in biliary clearance (40% reduction) (Figure 9 A and C). Although the simulated CP-III biliary clearance is slightly higher (simulated 94% reduction vs. observed >99% reduction) than the observed decrease, simulation B accounts for the differential reduction in the biliary concentration of CP-I and CP-III. In summary, the simulations found that the increased plasma, liver concentrations, and reduction of biliary clearance of CP-I and CP-III in TR- rats could be explained by altered Mrp3, decrease in CP-III renal elimination, and increased hepatic synthesis of CPs.
4. Discussion
In the current work, we extended our earlier work where we evaluated if CP-I and CP-III, endogenous substrates of the OATP-MRP axis, are a suitable tool to detect the changes of the transporter activities in the NASH animal models and patients [11]. The objective of the current study was to gain a quantitative and mechanistic understanding of the altered disposition of CP-I and CP-III, and its relation to changes in transporter activity during NASH. To achieve this, we developed mechanistic models for rats and mice. This modeling work is the first of its kind to investigate the role of transporters in the disposition of CP-I and CP-III in preclinical disease animal models. We successfully recapitulated the disposition of CP-I and CP-III in plasma and liver in healthy control rats and mice. In addition, we dissected the underlying mechanisms of the changes in CP disposition, various mouse and rat NASH models.
Model validation of a mechanistic model is different from pharmacometrics and PK/PD models where the emphasis is on established methods such as goodness-for-fit and visual predictive check plots [42]. A mechanistic model should ideally be validated using different experimental data to evaluate if the model represents normal physiology [37]. To this end, simulations were performed for infusion experiments in rats administered with the same and different proportions of CP’s (Table 2) and concomitant infusion of BSP, a transporter inhibitor, to understand the role of liver transporters on CP-I and CP-III disposition (Figure 4). The model successfully reproduced the observed CP’s disposition in bile and urine. These validation experiments show that the model captures the essential physiology of CPs in the rat and support its ability to accurately represent the disposition of CPs in the context of liver transporters.
Additionally, the steady-state simulation of CP models successfully captures the observed plasma concentrations and hepatic and renal elimination of CP-I and CP-III in rats and mice. Notably, the plasma concentrations of CP-III are higher than CP-I in both species, with a 9-fold difference in rats and a 3-fold difference in mice. However, in monkeys and humans, the plasma concentrations of CP-III are lower than CP-I [44-45]. The relative ratio of CP-III to CP-I in plasma suggests a species-specific difference in the disposition of CPs between rodents and primates. Nevertheless, it is worth noting that in monkeys and humans, CP-I is primarily eliminated via liver elimination (>85% of total CP elimination), similar to what was observed in the present study with rats [22]. In cynomolgus monkeys, the reported biliary and urinary elimination rates of CP-III were 0.7 nmol/h and 1.19 nmol/h, respectively [22.44]. In rats, the corresponding rates were 0.87 nmol/h/kg and 1.0 nmol/h/kg in the present study. These data indicate that both species excrete a similar proportion of CP-III through the liver, with 38% in monkeys and 46% in rats. The similarity in hepatic elimination of CP-I and CP-III between rodents and monkeys suggests that the mechanistic model developed in current study, based on rodents, is relevant for understanding CP disposition in monkeys and potentially humans as well.
Moreover, rodent BDL model is a useful NASH model in studying different features observed in NASH patients such as fibrosis, portal inflammation, and hepatic encephalopathy [45-46]. Similar changes in sinusoidal transporter activities have been reported in the BDL model compared to the NASH model reflecting the compensatory changes due to blockage in the canalicular transport [41-42]. In addition, the reported reduction in Mrp2 activity, the key canalicular transporter for CP-I and CP-III, in different NASH animal models and NASH patients makes the BDL model more relevant from CPs disposition standpoint [49]. CPs were also found to be significantly increased in obstructive cholestasis in humans emphasizing the importance of monitoring their profile in the BDL model [50]. Model results showed a reasonably good match of dynamics of observed CP-I in plasma and liver compartments and liver transporter activity of Oatp and Mrp3. However, model explained the CP-III profile in plasma and liver by hypothesizing the decrease in its renal secretion indicating the involvement of renal transport function in BDL rat.
Furthermore, the current mechanistic models allow us to obtain mechanistic understanding on the role of Oatp, Mrp2, and Mrp3 on the plasma disposition of CP-I and CP-III. These transporters show altered activity in NASH patients and pre-clinical NASH model [47.51]. The protein expression of Oatp has been reported to decrease in rodent cholestasis (BDL), partial cholestasis (ethinyl estradiol rat), and diet-induced NASH models [11, 52-53] Although the protein expression of Mrp3 is up-regulated in this cholestasis and NASH rodent model [54-55], the functional activity of Mrp2 is also likely to be decreased due to its mislocalization from canalicular membrane, as reported both in the human NASH and MCD (methionine choline diet) -induced rodent NASH model [56-57]. Interestingly, CP-I and CP-III were found to be significantly increased both in the MP (methapyrilene)-induced rat NASH model and in the choline-deficient high-fat diet (CAHFD) induced mice NASH model [11]. The observed increase in CPs in the NASH models may be the result of the combined effect of these transporters and a mechanistic model is the appropriate tool to address the role of these transporters on plasma CPs level. Figure 6 analysis provides various possibilities of changes in the activity of these transporters on plasma CP-I and helps in interpreting the increased CP-I in terms of changes in the activity of Oatp, Mrp2 and Mrp3. Additional experimental and computational approaches are required to interpret the physiological relevance of the changes in the transporter’s activity based on plasma CP-I disposition.
The mouse CP model revealed a discrepancy between an increase in CP-III and a loss of Oatp activity in Oatp knockout mice. Similarly, the rat CP model identified a discrepancy between observed plasma CP-I and CP-III in Mrp2-deficient TR- rats based on transporter activity changes. Since Oatp and Mrp2 are essential transporters involved in the elimination of xenobiotic and other endogenous compounds such as bilirubin, it is not surprising that the inactivation of these transporters alters the hepatic elimination pathways. Consequently, the significant increase in plasma CP-I and CP-III may also be indicative of a change in hepatic heme synthesis and metabolism. In Oatp1a/1b gene cluster knockout (KO) rodents (Oatp1a/1b2/2), neither Mrp2 nor Mrp3 expression was altered. However, plasma bilirubin (both conjugated and unconjugated) and plasma bile acids were significantly elevated in Oatp1a/1b knockout mice compared to wild-type mice [58]. Interestingly, in unconjugated hyperbilirubinemia caused by Gilbert's syndrome, which is characterized by a decrease in hepatic UGT1A1 enzyme activity, changes in heme biosynthesis were reported [59-60]. Specifically, the activity of protoporphyrinogen oxidase, an enzyme involved in heme biosynthesis, was reduced, while delta-aminolevulinic acid (ALA) synthase, a rate-limiting enzyme of heme biosynthesis, was up-regulated [60]. These changes have direct implications for CP-III biosynthesis [27]. Therefore, the model-derived insights into the increased hepatic biosynthesis of CP-I and CP-III in the Oatp KO mice and TR- rats genetic models suggest that further investigation into heme metabolism alterations is necessary to better understand the underlying mechanisms. This study could provide insights on the relationship between transporter deficiencies, heme metabolism, and changes in CPs plasma disposition.
The mechanistic model can be used to test or generate hypotheses to aid in understanding the underlying mechanism of the observed data. The current mice model provided a mechanistic understanding of high CP-I (mean 200-fold on 3rd day and mean 40-fold on 10th day) and CP-III (mean 98-fold on 3rd and 32-fold on 10th day) increase in the bile duct ligated mice. A similar increase in total bilirubin (mean 134-fold on 3rd day and mean 140-fold on 7th day) and total bile acids (mean 114-fold on 3rd day and mean 77-fold on 7th day) were reported [61] in common bile duct ligated mice, indicating a positive correlation with CPs profile in liver disease. Simulation prediction can be verified by measuring CPs in the urine of the BDL mice model. Furthermore, CPs should be measured with bilirubin and bile acids in other NASH models to evaluate their biomarker potential for transporters activity compared to bilirubin and bile acid.
The present models do not consider the role of renal transporters in the transport of CPs and the role of key enzymes in the biosynthesis of CPs. Significant changes in renal Oatp, Mrp2, and Mrp3 were observed in the rat model of NASH although no studies have been published examining human NASH-related alteration of renal drug transporters [62]. The other important limitation in the current models is that the current rat and mouse mechanistic models do not consider the different isoforms of Oatp. Additionally, considering the different isoforms of Oatp is crucial for understanding the specific contributions of each isoform to CP disposition in plasma. By incorporating various isoforms of Oatp into the models, it would be possible to investigate the isoform-specific changes in protein expression and their impact on CPs disposition. Addressing these limitations in future work will enhance our understanding of CP disposition in the context of NASH and improve the interpretation of changes in plasma CP disposition as they relate drug transporter activity. It will contribute to a more comprehensive characterization of CPs as potential biomarkers for assessing drug transporter function in NASH and other liver diseases.
5. Conclusions
In conclusion, the current mechanistic models demonstrate its suitability to represent the CPs disposition in control and rodent BDL models. We have shown using the mechanistic model that the CP-I can be used to assess the drug transporter changes in the NASH liver and in rodent models involving alteration in Oatp, Mrp2, and Mrp3 activities. As the model includes the essential processes including biosynthesis and elimination, the mechanistic model provides a comprehensive understanding of CP disposition. This enables the evaluation of CPs as potential biomarkers for changes in drug transporter activity in various NASH models. The knowledge of changes in drug transporters learned from the preclinical assessment of drug transporters (Oatp, Mrp2, and Mep3) potentially apply to healthy subjects and NASH patients.
Supplementary Materials
The following supporting information can be downloaded at: Preprints.org, Figure S1: Schematic diagram of Coproporphyrin (CP) model in rat and mouse. Figure S2: Comparison of model simulated steady states with observed data. Figure S3: Comparison of model simulated renal and biliary secretion with observed data. Figure S4 : Model simulation showing the effect of con-comitant infusion of bromosulphophthalein (BSP) with equal amounts of CP-I and CP-III. Figure S5: Comparison of model simulated plasma and liver CP-I and CP-III and with observed data in BDL rat. Figure S6: Model simulated change in transporter activity during bile-duct ligation (BDL) in rat. Figure S7: Steady-state continuation analysis showing the impact of different transporters (Oatp, Mrp3,and Mrp2) on plasma CP-I level. Figure S8: Comparison of model simulated plasma CP-I and CP-III with observed data and simulated biliary secretion CP-I and CP-III. Figure S9: Comparison of model-simulated and observed data in TR- rats.; Table S1. Key model parameters used in rat and mouse CP models. Table S2: Model simulated steady states values in mice compared with observed result. Table S3: Model simulated biliary excretion ratio (CP-III/CP-I) with an intravenous infusion with the same and different proportions of CP-I and CP-III. Table S4: Model simulation results of CP-I and CP-III disposition in Oatp KO mice; * Simulations done with increased hepatic CP-III synthesis. File S1: Description of mechanistic model, File S2: MATLAB Scripts File S3: Experimental Description.
Author Contributions
Conceptualization, R.K.H.S. and S.C.; methodology, R.K.H.S. and S.C. Software, R.K.; validation R.K.H.S. and S.C.; formal Analysis, R.K.H.S,S.C.,R.R.G.,T.T.M; resources, T.T.M; data Curation, R.K.,R.R.G.,; writing—original draft preparation, R.K.,; writing—review and editing, R.K.,H.S.,S.C.,R.R.G.,T.T.M..; visualization, R.K.,H.S.,S.C.,R.R.G,T.T.M.; supervision, H.S.T.T.M.; project administration, H.S.T.T.M; All authors have read and agreed to the published version of the manuscript.
Funding
Please add: This research received no external funding.
Institutional Review Board Statement
The animal study protocol was approved by the Institutional Animal Ethical Committee, accredited by Association for Assessment and Accreditation of Laboratory Animal Care International. (Protocol details: SYNGENE/IAEC/858/07/2017).
Data Availability Statement
The MATLAB scripts are available as a supplementary file.
Acknowledgments
We thank Sankara Sivaprasad for the experimental works which helped develop the mechanistic model. We also thank Devang Shah, Michael Sinz, and Punith Marathe for their technical advice.
Conflicts of Interest
All authors are employees of either Bristol Myers Squibb Company or Biocon Bristol Myers Squibb R&D Centre, Syngene International Ltd.
References
- Brunt, E. M.; Kleiner, D. E.; Wilson, L. A.; Belt, P.; Neuschwander-Tetri, B. A.; for the NASH Clinical Research Network (CRN). Nonalcoholic Fatty Liver Disease (NAFLD) Activity Score and the Histopathologic Diagnosis in NAFLD: Distinct Clinicopathologic Meanings. Hepatology 2011, 53, 810–820. [Google Scholar] [CrossRef] [PubMed]
- Angulo, P.; Kleiner, D. E.; Dam-Larsen, S.; Adams, L. A.; Bjornsson, E. S.; Charatcharoenwitthaya, P.; Mills, P. R.; Keach, J. C.; Lafferty, H. D.; Stahler, A.; Haflidadottir, S.; Bendtsen, F. Liver Fibrosis, but No Other Histologic Features, Is Associated With Long-Term Outcomes of Patients With Nonalcoholic Fatty Liver Disease. Gastroenterology 2015, 149, 389–397e10. [Google Scholar] [CrossRef] [PubMed]
- Gandhi, A.; Moorthy, B.; Ghose, R. Drug Disposition in Pathophysiological Conditions. CDM 2012, 13, 1327–1344. [Google Scholar] [CrossRef] [PubMed]
- Verbeeck, R. K. Pharmacokinetics and Dosage Adjustment in Patients with Hepatic Dysfunction. Eur J Clin Pharmacol 2008, 64, 1147–1161. [Google Scholar] [CrossRef] [PubMed]
- Ali, I.; Slizgi, J. R.; Kaullen, J. D.; Ivanovic, M.; Niemi, M.; Stewart, P. W.; Barritt, A. S.; Brouwer, K. L. R. Transporter-Mediated Alterations in Patients With NASH Increase Systemic and Hepatic Exposure to an OATP and MRP2 Substrate. Clin. Pharmacol. Ther. 2018, 104, 749–756. [Google Scholar] [CrossRef] [PubMed]
- Shitara, Y.; Maeda, K.; Ikejiri, K.; Yoshida, K.; Horie, T.; Sugiyama, Y. Clinical Significance of Organic Anion Transporting Polypeptides (OATPs) in Drug Disposition: Their Roles in Hepatic Clearance and Intestinal Absorption: CLINICAL SIGNIFICANCE OF OATPS IN DRUG DISPOSITION. Biopharm. Drug Dispos. 2013, 34, 45–78. [Google Scholar] [CrossRef]
- Gerk, P. M.; Vore, M. Regulation of Expression of the Multidrug Resistance-Associated Protein 2 (MRP2) and Its Role in Drug Disposition. J Pharmacol Exp Ther 2002, 302, 407–415. [Google Scholar] [CrossRef]
- Marver, HS; Schmid I, The porphyrins, The Metabolic Basis of Inherited Disease, 3rd ed. , Stanbury JB, Wyngaarden JB, Fredrickson DS, eds; McGraw-Hill Book Co: New York, USA, 1972, p 1087. [Google Scholar]
- Bednarczyk, D.; Boiselle, C. Organic Anion Transporting Polypeptide (OATP)-Mediated Transport of Coproporphyrins I and III. Xenobiotica 2016, 46, 457–466. [Google Scholar] [CrossRef]
- Gilibili, R.; Kurawattimath, V.; Murali, B.; Lai, Y.; Mariappan, T.; Shen, H.; Chatterjee, S. In Vitro Stimulation of Multidrug Resistance-Associated Protein 2 Function Is Not Reproduced In Vivo in Rats. Pharmaceutics 2018, 10. [Google Scholar] [CrossRef]
- Chatterjee, S.; Mukherjee, S.; Sankara Sivaprasad, L. V. J.; Naik, T.; Gautam, S. S.; Murali, B. V.; Hadambar, A. A.; Gunti, G. R.; Kuchibhotla, V.; Deyati, A.; Basavanthappa, S.; Ramarao, M.; Mariappan, T. T.; Zinker, B. A.; Zhang, Y.; Sinz, M.; Shen, H. Transporter Activity Changes in Nonalcoholic Steatohepatitis: Assessment with Plasma Coproporphyrin I and III. J Pharmacol Exp Ther 2021, 376, 29–39. [Google Scholar] [CrossRef]
- Kunze, A.; Ediage, E. N.; Dillen, L.; Monshouwer, M.; Snoeys, J. Clinical Investigation of Coproporphyrins as Sensitive Biomarkers to Predict Mild to Strong OATP1B-Mediated Drug–Drug Interactions. Clin Pharmacokinet 2018, 57(12), 1559–1570. [Google Scholar] [CrossRef] [PubMed]
- Wolkoff AW; Wolpert E; Pascasio FN,;Arias IM. Rotor's syndrome. A distinct inheritable pathophysiologic entity. Am J Med. 1976, 60(2):173-9. [CrossRef]
- Lai, Y.; Mandlekar, S.; Shen, H.; Holenarsipur, V. K.; Langish, R.; Rajanna, P.; Murugesan, S.; Gaud, N.; Selvam, S.; Date, O.; Cheng, Y.; Shipkova, P.; Dai, J.; Humphreys, W. G.; Marathe, P. Coproporphyrins in Plasma and Urine Can Be Appropriate Clinical Biomarkers to Recapitulate Drug-Drug Interactions Mediated by Organic Anion Transporting Polypeptide Inhibition. Journal of Pharmacology and Experimental Therapeutics 2016, 358, 397–404. [Google Scholar] [CrossRef]
- Shen, H.; Dai, J.; Liu, T.; Cheng, Y.; Chen, W.; Freeden, C.; Zhang, Y.; Humphreys, W. G.; Marathe, P.; Lai, Y. Coproporphyrins I and III as Functional Markers of OATP1B Activity: In Vitro and In Vivo Evaluation in Preclinical Species. Journal of Pharmacology and Experimental Therapeutics 2016, 357, 382–393. [Google Scholar] [CrossRef] [PubMed]
- Zhang, Y.; Holenarsipur, VK.; Kandoussi, H.; Zeng, J. , Mariappan TT.; Sinz M.; Shen H. Detection of Weak Organic Anion-Transporting Polypeptide 1B Inhibition by Probenecid with Plasma-Based Coproporphyrin in Humans. Drug Metab Dispos. 2020.48(10):841-848. [CrossRef]
- Takita, H.; Scotcher, D.; Chu, X.; Yee, K. L.; Ogungbenro, K.; Galetin, A. Coproporphyrin I as an Endogenous Biomarker to Detect Reduced OATP1B Activity and Shift in Elimination Route in Chronic Kidney Disease. Clin Pharma and Therapeutics 2022, 112(3), 615–626. [Google Scholar] [CrossRef] [PubMed]
- Lin, J.; Kimoto, E.; Yamazaki, S.; Vourvahis, M.; Bergman, A.; Rodrigues, A. D.; Costales, C.; Li, R.; Varma, M. V. S. Effect of Hepatic Impairment on OATP1B Activity: Quantitative Pharmacokinetic Analysis of Endogenous Biomarker and Substrate Drugs. Clin Pharma and Therapeutics 2023, 113(5), 1058–1069. [Google Scholar] [CrossRef]
- Rodrigues, A.; Taskar, K.; Kusuhara, H.; Sugiyama, Y. Endogenous Probes for Drug Transporters: Balancing Vision With Reality. Clin. Pharmacol. Ther. 2018, 103, 434–448. [Google Scholar] [CrossRef]
- Chu, X.; Liao, M.; Shen, H.; Yoshida, K.; Zur, A. A.; Arya, V.; Galetin, A.; Giacomini, K. M.; Hanna, I.; Kusuhara, H.; Lai, Y.; Rodrigues, D.; Sugiyama, Y.; Zamek-Gliszczynski, M. J.; Zhang, L.; on behalf of the International Transporter Consortium. Clinical Probes and Endogenous Biomarkers as Substrates for Transporter Drug-Drug Interaction Evaluation: Perspectives From the International Transporter Consortium. Clin. Pharmacol. Ther. 2018, 104, 836–864. [Google Scholar] [CrossRef]
- Bradshaw, E. L.; Spilker, M. E.; Zang, R.; Bansal, L.; He, H.; Jones, R. D. O.; Le, K.; Penney, M.; Schuck, E.; Topp, B.; Tsai, A.; Xu, C.; Nijsen, M. J. M. A.; Chan, J. R. Applications of Quantitative Systems Pharmacology in Model-Informed Drug Discovery: Perspective on Impact and Opportunities. CPT Pharmacometrics Syst. Pharmacol. 2019, 8, 777–791. [Google Scholar] [CrossRef]
- Barnett, S.; Ogungbenro, K.; Ménochet, K.; Shen, H.; Lai, Y.; Humphreys, W. G.; Galetin, A. Gaining Mechanistic Insight Into Coproporphyrin I as Endogenous Biomarker for OATP1B-Mediated Drug-Drug Interactions Using Population Pharmacokinetic Modeling and Simulation. Clin. Pharmacol. Ther. 2018, 104, 564–574. [Google Scholar] [CrossRef]
- Yoshikado, T.; Toshimoto, K.; Maeda, K.; Kusuhara, H.; Kimoto, E.; Rodrigues, A. D.; Chiba, K.; Sugiyama, Y. PBPK Modeling of Coproporphyrin I as an Endogenous Biomarker for Drug Interactions Involving Inhibition of Hepatic OATP1B1 and OATP1B3. CPT Pharmacometrics Syst. Pharmacol. 2018, 7, 739–747. [Google Scholar] [CrossRef]
- Kimoto, E.; Costales, C. ; West MA, Bi YA.; Vourvahis M.; David Rodrigues A, Varma MVS. Biomarker-Informed Model-Based Risk Assessment of Organic Anion Transporting Polypeptide 1B Mediated Drug-Drug Interactions. Clin Pharmacol Ther. 2022. 111(2), 404-415. /: https. [CrossRef]
- Mochizuki, T.; Aoki, Y.; Yoshikado, T.; Yoshida, K.; Lai, Y.; Hirabayashi, H.; Yamaura, Y.; Rockich, K.; Taskar, K.; Takashima, T.; Chu, X.; Zamek-Gliszczynski, M. J.; Mao, J.; Maeda, K.; Furihata, K.; Sugiyama, Y.; Kusuhara, H. Physiologically-based Pharmacokinetic Model-based Translation of OATP1B -mediated Drug–Drug Interactions from Coproporphyrin I to Probe Drugs. Clinical Translational Sci 2022, 15(6), 1519–1531. [Google Scholar] [CrossRef]
- Doss, MO. Porphyrinurias and occupational disease. Ann N Y Acad Sci. 1987;514:204-18. [CrossRef]
- Karim, Z.; Lyoumi, S.; Nicolas, G.; Deybach, J.-C.; Gouya, L.; Puy, H. Porphyrias: A 2015 Update. Clinics and Research in Hepatology and Gastroenterology 2015, 39, 412–425. [Google Scholar] [CrossRef] [PubMed]
- Heinemann, IU. ;Jahn, M; Jahn, D. The biochemistry of heme biosynthesis. Arch Biochem Biophys. 2008, 474(2):238-51. [CrossRef]
- Hamza, I. Intracellular Trafficking of Porphyrins. ACS Chem. Biol. 2006, 1, 627–629. [Google Scholar] [CrossRef] [PubMed]
- Kaplowitz, N.; Javitt, N.; Kappas, A. Coproporphyrin I and 3 excretion in bile and urine. J Clin Invest. 1972, 51(11):2895-9. [CrossRef]
- Takita, H.; Barnett, S.; Zhang, Y.; Ménochet, K.; Shen, H.; Ogungbenro, K.; Galetin, A. PBPK Model of Coproporphyrin I: Evaluation of the Impact of SLCO1B1 Genotype, Ethnicity, and Sex on Its Inter-Individual Variability. CPT Pharmacometrics Syst. Pharmacol. 2021, 10, 137–147. [Google Scholar] [CrossRef]
- Gilibili, R. R.; Chatterjee, S.; Bagul, P.; Mosure, K. W.; Murali, B. V.; Mariappan, T. T.; Mandlekar, S.; Lai, Y. Coproporphyrin-I: A Fluorescent, Endogenous Optimal Probe Substrate for ABCC2 (MRP2) Suitable for Vesicle-Based MRP2 Inhibition Assay. Drug Metab Dispos 2017, 45(6), 604–611. [Google Scholar] [CrossRef] [PubMed]
- Orth, J. D.; Thiele, I.; Palsson, B. Ø. What Is Flux Balance Analysis? Nat Biotechnol 2010, 28(3), 245–248. [Google Scholar] [CrossRef]
- Davies, B,;Morris, T.; Physiological parameters in laboratory animals and humans. Pharm Res. 1993, 10(7):1093-5. [CrossRef]
- Conway, A. J.; Brown, F. C.; Fullinfaw, R. O.; Kile, B. T.; Jane, S. M.; Curtis, D. J. A Mouse Model of Hereditary Coproporphyria Identified in an ENU Mutagenesis Screen. Disease Models & Mechanisms, 2911. [Google Scholar] [CrossRef]
- Moriondo, V.; Marchini, S.; Gangi, P. D.; Ferrari, M. C.; Nascimbeni, F.; Rocchi, E.; Ventura, P. Role of Multidrug-Resistance Protein 2 in coproporphyrin transport: results from experimental studies in bile fistula rat models. Cell Mol Biol (Noisy-le-grand). 2009,55(2):70-8.
- Bezençon, J.; Saran, C.; Hussner, J.; Beaudoin, J. J.; Zhang, Y.; Shen, H.; Fallon, J. K.; Smith, P. C.; Meyer Zu Schwabedissen, H. E.; Brouwer, K. L. R. Endogenous Coproporphyrin I and III Are Altered in Multidrug Resistance-Associated Protein 2-Deficient (TR−) Rats. Journal of Pharmaceutical Sciences 2021, 110(1), 404–411. [Google Scholar] [CrossRef]
- Horikawa, M.; Kato, Y.; Tyson, C. A.; Sugiyama, Y. The Potential for an Interaction between MRP2 (ABCC2) and Various Therapeutic Agents: Probenecid as a Candidate Inhibitor of the Biliary Excretion of Irinotecan Metabolites. Drug Metabolism and Pharmacokinetics 2002, 17, 23–33. [Google Scholar] [CrossRef]
- Ishida, K.; Ullah, M.; Tóth, B.; Juhasz, V.; Unadkat, J. D. Transport Kinetics, Selective Inhibition, and Successful Prediction of In Vivo Inhibition of Rat Hepatic Organic Anion Transporting Polypeptides. Drug Metab Dispos 2018, 46, 1251–1258. [Google Scholar] [CrossRef]
- Tanaka, Y.; Kobayashi, Y.; Gabazza, E. C.; Higuchi, K.; Kamisako, T.; Kuroda, M.; Takeuchi, K.; Iwasa, M.; Kaito, M.; Adachi, Y. Increased Renal Expression of Bilirubin Glucuronide Transporters in a Rat Model of Obstructive Jaundice. American Journal of Physiology-Gastrointestinal and Liver Physiology 2002, 282, G656–G662. [Google Scholar] [CrossRef]
- Kaler, B.; Karram, T.; Morgan, W. A.; Bach, P. H.; Yousef, I. M.; Bomzon, A. Are Bile Acids Involved in the Renal Dysfunction of Obstructive Jaundice? An Experimental Study in Bile Duct Ligated Rats. Renal Failure 2004, 26, 507–516. [Google Scholar] [CrossRef] [PubMed]
- Kirouac, D. C. How Do We “Validate” a QSP Model? CPT Pharmacometrics Syst. Pharmacol. 2018, 7, 547–548. [Google Scholar] [CrossRef] [PubMed]
- Friedrich, C. A Model Qualification Method for Mechanistic Physiological QSP Models to Support Model-informed Drug Development. CPT Pharmacometrics Syst. Pharmacol. 2016, 5, 43–53. [Google Scholar] [CrossRef]
- Takehara, I.; Watanabe, N.; Mori, D.; Ando, O.; Kusuhara, H. Effect of Rifampicin on the Plasma Concentrations of Bile Acid-O-Sulfates in Monkeys and Human Liver-Transplanted Chimeric Mice With or Without Bile Flow Diversion. Journal of Pharmaceutical Sciences 2019, 108, 2756–2764. [Google Scholar] [CrossRef] [PubMed]
- Georgiev, P.; Jochum, W.; Heinrich, S.; Jang, J. H.; Nocito, A.; Dahm, F.; Clavien, P.-A. Characterization of Time-Related Changes after Experimental Bile Duct Ligation. British Journal of Surgery 2008, 95, 646–656. [Google Scholar] [CrossRef]
- Butterworth, R. F.; Norenberg, M. D.; Felipo, V.; Ferenci, P.; Albrecht, J.; Blei, A. T.; Members of the ISHEN Commission on Experimental Models of HE]. Experimental Models of Hepatic Encephalopathy: ISHEN Guidelines. Liver International 2009, 29, 783–788. [Google Scholar] [CrossRef]
- Thakkar, N.; Slizgi, J. R.; Brouwer, K. L. R. Effect of Liver Disease on Hepatic Transporter Expression and Function. Journal of Pharmaceutical Sciences 2017, 106, 2282–2294. [Google Scholar] [CrossRef]
- Slitt, A. L.; Allen, K.; Morrone, J.; Aleksunes, L. M.; Chen, C.; Maher, J. M.; Manautou, J. E.; Cherrington, N. J.; Klaassen, C. D. Regulation of Transporter Expression in Mouse Liver, Kidney, and Intestine during Extrahepatic Cholestasis. Biochimica et Biophysica Acta (BBA) - Biomembranes 2007, 1768, 637–647. [Google Scholar] [CrossRef]
- Halilbasic, E.; Claudel, T.; Trauner, M. Bile Acid Transporters and Regulatory Nuclear Receptors in the Liver and Beyond. Journal of Hepatology 2013, 58, 155–168. [Google Scholar] [CrossRef]
- Rocchi, E.; Gibertini, P. ;Santunione. V.; Balli. F.; Ventura, E. Faecal and urinary coproporphyrin isomers in biliary atresia and neonatal hepatitis. Ric Clin Lab. 1980,10(3):501-9. [CrossRef]
- Vildhede, A.; Kimoto, E.; Pelis, R. M.; Rodrigues, A. D.; Varma, M. V. S. Quantitative Proteomics and Mechanistic Modeling of Transporter-Mediated Disposition in Nonalcoholic Fatty Liver Disease. Clin. Pharmacol. Ther. 2020, 107, 1128–1137. [Google Scholar] [CrossRef]
- Geier, A.; Dietrich, C. G.; Gerloff, T.; Haendly, J.; Kullak-Ublick, G. A.; Stieger, B.; Meier, P. J.; Matern, S.; Gartung, C. Regulation of Basolateral Organic Anion Transporters in Ethinylestradiol-Induced Cholestasis in the Rat. Biochimica et Biophysica Acta (BBA) - Biomembranes 2003, 1609, 87–94. [Google Scholar] [CrossRef]
- Clarke, J. D.; Hardwick, R. N.; Lake, A. D.; Canet, M. J.; Cherrington, N. J. Experimental Nonalcoholic Steatohepatitis Increases Exposure to Simvastatin Hydroxy Acid by Decreasing Hepatic Organic Anion Transporting Polypeptide Expression. J Pharmacol Exp Ther 2014, 348, 452–458. [Google Scholar] [CrossRef] [PubMed]
- Soroka, C. Cellular Localization and Up-Regulation of Multidrug Resistance–Associated Protein 3 in Hepatocytes and Cholangiocytes during Obstructive Cholestasis in Rat Liver. Hepatology 2001, 33, 783–791. [Google Scholar] [CrossRef] [PubMed]
- Denk, G. U.; Soroka, C. J.; Takeyama, Y.; Chen, W.-S.; Schuetz, J. D.; Boyer, J. L. Multidrug Resistance-Associated Protein 4 Is up-Regulated in Liver but down-Regulated in Kidney in Obstructive Cholestasis in the Rat. Journal of Hepatology 2004, 40, 585–591. [Google Scholar] [CrossRef]
- Hardwick, R. N.; Fisher, C. D.; Street, S. M.; Canet, M. J.; Cherrington, N. J. Molecular Mechanism of Altered Ezetimibe Disposition in Nonalcoholic Steatohepatitis. Drug Metab Dispos 2012, 40, 450–460. [Google Scholar] [CrossRef]
- Dzierlenga, A. L.; Clarke, J. D.; Klein, D. M.; Anumol, T.; Snyder, S. A.; Li, H.; Cherrington, N. J. Biliary Elimination of Pemetrexed Is Dependent on Mrp2 in Rats: Potential Mechanism of Variable Response in Nonalcoholic Steatohepatitis. Journal of Pharmacology and Experimental Therapeutics 2016, 358, 246–253. [Google Scholar] [CrossRef]
- Van De Steeg, E.; Wagenaar, E.; Van Der Kruijssen, C. M. M.; Burggraaff, J. E. C.; De Waart, D. R.; Elferink, R. P. J. O.; Kenworthy, K. E.; Schinkel, A. H. Organic Anion Transporting Polypeptide 1a/1b–Knockout Mice Provide Insights into Hepatic Handling of Bilirubin, Bile Acids, and Drugs. J. Clin. Invest. 2010, 120, 2942–2952. [Google Scholar] [CrossRef]
- Huang, M.; Chen, Y.; Huang, Y.; Yang, S.; Chen, P.; Huang, C. Effect of UDP-glucuronosyltransferase 1A1 Activity on Risk for Developing Gilbert’s Syndrome. Kaohsiung J Med Sci, 1207. [Google Scholar] [CrossRef]
- McColl, K. E.; Thompson, G. G.; El Omar, E.; Moore, M. R.; Goldberg, A. Porphyrin Metabolism and Haem Biosynthesis in Gilbert’s Syndrome. Gut 1987, 28, 125–130. [Google Scholar] [CrossRef]
- Wagner, M.; Fickert, P.; Zollner, G.; Fuchsbichler, A.; Silbert, D.; Tsybrovskyy, O.; Zatloukal, K.; Guo, G. L.; Schuetz, J. D.; Gonzalez, F. J.; Marschall, H.-U.; Denk, H.; Trauner, M. Role of Farnesoid X Receptor in Determining Hepatic ABC Transporter Expression and Liver Injury in Bile Duct-Ligated Mice. Gastroenterology 2003, 125, 825–838. [Google Scholar] [CrossRef]
- Canet, M. J.; Hardwick, R. N.; Lake, A. D.; Dzierlenga, A. L.; Clarke, J. D.; Goedken, M. J.; Cherrington, N. J. Renal Xenobiotic Transporter Expression Is Altered in Multiple Experimental Models of Nonalcoholic Steatohepatitis. Drug Metab Dispos 2015, 43, 266–272. [Google Scholar] [CrossRef]
Figure 1.
Schematic diagram of Coproporphyrin (CP) network in rat and mouse CP models. The models include three compartments – plasma, liver, and intestine. The numbers represent the processes that are modeled for CP metabolism (1), synthesis of CP-I/III from erythrocytes (2), hepatic synthesis of CP-I/III (3), Oatp-mediated uptake from plasma to liver (4), passive diffusional transport of CP-I/III from plasma to liver (5), Mrp3-mediated efflux CP-I/III from liver to plasma (6), Mrp2 mediated CP-I/III transport from liver to intestine (7), non-Mrp2 mediated CP-I/III transport from liver to plasma (8), enterohepatic circulation of CP-I/CP-III from intestine to plasma (9), fecal elimination of CP-I/CP-III, and (10) renal elimination of CP-I/CP-III.
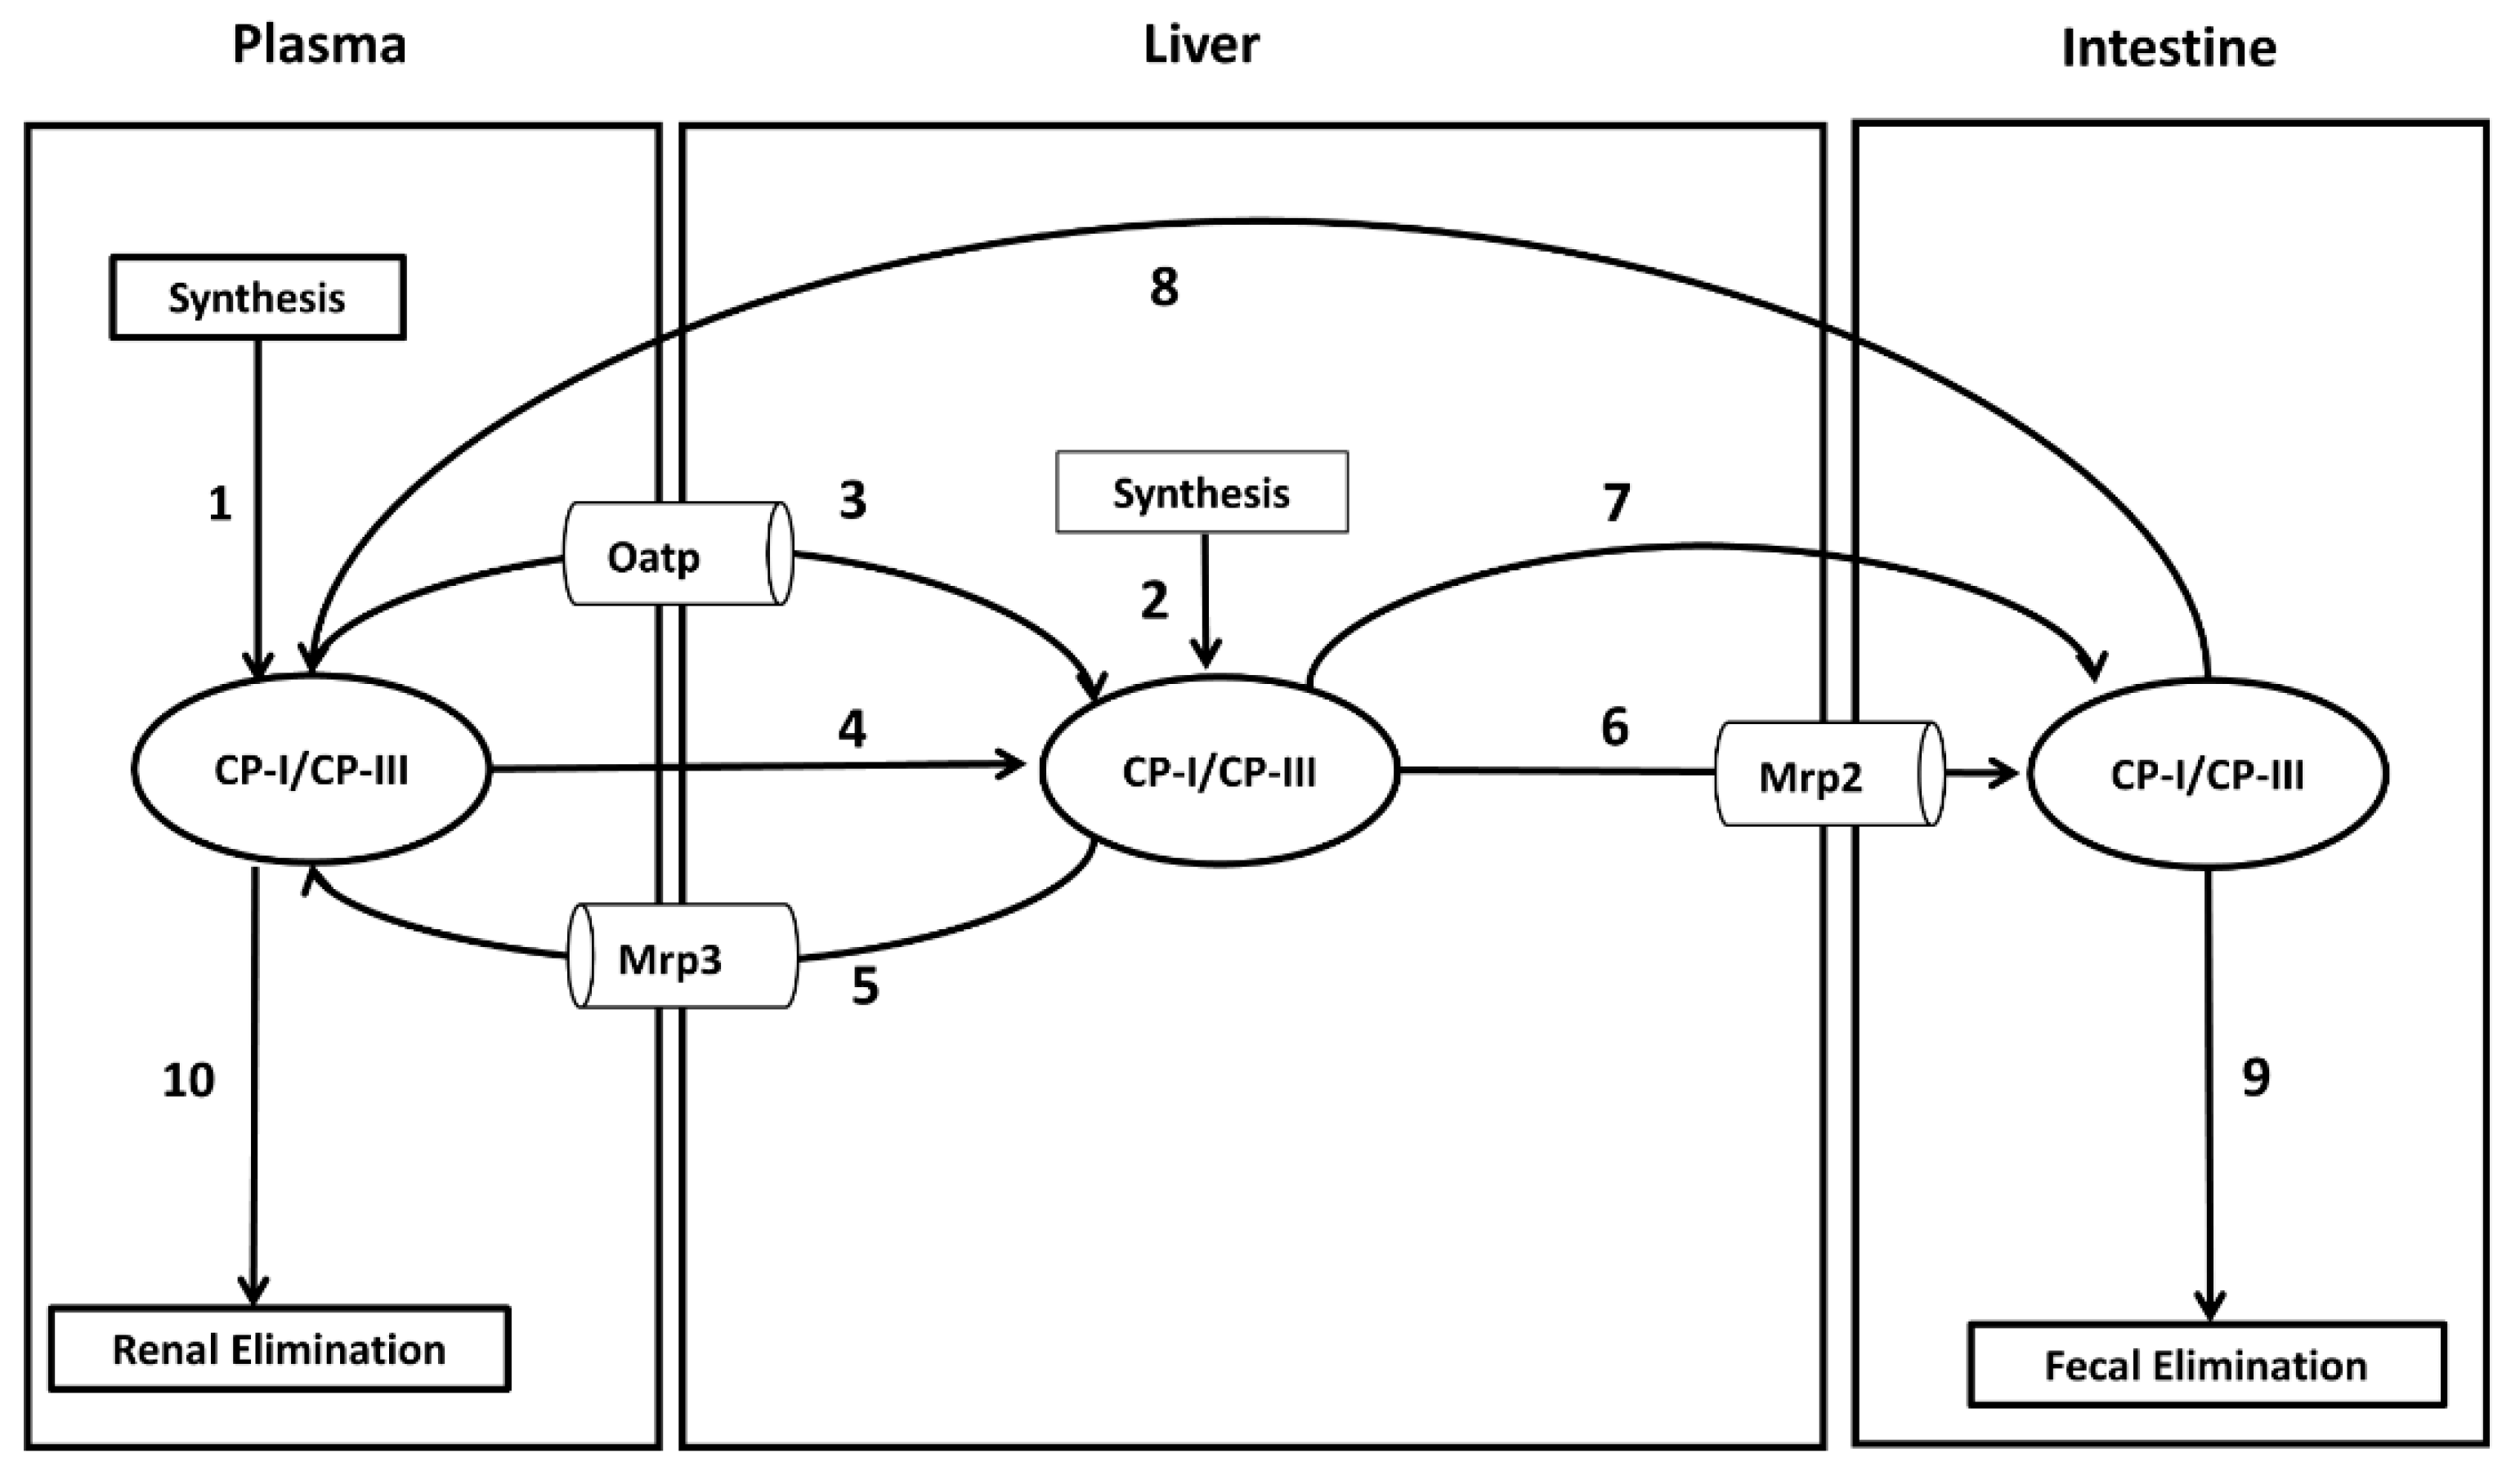
Figure 2.
Comparison of model simulated steady states with observed data. (A) Plasma CP-I, (B) Liver CP-I, (C) CP-I in bile, (D) Plasma CP-III, (E) Liver CP-III, (F) CP-III in Bile. Symbols, the continuous line represents simulated data. Experimental data with error bars (mean ± SEM) represent observed data. CP-I, Coproporphyrin-I; CP-III, Coproporphyrin-III.
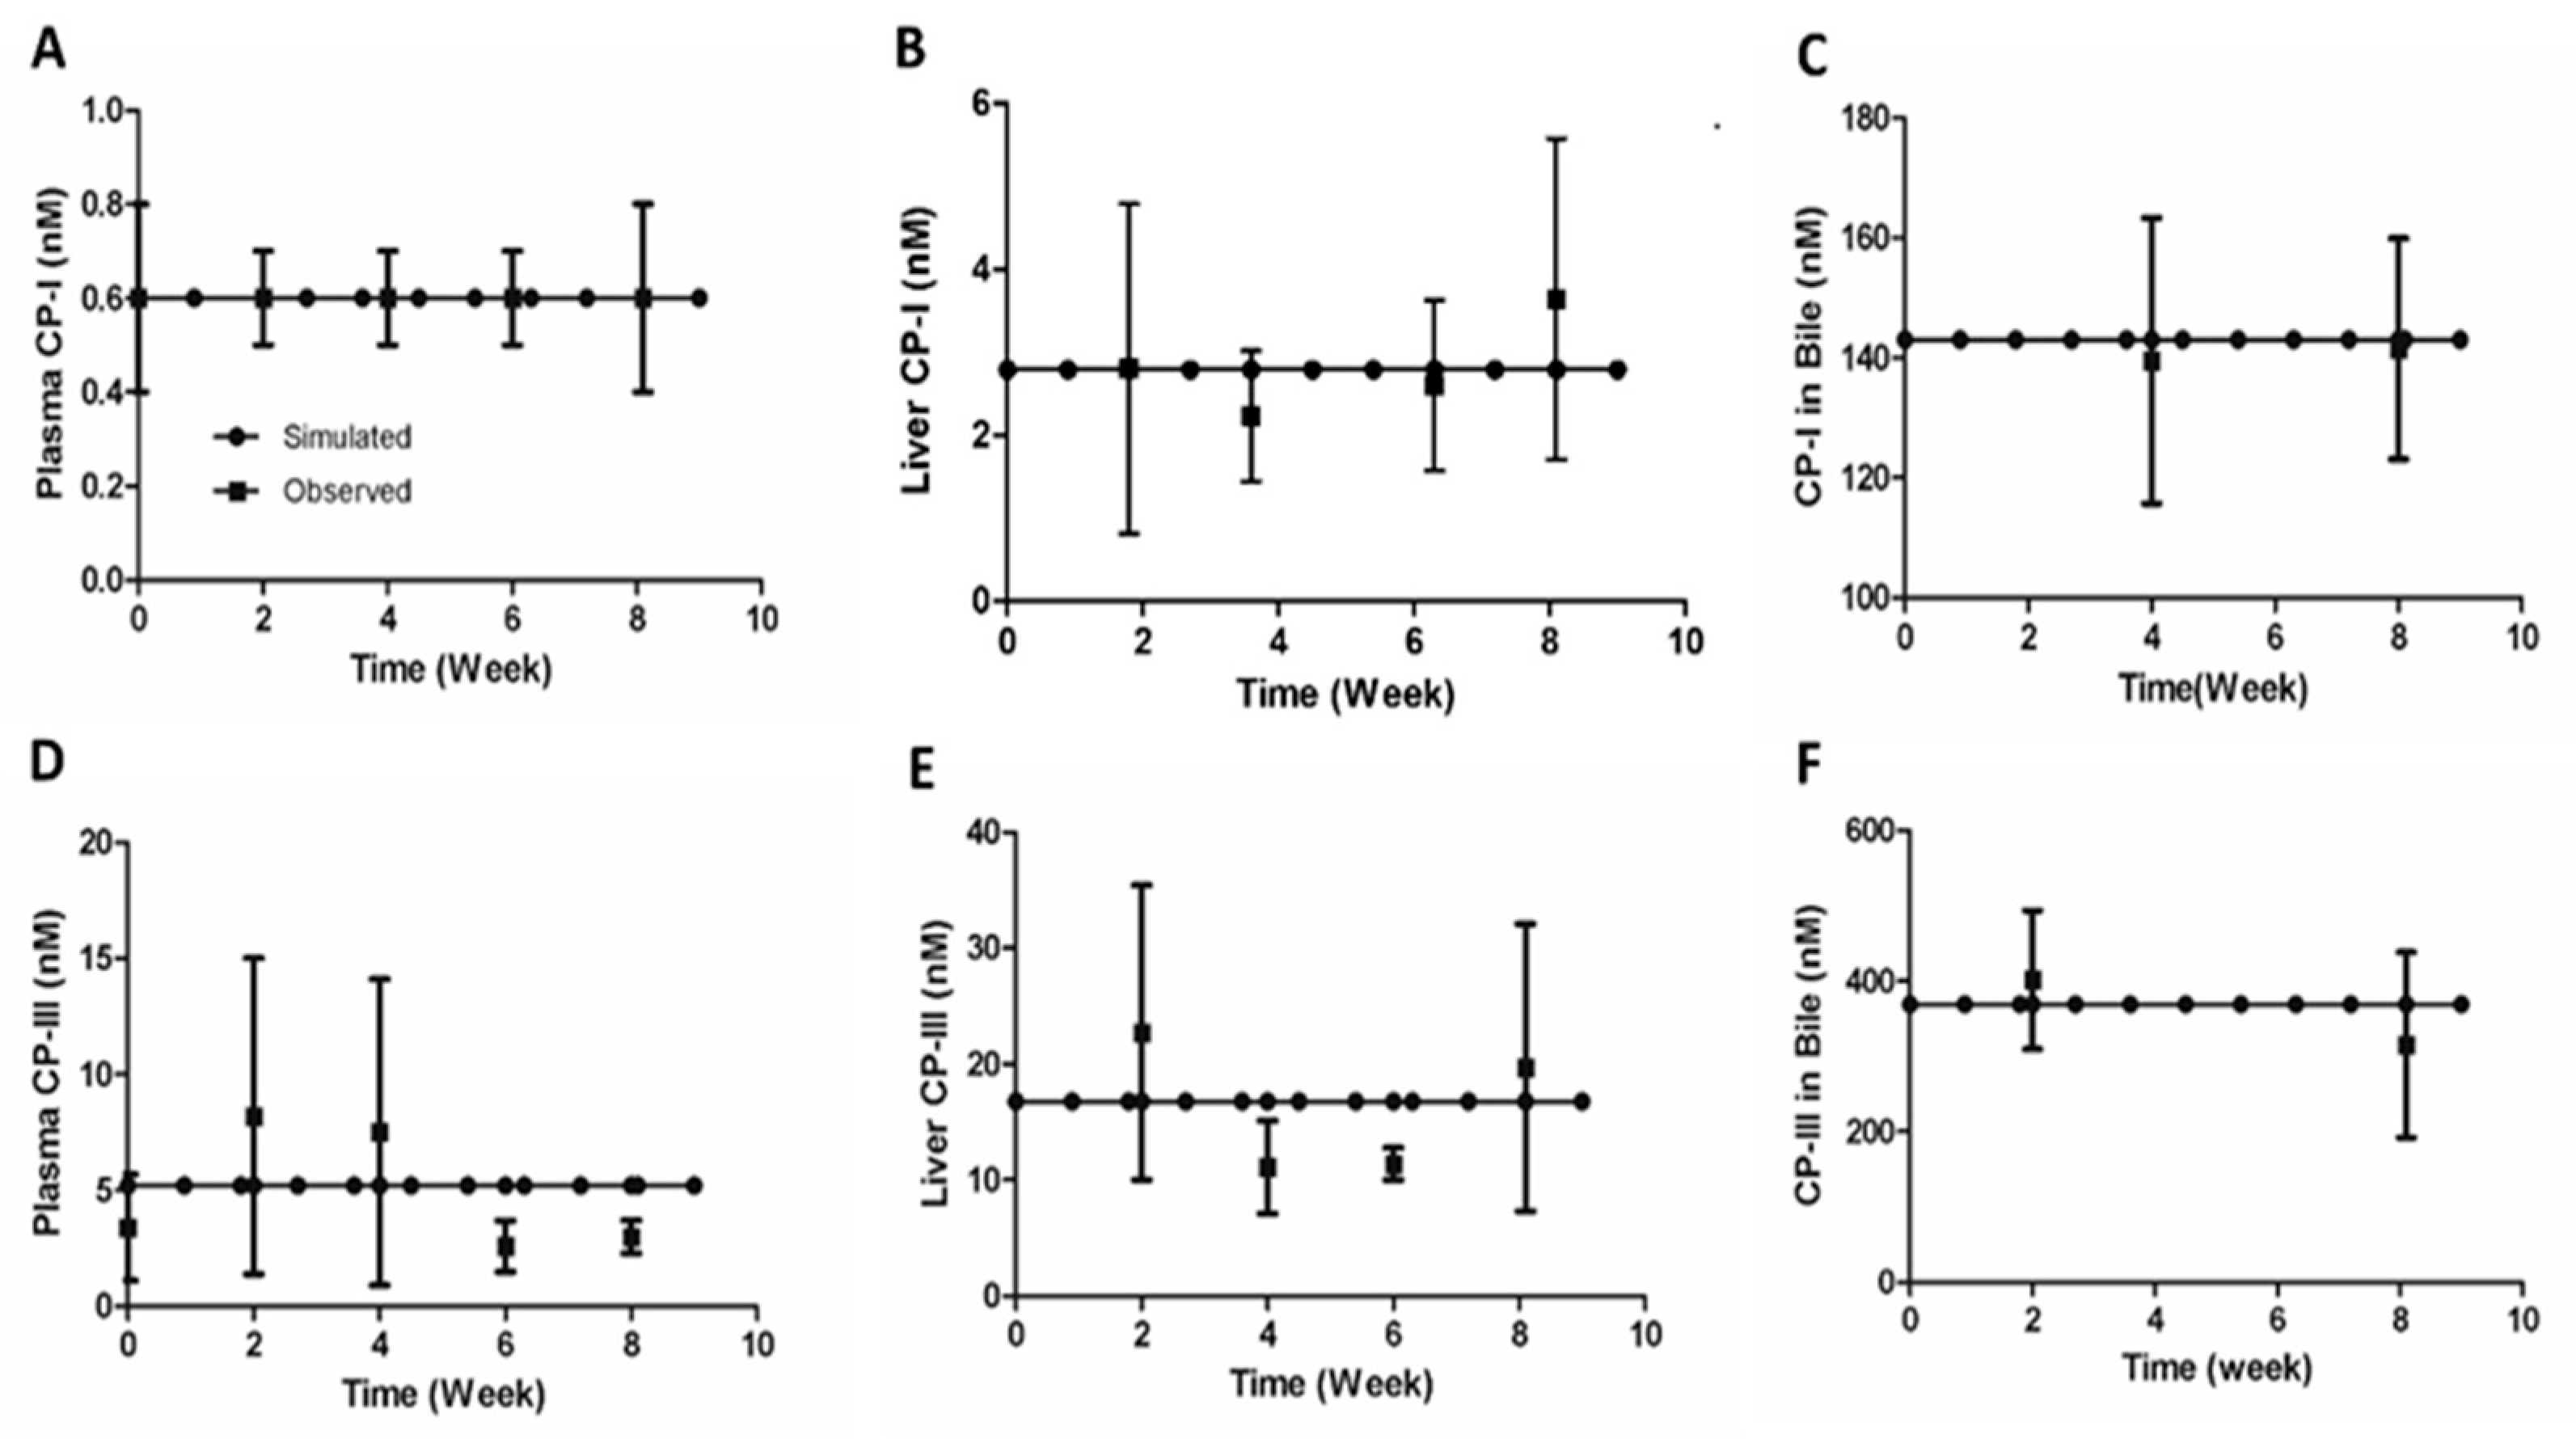
Figure 3.
Comparison of model simulated renal and biliary secretion with observed data. (A) CP-I and CP-III urinary secretion (B) CP-I and CP-III biliary secretion.Symbols, the continuous line represents simulated data. Experimental data with error bars (mean ± SEM) represent observed data. CP-I, Coproporphyrin-I; CP-III, Coproporphyrin-II.
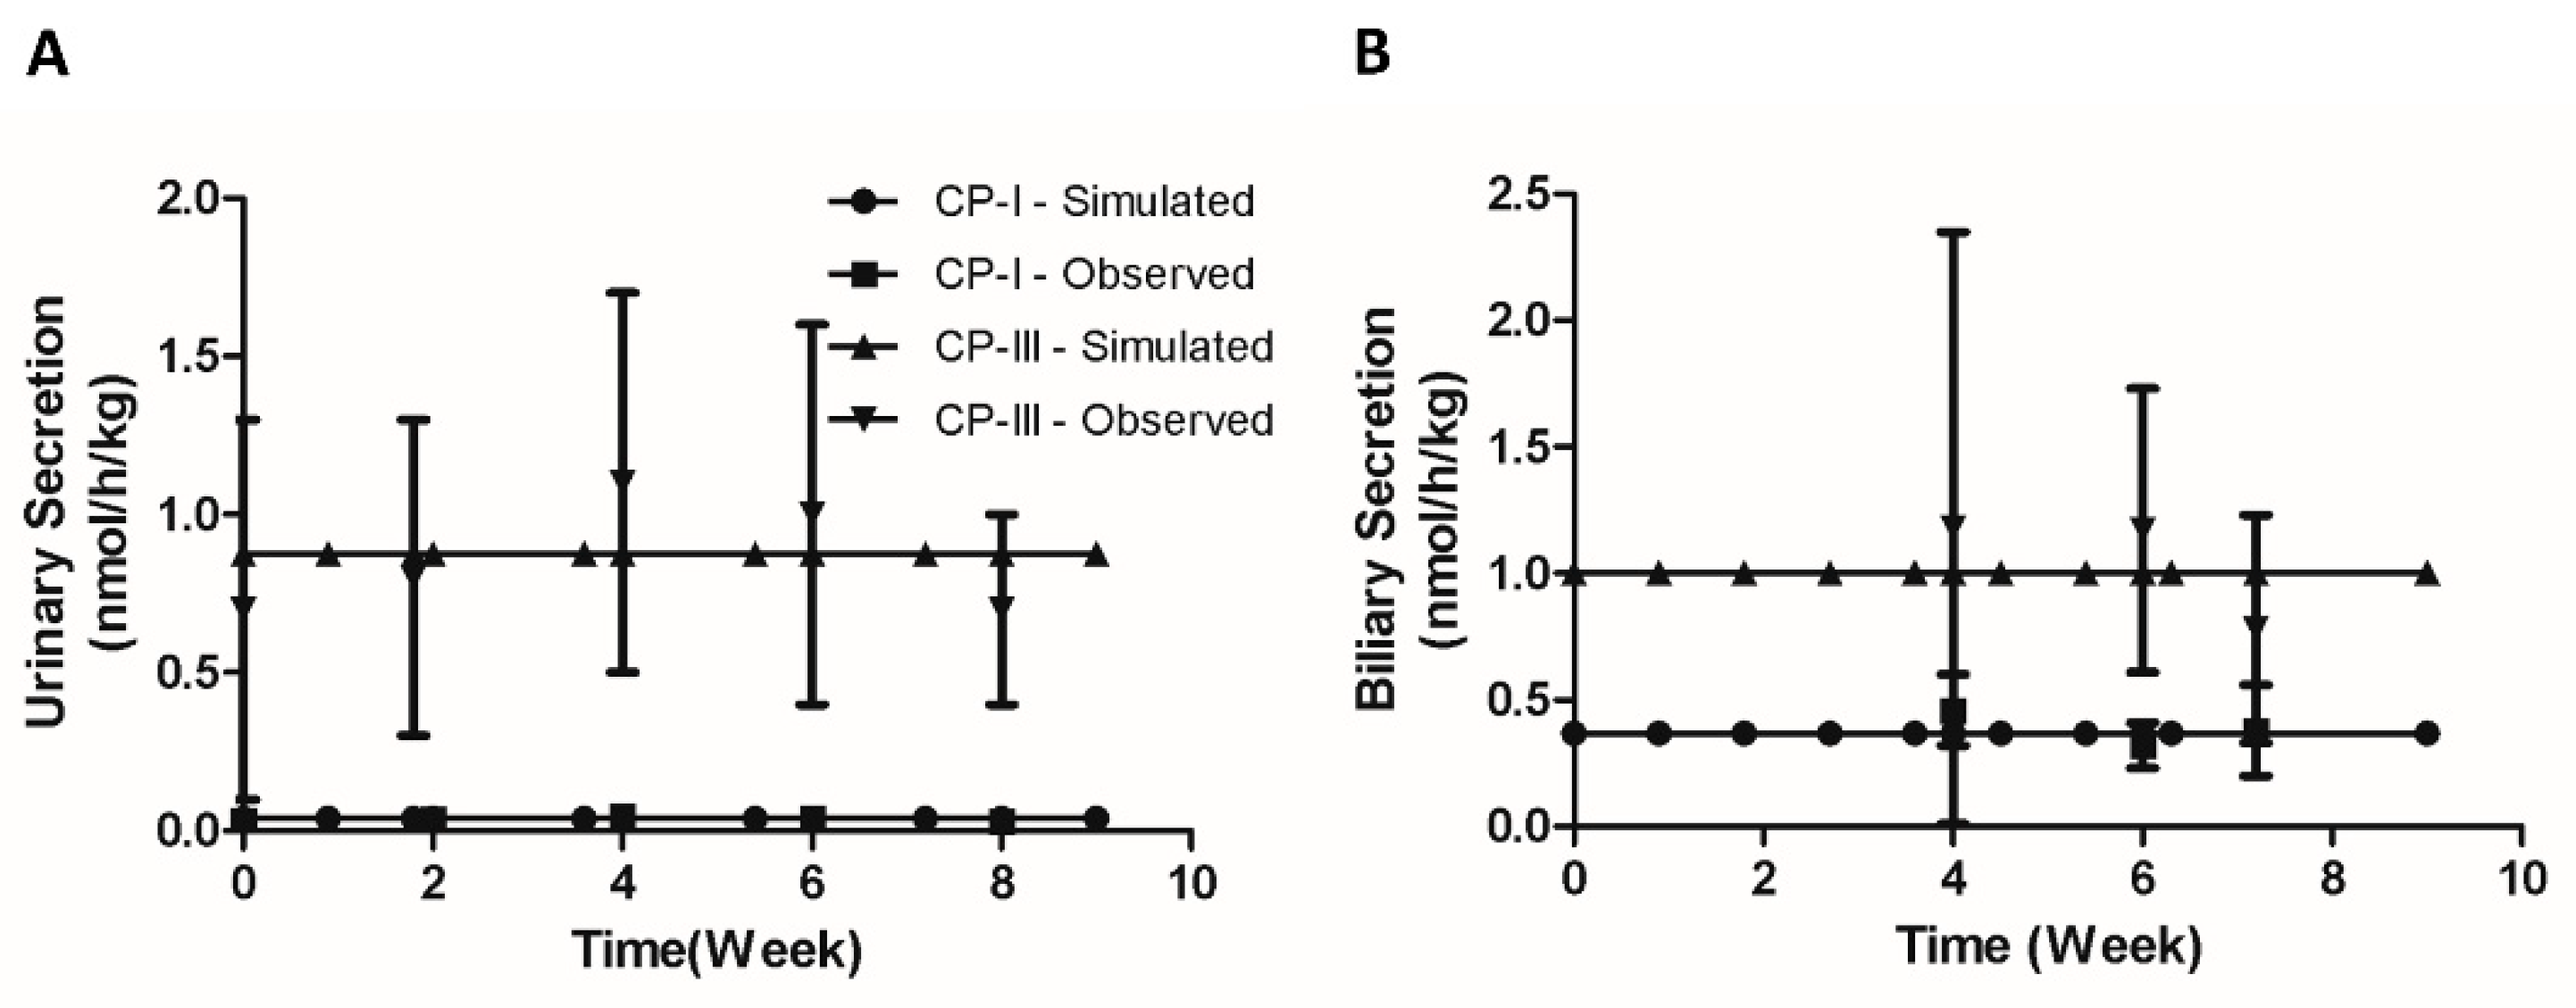
Figure 4.
Model simulation showing the effect of concomitant infusion of bromosulphophthalein (BSP) with equal amounts of CP-I and CP-III. (A) CP-I biliary secretion (B) CP-III biliary secretion, (C) CP-I, and CP-III biliary secretion. Data was extracted using the WebPlotDigitizer tool (URL: https://apps.automeris.io/wpd/ ) . Experimental data [30] with error bars (mean ± SD) represent observed data. CP-I, Coproporphyrin-I ; CP-III, Coproporphyrin-III.
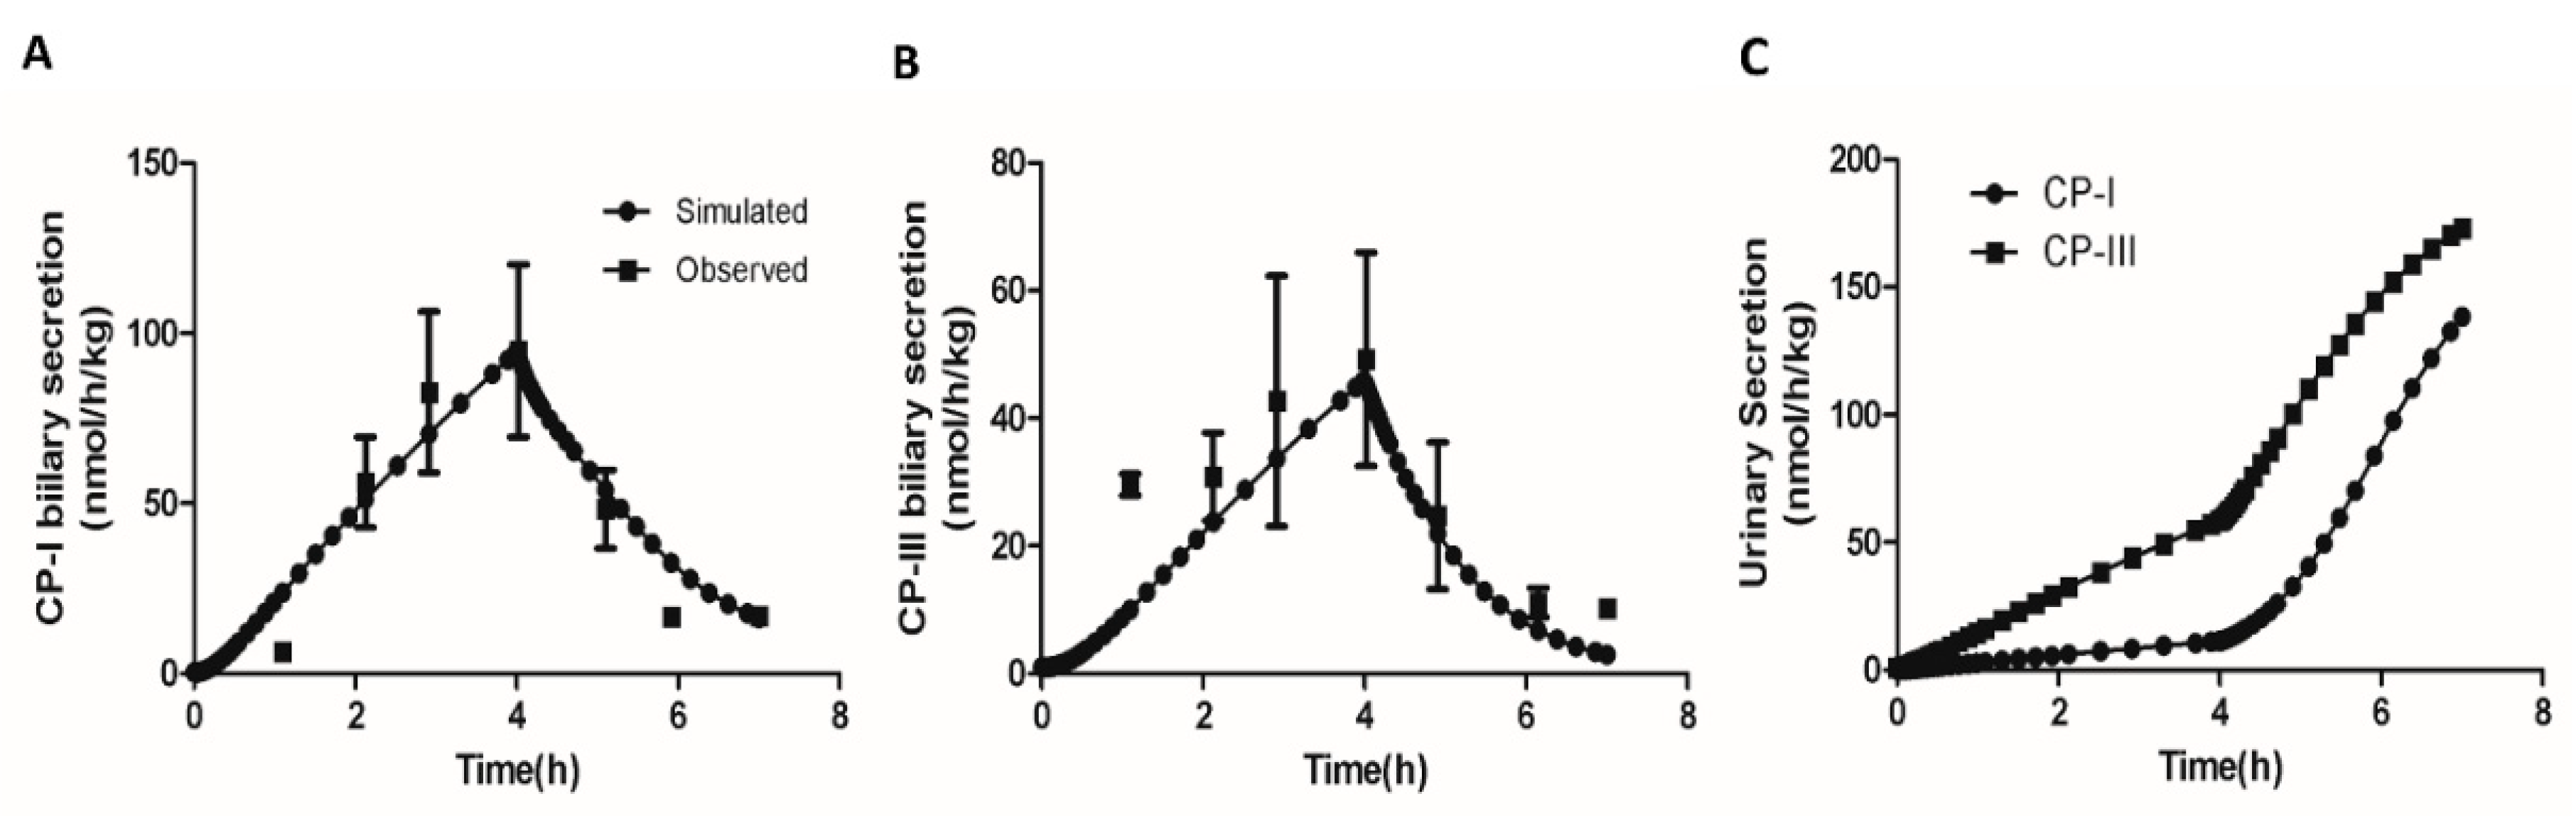
Figure 5.
Comparison of model simulated plasma and liver CP-I and CP-III and with observed data in BDL rat. (A) Plasma CP-I, (B) Liver CP-I, (C) Plasma CP-III, (D) Liver CP-III. Symbols, continuous line represents simulated data. Data was extracted using the WebPlotDigitizer tool (URL: https://apps.automeris.io/wpd/ ) Experimental data [11] with error bars (mean ± SEM) represent observed data. CP-I, Coproporphyrin-I; CP-III, Coproporphyrin-III, FC wrt control, Fold change with respect to control.
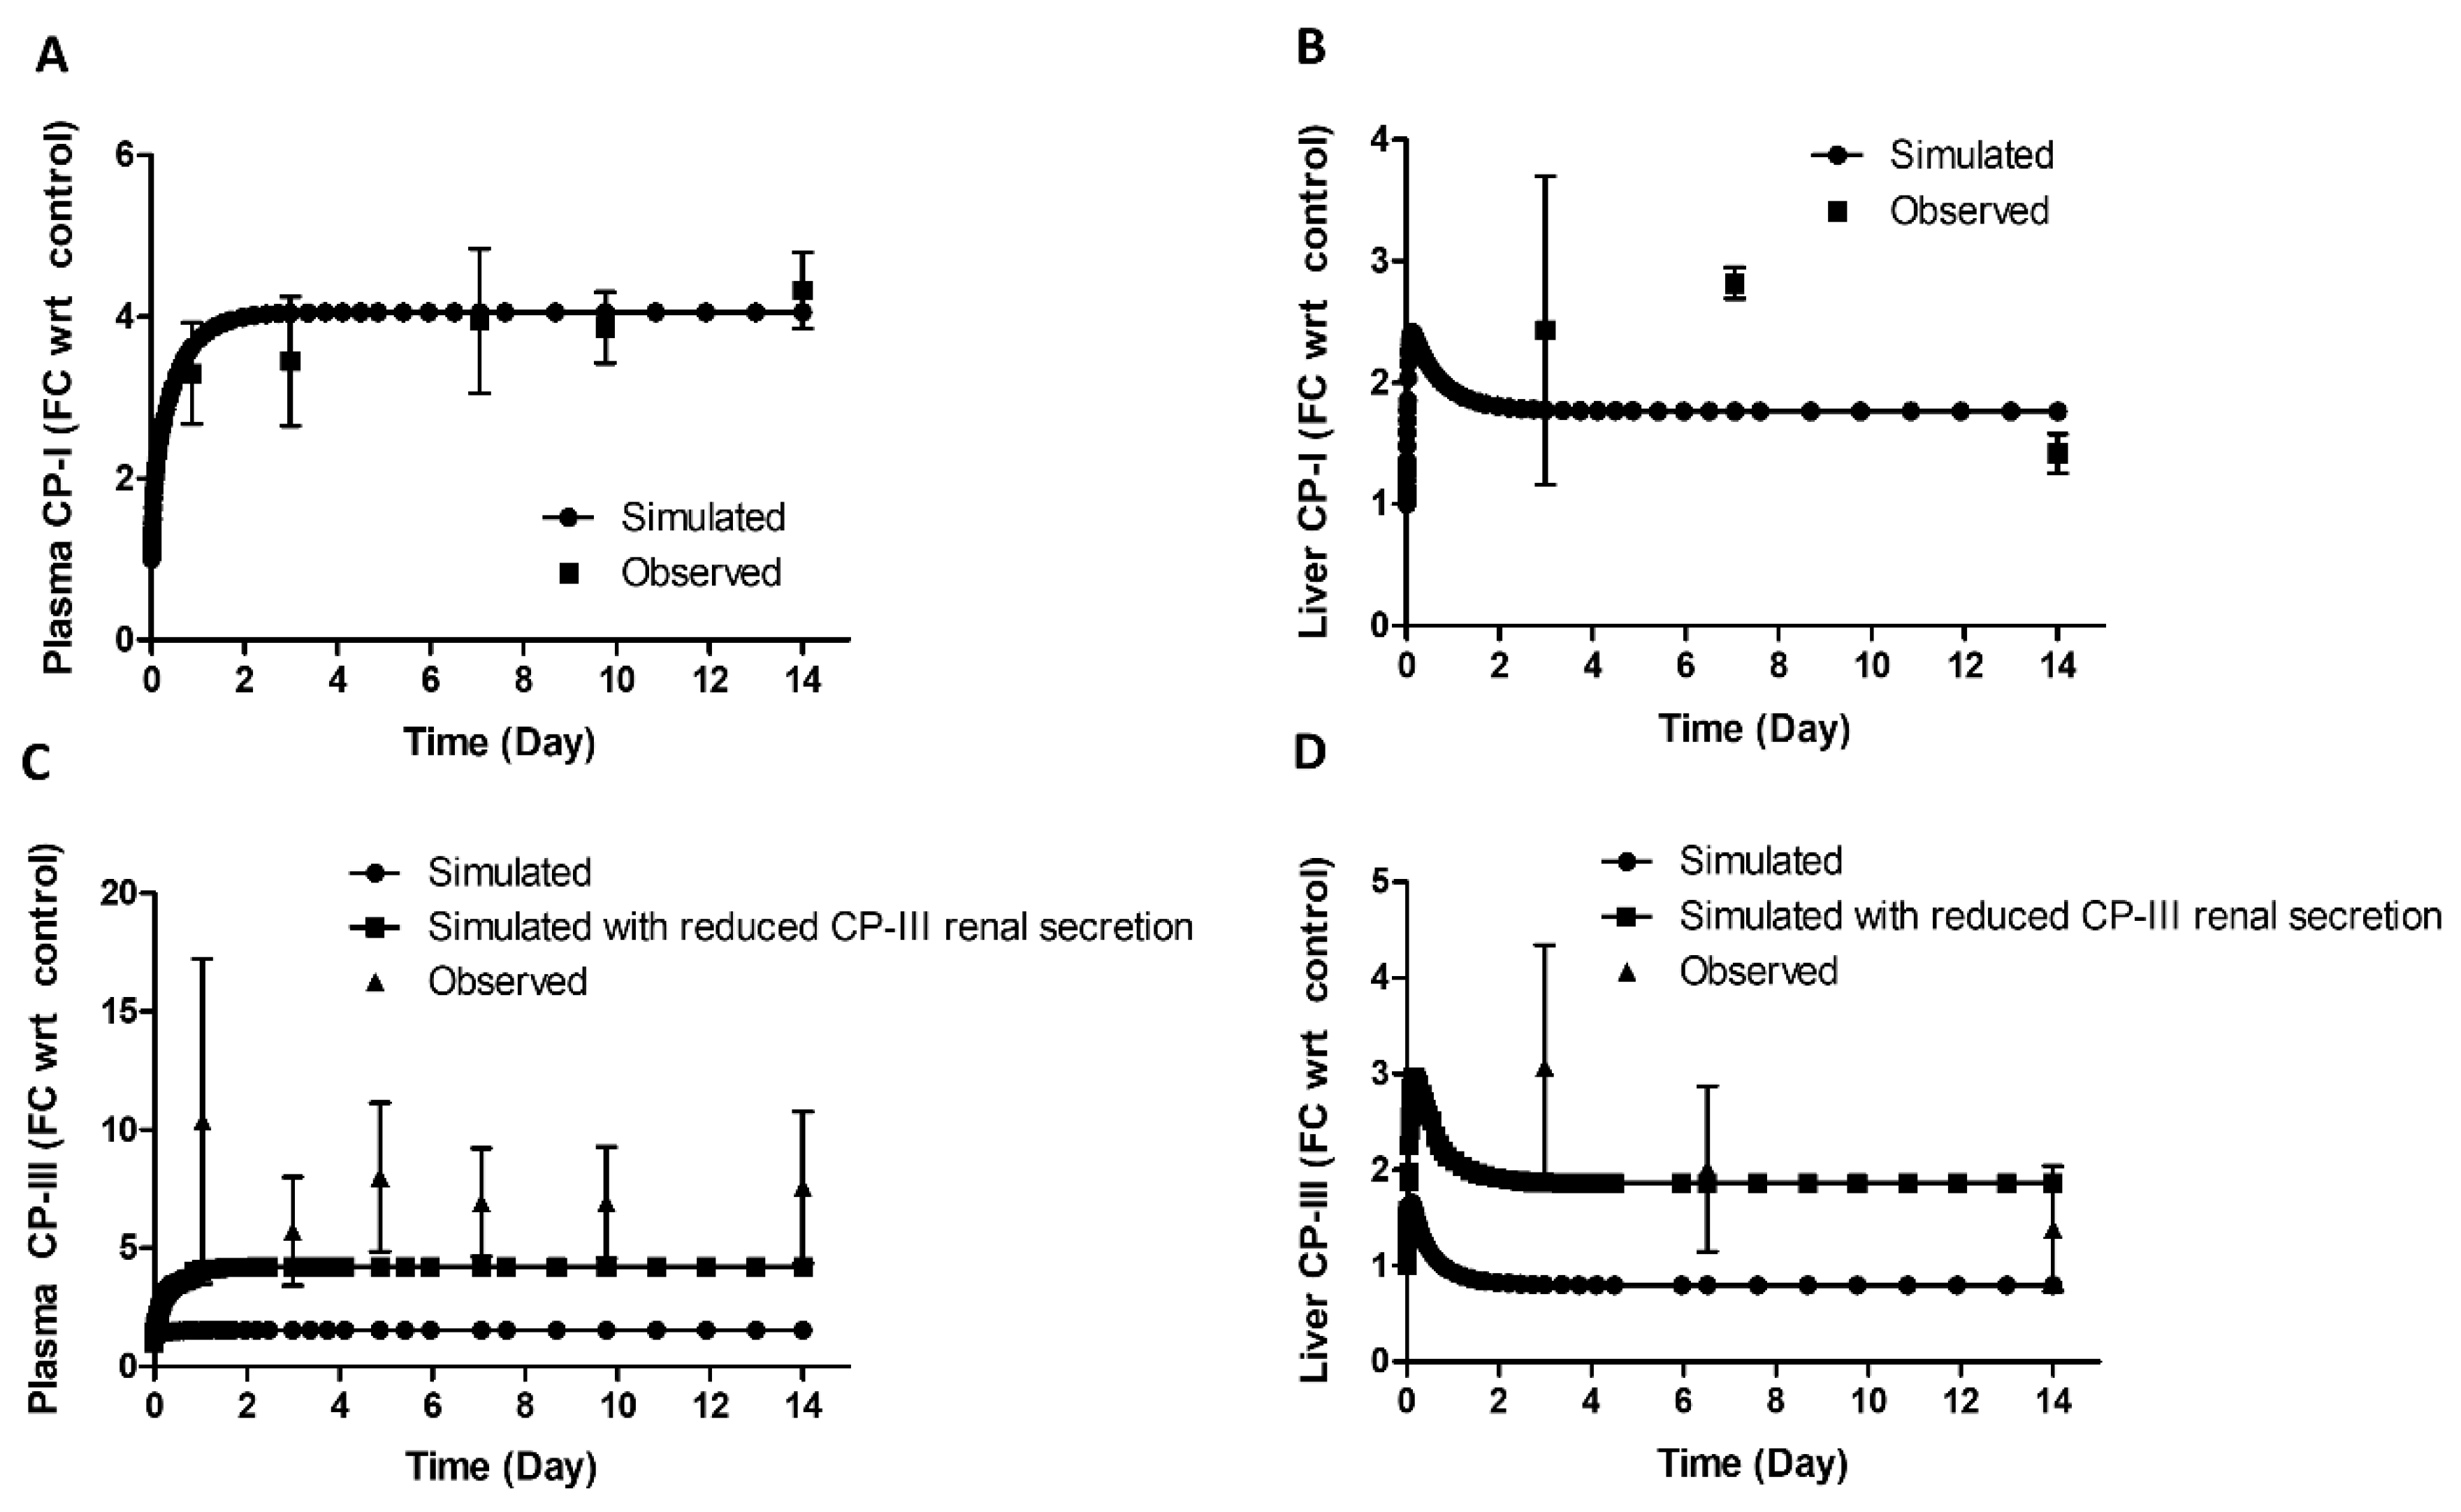
Figure 6.
Model simulated change in transporter activity during bile-duct ligation (BDL) in rat. Symbol, FC wrt control, Fold change with respect to control.
Figure 6.
Model simulated change in transporter activity during bile-duct ligation (BDL) in rat. Symbol, FC wrt control, Fold change with respect to control.
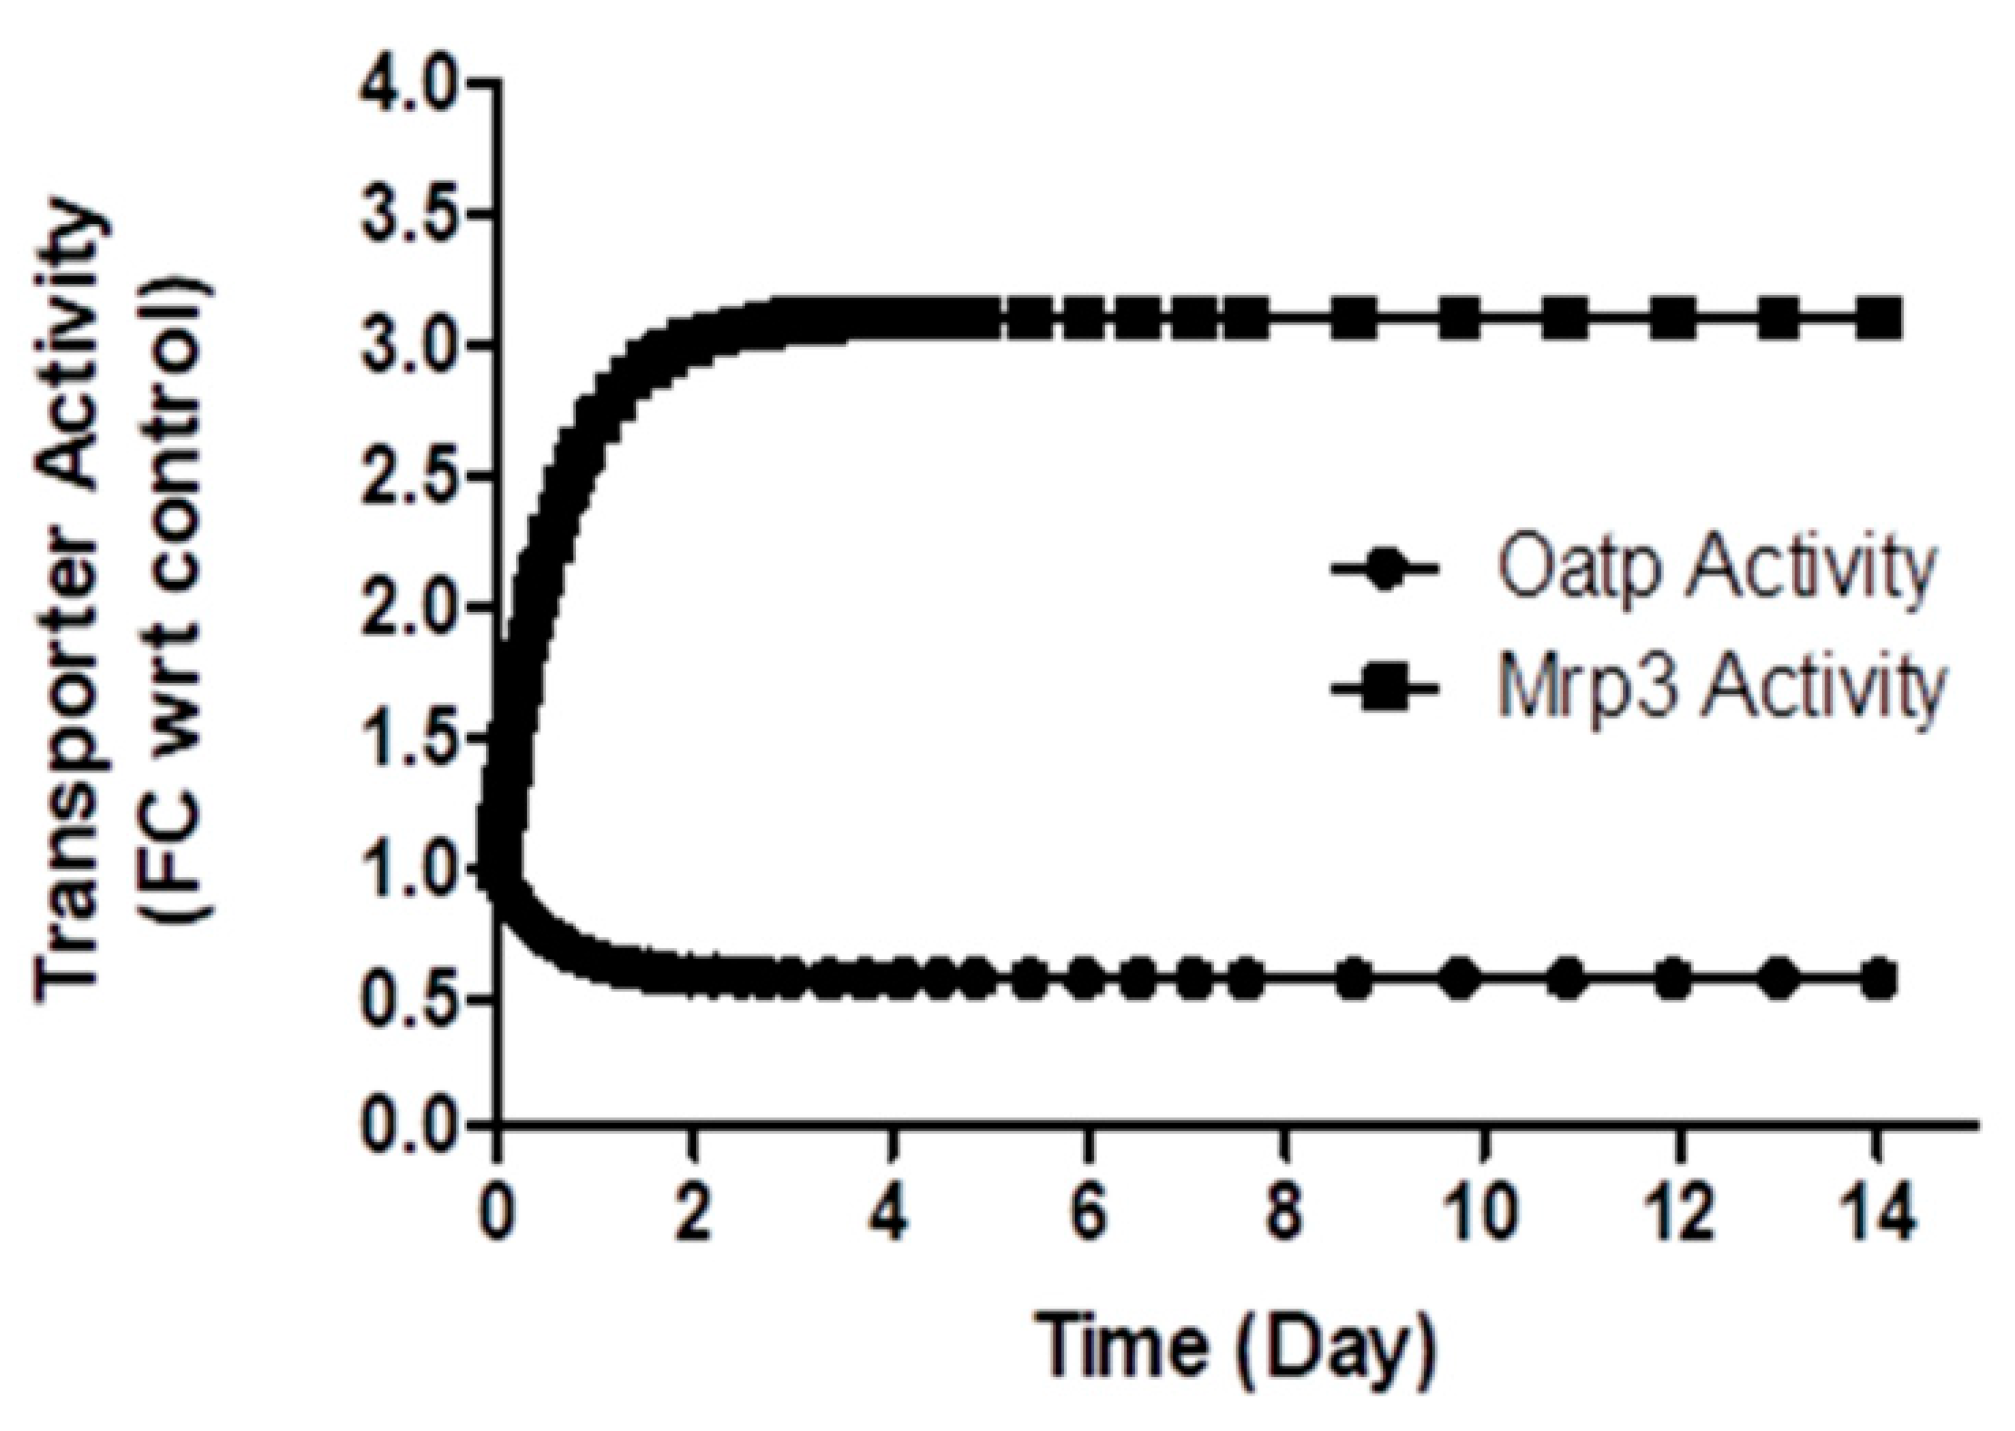
Figure 7.
Steady-state continuation analysis showing the impact of different transporters (Oatp, Mrp3, and Mrp2) on plasma CP-I level. Symbol, FC wrt control, Fold change with respect to control.
Figure 7.
Steady-state continuation analysis showing the impact of different transporters (Oatp, Mrp3, and Mrp2) on plasma CP-I level. Symbol, FC wrt control, Fold change with respect to control.
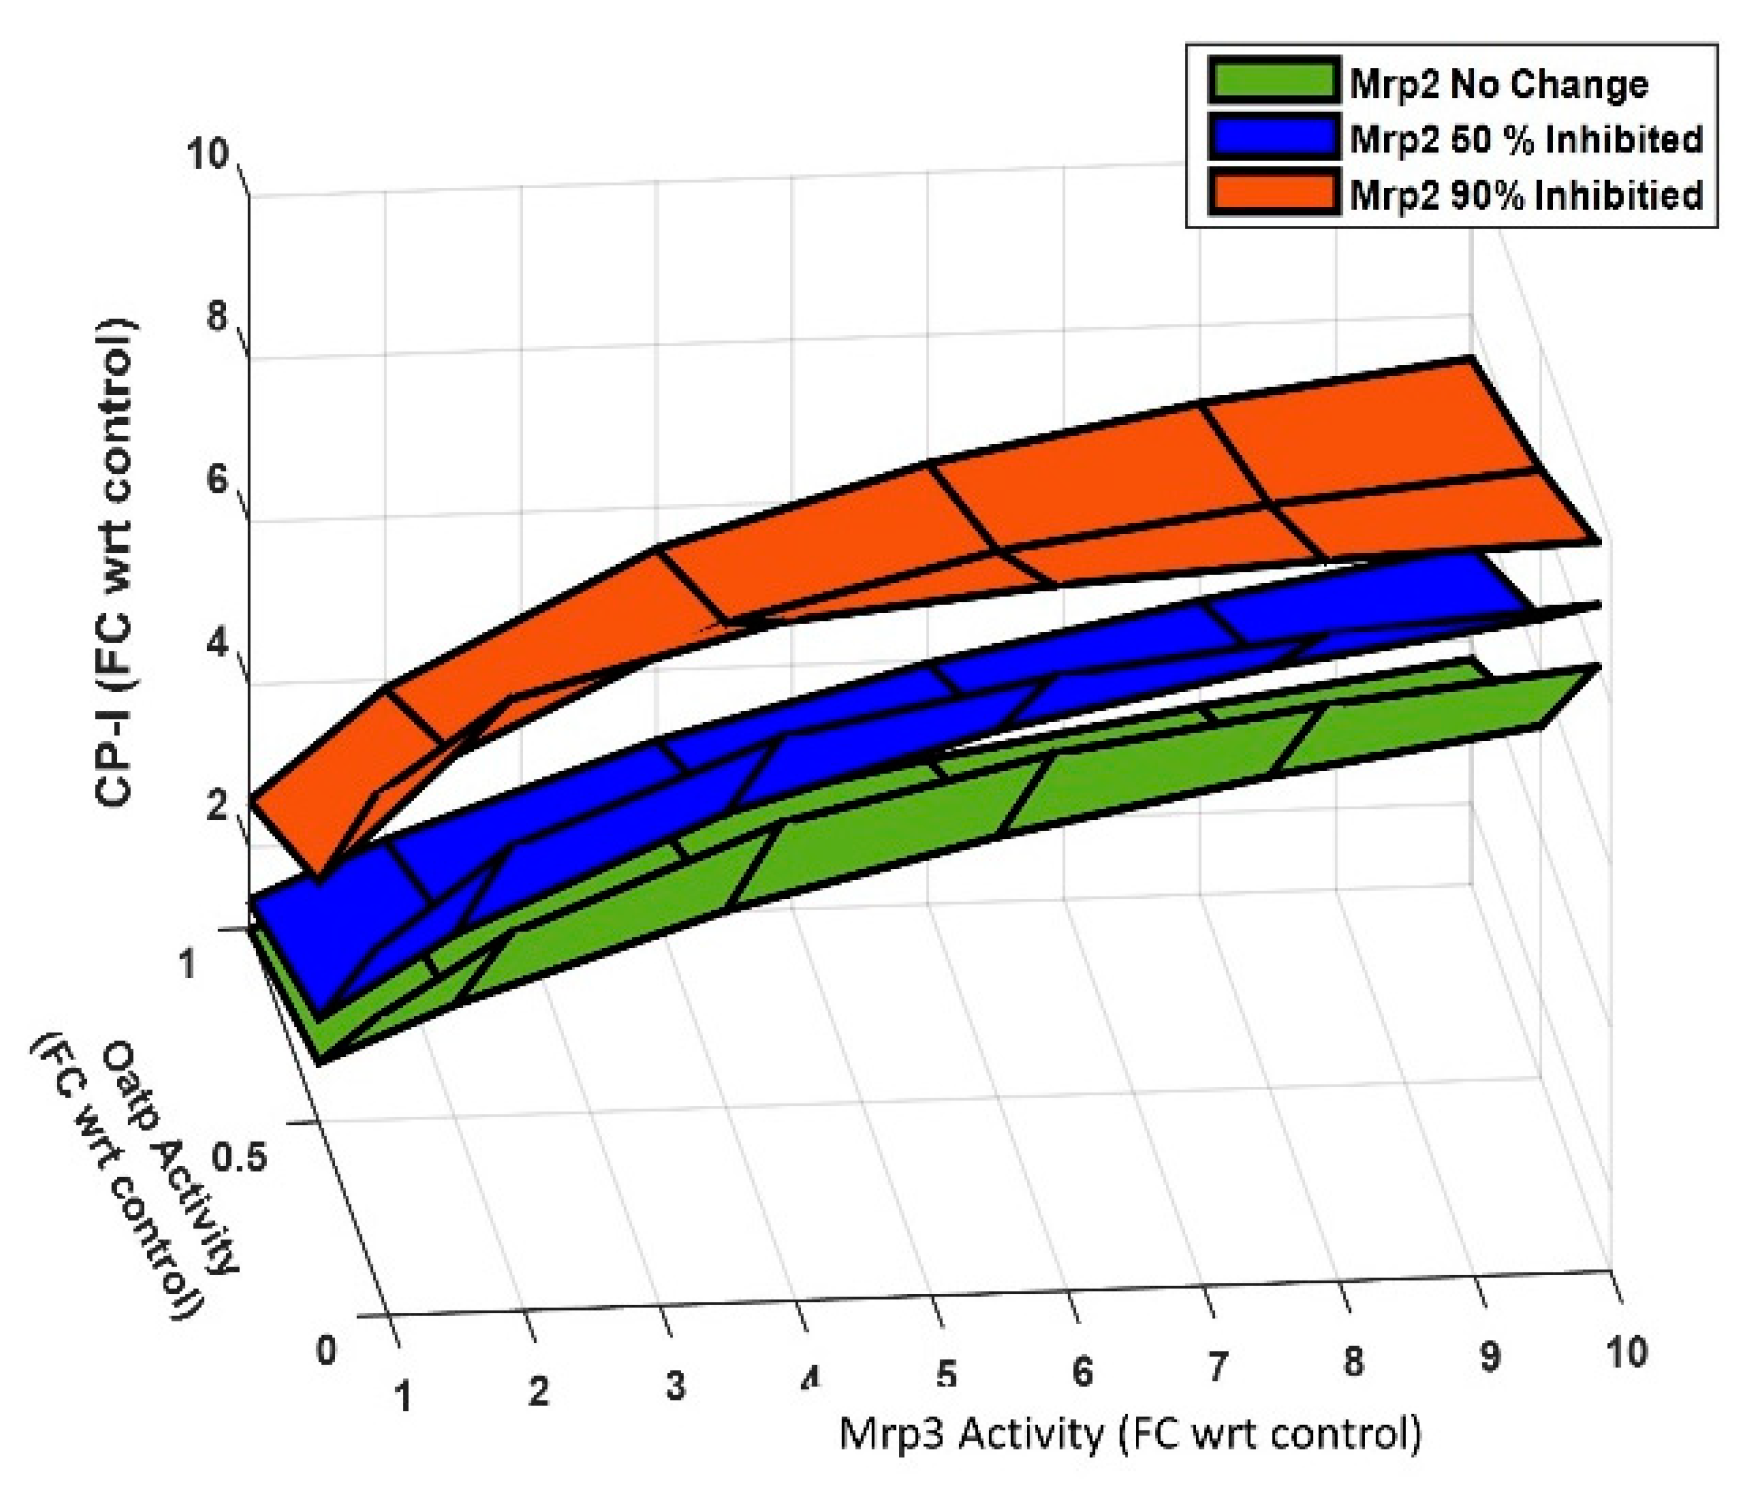
Figure 8.
Comparison of model simulated plasma CP-I and CP-III with observed data and simulated biliary secretion CP-I and CP-III. (A) Plasma CP-I, (B) CP-I urinary secretion, (C) Plasma CP-III, (D) CP-III urinary secretion. Symbols, continuous line represents simulated data. Experimental data [11] with error bars (mean ± SEM) represent observed data. CP-I, Coproporphyrin-I; CP-III, Coproporphyrin-III.
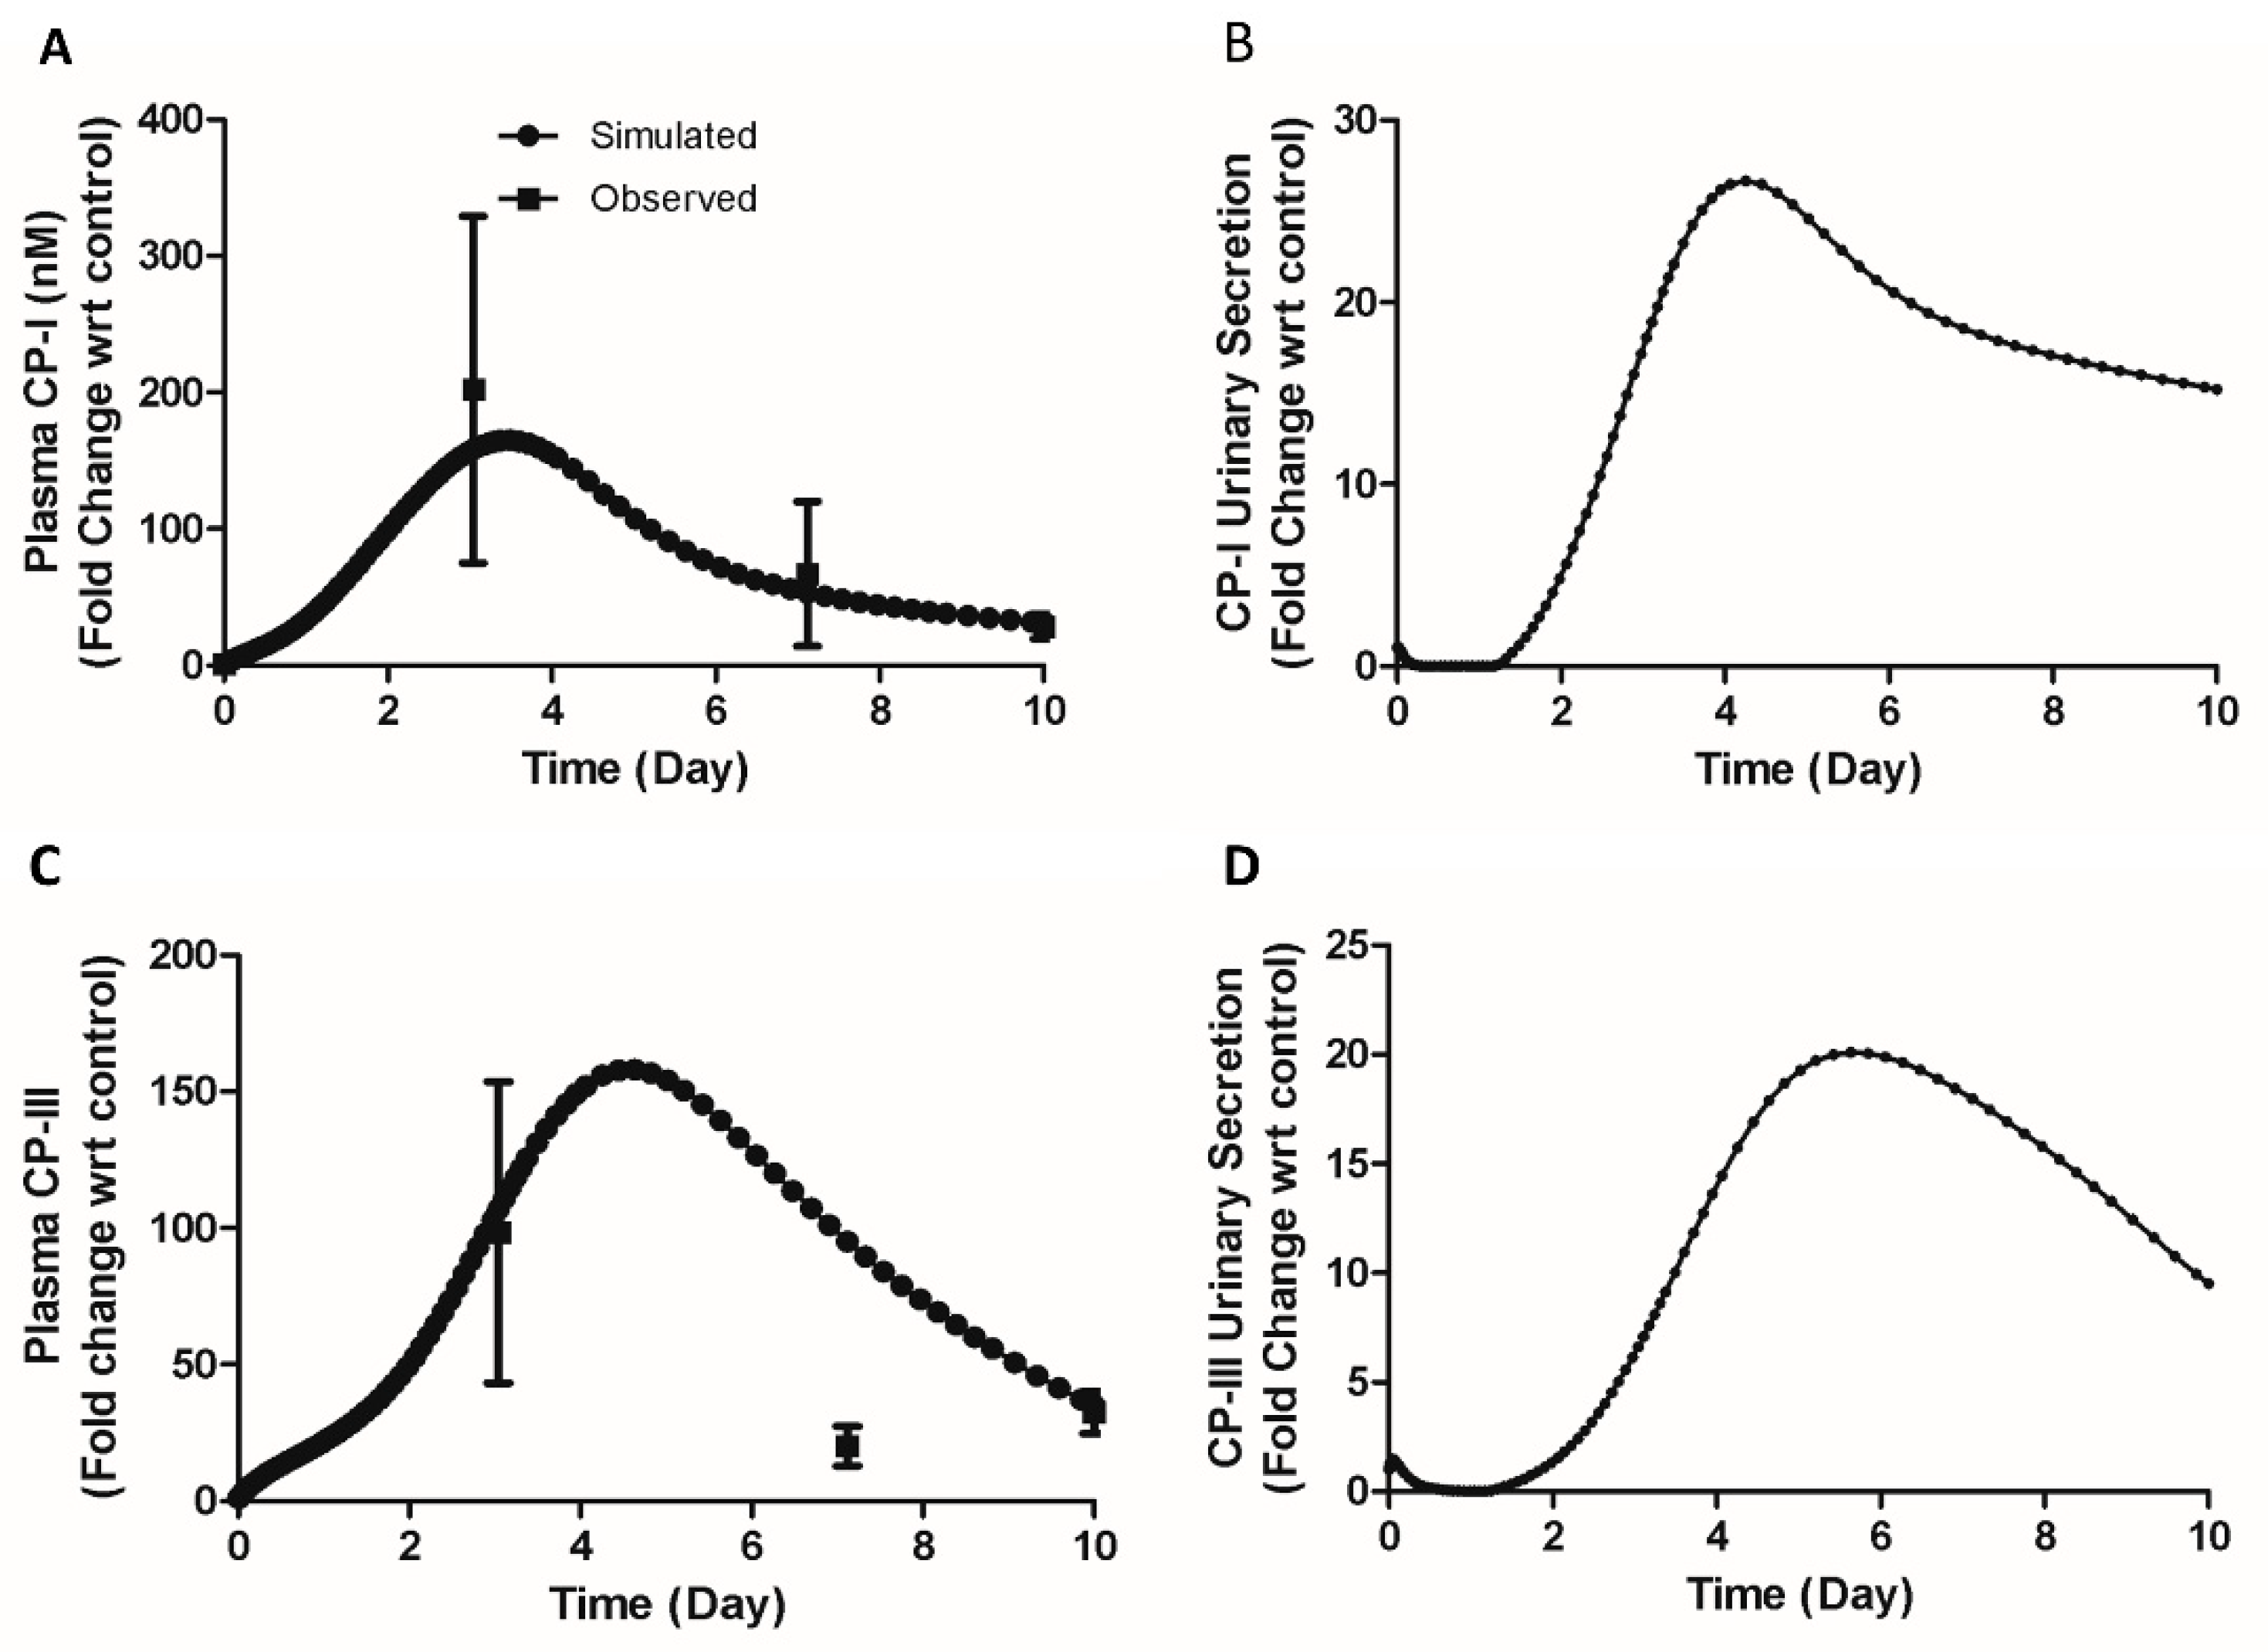
Figure 9.
Comparison of model simulated and observed data in TR- rats [33]. Simulation details are given the text. FC, fold change; CP-I, Coproporphyrin-I ; CP-III, Copropophyrin-III.
Figure 9.
Comparison of model simulated and observed data in TR- rats [33]. Simulation details are given the text. FC, fold change; CP-I, Coproporphyrin-I ; CP-III, Copropophyrin-III.


Table 1.
Key model parameters used in rat and mouse CP models.
| Parameter Name | Description | Value (Rat model) | Value (Mouse model) | Unit | Reference |
|---|---|---|---|---|---|
| km,Oatp,CP-I | Affinity constant of CP-I for Oatp | 1.66 | 1.66 | µM | [9] |
| km,Mrp2,CP-I | Affinity constant of CP-I for Mrp2 | 7.7 | 7.7 | µM | [10] |
| km,Mrp3,CP-I | Affinity constant of CP-I for Mrp3 | 3.75 | 3.75 | µM | [11] |
| km,Oatp,CP-III | Affinity constant of CP-III for Oatp | 2.44 | 2.44 | µM | [9] |
| km,Mrp2,CP-III | Affinity constant of CP-III for Mrp2 | 7.7 | 7.7 | µM | [10] |
| km,Mrp3,CP-III | Affinity constant of CP-III for Mrp3 | 3.75 | 3.75 | µM | [11] |
| vCP-I,Syn | CP-I extrahepaic synthesis rate | 0.166 | 0.0229 | nM/min | Computed |
| vCP-I,hepaticSyn | CP-I hepatic synthesis rate | 0.032 | 0.0077 | nM/min | Computed |
| vCP-III,Syn | CP-III extra hepatic Synthesis rate | 0.896 | 0.0785 | nM/min | Computed |
| vCP-III,hepaticSyn | CP-III hepatic synthesis rate | 0.175 | 0.0263 | nM/min | Computed |
| Liver volume | Volume of liver | 0.01 | 0.0018 | Litre | [34] |
| Plasma volume | Volume of plasma | 0.007 | 0.002 | Litre | [34] |
| Intestinal volume | Volume of intestine | 0.011 | 0.002 | Litre | [34] |
Table 2.
Model simulated steady states values in mice compared with observed result.
| Model Variables | Simulation | Observed [15] |
|---|---|---|
| Plasma CP-I (nM) | 0.14 | 0.14±0.02 |
| Plasma CP-III (nM) | 0.57 | 0.57±0.1 |
| Liver CP-I (nM) | 0.6 | NA |
| Liver CP-III (nM) | 1.57 | NA |
| Bile CP-I (nM) | 32 | NA |
| Bile CP-III (nM) | 43 | NA |
| CP-I urinary secretion (nmol/h/kg) | 0.012 | 0.0123±0.001 |
| CP-III urinary secretion (nmol/h/kg) | 0.034 | 0.034±0.006 |
Table 3.
Model simulated biliary excretion ratio (CP-III/CP-I) with intravenous infusion with same and different proportion of CP-I and CP-III .
Table 3.
Model simulated biliary excretion ratio (CP-III/CP-I) with intravenous infusion with same and different proportion of CP-I and CP-III .
| CP-I infusion rate (µg/h) | CP-III infusion rate (µg/h) | Simulation | Observed [31] |
|---|---|---|---|
| 60 | 60 | 2.5 | 2 |
| 30 | 60 | 1.5 | 1 |
| 60 | 30 | 4.6 | 4.2 |
Table 4.
Model simulation results of CP-I and CP-III disposition in Oatp KO mice; * Simulations done with increased hepatic CP-III synthesis.
Table 4.
Model simulation results of CP-I and CP-III disposition in Oatp KO mice; * Simulations done with increased hepatic CP-III synthesis.
| Model Variables | Simulation A | Simulation B* | Observed [15] |
|---|---|---|---|
| Plasma CP-I (nM) | 1.01 | 1.01 | 0.98±0.03 |
| Plasma CP-III (nM) | 5.30 | 8.84 | 8.76±0.92 |
| CP-I urinary secretion (nmol/h/kg) | 0.08 | 0.08 | 0.15±0.05 |
| CP-III urinary secretion (nmol/h/kg) | 0.25 | 0.43 | 0.61±0.17 |
Disclaimer/Publisher’s Note: The statements, opinions and data contained in all publications are solely those of the individual author(s) and contributor(s) and not of MDPI and/or the editor(s). MDPI and/or the editor(s) disclaim responsibility for any injury to people or property resulting from any ideas, methods, instructions or products referred to in the content. |
© 2023 by the authors. Licensee MDPI, Basel, Switzerland. This article is an open access article distributed under the terms and conditions of the Creative Commons Attribution (CC BY) license (https://creativecommons.org/licenses/by/4.0/).
Copyright: This open access article is published under a Creative Commons CC BY 4.0 license, which permit the free download, distribution, and reuse, provided that the author and preprint are cited in any reuse.


