
Submitted:
01 September 2023
Posted:
04 September 2023
You are already at the latest version
Abstract
It is expected that due to the new UE regulation focus on waste management, managing kitchen waste will become more important in the future, especially in households. It is, therefore, crucial to develop user-friendly and odor-free containers to store kitchen waste. The study aimed to test the effectiveness of compost biochar in reducing noxious odors and volatile organic compounds (VOCs) released during kitchen waste storage. Varying quantities of compost biochar (0%, 1%, 5%, and 10%) were added to food waste samples and incubated for seven days at 20℃. VOCs released were analyzed on days 1, 3, and 7 of the storage simulation process. The results indicated that adding 5-10% of composts’ biochar to kitchen waste significantly reduced emissions in 70% of detected VOCs compounds. Additionally, Compost's biochar can be used to eliminate potential odor components and specific dangerous VOCs such as ethylbenzene, o-xylene, acetic acid, and naphthalene. A new composts’ biochar with a unique composition was particularly effective in reducing VOCs and could be an excellent solution for eliminating odors in kitchen waste con-tainers.
Keywords:
VOCs
; kitchen waste
; waste storage
; compost biochar
1. Introduction
Kitchen waste is a group of biodegradable waste that includes peelings, fruit and vegetables leftovers, out-of-date food products as well as coffee grounds and tea leaves. The main problems of waste management in terms of kitchen waste management are the emission of odorous volatile organic compounds (VOCs), greenhouse gases like benzene, chloroethylene and styrene [1] and the presence of pathogenic microorganisms like Bacillus, Pseudomonas or Flavobacterium [2]. Quickly degradation of kitchen waste during home collection is caused by microorganisms through metabolic processes that contribute to the decomposition of organic matter and emission of odors. Short-term exposure to close proximity to a VOC emitter causes dizziness and headaches, nausea, and irritation of the skin and nose. Conversely, prolonged exposure to an emitter can increase the risk of cancer [3]. Substances emitted from the compost pile also contribute to environmental pollution and negatively affect natural ecosystems [4]. Due to the harmfulness of VOCs to the environment and human health (in extreme cases even life) [5] new solutions are being sought to help neutralise them. Current technologies that may contribute to preventing VOCs emissions in the future include membrane separation [6], thermal catalysis [7], non-thermal plasma [8] and adsorption [9]. Currently, there are also studies that test the effectiveness of combining methods such as plasma catalysis [10]. These are developing technologies, nevertheless, they can become a very useful tools for VOC removal due to their high efficiency. In some cases, the elimination of VOCs by the abovementioned methods reached up to 90%. Unfortunately, due to the lack of universality of these methods, the costs associated with the possibility of their use are very high.
Adsorption is one of the more common methods to remove VOCs due to its ease of use and low cost. The most popular adsorbent for harmful volatile substances is activated carbon, but more and more studies are emerging that also report the high effectiveness of biochar [11,12,13].
Duan researched the effectiveness of bamboo biochar addition to chicken manure compost on the degradation of volatile fatty acids. The study made it possible to observe a high correlation between adsorption of harmful substances and the physicochemical properties of biochar, such as porosity. The addition of biochar to the compost mass caused a reduction in the fatty acid content by converting acid fats into humic acids. Increasing the HA/FA proportion (which was 4.92) resulted in an accelerated humification process, faster stabilization of the compost and partial neutralization of odors [14]. Sánchez-Monedero and collaborators used oak biochar to test its effectiveness in the context of reducing VOCs emissions in chicken manure and straw compost. The results showed that the best effect of 10% biochar addition was observed in the thermophilic phase of the process. The study proved that biochar prevents the formation of anaerobic sites in the compost mass, which can be a source of VOC emissions [15].
The environmental conditions inside the pile may not always be favourable for the sorption of VOCs. Competition of water vapor and organic molecules for adsorption sites in biochar can lead to a reduction in the sorption capacity of the material. Hwang conducted a study on the potential of biochar to remove VOCs from swine faeces. Biochar from poultry litter, pig manure, oak and coconut shells (each substrate was pyrolysed at 350 °C and 500 °C) and activated carbon produced from coconut shells were used in the study. The results presented in the research showed that oak biochar pyrolysed at 350 °C revealed the highest sorption capacity but less than coconut shell activated carbon [16]. This suggests that the pyrolysis temperature has a significant effect on the sorption capacity of biochar. Awasthi studied the effect of biochar addition on volatile fatty compounds and odor release during composting of sewage sludge. The study shows that biochar can optimise the bulk density of the pile and its porosity, which has a positive effect on the abundance of microorganisms. Increasing the number of microorganisms like lactic acid bacteria resulted in an acceleration of the process and its intensification, which in turn enabled a faster stabilization of the process. As the organic matter decomposed, the number of microorganisms in the pile and the amount of volatile fatty acids (VFAs) emitted also decreased. Intensification of the process due to increased microbial activity especially in the thermophilic phase led to a reduction in the abundance of long-chain compounds such as valerian acid. The authors also observed a positive correlation between temperature and VOCs emissions and a negative correlation between temperature and VFAs emissions [17]. Czekała investigated the effect of adding biochar to poultry manure compost on temperature and carbon dioxide emissions during the process. It was observed that the addition of biochar increased the process temperature and shortened the thermophilic phase. In addition, increasing the process temperature was responsible for increasing the proportion of carbon dioxide emitted [18].
In each of the mentioned studies, a positive relationship was observed between the addition of biochar and compost parameters such as pH, temperature, aeration and bacterial count, which may not only help to control the composting process but also to effectively neutralize VOCs. The biochar added to the compost caused that in the piles not formed free of oxygen, which caused the onset of the adverse process of anaerobic digestion. Physicochemical properties of biochar such as porosity caused the pile was optimally aerated, which resulted in a balance of transformations in the compost. Owing to this, parameters such as pH, temperature and number of bacteria were stabilized which had a positive effect on the maturation of compost. The popularity of biochar has also influenced the emergence of research that leads to the improvement of the physicochemical properties of biochar for more efficient adsorption of VOCs. Zhang noted that ball milling of biochar with ammonia hydroxide or hydrogen peroxide improves the adsorption of phenyl VOCs. The study involving the modification of biochar improved, among other things, the volume of micropores responsible for the adsorption process in biochar and made the adsorbent more homogeneous. The larger volume of micropores promoted easier diffusion into the pores and transport of microparticles of some organic compounds such as benzene to the adsorption sites [19].
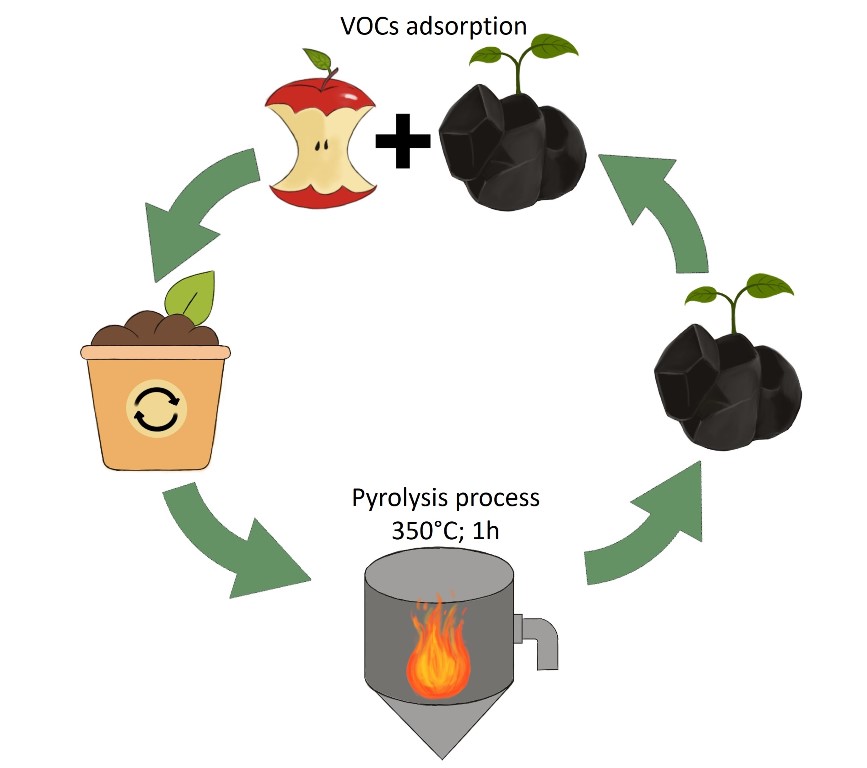
Due to the beneficial environmental impact determined by the sorption capacity and the preparation method, biochar can also be considered as part of a circular economy model [20,21]. Thermal conversion via the pyrolysis process helps to reduce the amount of waste [22]. Additionally, a by-product of the pyrolysis process is biochar, whose properties can contribute to the removal of harmful odor compounds from the air, but adsorption is not its only application. The presence of pores on the surface of biochar makes the material suitable for use in the manufacture of construction materials as a filler and cement replacer in cementitious materials [23]. The possibility of using biochar in agriculture as an additive to improve soil properties has also been observed, which can become an alternative to conventional fertilizers [24]. Biochar-based fertilizers are characterized by a slow release of micro and macro elements into the soil. The slower release of nutrients prevents the loss of valuable minerals [25]. In addition, biochar, due to its adsorption properties, can retain heavy metals present in the soil on its surface [26]. The specific properties of biochar and the possibilities of its use make it a part of sustainable agriculture [27].
This study aims to test the composts’ biochar properties and its ability of composts’ biochar to reduce the VOCs compounds and noxious odor released during kitchen waste storing. It is expected that due to the new UE regulation focus on waste management, managing kitchen waste will become more important in the future, especially in households. Therefore, it is essential to develop easy-to-use and odor-free containers for kitchen waste. Various measurements need to be followed to manage the respective malodorous emissions. The essence of the study is also to compare the physicochemical properties of biochar and to observe the relationship between the amount of inorganic matter that builds the structure of compost biochar and the VOCs adsorption capacity.
2. Materials and Methods
2.1. Materials
In the study, kitchen waste and compost biochar were used. A mixture of food waste was prepared with the following proportions according to (CESARO, BELGIORNO 2014):
- vegetable and fruit waste, 65% by weight,
- pasta, rice and bread waste, 20% by weight,
- meat and dairy waste, 15% by weight.
To obtain homogeneity, waste was ground in an electric mill (Bosch SmartPower 1500W), with a mesh diameter of 3.5 mm. Biochar from a home composter was prepared in laboratory muffle furnace (SNOL, model 8.1/1100, Utena, Lithuania). in retention time - 1h, temperature 350 ℃, heating rate of 50°C ∙ min-1. The CO2 was supplied into the chamber during the whole pyrolysis process to keep an inert atmosphere. After carbonization, the furnace was turned off and left to cool. For this study biochar was ground in a mill using a 1 mm sieve ground by knife mill through a screen of 1 mm. The material was stored in plastic containers at room temperature.
2.2. Experimental Procedure
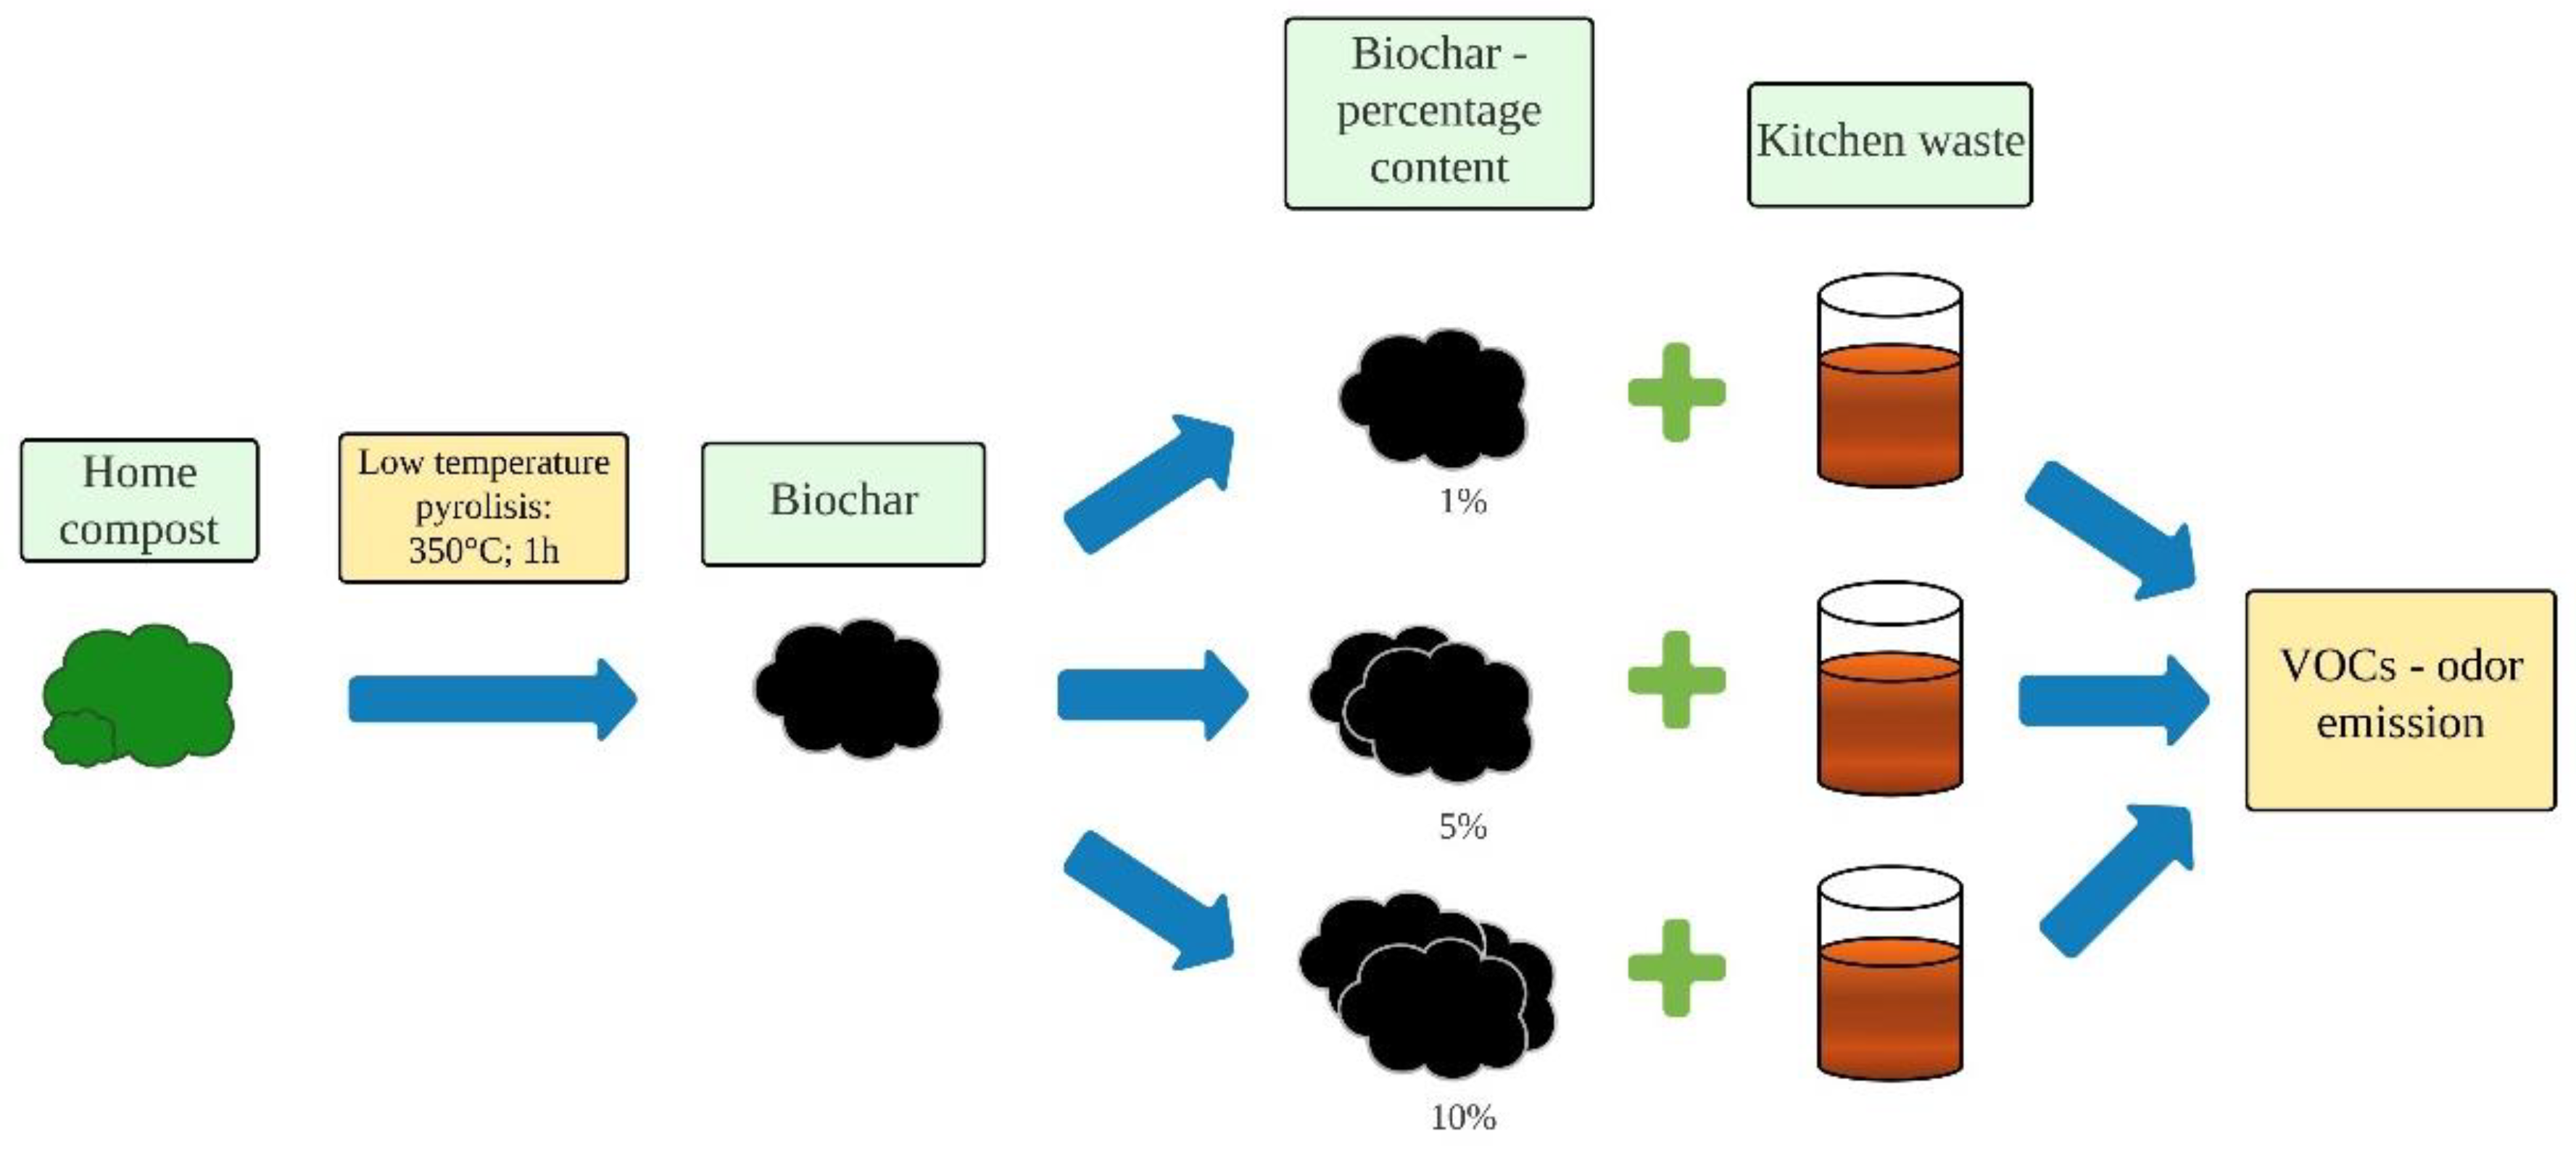
Experiments was provided in a small glass reactors, 100 ml volume, with approximately 50 g of food waste in each. The compost biochar was added to food waste samples 0%, 1%, 5% and 10% by wet basis. Reactors with material were incubated for 7 days at a temperature of 20 ℃ in laboratory incubator (POL-EKO-APARATURA, model ST 3 COMF, Wodzisław Śląski, Poland) – simulation of storage of food waste in households bins. Basic analyses were provided for each component and material. For each waste component (food waste and compost biochar) and in each reactor before and after the process basic analyses were provide included: pH, electrical conductivity (EC), moisture content (MC), and volatile solids (VS) content. Food waste and compost biochar were additionally subjected to FTIR and VOC analysis.
Figure 1.
Material with the addition of appropriate amounts of biochar from food waste, from the left side, concentrations: 0%, 1%, 5% and 10%.
Figure 1.
Material with the addition of appropriate amounts of biochar from food waste, from the left side, concentrations: 0%, 1%, 5% and 10%.
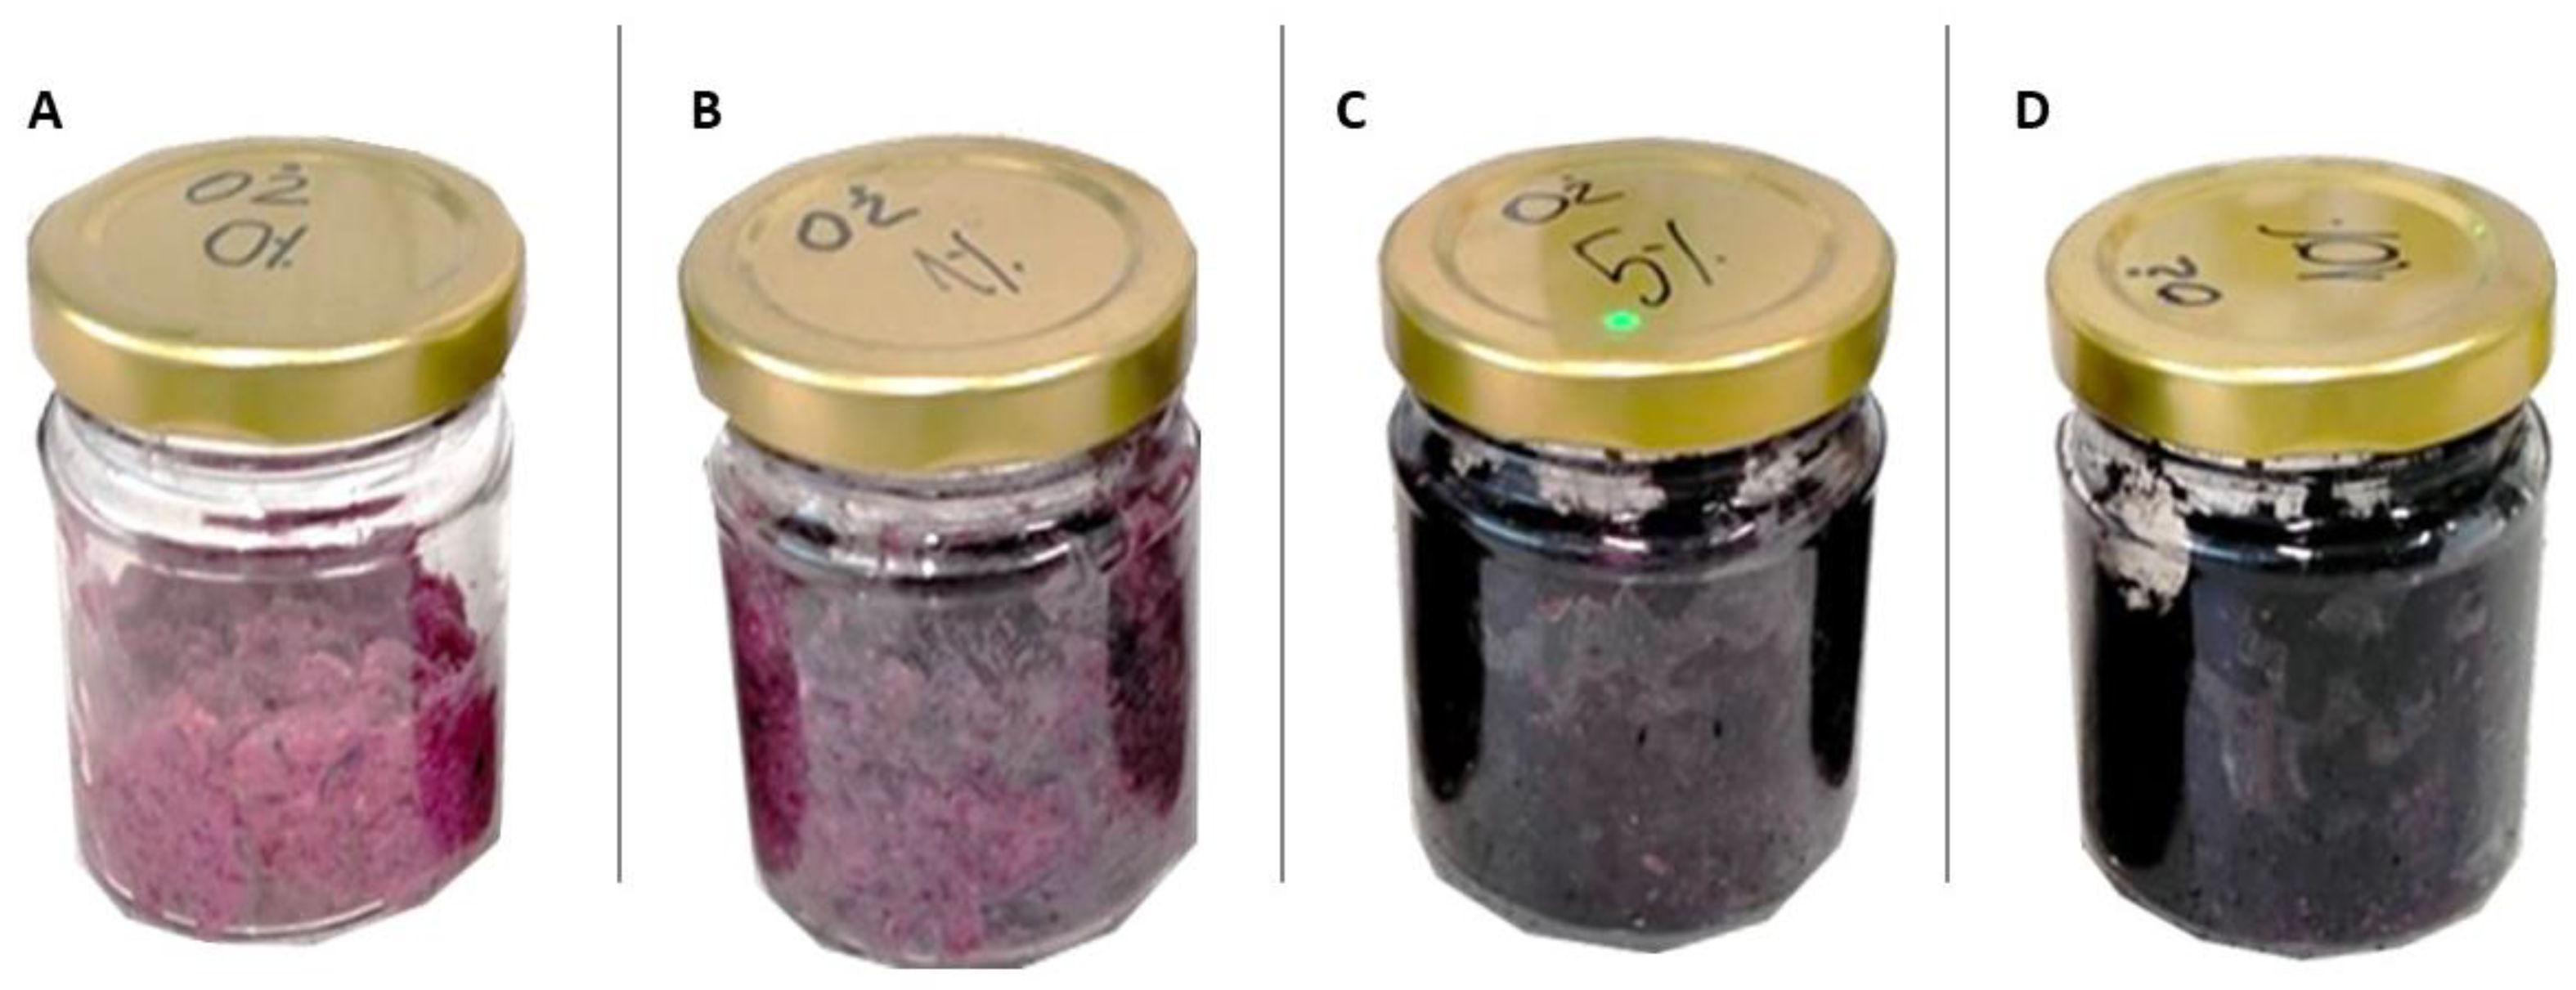
Figure 2.
Experiment design.
2.3. Methods
2.3.1. Materials Analysis
The moisture content (MC) was measured at a temperature of 105°C, using a laboratory dryer (WAMED, model KBC-65W, Warsaw, Poland). To determine the volatile solids (VS) content 550°C, 4 hours held, a laboratory muffle furnace (SNOL, model 8.1/1100, located in Utena, Lithuania) was used. Electrical conductivity (EC) and pH was determined in use pH-meter (Elmetron, CPC-411, Zabrze, Poland) in water solution 1:10 [1].
For augmented total reflection-Fourier transform infrared (ATR)-FTIR measurements a Nicolet iN10 integrated infrared microscope with Nicolet iZ10 external FT-IR module (Thermo Fischer Scientific, Waltham, Massachusetts, United States) was using a deuterated-triglycine sulfate (DTGS) detector and a diamond ATR module. For each spectrum 32 scans were averaged in the mid IR range of 400 - 4000 cm-1.
2.3.2. Sample Preparation for VOC Analysis
VOC analysis were performed on days 1, 3, and 7 of the storage simulation process. For VOC analysis ~0.5 g mixture of food waste and biochars and placed in 20 ml dark glass vials, sealed with a PTFE septum and with extruded aluminium caps. A 2 x 2 cm filter paper with 3 μg of 1 mg‧ml-1 caryophyllene was placed in each vial - facilitate the quantification of VOCs. The caryophyllene was placed on the paper filter, and not directly on the material, due to the possibility of absorbing it by biochar.
2.3.3. VOC Analysis - GC-MS, SPME Arrow Extraction
Gas chromatography-mass spectrometry (GC-MS) combined with solid phase microextraction in the gas phase (SPME Arrow) was used for separation, identification, and quantification of volatile organic compounds (VOC). VOCs was performed with Shimadzu GCMS QP 2020 Plus (Shimadzu, Kyoto, Japan) equipped with a ZB-5MSi capillary column (30 m × 0.25 mm × 0.25 µm; Phenomenex Ltd., USA, California).
GC operational conditions were as follows: injection port 50°C; temperature program started with 50°C held for 2 min, then at the of rate 3°C·min−1 to 180°C, then at the rate of 20°C·min−1 to 270°C, held for 5 min, 10 s; helium as carrier gas with flow 1 mL·min−1; split 100 (SPME Arrow analysis).
Extraction of VOCs was performed with 1.10 mm DVB/C-WR/PDMS SPME Arrow fiber (Supelco, Bellefonte, PA, USA). The extraction was performed in 20 mL headspace vials for 30 min at 45°C. The extraction proceeded with incubation for 10 min at the same temperature. The analytes were desorbed at the conditions of the GC injection port for 3 min. MS operational conditions were as follows: interface temperature 250°C; ion source temperature 250°C; scan 40–400 m/z.
2.4. Statistical Analysis
For statistical analysis, 13.3 Statistica software (TIBCO Software Inc., Palo Alto, CA, USA) was used.
For VOCs contribution statistical differences, one-way ANOVA was applied, including previous verification of normality and homogeneous variance by Levene’s test. For all relevant cases, standard deviation (SD) was applied.
3. Results and Discussion
3.1. Properties of Compost, Biochar and Kitchen Waste
The amounts of individual elements and heavy metals contained in the compost and in the biochar made from the compost were compared (Figure 3). For all elements, a slight increase in their content was observed in the biochar compared to the compost. The reason for the increase in the proportion of elements is the thermal transformation of the material. Subjecting the material to pyrolysis at 350°C for 1 hour concentrated the substances present in the material, thereby increasing the proportion of elements studied.
The amount of N in the compost was 0.73 % d.m.-1, while after the pyrolysis process, it increased to 1.19 % d.m.-1. The total content of P in the compost reached 0.47 % d.m.-1 while the biochar was characterized by a P content of 0.68 % d.m.-1. In the case of K, an increase in the share of this element was also evident. From a value of 1.7 % d.m.-1, K increased to 2.1 % d.m.-1. In a study that Phares conducted, the opposite trend was observed for N, P and K. The study showed that the amount of N in the compost was 2.2 mg·kg d.m.-1, while in the biochar it was 0.36 mg·kg d.m.-1. P in the compost reached 1.41 mg·kg d.m.-1, while in the biochar it was only 0.25 mg·kg d.m.-1. The same observation was made for K, where in the compost its value was also higher than in the biochar. For the compost, it was 1.8 mg·kg d.m.-1, and for the biochar it was 1.22 mg·kg d.m.-1. A potential reason for the differences in results could be the different material from which the biochar was made, as well as the temperature at which the pyrolysis was conducted and its length. The sample was pyrolyzed at 550°C for 4 hours [28]. On the other hand, a study conducted by Konak, which tested the effect of temperature on the physicochemical properties of the substrates, showed that biochar made at 300°C had the highest accumulation of nutrients. For each temperature, an increase in minerals relevant to soil application was observed [29]. The greatest difference between compost and biochar was observed for C, as it increased from a value of 9.21 % d.m.-1 to 18.03 % d.m.-1. On the other hand, Na before the pyrolysis process in compost was 4.45 mg·kg d.m.-1, while after thermal treatment of the sample it reached a value of 6.41 % d.m.-1. Mn increased slightly after the sample was subjected to the pyrolysis process, while its amount both before and after the process was insignificant. A Mn value of 0.26 % d.m.-1 was observed in the compost, while in the biochar this value increased to 0.34 % d.m.-1. As the amount of C increased in the biochar tested, the C/N parameter also increased. In the compost, its value was 12.69 (indicating complete humification of the material), after which it increased to 15.15.
Similarly to biologically useful elements, an increase in heavy metals such as As, Cu, Al, Ni, B, Cr and Pb was observed. Chemical analysis showed that the heavy metals with the highest amounts in the sample were Cu and Pb. The high values of these heavy metals indicate the use of pesticides during the cultivation of composted vegetables and fruits. Cu in the compost was 50.36 mg·kg d.m.-1, while in the biochar it was as high as 61.48 mg·kg d.m.-1. Pb for the compost reached a value of 85.95 mg·kg d.m.-1, while in the biochar it was 99.4 mg·kg d.m.-1. The elements with the smallest amounts were As and Al. For the compost, they obtained values of, respectively: 3.64 mg·kg d.m.-1, 5.05 mg·kg d.m.-1, and for biochar: 4.06 mg·kg d.m.-1, 7.28 mg·kg d.m.-1. Medyńska-Juraszek studied the effects of compost and biochar on changes in the mobility of heavy metal absorption by green leafy vegetables. Green waste from the city was used as the material used in the composting process, while the material for biochar was wheat straw, the material was subjected to a pyrolysis process at 550°C. In the case of compost, higher amounts of heavy metals were observed than in the case of biochar, which has to do with where the material was obtained. Composted green waste from urban areas is characterized by a high accumulation of toxic and undesirable elements in plant aids. The heavy metals with the highest concentration in the material were Cu and Pb and also Cr, whose values were 45.3 mg·kg d.m.-1, 24.3 mg·kg d.m.-1 and 19.0 mg·kg d.m.-1, respectively [30]. Addai studied the effects of biochar, compost and/or NPK fertilizer on the uptake of potentially toxic elements and promote yields of cultivated lettuce in an abandoned gold mine. The study used poultry manure compost and rice husk biochar made at 500°C for 3 hours. In the study, low values of individual heavy metals were observed in both the compost and the biochar. In addition, the heavy metals contained in the biochar had a lower proportion than in the composted material [31].
The physicochemical parameters of the kitchen waste were examined on days 1 and 7 of the process. On the first day of the process, the food waste was characterized by a moisture content of 80.05%, an organic dry matter content of about 95.53%, a pH of 4.92, and a conductivity of 2.05 mS‧cm-1. After 7 days, the material was again analyzed and the basic parameters were determined. A slight decrease in moisture content to 79.95% and an equally slight increase in organic dry matter content of 95.78% were observed. After 7 days, the acidity of the material increased as evidenced by a pH of 3.87. Conductivity also decreased and was 1.91 mS‧cm-1.
The physicochemical properties of the compost before the torrefaction process and the finished product, which was biochar, were also analyzed. The cation exchange capacity (CEC) was examined, the value of which in the compost was 143.28 cmol(+)‧kg-1. Biochar was characterized by a decrease in the value of CEC compared to the substrate subjected to torrefaction. CEC for biochar was 123.92 cmol(+)‧kg-1. The largest differences were observed for N-NO3. The proportion of ammonium ions for compost was 1322.03 mg‧kg-1 d.m., while for biochar it was 16.03 mg‧kg-1 d.m. N-NH4 for compost reached 125.85 mg‧kg-1 d.m., while for biochar it was 55.99 mg‧kg-1 d.m. Another parameter tested was the LOI, which was 34% d.m. in the compost, while a lower value of 19% d.m. was recorded in the biochar. The pH was also tested, which reached similar values for both materials. The hydrogen ion ratio in the compost reached a value of 7.09, while a slightly lower value of 6.92 was observed in the biochar. The water content in the compost was 40.20%, while in the torrefied material, the moisture content was only 1.71%. Electrolytic conductivity was examined only in biochar and was 2.88 mS‧cm-1.
Composts’ biochar was characterized by VOCs composition and emissions – 51 substances have been recognized (Supplementary material Table S1). The substance has been identified as potential hazards and described for their chemical characteristic like odor use in agriculture chemicals (Supplementary Materials Table S1). The emission of majority of VOCs components were very low < 50 µg∙kg-1 d.m., however, 23 identified substances are responsible for some hazards – cause health or/and environmental problems. This indicated emissions of these substances give information about special treatment during the storage of this biochar because they could be dangerous for health (e.g. Nonane; Octane, 3-methyl-; Decane, 3-methyl-) when they will be inhaled or swallowed. Some propositions for limitation of this threat could be the use of palletization, which can reduce even 80% of emissions [32]. However, this needs to be studied in a future studies for recognise the effect of palletization of biochar’s compost for sorption of VOCs compounds.
It needs to be highlighted that biochar’s compost has much less identified dangerous substance than other known biochars: municipal solid waste (>80 compounds);
On the other side, some substances are recognized as important in plant or microorganism metabolism (Octane, 2,3,6,7-tetramethyl-; decane, 2,3,5,8-tetramethyl-; decane, 3-ethyl-3-methyl-; tetradecane <n->), what could be a benefit when this will be used as an addition to soil or waste in composting process. The greatest risk connected with the use of this type of biochar is their storage and way of application. The substance with the biggest emission like bicyclo[2.1.1]hex-2-ene, 2-ethenyl-, 444.7 µg∙kg-1 d.m.; 1,3-cyclopentadiene, 5-(1-methylethylidene)-, 358.9 µg∙kg-1 d.m., azulene 208.1 µg∙kg-1 d.m., are not dangerous, or dangerous only with direct contact. This study confirms that these dangerous substances were not observed when biochar is applicable to food waste storage, which could be a result of bacterial metabolism (other substances were released) or a level of emission is below the GS-MS below the detection threshold (Supplementary material Table S2).

Table 1.
Quantification of the total amount and chemical families of the VOCs identified in kitchen waste during the coffering process (a) without the addition.
Table 1.
Quantification of the total amount and chemical families of the VOCs identified in kitchen waste during the coffering process (a) without the addition.
| Substrate | CEC, cmol(+)‧kg-1 | N-NH4, mg‧kg-1 d.m. | N-NO3, mg‧kg-1 d.m. | LOI, % d.m. | pH, - | Moisture, % | EC, mS‧cm-1 |
|---|---|---|---|---|---|---|---|
| Compost | 143.28 | 125.85 | 1322.03 | 34 | 7.09 | 1.71 | 2.88 |
| Biochar | 123.92 | 55.99 | 16.03 | 19 | 6.92 | 40.20 | n.d. |
| Kitchen waste | Day 1 | 4.92 | 80.05 | 2.05 | |||
| Day 7 | 3.87 | 79.95 | 1.91 | ||||
3.1.1. Infrared Spectroscopy Analysis of Compost and Biochar
Infrared spectroscopy was used to identify the functional groups present in the sample of compost and biochar produced from compost. Surface functional groups of compost and biochar are displayed in Figure 4. As can be observed, the FTIR of organic materials were different from others regarding the intensity and specific functionality.
At the compost predominance of the peaks or bands at 3350, 1600–1650 and 1110–1050 cm-1 was observed, which shows that composts were rich in aromatic, phenolic, aliphatic and polysaccharide structures. The samples’ spectra displayed the typical bands for compost characterization as were shown before by Majtaba and Silva. Band at 3320 cm-1 was associated with C-H bonds (Figure 4a). Two characteristic bands asymmetric (CH2) 2935 and symmetric (CH3) 2859 cm-1 were attributed to asymmetric and of the aliphatic functional group. The most remarkable change in FTIR with compost torrefaction is decrease in the C–H and O– H bands in the region of 2800 – 3600 cm-1 [33,34]. These bands were barely visible in the biochar spectra (Figure 4b).
The aromatic carbon (C=C) vibration and carboxyl (C=O) stretching were found at 1636 cm−1 in compost, which was visible also in fruits vegetables waste [33], this confirm that compost was mainly produced from food waste. This peak was diminished in biochar (Figure 4). C-H bending of the carbonyl functional group peak was detected in compost at 1417 cm−1, while greater intensity of the C-H binding was observed in biochar. The representative transmittance of aromatic CO- or phenolic-OH stretching vibration detected at around 1317 cm−1 was observed in biochar but was not noticeable in biochar. Band around 1020 cm-1 could be attributed to the combination of C-O stretching of polysaccharides, as well as Si-O-Si bonds of silica and the group Si-O-C, according to Rueda both in compost and biochar [35]. The high transmittance of aromatic C-H stretching associated at 870 cm−1 was observed in biochar, whereas barely visible in compost . Furthermore, a certain decrease and changes in the shape of the carbohydrate bands in the region 950 – 1200 cm-1 are observed in biochar. Some changes in the organic matter composition can be hidden by the overlap with mineral phases (mainly calcium carbonate and silicates).
Rueda suggests that the thermal treatments at different temperatures lead to an evident variation in the organic matter structure of the organic amendments, especially in the case of immature compost [35].
3.2. VOCs Emissions during Kitchen Waste Incubation at 20°C
The results of individual compounds emitted from food waste obtained from GC-MS analysis were grouped according to basic chemical groups (Figure 5). A total of 87 compounds were identified, including 17 alcohols and phenols, 7 ketones and aldehydes, 29 o-compounds (esters, acids, furans), 4 sulfates, 12 terpenes and terpenoids, 9 aromatic compounds, and 9 unidentified compounds. Some of these families (alcohols, ketones, aliphatic hydrocarbons, nitride molecules and sulphide molecules) are extensively degraded during the biological process and detected only in the first stages of composting [36].
O-compounds were the dominant group of compounds highlighted in the study, especially for the control sample, reaching 32.0%-77.7% of the total percentage of identified chemical compounds. Volatile organic compounds (VOCs) may arise from the decomposition of fruit and kitchen waste, as well as from reactions between alcohols and carboxylic acids [37]. The addition of biochar resulted in a decrease in the percentage of these compounds especially on the seventh day of testing in each of the samples, while the greatest changes were observed at doses of 5% and 10%. Sánchez-García also observed the use of biochar reduced generation of VOC and particularly oxygenated volatile compounds, typically generated during a deficient aerobic degradation. Biochar addition improved the physical properties of the material, preventing the formation of clumps larger than can be inductive to anaerobic conditions in the pile. This effect may explain effectiveness of biochar in reducing O-compounds [38].
As the proportion of O-compounds decreased, an increase was observed in the proportion of alcohols and phenols, which were the second most abundant chemical group. Higher doses of biocarbon were observed to increase alcohol emissions, which were 59.8% on the seventh day for the 5% biocarbon addition and 59.5% in the sample with 10% biocarbon addition. During early stages of organic decomposition, alcohol is typically produced through anaerobic or poorly aerobic processes [39,40], especially when oxygen could be alimiting factor due to the high microbial activity [41]. The study was conducted under oxygen-limited conditions as could be observed during kitchen waste collections, so especially the lower layers of material in the reactors could undergo methane fermentation, resulting in the generation of alcoholic compounds. VOCs from decomposing fruit and kitchen waste, along with the reactions that occur between alcohols and carboxylic acids. The observation of semi-aerobic conditions is also evidenced by the presence of valeric acid, typical of the methane fermentation process (Supplementary materials Table S2) [42]. Biochar creates an optimal environment for microorganisms, which accelerates colony growth even in a fermentation process [43]. The phenols present in the study may have come from meat waste, as they are formed by the metabolism of aminoacids [44]. Scaglia confirmed that the main part of alcohols is emitted during the first biostabilization stage, when oxygen could be a limiting factor due to the high microbial activity [41]. Indeed, in the present study, alcohols were emitted strongly with addition of biochar what can be an affect of stimulate activities of specific microbes that can excrete functional enzymes affect microbial activity through altering physico-chemical properties like increasing pH and C/N and facilitate kitchen waste degradation [45].
The third most abundant group was aromatic compounds. A decrease in their percentage over time was observed in the control sample, while the addition of biochar caused inhibition of this decrease. The aromatic compounds present among the identified chemical groups were most likely derived from vegetables and fruits, whose share in food waste was significant. These compounds are produced from the microbial degradation of organic plant matter or bulking agents during composting [46].
A large reduction was observed for ketones and aldehydes, as well as terpenes and terpenoids which have been described as the main compounds and responsible for odorous pollution. Is clearly visible that addition of biochar effect positively on amount of terpenes and terpenoids and unpleasant odors during storage of the kitchen waste. The presence of ketones and aldehydes together with sulfides indicates incomplete aerobic decomposition of organic matter [44]; terpenes are more related to the presence of vegetable food they are present in peels, fleshes, oils, and juices of citrus fruits [36].
Conditions of incomplete aerobic decomposition are particularly conducive to the accumulation of sulfides, which were most likely present especially in lower parts of the material in reactors due to the lack of or low availability of oxygen. For the terpenes and terpenoids group, the compound with the highest proportion was limonene, which is usually one of the main terpenes detected in kitchen waste [47,48,49].
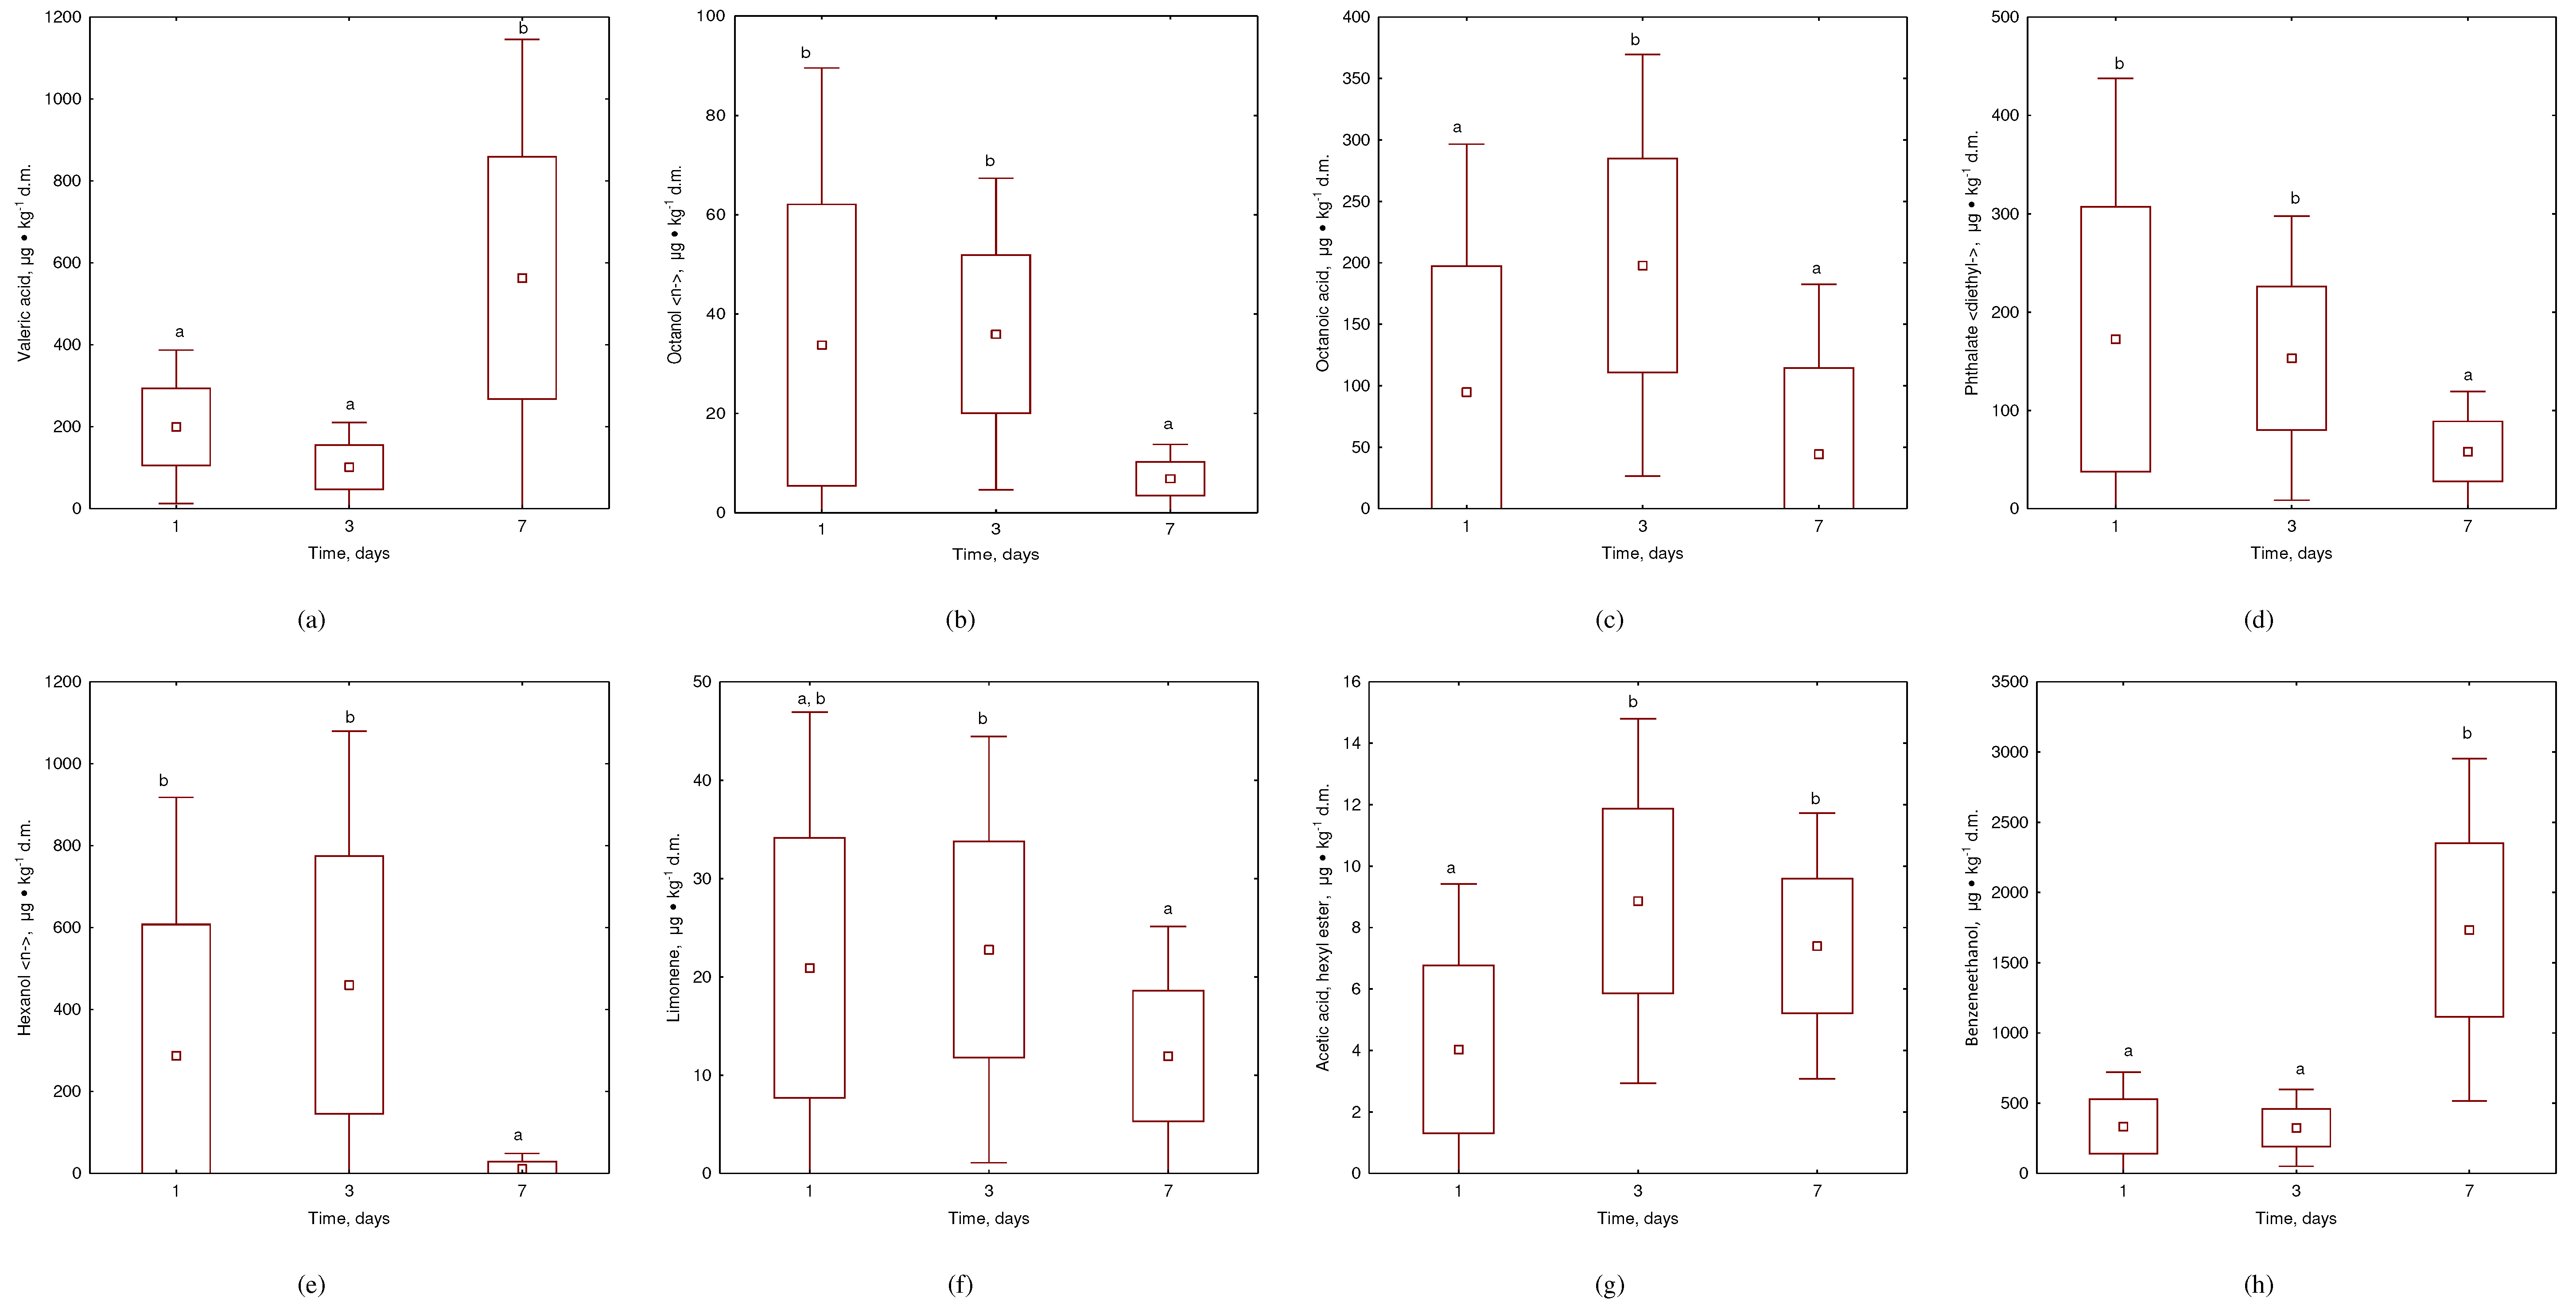
It is crucial for users of kitchen waste bins to have easy-to-use and odor-free containers. Hence, both pleasant and unpleasant odors were observed and recorded (Figure 6 and Figure 7; Supplementary Materials Tables S1 and S2). The study made it possible to analyze the emissions of VOCs compounds with the highest mass share produced over 7 days for the control sample and individual biochar doses addition. A total of 58 compounds were identified in kitchen waste air without added biochar, while 72 compounds were identified in kitchen waste air with added biochar (22 compounds were responsible for pleasant odors, while 10 for unpleasant). Valeric acid, octanol <n->, octanoic acid, and phthalate <diethyl-> (Figure 6 and Figure 7) represented the most typical unpleasant odors during kitchen waste storage [50]. Butyric acid, hexanoic acid, and camphor were observed only in untreated waste, while caproic acid, cresol<meta->, and caprylonitrile (only with biochar addition) were also noted (Supplementary Materials Table S3). The results of the current study are in agreement with the emissions measured before in composting plants where alkanes (Decane, Undecane, Tetradecane) (ethanol), esters (Acetic acid, methyl ester; Hexanoic acid, methyl ester; Octanoic acid, methyl ester), alcohols (1-Octanol), terpenes (Alpha-pinene; limonene; Delta.3-carene), furans (Furan, 2-pentyl) were presented [51].
Valeric acid had no statistically significant effect from biochar addition, but its emission share increased over time, especially with 5% and 10% biochar doses (Figure 7a). Octanol <n-> (Figure 6b) emissions in the control sample decreased over time. Biochar doses levelled the mass share of octanol on the first day, which was not observed in the untreated sample (Figure 7b). Biochar doses were not a significant factor in the reduction of emissions of octanoic acid (Figure 6c). Phthalate <diethyl-> was reduced significantly, especially with 5% biochar addition, while 1% biochar dose increased its emission values (Figure 6c,d). All doses showed a statistically significant reduction in octanoic acid and phthalate <diethyl-> emissions compared to the control sample. It was observed that the largest unpleasant odors had lower emissions at the end of storage than the first day (Figure 7a,b,c,d). Butyric acid, hexanoic acid, and camphor were only observed in untreated samples and were eliminated with biochar addition. Caproic acid increased during storage, but larger biochar doses limited its emission to a minimum (46.1 μg∙kg-1 d.m after 7 days of storage with 10% biochar addition). Other unpleasant odors (cresol<meta-> and caprylonitrile) were released in small doses of no more than 15 μg∙kg-1 d.m (Appendix A Table A1). Nevertheless, the perception of malodorous substances should not be seen as a result of a single component but as a synergy or antagonism between compounds [51].
The proportion of pleasant VOCs were also changeable during the storage of kitchen waste. By analyzing hexanol <n-> (odor of freshly mown grass, Figure 6e) emissions in kitchen waste, it was observed that low doses of biochar were particularly reducing emissions %. Addition of biochar statistically decreased the level of this VOCs component (Figure 6e). A dose of 1% enabled almost complete reduction of hexanol <n-> emissions in the test sample on each test day. Another compound analyzed was acetic acid, hexyl ester (mild sweet odor, Figure 6f), whose emissions increased especially on the third day of the study (Figure 7f). In the case of this compound, it was not observed that the dose of biochar had a particular effect on emission reduction, while the mass share of this compound decreased during the process (Figure 6f). Limonene is not considered a bad odorant, however, it may play an important role in the perception of waste odor in combination with certain microbial volatiles [51]. These emissions in the sample with biochar addition also showed a decreasing trend (Figure 6g). The emission reduction was best influenced by the 1% and 5% doses. The 10% dose initially showed a significant reduction in limonene emissions, while on the seventh day, the mass share of the compound increased (Supplementary material Table S3). An inverse relationship was observed for benzeneethanol emissions (Figure 6h), as emission reductions occurred only in the sample where biochar was applied at a dose of 1%. The other biochar led to a marked increase in emissions of the chemical compound, however no statistical differences were observed (Figure 6h). During the storage of kitchen waste a level of the content of limonene and hexanol <n-> were decreased while the benzeneethanol and acetic acid, hexyl ester were statistically increased. At the same time, other pleasant odors where released with the addition of biochar like benzene <ethyl->, isoamyl acetate, o-xylene, heptan-2-ol, pseudocumene, caprylic acid, naphthalene, octanoic acid, ethyl ester (Supplementary Materials, Table S3), and only 5 others VOCs were missed where biochar was added: octanal <n->, nonanal <n->; octanoic acid; decanal <n->; dodecanol. As used biochar was successfully used for the elimination of the potential odors components, it needs to be highlighted that it could be dedicated also for sorption of specific dangerous VOCs such ethylbenzene, o-xylene, acetic acid and naphthalene as were observed in others studies with biochar [16,50]. All of these statements proved that the addition of composts’ biochar has a positive effect for reduce unpleasant odors during the long storage of kitchen waste.
On the other hand, excess exposure to some VOCs may cause mild or serious health problems, as indicatively shown in Supplementary Materials Tables S1 and S2. Eleven VOCs compounds were categorised as potential agricultural chemicals, which could influence of the final results of biochar addition. Those chemicals molecules could distract the metabolism of microorganisms in effective elimination of unpleasant odors. Some of those chemicals are natural components of plants and finally kitchen waste (e.g. limonene, 1-octen-3-ol), but others (e.g. naphthalene, guaiacol), could be an effect of used pesticides in agriculture.
Authors usually emphasize the role of the high sorption capacity of biochar in a mechanism for VOC removal. However, biochar can get quickly saturated when wide range of VOC and concentrations are generated [16], limiting its contribution to VOC removal. The environmental conditions, characterized by high moisture, temperature and organic matter content, may not be optimal for the sorption of VOC on biochar surface, limiting its sorption capacity. Especially the high temperatures, such as those typically registered in composting, are known to decrease sorption efficiency [52]. In this study the composts’ biochar where used at 20°C, what could benefit in better VOC sorption, observed during the experiment. Although used biochar is also not typical, as tested before by other authors – contained only 20% of organic matter (Table 1), while others tested >90%. Zhang also emphasized the role of noncarbonized organic matter content, which in composts biochar could explain the high potential of this biochar for VOC sorption - large share of the mineral fraction, especially for biochars produced as low pyrolysis [52]. Additionally, they proved that biochars produced at low temperatures (300 °C), have the bigger sorption capacity for acetone, cyclohexane and toluene adsorption. Others authors listed a presence of surface chemical functional group as source of VOCs adsorption control [52]. As identified through ATR-FTIR analysis (Figure 4), the following possible groups common basic functional groups responsible for VOCs adsorptions were identified in composts’ biochar: carbonyl (C=O, peak 1560); quinones (C-H, peak 1580-1620); pyrrole (N-H:1480-1560, C-N 1190), pyridinium (N-H, peak 1480,1560), pyridine-N-oxide (N-O, peak 1000-1300). The possible presence of those groups also could indicate the effectiveness of composts; biochar. Another possible hypothesis for an explanation of the positive effect of biochar addition is stimulation of microorganism metabolism responsible for biodegradation when biochar is added to food waste. Almost 25% of the observed VOCs compounds have a role in metabolism of plants, microorganisms and humans (e.g. hexanoic acid, methyl ester; benzenemethanol; Supplementary Materials, Table S2). This could explain the positive effect of biochar on observed VOCs emission.
4. Conclusions
The Composts’ biochar is a novel form of biochar with a unique composition. Pre-liminary research has been conducted on the impact of Composts' biochar on volatile organic compound (VOC) emissions during kitchen waste storage, which yielded the following results:
- Addition of Composts' biochar to kitchen waste demonstrated significant VOC removal, with over 70% reduction in VOC emissions when 5-10% biochar was added.
- The most effective reduction was observed for unpleasant odors such as hexa-nol <-n> acetic acid, hexyl ester, and diethyl-phthalate, while no effect was ob-served for pleasant odors such as octanol <n->, limonene, octanoic acid, and benzeneethanol.
- The high mineral fraction content of Composts' biochar suggests that VOC gaseous sorption was controlled more by noncarbonized organic matter con-tent than physical adsorption.
- 25% of detected VOC compounds play a role in plant, microorganism, and human metabolism, what suggests that Composts' biochar has a positive im-pact on overall metabolism and accelerates biodegradation.
As biochar was successfully used for the elimination of the potential odors com-ponents, it needs to be highlighted that it could be dedicated also to sorption of specific dangerous VOCs such ethylbenzene, o-xylene, acetic acid and naphthalene as were observed in others studies with biochar.
Raw biochar contains only a few hazardous compounds, posing a low risk of ex-posure. Thus, it presents an excellent opportunity for odor elimination in kitchen waste containers. Furthermore, producing biochar from compost presents a promising op-portunity for local bioeconomy development. The production of this type of biochar can help eliminate odors in future processing, such as composting (compost + Com-posts’ biochar + kitchen waste + Composts' biochar + composting of kitchen waste + Composts’ biochar).
Supplementary Materials
The following supporting information can be downloaded at the website of this paper posted on Preprints.org, Table S1: Information regarding the emissions and hazards of VOCs emitted from produced composts' biochar and relevant details about identified substances (based on National Library of Medicine); Table S2: Information regarding the hazards of VOCs emitted during storage of kitchen waste with and without composted biochar addition and relevant details about identified substances (based on National Library of Medicine). Table A1 displays the measured emission levels of identified compounds.
Author Contributions
Conceptualization, S.S-D; methodology, S.S-D. and J.Ł; software, J.Ł.; validation, S.S-D. and J.R.; formal analysis, S.S-D. and J.R.; investigation, S.S-D.; resources, S.S-D.; data curation, S.S-D., Ł.M. and J.Ł.; writing—original draft preparation, S.S-D. and J.R; writ-ing—review and editing, S.S-D. and J.R.; visualization, S.S-D. and J.R.; supervision, S.S-D.; project administration, S.S-D.; funding acquisition, S.S-D. All authors have read and agreed to the pub-lished version of the manuscript. Please turn to the CRediT taxonomy for the term explanation. Authorship must be limited to those who have contributed substantially to the work reported.
Funding
The research is financed/co-financed under the Leading Research Groups support project from the subsidy increased for the period 2020–2025 in the amount of 2% of the subsidy referred to Art. 387 (3) of the Law of 20 July 2018 on Higher Education and Science, obtained in 2019.
Institutional Review Board Statement
Not applicable.
Informed Consent Statement
Not applicable.
Data Availability Statement
We encourage all authors of articles published in MDPI journals to share their research data. In this section, please provide details regarding where data supporting reported results can be found, including links to publicly archived datasets analyzed or generated during the study. Where no new data were created, or where data is unavailable due to privacy or ethical restrictions, a statement is still required. Suggested Data Availability Statements are available in section “MDPI Research Data Policies” at https://www.mdpi.com/ethics.
Conflicts of Interest
The authors declare no conflict of interest.
Appendix A
Table A1.
VOCs mean emissions, µg∙g-1 d.m. during stored the kitchen waste in 20°C, the effect of time and compost biochar doses.
Table A1.
VOCs mean emissions, µg∙g-1 d.m. during stored the kitchen waste in 20°C, the effect of time and compost biochar doses.
| No. | Biochar dose, % | 0 | 1 | 5 | 10 | ||||||||
|---|---|---|---|---|---|---|---|---|---|---|---|---|---|
| Day of the store | 1 | 3 | 7 | 1 | 3 | 7 | 1 | 3 | 7 | 1 | 3 | 7 | |
| 1 | Butyric acid | 157.2 | 146.9 | 194.9 | |||||||||
| 2 | unknown | 48.3 | 13.9 | 158.7 | 386.4 | 16.5 | 75.1 | 493.6 | 156.8 | 168.9 | 708.7 | 446.7 | 248.7 |
| 3 | Valeric acid | 172.8 | 51.1 | 765.3 | 296.1 | 145.3 | 853.3 | 243.6 | 91.9 | 349.6 | 86.1 | 116.3 | 283.7 |
| 4 | 3-Hexen-1-ol, (3Z)- | 32.1 | 15.1 | 366.8 | 21.9 | 9.1 | 536.4 | 36.8 | 7.0 | 96.7 | 0.0 | 7.2 | 0.0 |
| 5 | 2-Hexen-1-ol, (E)- | 18.3 | 793.9 | 5.7 | |||||||||
| 6 | Hexanol <n-> | 799.7 | 805.9 | 5.3 | 220.4 | 993.1 | 21.2 | 194.0 | 637.7 | 38.8 | 138.4 | 383.7 | 37.2 |
| 7 | unknown acid | 18.0 | 46.5 | 75.5 | 25.3 | 51.3 | 49.6 | 41.7 | 69.7 | 19.4 | |||
| 8 | unknown | 299.9 | 18.5 | 10.0 | |||||||||
| 9 | n-Butyl ethe | 16.5 | 4.1 | 1.9 | |||||||||
| 10 | Methyl allyl disulfide | 7.5 | 6.0 | 0.8 | |||||||||
| 11 | Hexanoic acid, methyl ester | 28.4 | 40.3 | 15.5 | |||||||||
| 12 | Disulfide <methyl-, propyl-> | 3.1 | 3.6 | 0.9 | |||||||||
| 13 | Pinene <alpha-> | 9.2 | 4.1 | 1.9 | 2.9 | 3.5 | 1.1 | 3.9 | 2.4 | 2.9 | 5.9 | 4.5 | 5.5 |
| 14 | 2-Propanol, 1-butoxy- | 4.3 | 2.7 | 0.8 | |||||||||
| 15 | Benzaldehyde | 50.5 | 36.0 | 1.4 | 30.5 | 32.4 | 3.2 | 77.6 | 42.7 | 8.1 | 88.3 | 87.6 | 17.3 |
| 16 | 2-Hepten-1-ol, (2E)- | 25.6 | 21.9 | 14.1 | |||||||||
| 17 | Heptanol <n-> | 38.7 | 27.5 | 23.9 | 7.9 | 28.1 | 4.9 | 6.8 | 17.3 | 10.9 | 4.0 | 10.7 | 7.0 |
| 18 | Hexanoic acid | 310.0 | 342.5 | 337.7 | |||||||||
| 19 | Furan <2-pentyl-> | 31.1 | 44.0 | 18.3 | 16.7 | 77.7 | 109.3 | 9.9 | 89.5 | 41.3 | 9.5 | 62.0 | 28.7 |
| 20 | Hept-5-en-2-ol <6-methyl-> | 11.7 | 0.0 | 3.6 | 17.2 | 6.4 | 0.0 | 8.8 | 0.0 | 2.0 | 0.0 | 6.0 | 0.0 |
| 21 | 3-Octanol | 65.4 | 0.0 | 4.0 | 8.4 | 7.8 | 7.4 | 10.0 | 0.0 | 12.9 | 0.0 | 2.8 | 10.0 |
| 22 | Octanal <n-> | 41.6 | 33.3 | 11.6 | |||||||||
| 23 | Carene <delta-3-> | 21.2 | 10.9 | 4.0 | 6.4 | 4.8 | 2.1 | 7.7 | 6.8 | 3.3 | 8.9 | 8.4 | 5.2 |
| 24 | Acetic acid, hexyl ester | 7.2 | 8.8 | 8.0 | 4.8 | 13.1 | 7.1 | 2.3 | 8.3 | 8.3 | 5.6 | 5.3 | 6.3 |
| 25 | Limonene | 41.9 | 33.6 | 13.7 | 16.1 | 28.8 | 6.1 | 14.4 | 16.7 | 11.7 | 11.2 | 12.0 | 16.1 |
| 26 | Hexanol <2-ethyl-> | 45.9 | 11.2 | 5.6 | 16.5 | 13.6 | 1.6 | 16.9 | 6.7 | 8.0 | 21.3 | 7.3 | 17.1 |
| 27 | Benzenemethanol | 30.7 | 29.6 | 5.7 | 32.9 | 32.0 | 9.3 | 62.4 | 34.7 | 12.1 | 110.4 | 52.1 | 46.3 |
| 28 | Benzeneacetaldehyde | 34.1 | 22.1 | 5.7 | 126.5 | 81.7 | 4.5 | 28.4 | 32.3 | 2.1 | 19.8 | 16.1 | 3.9 |
| 29 | 2-Octenal, (2E)- | 20.9 | 23.2 | 4.0 | 7.1 | 36.7 | 1.6 | 10.4 | 30.7 | 3.7 | 6.4 | 27.5 | 7.7 |
| 30 | 2-Octen-1-ol, (2E)- | 44.0 | 16.1 | 2.5 | |||||||||
| 31 | Octanol <n-> | 78.8 | 60.5 | 3.6 | 24.0 | 33.7 | 7.7 | 19.5 | 29.5 | 6.9 | 12.8 | 20.1 | 9.1 |
| 32 | Heptanoic acid | 16.1 | 13.7 | 8.3 | 22.8 | 25.5 | 27.5 | 21.3 | 38.4 | 3.0 | 16.5 | 25.3 | 9.6 |
| 33 | Disulfide <allyl-> | 26.3 | 17.3 | 6.8 | 17.7 | 16.0 | 13.2 | ||||||
| 34 | Linalool | 30.5 | 36.5 | 19.6 | 34.1 | 61.7 | 20.8 | ||||||
| 35 | Nonanal <n-> | 22.5 | 28.1 | 5.3 | |||||||||
| 36 | Disulfide <dipropyl-> | 17.7 | 10.1 | 5.3 | 11.7 | 10.7 | 4.3 | 18.8 | 15.5 | 10.1 | 17.3 | 11.6 | 11.3 |
| 37 | Benzeneethanol | 109.3 | 190.0 | 1482.9 | 565.3 | 422.4 | 1189.9 | 407.6 | 404.0 | 2093.3 | 251.5 | 282.3 | 2170.7 |
| 38 | unknown | 70.7 | 40.9 | 2.0 | |||||||||
| 39 | Octanoic acid, methyl ester | 13.3 | 30.1 | 11.5 | 14.4 | 28.4 | 12.0 | 14.7 | 27.3 | 10.3 | 11.5 | 21.6 | 7.7 |
| 40 | Camphor | 6.5 | 1.9 | 1.0 | |||||||||
| 41 | Octanoic acid | 262.4 | 211.7 | 160.1 | |||||||||
| 42 | Decanal <n-> | 19.2 | 21.3 | 0.8 | |||||||||
| 43 | Benzothiazole | 10.1 | 5.7 | 2.0 | |||||||||
| 44 | Nonanoic acid | 23.7 | 16.1 | 5.9 | 7.7 | 15.3 | 4.7 | 8.4 | 14.5 | 0.8 | 7.2 | 10.7 | 1.2 |
| 45 | Undecan-2-one | 66.3 | 38.3 | 13.1 | 22.4 | 25.9 | 3.2 | 17.9 | 22.9 | 10.7 | 24.4 | 15.9 | 18.0 |
| 46 | Decanoic acid, methyl ester | 19.6 | 21.2 | 11.1 | 17.3 | 21.1 | 13.6 | 23.2 | 198.5 | 4.0 | 25.1 | 30.5 | 11.2 |
| 47 | unknown | 34.7 | 16.4 | 13.0 | |||||||||
| 48 | Triacetin | 45.1 | 35.7 | 2.4 | |||||||||
| 49 | n-Decanoic acid | 36.8 | 36.4 | 48.5 | |||||||||
| 50 | Butanoic acid, octyl ester | 49.9 | 27.5 | 7.3 | |||||||||
| 51 | Copaene <alpha-> | 67.9 | 100.7 | 16.4 | 19.2 | 61.6 | 4.1 | 23.1 | 70.4 | 7.6 | 20.4 | 62.4 | 13.9 |
| 52 | Longipinene<beta-> | 79.1 | 99.5 | 14.8 | 17.2 | 67.5 | 5.6 | 21.1 | 68.0 | 10.3 | 17.2 | 65.3 | 16.3 |
| 53 | IS | 0.0 | 0.0 | 0.0 | 0.0 | 0.0 | 0.0 | 0.0 | 0.0 | 0.0 | 0.0 | 0.0 | 0.0 |
| 54 | gamma.-Elemene | 54.3 | 85.9 | 13.2 | 11.3 | 40.9 | 3.5 | 17.2 | 43.7 | 6.1 | 15.7 | 43.6 | 13.9 |
| 55 | Himachalene <alpha-> | 17.5 | 22.0 | 5.2 | 2.4 | 12.0 | 1.2 | 2.3 | 9.6 | 2.0 | 4.3 | 10.0 | 3.9 |
| 56 | trans-Geranylacetone | 22.8 | 11.2 | 1.3 | 6.4 | 5.6 | 0.0 | 4.8 | 6.8 | 1.4 | 5.1 | 0.0 | 3.1 |
| 57 | Dodecanol | 20.4 | 0.0 | 0.8 | |||||||||
| 58 | Phthalate <diethyl-> | 376.8 | 207.3 | 87.7 | 69.3 | 201.9 | 25.1 | 108.9 | 92.0 | 39.5 | 134.0 | 111.1 | 80.4 |
| 59 | Lactate <ethyl-> | 933.3 | 199.6 | 192.8 | 53.1 | 58.3 | 33.6 | 1248.8 | 121.6 | 343.7 | |||
| 60 | Benzene <ethyl-> | 30.4 | 26.7 | 0.1 | 1042.8 | 190.4 | 281.9 | 52.8 | 88.1 | 34.4 | |||
| 61 | Isoamyl acetate | 35.1 | 40.7 | 82.4 | 36.9 | 30.4 | 230.0 | 46.7 | 61.9 | 106.6 | |||
| 62 | o-Xylene | 14.8 | 11.7 | 3.9 | 22.8 | 25.2 | 15.5 | 28.3 | 38.1 | 16.9 | |||
| 63 | Heptan-2-ol | 33.2 | 17.2 | 7.5 | 46.3 | 18.7 | 35.5 | 27.5 | 40.5 | 40.0 | |||
| 64 | Hexanoate <methyl-> | 21.9 | 54.8 | 18.9 | 22.7 | 41.1 | 12.9 | 19.9 | 38.7 | 14.5 | |||
| 65 | 1-Octen-3-ol | 168.0 | 164.8 | 23.7 | 153.3 | 113.6 | 60.0 | 57.5 | 131.1 | 64.8 | |||
| 66 | Caproic acid | 144.4 | 299.5 | 533.7 | 145.5 | 401.5 | 132.9 | 170.8 | 316.4 | 46.1 | |||
| 67 | Thiophen-3-one <dihydro-, 2-methyl-> | 18.0 | 2.6 | 268.2 | 0.0 | 0.8 | 0.0 | 0.0 | 0.0 | 0.0 | |||
| 68 | Pseudocumene | 3.3 | 2.9 | 1.4 | 8.9 | 7.3 | 5.5 | 12.5 | 11.7 | 8.5 | |||
| 69 | Cymene <para-> | 3.6 | 5.9 | 2.6 | 4.7 | 6.4 | 3.2 | 4.8 | 6.5 | 5.4 | |||
| 70 | Cresol <ortho-> | 9.3 | 6.0 | 6.0 | 12.1 | 17.6 | 9.2 | 17.0 | 16.0 | 12.0 | |||
| 71 | Cresol<meta-> | 9.3 | 11.1 | 25.2 | 14.9 | 14.3 | 5.7 | 15.3 | 9.9 | 8.5 | |||
| 72 | Disulfide <allyl-> | 17.3 | 14.7 | 0.0 | 18.4 | 14.9 | 14.8 | ||||||
| 73 | Caprylonitrile | 0.0 | 2.0 | 0.0 | 0.0 | 0.0 | 0.0 | 3.3 | 0.0 | 4.9 | |||
| 74 | Guaiacol | 6.0 | 2.2 | 1.7 | 11.5 | 8.4 | 2.9 | 10.9 | 10.8 | 8.8 | |||
| 75 | 2-Nonanone | 4.9 | 3.0 | 1.2 | 6.8 | 0.0 | 4.0 | 27.6 | 4.0 | 10.3 | |||
| 76 | Caprylic acid | 180.3 | 220.7 | 202.0 | 142.5 | 228.3 | 46.4 | 74.8 | 174.0 | 4.1 | |||
| 77 | Benzeneacetic acid, methyl ester | 7.5 | 7.8 | 4.8 | 4.1 | 10.8 | 11.2 | 5.4 | 0.0 | ||||
| 78 | Naphthalene | 32.7 | 23.1 | 8.2 | 65.1 | 54.1 | 33.5 | 87.6 | 76.4 | 50.0 | |||
| 79 | Octanoic acid, ethyl ester | 22.8 | 69.7 | 12.4 | 41.1 | 217.7 | 13.2 | 53.1 | 292.5 | 0.0 | |||
| 80 | Tridecane <n-> | 6.1 | 5.6 | 2.3 | 14.4 | 16.0 | 9.2 | ||||||
| 81 | Napthalene,<1-Methyl -> Naphthalene, 1-methyl- | 12.5 | 9.5 | 3.2 | 29.5 | 25.6 | 12.1 | 44.5 | 35.6 | 23.9 | |||
| 82 | 2-Nonanol, 2-methylpropionate | 11.3 | 6.3 | 2.9 | 10.9 | 4.3 | 4.9 | 14.8 | 7.9 | 5.3 | |||
| 83 | Capric acid | 29.9 | 42.4 | 46.4 | 28.5 | 51.5 | 19.6 | 20.8 | 43.9 | 18.3 | |||
| 84 | Decanoic acid, ethyl ester | 11.5 | 49.7 | 6.9 | 23.1 | 27.1 | 10.1 | 52.3 | 303.5 | 7.2 | |||
| 85 | Pentadecane | 4.1 | 0.0 | 1.3 | 5.5 | 3.6 | 4.1 | 8.0 | 8.0 | 6.8 | |||
| 86 | Farnesene <(E,E)-, alpha-> | 138.1 | 0.0 | 1.4 | 28.7 | 0.0 | 2.4 | 4.9 | 40.8 | 7.4 | |||
| 87 | Tetradecane <n-> | 5.6 | 4.8 | 2.1 | 9.3 | 10.1 | 6.5 | 16.0 | 16.1 | 11.1 | |||
References
- Zheng, G.; Liu, J.; Shao, Z.; Chen, T. Emission Characteristics and Health Risk Assessment of VOCs from a Food Waste Anaerobic Digestion Plant: A Case Study of Suzhou, China. Environmental Pollution 2020, 257, 113546. [Google Scholar] [CrossRef] [PubMed]
- Xu, Y.; Gao, Y.; Tan, L.; Wang, Q.; Li, Q.; Wei, X.; Liu, F.; Li, Y.; Zheng, X. Exploration of Bacterial Communities in Products after Composting Rural Wastes with Different Components: Core Microbiome and Potential Pathogenicity. Environ Technol Innov 2022, 25. [Google Scholar] [CrossRef]
- Chai, F.; Li, P.; Li, L.; Qiu, Z.; Han, Y.; Yang, K. Dispersion, Olfactory Effect, and Health Risks of VOCs and Odors in a Rural Domestic Waste Transfer Station. Environ Res 2022, 209, 112879. [Google Scholar] [CrossRef] [PubMed]
- Chung, W.J.; Chang, S.W.; Chaudhary, D.K.; Shin, J. Du; Kim, H.; Karmegam, N.; Govarthanan, M.; Chandrasekaran, M.; Ravindran, B. Effect of Biochar Amendment on Compost Quality, Gaseous Emissions and Pathogen Reduction during in-Vessel Composting of Chicken Manure. Chemosphere 2021, 283, 131129. [Google Scholar] [CrossRef] [PubMed]
- Yang, K.; Wang, C.; Xue, S.; Li, W.; Liu, J.; Li, L. The Identification, Health Risks and Olfactory Effects Assessment of VOCs Released from the Wastewater Storage Tank in a Pesticide Plant. Ecotoxicol Environ Saf 2019, 184, 109665. [Google Scholar] [CrossRef]
- Zhang, C.; Gao, X.; Qin, J.; Guo, Q.; Zhou, H.; Jin, W. Microporous Polyimide VOC-Rejective Membrane for the Separation of Nitrogen/VOC Mixture. J Hazard Mater 2021, 402, 123817. [Google Scholar] [CrossRef]
- Yang, Y.; Zhao, S.; Cui, L.; Bi, F.; Zhang, Y.; Liu, N.; Wang, Y.; Liu, F.; He, C.; Zhang, X. Recent Advancement and Future Challenges of Photothermal Catalysis for VOCs Elimination: From Catalyst Design to Applications. Green Energy & Environment 2023, 8, 654–672. [Google Scholar] [CrossRef]
- Adelodun, A.A. Influence of Operation Conditions on the Performance of Non-Thermal Plasma Technology for VOC Pollution Control. Journal of Industrial and Engineering Chemistry 2020, 92, 41–55. [Google Scholar] [CrossRef]
- Vikrant, K.; Kim, K.H.; Peng, W.; Ge, S.; Sik Ok, Y. Adsorption Performance of Standard Biochar Materials against Volatile Organic Compounds in Air: A Case Study Using Benzene and Methyl Ethyl Ketone. Chemical Engineering Journal 2020, 387, 123943. [Google Scholar] [CrossRef]
- Huang, H.; Chen, C.; Yang, R.; Yu, Y.; Albilali, R.; He, C. Remarkable Promotion Effect of Lauric Acid on Mn-MIL-100 for Non-Thermal Plasma-Catalytic Decomposition of Toluene. Appl Surf Sci 2020, 503, 144290. [Google Scholar] [CrossRef]
- Barquilha, C.E.R.; Braga, M.C.B. Adsorption of Organic and Inorganic Pollutants onto Biochars: Challenges, Operating Conditions, and Mechanisms. Bioresour Technol Rep 2021, 15, 100728. [Google Scholar] [CrossRef]
- Zhang, X.; Gao, B.; Zheng, Y.; Hu, X.; Creamer, A.E.; Annable, M.D.; Li, Y. Biochar for Volatile Organic Compound (VOC) Removal: Sorption Performance and Governing Mechanisms. Bioresour Technol 2017, 245, 606–614. [Google Scholar] [CrossRef] [PubMed]
- Nie, E.; Zheng, G.; Shao, Z.; Yang, J.; Chen, T. Emission Characteristics and Health Risk Assessment of Volatile Organic Compounds Produced during Municipal Solid Waste Composting. Waste Management 2018, 79, 188–195. [Google Scholar] [CrossRef] [PubMed]
- Duan, Y.; Awasthi, S.K.; Liu, T.; Zhang, Z.; Awasthi, M.K. Response of Bamboo Biochar Amendment on Volatile Fatty Acids Accumulation Reduction and Humification during Chicken Manure Composting. Bioresour Technol 2019, 291, 121845. [Google Scholar] [CrossRef]
- Sánchez-Monedero, M.A.; Sánchez-García, M.; Alburquerque, J.A.; Cayuela, M.L. Biochar Reduces Volatile Organic Compounds Generated during Chicken Manure Composting. Bioresour Technol 2019, 288, 121584. [Google Scholar] [CrossRef]
- Hwang, O.; Lee, S.R.; Cho, S.; Ro, K.S.; Spiehs, M.; Woodbury, B.; Silva, P.J.; Han, D.W.; Choi, H.; Kim, K.Y.; et al. Efficacy of Different Biochars in Removing Odorous Volatile Organic Compounds (VOCs) Emitted from Swine Manure. ACS Sustain Chem Eng 2018, 6, 14239–14247. [Google Scholar] [CrossRef]
- Awasthi, M.K.; Awasthi, S.K.; Wang, Q.; Wang, Z.; Lahori, A.H.; Ren, X.; Chen, H.; Wang, M.; Zhao, J.; Zhang, Z. Influence of Biochar on Volatile Fatty Acids Accumulation and Microbial Community Succession during Biosolids Composting. Bioresour Technol 2018, 251, 158–164. [Google Scholar] [CrossRef]
- Czekała, W.; Malińska, K.; Cáceres, R.; Janczak, D.; Dach, J.; Lewicki, A. Co-Composting of Poultry Manure Mixtures Amended with Biochar – The Effect of Biochar on Temperature and C-CO2 Emission. Bioresour Technol 2016, 200, 921–927. [Google Scholar] [CrossRef]
- Zhang, X.; Miao, X.; Xiang, W.; Zhang, J.; Cao, C.; Wang, H.; Hu, X.; Gao, B. Ball Milling Biochar with Ammonia Hydroxide or Hydrogen Peroxide Enhances Its Adsorption of Phenyl Volatile Organic Compounds (VOCs). J Hazard Mater 2021, 403, 123540. [Google Scholar] [CrossRef]
- Antunes, E.; Vuppaladadiyam, A.K.; Kumar, R.; Vuppaladadiyam, V.S.S.; Sarmah, A.; Anwarul Islam, M.; Dada, T. A Circular Economy Approach for Phosphorus Removal Using Algae Biochar. Cleaner and Circular Bioeconomy 2022, 1, 100005. [Google Scholar] [CrossRef]
- Bolognesi, S.; Bernardi, G.; Callegari, A.; Dondi, D.; Capodaglio, A.G. Biochar Production from Sewage Sludge and Microalgae Mixtures: Properties, Sustainability and Possible Role in Circular Economy. Biomass Convers Biorefin 2021, 11, 289–299. [Google Scholar] [CrossRef]
- Hu, Q.; Jung, J.; Chen, D.; Leong, K.; Song, S.; Li, F.; Mohan, B.C.; Yao, Z.; Prabhakar, A.K.; Lin, X.H.; et al. Biochar Industry to Circular Economy. Science of The Total Environment 2021, 757, 143820. [Google Scholar] [CrossRef] [PubMed]
- Danish, A.; Ali Mosaberpanah, M.; Usama Salim, M.; Ahmad, N.; Ahmad, F.; Ahmad, A. Reusing Biochar as a Filler or Cement Replacement Material in Cementitious Composites: A Review. Constr Build Mater 2021, 300, 124295. [Google Scholar] [CrossRef]
- Wang, C.; Luo, D.; Zhang, X.; Huang, R.; Cao, Y.; Liu, G.; Zhang, Y.; Wang, H. Biochar-Based Slow-Release of Fertilizers for Sustainable Agriculture: A Mini Review. Environmental Science and Ecotechnology 2022, 10, 100167. [Google Scholar] [CrossRef]
- Lateef, A.; Nazir, R.; Jamil, N.; Alam, S.; Shah, R.; Khan, M.N.; Saleem, M.; Rehman, S. ur Synthesis and Characterization of Environmental Friendly Corncob Biochar Based Nano-Composite – A Potential Slow Release Nano-Fertilizer for Sustainable Agriculture. Environ Nanotechnol Monit Manag 2019, 11, 100212. [Google Scholar] [CrossRef]
- Qiu, M.; Liu, L.; Ling, Q.; Cai, Y.; Yu, S.; Wang, S.; Fu, D.; Hu, B.; Wang, X. Biochar for the Removal of Contaminants from Soil and Water: A Review. Biochar 2022, 4, 1–25. [Google Scholar]
- Dahal, R.K.; Acharya, B.; Farooque, A. Biochar: A Sustainable Solution for Solid Waste Management in Agro-Processing Industries. https://doi.org/10.1080/17597269.2018.1468978, 2018; 12, 237–245. [Google Scholar] [CrossRef]
- PHARES, C.A.; AKABA, S. Co-Application of Compost or Inorganic NPK Fertilizer with Biochar Influences Soil Quality, Grain Yield and Net Income of Rice. J Integr Agric 2022, 21, 3600–3610. [Google Scholar] [CrossRef]
- Konaka, T.; Tadano, S.; Takahashi, T.; Suharsono, S.; Mazereku, C.; Tsujimoto, H.; Masunaga, T.; Yamamoto, S.; Akashi, K. A Diverse Range of Physicochemically-Distinct Biochars Made from a Combination of Different Feedstock Tissues and Pyrolysis Temperatures from a Biodiesel Plant Jatropha Curcas: A Comparative Study. Ind Crops Prod 2021, 159, 113060. [Google Scholar] [CrossRef]
- Medyńska-Juraszek, A.; Bednik, M.; Chohura, P. Assessing the Influence of Compost and Biochar Amendments on the Mobility and Uptake of Heavy Metals by Green Leafy Vegetables. Int J Environ Res Public Health 2020, 17, 1–16. [Google Scholar] [CrossRef]
- Addai, P.; Mensah, A.K.; Sekyi-Annan, E.; Adjei, E.O. Biochar, Compost and/or NPK Fertilizer Affect the Uptake of Potentially Toxic Elements and Promote the Yield of Lettuce Grown in an Abandoned Gold Mine Tailing. Journal of Trace Elements and Minerals 2023, 4, 100066. [Google Scholar] [CrossRef]
- Białowiec, A.; Micuda, M.; Szumny, A.; Łyczko, J.; Koziel, J.A. The Proof-of-the-Concept of Application of Pelletization for Mitigation of Volatile Organic Compounds Emissions from Carbonized Refuse-Derived Fuel. Materials 2019, Vol. 12, Page 1692 2019, 12, 1692. [Google Scholar] [CrossRef] [PubMed]
- Mujtaba, G.; Hayat, R.; Hussain, Q.; Ahmed, M. Physio-Chemical Characterization of Biochar, Compost and Co-Composted Biochar Derived from Green Waste. Sustainability 2021, Vol. 13, Page 4628 2021, 13, 4628. [Google Scholar] [CrossRef]
- Silva, A.C.; Rocha, P.; Antelo, J.; Valderrama, P.; López, R.; Geraldo, D.; Proença, M.F.; Pinheiro, J.P.; Fiol, S.; Bento, F. Comparison of a Variety of Physico-Chemical Techniques in the Chronological Characterization of a Compost from Municipal Wastes. Process Safety and Environmental Protection 2022, 164, 781–793. [Google Scholar] [CrossRef]
- P. Rueda, M.; Comino, F.; Aranda, V.; José Ayora-Cañada, M.; Domínguez-Vidal, A. Understanding the Compositional Changes of Organic Matter in Torrefied Olive Mill Pomace Compost Using Infrared Spectroscopy and Chemometrics. Spectrochim Acta A Mol Biomol Spectrosc 2023, 293, 122450. [Google Scholar] [CrossRef]
- Maulini-Duran, C.; Puyuelo, B.; Artola, A.; Font, X.; Sánchez, A.; Gea, T. VOC Emissions from the Composting of the Organic Fraction of Municipal Solid Waste Using Standard and Advanced Aeration Strategies. Journal of Chemical Technology & Biotechnology 2014, 89, 579–586. [Google Scholar] [CrossRef]
- Zhang, Y.; Yue, D.; Liu, J.; Lu, P.; Wang, Y.; Liu, J.; Nie, Y. Release of Non-Methane Organic Compounds during Simulated Landfilling of Aerobically Pretreated Municipal Solid Waste. J Environ Manage 2012, 101, 54–58. [Google Scholar] [CrossRef]
- Sánchez-García, M.; Alburquerque, J.A.; Sánchez-Monedero, M.A.; Roig, A.; Cayuela, M.L. Biochar Accelerates Organic Matter Degradation and Enhances N Mineralisation during Composting of Poultry Manure without a Relevant Impact on Gas Emissions. Bioresour Technol 2015, 192, 272–279. [Google Scholar] [CrossRef]
- Pierucci, P.; Porazzi, E.; Martinez, M.P.; Adani, F.; Carati, C.; Rubino, F.M.; Colombi, A.; Calcaterra, E.; Benfenati, E. Volatile Organic Compounds Produced during the Aerobic Biological Processing of Municipal Solid Waste in a Pilot Plant. Chemosphere 2005, 59, 423–430. [Google Scholar] [CrossRef]
- Statheropoulos, M.; Agapiou, A.; Pallis, G. A Study of Volatile Organic Compounds Evolved in Urban Waste Disposal Bins. Atmos Environ 2005, 39, 4639–4645. [Google Scholar] [CrossRef]
- Scaglia, B.; Orzi, V.; Artola, A.; Font, X.; Davoli, E.; Sanchez, A.; Adani, F. Odours and Volatile Organic Compounds Emitted from Municipal Solid Waste at Different Stage of Decomposition and Relationship with Biological Stability. Bioresour Technol 2011, 102, 4638–4645. [Google Scholar] [CrossRef]
- Akdeniz, N.; Koziel, J.A.; Ahn, H.K.; Glanville, T.D.; Crawford, B.P.; Raman, D.R. Laboratory Scale Evaluation of Volatile Organic Compound Emissions as Indication of Swine Carcass Degradation inside Biosecure Composting Units. Bioresour Technol 2010, 101, 71–78. [Google Scholar] [CrossRef] [PubMed]
- Świechowski, K.; Matyjewicz, B.; Telega, P.; Białowiec, A. The Influence of Low-Temperature Food Waste Biochars on Anaerobic Digestion of Food Waste. Materials 2022, Vol. 15, Page 945 2022, 15, 945. [Google Scholar] [CrossRef]
- Turan, N.G.; Akdemir, A.; Ergun, O.N. Emission of Volatile Organic Compounds during Composting of Poultry Litter. Water Air Soil Pollut 2007, 184, 177–182. [Google Scholar] [CrossRef]
- Sun, D.; Lan, Y.; Xu, E.G.; Meng, J.; Chen, W. Biochar as a Novel Niche for Culturing Microbial Communities in Composting. Waste Management 2016, 54, 93–100. [Google Scholar] [CrossRef] [PubMed]
- Maulini-Duran, C.; Artola, A.; Font, X.; Sánchez, A. Gaseous Emissions in Municipal Wastes Composting: Effect of the Bulking Agent. Bioresour Technol 2014, 172, 260–268. [Google Scholar] [CrossRef]
- Staley, B.F.; Xu, F.; Cowie, S.J.; Barlaz, M.A.; Hater, G.R. Release of Trace Organic Compounds during the Decomposition of Municipal Solid Waste Components. Environ Sci Technol 2006, 40, 5984–5991. [Google Scholar] [CrossRef]
- Scaglia, B.; Orzi, V.; Artola, A.; Font, X.; Davoli, E.; Sanchez, A.; Adani, F. Odours and Volatile Organic Compounds Emitted from Municipal Solid Waste at Different Stage of Decomposition and Relationship with Biological Stability. Bioresour Technol 2011, 102, 4638–4645. [Google Scholar] [CrossRef]
- Dorado, A.D.; Husni, S.; Pascual, G.; Puigdellivol, C.; Gabriel, D. Inventory and Treatment of Compost Maturation Emissions in a Municipal Solid Waste Treatment Facility. Waste Management 2014, 34, 344–351. [Google Scholar] [CrossRef]
- Yang, K.; Xue, F.; Sun, Q.; Yue, R.; Lin, D. Adsorption of Volatile Organic Compounds by Metal-Organic Frameworks MOF-177. J Environ Chem Eng 2013, 1, 713–718. [Google Scholar] [CrossRef]
- Agapiou, A.; Vamvakari, J.P.; Andrianopoulos, A.; Pappa, A. Volatile Emissions during Storing of Green Food Waste under Different Aeration Conditions. Environmental Science and Pollution Research 2016, 23, 8890–8901. [Google Scholar] [CrossRef]
- Zhang, X.; Gao, B.; Creamer, A.E.; Cao, C.; Li, Y. Adsorption of VOCs onto Engineered Carbon Materials: A Review. J Hazard Mater 2017, 338, 102–123. [Google Scholar] [CrossRef] [PubMed]
Figure 3.
Content of selected elements in compost and biochar used in the experiment (a) essential elements (b) heavy metals.
Figure 3.
Content of selected elements in compost and biochar used in the experiment (a) essential elements (b) heavy metals.
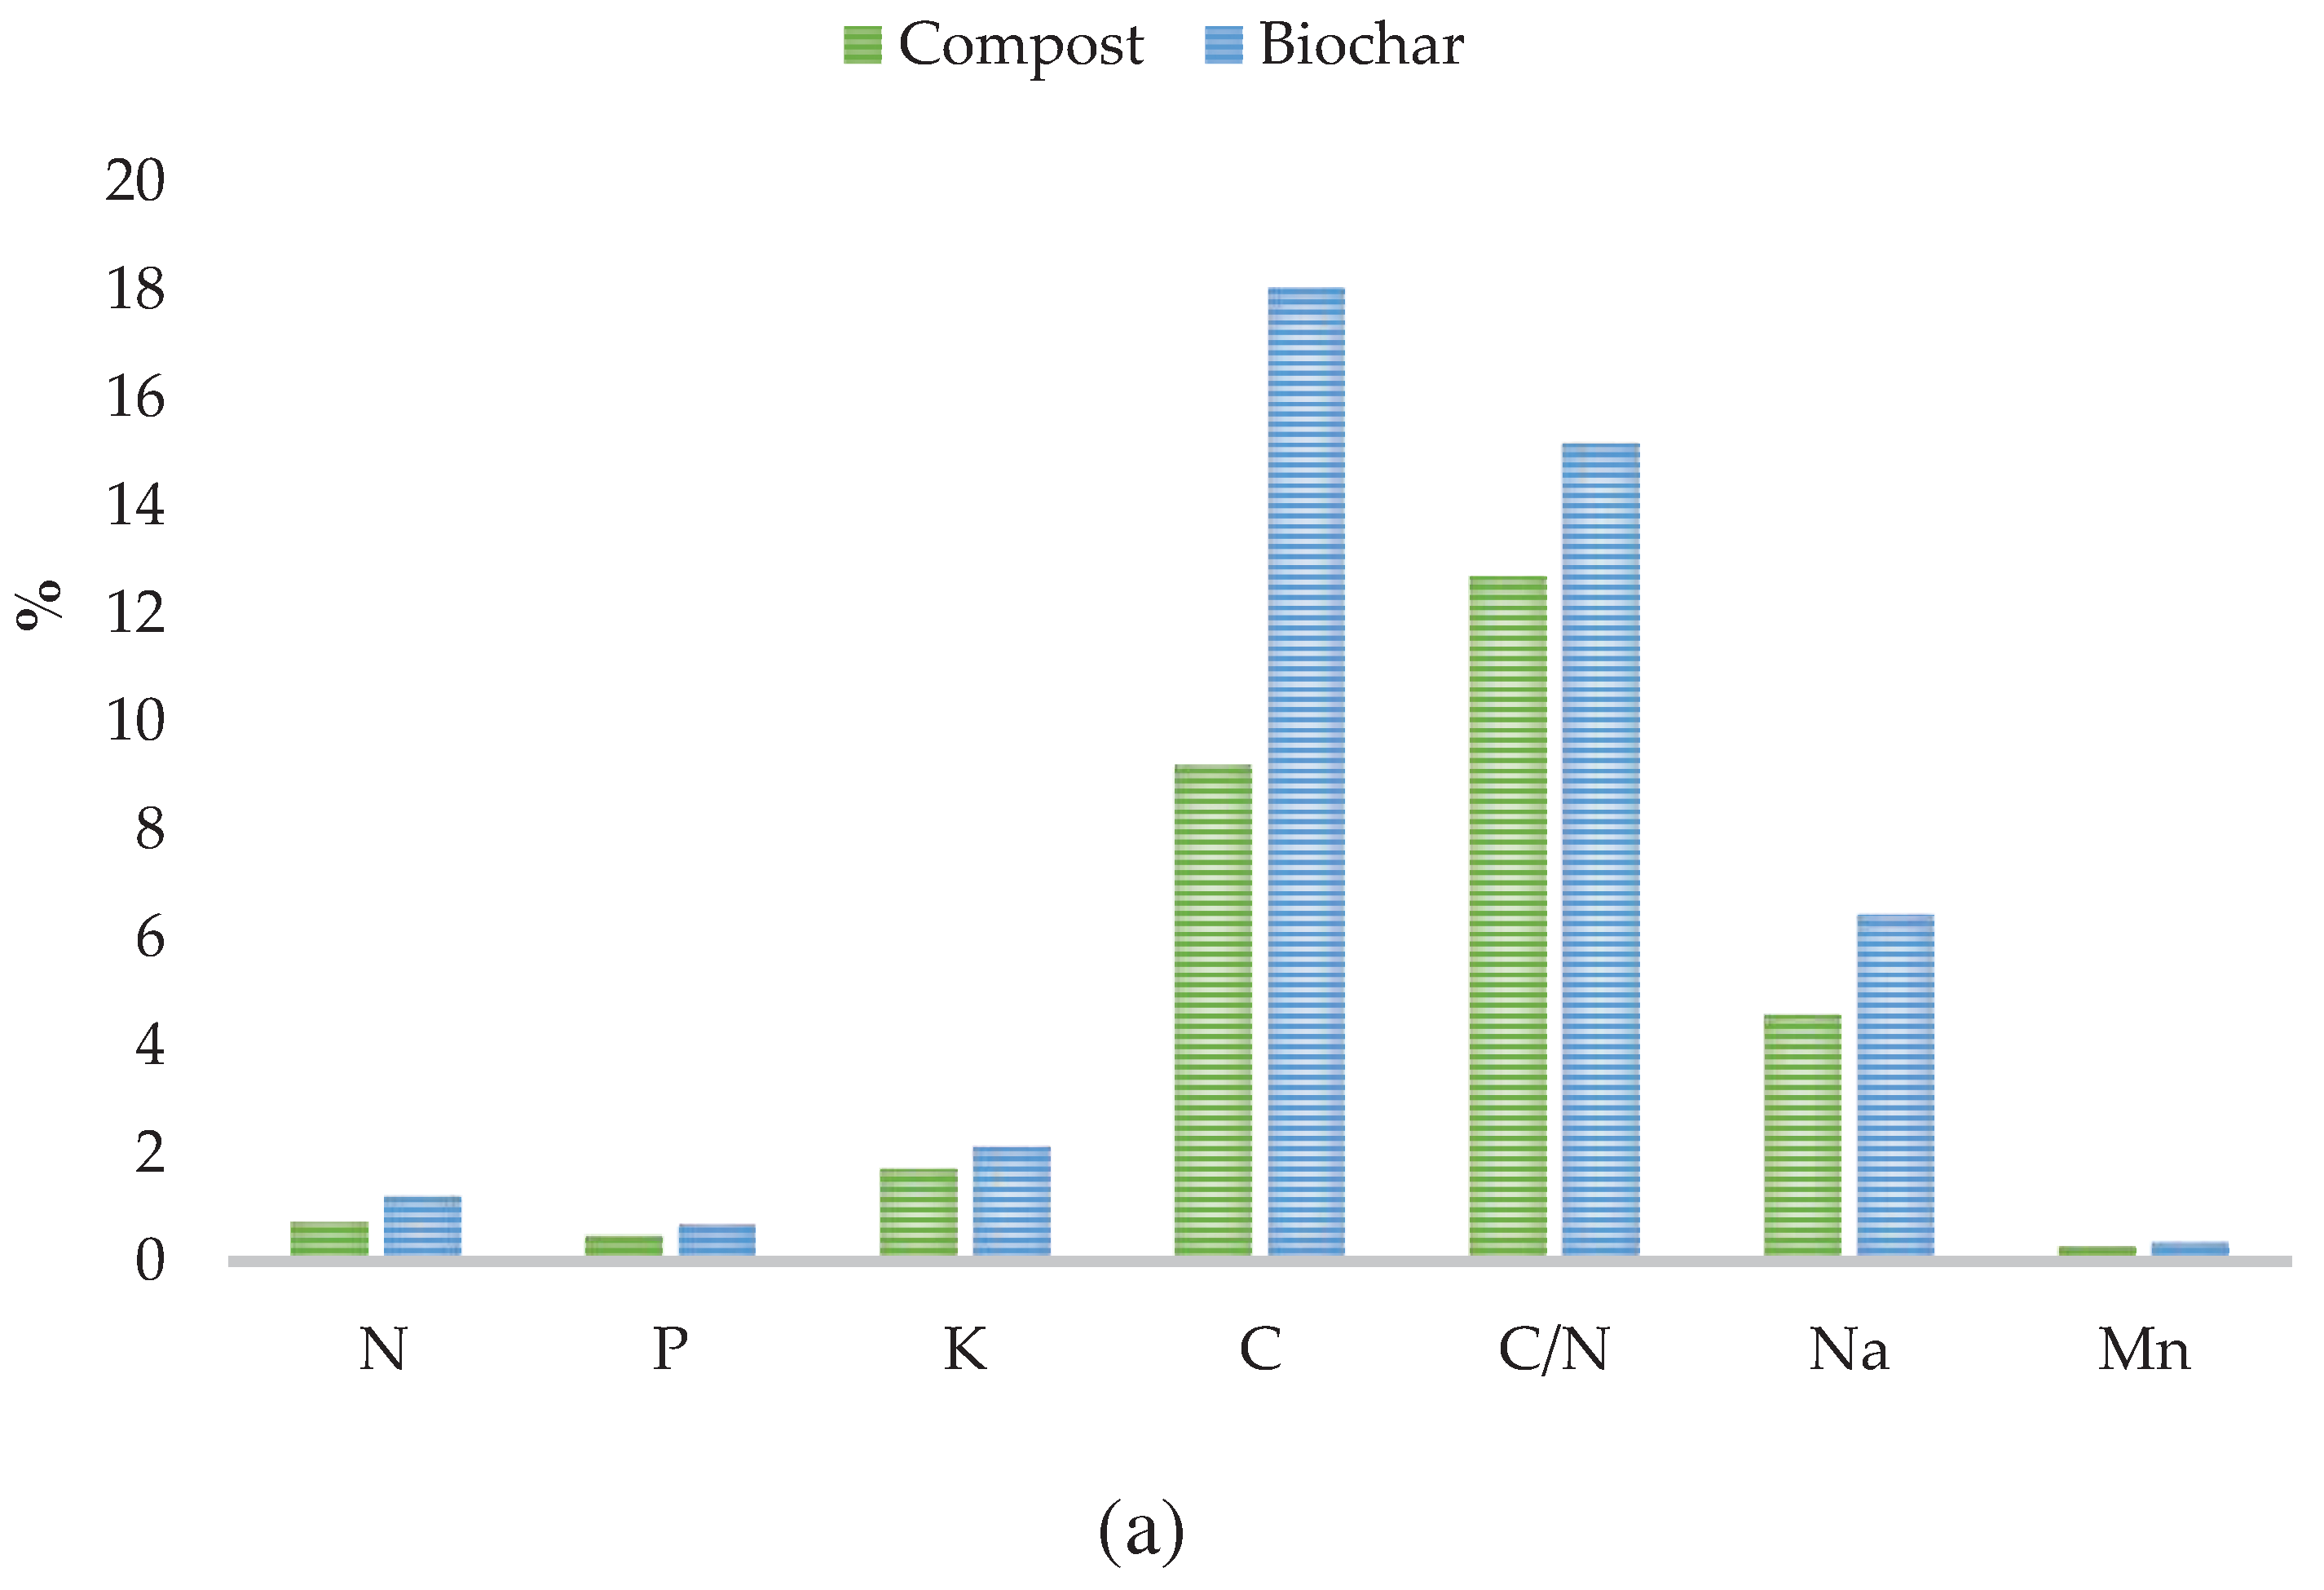
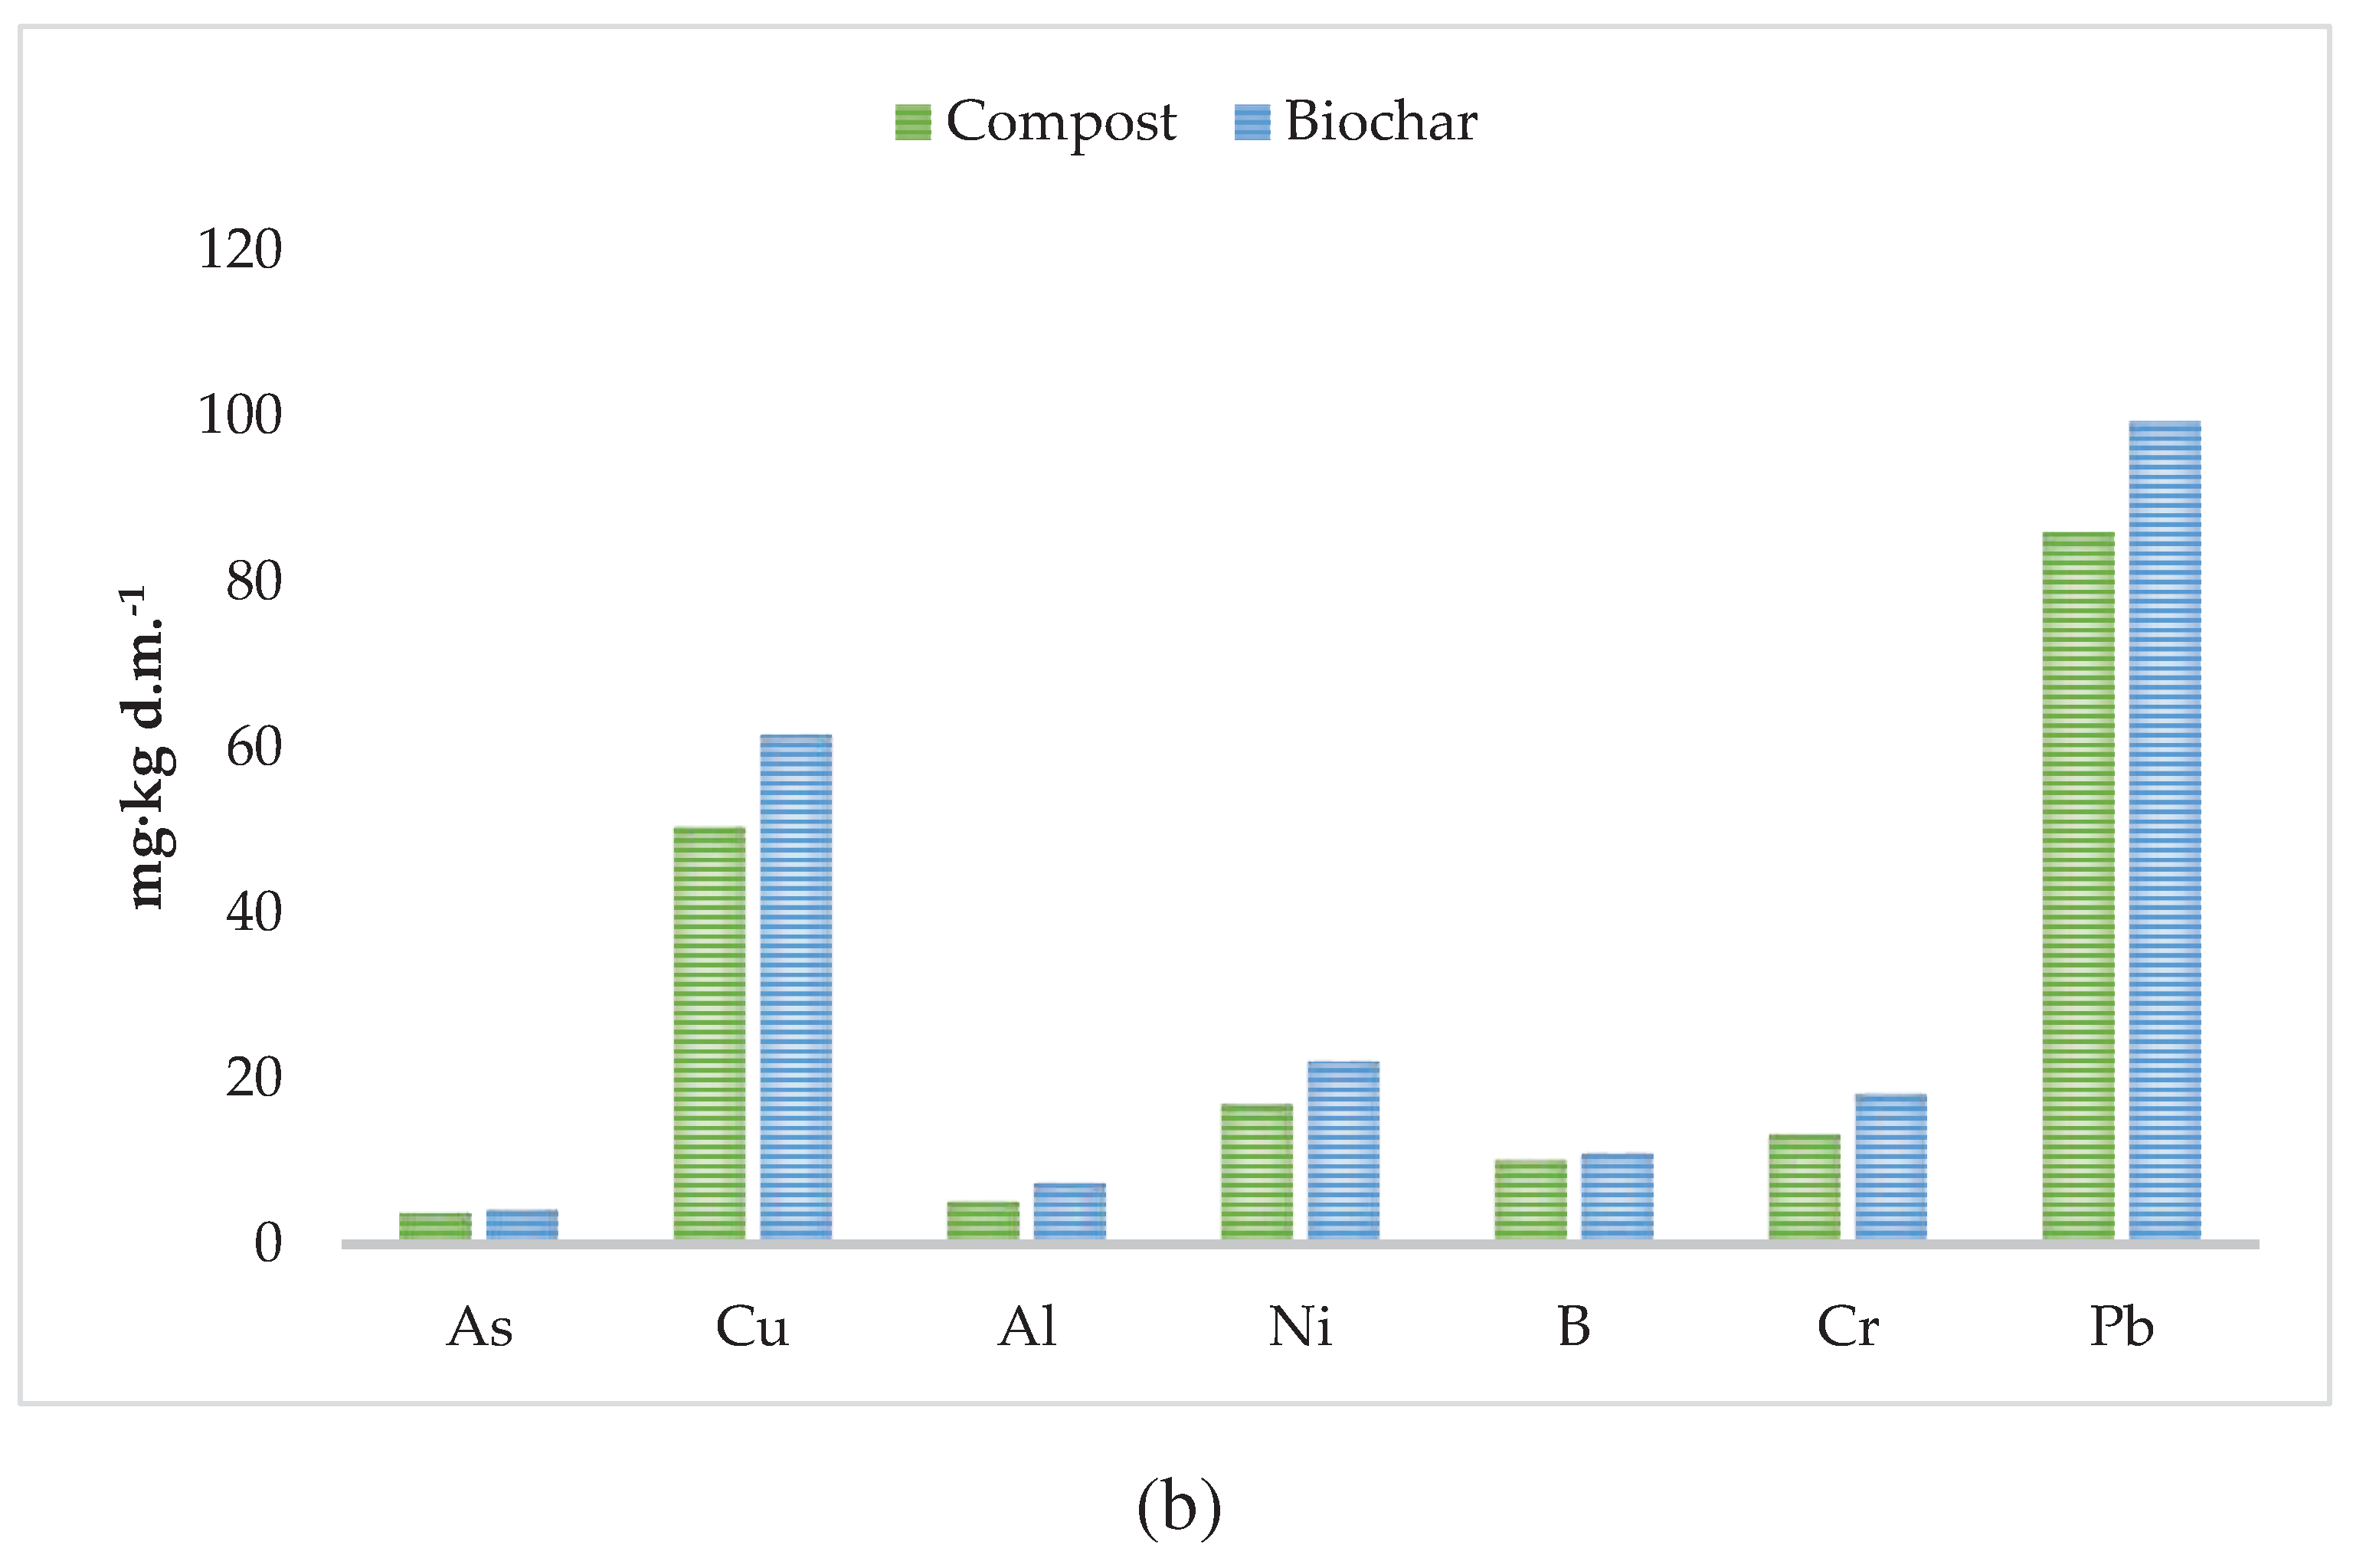
Figure 4.
FTIR results of compost and biochar made from compost A) shows FTIR spectra of compost and biochar made from compost, B) shows subtraction spectra of samples. The dashed lines indicate zero absorbance change for each subtraction spectrum.
Figure 4.
FTIR results of compost and biochar made from compost A) shows FTIR spectra of compost and biochar made from compost, B) shows subtraction spectra of samples. The dashed lines indicate zero absorbance change for each subtraction spectrum.
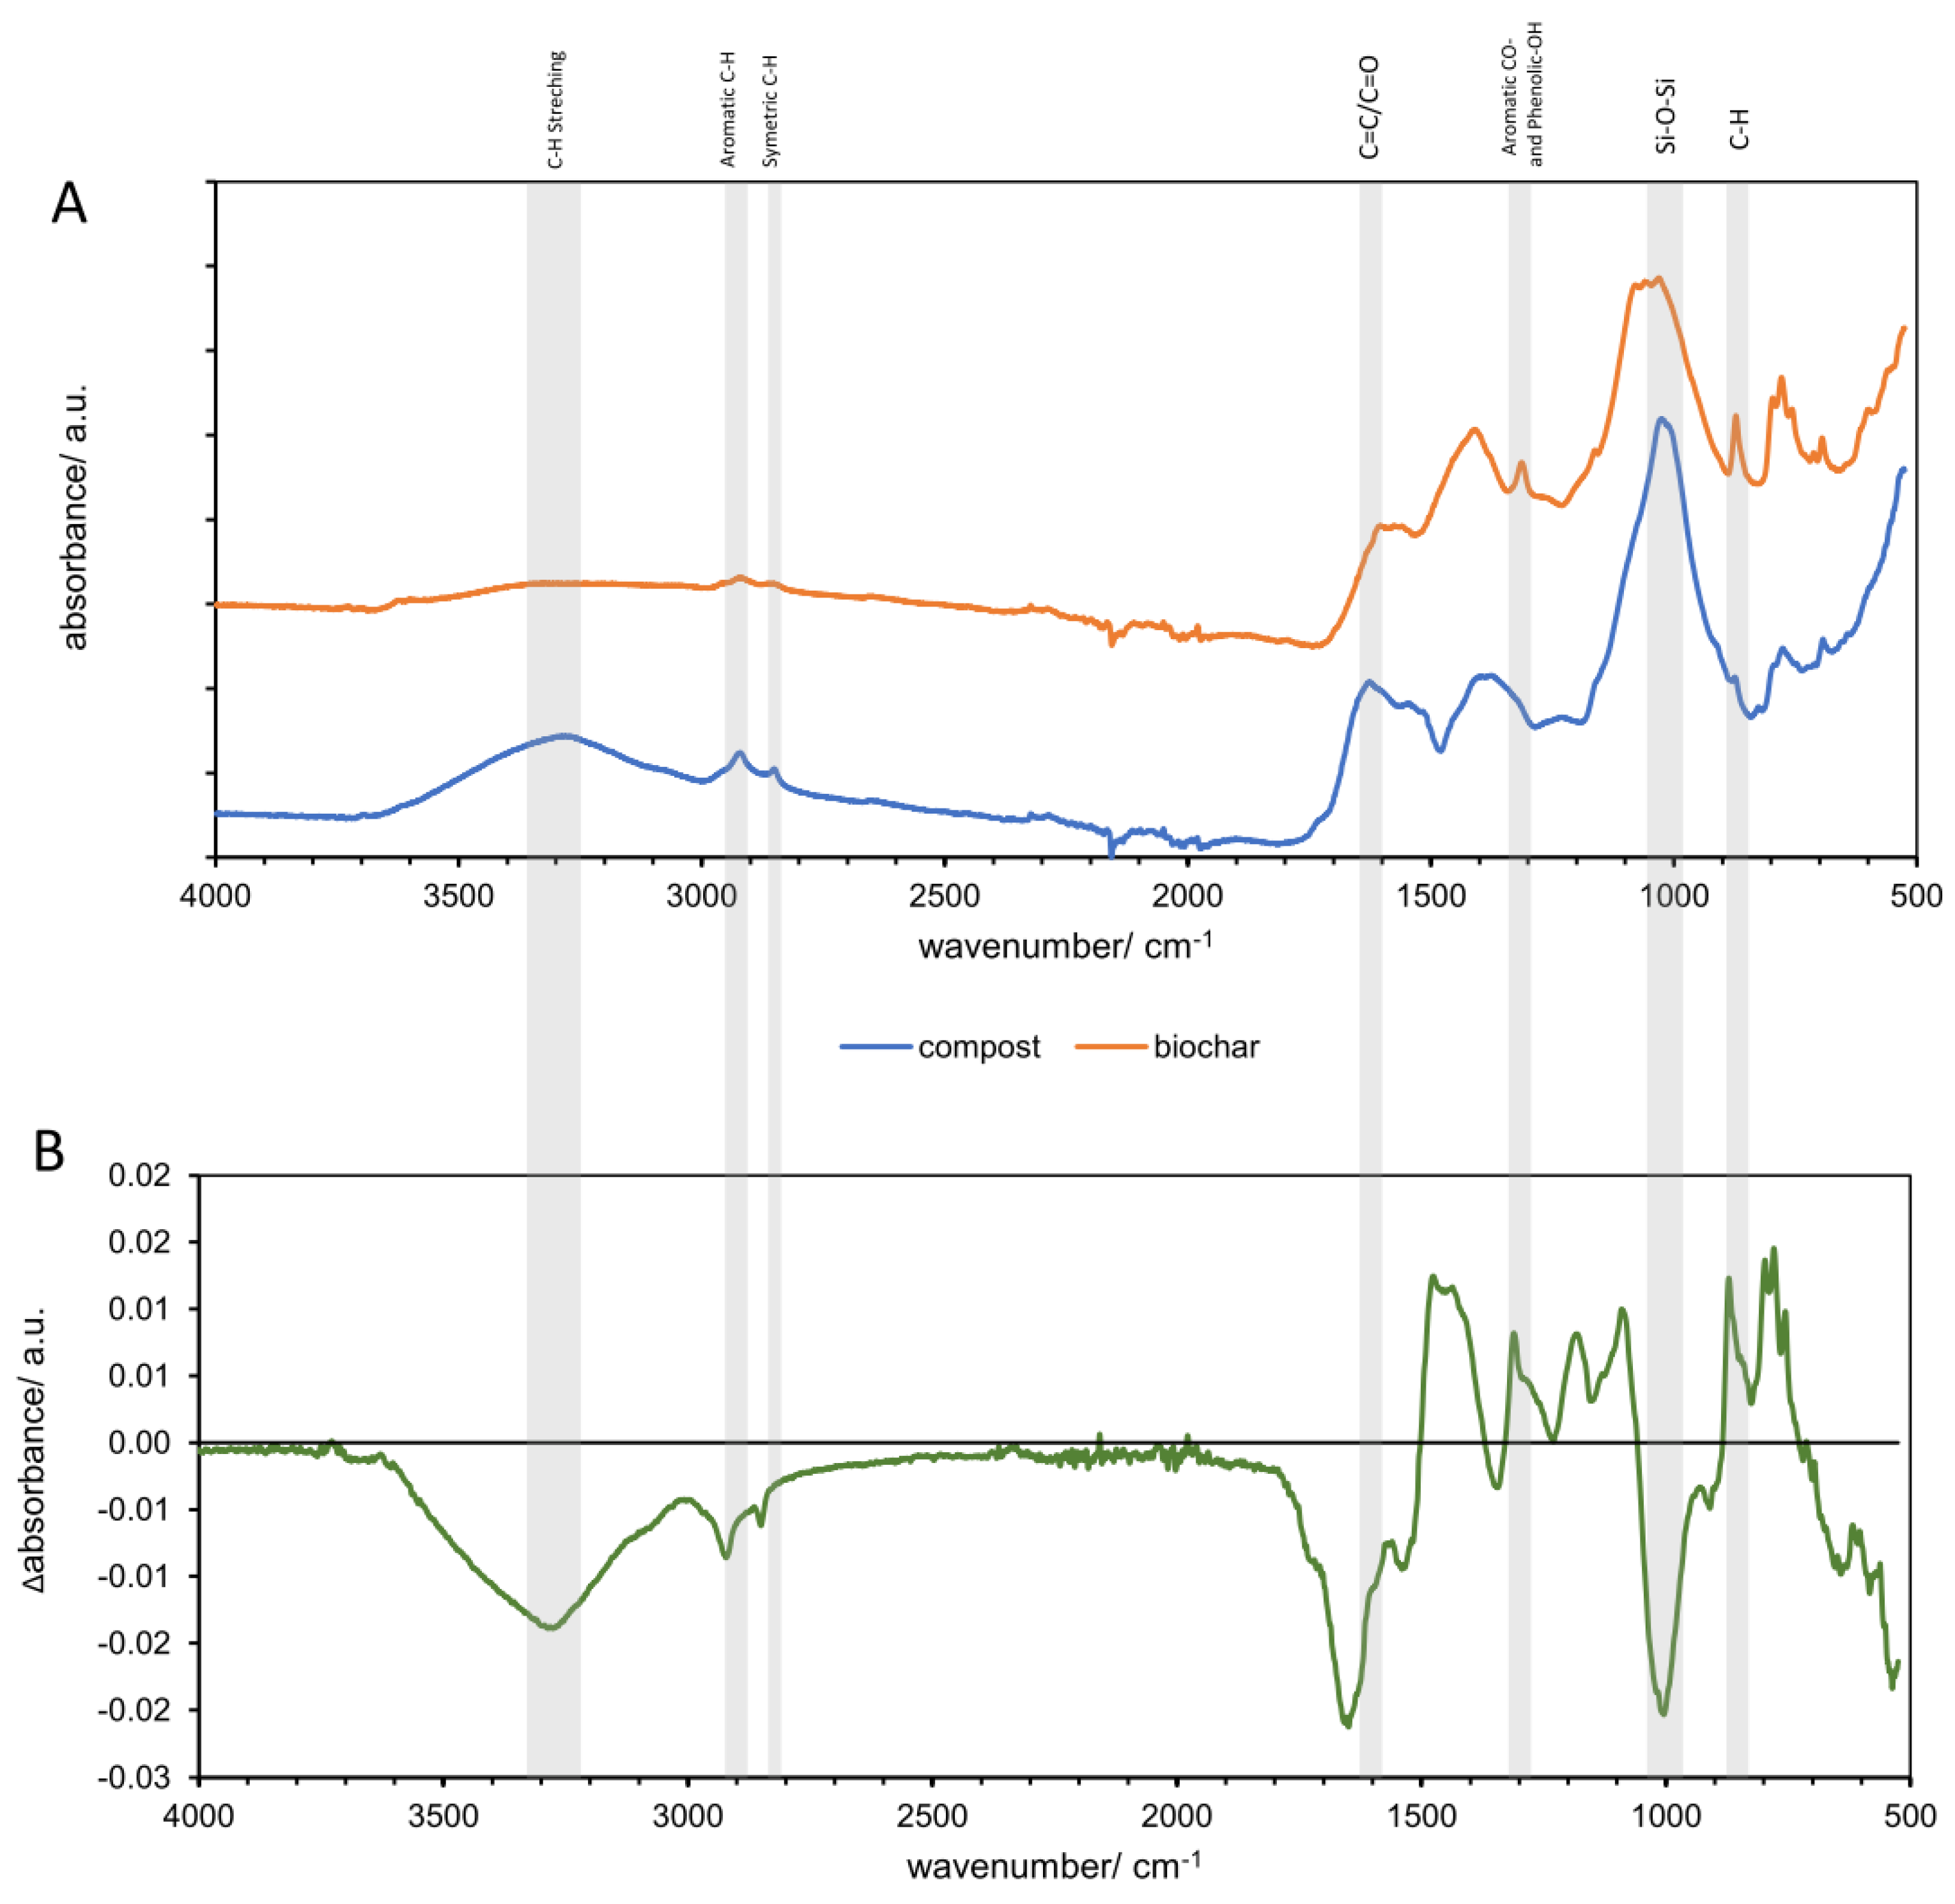
Figure 5.
Quantification of the total amount and chemical families of the VOCs identified in kitchen waste during the coffering process (a) total emission without the addition of biochar, (b) the proportion of each compound category (without biochar), (c) total emission with the addition of 1% biochar, (d) the proportion of each compound category (1% of biochar), (e) total emission with the addition of 5% biochar, (f) the proportion of each compound category (5% of biochar), (g) total emission with the addition of 10% biochar, (f) the proportion of each compound category (10% of biochar).
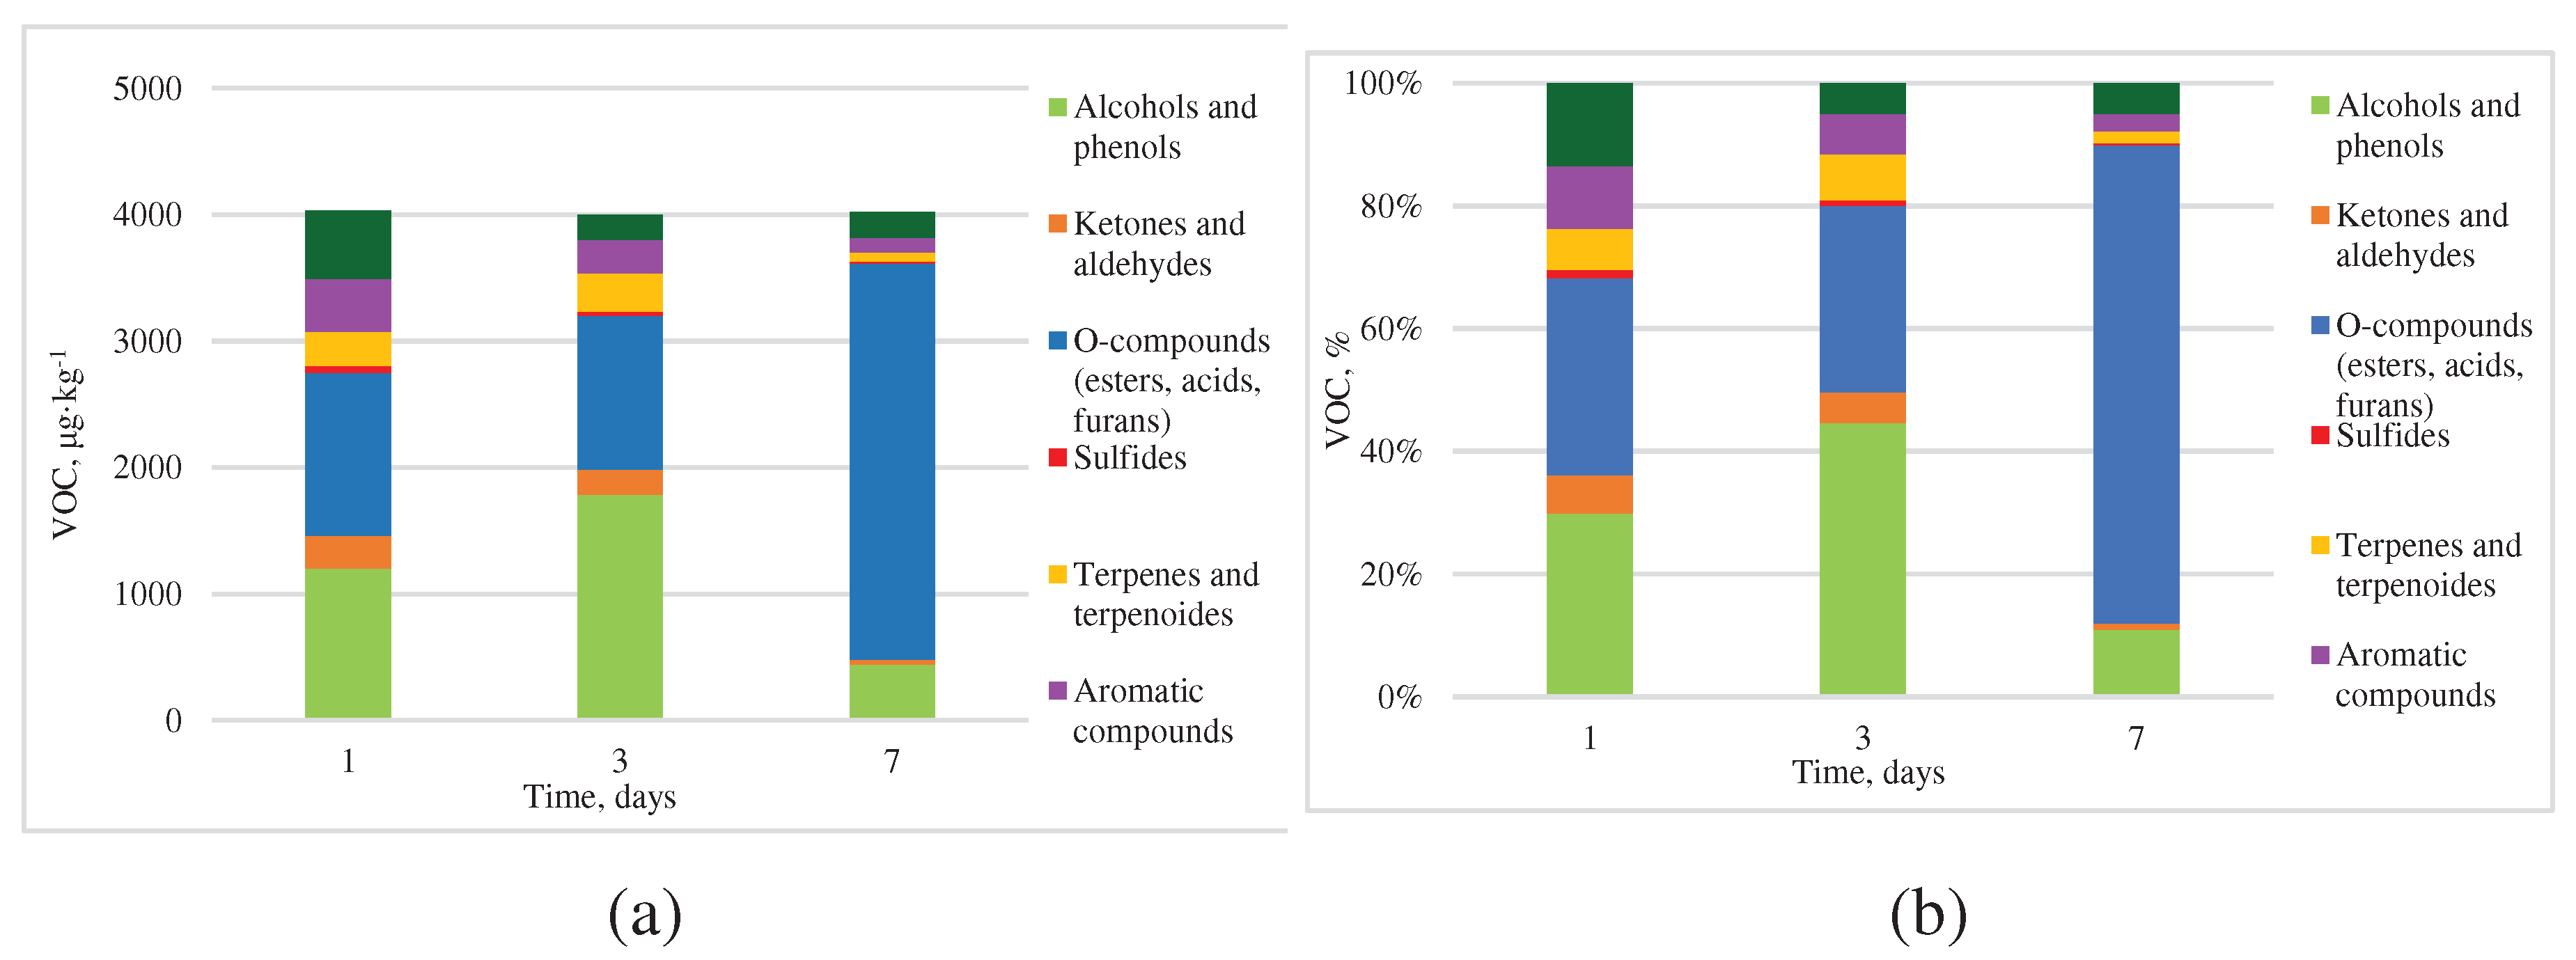
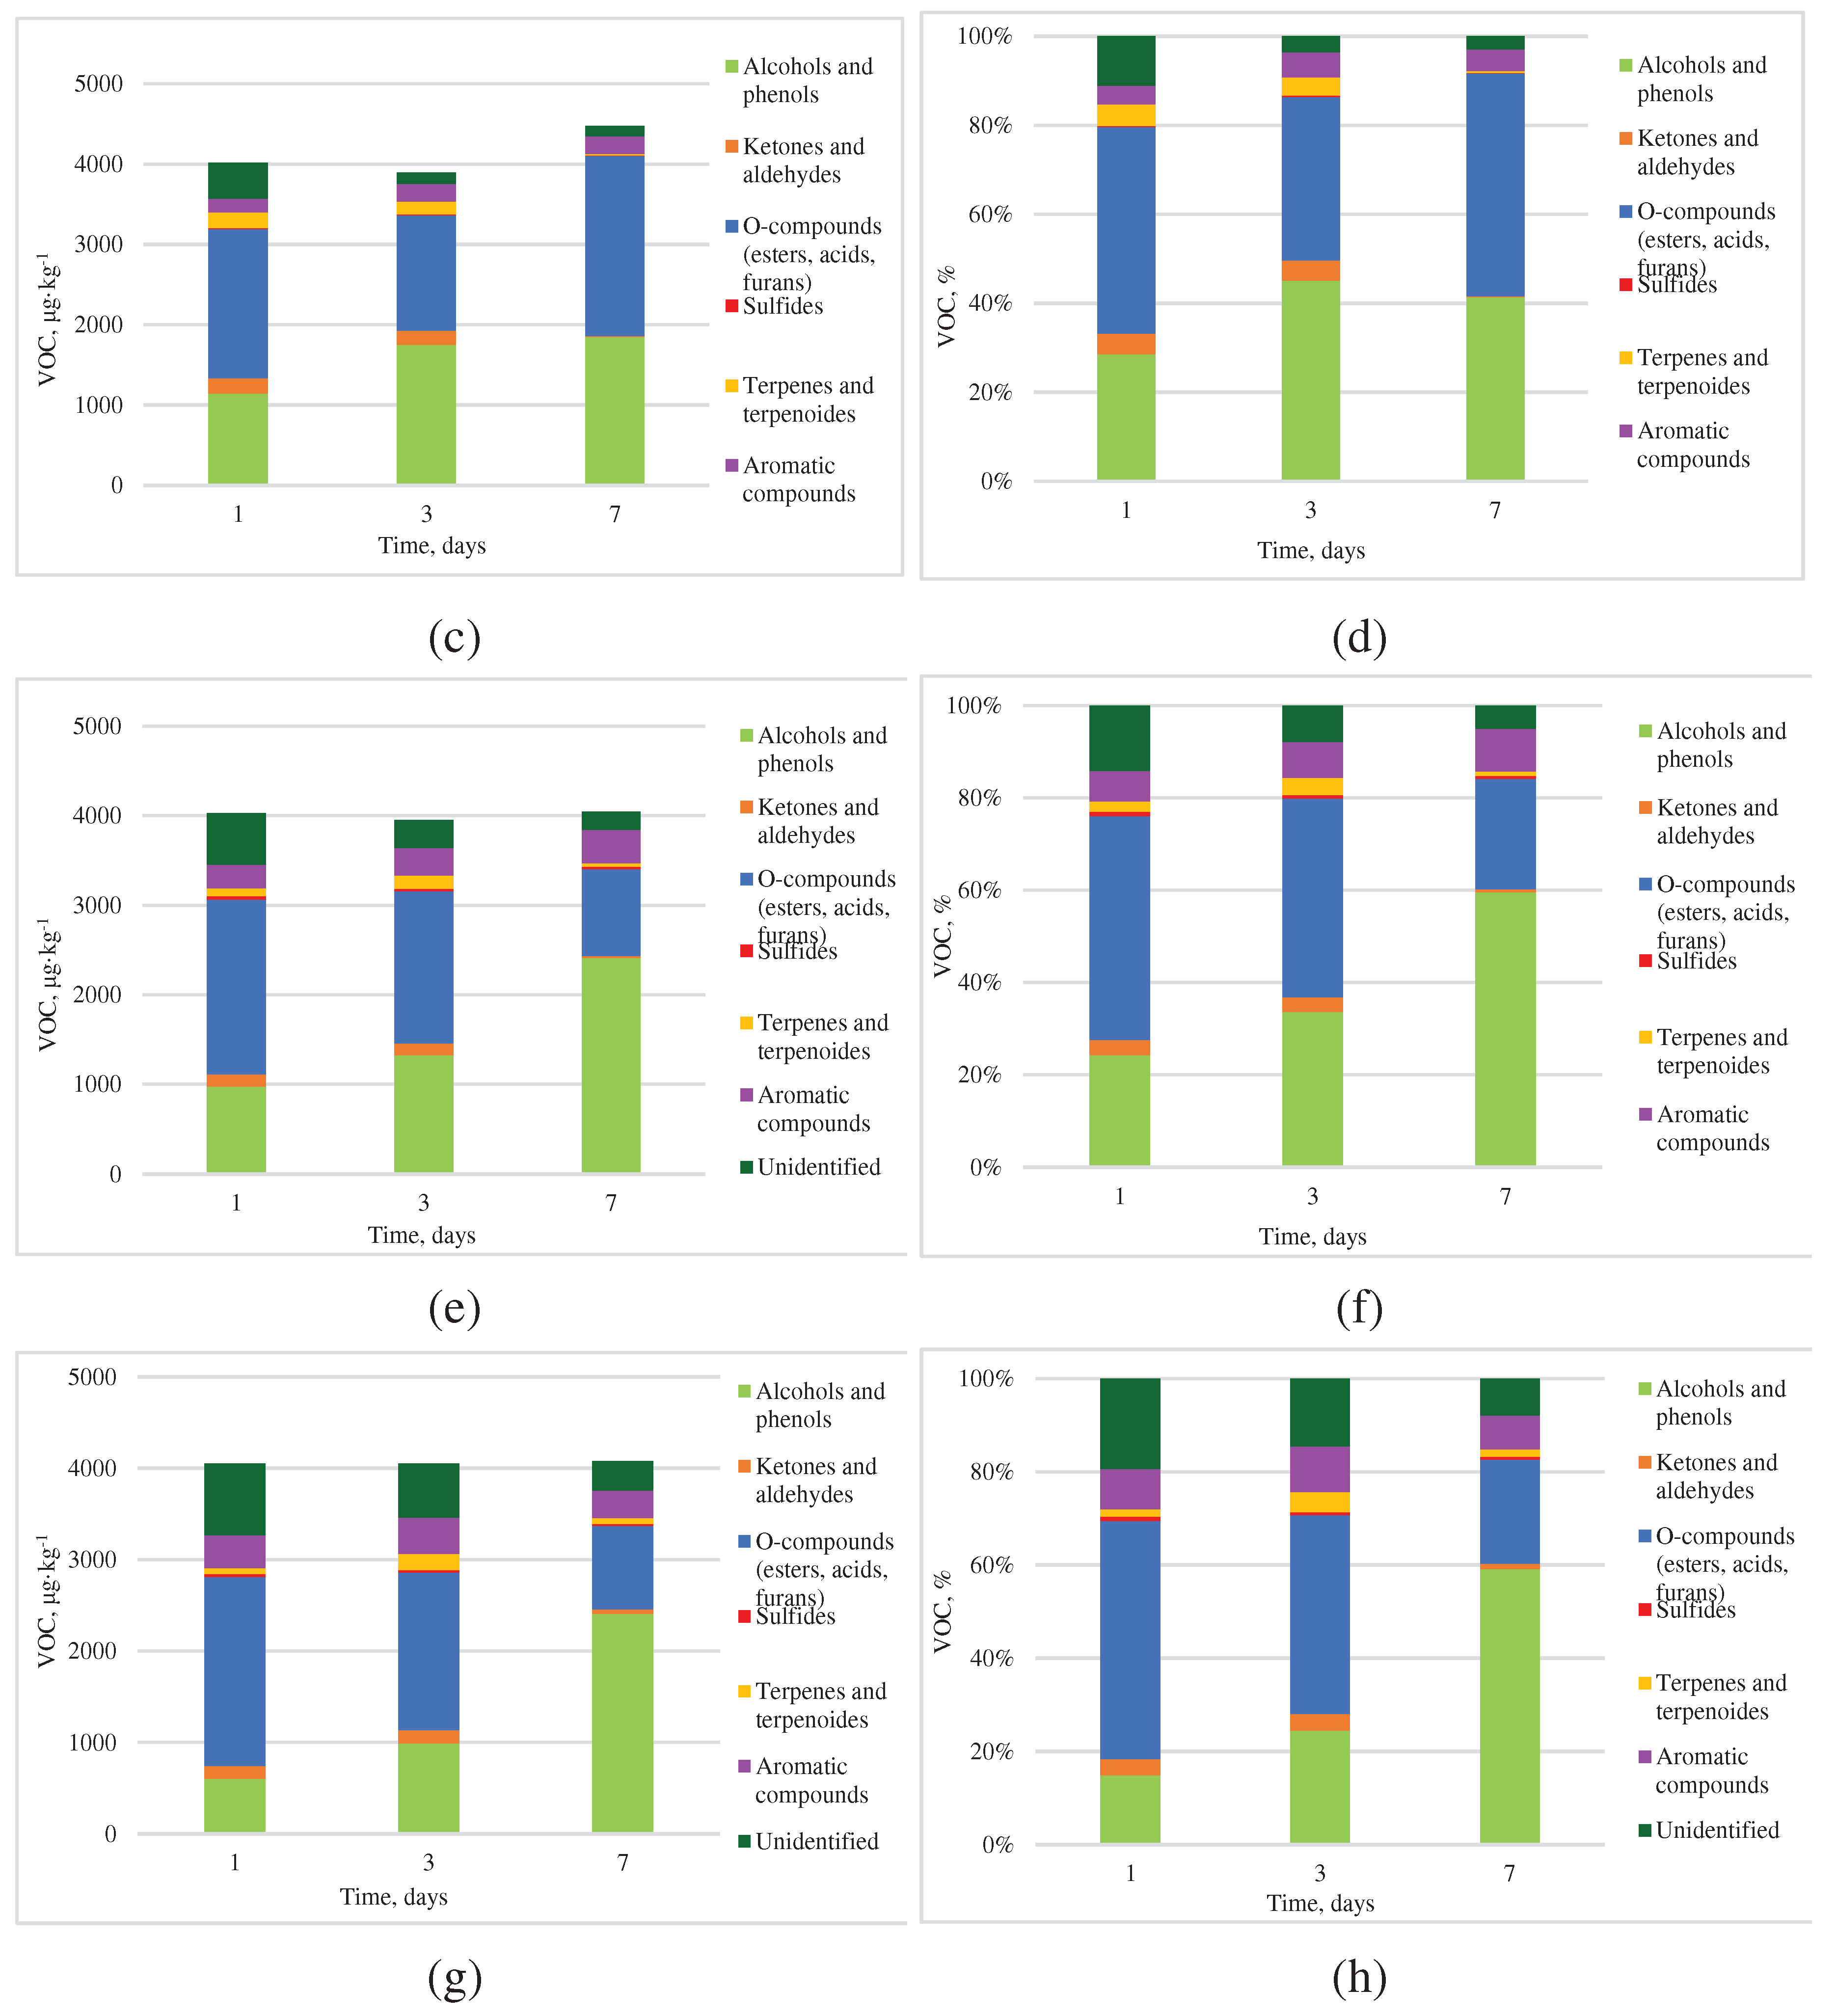
Figure 6.
Effect of biochar dose on different VOC emissions: (a) Valeric acid; (b) Hexanol <-n> (c) Acetic acid, hexyl ester, (d) Phthalate <diethyl-> (e) Octanol <n-> (f) Limonene, (g) Octanoic acid; (h) Benzeneethanol; letters (a, b) indicate the homogeneity group according to Tukey’s test at a significance level p < 0.05.
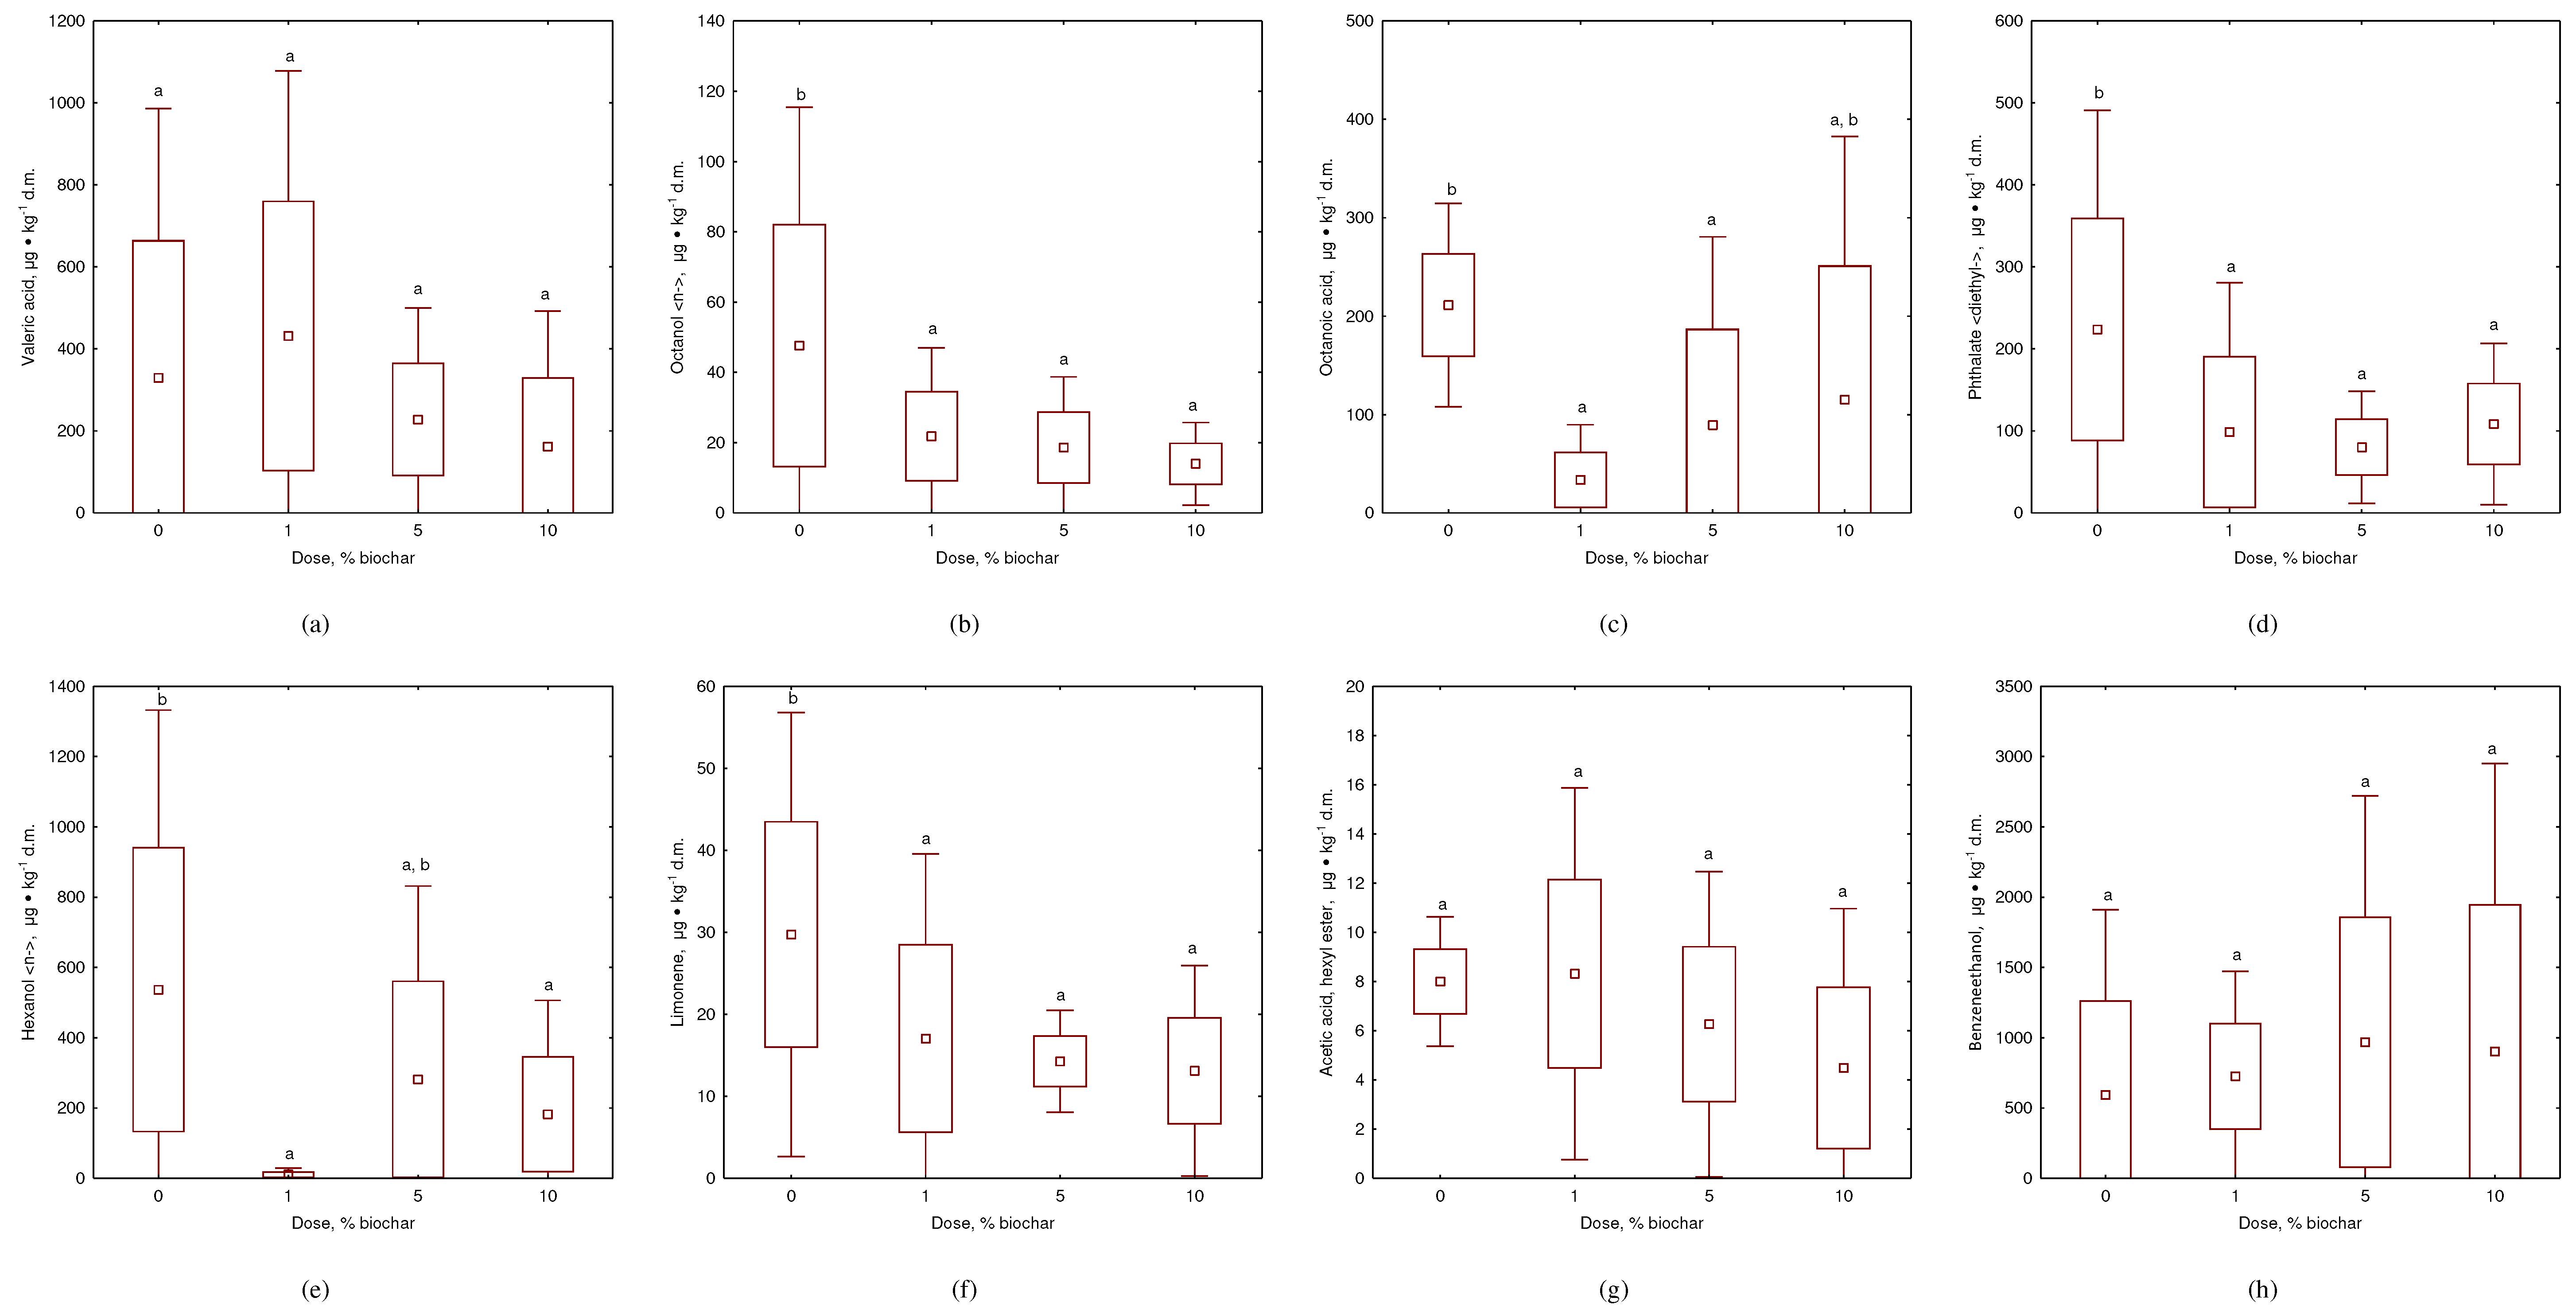
Figure 7.
Effect of time on different VOC emissions during the biochar addition: (a) Valeric acid; (b) Hexanol <-n> (c) Acetic acid, hexyl ester, (d) Phthalate <diethyl-> (e) Octanol <n-> (f) Limonene, (g) OctanoCamphoric acid; (h) Benzeneethanol; letters (a, b) indicate the homogeneity group according to Tukey’s test at significance level p < 0.05.
Disclaimer/Publisher’s Note: The statements, opinions and data contained in all publications are solely those of the individual author(s) and contributor(s) and not of MDPI and/or the editor(s). MDPI and/or the editor(s) disclaim responsibility for any injury to people or property resulting from any ideas, methods, instructions or products referred to in the content. |
© 2023 by the authors. Licensee MDPI, Basel, Switzerland. This article is an open access article distributed under the terms and conditions of the Creative Commons Attribution (CC BY) license (http://creativecommons.org/licenses/by/4.0/).
Copyright: This open access article is published under a Creative Commons CC BY 4.0 license, which permit the free download, distribution, and reuse, provided that the author and preprint are cited in any reuse.


