
Submitted:
30 August 2023
Posted:
01 September 2023
You are already at the latest version
Abstract
Breast cancer (BC) is the second leading cause of death in the United States in women. 1 in 8 women in their lifetime has a risk of developing breast cancer. With advances in omics technology, more data is available for diagnosis, treatment, and prognosis. The help of Machine Learning algorithms, a subdomain of Artificial Intelligence, would allow for a better clinical support tool. Machine Learning could be the key to answering a complex problem in BC. The methodology of this research question involves collecting and finding data such as RNA-Seq datasets, selecting and training appropriate machine learning algorithms, and evaluating the performance of the algorithms in predicting BC prognosis. Also, the study explores and tries to identify the most relevant genes and pathways through feature selection extraction and dimensionality reduction techniques. After applying feature extraction, the top 10 genes were extracted using the Univariate Feature Selection (UFS) method, precisely the SelectKBest technique. After employing different machine learning algorithms, such as Networks, Random Forest, Linear SVM, Logistic Regression, and Quadratic Discriminant Analysis (QDA), we found QDA was the best model in classifying the RNA-seq dataset with a 96% accuracy rate and 94% ROC AUC. This study suggests that AK2 and CD68 have a positive correlation with each other, and it could potentially be a biomarker and therapeutic target for BC.
Keywords:
breast cancer
; machine learning
; BRACA1
; BRACA2
; biomarker
; QDA
1. Introduction
Breast cancer (BC) is the most common cancer in women in the United States.[1] It affects about 30% of women each year. The incidence rate has increased by 0.5% per year. Breast cancer is considered the second most common cause of cancer-related death among women, as per the American Cancer Society (ACS). ACS estimates that 2.5% of women with cancer will die from breast cancer. The possibility of a woman developing BC throughout their lifetime is one out of eight [1,2].
With current Advances in treatment and screenings, cancer death rates have decreased since 1989. The total decline rate is 43% through 2020 [1]. Even the decline of 43%, the ACS estimates for 2023 that 297,790 new cases of breast cancer and 43,700 women will pass away from BC. Nonetheless, there are 3.8 million BC survivors in the US [1].
Moreover, there are different ways to describe breast cancer and more than one way to classify BC. The first way of explaining is Ductal or Lobular carcinoma. The word carcinoma represents where the tumor starts: In the epithelial cell. Ductal carcinoma starts in milk ducts, and Lobular carcinoma is the location where the gland in the breast makes milk. Once the tumor has formed in the breast, the specific type is called adenocarcinoma.
Furthermore, the second way of defining breast cancer is if the breast cancer has metastasized or not. Invasive or In situ Breast Cancers. In situ type is breast cancer in the milk ducts that has not developed yet or fully advanced in the breast tissues. It is considered pre-cancer or Ductal Carcinoma In Situ (DCIS). The other type is known as infiltrating or invasive. This type of breast cancer spreads to surrounding breast tissues. The most common type of invasive breast cancer is invasive ductal carcinoma, which makes up 70-80% of all BC [3].
In addition, there are distinct types of invasive BC. These include Triple-Negative Breast Cancer (TNBC) and Inflammatory Breast Cancer (IBC). TNBC is aggressive compared to other types. It comprises 15% of all BC and is one of the most challenging types to treat. The tumor cells in TNBC lack estrogen or progesterone receptors (ER or PR). Also, this type of BC has insufficient production of HER2 protein or sometimes has a surplus of the HER2 protein [4].
HER2 is a protein that allows for the rapid development of BC cells. There are two types, HER2-positive and HER2-negative. HER2-positive is when the BC cells have elevated levels of HER2 protein. HER2-negative breast cancer cells tend to grow at a faster rate compared to HER2-positive breast cancer cells [4,5]. The American Cancer Society also recommends that all invasive breast cancers testes for HER2 protein [5].
IBC is a less common form of invasive breast cancer, accounting for only 1-5% of all cases. IBC results in blockage of lymph vessels in the skin, leading to the breast appearing "inflamed" [4]. IBC occurs in younger women that are less than 40 years old. Also, it is more common in a woman that is overweight and obese. By the time the individual is diagnosed with IBC, roughly 1 in every 3 cases, cancer has advanced and metastasized to surrounding tissues and other parts of the body. For this reason, it becomes tougher to treat efficiently. Also, IBC patients tend to experience a worse prognosis than any other BC type [6].
The other lesser common breast cancers are Angiosarcoma, Phyllodes Tumor, and Paget disease of the breast. Paget disease of the breast is very rear and consists of one to three percent of all BC cases [4]. This type of breast cancer originates in the milk ducts, spreads to the nipple skin, and eventually involves the surrounding areola. Areola is the dark area around the nipple. 80%-90% of cases of this type are discovered with DCIS or infiltrating ductal carcinoma [7].
On the other hand, Angiosarcoma makes up only one percent of all breast cancer. Angiosarcoma develops after someone has received radiation therapy [8]. This typically happens after eight to ten years after exposure. This breast cancer originates in the cell line of lymph vessels and blood vessels. Lastly, Phyllodes tumor develops in the stroma of the breast tissue, which is the connective tissue.
The well-known genes for breast cancer are Breast Cancer gene 1 (BRCA1) and Breast Cancer gene 2 (BRCA2). Both of these genes are high-penetrance tumor suppressor genes. The first BC gene family, BRCA1, operates as a tumor suppressor gene and maintains chromosome stability. BRCA1 is associated with cell cycle regulators and multiple repair proteins. Also, it participates in the formation of several complexes that aid in its functioning [9,10]. Some of the other functions include regulating the transcription of numerous genes in cancer and maintaining genome integrity by homeostasis levels of itself in case of genotoxic insult [11,12].
Moreover, BRCA1 functions as a substrate in the DNA damage response kinases ATR (Ataxia Telangiectasia and Rad3-related protein) and ATM (Ataxia Telangiectasia Mutated). Both of these are involved in responding to DNA damage [10]. Also, Homology-directed repair is a function recognized to BRCA1. BRCA1 plays a role in the error-free repair of double-strand breaks and in the repair of DNA damage caused by UV radiation in the homology-directed repair pathway.
Furthermore, BRCA1 acts as the major subunit of various protein complexes. All these different protein complexes help regulate and maintain genomic stability. The domain of BRCA1, BRCA1 C Terminus (BRCT), has been identified as crucial due to its involvement in cell cycle checkpoint, tumor suppression, and HR [13]. The protein complexes are involved in helping regulate the physiological process of BRCA1 HR.
There are four main functions, where BRCA1 is a major subunit of a different protein complex that maintains genomic stability. The first primary function is DNA Replication S-phase progression. The genes and the protein complexes engaged in this cell cycle are BACH1 and TOPBP1. BRCA1 Localization at the DSBS G2-M checkpoint is the second primary function. ABRAXAS, RAP80, BRCC36, BRCC45, and MERIT40 are part of DSBS G2-M checkpoint. These Protein complexes facilitate regulation and maintain the checkpoint.
The third main function is responsible for DNA resection G2-M checkpoint. It is composed of BARD1, CT1P, MRN, MRE11, RAD50 and NBS1. Lastly.0, the fourth main function is involved in the Homologous Recombination process. In this process, there are four protein complexes. These are BAH1, PALB2, RAD51, and BRCA2 [10].
The second breast cancer family gene is BRCA2. Its main function is in Homologous Recombination and its capability to attach to the strand RAD51. RAD51 helps aid in DNA Damage through eight BRCT repeats that recruit RAD51 to the site. In addition, BRCA2 communicates with PALB2 to repair and stabilize double-strand breaks [11]. Furthermore, BRCA2 has a crucial function in preserving genomic stability [10,12].
Moreover, BRCA1 and BRCA2 genes play critical parts in DNA repair, regulating mitotic or cell division steps, and cell cycle check control [10]. The occurrence of mutation of BRCA1 in the overall population is 1 in 300, and the frequency of BRCA2 is 1 in 800 [14]. It is very critical that there is no mutation in these genes because their role in maintaining stability is very much needed. Some mutations to these genes include small insertions or frameshift deletions, large duplications or deletions, and nonsense alteration or splice junction.
The application of Machine Learning in health care are vast. Machine Learning is the subdomain of Artificial Intelligence (AI) that uses software algorithms to identify patterns in an extensive dataset. Machine Learning is one of the innovative technologies implemented in health care. ML has been used in clinical environments and has shown impressive results in clinical decisions, surgical assistance, patient care, system management, and patient monitoring and coaching. In the near future, ML will be a significant part of clinicians due to complex problems and more considerable reasoning beyond human capacity. ML would close the gap between patients, data, and clinician decision making [15].
Also, more data gets produced as part of disease diagnosis, treatment, and prognosis. ML's utilization becomes necessary due to its ability to perform and analyze complex problems, multi-scale data, and multi-dimensional. This advancement would not be achievable without the contribution of advances in omics technologies. Advancements in Omics technologies have allowed ML to become a method to solve and figure out an effective and rapid program that would help in treatments and diagnosis. ML would become a big part of the clinician's support tool [16].
Moreover, the Machine Learning algorithm learns from previous data to predict future data. It employs various statistical, probabilistic, and optimization tools to achieve learning capabilities. This capability allows it to be used in complex problems such as proteomics and genomic measurements. Due to this reason, ML has been employed more frequently in cancer diagnosis and detection. The reason is that it would allow for three primary purposes, these include the prediction of cancer susceptibility, recurrence, and survivability [17].
Furthermore, as more cancer genomic data is available, several different ML classification methods could be developed and employed to allow for ML for diagnosis and treatment purposes. One such classification method is Support Vector Machine (SVM) learning method. This method has been employed on to genomics data to able to analyze genomics data and find novel biomarkers or signature discoveries using SVM [18].
Another ML method that employs an ML algorithm is Deep Learning in cancer biology. Deep Learning is a subdiscipline of AI that utilizes ML algorithms and is also known as a Neural Network. This model algorithm is the best fitted to isolate patterns and perform predictions. Deep Learning uses are in cancer diagnosis, treatment, and prognosis selection. Moreover, several subcategories of Deep Learning could be employed in cancer, accordingly [19].
Other different classifiers of ML have been deployed in cancer biology. These include Random Forest, KNN (K Nearest Neighbor), Ada Boost, Naive Bayes, QDA (Quality Discriminant Analysis), Logistic Regression, and Gaussian Process. Breast cancer classification has been performed using these classifiers. The different classifiers have also been implemented in this study. Each model has their advantages and disadvantages in terms of their implementation.
There are two main methods of deploying Machine learning, and these include supervised and unsupervised methods. The supervised method learns from labeled training data. Once the method has been implemented, new data is employed to predict. The results are then compared with each other. On the other hand, unsupervised learns common data from anonymous class data, which is not labeled [19]. Supervised and Unsupervised methods are the main categories of ML, and all the classifications of ML algorithms fall into these two categories.
Multiple breast cancer studies implement Machine Learning algorithms to understand better how each model performs in their research purpose. There are a variety of fields in which ML was implemented based on used case scenarios. These range from classifying MRI images, Mammography results, Computed Tomography (CT Scans), PET Scans, Ultrasound, patient profile data, or other diagnostic procedures. In some way or another, different data have been implemented in Machine learning algorithms to help guide researchers to their objective and purpose of the study.
For example, one study implements Deep Learning to detect breast cancer. Their study looked at data from Mammograms, CT images, MRI, 3D mammography, and Histopathological Imaging. The purpose of the study was to efficiently and accurately classify BC using various photos. For their purpose, Deep Learning was the best ML model because of its ability to analyze big data and extract the most critical features from each imaging [20].
Moreover, another study invented a DeepProg model, an ML algorithm built on Deep Learning. DeepProg is a novel DL model that predicts survival rates based on different multi-omics data supplemented with survival rates. The data sets included mRNA transcriptomics, DNA methylation, and microRNA expression. DeepProg model was created through their study as a way of predicting the survival rate of an individual [21].
In addition, their study explored two different types of cancer with seven different datasets. The first two datasets are from liver cancer, and the other five are from breast cancer datasets. Moreover, they also explored vital genes from the worst survival subtypes. They employed feature extraction from their dataset using the Wilcoxon rank test with p values below 1e-4. Then, they calculated Cox-PH regression in different cancers.
Furthermore, another study examined metabolomics for triple-negative breast cancer and implemented machine learning algorithms. In the study, the purpose of using ML models was to classify and distinguish the subtypes of metabolomics. Their models included SVM and LASSO [22]. Moreover, another study examined breast cancer therapy response and implemented ML models based on multiple datasets to predict the therapy responses. The datasets include digital pathology, clinical, transcriptomic, and genomic data. 168 patients with breast cancer were included in the study, and they received chemotherapy either with or without HER2 [23].
Some studies even researched using ML algorithms to predict BC based on personal data [24]. Their models were trained on different cancer types. Then the ML algorithms were implemented into the breast cancer dataset. In addition, another study has utilized different ML algorithms to detect BC using patient data. Their data was from Wisconsin Diagnostic Breast Cancer. Their methodology employed SVM, Neural Network, Random Forest, Gradient Boosting, and multiplayer perception [25].
Others have developed novel machine learning algorithms called Radiomic that can calculate and predict prognostic factors of BC. This model combines angiogenesis properties and tumor heterogeneity of MRI to train the machine learning model [26]. Nonetheless, the usage of Machine learning has been widely used in breast cancer. One study uses ML model to predict the TNBC Immune subtype. Due to their research, they have produced an open and free website built on a Random Forest model that can predict and provide a better prognosis. Their model requires gene expression profile data to distinguish the immunotherapy response subgroups [27].
In addition, one study examined the analytical accuracy of distinct ML algorithms by conducting a meta-analysis. The study implemented five other models, SVM, Decision Tree, Naive Bayes, and KNN to find a better model that predicts breast cancer risk. They concluded that SVM was the best model and could predict breast cancer risk with greater accuracy [28].
Also, more studies use ML to predict some aspects of breast cancer. For example, one study uses ML algorithms to predict transcriptome profiling and feature selection. Their input data was based on clinical data that was downloaded from TCGA. They implemented more than 13 classifier algorithms to see which algorithms have the best accuracy and area under the Curve (AUC). They concluded that Local Gaussian Regression and Multilayer perceptron were the best [29].
2. Materials and Methods
The dataset collected and downloaded for this study was found in Structural Bioinformatics and Computational Lab (SBCB). The RNA-Seq dataset, through microarray, is part of the Database for cancer research that is created by the SBCB. The name of the Database is BARRA: CuRDa. CuRDa stands for Curated RNA-Seq Database for Cancer Research. This Database was built to allow scientists to have a curated dataset for Machine Learning protocols. The Database is comprised of 17 different RNA-Seq datasets for other cancer types. The dataset is downloaded from Gene Expression Omnibus using thorough filtering measures [30].
Figure 1.
Workflow of curating the Datasets. This figure was adapted from the SBCB website. It was adapted for the reason to provide the curation method for processing and filtering datasets for ML application purposes. This figure is an actual adaptation of their figure.
Figure 1.
Workflow of curating the Datasets. This figure was adapted from the SBCB website. It was adapted for the reason to provide the curation method for processing and filtering datasets for ML application purposes. This figure is an actual adaptation of their figure.
The steps that were done to curate the dataset for machine learning. Each dataset underwent the removal of low-quality bases and ribosomal RNA, sample quality analysis, transcript level quantity, and artifacts from the experimental process. The raw data from Gene Expression Omnibus was retrieved. Then, Quality Control was imposed using the FastQC technique to assess the quality control. Next, trimming was performed using the Trimmomatic method. Once again, the Quality Control was implemented using FastQC.
After Quality Control, Alignment and transcript quantification was performed using RSEM plus STAR technique. The reference genome that was used was GRCh38.94. After this step, the Summarization of transcript-level abundance into gene-level abundance estimation was done using the tximport plus DESeq2 technique. Lastly, matrix transformation using variance stabilizing transformation function from DESeq2. Lastly, the datasets were converted to different files format and uploaded to the Database.
Three breast tissue datasets were downloaded in .csv format for this study. The size of the data for each dataset ranged from 21 MB to 35 MB. Each of the datasets contained 58,735 genes. The first dataset had 20 samples; the id number associated with it is GSE5194. The second dataset had 35 samples, and the id is GSE69240. The last dataset had 33 samples with the id number GSE71651. Each dataset had two classes. One was 'Normal,' and the other was 'Tumor.'
The .csv file had an id number in the first column—a class in the second column, and genes in the other columns. The id number is in SRR format (e.g., SRR1027171). The SRR number is the Run Accession number found in European Nucleotide Archive. The genes are id based on ENSG format (e.g., ENSG00000000003), and the ENSG format genes belong to e!Ensembl Database. Both SRR and the genes belong to some form of breast cancer project.
The dataset was divided into training and testing sets using the train_test_split method of the sklearn library. The first step of splitting the dataset was to assign X and Y values. X had the values of all the different genes. The y variable contained the values of 'Class,' which is 0 or 1. Since there was inconsistency with the sample size not being even, Over-sampling had to be performed. For this study, SMOTE oversampling was chosen. SMOTE stands for Synthetic Minority Over-sampling Technique.
This method produces synthetic cases using the K Nearest Neighbor technique on the minority class, which are normal samples. This method does not duplicate, whereas other over-sampling methods do duplicate. The synthetic examples are generated based on the k-nearest neighbor of the minority class examples, and SMOTE technique was applied through the "imblearn.over_sampling" library. The new x and y had a sample size of 114 after over-sampling.
Next, the data is divided into training and testing sets. This was executed using the train_test_split method. The data was divided into training and evaluation sets, with 80% of the data used for training and the remaining 20% for model performance evaluation. The dataset was split into four categories 1) X_train, 2) X_test, 3) y_train, and 4) y_test.
For the purpose of choosing a specific model, there was no way to tell which model would perform the best. Eleven different machine-learning models were trained. The 11 models are 1) Logistic Regression, 2) KNN, 3) Linear SVM, 4) RBF SVM, 5) Gaussian Process, 6) Decision Tree, 7) Random Forest, 8) Neural Network, 9) AdaBoost, Naive 10) Bayes, and 11) QDA.
In addition, the incorporation of the QDA model in this study models the probability density functions of each class using a quadratic decision boundary and is derived from Bayes' rule.
 It utilizes multivariate Gaussian distribution with density to be maximized. In order to have a maximum density for a class base of the covariance matrix, where QDA has no assumptions of covariance matrices of the Gaussians:
 QDA model takes the model above, and applies the log of the posterior which is:
The constant Cst reacts to the denominator P(x), and the predicted class that responds to the log-posterior is the one that gets maximized.
Moreover, each of the models was given specific parameters to calculate the accuracy of each model. Then, four distinct categories of X and Y values were passed accordingly to each model (See Appendix A). For each model, their respective library and Class were called to train the models. Each model hyperparameters were adjusted to produce the best machine learning model best on the accuracy, f1 score, precision, recall, and AUC scores.
The selection of the model was based on its accuracy. Each model score was calculated using the "variable" score method. This is to see what their respective accuracy value is. The initial accuracies of each model were produced without any parameters in place. Once the initial accuracies were determined, each model was reevaluated with different parameters to improve the accuracy.
Furthermore, once again, each model was utilized to determine which model would best fit for prediction. Once the prediction function was called, the classification report method was called to determine each model's precision, recall, f1-score, and accuracy values. Once these values were produced carefully, only one model was selected based on the highest accuracy and with an excellent classification report.
To validate the models, the Cross_val_score class was utilized from the sklearn.model_selection library. The k-fold validation technique was employed to assess the selected model. The parameters that were set for cross-validation included the QDA model. X and Y train data values and cv was manipulated to produce the highest accuracy. Also, AUC (Area Under the Curve) was calculated as well. This was done by calling roc_auc_score from sklearn.metrics library.
This method is a scalar evaluation metric that summarizes the binary classifier's performance by evaluating the classifier's capability to differentiate between positive and negative classes. The AUC is a graphical representation of the relationship between the true positive rate (TPR) and the false positive rate (FPR) in the area under the Receiver Operating Characteristic (ROC) curve.
Before employing the Univariate Feature Selection (UFS) technique, the dimensionality reduction technique was applied to acquire a valuable prediction and to extract the functional genes and pathways from dataset. For this study, Principle Component Analysis (PCA) method was selected. This method is one of the popular techniques for lessening the number of features in a dataset while preserving as much information as possible. The technique identifies essential underlying patterns, or principal components, in the data and projects the data into a lower-dimensional space. PCA is commonly used for visualizing high-dimensional data, removing noise and outliers, reducing data complexity, and improving the performance of ML algorithms.
The UFS technique was employed to extract the best special features. Among UFS, the SelectKBest method was chosen as part of this study. SelectKBest and f_classif were called from sklearn.feature_selection. The parameters that were used to deploy k-selection were utilized as a statistical method to calculate the feature selection. For this study, f_classif was chosen. F_classif calculates the ANOVA F-value for the data values. This technique is best for feature/classification models such as in this case.
Also, k was set to 10. It is because k was based on a validation method that produced the highest level of accuracy. The top 10 genes were extracted from the tumor class dataset. When extracting the genes, the columns were missing a header. The header from the original dataset was extracted and passed into the new dataset to resolve the issue. This is to identify to what gene the values belonged. (See Appendix A: Applying UFS with PCA Technique)
For visualization, the first method was a heatmap to represent the extracted genes best. Class sns was imported from the seaborn library to graph the genes. The correlation values were calculated to graph the heatmap. The same thing was applied to produce a bar plot. Class plt was called from matplotlib. pyplot library to execute and create the graph.
Next, Extracted Genes were evaluated in Database to find the gene id. ENSG gene id was matched to the Ensemble database to find what gene it belonged to. A table was created with ENSG IDs from extracted features, along with gene names.
3. Results
Multiple steps were required to obtain the best ML model. The first step was calculating the initial accuracy values for each model with x_test values. Once that was calculated, hyperparameters were manipulated to generate the best and highest accuracy for each model. The only significant model that was impacted by the hyperparameters was Decision Tree. The level of accuracy increased by 8%. Other models were not affected as much by the hyperparameters—the updated accuracy is presented in Figure 2. Aamir and his colleagues have manipulated ML models to get the best accuracy [25].
After calculating each model's accuracy, the Quadratic Discriminant Analysis model had the highest percentage accuracy. It had a score of 96%. The second-highest accuracy was 91%. Five different ML models had this score 1) Logistic Regression, 2) Linear SVM, 3) Random Forest, 4) Gaussian Process, and 5) Neural Network. With every other model, it had an accuracy of 87%. (Figure 2)
After evaluating the accuracy values of ML models to each other, the best model was QDA. QDA generated the best accuracy and had the best f1 score, recall, and precision score. In addition, it has an AUC score of 94.4%. It shows that the QDA Machine learning model best predicts breast cancer based on the RNA-Sequence dataset. Other studies have implemented the QDA model in their study. For example, in the analysis of microarray data, identifying protein-coding regions, and predicting splice sites [31,32,33].
In addition, every other model was consistent with the score values except for RBF SVM. RBF SVM had a 0.39% of accuracy. Compared to other models, each model was consistent with Precision, Recall, F1 score, Accuracy, and AUC. But RBF SVM did not perform very well, it had the worse accuracy. (Figure 3) This could mean this model is not the best fit to predict BC based on RNA-Sequence.
The next logical step was to validate this model using the k-fold validation test. This test showed it had the best validation accuracy rate and the standard deviation score for QDA. The k-fold test was applied with parameters cross-validation (cv) equal to 10. Cross-validation was set to 10 because the cv was manipulated with different numbers to produce the highest validation accuracy. The QDA k-fold validation had an accuracy of 0.88 with a +/- 0.20 standard deviation.
Moreover, the results for the top 10 genes were extracted using PCA and UFS techniques. The PCA values of the top 5 Tumor samples along with the ENSG number, were visualized and presented when the technique was applied. These ENSG names were then matched with data based to find correspondence gene names.
Table 1 shows the names of the genes that were extracted. These genes included SARM, POLDIP2, PLXND1, AK2, CD68, FKBP4, KDM1A, RBM6, CAMKK1, and RECQL. The functions of each gene will be discussed more thoroughly, and there are studies about the genes that are associated with BC in the next section.
The Univariate Feature Selection (UFS) method is the best extraction method to extract the best features from the Tumor class dataset. This method was selected because of its compatibility with the QDA model. The other feature extraction method, Recursive feature elimination (RFE), could not be employed due to its ability to function with linear kernel models such as Linear SVM, Logistic regression, or others. Due to this reason, the UFS method was selected. Also, other studies have implemented to UFS method to discover new biomarkers and have been declared the best feature selection [34,35].
For the statistical score, the ANOVA f-value was selected for classification [36,37]. In addition, UFS contains subcategories in which this method could be employed. These include SelectKBest, SelectPercentile, and SelectFpr. SelectKBest was selected among these subcategories because it can choose any feature "k" and statistical scores.
Before applying UFS, a dimensionality reduction technique was utilized to decrease the number of features and choose the top key features. Principle component Analysis (PCA) was chosen because of its ability to preserve the maximum amount of information and allow for increased interpretability [38,39]. PCA was applied to the Tumor class genes, and then it was transformed to fit. Also, only the absolute values were taken into consideration because the SelectKBest method only handles the positive values to extract the feature.
The best feature extraction genes are SARM, POLDIP2, PLXND1, AK2, CD68, FKBP4, KDM1A, RBM6, CAMKK1, and RECQL. The top 10 genes were extracted using the SelectKbest method and the PCA technique. Only the top 10 were extracted because of cv was equal to 10 in the previous validation method.
The first gene SARM is part of the axon degeneration function family. This gene is a NAD+, a cleaving enzyme responsible for axon destruction triggered by NMN/NAD+ ratio [40]. SARM1 gene has been linked to prostate cancer [41]. Moreover, SARM1 has been suggested to be valuable for therapy resistance and could be a relevant clinical target for cervical cancer [42]. Also, this gene has been documented to be patent for Colorectal cancer [43].
There has not been a direct connection between this gene and breast cancer. But a connection has been established between this gene and various other types of cancer. Other cancers are prostate and cervical cancer. There are no studies that have been published regarding this gene with BC. It does not contribute to being the first novel biomarker for breast cancer. Further analysis needs to be conducted and performed to find if this gene plays an important role in BC patients.
The second gene that was identified was POLDIP2. This gene portrays a significant role in proliferative cell nuclear antigen, and the gene encodes for a subunit of p50. This gene has been identified to be upregulated in BC tissue [44]. Moreover, this gene is suggested that overexpression of this gene might be able to prevent the proliferative, invasive, and migrative abilities of BC [45]. Also, this gene has been found mutated in Secretory breast Carcinoma [46], and the transcriptional structure of TNFAIP1 and POLDIP2 has been involved in BC progression [47]. In addition, the knockdown of this gene has been linked to the suppression of tumor growth and invasion capacity in non-small cell lung cancer [48].
Not much research has been conducted to identify the role of POLDIP2 and suppression in breast cancer research. Potentially, POLDIP2 could be a biomarker for breast cancer. Also, this study has found that this gene has the highest ANOVA F1 test score compared to other genes. (Figure 5). The score would suggest that this gene should be investigated and researched more thoroughly to be identified as a biomarker or therapeutic target for BC.
Next, the PLXND1 gene belongs to the transmembrane of proteins called plexins. This gene has been recognized as the receptor for semaphorins, which aids in vascular patterning and axonal guidance. This gene has been identified as an effector of Notch signaling in cancer cells as a novel transcriptional target. The secreted semaphorins Sema3E are responsible for cell migration and invasiveness in cancer cells. The Sema3E receptor, PLXND1, is overexpressed in several types of cancer, including melanoma, breast, colon, ovarian, and prostate cancer [49].
Figure 6 represents and shows the upregulation of PLXND1 in one tumor class sample with the highest peak. (Figure 6) The graph is a representation of each Tumor sample class being plotted with PCA values. In one class, it shows that there is a peak in one sample that could suggest the upregulation of the PLXND1.
Nonetheless, Sema3E promotes cancer invasion and metastasis by inducing angiogenesis. This ligand, Sem3E, is known to ensure BC cell viability. It is done through the blockage of an unknown proapoptotic signaling cascade, where PLXND1 acts as the dependence receptor [55]. Also, PLXND1 aids in supporting the development of Tumors by allowing tumor metastasis and epithelial-mesenchymal transition. Moreover, the interaction between Sema3E and PLXND1 plays a crucial role in inducing apoptosis and tumor resistance. Luchino and his colleagues suggest that activating a dependence receptor pathway could be exploited as a therapeutic approach [50,51].
The fourth identified gene, AK2, maintains the stability of the adenine nucleotide pool. This gene is said to play a role in cell proliferation and death. AK2 has been ruled to be in lung and breast cancer tumorigenesis. Furthermore, this gene participates in the RAS-BRAF signaling pathway. This pathway is a critical pathway that is found in human cancer. It is responsible for cell proliferation. Kim and their colleagues have shown that this AK2 is a BRAF-suppressor in their research [52]. In addition, AK2 has been identified as a promising biomarker for TNBC [53].
Moreover, CD68 is the next identified gene. CD68 is a glycoprotein with glycosylation that is detected in macrophages and other types of mononuclear phagocytes. CD68 is an immune cell subtype that represents innate immunity. The immune cells are found in the breast ductal lobules of normal breast cancer tissue [54]. In addition, a higher percentage of CD68 has been found in ductal carcinoma in situ [55]. Also, a high density of CD68 was identified in TNBC, specifically in Tumor Nest and Tumor Stroma [56].
CD68 has been recognized as a favorable indicator of prognosis when utilized either independently or alongside other cell markers to identify tumor-associated macrophages. It had an excellent predictive value for the survival of cancer patients [55]. Moreover, this study has determined that CD68 and AK2 positively correlate with a score of 0.92. (Figure 7). The positive correlation score could suggest that these genes might work together toward breast cancer. Also, it could be an excellent point for using as a biomarker or therapeutic to treat breast cancer. No such study has been done that has analyzed or researched these two genes. Both of these genes could provide a new research area that has never been explored.
Next, the FKBP4 (HFKBP Prolyl Isomerase 4) gene belongs to a group of proteins known as immunophilins. FKBP4 plays a crucial role in regulating the immune system and in various cellular processes, such as protein folding and trafficking of HSP90. This gene has been associated with being a malignant factor for a particular subtype of breast cancer known as Lumina A. Also, Xiong has suggested that FKBP4 is an important prognostic indicator that could eventually be exploited in drug targets for Luminal A subtype breast cancer [57]. In addition, FKBP4 has been identified as a pathway that could provide insight into a novel anti-tumor method against breast cancer. The identified pathway is the FKBP4/ NR3C1/ NRF2 axis [58].
Furthermore, the next gene identified in this study was KDM1A or Lysine Demethylase 1A. This gene is highly expressed in TNBC [56]. KDM1A participates in regulating and forming a corepressor complex with CoREST/histone deacetylases. This complex, along with OTUD7B, a unique switching partner, plays an integral role in maintaining KDM1A/CoREST corepressor complex and in breast cancer metastasis [59].
In addition, Wang and his colleagues have identified an inhibitor, ORY-1001 suppresses androgen receptor expression by preventing proliferation and promoting apoptosis of TNBC cells [60]. Moreover, another study suggests an NCD38 inhibitor that could be a novel drug class for treating TNBC. Also, the inhibition reduces cancer stem cell functions due to the inhibition of STAT3 and epithelial-mesenchymal transition (EMT) signaling [61].
Last but not least, RBM6: RNA Binding Motif Protein 6 was the following gene identified through feature selection. RBM6 is responsible for alternative splicing and harboring tumor suppressor activity. Machour and his colleagues have identified RBM6 as a novel homologous recombination regulator (HR) that repairs DNA DSBs. Also, they provide insights that RBM6 is a possible therapeutic target for advanced BC [62]. Moreover, other families of RBM, such as RBM5 and RBM10, play a vital role in BC. Especially, RBM10 has been identified for regulating tumor apoptosis, proliferation, and metastasis [63,64,65].
Furthermore, CAMKK1, a Calcium/Calmodulin Dependent Protein Kinase Kinase 1, belongs to Serine Threonine protein kinase. It has a crucial function in the cascade of Calcium Calmodulin-dependent kinase. The knockdown of CAMMK1 has been associated with a decrease in phospho-Akt (Thr308) and increased apoptosis in SK-BR-3. SK-BR-3 is a BC cell that overexpresses HER2 [66].
Lastly, the last gene that was identified as part of feature extraction was RECQL, RecQ Like Helicase. This gene is responsible for maintaining genome integrity and prevents double-strand DNA breaks by restabilizing stalled replication [67]. Mutation in this gene has been linked to BC, and mutations in RECQL may serve as a valuable biomarker and potential target for the treatment of BC [68,69]. Banerjee suggests that the help of novel DNA repair inhibitors could pave the way for new strategies in treating cancer [70].
4. Discussion
The genes identified in Table 1 from this study are different compared to other genes found in other published studies. Also, the methodology in which the features selection and feature extraction are different compared to others that have been employed. One such study found seven novel biomarker genes using the Cox regression model based on gene expression to predict survivability. In their study, they found AC123595.1, LILRB5, CD209 molecule, AL049749.1, LYVE1, TMEM 190, and TUBA3D. [71]
Among these genes, only LYVE1 and CD209 have been associated with cancer. LYVE1, lymphatic vessel endothelial hyaluronan receptor 1. This gene is a type 1 integral membrane glycoprotein responsible for binding soluble and immobilized hyaluronan. On the other hand, the CD209 gene is identified as a protective biomarker in the prognosis of BC. Moreover, these identified genes in their study were the only genes associated with BC. Other five genes that are suggesting that the functions are not known currently, and further investigation needs to be conducted to find those functions.
In addition, another study has identified potential marker genes for better immunotherapy decisions. They have identified SERPINA1, CD74, STX11, ADAM9, CD24, NFKBIA, and PGK1. These genes are potential gene markers for macrophages that could be targeted for breast cancer prognosis. Their dataset involved a Single-cell RNA sequence, and their method involved applying PCA combined with t-SNE for dimensionality reduction technique. They calculated Cox regression models and the Kaplan-Meier method for statistical analysis purposes. [72]
The genes identified above, only CD24, CD74, and PGK1 had the highest tumor expression compared to adjacent tumor normal tissues and the highest expression compared to other genes. These genes were positively correlated with BC. Also, they suggest that CD74 and SERPINA1 are negatively correlated when comparing gene expression and DNA methylation. This means that DNA methylation could be a key regulator among these two genes.
Moreover, another study has potentially identified KIF11 and RRM2 as therapeutic targets or prognostic targets. This result is based on their redundancy analysis. KIF11 is associated with proto-oncogene with BC, wnt signaling pathway and recurrence of hepatocellular carcinoma. On the other hand, RRM2 is found to be associated with Prostate cancer. In this study, they suggest this gene could be a potential breast cancer therapy target. Also, this gene is involved with tumor cell proliferation in the YBX1-RRM2-TYMS-TK1 axis governing metabolism. Lastly, the 10 DEGs identified from their study include DLGAP5, AURKA, UBE2C, CCNB1, RRM2, KIF23, KIF11, NCAPG, ZWINT, and DTL. [73]
Others have been able to identify a key gene, TPX2, in HER2+ breast cancer. TPX2 key gene had never been reported in previously published studies. Due to this, this could be a potential novel gene involved in HER2+ BC. Their dataset involved HER2+ breast cancer from the GEO and TCGA website. The genes were identified through a multi-factor logistic regression analysis technique. The ten key genes that were identified from their study included CCNA2, CDK1, CDC20, CCNB1, DLGAP5, AURKA, BUB1B, RRM2, TPX2, and MAD2L1. Among these ten genes, only five genes were identified to be associated with the prognosis of HER2+: CDC20, CCNA2, DLGAP5, RRM2, and TPX2. Also, they suggest that the CDC20 gene had the highest correlation with HER2+ Breast Cancer. [74]
Also, BUB1, CCNA1, and PACC1 have been marked as protentional genes and therapeutic targets that could play potential roles in Triple-Negative Breast Cancer. These genes were identified through the LASSO feature selection technique. Their dataset involved using TNBC samples. The top genes identified from this study included PBK, TOP2A, CDCA8, ASPM, CCNA2, KIF20A, BUB1, AURKB, CDK1, and CCNB2. [75]
Furthermore, another study has deployed a log-rank test algorithm and other bioinformatics analyses to find potential gene biomarkers. They have identified eight hub genes for different subtypes of breast cancer. These genes include CCNE1, CENPN, CHEK1, PLK1, DSCC1, FAM64A, UBE2C, and UBE2T. This study suggests that FAM64A and UBE2T are up-expressed and associated with poor outcomes in BC. [76]
In addition, Xu and his colleagues have suggested these genes, COL12A1, QPRT, MRPL13, KRT14, KRT15, LAMB3, and MYBPC1 genes as prognostic genes. Among these genes, COL12A1 and LAMB3 were chosen for reverse transcription and RT-PCR process. The genes were identified by constructing a novel Protein-protein interaction network and conducting a survival analysis technique. The dataset was downloaded from TCGA and contained transcriptome breast cancer data. [77]
Moreover, another study has identified potential ant-breast cancer drug targets and prognostic markers. The study identified 13 hubs genes as potential therapeutic targets for BC. These genes, through various statistical analyses and combined with other steps, were identified and verified. The steps include WGCNA, PPI analysis, GEPIA 2, and HPA database. These genes include: CDK1, BUB1, BUB1B, CDC20, CCNB2, CCNB1, KIF2C, NDC80, CDCA8, CENPF, BIRC5, AURKB, PLK1, MAD2L1, and CENPE. Out of these 13 hub genes, only two genes, CCNB1 and PLK1, were identified to be strongly associated with the low survival rate of BC. Also, these two genes were highly expressed in all breast cancer stages. This study suggests that two genes could be potential drug targets.[78]
In conclusion, this study provided multiple Machine learning algorithms that could be used to quantify and classify breast cancer based on RNA-Sequence. However, the model that worked the best was Quadratic Discriminant Analysis with an accuracy of 96%. Furthermore, the feature extraction method has allowed for ten potential biomarker genes of breast cancer that could be explored and researched thoroughly to confirm these findings.
The main potential result indicated by feature extraction was that there might be a correlation between AK2 and CD68. No studies have explored these genes or evaluated any investigations that could suggest these correlations. Based on this result, these two genes might be potential biomarkers or therapeutic targets for BC. Also, POLDIP2 might be another potential biomarker, but further research needs to be conducted.
Author Contributions
Conceptualization, A.A. and R.P.; methodology, A.A.., R.P. and MM.R.; software, A.A. and R.P.; validation, A.A., R.P. and M.M.R.; formal analysis, A.A., R.P.; investigation, A.A., R.P.; resources, A.A., R.P. and M.M.R.; data curation, A.A., R.P.; writing—original draft preparation, review and editing, A.A., and M.M.R; visualization, A.A.; supervision, R.P. and M.M.R.; project administration, R.P.; funding acquisition, M.M.R. All authors have read and agreed to the published version of the manuscript.
Funding
“This research received no external funding”.
Institutional Review Board Statement
Not applicable.
Informed Consent Statement
This work used publicly available data.
Data Availability Statement
The datasets (BARRA:CuRDa - a Curated RNA-seq Database for Cancer Research) is publicly available at https://sbcb.inf.ufrgs.br/barracurda (accessed on 1st Dec 2022).
Conflicts of Interest
The authors declare no conflict of interest.
References
- Breast cancer statistics: How common is breast cancer? Breast Cancer Statistics | How Common Is Breast Cancer? (n.d.). Retrieved February 7, 2023, from https://www.cancer.org/cancer/breast-cancer/about/how-common-is-breast-cancer.html.
- Howlader N, Noone AM, Krapcho M, Miller D, Brest A, Yu M, Ruhl J, et al. SEER Cancer Statistics Review, 1975-2018, National Cancer Institute. Bethesda, MD, https://seer.cancer.gov/csr/1975_2018/, based on November 2020 SEER data submission, posted to the SEER website, April 2021.
- Dillon DA, Guidi AJ, Schnitt SJ. Ch. 25: Pathology of invasive breast cancer. In: Harris JR, Lippman ME, Morrow M, Osborne CK, eds. Diseases of the Breast. 5th ed. Philadelphia, Pa: Lippincott-Williams & Wilkins; 2014.
- Anders CK and Carey LA. ER/PR negative, HER2-negative (triple-negative) breast cancer. UpToDate website. https://www.uptodate.com/contents/er-pr-negative-her2-negative-triple-negative-breast-cancer. Updated June 06, 2019. Accessed July 23, 2019.
- Breast cancer HER2 status. What is HER2 Status? (2022, August 25). Retrieved February 7, 2023, from https://www.cancer.org/cancer/breast-cancer/understanding-a-breast-cancer-diagnosis/breast-cancer-her2-status.html.
- National Cancer Institute. Inflammatory Breast Cancer. 2016. Accessed at https://www.cancer.gov/types/breast/ibc-fact-sheet on August 30, 2021.
- Paget disease of the breast. Details, Diagnosis, and Signs. (2021, November 19). Retrieved February 7, 2023, from https://www.cancer.org/cancer/breast-cancer/about/types-of-breast-cancer/paget-disease-of-the-nipple.html.
- Angiosarcoma of the breast. Signs and Symptoms. (2022, November 19). Retrieved February 7, 2023, from https://www.cancer.org/cancer/breast-cancer/about/types-of-breast-cancer/angiosarcoma-of-the-breast.html.
- Vega, A. (2013). Breast cancer genes: Beyond BRCA1 and BRCA2. Frontiers in Bioscience, 18(4), 1358. [CrossRef]
- PJ O'Donovan and DM Livingston. BRCA1 and BRCA2: breast/ovarian cancer susceptibility gene products and participants in DNA double-strand break repair. Carcinogenesis 31, 961-967 (2010).
- C Moiola, P De Luca, J Cotignola, K Gardner, E Vazquez and A De Siervi. Dynamic coregulatory complex containing BRCA1, E2F1 and CtIP controls ATM transcription. Cell Physiol Biochem 30, 596-608 (2012).
- A De Siervi, P De Luca, JS Byun, LJ Di, T Fufa, CM Haggerty, et al. Transcriptional autoregulation by BRCA1. Cancer Res 70, 532-542 (2010).
- B Wang, BRCA1 tumor suppressor network: focusing on its tail. Cell Biosci 2, 6-3701-2-6 (20122).
- WD Foulkes: Inherited susceptibility to common cancers. N Engl J Med 359(20):2143-53 (2008).
- Rowe M. (2019). An Introduction to Machine Learning for Clinicians. Academic medicine : journal of the Association of American Medical Colleges, 94(10), 1433–1436. [CrossRef]
- Zhao, X. T., Yang, Y. D., Qu, H. Z., & Fang, X. D. (2018). Yi chuan = Hereditas, 40(9), 693–703. [CrossRef]
- Cruz, J. A., & Wishart, D. S. (2007). Applications of machine learning in cancer prediction and prognosis. Cancer informatics, 2, 59–77.
- Huang, S., Cai, N., Pacheco, P. P., Narrandes, S., Wang, Y., & Xu, W. (2018). Applications of Support Vector Machine (SVM) Learning in Cancer Genomics. Cancer genomics & proteomics, 15(1), 41–51. [CrossRef]
- Tran, K. A., Kondrashova, O., Bradley, A., Williams, E. D., Pearson, J. V., & Waddell, N. (2021). Deep Learning in cancer diagnosis, prognosis and treatment selection. Genome medicine, 13(1), 152. [CrossRef]
- Din, N. M. U., Dar, R. A., Rasool, M., & Assad, A. (2022). Breast cancer detection using deep Learning: Datasets, methods, and challenges ahead. Computers in biology and medicine, 149, 106073. [CrossRef]
- Poirion, O. B., Jing, Z., Chaudhary, K., Huang, S., & Garmire, L. X. (2021). DeepProg: an ensemble of deep-learning and machine-learning models for prognosis prediction using multi-omics data. Genome medicine, 13(1), 112. [CrossRef]
- Xiao, Y., Ma, D., Yang, Y. S., Yang, F., Ding, J. H., Gong, Y., et al. (2022). Comprehensive metabolomics expands precision medicine for triple-negative breast cancer. Cell research, 32(5), 477–490. [CrossRef]
- Sammut, S. J., Crispin-Ortuzar, M., Chin, S. F., Provenzano, E., Bardwell, H. A., Ma, W., et al. (2022). Multi-omic machine learning predictor of breast cancer therapy response. Nature, 601(7894), 623–629. [CrossRef]
- Stark, G. F., Hart, G. R., Nartowt, B. J., & Deng, J. (2019). Predicting breast cancer risk using personal health data and machine learning models. PloS one, 14(12), e0226765. [CrossRef]
- Aamir, S., Rahim, A., Aamir, Z., Abbasi, S. F., Khan, M. S., Alhaisoni, M., et al. (2022). Predicting Breast Cancer Leveraging Supervised Machine Learning Techniques. Computational and mathematical methods in medicine, 2022, 5869529. [CrossRef]
- Lee, J. Y., Lee, K. S., Seo, B. K., Cho, K. R., Woo, O. H., Song, S. E., et al. (2022). Radiomic machine learning for predicting prognostic biomarkers and molecular subtypes of breast cancer using tumor heterogeneity and angiogenesis properties on MRI. European radiology, 32(1), 650–660. [CrossRef]
- Chen, Z., Wang, M., De Wilde, R. L., Feng, R., Su, M., Torres-de la Roche, L. A., et al. (2021). A Machine Learning Model to Predict the Triple Negative Breast Cancer Immune Subtype. Frontiers in immunology, 12, 749459. [CrossRef]
- Nindrea, R. D., Aryandono, T., Lazuardi, L., & Dwiprahasto, I. (2018). Diagnostic Accuracy of Different Machine Learning Algorithms for Breast Cancer Risk Calculation: a Meta-Analysis. Asian Pacific journal of cancer prevention : APJCP, 19(7), 1747–1752. [CrossRef]
- Taghizadeh, E., Heydarheydari, S., Saberi, A., JafarpoorNesheli, S., & Rezaeijo, S. M. (2022). Breast cancer prediction with transcriptome profiling using feature selection and machine learning methods. BMC bioinformatics, 23(1), 410. B.
- Feltes, B.C.; Poloni, J.F.; Dorn, M. Benchmarking and Testing Machine Learning Approaches with BARRA:CuRDa, a Curated RNA-Seq Database for Cancer Research. Journal of Computational Biology. 2021 Sep; 28(9), 931-944.
- Stingo, F. C., & Vannucci, M. (2011). Variable selection for discriminant analysis with Markov random field priors for the analysis of microarray data. Bioinformatics (Oxford, England), 27(4), 495–501. [CrossRef]
- Zhang, L., & Luo, L. (2003). Splice site prediction with quadratic discriminant analysis using diversity measure. Nucleic acids research, 31(21), 6214–6220. [CrossRef]
- Zhang M. Q. (1997). Identification of protein coding regions in the human genome by quadratic discriminant analysis. Proceedings of the National Academy of Sciences of the United States of America, 94(2), 565–568. [CrossRef]
- Abdel Samee, N.M., Solouma, N.H. & Kadah, Y.M. Detection of biomarkers for Hepatocellular Carcinoma using a hybrid univariate gene selection methods. Theor Biol Med Model 9, 34 (2012). [CrossRef]
- Goli, S., Mahjub, H., Faradmal, J., Mashayekhi, H., & Soltanian, A.-R. (2016). Survival prediction and feature selection in patients with breast cancer using support vector regression. Computational and Mathematical Methods in Medicine, 2016, 1–12. [CrossRef]
- Samee, N.A., Atteia, G., Meshoul, S., Al-antari, M.A., Kadah, Y.M. Deep Learning Cascaded Feature Selection Framework for Breast Cancer Classification: Hybrid CNN with Univariate-Based Approach. Mathematics 2022, 10, 3631. [CrossRef]
- Gomes, R., Paul, N., He, N., Huber, A. F., & Jansen, R. J. (2022). Application of Feature Selection and Deep Learning for Cancer Prediction Using DNA Methylation Markers. Genes, 13(9), 1557. [CrossRef]
- Ma, J.; Yuan, Y. Dimension reduction of image deep feature using PCA. J. Vis. Commun. Image Represent. 2019, 63, 102578.
- Zhang, D., Zou, L., Zhou, X., & He, F. (2018). Integrating feature selection and feature extraction methods with deep learning to predict clinical outcome of breast cancer. IEEE Access, 6, 28936–28944. [CrossRef]
- Figley MD, Gu W, Nanson JD, Shi Y, Sasaki Y, Cunnea K, et al. SARM1 is a metabolic sensor activated by an increased NMN/NAD+ ratio to trigger axon degeneration. Neuron. 2021;109(7):1118–1136.e11. [CrossRef]
- Wu Y. (2022). Circ_0044516 Enriches the Level of SARM1 as a miR-330-5p Sponge to Regulate Cell Malignant Behaviors and Tumorigenesis of Prostate Cancer. Biochemical genetics, 60(4), 1346–1361. [CrossRef]
- Morale, M. G., Tamura, R. E., Cintra, R., Araújo, N. M., & Villa, L. L. (2022). TLR4 and SARM1 modulate survival and chemoresistance in an HPV-positive cervical cancer cell line. Scientific reports, 12(1), 6714. [CrossRef]
- Quyun, C., Ye, Z., Lin, S. C., & Lin, B. (2010). Recent patents and advances in genomic biomarker discovery for colorectal cancers. Recent patents on DNA & gene sequences, 4(2), 86–93. [CrossRef]
- Xin, C., Bi, X., Xiao, C., & Dong, L. (2021). MIR31HG regulates the proliferation, migration and invasion of breast cancer by regulating the expression of POLDIP2. Journal of B.U.ON. : official journal of the Balkan Union of Oncology, 26(2), 459–465.
- Lei, T., Deng, X., Peng, Y., & Chen, T. (2022). The genomic profile of double primary secretory breast carcinoma in one patient provides evidence for the treatment of such carcinoma: A case report. Pathology, research and practice, 236, 154006. [CrossRef]
- Grinchuk, O. V., Motakis, E., & Kuznetsov, V. A. (2010). Complex sense-antisense architecture of TNFAIP1/POLDIP2 on 17q11.2 represents a novel transcriptional structural-functional gene module involved in breast cancer progression. BMC genomics, 11 Suppl 1(Suppl 1), S9. [CrossRef]
- Chen, Y. C., Kuo, C. C., Chian, C. F., Tzao, C., Chang, S. Y., Shih, Y. L., et al. (2018). Knockdown of POLDIP2 suppresses tumor growth and invasion capacity and is linked to unfavorable transformation ability and metastatic feature in non-small cell lung cancer. Experimental cell research, 368(1), 42–49. [CrossRef]
- Rehman, M., Gurrapu, S., Cagnoni, G., Capparuccia, L., & Tamagnone, L. (2016). PlexinD1 Is a Novel Transcriptional Target and Effector of Notch Signaling in Cancer Cells. PloS one, 11(10), e0164660. [CrossRef]
- Tamagnone, L., & Rehman, M. (2013). To die or not to die: Sema3E rules the game. Cancer cell, 24(5), 564–566. [CrossRef]
- Luchino, J., Hocine, M., Amoureux, M. C., Gibert, B., Bernet, A., Royet, A., et al. (2013). Semaphorin 3E suppresses tumor cell death triggered by the plexin D1 dependence receptor in metastatic breast cancers. Cancer cell, 24(5), 673–685. [CrossRef]
- Vivekanadhan, S., & Mukhopadhyay, D. (2019). Divergent roles of Plexin D1 in cancer. Biochimica et biophysica acta. Reviews on cancer, 1872(1), 103–110. [CrossRef]
- Kim, H., Jeong, M., Na, D. H., Ryu, S. H., Jeong, E. I., Jung, K., et al. (2022). AK2 is an AMP-sensing negative regulator of BRAF in tumorigenesis. Cell death & disease, 13(5), 469. [CrossRef]
- Klepinin, A., Miller, S., Reile, I., Puurand, M., Rebane-Klemm, E., Klepinina, L., et al. (2022). Stable Isotope Tracing Uncovers Reduced γ/β-ATP Turnover and Metabolic Flux Through Mitochondrial-Linked Phosphotransfer Circuits in Aggressive Breast Cancer Cells. Frontiers in oncology, 12, 892195. [CrossRef]
- Chistiakov, D., Killingsworth, M., Myasoedova, V. et al. CD68/macrosialin: not just a histochemical marker. Lab Invest 97, 4–13 (2017). [CrossRef]
- Goff, S. L., & Danforth, D. N. (2021). The Role of Immune Cells in Breast Tissue and Immunotherapy for the Treatment of Breast Cancer. Clinical breast cancer, 21(1), e63–e73. [CrossRef]
- Jamiyan, T., Kuroda, H., Yamaguchi, R., Abe, A., & Hayashi, M. (2020). CD68- and CD163-positive tumor-associated macrophages in triple negative cancer of the breast. Virchows Archiv : an international journal of pathology, 477(6), 767–775. [CrossRef]
- Xiong, H., Chen, Z., Zheng, W., Sun, J., Fu, Q., Teng, R., et al. (2020). FKBP4 is a malignant indicator in luminal A subtype of breast cancer. Journal of Cancer, 11(7), 1727–1736. [CrossRef]
- Xiong, H., Chen, Z., Lin, B., Xie, B., Liu, X., Chen, C., et al. (2022). Naringenin Regulates FKBP4/NR3C1/NRF2 Axis in Autophagy and Proliferation of Breast Cancer and Differentiation and Maturation of Dendritic Cell. Frontiers in immunology, 12, 745111. [CrossRef]
- Zhou, M., Venkata, P. P., Viswanadhapalli, S., Palacios, B., Alejo, S., Chen, Y., et al. (2021). KDM1A inhibition is effective in reducing stemness and treating triple negative breast cancer. Breast cancer research and treatment, 185(2), 343–357. [CrossRef]
- Gong, Z., Li, A., Ding, J., Li, Q., Zhang, L., Li, Y., et al. (2021). OTUD7B Deubiquitinates LSD1 to Govern Its Binding Partner Specificity, Homeostasis, and Breast Cancer Metastasis. Advanced science (Weinheim, Baden-Wurttemberg, Germany), 8(15), e2004504. [CrossRef]
- Wang, T., Zhang, F., & Sun, F. (2021). ory-1001, a kdm1a inhibitor, inhibits proliferation, and promotes apoptosis of triple negative breast cancer cells by inactivating androgen receptor. Drug Development Research, 83(1), 208–216. [CrossRef]
- Machour, F. E., Abu-Zhayia, E. R., Awwad, S. W., Bidany-Mizrahi, T., Meinke, S., Bishara, L. A., et al. (2021). RBM6 splicing factor promotes homologous recombination repair of double-strand breaks and modulates sensitivity to chemotherapeutic drugs. Nucleic acids research, 49(20), 11708–11727. [CrossRef]
- Cao, Y., Di, X., Zhang, Q., Li, R., & Wang, K. (2021). RBM10 Regulates Tumor Apoptosis, Proliferation, and Metastasis. Frontiers in oncology, 11, 603932. [CrossRef]
- Rintala-Maki, N. D., Goard, C. A., Langdon, C. E., Wall, V. E., Traulsen, K. E., Morin, C. D., et al. (2007). Expression of RBM5-related factors in primary breast tissue. Journal of cellular biochemistry, 100(6), 1440–1458. [CrossRef]
- Wang, K., Ubriaco, G., & Sutherland, L. C. (2007). RBM6-RBM5 transcription-induced chimeras are differentially expressed in tumours. BMC genomics, 8, 348. [CrossRef]
- Hamada, T., Souda, M., Yoshimura, T., Sasaguri, S., Hatanaka, K., Tasaki, T., et al. (2014). Anti-apoptotic effects of PCP4/PEP19 in human breast cancer cell lines: a novel oncotarget. Oncotarget, 5(15), 6076–6086. [CrossRef]
- Akbari, M. R., & Cybulski, C. (2015). RECQL: a DNA helicase in breast cancer. Oncotarget, 6(29), 26558–26559. [CrossRef]
- Sun, J., Wang, Y., Xia, Y., Xu, Y., Ouyang, T., Li, J., et al. (2015). Mutations in RECQL Gene Are Associated with Predisposition to Breast Cancer. PLOS genetics, 11(5), e1005228. [CrossRef]
- Bowden, A. R., & Tischkowitz, M. (2019). Clinical implications of germline mutations in breast cancer genes: RECQL. Breast cancer research and treatment, 174(3), 553–560. [CrossRef]
- Banerjee, T., & Brosh, R. M., Jr (2015). RECQL: a new breast cancer susceptibility gene. Cell cycle (Georgetown, Tex.), 14(22), 3540–3543. [CrossRef]
- Liu, L., Chen, Z., Shi, W., Liu, H., & Pang, W. (2019). Breast cancer survival prediction using seven prognostic biomarker genes. Oncology letters, 18(3), 2907–2916. [CrossRef]
- Li, Y., Zhao, X., Liu, Q., & Liu, Y. (2021). Bioinformatics reveal macrophages marker genes signature in breast cancer to predict prognosis. Annals of medicine, 53(1), 1019–1031. [CrossRef]
- Zeng, X., Shi, G., He, Q., & Zhu, P. (2021). Screening and predicted value of potential biomarkers for breast cancer using bioinformatics analysis. Scientific reports, 11(1), 20799. [CrossRef]
- Weng, Y., Liang, W., Ji, Y., Li, Z., Jia, R., Liang, Y., Ning, P., & Xu, Y. (2021). Key Genes and Prognostic Analysis in HER2+ Breast Cancer. Technology in cancer research & treatment, 20, 1533033820983298. [CrossRef]
- Chen, D. L., Cai, J. H., & Wang, C. C. N. (2022). Identification of Key Prognostic Genes of Triple Negative Breast Cancer by LASSO-Based Machine Learning and Bioinformatics Analysis. Genes, 13(5), 902. [CrossRef]
- Wang, Y., Li, Y., Liu, B., & Song, A. (2021). Identifying breast cancer subtypes associated modules and biomarkers by integrated bioinformatics analysis. Bioscience Reports, 41(1). [CrossRef]
- Xu, Y. H., Deng, J. L., Wang, L. P., Zhang, H. B., Tang, L., Huang, Y., Tang, J., Wang, S. M., & Wang, G. (2020). Identification of Candidate Genes Associated with Breast Cancer Prognosis. DNA and cell biology, 39(7), 1205–1227. [CrossRef]
- Fang, L., Liu, Q., Cui, H., Zheng, Y., & Wu, C. (2022). Bioinformatics Analysis Highlight Differentially Expressed CCNB1 and PLK1 Genes as Potential Anti-Breast Cancer Drug Targets and Prognostic Markers. Genes, 13(4), 654. [CrossRef]
Figure 2.
Classification Report with AUC. This figure highlights the classification report along with AUC for each selected model. 11 different models were picked as part of this study. Each model's precision, recall, f1 score, Accuracy, and AUC were calculated. Each of the models had consistent results except for RBF SVM. RBF SVM model was the only model with the lowest accuracy compared to other models.
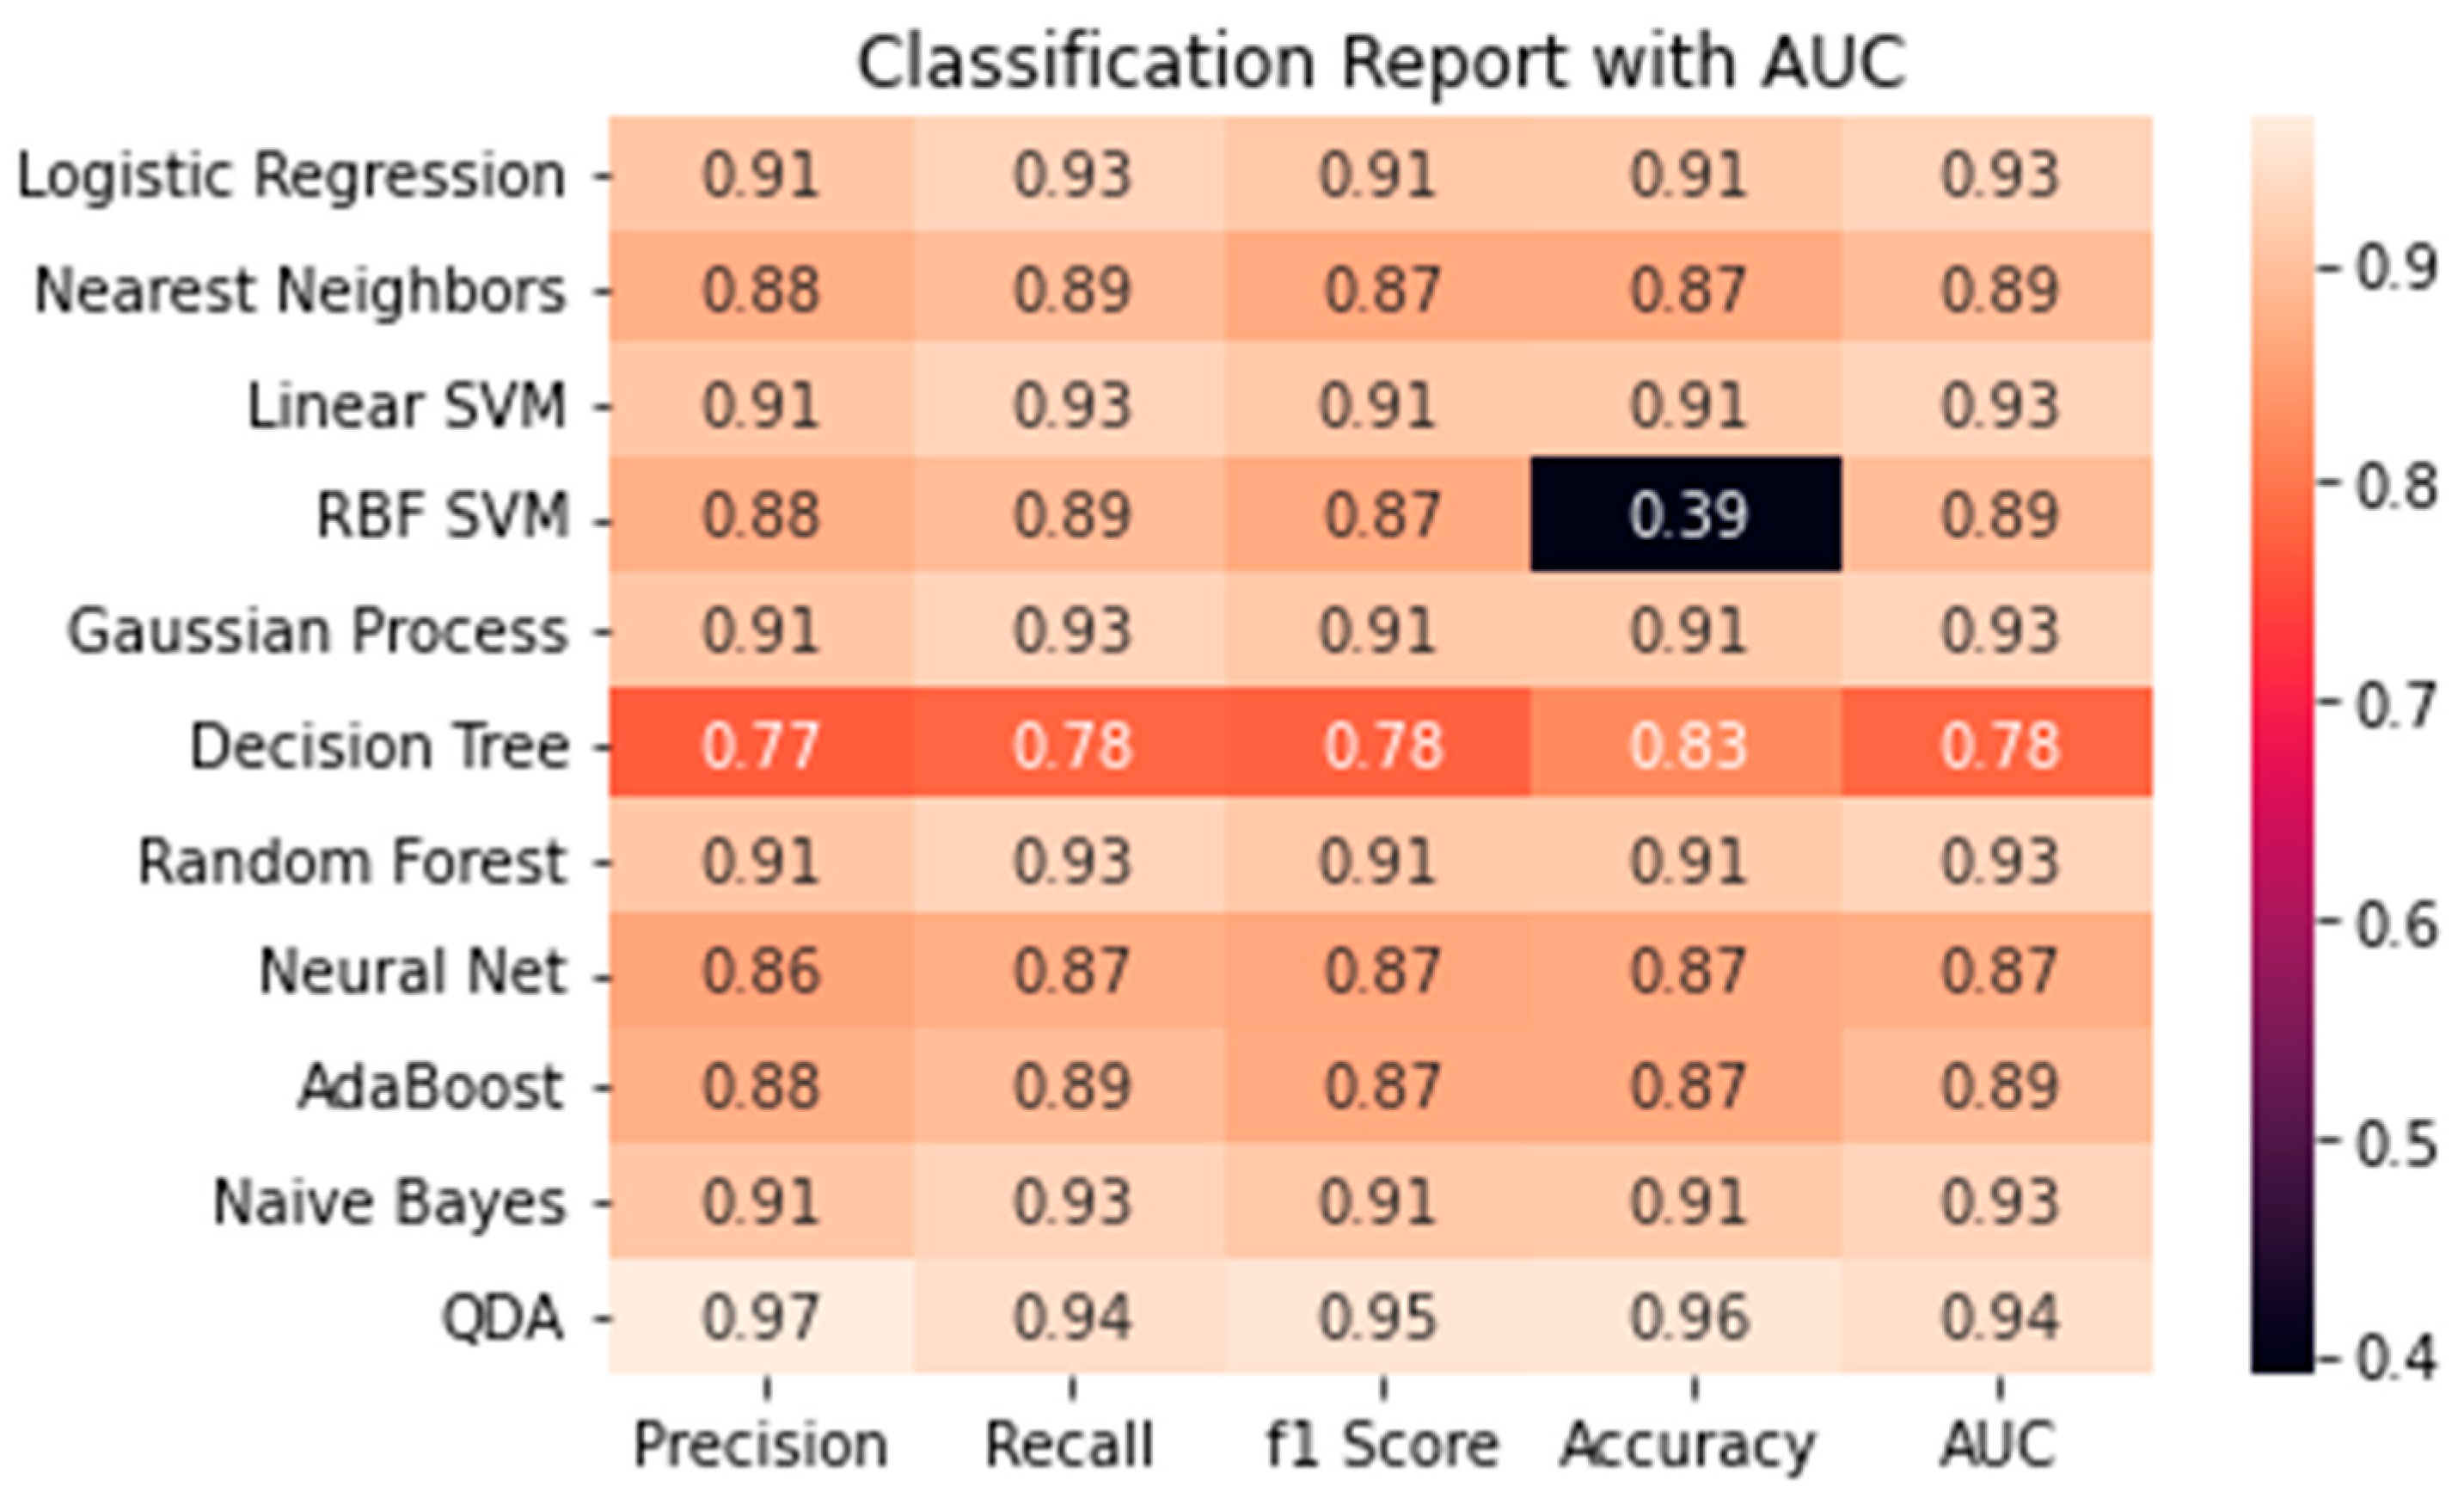
Figure 3.
Linear Representation of Class Report. This linear representation shows the classification report for each model. It highlights the percentage of each model through a linear model. This model reiterates the previous classification report to visualize how each model is behaving. As mentioned earlier, the only model with the lowest accuracy was RBF SVM, as it can be seen above with a green dotted line. At 3.0, accuracy is at its lowest compared to other models.
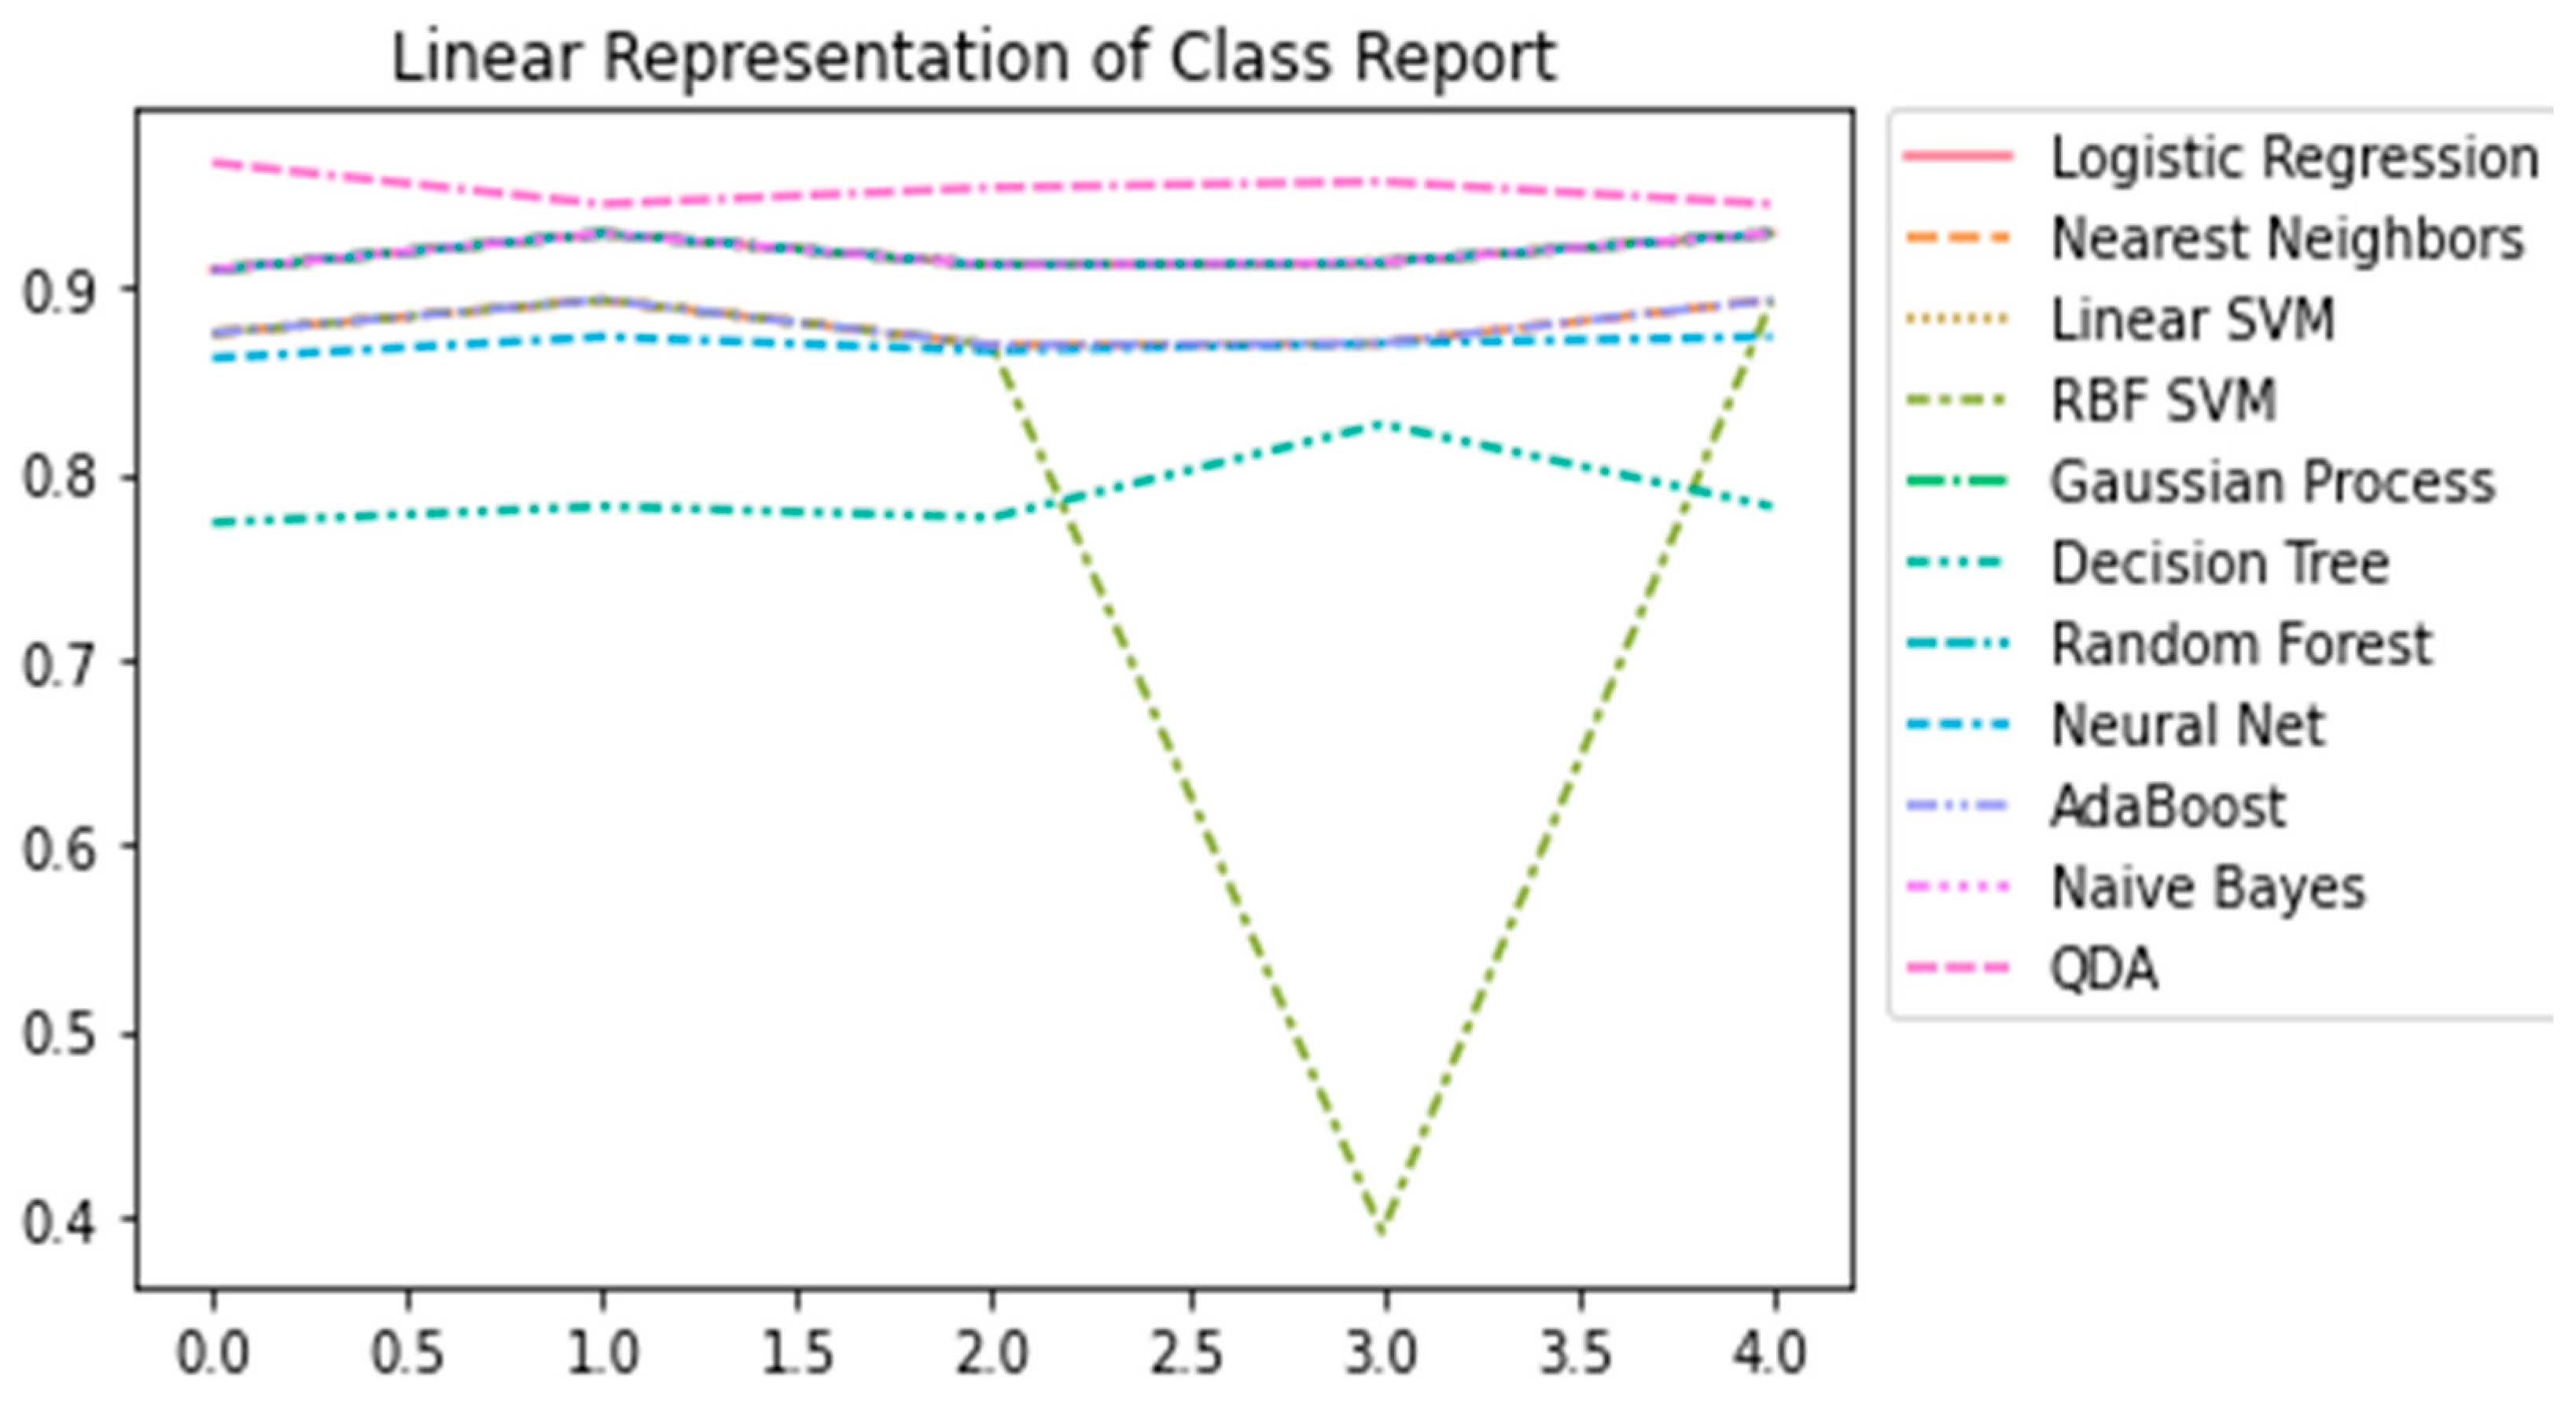
Figure 5.
Average PCA Values of Genes. The average PCA values were calculated for each gene across all the samples. The gene with the highest average was POLDIP2, and the lowest was RECQL. The RECQL PCA values were very small to begin with. The average PCA value for RECQL was less than 0 compared to other genes, which had averages above 0. That is the reason, there was no bar representation for that gene.
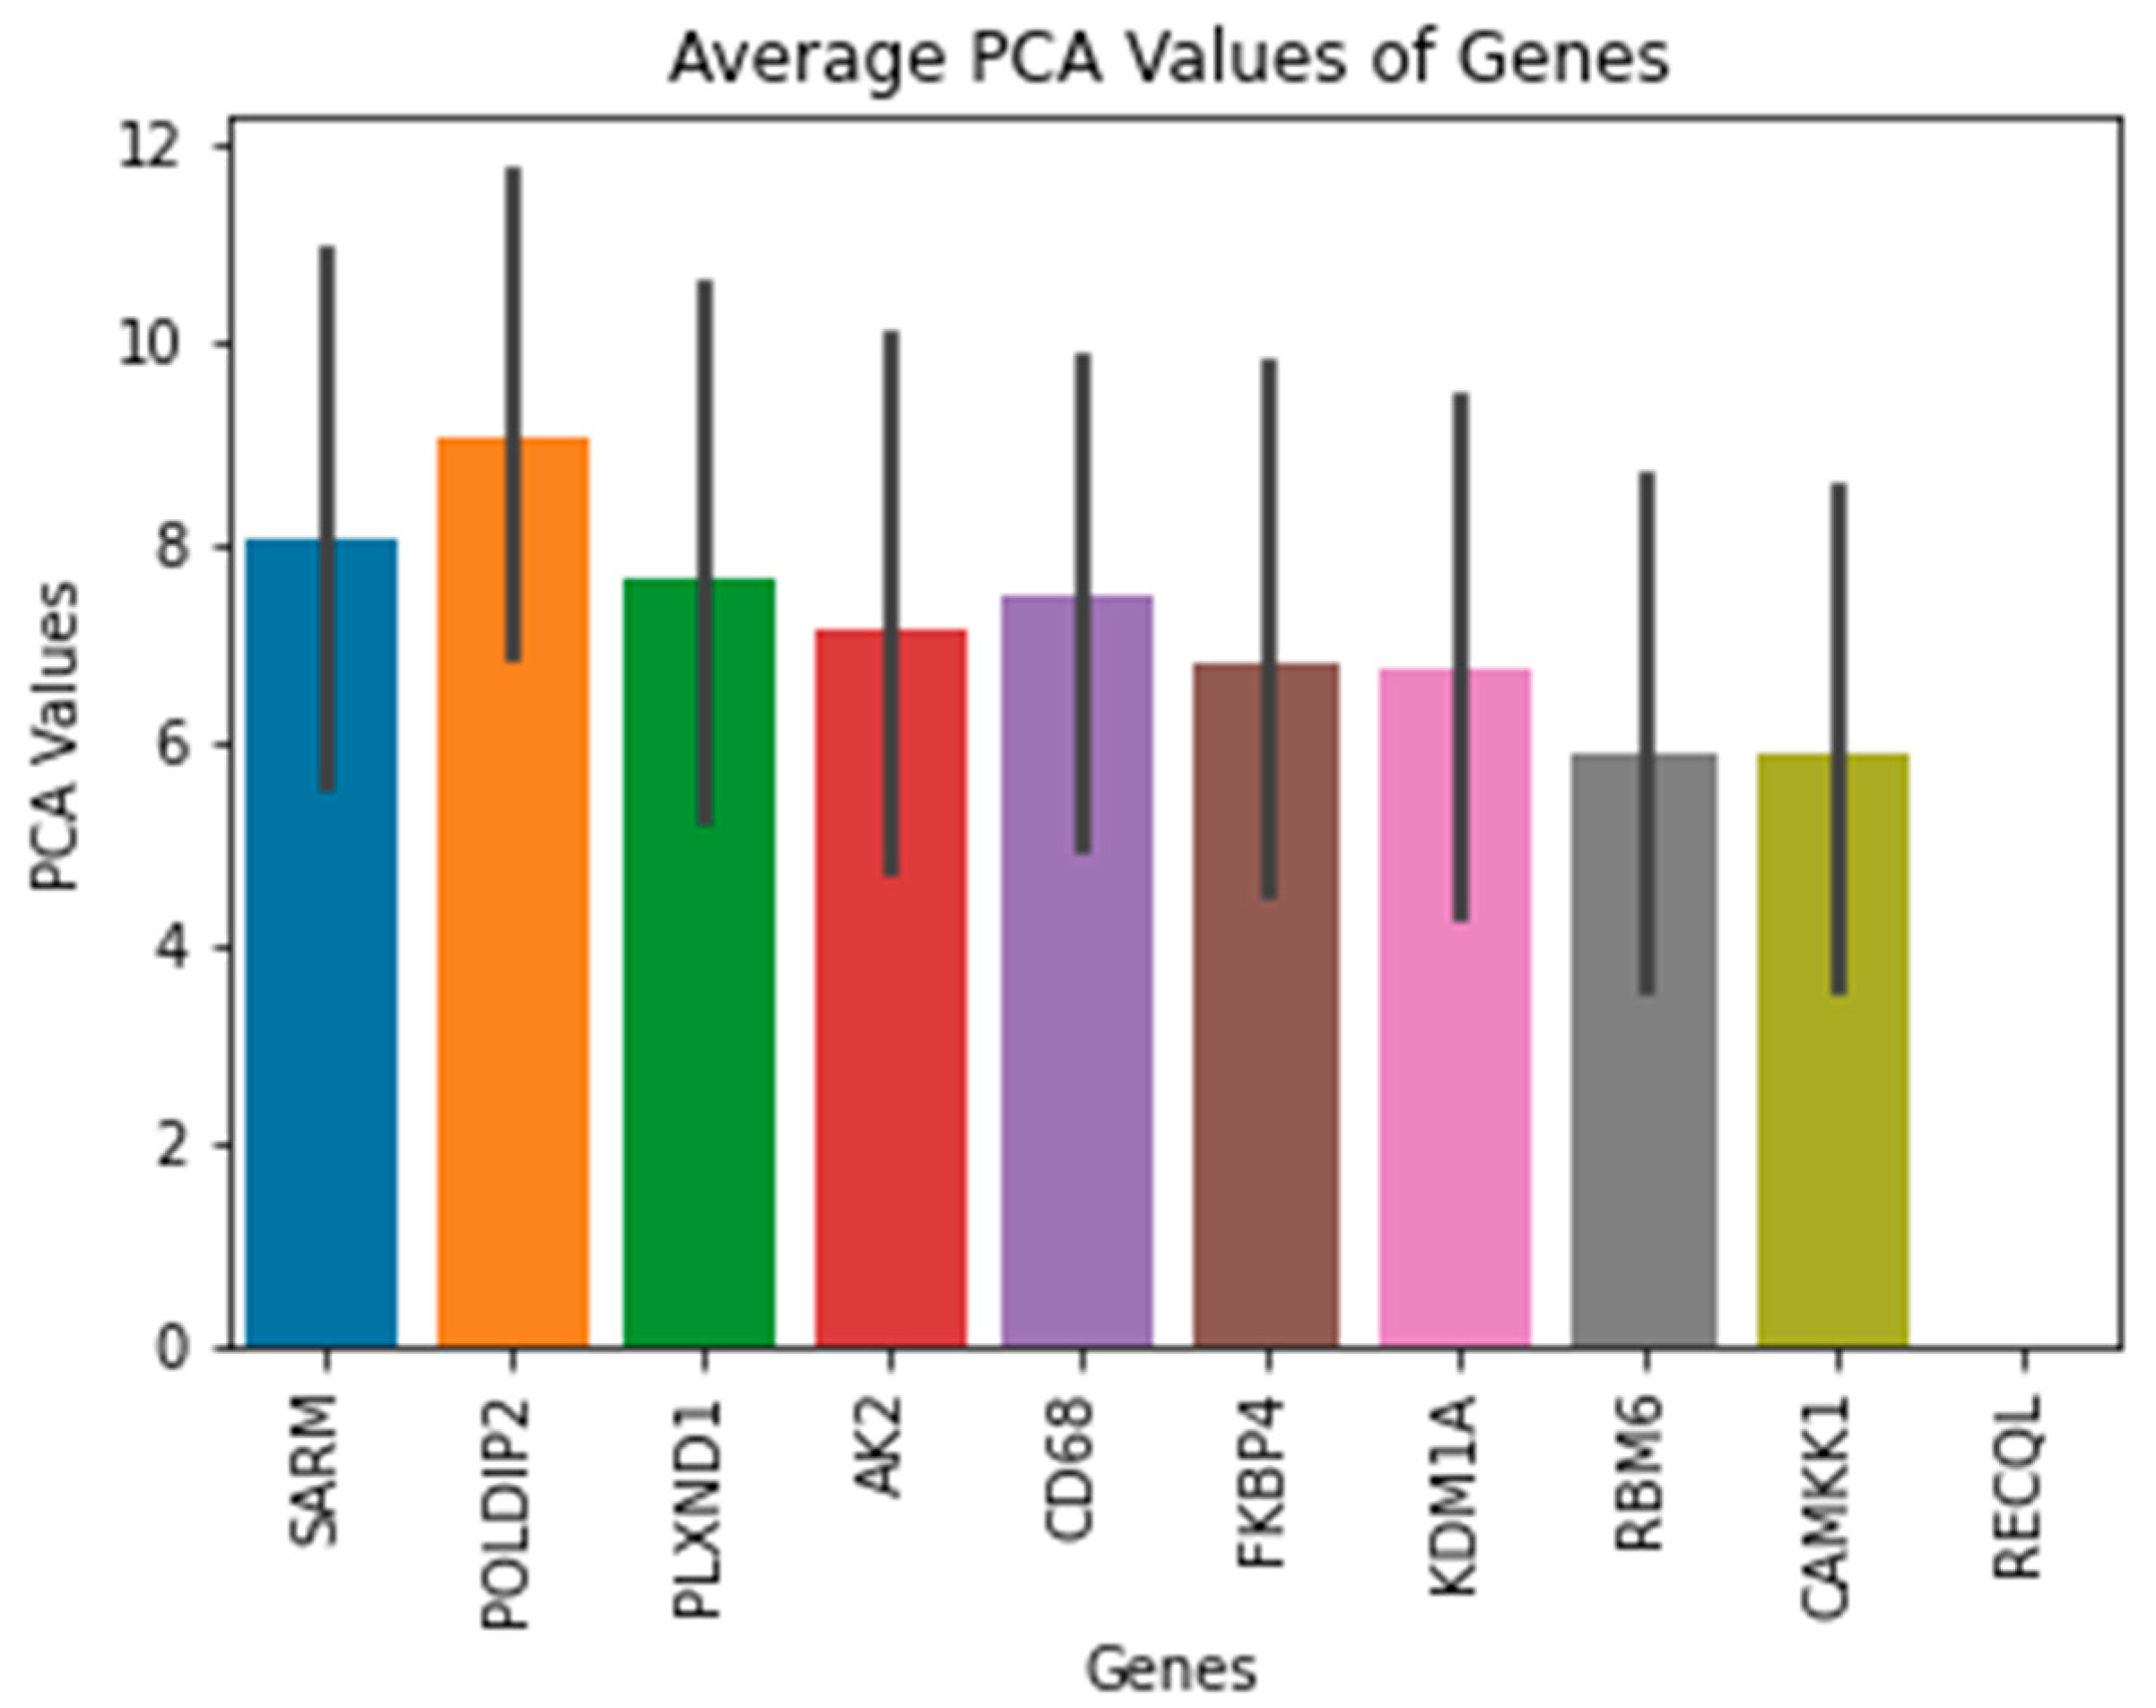
Figure 6.
Genes with PCA values of Tumor Samples. This graph was to visualize how each gene behaves in each of the tumor samples. Each gene was graphed using their respective PCA values for each of the samples. In this graph, only PLXND1 had the highest value at one of the points. PLXND1 stands out the most compared to other genes.
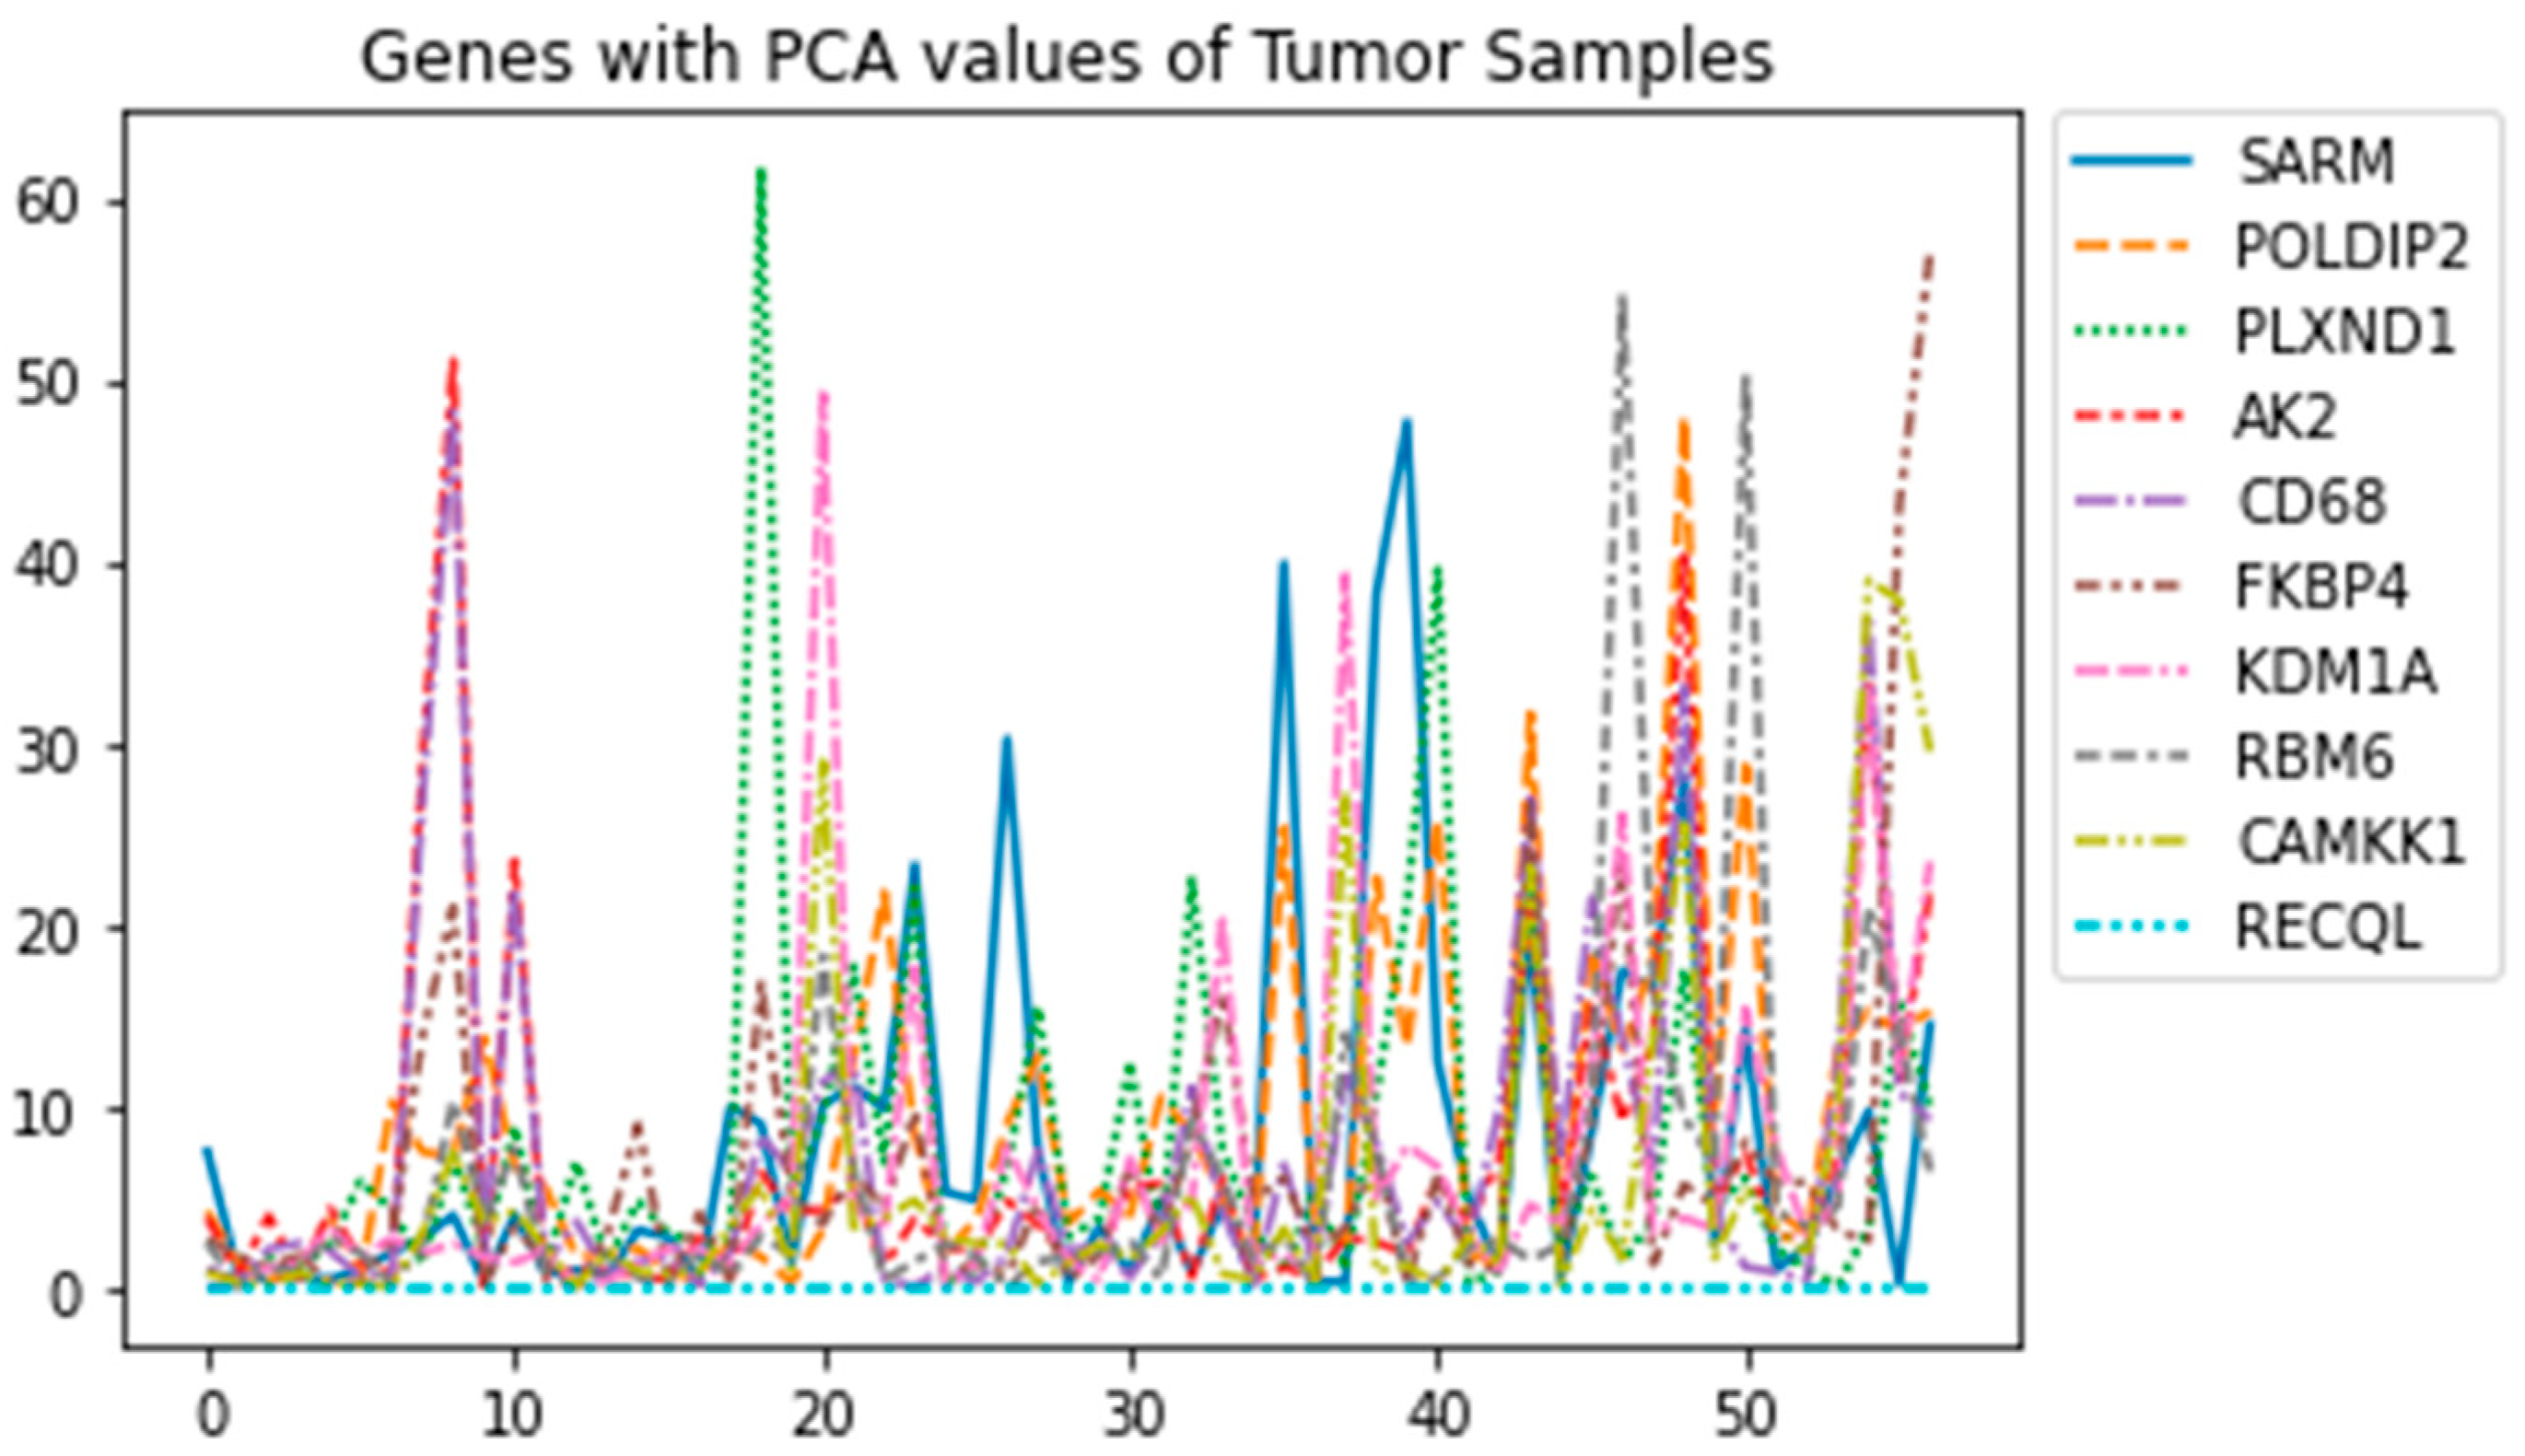
Figure 7.
Correlation of Top Genes in Heatmap. This heatmap is a representation of each gene being compared to each other to find any genes that might be working together. Gene correlation values were calculated and compared with other genes. The 1 mean 100% correlation across the heatmap. This 100% percent is only to each of the genes with each other. AK2 and CD68 were the only genes with the highest positive correlation of 92%. Other genes had little to nothing correlation with each other.
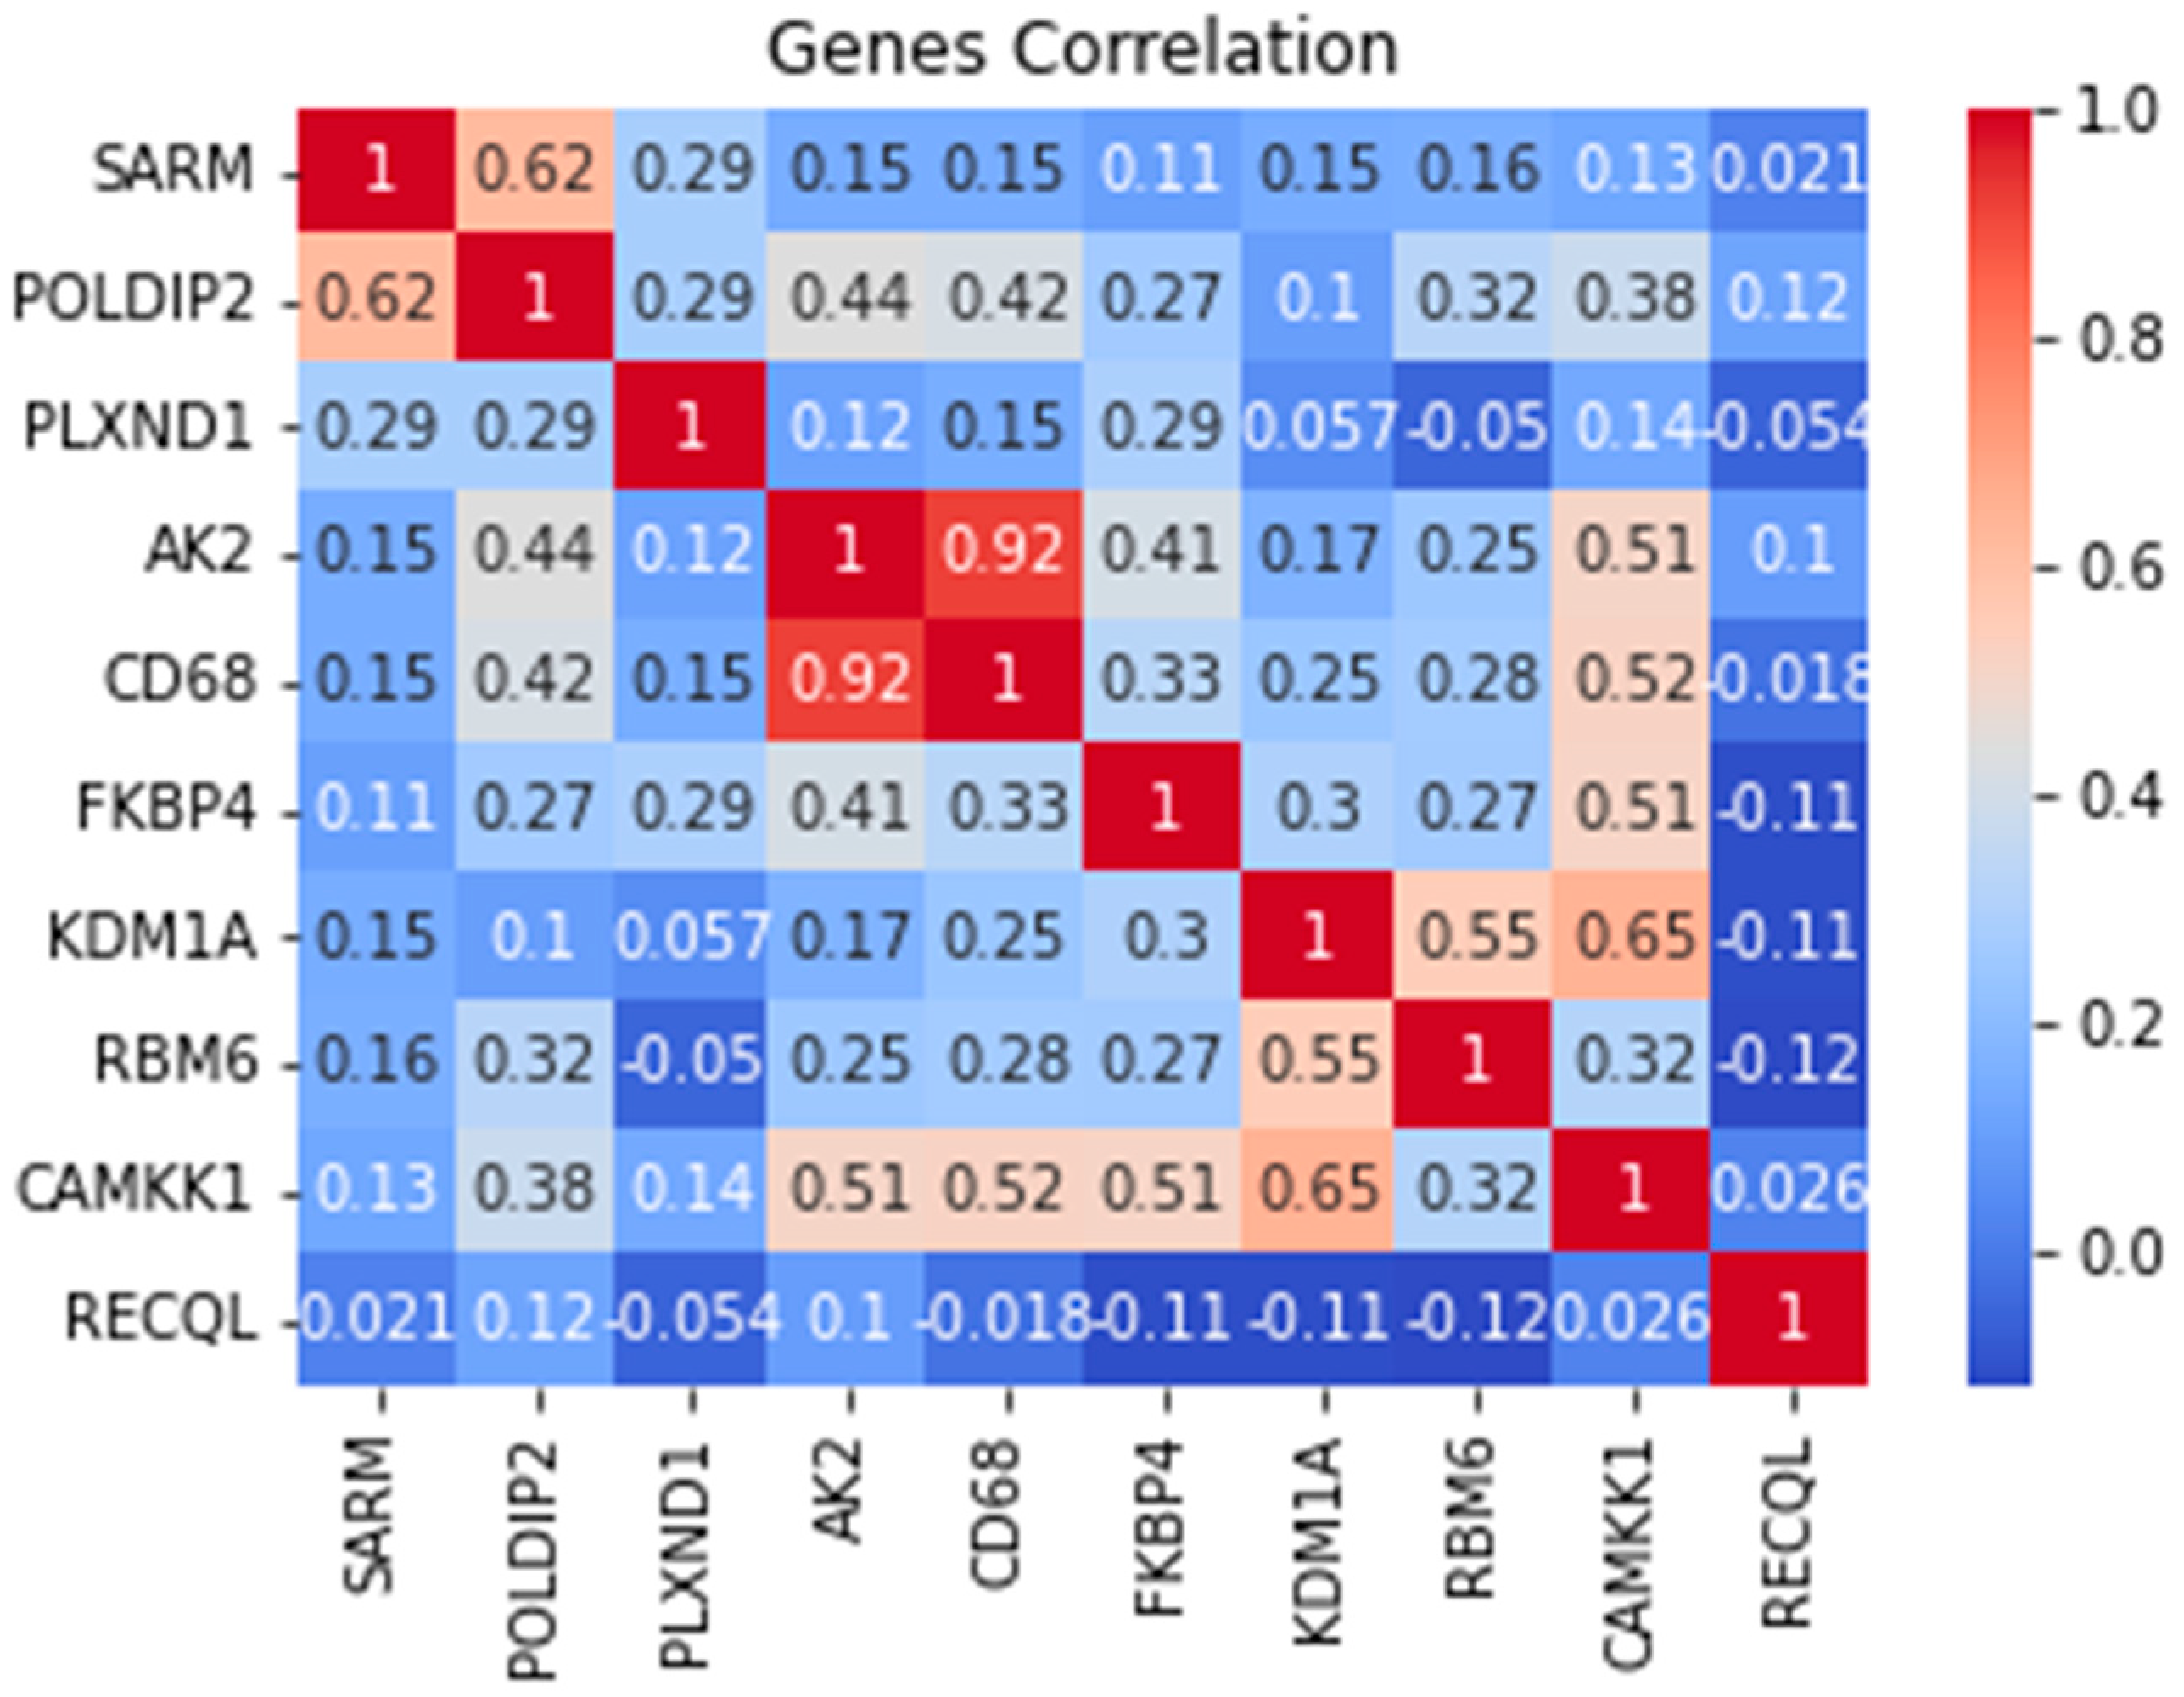

Table 1.
ENSG ID with Gene Name.
| ENSG ID | Gene Name: |
|---|---|
| ENSG00000004139 | SARM : Sterile Alpha and TIR Motif Containing 1 |
| ENSG00000004142 | POLDIP2: DNA Polymerase Delta Interacting Protein 2 |
| ENSG00000004399 | PLXND1: Plexin D1 |
| ENSG00000004455 | AK2: Adenylate Kinase 2 |
| ENSG00000004468 | CD68: CD68 Molecule |
| ENSG00000004478 | FKBP4: HFKBP Prolyl Isomerase 4 |
| ENSG00000004487 | KDM1A: Lysine Demethylase 1A |
| ENSG00000004534 | RBM6: RNA Binding Motif Protein 6 |
| ENSG00000004660 | CAMKK1: Calcium/Calmodulin Dependent Protein Kinase Kinase 1 |
| ENSG00000004700 | RECQL: RecQ Like Helicase |
Disclaimer/Publisher’s Note: The statements, opinions and data contained in all publications are solely those of the individual author(s) and contributor(s) and not of MDPI and/or the editor(s). MDPI and/or the editor(s) disclaim responsibility for any injury to people or property resulting from any ideas, methods, instructions or products referred to in the content. |
© 2023 by the authors. Licensee MDPI, Basel, Switzerland. This article is an open access article distributed under the terms and conditions of the Creative Commons Attribution (CC BY) license (http://creativecommons.org/licenses/by/4.0/).
Copyright: This open access article is published under a Creative Commons CC BY 4.0 license, which permit the free download, distribution, and reuse, provided that the author and preprint are cited in any reuse.


