
Submitted:
30 August 2023
Posted:
31 August 2023
You are already at the latest version
Abstract
Melanoma is widely recognized as one of the most lethal forms of skin cancer, with its incidence showing an upward trend in recent years. Nonetheless, the timely detection of this malignancy substantially enhances the likelihood of patients’ long-term survival. Several computer-based methods have recently been proposed in the pursuit of diagnosing skin lesions at their early stages. Despite achieving some level of success, there still remains a margin of error that the machine learning community considers to be an unresolved research challenge. This study presents a novel framework for the classification of skin lesions. The framework incorporates deep features to generate a highly discriminant feature vector, while also maintaining the integrity of the original feature space. Recent deep models including Darknet53, DenseNet201, InceptionV3, and InceptionResNetV2 are employed in our study for the purpose of feature extraction. Additionally, transfer learning is leveraged to enhance the performance of our approach. In the subsequent phase, the extracted feature information from the chosen pre-existing models is combined, with the aim of preserving maximum information, prior to undergoing the process of feature selection using a novel entropy-controlled grey wolf optimization (ECGWO) algorithm. The integration of fusion and selection techniques is employed to initially incorporate the feature vector with a high level of information and subsequently eliminate redundant and irrelevant feature information. The efficacy of our design is substantiated through the evaluation on three benchmark dermoscopic datasets, namely PH2, ISIC-MSK, and ISIC-UDA. In order to validate the proposed methodology, a comprehensive evaluation is conducted, including a rigorous comparison with established techniques in the field.
Keywords:
convolutional neural networks
; feature selection
; transfer learning
; feature fusion
; gray wolf optimization
; deep learning
; skin lesion
1. Introduction
Cancer is caused by the uncontrolled multiplication of abnormal cells. Human cells frequently possess the capacity to replicate and divide, and abnormally replicated cells can spread through the lymphatic and vascular systems, wreaking havoc on a healthy body [1]. The five main forms of cancer recognized by Stanford medical and healthcare are carcinoma, sarcoma, lymphoma, leukemia, and myeloma. Most cases of the malignant melanoma variety belongs to the class of carcinoma [2,3]. One of the most lethal and prevalent cancers in the world is skin cancer [4]. Sunlight has been linked to skin cancer in a recent studies, because radiation is the main source of these rays; however, some artificial light also causes DNA damage to skin cells. Skin cancer can also be caused by genetic abnormalities or diseases that run in families [5].
Skin cancer affects an estimated 9,500 persons every day in the United States alone, as reported by the American Cancer Society (ACS)[6]. In the year 2022, a total of 99,780 incidents of melanoma were identified, with 57,180 cases affecting males and 42,600 cases affecting females [7]. It is anticipated that almost 5,080 men and 2,570 women will lose their lives to this terrifying illness this year. Incidences of melanoma have been steadily climbing over the course of the past few decades, with rates varied according to the ages of the people affected [8]. The percentage of skin cancer caused by sun exposure in different age categories and the number of skin cancer cases diagnosed on each continent are presented in Figure 1.
With a cautious prediction of 17,756 new cases in 2022, the Australian institute of health and welfare predicts that skin cancer (melanoma) will rise to the third most often diagnosed cancer type in Australia. Diagnosis rates are as follows: 58.5% male and 41.5% female [9,10]. Clinical examinations often involve a practitioner or dermatologist observing a suspect’s skin in a series of phases. The skin’s appearance is heavily influenced by their eyesight, which varies from person to person. Such observational screening for skin cancer has significant limitations and cannot provide an accurate diagnosis. Despite the best efforts of great dermatologists, a recent study found that only 80% of skin cancers were correctly diagnosed [11]. In clinical examination, the most common method is ABCDE rule, in which the appearance of the lesion (symmetry, border, color, and diameter) and evolution of the lesion are observed [12]. Despite the best efforts of great dermatologists, a recent study found that only 80% of skin cancers were correctly diagnosed.
Machine learning methods have been widely implemented in several domains including activity recognition [13], experimental systems [14], public health care, etc for nearly two decades. The employment of these cutting-edge methods has simplified the entire process of disease detection and diagnosis [15]. Computer-aided diagnostic (CAD) systems [16] have the potential to replace conventional surgical assessment methods based on auto-generated features analysis using machine learning approaches[17]. Therefore, scientists are certain that machine learning techniques will eventually replace conventional approaches to evaluating surgical procedures [18,19,20]. This study primarily focuses on the use of feature fusion and selection methods jointly. Following feature extraction from the CNN models, feature fusion is used to combine the best features from each model into a single set. Next, an evolutionary method with biological inspiration is developed for calculating the likelihood of having irrelevant and redundant data.
2. Literature Review
In this section, we provide a concise literature assessment of work done on skin lesion classification using CNN. In a few cases, the classification frameworks are applied directly to the provided image samples, while in others, the images are initially pre-processed before being subjected to the main processing steps. We begin with a discussion of non-traditional/deep-model approaches to image classification. Several researchers have approached this issue by considering it as a binary classification problem, where the images are categorized into two primary classes: malignant and benign. Several image samples are presented to the readers as reference in the Figure 2. However, a small number of them even employed seven classes.
The research of [21] has employed deep learning models for the automatic categorization of multi-class skin lesions. The presented algorithm is based on the deep convolutional neural network (DCNN), which contains several stacked layers and variable filter sizes. The authors have claimed to attain 90.1% precision, 93.23% sensitivity, and 91.1% specificity on the ISIC-17 dataset. The proposed algorithm demonstrates superior performance in comparison to various alternative methods, particularly in the context of low-resolution images. Similarly, the authors in [22] proposed a DCNN framework to categorize skin lesions images into seven different classes that are subsequently consolidated into two overarching classes: healthy and cancerous. One limitation of this study is the occasional inability to directly consolidate classes into a smaller number. The evaluation of different CNN architectures is being done in the work proposed by [23] in which authors utilized different configurations of twelve CNN models, and setting seven different classifiers. The DenseNet201 combined with the KNN classifier resulted in the best F1-Score, accuracy, recall, and precision values.
The methodology proposed by Bi et al. [24] employs a hyper-connected convolutional neural network (HcCNN) to classify skin lesion images. The proposed approach involves the implementation of a deep hierarchical convolutional neural network (HcCNN) that incorporates a multi-scale attention block. This integration enables the model to effectively capture and utilize the visual characteristics present in both dermoscopy and clinical skin cancer image datasets. The method proposed in this study demonstrated a slightly reduced level of performance in terms of accuracy (82.70%), sensitivity (68.18%), specificity (84.62%), and precision (75.98%). Similarly, the work of [25] addresses the classification of high-resolution images and class variation present in real datasets. They have proposed a framework known as patch-based attention architecture (pre-trained CNN). The outlined algorithm provides a global context in between low and high resolution regions. The mean values of achieved sensitivity, specificity and F1-score are 73.3%, 96.3% and 85.3%, which are quite low as some of the methods achieve better results compared to the existing techniques. In [26], authors have given a method to accelerate the performance of classifying the skin lesions using generated adversarial networks (GANs); that are based on data augmentation technology. On the dataset ISIC-2018 , the obtained accuracy, specificity, sensitivity, average precision are 95.25%, 96.61%, 83.21%, and 83.11%. Though the authors have claimed that their achieved parameters are better in comparison to the CNN model, but yet the achieved multi-class accuracy, specificity and sensitivity need to be improved. The presented algorithm is effective only to skin lesion regions having high resolution and better diversity.
The proposed framework of [27] combines a skin lesion boundary segmentation (done using full resolution convolutional network) stage and a multiple skin cancer lesions classification stage. Then a CNN such as ResNet-50, inception-v3, DenseNet-201, and Inception-ResNet-v2 is employed. The maximum achieved values of specificity, sensitivity, accuracy, true-negative rate (F1-score) and area under the curve and the are 80.62%, 75.67%, 75.75% and 81.57% respectively on ISIC 2017 dataset. The proposed method in [28] classifies the cancer lesion using ensembles of CNN model known as multi-resolution EfficientNets with meta data. Lesion classification is done using EfficientNets, SENet, and ResNet WSI. The achived values of the area under the curve ranged in 77.5%-96% and that of sensitivity ranged in 0.283%-71% obtained on ISIC-2019 dataset. In [29], authors have proposed a cascade knowledge diffusion network (CKDNet) that transfers and accumulates the information gathered from various sub-tasks to increase the efficiency of segmenting and classifying cancer images. They have reported better performance without ensemble approaches or external datasets, and every time neural network need to be trained, and it takes much time to do that. Hence in some applications, it can be a drawback. On contrary, authors in [30] proposed an approach for the multi-label ensemble multi-class classification of the skin cancer images. The efficiency of the method has only been compared with that of the specialist’s advice.
The integration of conventional and contemporary frameworks is a subject of interest among researchers in the field. The work of [32] uses wavelet-based CNN model. The method decomposes the input image into seven different directional sub-bands. The sub-band images are fed to eight pretrained CNNs; as an input; to generate eight probabilistic classifiers. The efficiency of the proposed method is evaluated for seborrheic keratosis and melanoma classification. The authors have concluded that the model I-GR0235 tops in the performance among other models. But the achieved values of the accuracy (83%), receiver operating characteristic curve (91%), and sensitivity (13%) are not that convincing. Similarly, the authors in [34] have presented a multi-level multi-class algorithm implemented by available machine learning tools and advanced deep learning methods based on divide and conquer rule. They achieved the specificity, sensitivity, precision and accuracy of 98.45%, 87.21%, 98.25% and 92.82% respectively for the testing phase.
Researchers are still developing conventional methods for classifying cutaneous lesions. The work proposed in [33] is based on sparse representation for classification of lesion images. The developed algorithm produces a discriminating sparse codes representing the features in a high-dimensional feature set. The reported values of sensitivity, accuracy and specificity are 96.61%, 94.83% and 93.31% respectively on the ISIC 2016 dataset. Similarly, the approach in [36] they utilize a network called the Self-supervised Topology Clustering Network (STCN) to transform an invariant network using a self-supervised modularity clustering algorithm based on the principles of topology analysis. The proposed STCN cannot filter negative sample images, which reduces the classification performance, also STSN cannot utilize hand-crafted features.
The literature review is concisely presented in the Table 1. The given indices are PRC (precision), SEN (sensitivity), ACC (accuracy), SPC (specificity), AUC (area under the curve), F1-S (F1-Score), Ppv (+ve predictive value), and Hm (Harmonic Mean).
3. Problem Statement and Contributions
Over the past few years, computer-aided detection (CAD) systems have become increasingly important in the detection and assessment of skin lesions. Nevertheless, the classification process is hindered by various limitations at both the image level, including low-contrast lesion regions, skin flakes, the presence of hair and air bubbles; and at the feature level, such as redundant or missing feature information. Consequently, achieving accurate classification becomes challenging. The presence of these undesirable characteristics has a direct or indirect impact on the segmentation and classification processes, leading to a decline in the overall performance of the system. Hence, it is imperative to tackle these issues at various stages to establish a resilient framework for detection and classification. This study primarily examines the impact of feature-level information on the ultimate classification outcome. Following the feature extraction phase, conventional feature selection techniques frequently encounter challenges related to increased computational cost and diminished accuracy. Hence, in order to address the aforementioned issue, hybrid meta-heuristic algorithms have been introduced to enhance performance.
The research presented in this study makes two primary contributions: The present study introduces a bio-inspired feature selection strategy aimed at addressing the challenges posed by the curse of dimensionality and over-fitting. This strategy focuses on identifying the most discriminant features to mitigate these issues. Second: in order to enhance the efficacy of the extracted features, a fusion mechanism is employed that leverages the complementary strengths of four pre-trained models.
Given a database of dermoscopic images, we must attribute a label to each and every image, classifying it as either benign or malignant. Let an image be a dermoscopic image for a given database . The set of images are . For a given image, the number of channels are fixed to be 3, and the number of classes C are provided by the user. Therefore, for each image the extracted features, , are later subjected to the classifier for the label assignment, , against each image. The cascaded system, which consists of a series of steps including feature fusion and selection, is ultimately represented as:
where denotes the features extracted after employing the transfer learning, depicts the fused feature set from fully connected layers of different architectures, and is the representation of selected feature set as the output of hierarchical structural design.
4. Material and Methods
4.1. Convolutional Neural Networks (CNN):
It is the most spectacular versions of deep feed-forward neural networks used for feature detecting and classifying [16,39]. Each neuron in CNN is linked to a group of other neurons in the higher layer using a feed-forward technique. Convolution, pooling, and fully linked layers make up the three main sub-blocks of the CNN’s fundamental architecture, as depicted in Figure 3.
- Convolution layer: In the CNN architecture, this is the most basic and crucial element. The primary goal of it is to identify and extract local feature sets from an input image, . Let the image database is divided into training () and testing databases , where {. The training samples are represented as , where n denotes the training image database size. For each given input image, the resulting output image is where signifies the class number. Convolutional layer consists of a kernel filter that going through each pixel of the input image as . The local feature set is obtained based on the following equation:where denotes the output feature map for that particular layer, are the trainable parameters for layer, is the activation function.
4.1.1. Pre-trained CNN models
In this study, we utilized four state-of-the-art pre-trained models for feature extraction, including DarkNet53, InceptionV3, InceptionResNetV2, and DenseNet201. There are various proposed sets of CNN architectures for computer vision applications. This decision was made based on their performance, number of parameters, and Top-1 accuracy.
- Inception-V3: The two essential components of Inception-V3 are feature extraction and classification. It is trained using the ImageNet database. Using inception units, Inception-framework V3’s can increase a network’s depth and width while also reducing its computing load.
- Inception-ResNet-V2: The development of Inception-V3, Inception-ResNet-V2 is likewise trained using the ImageNet database. It combines the ResNet module and inception. The other connections enable bypass in the model, which strengthens the network. The computational prowess of the inception units and the optimization leverage provided by the residual connections are combined in Inception-ResNet-V2.
- DenseNet-201: The ImageNet database is also used to train DenseNet-201. It is built on an advanced connectivity scheme that continuously integrates all of the output properties in a feed-forward manner. Further, it strengthens feature propagation, decreases the number of input and functional parameters, and mitigates the vanishing-gradient problem.
4.1.2. Datasets
Here in this study, we have carried our simulations on the three publicly avaialable benchmark datasets freely and publicly available image databases:
- It consists of 200 RGB images, divided in between 160 benign and 40 melanoma image samples. Database is maintained by by the Hospital Pedro Hispano, Matsinhos through a clinical observation using dermoscope. The real physicians response is also provided, i.e. normal, melanoma or typical nevus.
- ISIC-MSK: The other database incorporated here, is the International Skin Imaging Collaboration (ISIC). It includes 225 RGB dermoscopic image samples obtained from different well-reputed international cancer institutes captures by various modalities.
- ISIC-UDA: is another dataset publicly accessible for characterization and study of skin cancer (total images: 2750, training images: 2200 testing samples: 550). It contains three cancer types: melanoma, keratosis and benign; but, since keratosis is a fairly common benign skin indication, the images can be divided into two classes: malignant and benign.
For the evaluation purpose, dermatologists manually labeled all datasets. Table 2 displays the distribution of images within the previously mentioned datasets.
4.2. Proposed framework
In this study, a conventional hierarchical approach was employed, encompassing feature extraction and concluding with the final classification. The proposed framework employs transfer learning to extract deep features from pretrained models. Subsequently, the extracted features are combined in a predetermined order, and these combinations are subsequently subjected to the proposed feature selection method. The feature vectors obtained at the end of the process are subsequently employed for classification purposes. Figure 4 demonstrates the detailed flow of the proposed framework from the image acquisition to the final classification.
4.2.1. Transfer Learning
Convolutional algorithms operate under the assumption that the feature sets of both the training and testing datasets are nearly identical, allowing for straightforward estimation. Although numerous pre-trained models have undergone extensive training on general image datasets, they may not be optimal for specialized applications. Transfer learning (TL) is a viable approach as it effectively classifies images using a limited number of training instances, even in scenarios where acquiring real-world data poses challenges. The optimal performance of transfer learning is achieved when the input and output source databases exhibit a significant degree of dispersion in terms of their sizes, thereby ensuring a diverse source domain.
Consider a source domain, , where
; with particular learning assignments, , and target domain having the learning assignment as , where .
Let us consider, for a given dataset, the number of image samples are , and the model is trained over a large dataset , where ≪, and their labels are , and . The primary objective of transfer learning (TL) is to enhance the learning effectiveness of the target function by leveraging the information derived from both the source dataset and the target dataset .
4.2.2. Feature fusion
The availability of highly discriminant information is a crucial factor in enhancing classification accuracy. The presence of redundancy and irrelevant information not only diminishes the accuracy of classification but also imposes a greater computational load. Furthermore, the likelihood of attaining a high level of classification accuracy through the utilization of solely a standard feature extraction approach is quite low. Hence, a methodology for feature fusion has been selected, which not only generates a comprehensive information vector but also leads to an increase in redundancy my ref. In order to address this issue, the utilization of feature fusion in conjunction with feature selection algorithms is employed. In this study, we integrate the extracted set of features obtained from the chosen pre-trained models following the implementation of transfer learning. Suppose that for a given set of features extracted from the selected model after applying transfer learning are . The dimensions for the extracted features are given as: , extracted from the fully-connected and average pooling layers of all the selected models. The fusion process involves a sequential concatenation of feature vectors, where each new vector is embedded into the existing one. The resultant feature vectors are generated with a combination of all extracted feature vectors. Let , , , , the concatenated form follows the property given; where and . For the rest of combinations, the property still holds; , , , , .
4.2.3. Entropy-Controlled grey wolf optimization
We have employed entropy-controlled grey wolf optimization (GWO) [40] to achieve the desired result. Here in this section we offer a brief but concise background of the method. GWO is a meta-heuristic optimization technique that imitates the hunting strategy and social organizational behavior of grey wolves. This framework counts on three primary steps: skirting the prey, encircling the prey; and finally attacking and hunting the prey. In GWO, the population is categorized into alpha wolf; which is the leader of the gang, beta wolf; the second leader and delta wolf which is the third leader. Beta wolf assists the alpha leader in making the decisions, and the delta wolf dominates the pack of wolves . The hunting process is originally guided by three leaders, whereas the wolves only follow the leaders. The first step i.e. the hunting step of the pack is given as:
where is the new position of the wolf, is current position, and represents the coefficient vector. The variable depending on the current location of the prey , and is defined as:
Here is a random vector in the range . Other coefficients can be further explored in the cited article [41]. If we assume that , and are the three optimum solutions; the new position of the other wolves is modified using the following set of rules:
Here is the leader count-selected to be three. The position vectors are calculated by the Eq.6:
The parameters , and are the positions of , and at t iteration; where other set of parameters including and are calculated using the reference article [41], such as:
where , and are calculated as in [41]. GWO, in general, is utilized to solve the continuous optimization problem. It optimizes by considering a set of random solutions; for the solution there is a vector that keeps the parameters’ values of the problem. The beginning step is to estimate the objective function value of each solution. For the current solution, the entropy-based fitness value is calculated on the basis of the total amount of information in an entire probability distribution. The population vector subjected to the entropy calculation offers a maximum information range. The fitness is therefore calculated using the Shannon entropy:
where is the selected vector. Hence, each solution has one variable to keep its objective value. There are vectors and parameters other than the mentioned. These vectors and parameters store the objective function and location values of , and wolves. These values are updated before updating the position of the wolves. The GWO algorithm keeps updating the solutions using Eq.5-7.
As mentioned earlier, we have utilized GWO to solve the continuous optimization problem; but in case of feature selection, we extend the work of [41]; and embed the concept of entropy fitness function. A detailed flow of proposed entropy-controlled grey wolf optimization algorithm is given in Figure 5
5. Results and Analysis
The simulations are carried out on three publicly available datasets as shown in Table 2. Three families of contemporary classifiers, including support vector machines (SVM), k-Nearest neighbors (KNN), and Ensemble (ES), are used for classification. The proposed framework is evaluated utilizing two configurations: In the initial configuration, classification results are obtained without feature selection. In the second simulation setup, the proposed feature selection step is incorporated to obtain the classification results. In order to make a fair comparison, we have also evaluated the proposed framework alongside other classifiers. The training/testing ratio of 70:30 is selected, and hold-out cross-validation is chosen as the cross-validation technique. Table 4 provides all necessary base parameters for the chosen classifiers. The selected parameters are selected based on the default values for all the Matlab sessions. In this study, we endeavored to employ a diverse range of classifiers, encompassing SVM, KNN, and ensemble methods. This selection is predicated on the previous empirical evidence of consistently achieving superior outcomes in comparison to alternative sets of classifiers for this specific application.
In the results section, we will discuss the impact of the feature vectors produced by applying transfer learning to four pre-trained models. The flow is designed to take into account the feature combination vectors, their initial sizes, and the reduction percentage obtained after implementing the proposed feature selection algorithm.
The findings presented in Table 5 demonstrate that the greatest reduction percentage is observed when all the extracted feature vectors (FV1 - FV2 - FV3 - FV4) are combined. This suggests a high likelihood of redundant information. Despite the extent of reduction achieved, the classification accuracies remain satisfactory. The average reduction percentage for the last feature combination, which includes all feature vectors, is at its maximum value of 91.33%. In contrast, the average reduction percentages for the remaining feature combinations are 74.33%, 82.33%, 90.66%, and 88.66% respectively. Additionally, an alternative manifestation of the impact can be observed in Figure 6, which illustrates that the greatest level of reduction is attained on the ISIC-MSK dataset. Based on the obtained results, it is strongly believed that our proposed algorithm exhibits superior performance in handling large feature vectors, primarily due to its notable capability in effectively detecting and eliminating redundant information.
Based on the findings presented in Table 5, it can be inferred that the final combination exhibits the highest reduction rate. Building upon this observation, we proceeded to generate the testing accuracies, as well as other relevant parameters such as sensitivity, specificity, false negative rate (FNR), false positive rate (FPR), and F1-score in Table 6. We took the accuracy as the primay measure and compared the performance specifically on this measure in addition to other measures. FNR and FPR of all the classifiers with greater accuracy and sensitivity are at lowest that clearly indicates the superior performance of these classifiers including Fine KNN, Q-SVM, ES-KNN. We focused primarily on accuracy in our comparisons and used this and other metrics to evaluate performance. Classifiers like Fine KNN, Q-SVM, and ES-KNN that have a high level of accuracy and sensitivity also have low levels of FNR, and FPR, respectively, demonstrating their superior performance.
A give a better insight, a fair comparison of feature fusion approach with and without applying feature selection is also provided in Table 7. Three classifiers are being employed due to their superior accuracy and computational efficiency. The results demonstrate a noticeable enhancement in performance following the implementation of the feature selection technique. When comparing the classification accuracy obtained using fine KNN with and without feature selection, it is important to evaluate the impact of feature selection on the accuracy of the classification model. In the case of PH2, the maximum achieved accuracy is 98.89%, while the accuracy without feature selection is 85.22%. A discernible disparity of approximately 13% can be observed. Similar patterns are observed in other datasets. When considering the ISIC-MSK dataset, the accuracy rate is observed to be 99.01%. However, when utilizing fine KNN with the same dataset, the accuracy rate decreases to 81.23%. Although the classification accuracy achieved with other classifiers is 83.73%. Regarding ISIC-UDA, ES-KNN has demonstrated an accuracy of 99.09%. Conversely, the maximum accuracy attained for the original fused feature vector is 89.74%. Based on the statistical data, we hold the firm belief that our proposed feature selection techniques have the potential to yield exceptional results in various other applications.
6. Conclusions
Melanoma is widely acknowledged as a highly fatal variant of skin cancer, with its occurrence demonstrating an increasing pattern in recent times [42]. In recent times, a number of computer-based methodologies have been put forth with the aim of early detection and diagnosis of skin lesions. Despite having attained a certain degree of accomplishment, there persists a margin of error that is regarded as an unresolved research challenge within the machine learning community. The present study introduces an innovative framework for the categorization of skin lesions. The framework integrates deep features in order to produce a feature vector that is highly discriminative, while simultaneously preserving the integrity of the original feature space. Our study utilizes a selection of contemporary deep models, namely Darknet53, DenseNet201, InceptionV3, and InceptionResNetV2, to perform feature extraction. Furthermore, the utilization of transfer learning is employed to augment the efficacy of our methodology, and later feature selection is employed to identify the most discriminant information. The approach demonstrated satisfactory performance in the majority of cases. However, it is important to note that the feature selection method may not be effective for feature vectors exhibiting maximum correlation. Furthermore, the inclusion of a pre-processing step has the potential to enhance the accuracy even further.
In subsequent research, there is potential for the improvement of the feature selection method and the implementation of a contrast enhancement procedure as a preprocessing step.
Funding
The authors are thankful to Princess Nourah bint Abdulrahman University Researchers Supporting Project number (PNURSP2023R410), Princess Nourah bint Abdulrahman University, Riyadh, Saudi Arabia.
Conflicts of Interest
The authors declare no conflict of interest.
References
- Amazon, E. Instances [WWW Document](2015). URL http://aws. amazon. com/ec2/instance-types (Accessed 06 July 2015).
- Ajmal, M.; Khan, M.A.; Akram, T.; Alqahtani, A.; Alhaisoni, M.; Armghan, A.; Althubiti, S.A.; Alenezi, F. BF2SkNet: Best deep learning features fusion-assisted framework for multiclass skin lesion classification. Neural Computing and Applications 2022, pp. 1–17.
- Akram, T.; Lodhi, H.M.J.; Naqvi, S.R.; Naeem, S.; Alhaisoni, M.; Ali, M.; Haider, S.A.; Qadri, N.N. A multilevel features selection framework for skin lesion classification. Human-centric Computing and Information Sciences 2020, 10, 1–26. [Google Scholar] [CrossRef]
- Karimkhani, C.; Green, A.C.; Nijsten, T.; Weinstock, M.A.; Dellavalle, R.P.; Naghavi, M.; Fitzmaurice, C. The global burden of melanoma: results from the Global Burden of Disease Study 2015. British Journal of Dermatology 2017, 177, 134–140. [Google Scholar] [CrossRef] [PubMed]
- Foundation, S.C. The Skin Cancer Foundation, 2018. Skin Cancer Information. [WWW Document]. (2018). URL https://www.skincancer.org/skin-cancer-information/ (accessed 2.17.20).
- Rebecca L. Siegel, Kimberly D. Miller, H.E.F.A.J. Cancer statistics, 2022. A Cancer journal for clinicians 2022, pp. 7–33.
- Cokkinides, V.; Albano, J.; Samuels, A.; Ward, M.; Thum, J. American cancer society: Cancer facts and figures. Atlanta: American Cancer Society, 2022. [Google Scholar]
- Society, A.C. Key Statistics for Melanoma Skin Cancer. [WWW Document]. (2022). URL https://www.cancer.org/cancer/melanoma-skin-cancer/about/key-statistics.html/ (accessed 10.17.22).
- Australia), A.G.C. Melanoma of the skin. [WWW Document]. (2022). URL https://www.canceraustralia.gov.au/cancer-types/melanoma/statistics/ (accessed 10.18.22).
- of Health, A.I. ; Welfare. Skin Cancer. [WWW Document]. (2022). URL https://www.aihw.gov.au/ (accessed 10.18.22).
- Marks, R. Epidemiology of melanoma. clinical and experimental dermatology 2000, 25, 459–463. [Google Scholar] [CrossRef] [PubMed]
- Rigel, D. S., F. R.J.K.A.W..P.D. ABCDE—an evolving concept in the early detection of melanoma. Archives of dermatology 2005, 141, 1032–1034. [Google Scholar] [CrossRef]
- Naqvi, S.R.; Akram, T.; Haider, S.A.; Kamran, M. Artificial neural networks based dynamic priority arbitration for asynchronous flow control. Neural Computing and Applications 2018, 29, 627–637. [Google Scholar] [CrossRef]
- Haider, S.A.; Naqvi, S.R.; Akram, T.; Kamran, M.; Qadri, N.N. Modeling electrical properties for various geometries of antidots on a superconducting film. Applied Nanoscience 2017, 7, 933–945. [Google Scholar] [CrossRef]
- P. Tschandl, C. Rosendahl, B.A.G.A.A.B.R.B.e.a. Expert-level diagnosis of nonpigmented skin cancer by combined convolutional neural networks. JAMA Dermatol 2019, 155, 58–65. [Google Scholar] [CrossRef]
- Attique Khan, M.; Sharif, M.; Akram, T.; Kadry, S.; Hsu, C.H. A two-stream deep neural network-based intelligent system for complex skin cancer types classification. International Journal of Intelligent Systems 2022, 37, 10621–10649. [Google Scholar] [CrossRef]
- M. A. Khan, T. Akram, M.S.T.S.K.J.I.L. Construction of saliency map and hybrid set of features for efficient segmentation and classification of skin lesion. Microsc. Res. Tech 2019, 82, 741–763. [Google Scholar] [CrossRef]
- F. Afza, M.A. Khan, M.S.A.R. Microscopic skin laceration segmentation and classification: a framework of statistical normal distribution and optimal feature selection. Microsc. Res. Tech 2019, 82, 1471–1488. [Google Scholar] [CrossRef]
- M.A. Khan, M.Y. Javed, M.S.T.S.A.R. Multi-model deep neu- ral network based features extraction and optimal selection approach for skin lesion classification. In 2019 international conference on computer and information sciences (ICCIS) 2019, pp. 1–7.
- N. Zhang, Y.-.X. Cai, Y.Y.W.Y.T.T.X.L.W.B.B. Skin cancer diagnosis based on optimized convolutional neural network. Artif. Intell. Med. 2020, 102, 101756. [Google Scholar] [CrossRef]
- Iqbal, I.; Younus, M.; Walayat, K.; Kakar, M.U.; Ma, J. Automated multi-class classification of skin lesions through deep convolutional neural network with dermoscopic images. Computerized medical imaging and graphics 2021, 88, 101843. [Google Scholar] [CrossRef] [PubMed]
- Harangi, B.; Baran, A.; Hajdu, A. Assisted deep learning framework for multi-class skin lesion classification considering a binary classification support. Biomedical Signal Processing and Control 2020, 62, 102041. [Google Scholar] [CrossRef]
- Rodrigues, D.d.A.; Ivo, R.F.; Satapathy, S.C.; Wang, S.; Hemanth, J.; Reboucas Filho, P.P. A new approach for classification skin lesion based on transfer learning, deep learning, and IoT system. Pattern Recognition Letters 2020, 136, 8–15. [Google Scholar] [CrossRef]
- Bi, L.; Feng, D.D.; Fulham, M.; Kim, J. Multi-label classification of multi-modality skin lesion via hyper-connected convolutional neural network. Pattern Recognition 2020, 107, 107502. [Google Scholar] [CrossRef]
- Gessert, N.; Sentker, T.; Madesta, F.; Schmitz, R.; Kniep, H.; Baltruschat, I.; Werner, R.; Schlaefer, A. Skin lesion classification using CNNs with patch-based attention and diagnosis-guided loss weighting. IEEE Transactions on Biomedical Engineering 2019, 67, 495–503. [Google Scholar] [CrossRef] [PubMed]
- Qin, Z.; Liu, Z.; Zhu, P.; Xue, Y. A GAN-based image synthesis method for skin lesion classification. Computer Methods and Programs in Biomedicine 2020, 195, 105568. [Google Scholar] [CrossRef] [PubMed]
- Al-Masni, M.A.; Kim, D.H.; Kim, T.S. Multiple skin lesions diagnostics via integrated deep convolutional networks for segmentation and classification. Computer methods and programs in biomedicine 2020, 190, 105351. [Google Scholar] [CrossRef]
- Gessert, N.; Nielsen, M.; Shaikh, M.; Werner, R.; Schlaefer, A. Skin lesion classification using ensembles of multi-resolution EfficientNets with meta data. MethodsX 2020, 7, 100864. [Google Scholar] [CrossRef]
- Jin, Q.; Cui, H.; Sun, C.; Meng, Z.; Su, R. Cascade knowledge diffusion network for skin lesion diagnosis and segmentation. Applied Soft Computing 2021, 99, 106881. [Google Scholar] [CrossRef]
- Chatterjee, S.; Dey, D.; Munshi, S.; Gorai, S. Extraction of features from cross correlation in space and frequency domains for classification of skin lesions. Biomedical Signal Processing and Control 2019, 53, 101581. [Google Scholar] [CrossRef]
- Rebouças Filho, P.P.; Peixoto, S.A.; da Nóbrega, R.V.M.; Hemanth, D.J.; Medeiros, A.G.; Sangaiah, A.K.; de Albuquerque, V.H.C. Automatic histologically-closer classification of skin lesions. Computerized Medical Imaging and Graphics 2018, 68, 40–54. [Google Scholar] [CrossRef]
- Serte, S.; Demirel, H. Gabor wavelet-based deep learning for skin lesion classification. Computers in biology and medicine 2019, 113, 103423. [Google Scholar] [CrossRef] [PubMed]
- Moradi, N.; Mahdavi-Amiri, N. Kernel sparse representation based model for skin lesions segmentation and classification. Computer methods and programs in biomedicine 2019, 182, 105038. [Google Scholar] [CrossRef] [PubMed]
- Hameed, N.; Shabut, A.M.; Ghosh, M.K.; Hossain, M.A. Multi-class multi-level classification algorithm for skin lesions classification using machine learning techniques. Expert Systems with Applications 2020, 141, 112961. [Google Scholar] [CrossRef]
- Mahbod, A.; Schaefer, G.; Wang, C.; Dorffner, G.; Ecker, R.; Ellinger, I. Transfer learning using a multi-scale and multi-network ensemble for skin lesion classification. Computer methods and programs in biomedicine 2020, 193, 105475. [Google Scholar] [CrossRef]
- Wang, D.; Pang, N.; Wang, Y.; Zhao, H. Unlabeled skin lesion classification by self-supervised topology clustering network. Biomedical Signal Processing and Control 2021, 66, 102428. [Google Scholar] [CrossRef]
- Chatterjee, S.; Dey, D.; Munshi, S. Integration of morphological preprocessing and fractal based feature extraction with recursive feature elimination for skin lesion types classification. Computer methods and programs in biomedicine 2019, 178, 201–218. [Google Scholar] [CrossRef] [PubMed]
- Liu, L.; Mou, L.; Zhu, X.X.; Mandal, M. Automatic skin lesion classification based on mid-level feature learning. Computerized Medical Imaging and Graphics 2020, 84, 101765. [Google Scholar] [CrossRef]
- Kamga, G.A.F.; Bitjoka, L.; Akram, T.; Mbom, A.M.; Naqvi, S.R.; Bouroubi, Y. Advancements in satellite image classification : methodologies, techniques, approaches and applications. International Journal of Remote Sensing 2021, 42, 7662–7722. [Google Scholar] [CrossRef]
- Mirjalili, S.; Mirjalili, S.M.; Lewis, A. Grey wolf optimizer. Advances in engineering software 2014, 69, 46–61. [Google Scholar] [CrossRef]
- Faris, H.; Aljarah, I.; Al-Betar, M.A.; Mirjalili, S. Grey wolf optimizer: a review of recent variants and applications. Neural computing and applications 2018, 30, 413–435. [Google Scholar] [CrossRef]
- Oliveira, R.B.; Papa, J.P.; Pereira, A.S.; Tavares, J.M.R. Computational methods for pigmented skin lesion classification in images: review and future trends. Neural Computing and Applications 2018, 29, 613–636. [Google Scholar] [CrossRef]
Figure 1.
Epidemiological data on skin cancer: a) WHO projections for skin cancer in 2022; b) average accumulated sun exposure Vs age groups
Figure 1.
Epidemiological data on skin cancer: a) WHO projections for skin cancer in 2022; b) average accumulated sun exposure Vs age groups
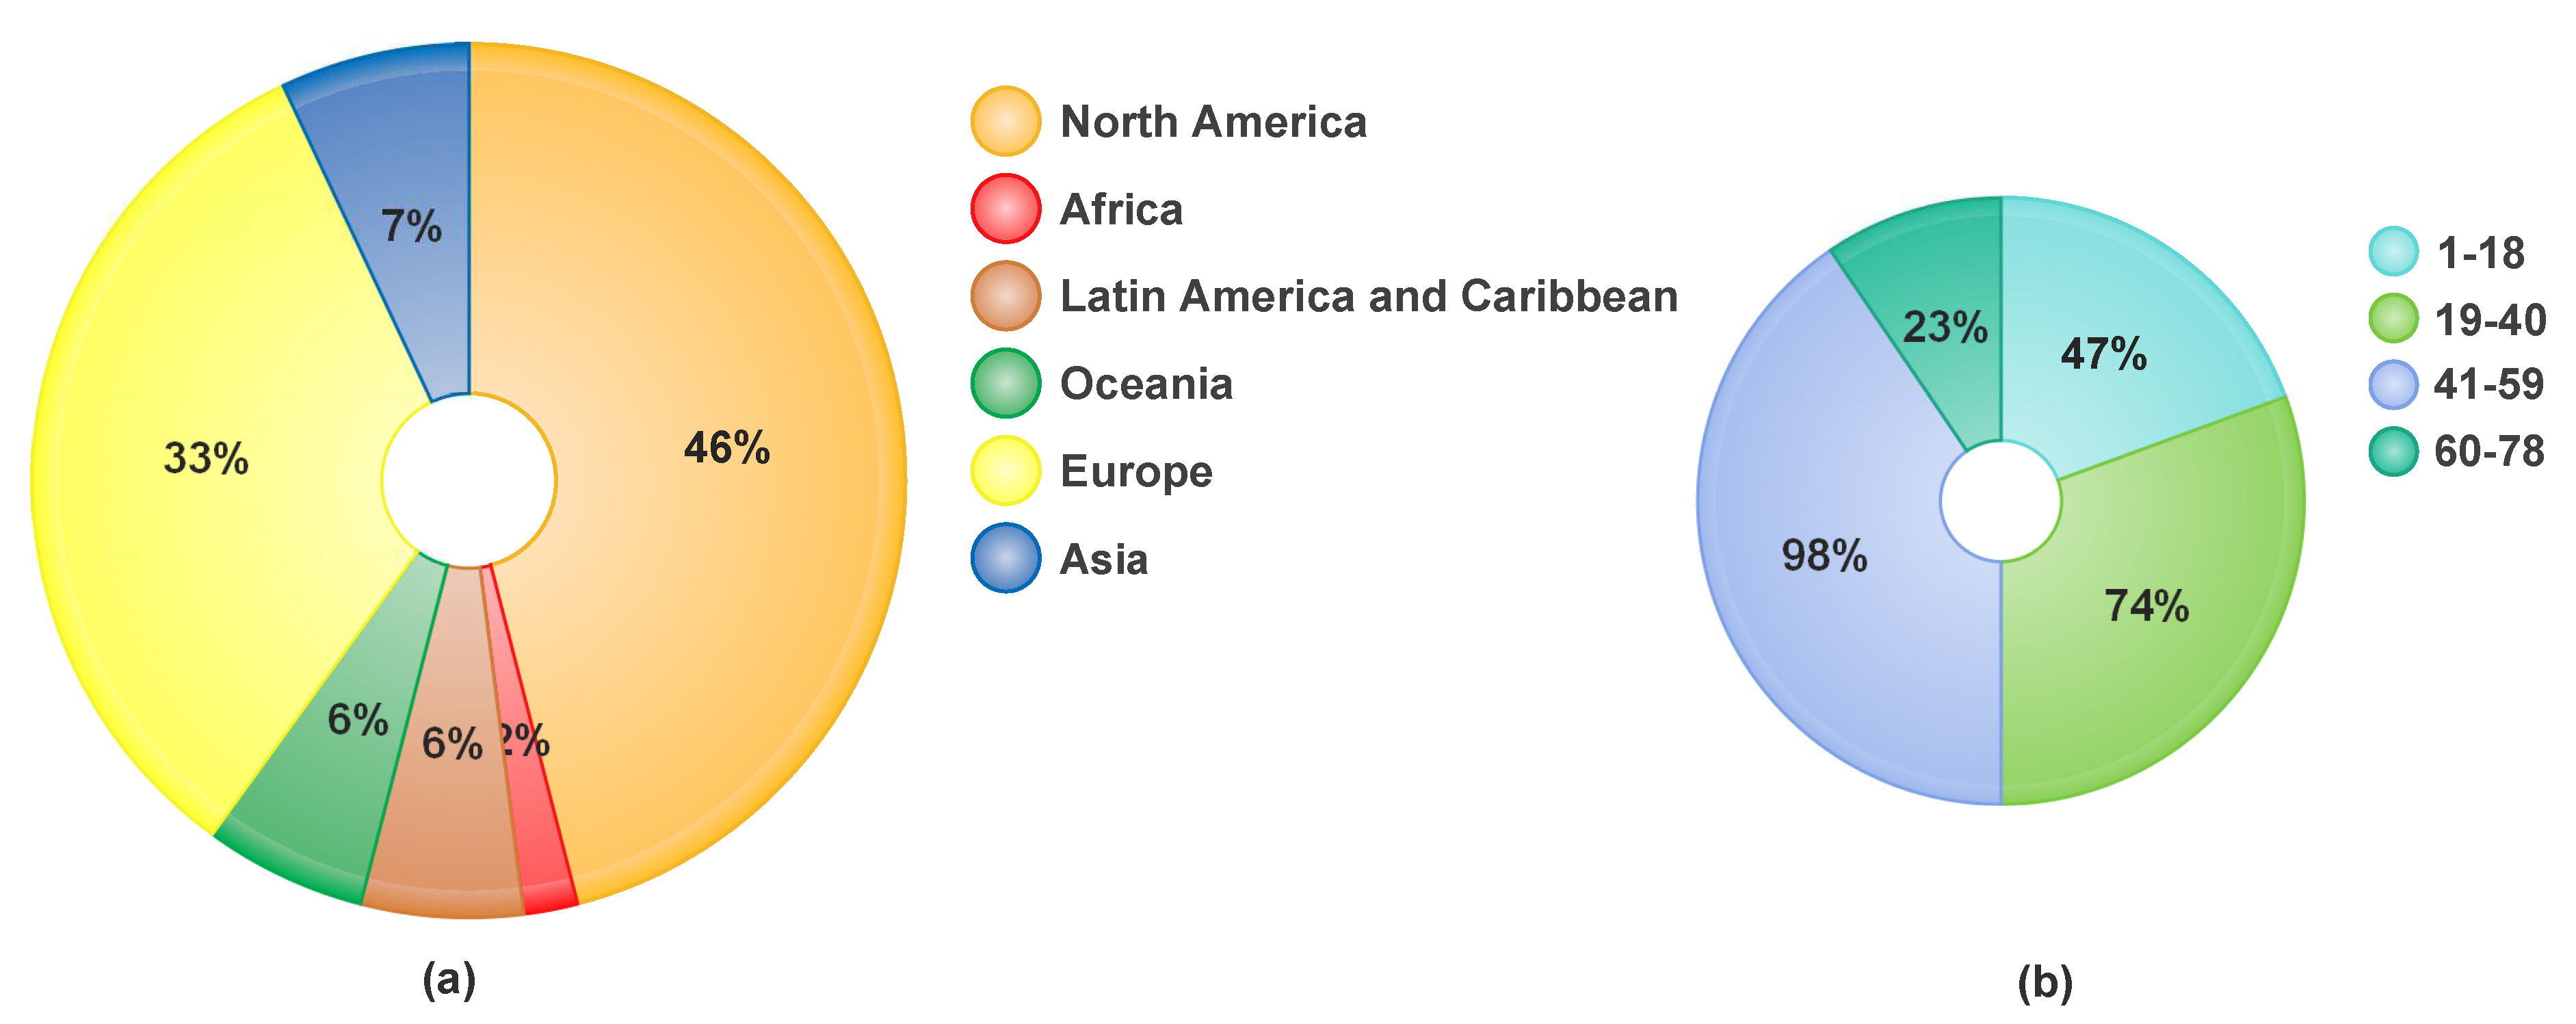
Figure 2.
Selected skin lesion samples showing benign class (left), and the malignant class (right)
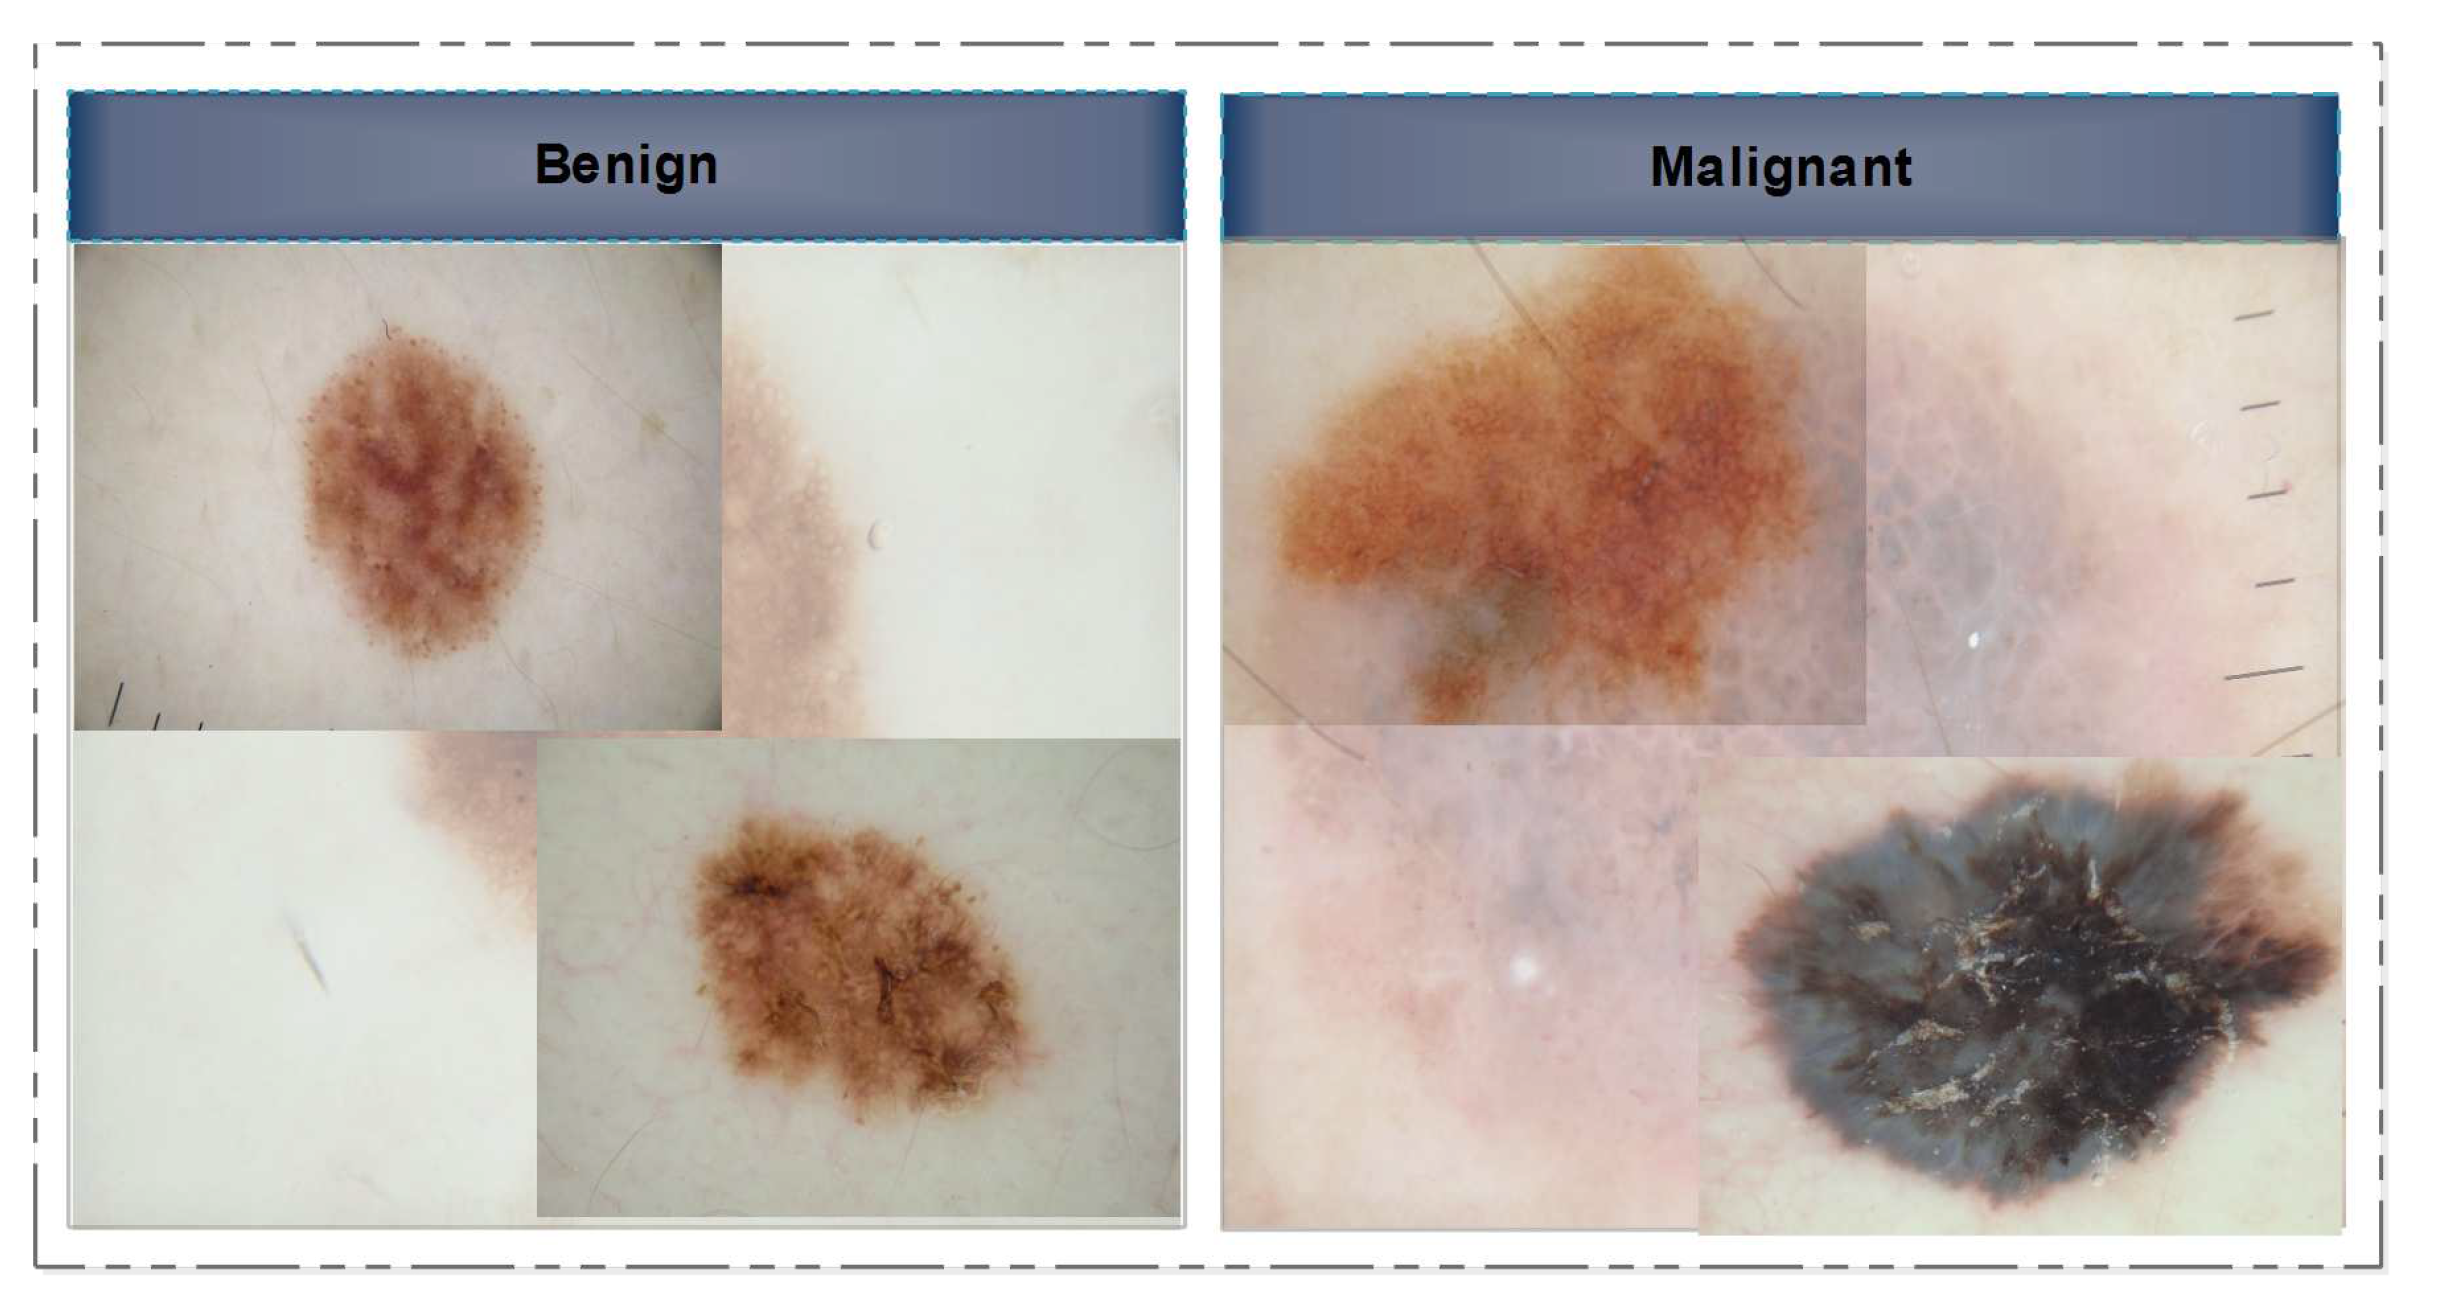
Figure 3.
Basic Architecture of CNN
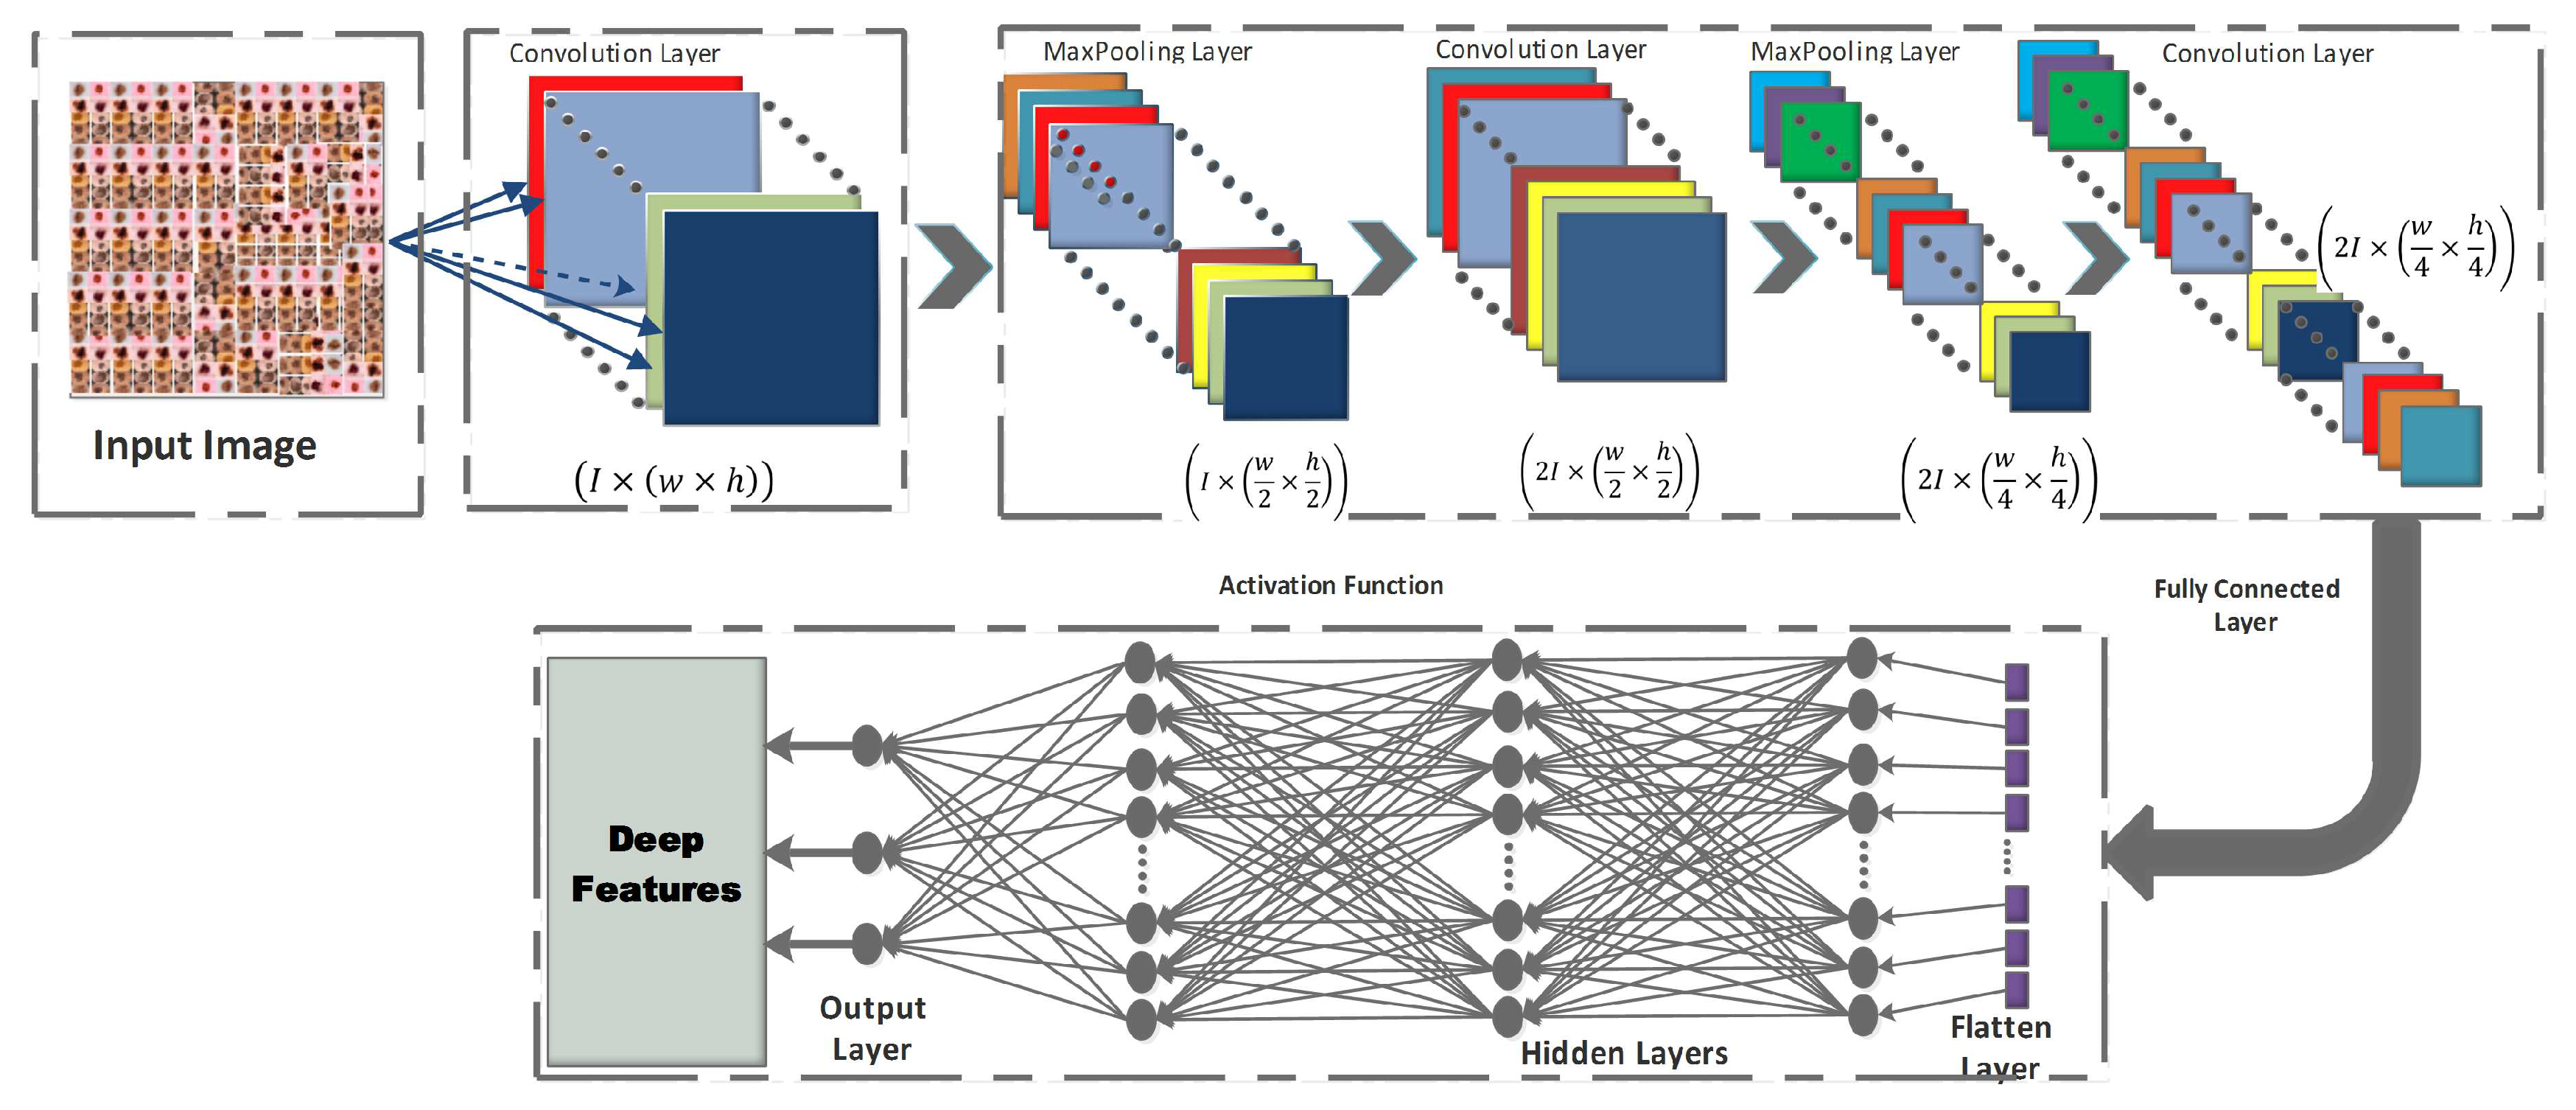
Figure 4.
Detailed illustration of proposed skin lesion classification framework
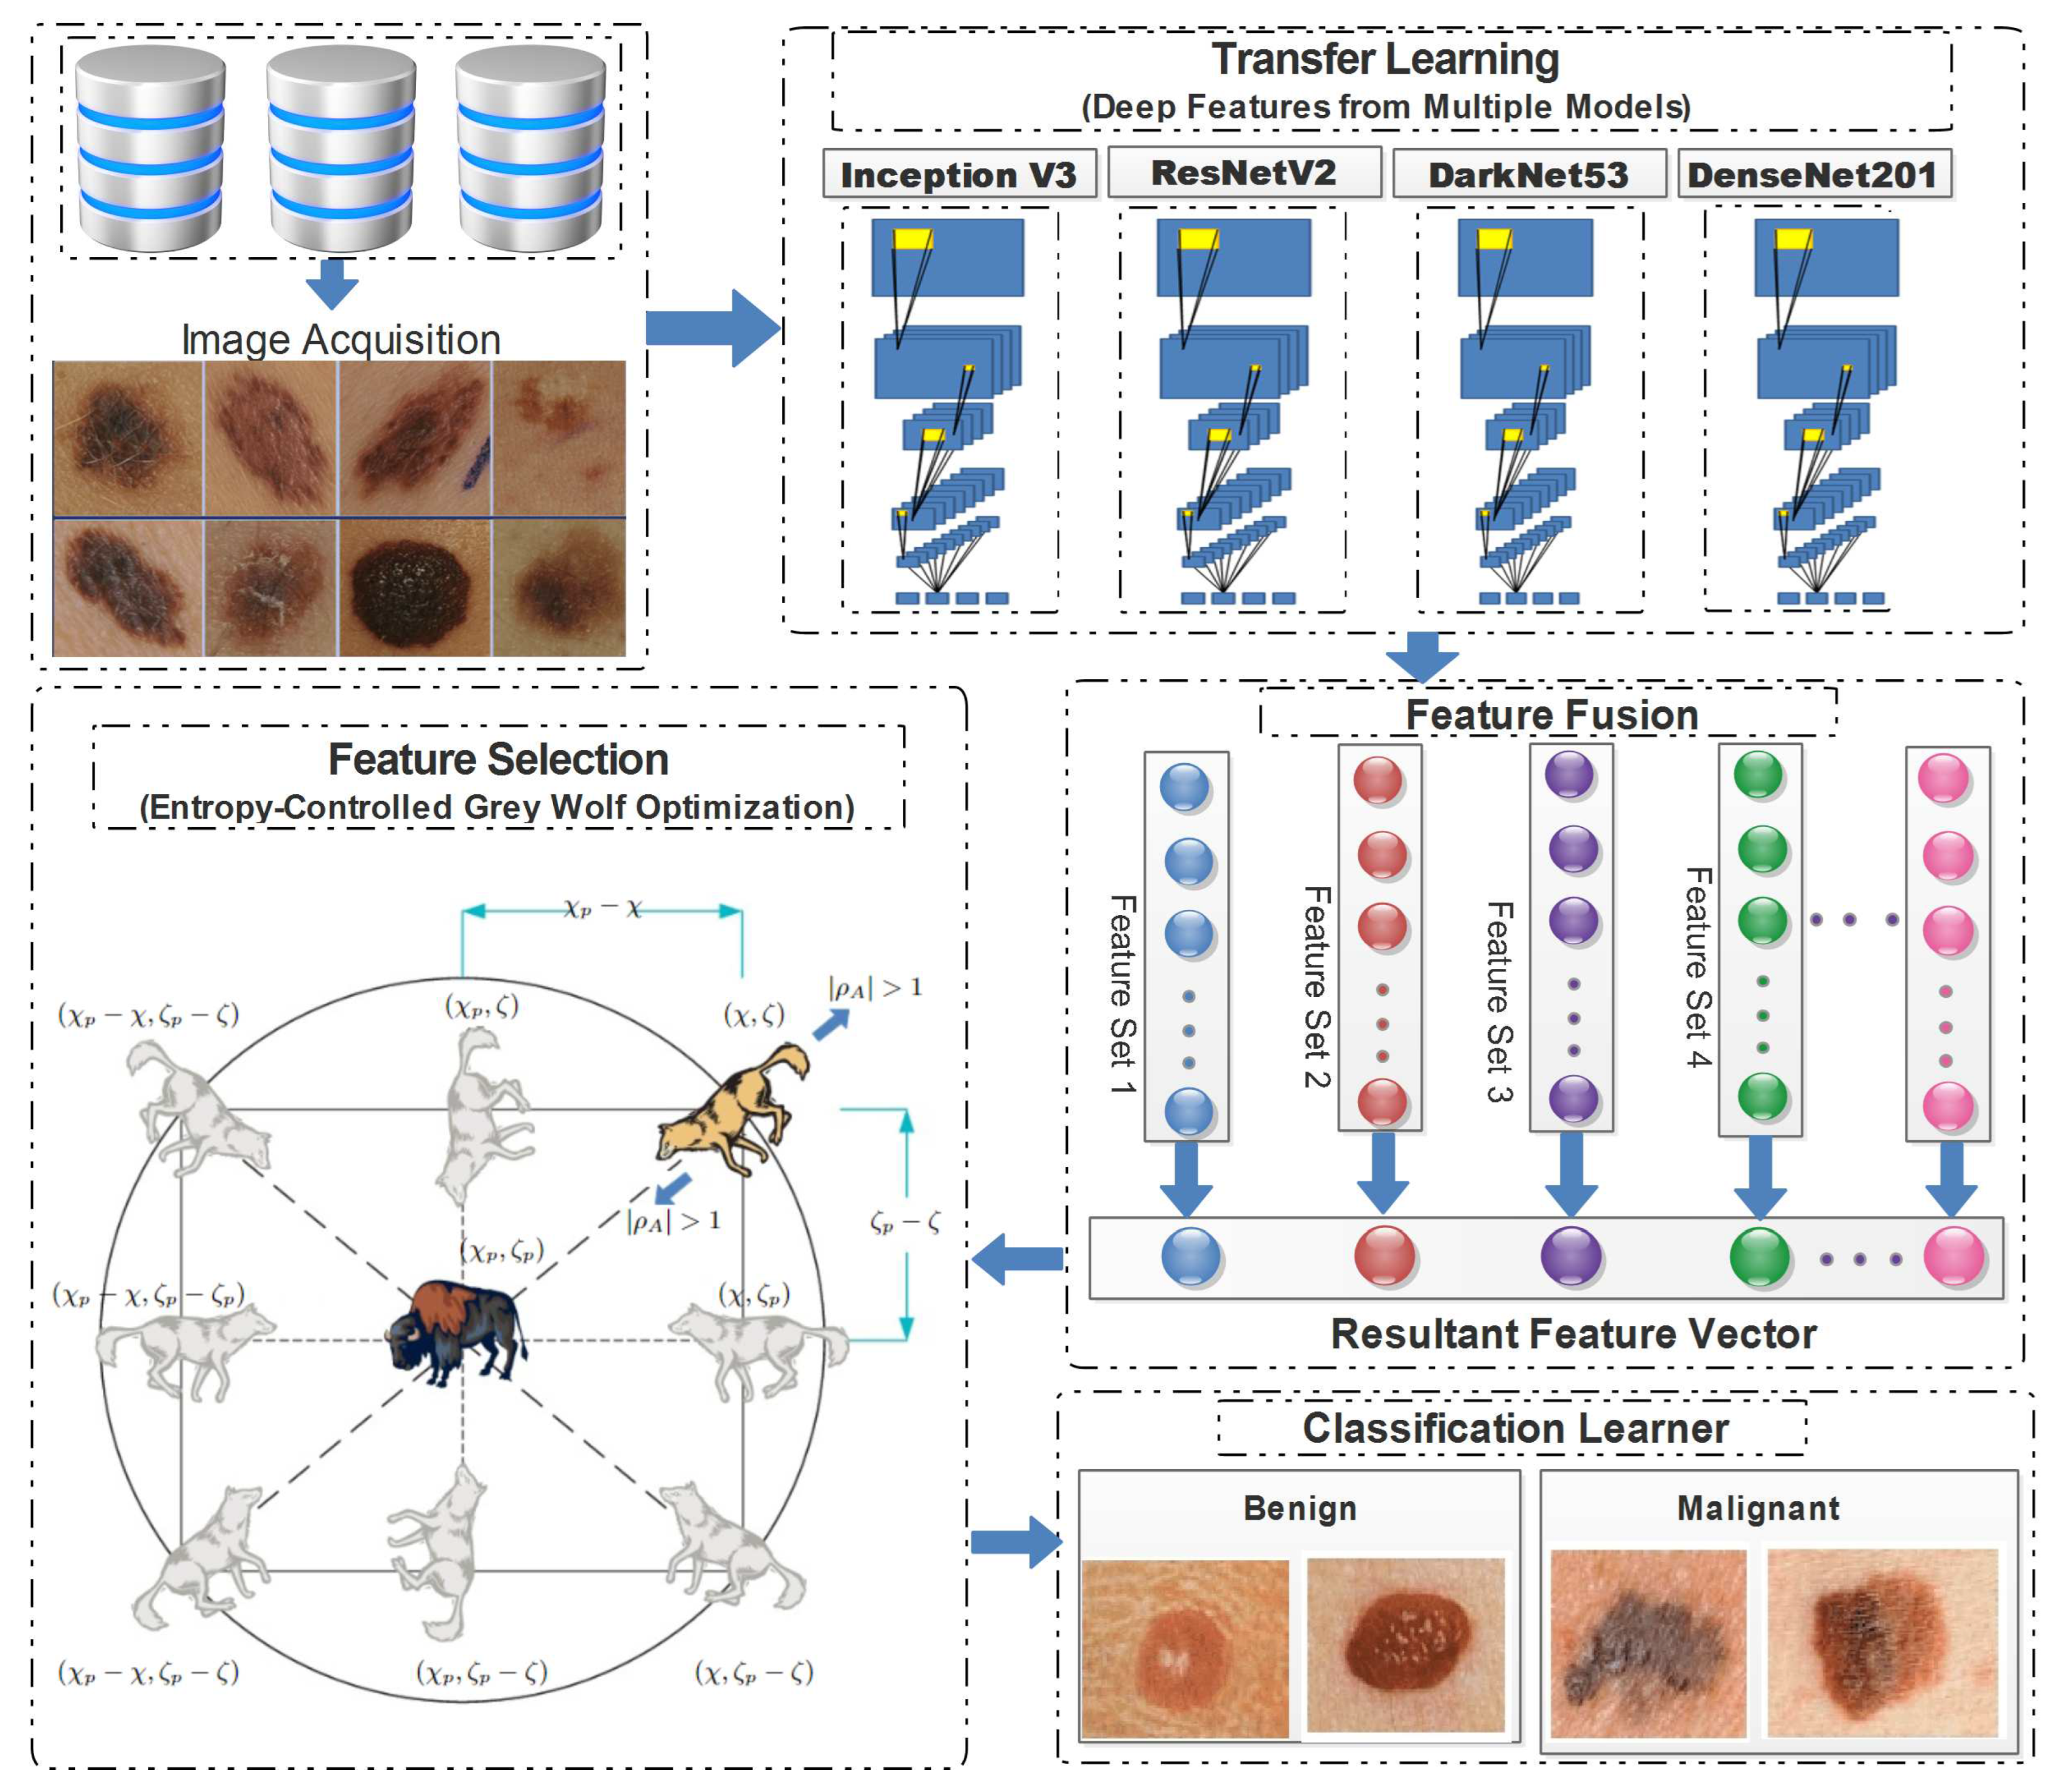
Figure 5.
Detailed flow diagram of proposed entropy-controlled grey wolf optimization
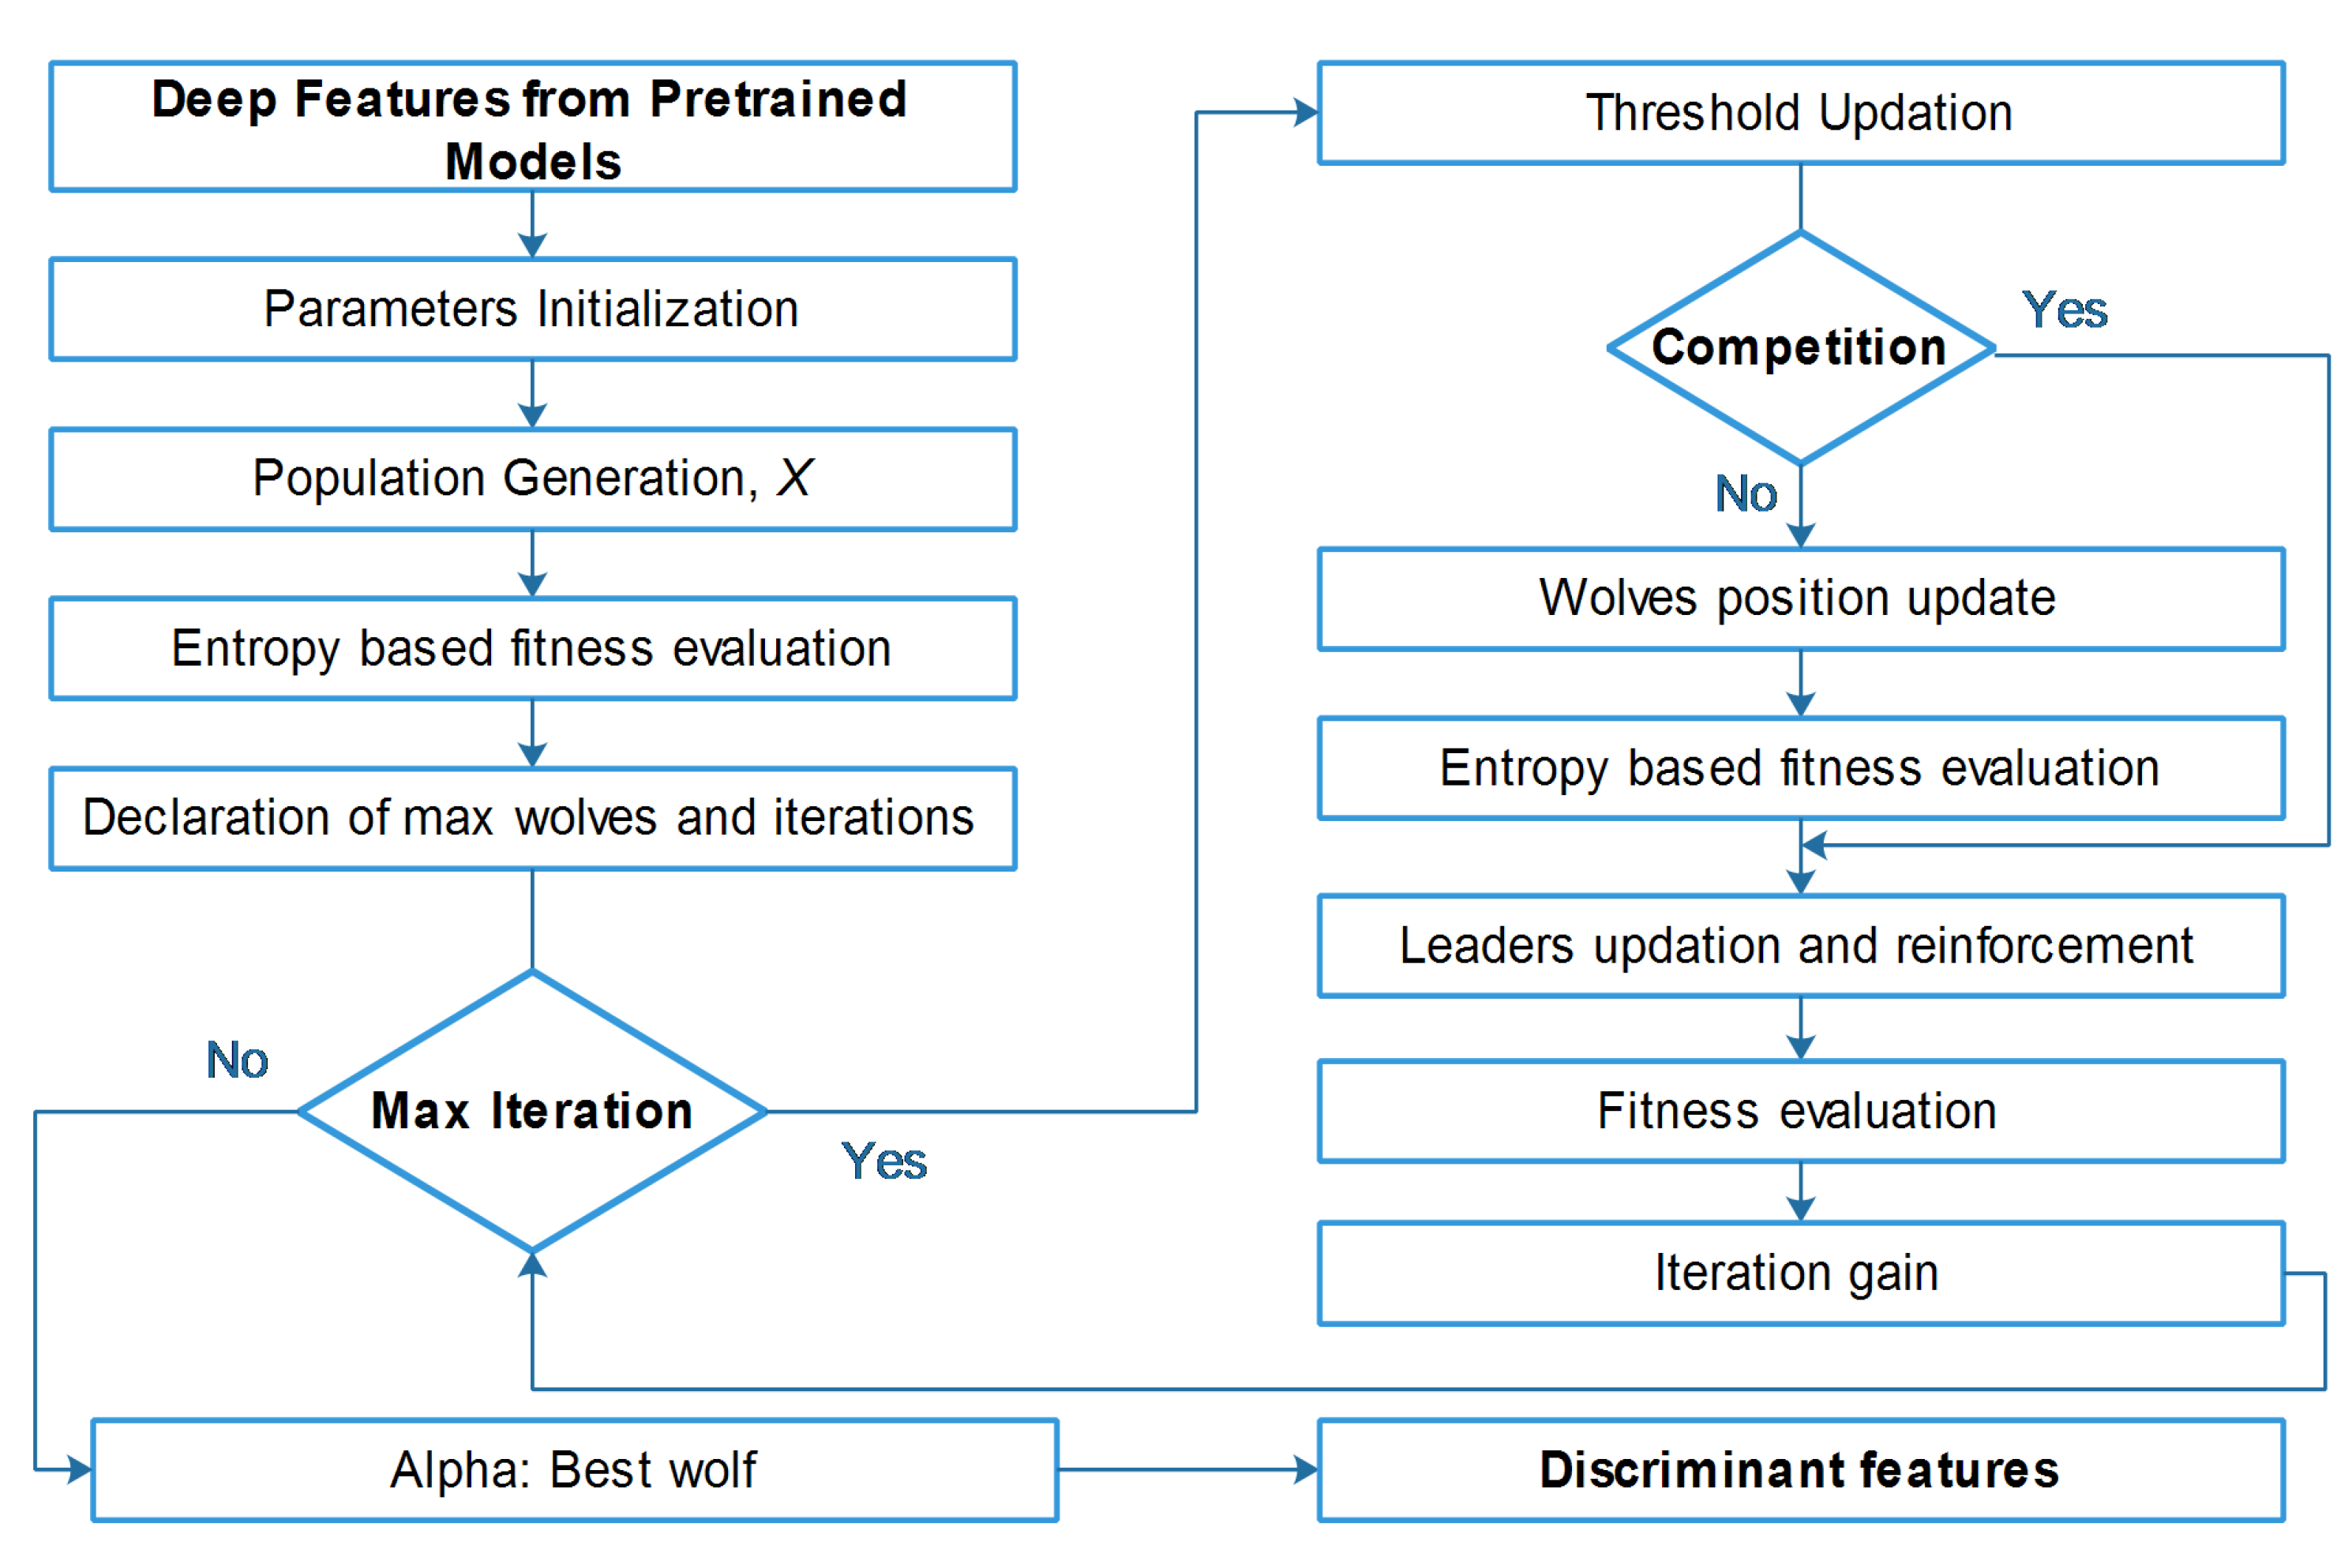
Figure 6.
Comparison of reduction percentage for each selected dataset.
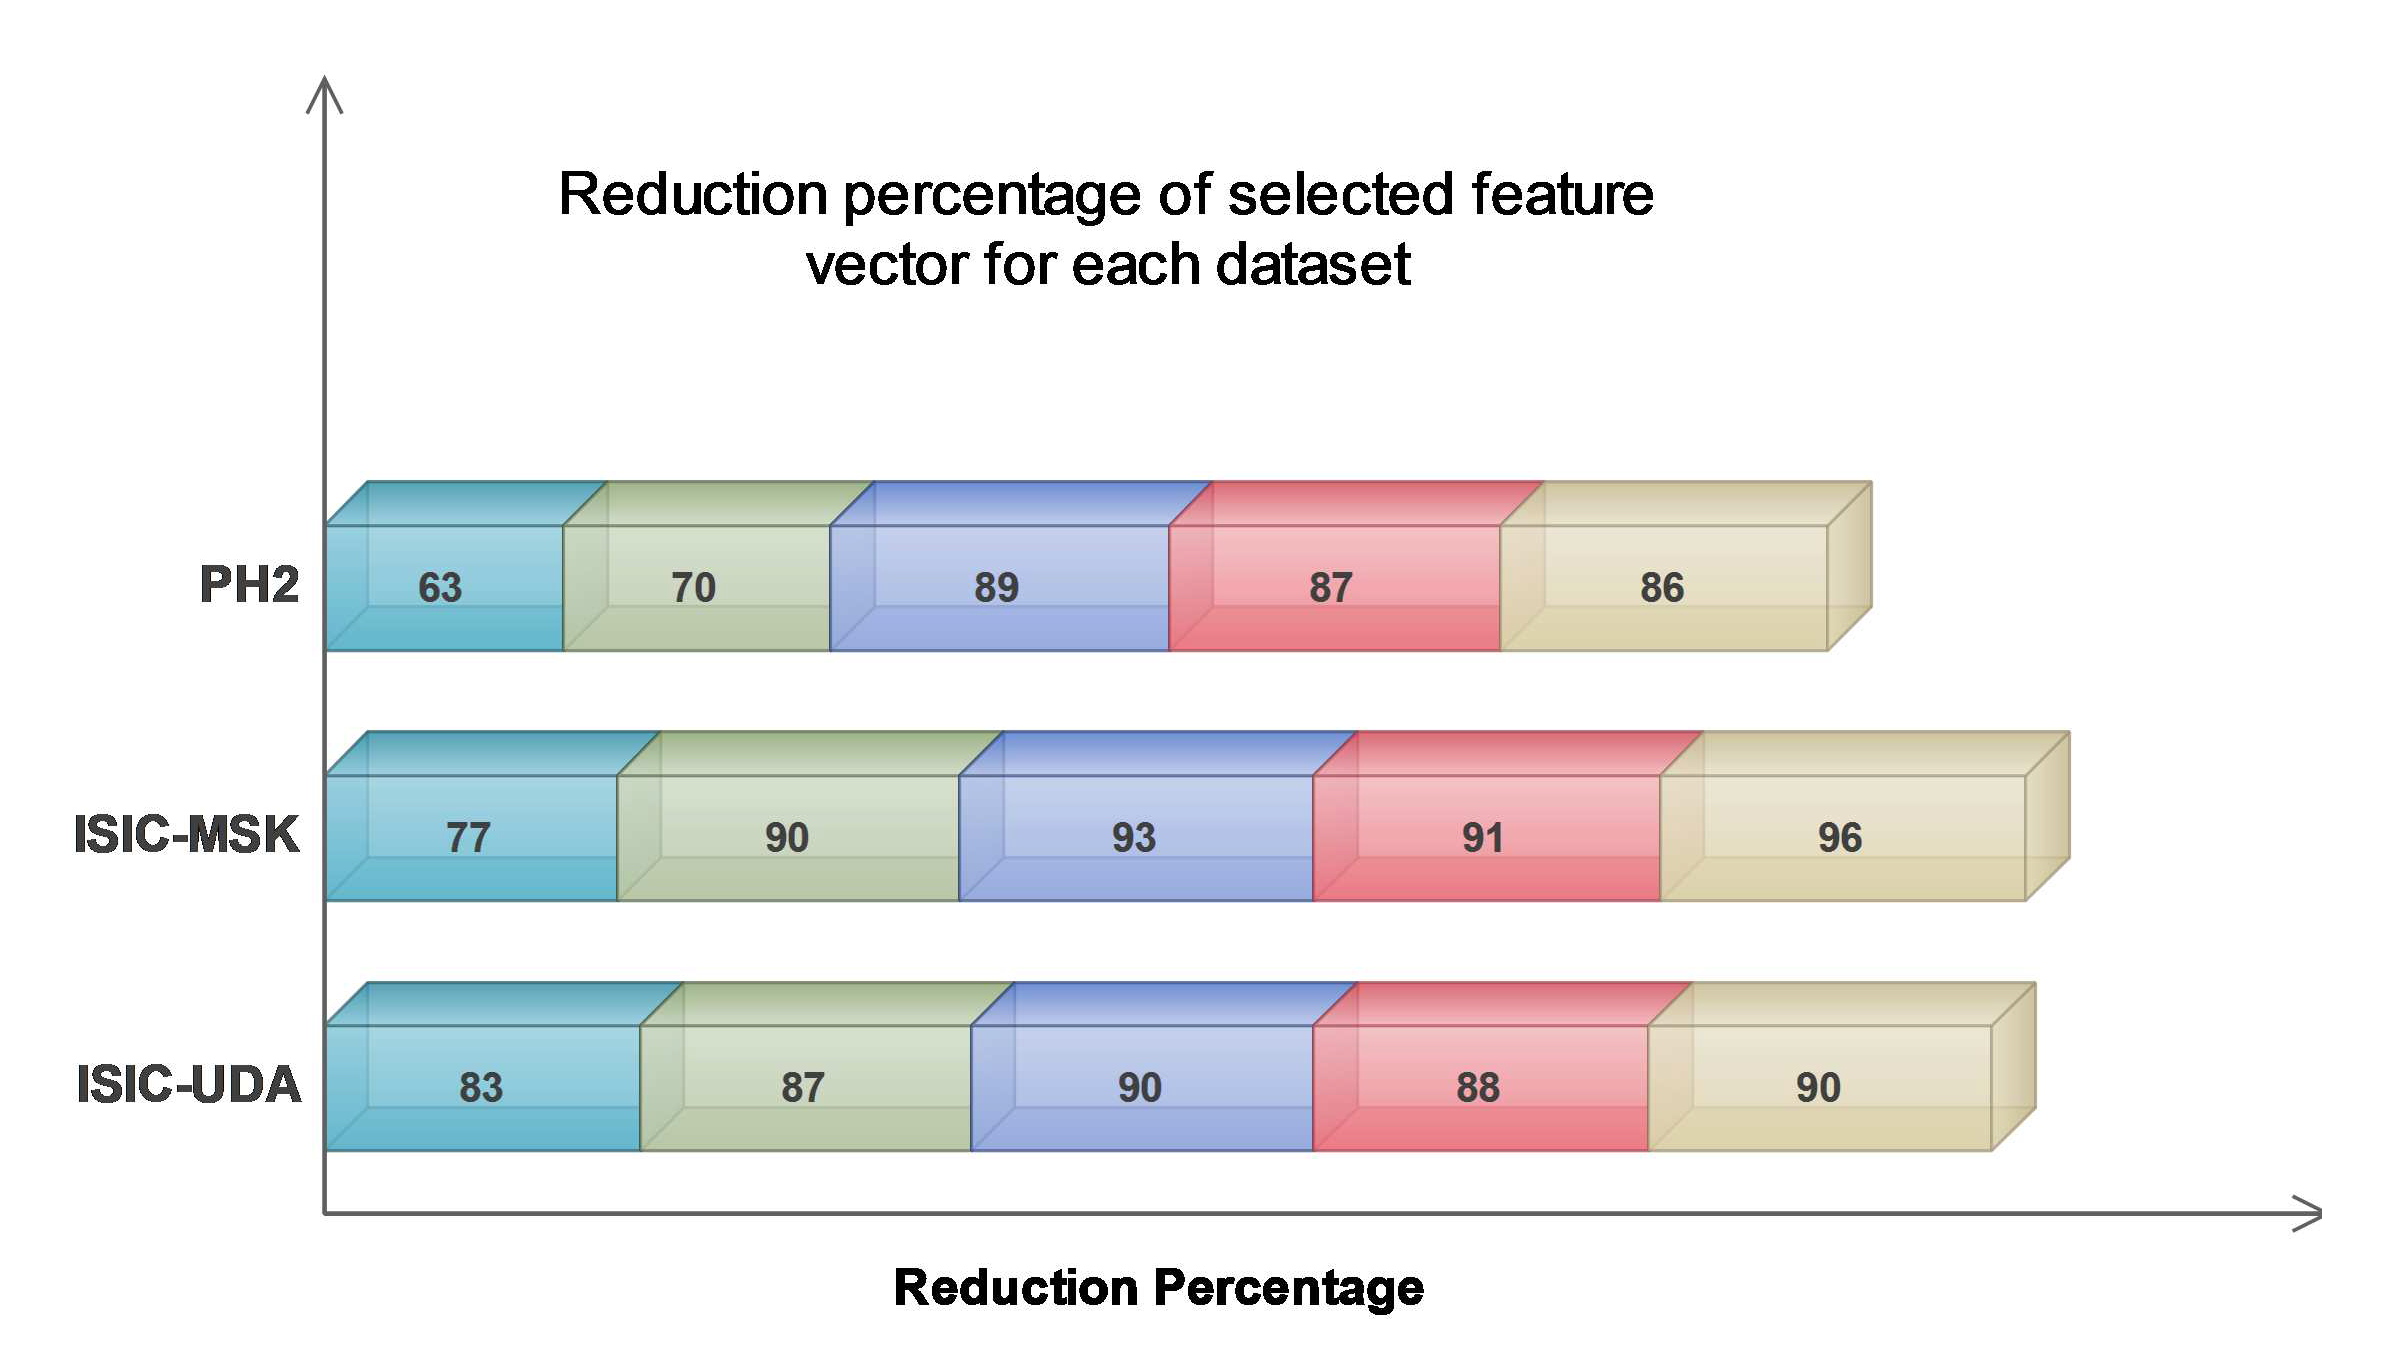

Table 1.
A comparative analysis of performance, techniques, and datasets in literature for various techniques and their evaluations
Table 1.
A comparative analysis of performance, techniques, and datasets in literature for various techniques and their evaluations
| Ref. | Year | Performance Parameters | Dataset | Remarks |
|---|---|---|---|---|
| [21] | 2021 | PRC=94.0% AUC=96.4% | ISIC-17,19 | The proposed model has multiple layers and filter sizes; but a fewer number of filters and parameters to classify the skin lesion images. |
| [31] | 2018 | SEN=89.9% SPC=92.1% F1-S=90% Ppv=91.3% | ISIC-17 | An automatic approach to classify melanoma, with the advantage of transforming the structural co-occurence matrix (SCM) in an adaptive feature extractor; that helps the classification process to depend only on the input image as a parameter. |
| [25] | 2019 | SEN=73.3% SPC=96.3% F1-S=85% | HAM | Research has two contributions: first, efficient application of high-resolution image dataset with pre-trained state of the art architecture for classification; Second, high variation faced in the real image database. |
| [26] | 2020 | SEN=83.2% ACC=95.2% SPC=96.6% | ISIC-18 | GAN-based data segmentation approach. The original generator’s style, control and input noise structures are altered by the model. The classifier is generated by a pretrained DCNN using transfer learning method. |
| [23] | 2020 | PRC=92.6%ACC=92.5% F1-S=92% | PH2 | This work presents skin caner lesion classification using transfer learning and CNN (as resource extractors). The method combines twelve CNN models with several different classifiers on PH2 and ISBI-ISIC dataset. |
| [22] | 2020 | SEN=73.7% ACC=92.5% AUC=91.2% Ppv=74.1% | ISIC-17 | Framework divides dermoscopic images with seven classes two possible classes: positive/negative. The DCNN is trained regarding this binary problem. The parameters regarding classification are later used to adjust for the multi-class categorization. |
| [29] | 2021 | SEN=70.0% ACC=88.1% SPC=92.5% AUC=90.5% Ppv=73.8% | ISIC-17 | In propsed framework which is a series of coarse-level segmentation, categorization, and fine-level segmentation networks. The two feature mixing modules are outlined to accommodate the diffused feature set from starting segmentation; and to integrate the related knowledge learned to help fine-level segmentation. |
| [32] | 2019 | SEN=17.0% ACC=79.0% SPC=95.0% AUC=70.0% | ISIC-17 | Seven separate directional sub-bands are created from gabor wavelet-based DCNN.from input images. Later, the output sub-band and input images are passed to eight parallel CNNs. To categorise the skin cancer lesion, the addition rule is used. |
| [33] | 2019 | SEN=96.6% ACC=94.8% SPC=93.3% | ISIC-16 | Kernel sparse representation based method is proposed. A linear classifier and a kernel-based meta-data are both jointly adopted by the discriminative kernel sparse coding technique. |
| [34] | 2020 | SEN=87.2% ACC=92.8% ACC=87.2% | ISIC | A multi-class multi-level classification method focuses on "divide and conquer" is presented. The algorithm is tuned using traditional NN tools and advanced deep learning methodologies. |
| [24] | 2020 | PRC=75.9%SEN=68.2% SPC=84.6% | 7 Point Checklist | The method uses a hyper-connected CNN by adding the visual properties of dermoscopy and clinical skin cancer images, and introducing a deep HcCNN with multi-scale attention block. |
| [27] | 2020 | SEN=75.7%ACC=81.6% SPC=80.6% | ISIC-17 | The framework integrates a skin lesion boundary segment and a multiple skin lesions classification stage. Then a CNN such as inception-v3 is employed. |
| [28] | 2020 | SEN=71.0% AUC=96.0% | ISIC-19 | The Method classifies the skin lesions with the help of statistics of multi-resolution EfficientNets with meta-data; using EfficientNets, SENet, and ResNet WSI. |
| [35] | 2020 | PRC=91.3%ACC=96.3% AUC=98.1% | ISIC-18 | The authors investigated the image size effect in classifying the skin lesion images using pre-trained CNNs. The performance EfficientNetB0 &B1, and SetReNetXt50 has been examined. |
| [36] | 2021 | ACC=80.0% | ISIC-18 | The research uses a Self-supervised Topology Clustering Network (STCN) by transformation invariant model network with modularity clustering algorithm. |
| [37] | 2019 | SEN=91.7% ACC=95.2% SPC=97.9% | ISIC 2016 | A recursive feature rejection based layered structured multi-class image categorization is used. Before the classification, features such as the shape and size, border non uniformity, color and texture of the skin lesion region are extracted. |
| [38] | 2020 | AUC=92.1% | ISIC-17 | The authors proposed a lesion classification method centered on mid-level features. Images are segmented first to identify the regions of interest, then the pre-trained DenseNet and ResNet are employed to extract the feature set. |
Table 2.
Selected skin lesion image datasets and their respective ratio of training to testing
| Dataset | Total Images | Training/Validation set | Testing set |
|---|---|---|---|
| PH | 200 | 160 | 40 |
| ISIC MSK-2 | 287 | 201 | 86 |
| ISIC UDA-1 | 387 | 271 | 116 |
Table 3.
Set of selected classifiers and their corresponding base parameters
| Classifier (selected) | Base parameters |
|---|---|
| Linear SVM | Kernel function: Linear Multi-class method: One-vs-One |
| Effecient L-SVM | Kernel function: Linear Multi-class method: One-vs-One |
| Cubic SVM | Kernel function: Cubic Multi-class method: One-vs-One |
| Fine KNN | Number of neighbours:1 Distance metric: Euclidean Weight: equal, |
| Medium KNN | Number of neighbours: 10 Distance metric: Euclidean Weight: equal |
| Weighted KNN | Number of neighbours: 10 Distance metric: Euclidean Weight: Squared inverse |
| Ensemble-BT | Ensemble method: AdaBoost Learner type: Decision tree Max. split: 20 Number of learners: 30 |
| Ensemble S-KNN | Ensemble method: Subspace Learner type: nearest neighbor Number of learners: 30 |
| Ensemble RUSB | Ensemble method: RUBoost Learner type: decision tree Number of learners: 30 Max. split: 20 |
Table 4. Selected classifiers and their functional parameters
Table 5.
The chosen set of feature vectors and their respective dimensions, along with the percentage of reduction achieved.
Table 5.
The chosen set of feature vectors and their respective dimensions, along with the percentage of reduction achieved.
| Vector Fusion | Input Dimension | Output Dimension | Reduction Percentage (%) |
|---|---|---|---|
| PH | |||
| FV2 - FV3 | 140 × 2562 | 140 × 948 | 63 |
| FV3 - FV4 | 140 × 2946 | 140 × 884 | 70 |
| FV2 - FV4 | 140 × 3456 | 140 × 380 | 89 |
| FV2 - FV3 - FV4 | 140 × 4482 | 140 × 583 | 87 |
| FV1 - FV2 - FV3 - FV4 | 140 × 4484 | 140 × 628 | 88 |
| ISIC - MSK | |||
| FV2 - FV3 | 201 × 2562 | 201 × 589 | 77 |
| FV3 - FV4 | 201 × 2946 | 201 × 295 | 90 |
| FV2 - FV4 | 201 × 3456 | 201 × 242 | 93 |
| FV2 - FV3 - FV4 | 201 × 4482 | 201 × 403 | 91 |
| FV1 - FV2 - FV3 - FV4 | 201 × 4484 | 201 × 179 | 96 |
| ISIC - UDA | |||
| FV2 - FV3 | 271 × 2562 | 271 × 436 | 83 |
| FV3 - FV4 | 271 × 2946 | 271 × 383 | 87 |
| FV2 - FV4 | 271 × 3456 | 271 × 346 | 90 |
| FV2 - FV3 - FV4 | 271 × 4482 | 271 × 538 | 88 |
| FV1 - FV2 - FV3 - FV4 | 271 × 4484 | 271 × 448 | 90 |
Table 6.
Performance comparison of various classifiers over selected datasets
| Classifier | Dataset | Performance Measures | |||||||
|---|---|---|---|---|---|---|---|---|---|
| I | II | III | Accuracy (%) | Sensitivity | Specificity | FNR | FPR | F1 Score | |
| Linear SVM | 88.13 | 0.833 | 0.941 | 0.167 | 0.058 | 0.888 | |||
| 85.11 | 0.801 | 0.916 | 0.198 | 0.083 | 0.861 | ||||
| 83.71 | 0.795 | 0.885 | 0.203 | 0.115 | 0.845 | ||||
| Q-SVM | 87.21 | 0.843 | 0.907 | 0.156 | 0.092 | 0.877 | |||
| 97.12 | 0.952 | 0.992 | 0.048 | 0.009 | 0.971 | ||||
| 96.54 | 0.951 | 0.979 | 0.048 | 0.021 | 0.965 | ||||
| Cubic SVM | 88.52 | 0.923 | 0.853 | 0.076 | 0.146 | 0.879 | |||
| 88.27 | 0.905 | 0.866 | 0.094 | 0.133 | 0.882 | ||||
| 87.14 | 0.893 | 0.849 | 0.106 | 0.154 | 0.866 | ||||
| Fine KNN | 98.89 | 0.98 | 0.989 | 0.019 | 0.012 | 0.985 | |||
| 99.01 | 0.985 | 0.994 | 0.014 | 0.005 | 0.994 | ||||
| 97.71 | 0.974 | 0.984 | 0.029 | 0.015 | 0.977 | ||||
| Medium KNN | 94.34 | 0.931 | 0.949 | 0.068 | 0.051 | 0.941 | |||
| 93.18 | 0.921 | 0.938 | 0.078 | 0.061 | 0.930 | ||||
| 90.55 | 0.885 | 0.926 | 0.114 | 0.073 | 0.907 | ||||
| Weighted KNN | 87.15 | 0.862 | 0.876 | 0.137 | 0.124 | 0.871 | |||
| 81.39 | 0.803 | 0.816 | 0.196 | 0.183 | 0.811 | ||||
| 79.64 | 0.792 | 0.798 | 0.207 | 0.202 | 0.796 | ||||
| Ensemble- BT | 73.89 | 0.728 | 0.742 | 0.271 | 0.257 | 0.738 | |||
| 75.24 | 0.745 | 0.755 | 0.254 | 0.244 | 0.752 | ||||
| 77.38 | 0.777 | 0.772 | 0.222 | 0.227 | 0.773 | ||||
| Ensemble S-KNN | 97.58 | 0.978 | 0.979 | 0.029 | 0.025 | 0.975 | |||
| 95.46 | 0.959 | 0.954 | 0.04 | 0.049 | 0.095 | ||||
| 99.09 | 0.986 | 0.994 | 0.013 | 0.006 | 0.993 | ||||
| Ensemble RUSB | 95.76 | 0.952 | 0.961 | 0.047 | 0.038 | 0.957 | |||
| 94.89 | 0.945 | 0.951 | 0.054 | 0.048 | 0.948 | ||||
| 93.57 | 0.932 | 0.939 | 0.069 | 0.063 | 0.935 | ||||
Table 7.
Overall accuracy comparison of simple fusion approach with the proposed framework
| Vector Fusion | OA (%) | |||||
|---|---|---|---|---|---|---|
| Feature Fusion Approach | Proposed Feature Selection Approach | |||||
| Q-SVM | Fine KNN | ES-KNN | Q-SVM | Fine KNN | ES-KNN | |
| PH | ||||||
| FV2 - FV3 | 84.31 | 74.27 | 74.13 | 86.23 | 88.21 | 81.37 |
| FV3 - FV4 | 79.23 | 78.34 | 81.20 | 88.76 | 86.33 | 88.90 |
| FV2 - FV4 | 81.23 | 81.29 | 79.45 | 84.01 | 88.69 | 87.54 |
| FV2 - FV3 - FV4 | 83.71 | 79.36 | 84.56 | 86.66 | 92.27 | 87.43 |
| FV1 - FV2 - FV3 - FV4 | 83.21 | 85.22 | 87.69 | 87.21 | 98.89 | 97.58 |
| ISIC - MSK | ||||||
| FV2 - FV3 | 74.63 | 82.27 | 78.27 | 79.21 | 81.89 | 87.23 |
| FV3 - FV4 | 76.38 | 83.27 | 81.17 | 83.34 | 81.44 | 89.28 |
| FV2 - FV4 | 76.31 | 79.28 | 76.84 | 81.23 | 87.38 | 84.38 |
| FV2 - FV3 - FV4 | 79.48 | 80.14 | 79.28 | 84.27 | 88.27 | 90.29 |
| FV1 - FV2 - FV3 - FV4 | 81.29 | 81.23 | 83.73 | 97.12 | 99.01 | 95.46 |
| ISIC - UDA | ||||||
| FV2 - FV3 | 77.94 | 79.54 | 81.24 | 85.23 | 85.27 | 87.07 |
| FV3 - FV4 | 76.28 | 81.88 | 82.13 | 84.36 | 88.34 | 89.69 |
| FV2 - FV4 | 81.56 | 83.29 | 84.63 | 88.28 | 91.26 | 84.26 |
| FV2 - FV3 - FV4 | 83.16 | 81.83 | 87.76 | 89.31 | 94.18 | 94.61 |
| FV1 - FV2 - FV3 - FV4 | 89.74 | 86.47 | 87.90 | 96.54 | 97.71 | 99.09 |
Disclaimer/Publisher’s Note: The statements, opinions and data contained in all publications are solely those of the individual author(s) and contributor(s) and not of MDPI and/or the editor(s). MDPI and/or the editor(s) disclaim responsibility for any injury to people or property resulting from any ideas, methods, instructions or products referred to in the content. |
© 2023 by the authors. Licensee MDPI, Basel, Switzerland. This article is an open access article distributed under the terms and conditions of the Creative Commons Attribution (CC BY) license (http://creativecommons.org/licenses/by/4.0/).
Copyright: This open access article is published under a Creative Commons CC BY 4.0 license, which permit the free download, distribution, and reuse, provided that the author and preprint are cited in any reuse.


