Submitted:
28 August 2023
Posted:
30 August 2023
You are already at the latest version
Abstract
Virtual validation of radar sensor models is becoming increasingly important for the safety validation of adf. Therefore, methods for quantitative comparison of radar measurements in the context of model validation need to be developed. This paper presents a novel methodology for accessing and quantifying validation measurements of radar sensor models. This method uses edf and the so-called dvm to effectively quantify deviations between distributions. By applying this metric, the study measures the consistency, reproducibility and repeatability of radar sensor measurements. Different interfaces and different levels of detail are investigated. By comparing the radar signals from real world experiments where different objects are present, valuable insights are gained into the performance of the sensor. In particular, the research extends to assessing the impact of varying rain intensities on the measurement results, providing a comprehensive understanding of the sensor’s behaviour under these conditions. This holistic approach significantly advances the evaluation of radar sensor capabilities and enables the quantification of the maximum required quality of radar simulation models.
Keywords:
Automotive Radar
; Validation Measurements
; Sensor Models
1. Introduction
Automated driving is one of the biggest challenges facing the automotive industry. Advantages are expected in the areas of connection of village regions, better utilization of existing resources with accompanying minimization of vehicle downtimes and additional technological development. However, any benefits depend on the safety of such ADFs being proven. Until it is reliable that automation is safer than humans, such systems will not be deployed in large numbers and in all areas of road transport [1]. For a variety of reasons, it is currently not possible to prove safety for such ADFs. One approach that addresses this problem is scenario-based testing [1]. These tests will be performed alongside real test drives in different simulation environments such as software-in-the-loop, hardware-in-the-loop or vehicle-in-the-loop. In this way, safety-critical scenarios can be performed for the vehicle and involved agents.
Along with path planning and control, the perception of the environment is an elementary component of ADFs. Therefore, in addition to vehicle dynamics and environment models, sensor models are required to represent the entire ADF pipeline in simulation. However, it is fundamental for the simulation validation process to objectively validate the models used. Both the simulation models and real-world validation measurements play a crucial role in this process. Although first approaches to validation measurements exist, the comparability, reproducibility and repeatability of these measurements are often problematic especially for Radio Detection and Ranging (radar) sensors ([2], p. 68; [3], p. 84).
In addition to radar, camera, Light Detection and Ranging (lidar) and ultrasonic sensors are established perception sensors in production vehicles [4]. Radar sensors determine position information, intensities and speeds by means of frequency modulation, which is determined by the Doppler effect. There are different processing levels in the sensor that can be used for radar sensor model validation measurements. Radar cuboid as a level after a fast Fourier transform (FFT) algorithm in the radar processing chain and detections as a result of the application of dynamic thresholding algorithms [5], which are of interest for this publication. The object list will not be explored further in the course of the paper, as the identification of effects in further processed interfaces increases in complexity.
Therefore, this paper presents a method to compare radar measurements at the radar cuboid and detection levels. The application of this method is intended to provide objective, comparable and quantifiable radar sensor validation measurements for radar sensor models as a part of the safety argumentation of ADFs in the context of scenario-based testing.
1.1. Related Work
There are several measurements in the literature that intend to validate radar models. The related work is separated into radar measurement campaigns as well as lidar and general model validation measurement campaigns.
1.1.1. Radar
Schaerman et al. transfer real scenarios with a high accuracy of 5 cm standard deviation into the simulation to validate raw data models. However, the repeatability and reproducibility of the measurements are not directly considered [6]. Abadpour presents radar measurements of vulnerable road users and their back-scattering behaviour. Nevertheless, the number of repetitions of the measurements is only one trial and reproducibility is not further addressed [7]. Schneider analyses different objects and their back-scattering behaviour in radar sensors. He compares the characteristics using histograms to investigate the corresponding distributions in the sensor. A deeper investigation about repeatability and reproducibility on radar cuboid and detection level is missing in his analysis [8]. Eder analyses an overtaking manoeuvre with 100 repetitions and finds that the trajectory is almost identical, but the fluctuation and therefore a lack in the repeatability of the measurement result in the detection level hinders a deeper analysis [3]. Holder et al. use Edfs to study the detection distribution of occluded and unoccluded objects. The number of detections on an object is also analysed using Edfs. Here, 3 repetitions of the measurement are performed, but a deeper analysis of the repeatability is not considered further [9]. Magosi et al. also aggregate the detections over the bounding box of a scenario, but do not consider test repetitions. Only a comparison between simulation and measurement is made [10]. Aust et al. use 10 repetitions of a scenario by driving the radar sensor towards a static object. They aggregate the detections over the bounding box of the target object and examine the distribution of detections using probability density function (PDF). However, they do not directly compare the measurements with each other [11]. Buddapaggari et al. also use re simulation of measured trajectories to compare detections in over-the-air/vehicle-in-the-loop test beds with real radar data. The number of experimental replicates is also limited to one, which means that measurement repeatability is not further considered [12]. Ngo uses different scenarios to determine the simulation-reality gap he defines for detections and object lists. For each scenario, only one trial repetition is considered [13, p.66, p.84]. Holder analyses different scenarios, running three trials for each scenario. Various variations are shown, but in the context of repeatability and reproducibility, these are not discussed further in terms of quantitative deviations and the identification of measurement outliers [2].
1.1.2. Lidar and Other Domains
In addition to radar sensors, different validation measurements of lidar sensors are also introduced in different publications. Rosenberger et al. use a relatively complex validation scenario with multiple objects, but also neglect the repeatability of the experiments in their analysis [14]. Linnhoff et al. use a meteorological station to analyse lidar data based on real weather conditions. However, due to the real conditions there is no reproducibility of the measurements despite a high number of experimental replicates [15]. Viehof uses 15 measurements in the validation of vehicle dynamics models and explicitly emphasises the need to ensure the quality of the measurement data [16]. However, no specific procedure is given for evaluating the repeatability of the measurements and the deviation quantification.
1.2. Research Questions
The following research questions arise from the validation measurement campaigns in literature for radar sensors.
Research Question 1: How reproducible are radar measurements and identical measurement setups?
Identical measurements in this case refers to a comparison of unchanged measurement setups in less than 10 minutes consecutively, where the sensor is not switched off. Furthermore, it is investigated how a dismantling and reconstruction of the measurement setup behaves on the radar measurements at constant position with precise markings on the test track.
Research Question 2: How do different objects and object positions affect radar measurements?
Different objects here denotes a corner cube reflector (CCR), which is an ideal point target, and extended targets, which differ in shape and size (Volvo XC90, Mercedes Vito). Furthermore, the poses of the vehicles to the sensor are varied to analyze this influence.
Research Question 3: How do environmental conditions such as rain affect radar validation measurements?
Due to the stochastic behavior of rain, it is challenging to quantify the effect and make different rain intensities comparable.
2. Evaluation Methodology
To answer the research questions, a methodology based on the so-called dvm introduced by Rosenberger ([17], pp. 118,119) is used. The corresponding process is visually illustrated in Figure 1. In a first step the measurement data for the different experiments is collected. We gather multiple measurements per experiment setup. After pre-processing and position-based filtering of the measurement data, the number of resulting measurement data points is compared between the respective measurements or experiments. We name this filtered area region of interest (ROI). The comparison of the overall number is due to the condition, that this deviation must be small for the DVM to be used ([17], p. 103). The dvm is based on a comparison of the EDFs of the measured data and therefore the underlying distribution. Rosenberger’s approach uses the area validation metric of Roy et al. ([18], p. 307) and extends it by a second factor to evaluate the EDFs. In contrast to Rosenberger, we do not summarise the individual distribution functions of the measurements, but evaluate the difference of the EDFs individually. Therefore, the area between all the resulting distribution functions is determined, which is a measure for the deviation of the mean value denoted as of the measurements and experiments ([17], pp. 116-119). If subsequently the EDFs are shifted by and the resulting area between the shifted EDFs is calculated, a value for the shape deviation of the distribution functions is obtained giving information about the scattering difference. These two parameters give information about the similarity of the different distribution functions in the unit of the analyzed measurand. In a final step the distribution of and is visualized and analyzed via box plots.
Five different evaluation levels are considered as input data for the process:
- 1.
- All range azimuth bins with the Doppler component 0 of the radar cuboid;
- 2.
- All detections in the dimensions distance, azimuth and Radar Cross Section (RCS);
- 3.
- A region of interest, which only includes the bins, where the object is present in the measurement, on radar cuboid level with the Doppler component 0;
- 4.
- A region of interest, which only includes detections, where the object is present in the measurement, on detection level;
- 5.
- Each range azimuth bin combination separately on the radar cuboid level;
3. Experimental Setup
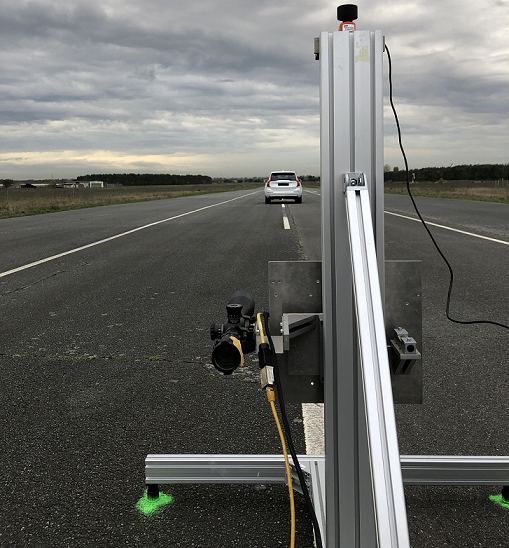
The validation experiments are performed at the August-Euler airfield in Griesheim. Except for the experiments Day 1 and Day 2, all experiments are performed with the same sensor position on the airfield. The setup and the orientation of the sensor are very crucial for the analysis of the data, because by effort the epistemic uncertainties can be reduced and thus increase the comparability between the experiments. The measurement setup consists of a radar sensor mounted on a sensor rack and an object positioned in front of it. The radar sensor is a series active cruise control (ACC) radar with a maximum range of approx. 200 m. The field of view (FoV) is approx. 12.8. For each measurement, a measurement time of 60 s is reproduced by the measurement computer. However, due to measurement data failures in the recording, this number may fluctuate.
The frame on which the radar sensor is mounted can be leveled in all directions by means of four adjustable feet. In addition, the height, azimuth angle, and elevation angle of the sensor can be adjusted. The elevation angle is set to 0. The orientation of the azimuth angle of the sensor is set by a centered far point target, and the orientation for the positioning of the point target and the sensor is given by the driving stiff mark. The height is based on the mounting position of the sensor in the vehicle. Therefore a height of 70 cm is chosen. For the objects, a distinction is made between a point target in the form of a ccr and an extended object in the form of two different vehicles. The vehicles are a Mercedes Benz Vito (production year 2020) and a Volvo XC90 (production year 2019). The Day 1 and Day 2 experiments do not contain an object. This is to quantify the effects of setup and dismantling, as well as to study the static environment itself. The exact setup of the different experiments can be found in Table 1.
The experimental setup follows the scheme shown in Figure 2. The center of the sensor defines the origin of the drawn S-coordinate system. The object positions are defined relative to this coordinate system. For the description of the experimental setups a two-dimensional experimental space is chosen, which can be defined by the polar coordinates, distance (r) and azimuth angle (), of the sensor. The reason for this is that the FoV of the sensor is also divided into polar coordinates. As the evaluation is also done at radar cuboid level, a logical positioning with respect to the bins makes sense. The bins result from the resolution of the sensor in range and azimuth. The real positions of all structures are measured during the experiments with an RTK-based global navigation satellite system (GNSS) antenna. The position of the ccr as a point target is thus described by the two parameters r and . Due to the size of the vehicles themselves, the position of the vehicle must also be described by the rotation around the vertical axis . For the vehicles, the wheel contact points are measured and the center of the vehicle and the rotation are calculated accordingly. The direction of rotation of the angles and is defined in a mathematical positive sense and takes the x-axis of the sensor as reference.
4. Evaluation
This chapter contains the evaluation results based on the method proposed in Section 2. The chapter structured as subsections based on the Research Question’s order.
4.1. RQ 1: Repeatability of Measurements and Reproducibility of Measurement Setups
In the following subsections, five measurements of a ccr are compared with each other to check repeatability (s. 4.1.1). Afterwards, reproducibility is considered on the basis of two sets of 8 individual measurements, where the measurements differ in that the sensor is set up and taken down on Day 1. On the following Day 2, the sensor is set up again in the same weather conditions and in an as similar position as possible using markings on the ground (s. 4.1.2).
4.1.1. Comparison of ccr Measurements
In a first step the number distribution of the five measurements on the different evaluation levels is compared. Figure 3 shows the deviation of data points. The number of bins from the radar cuboid is nearly identical, with a small deviation of 2 timeframes, corresponding to a percentage deviation of 2.5 ‰. Since the radar cuboid is also used for the evaluation of the roi and each bin and it is the same object class for both experiments, the deviation is the same. The number of detections for the whole field of view varies more significantly compared to the data points in the radar cuboid over the different measurements with a maximum deviation of 11.9 %. Nevertheless, an evaluation of the detections is carried out in the sense of the methodology as an example. For the roi at the detection level, however, the relative deviations are small with a maximum of 1.2 ‰.
Whole radar cuboid
Figure 4 shows the different EDFs, the box plots for and as well as the number of data points of the different colored distributions. Since the EDFs are very close to each other, it appears in the representation as if only one EDF is shown, whereas the opposite is the case. Due to this closeness, a visualization of the by shifted EDFs is omitted.
Both the EDFs and the by corrected EDFs are close to each other, indicating a high degree of agreement between the measured data examined. The statistical distribution of and can be seen in the box plot on the right hand side of Figure 4. There are only small differences between the five measurements for the two evaluation criteria. Compared to , shows a smaller scatter. However, the median of d is lower than that of . The values obtained show that the spread for is 0.16 dB, while for it is only 0.05 dB. In summary, it can be concluded from the analyses carried out that the measurements show a high repeatability with respect to the whole radar cuboid. There are no outliers, which means that several successive radar measurements with this sensor can be considered almost identical based on the analysis of the whole radar cuboid.
Whole detections
In Figure 5 the EDFs and box plots for distance, azimuth and rcs are visualized. It can be seen that the EDFs for distance are close to each other but a spread is visible. At a distance of 29.65 m there is an accumulation of detections which shows the influence of the ccr. In general, the detections are distributed over a distance up to 147 m. Close to the sensor detections are located on the road surface and with higher distances the number of detections increases at the transition between vegetation and road. Also in the vegetation itself multiple detections are present. A decrease in the number of detections above 110 m indicates a lower signal-to-noise ratio (SNR), making detections random. Above 147 m the snr is so low that there are no more detections in the environment. The median of all is similar to in absolute terms. However, the scatter of the values is larger compared to . In addition to the very different number of detections and the large scatter in the metrics, the repeatability of the measurement results for the distance of all detections is very low. The influence of the environment is too large to draw conclusions from the distance evaluation.
As with distance, the azimuth distribution is affected by the environment. Between -5 and 5 the ccr is notable with the step at 0. The visible shoulder area next to 0 indicates few detections due to the road. The second step close to 0 at negative azimuth angles can be associated to detections at close range as well as at twice the distance of the ccr and the sensor. The median of is about 0.5, which is a relatively high value in relation to the sensor’s fov, indicating, in addition to the scatter, a low repeatability of the measurements. The scatter deviation of confirms this impression.
The ccr is also evident in the rcs EDFs. 5 % of the detections are due to the point target with approximate 27 dBm. This indicates a high repeatability with respect to the reflectivity characteristics. However, especially for detections at close range due to asphalt and vegetation, different distributions show the stochastic behaviour of the major part of the detections. As before, and are difficult to interpret because there is too much randomness in the way the detections are generated by the environment. In particular, there is an outlier in , which is due to the comparison of measurements 2 and 5. Here the number of detections is the most spread over all measurements.
From the evaluation of all detections it can be concluded that a comparison of all detections is not useful for the validation of this specific radar sensor. The environment has too much influence on the detection distribution. This evaluation experiment can be used in future validation studies to assess whether an evaluation of all detections is useful in the studied environment in the context of validation measurements.
ROI radar cuboid
Figure 6 shows the same structure as in the previous evaluations. However, in this case only the bin of the radar cuboid and therefore the power where the ccr is located is analyzed. The distribution functions show a slight deviation from each other. This is also reflected in the two metrics. The deviations in show a spread of 0.045 dB and a much smaller spread in . This shows that the repeatability of the experiments for the ccr is even higher in comparison to the whole radar cuboid. This evaluation is therefore suitable for validation measurements in the case of this sensor for point targets.
ROI detections
Figure 7 visualises the rcs distribution of the ccr detections based on a ROI. Due to the point target characteristics and the small defined ROI, an analysis of the distance and azimuth is not discussed. The deviations in are 0.01 dbm and an even smaller scatter in appears. Finally, the ROI on detection level shows a high repeatability of the measurements. For point targets it can therefore be concluded that a ROI can be used as a filter on the detection level for validation measurements.
Each range and azimuth bin on radar cuboid level
For a detailed analysis of the environmental influence on the repeatability of the radar cuboid, the EDFs are compared using and for each individual range azimuth bin. For this purpose, the respective maximum of and of the corresponding range azimuth bin is visualised with a satellite image and the radar position measured by the GNSS sensor. This makes it possible to interpret causes of anomalies and assign them to areas in the radar fov. The result is shown in Figure 8.
It can be seen that for the ccr position there are small deviations across all azimuth and ± 2 range bins. This can be explained by the results of the ROI of the CCR. Due to the high back scattering power, stochastic effects are less pronounced. Due to the window functions used in the radar sensor, the power is smeared into the neighbouring bins of the radar cuboid, resulting in the high repeatability in the previously identified range for and . Only in front of and behind this area deviations occur in both metrics in the center of the fov. In the near range the largest deviations occur for and . These variations in the radar cuboid lead to the close range detections identified in the whole detection analysis. In general, the transition from road to vegetation gives the largest deviations. Here the deviations decrease with increasing azimuth space from the grass. The road surface, on the other hand, shows a very high repeatability of the measurements, with only minor deviations. Cracks and vegetation on the runway are possible explanations for this observation. Smaller deviations at the road junction confirm this impression when the opposite side with the grass is also taken into account. As the distance increases, the deviations in the two metrics decrease and the distributions in the different cells become more similar.
4.1.2. Dismantling and Set Up on Two Different Days
In this chapter, measurement data from two consecutive days with eight measurements each are compared. No object is placed in front of the radar sensor and only the surrounding is measured. A dismantling and reassembly of the measurement setup between the two days is performed. In this way the reproducibility of the radar model validation measurement setup is checked and the second part of RQ 1 is addressed. Compared to the ccr measurements, the sensor position on the runway is different, but this does not affect the research objective.
In itself, the measurements between Day 1 and Day 2 are consistent in terms of the number of data points (s. Figure 9). However, it can be seen that switching the sensor and PC on and off for data recording has an effect on the number of data points. The recording time is always 60 s for both days. It follows that such effects must be taken into account in the quality assurance of the measured data for the validation of sensor models. Due to the fact that no objects were placed, an analysis of the ROI RC and the ROI D is not feasible.
Whole radar cuboid
In general, the EDFs of the whole radar cuboid are visually close, which is confirmed by the deviations in and (s. Figure 10). However, a comparison of these measurements with those of ccr shows that the scatter of and is greater.
To support this observation, Figure 11 shows the comparison of and for Day 1/2, Day 1/1 and Day 2/2. It can be seen that reconfiguring the measurement setup has a greater effect than taking several measurements in succession. With the method presented, this effect is quantifiable via the scatter of the two metrics and the reproducibility is measurable.
Each range and azimuth bin on radar cuboid level
The Figure 12 shows and over all range azimuth bins. The largest deviations occur in the near range of the sensor, with up to 15 dB difference in power for at the edge of the fov. Compared to the CCR measurements, where only 5 dB are present. It can be concluded that the close range is particularly affected by the mounting and dismounting of the sensor. Especially for validation measurements with objects and environments, the reproducibility of the measurements must be checked before using them for a validity statement. For this reason, close range measurements must be taken with particular accuracy. On the road surface, deviations of up to 10 dB in can be detected up to a distance of 74 m. The roadside, on the other hand, has an effect on the readings over the whole visibility range due to differences in the sensor orientation. Both and show deviations at identical positions in the range azimuth map.
4.2. RQ 2: Effects of Objects on Radar Measurements
In this chapter, the influence of objects on radar validation measurements is investigated. For this purpose, the measurements of the ccr from chapter 4.1.1 are first compared with those of a Volvo XC90. The center of the vehicle is almost identical to the position of the ccr. The yaw angle of the vehicle is close to 0. Next, the XC90 is observed at the identical position, but rotated by a yaw angle in the second experiment. This analyzes the influence of the rotation on the measurement result. Finally, the XC90 and a Mercedes Vito are compared with each other at an almost identical position and yaw angle.
4.2.1. Comparison of ccr and XC90
In this chapter effects due to complex geometries compared to an ideal target are identified. Figure 13 shows the number of data points between detection and radar cuboid level. The relative deviation for radar cuboid level is for the evaluation of WRC, the ROI RC and EB RC similar and below 1 %. At the detection level, the number of detections differs significantly between the objects, which is why a comparison for the evaluation of WD and the ROI D is not meaningful.
Whole radar cuboid
Figure 14 visualizes the result for the comparison of the vehicle and the ideal target. For the entire radar cuboid, it is evident from the EDFs that the ccr affects all bins. Already at -82 dB deviations are recognizable. At occurrences above 90 % the EDF of both objects equalize again. At -78 dB there is a kink in the course of the EDF of the XC90, which suggests the influence of the environment, since this kink is also evident in the measurements of Day 1/2. For a median of -2 dB is shown for the whole radar cuboid. The different shape of the EDF is also reflected in . The values are significantly increased compared to the previous experiments.
Each range and azimuth bin on radar cuboid level
The analysis of the data in Figure 15 shows significant differences in , especially at the object positions. These discrepancies can be attributed to the better reflective properties of the ccr. In addition, the influence of the windowing function can be seen, which smears the power across the range bins. This effect is noticeable in the central area of the fov. The deviations at the edge of the roadway again confirm the effect already described in the evaluation of the entire radar cuboid. The ccr influences all bins. This finding is also reflected in the distribution of the . Lower deviations are seen both at the object position and at twice the distance. This is a proof of the reproducibilty of multipath propagation of the radar waves due to objects. In general, it can be seen that there is an influence of the object with the surrounding and its characteristics.
4.2.2. Comparison of XC90 and Rotated XC90
In this section the rotation of an object on the wave propagation for an exemplary yaw angle are examined. However, the difference between these two experiments is the yaw angle of the same object. As in the Section 4.2.1 the relative deviation on detection level is significantly higher than the deviation on radar cuboid level. Due to the high deviations on detection level, see Figure 13, a comparability of the measurements and thus of the experiments is not given. Therefore, this comparison is only evaluated on the radar cuboid level. The relative deviations on radar cuboid level for the different evaluations (WRC, ROI RC and EB RC) are in the same order of magnitude and thereby below 1 %.
Whole radar cuboid
The rotation of the object has a small influence on the total power distribution in the radar cuboid as visible in Figure 17. The distribution functions are again visually hardly separable, which is reflected in the values for and . The scatter of is 0.17 dB, which puts the difference in a range also observed in the ccr measurements. This can be explained by the main influence of the environment and the disproportionate amount of road and vegetation in the measurements. An effect over the entire radar cuboid due to rotation as in the ccr and XC90 comparison cannot be observed. Based on this finding, an evaluation of the whole detections is omitted and a detailed look at the roi is given.
roi radar cuboid
The evaluation of the roi is shown in Figure 18. The rotation leads to a significant decrease in the power values in the filtered bins, with little fluctuation between experiments. This observation confirms with a significant deviation of 5.5 dB at the median. Rotation also affects the shape of the distribution functions, such that is almost equal to 2.8 dB. The results show high inter-experiment repeatability for static experiments, but a significant influence of object orientation.
Each range and azimuth bin on radar cuboid level
The findings from the roi become even clearer in the satellite image (s. Figure 19). Especially in the vicinity of the object, values of 25 dB are present in . In this area, however, shows only low values, which speaks for the previously established high repeatability of the results in this area. Interesting are the high deviations in at the roadside and partly in the vegetation. 15 dB are increasingly and patchily detectable. This is further evidence of the influence of objects on the detected surrounding due to multipath propagation or effects in the signal processing of the radar sensor. The variations of are largest where is also high. Comparison with satellite images of ccr and XC90 shows similar values, suggesting a stochastically constant behavior of vegetation in the different experiments and measurements.
4.2.3. Comparison of Volvo XC90 and Mercedes Vito
Finally, the Volvo XC90 is compared with a Mercedes Vito. The effects of different object geometries and sizes are analyzed regarding their effects on validation measurement campaigns. The relative deviations are comparable to the previous findings. The deviations are higher at the detection level than those at the radar cuboid level, as seen in Figure 20. However, there is a difference in the deviations of all detections compared to the deviations for the detections in the roi, which are significantly higher. Thus, also for this comparison, an evaluation is performed on the radar cuboid level with a relative deviation for the number of data points below 1 % and the the whole detections.
Whole radar cuboid
Again, the entire radar cuboid is analyzed. From Figure 21 it can be seen that the object has an influence on all bins, as in the comparison of ccr and XC90. This can be seen from the higher power distribution of the EDFs of the Mercedes Vito. The shape of the object (hatchback compared to vertical rear) therefore has a direct influence on the measured environment. In addition to the rear, the underbody can also influence the measurement result. The overall effect be seen in , which shows a relatively high deviation with a low spread. For both metrics it can be seen that the repeatability of the measurements of the different objects is very high, as the scatter is low.
Whole detections
Figure 22 shows the EDFs for the distance, azimuth, and rcs, as well as a corresponding box plot for them. A look at the EDFs for the distance shows that these are similar to each other, but a deviation is still visible. In the distance of the vehicles at 29.65 m a small step and thus an accumulation of detections can be seen. All detections extend over an maximum distance of 150 m. In the vicinity of the sensor, these detections result from reflections of the road surface and, with increasing distance, from the transition between road and vegetation. Whereby it can be seen from the course that at distances over 115 m less detections can be recognized. Above 160 m only isolated detections with a low rcs are present, which argues for purely stochastic causes. The median values for and are similar when considered as absolute values. However, the scatter of with 5 m is significantly larger than the scatter of with 1 m.
Looking at the EDFs for the azimuth, it is noticeable that the EDFs overlap better for angles below 0 than for angles above 0. Also, the steps for the accumulation of detections by the two vehicles is different, so the step for the XC90 is at 1.5 and not as significant as the one for the Vito at 0. Basically, however, there is an accumulation of detections around 0 for both vehicles, which corresponds to the vehicle position and reflections from the road surface near the Sensor. For angles below -5 and above 5, detections can be seen by the transition from the road surface to vegetation. The plateaus between -5 and 0, and between 0 and 5 are due to the road surface. The median values of and are similar for an absolute observation. However, it can again be seen that the scatter is larger for the than for .
When looking at the Edfs for the rcs, these are close for the two vehicles between -30 dBm and -10 dBm and have a similar trend, but a deviation is visible. Below -30 dBm, the EDFs of the XC90 is determined by more significant steps compared to the Vito. Above -10 dBm the curve is similar, but there is a clear offset between the two vehicles indicating more detections on the Vito proving the findings in Figure 20. The steps above -10 dBm indicates the rcs for both vehicles. A difference for the maximum rcs for the detections can be observed, the rcs for the XC90 is 5 dBm less than the rcs of the Vito. In addition, a difference in the number of detections between the XC90 and the Vito can be seen in the level of the step. The medians for and differ by 1.75 dBm, with this being larger for . However, the dispersion for is 0.2 dBm larger than for . as noted in the comparison of the two CCRs, it is difficult to interpret the and due to the randomness that comes from the vegetation generated detections.
ROI radar cuboid
Figure 23 shows the roi on the radar cuboid level. It confirms the impression from the analysis of all bins of the radar cuboid. In general, the Vito generates higher power in the bins around its own position. Thereby, a high repeatability between the individual measurements is shown. The outer bins of the roi provide the low powers, which are similar for both objects. However, also increases with increasing power values. shows values from 3.7 dB to 3.95 dB and illustrates the deviations caused by the object geometry. Similarly, is clearly influenced by the different objects. Therefore, the shape of the distribution functions differs because of the different objects.
Each range and azimuth bin on radar cuboid level
The detailed analysis of the range azimuth bins is visualised in Figure 24. For , it is clearly visible that there are increased deviations in front of and behind the vehicle position. These extend over the entire azimuth range and are up to 18 dB in the centre. At twice the vehicle distance, multipath propagation across the sensor is evident. These are the largest at up to 25 dB and also extend over the entire azimuth range due to the windowing function. There is also a deviation up to maximum visibility in the centre of the fov. This effect is more noticeable in the comparison between ccr and the XC90. Here the higher reflectivity of the Vito causes smearing in the more distant range bins due to the sensor’s windowing functions. For there are increased values in the double distance of the object position as well as for vegetation, which is comparable to the satellite images of the other object analyses.
4.3. RQ3: Influence of Rain on Radar Measurements
For the experiment, the XC90 is in the same position, but five measurements are recorded without rain and five measurements with rain. Subjectively, the intensity of the rain decreases over time. Also for the investigation of the environmental conditions, in this case rain, a difference of the relative deviations for the number of data points is shown (s. Figure 25). On detection level the deviation is higher than on the radar cuboid level. However, the deviations for the evaluation of all detections are many times higher than those for the detections from the roi. The rain increases the number of detections. Therefore the evaluation is examined on the radar cuboid level. The relative deviation is similar for every evaluation on radar cuboid level and below 1 %.
Whole radar cuboid
In Figure 26 the EDFs of the whole radar cuboid are shown. Rain generally increases the power of all bins. The rain measurement No. 5 lays on the measurements without rain. This may be due to the fact that the rain intensity in this measurement is already low. There is no reference data for rain intensity to make an accurate assessment. From -70 dB the curves of all EDFs equalise, which shows the increasing influence of the XC90. This is again evident in the box plots for and . Rain leads to larger deviations in both metrics compared to the previous measurements in chapter 4.2. For a detailed analysis the satellite image is used.
Each range and azimuth bin on radar cuboid level
The satellite image clearly shows the effect of the rain. The increased power is shown in both and . In particular, is increased in the vicinity of the sensor and up to about half of the fov. The road surface is particularly affected by this phenomenon. For , the largest deviations occur in the medium range of the fov. Again, the road is more affected than vegetation, which can be explained by the previously identified stochastic properties of the vegetation.
5. Conclusions
This paper presents a methodology to make radar measurements comparable in the context of the validation of radar sensor models. The two metrics and are used to evaluate the similarity of the measured distribution functions. For this purpose, the number of data points is first analyzed in order to be able to make a comparison at all using dvm. The analysis on the level of the radar cuboid simplifies the explanation of the different effects, especially in combination with the representation of the range azimuth bins using a satellite image. Finally, the research questions raised in chapter 1.2 are answered, and applicability of the findings to other radar sensors remains to be shown.
Research Question 1: The analysis of the measurements with a ccr shows in direct comparison that there is a good repeatability of the measurements especially near an object in radar measurements. Only vegetation and the road surface in close proximity are characterized by larger deviations in and . Also the dismantling and repositioning shows that smaller influences occur. Nevertheless, the measurements can be performed reproducibly with the right tools (e.g. ground markers).
Research Question 2: Extended objects can be analyzed in detail with the presented methodology and deviations can be quantified accordingly. However, it can be seen that objects have a direct impact on the overall fov of the sensor depending on the orientation and type of object.
Research Question 3: Based on our methodology, environmental influences are comparable and their influence is quantitatively detectable. In particular, the close range of the radar sensor shows larger deviations due to rain on average. With increasing distance, rain leads to larger scattering, whereas the effect decreases again after a certain distance and the rain merges with the background noise of the sensor.
Therefore, for validation measurements of radar sensors, the following aspects can be derived from the results:
- Measurements of static vehicles and point targets are well reproducible on radar cube and detection level.
- Vegetation and also the close range of the radar sensor lead to large deviations, especially on the detection level, which is why this interface complicates the validation of radar sensor models with the methodology described here.
- The presented methodology can be used to quantify deviations between validation measurements and identify measurement outliers.
- Using ideal laboratory measurements, effects in real measurements can be identified based on the deviations in and , and their influence can also be quantified (e.g., multipath propagation and interference).
- With the presented methodology, a maximum achievable quality of simulation models can be determined with a quantitative value in the unit of the measurand.
The previous considerations refer only to static scenarios. In particular, dynamic tests are of great importance for the radar sensor due to the Doppler effect and the associated direct velocity measurement. Therefore, in a next step, the approach and analysis will be transferred to dynamic scenarios. So far, only the usefulness of the methodology for the sensor used has been demonstrated. In a next step the gained knowledge has to be proven with other radar sensors.
Author Contributions
Conceptualization, L.E.; methodology, L.E.; software, L.E. and J.S.; validation, L.E. and J.S.; formal analysis, L.E.; investigation, L.E. and J.S.; data curation, L.E.; writing—original draft preparation, L.E. and J.S.; writing—review and editing, L.E., J.S. and S.P.; supervision, S.P.; All authors have read and agreed to the published version of the manuscript.
Funding
This research was funded by the German Federal Ministry for Education and Research (BMBF) through the project Virtual Validation Tool Chain for Automated and Connected Driving (VIVID) under grant number 16ME0173.
Institutional Review Board Statement
Not applicable
Informed Consent Statement
Not applicable
Data Availability Statement
Data sharing is not applicable to this article.
Conflicts of Interest
The authors declare no conflict of interest.
Abbreviations
The following abbreviations are used in this manuscript:
| ACC | active cruise control |
| ADF | automated driving function |
| CCR | corner cube reflector |
| D | detecions |
| DVM | Double Validation Metric |
| EB RC | each bin of the radar cuboid |
| EDF | empirical cumulative distribution function |
| FFT | fast Fourier transform |
| FoV | field of view |
| GNSS | global navigation satellite system |
| Lidar | light detection and ranging |
| probability density function | |
| Radar | Radio Detection and Ranging |
| RC | radar cuboid |
| RCS | Radar Cross Section |
| RTK | real time kinematic |
| ROI | region of interest |
| SNR | signal-to-noise ratio |
| WD | whole detections |
| WRC | whole radar cuboid |
References
- Winner, H. Quo vadis, FAS? In Handbuch Fahrerassistenzsysteme; Winner, H., Hakuli, S., Lotz, F., Singer, C., Eds.; Springer Fachmedien Wiesbaden: Wiesbaden, 2015; pp. 1167–1186. [Google Scholar] [CrossRef]
- Holder, M.F. Synthetic Generation of Radar Sensor Data for Virtual Validation of Autonomous Driving. PhD thesis, Technische Universität Darmstadt, Darmstadt, 2021. [CrossRef]
- Eder, T. Simulation of Automotive Radar Point Clouds in Standardized Frameworks. PhD thesis, Technische Universität München, 2021.
- Dietmayer, K. Predicting of Machine Perception for Automated Driving. In Autonomous Driving; Maurer, M., Gerdes, J.C., Lenz, B., Winner, H., Eds.; Springer Berlin Heidelberg: Berlin, Heidelberg, 2016; pp. 407–424. [Google Scholar] [CrossRef]
- Holder, M.; Rosenberger, P.; Winner, H.; D’hondt, T.; Makkapati, V.P.; Maier, M.; Schreiber, H.; Magosi, Z.; Slavik, Z.; Bringmann, O.; et al. Measurements revealing Challenges in Radar Sensor Modeling for Virtual Validation of Autonomous Driving. In Proceedings of the 2018 21st International Conference on Intelligent Transportation Systems (ITSC); 2018; pp. 2616–2622. [Google Scholar] [CrossRef]
- Schaermann, A.; Rauch, A.; Hirsenkorn, N.; Hanke, T.; Rasshofer, R.; Biebl, E. Validation of vehicle environment sensor models. In Proceedings of the 2017 IEEE Intelligent Vehicles Symposium (IV); 2017; pp. 405–411. [Google Scholar] [CrossRef]
- Abadpour, S. Modeling Backscattering Behavior of Vulnerable Road Users Based on High-Resolution Radar Measurements. PhD thesis, Karlsruher Institut für Technologie (KIT), 2023. [CrossRef]
- Schneider, R. Modellierung der Wellenausbreitung für ein bildgebendes Kfz-Radar. PhD Thesis, Universität Fridericana Karlsruhe, Karlsruhe, 1998. [Google Scholar]
- Holder, M.; Rosenberger, P.; Winner, H.; D’hondt, T.; Makkapati, V.P.; Maier, M.; Schreiber, H.; Magosi, Z.; Slavik, Z.; Bringmann, O.; et al. Measurements revealing Challenges in Radar Sensor Modeling for Virtual Validation of Autonomous Driving. In Proceedings of the 2018 21st International Conference on Intelligent Transportation Systems (ITSC); 2018; pp. 2616–2622. [Google Scholar] [CrossRef]
- Magosi, Z.F.; Wellershaus, C.; Tihanyi, V.R.; Luley, P.; Eichberger, A. Evaluation Methodology for Physical Radar Perception Sensor Models Based on On-Road Measurements for the Testing and Validation of Automated Driving. Energies 2022, 15. [Google Scholar] [CrossRef]
- Aust, P.; Hau, F.; Dickmann, J.; Hein, M.A. A Data-driven Approach for Stochastic Modeling of Automotive Radar Detections for Extended Objects. In Proceedings of the 2022 14th German Microwave Conference (GeMiC); 2022; pp. 80–83. [Google Scholar]
- Jayapal Gowdu, S.B.; Aust, P.; Schwind, A.; Hau, F.; Hein, M.A. Evaluation of scenario-based automotive radar testing in virtual environment using real driving data. In Proceedings of the 2022 IEEE 25th International Conference on Intelligent Transportation Systems (ITSC); 2022; pp. 2379–2384. [Google Scholar] [CrossRef]
- Ngo, A. A methodology for validation of a radar simulation for virtual testing of autonomous driving. [CrossRef]
- Rosenberger, P.; Wendler, J.T.; Holder, M.F.; Linnhoff, C.; Berghöfer, M.; Winner, H.; Maurer, M. Towards a Generally Accepted Validation Methodology for Sensor Models - Challenges, Metrics, and First Results, Darmstadt, Mai 2019. Veranstaltungstitel: Grazer Symposium Virtuelles Fahrzeug.
- Linnhoff, C.; Hofrichter, K.; Elster, L.; Rosenberger, P.; Winner, H. Measuring the Influence of Environmental Conditions on Automotive Lidar Sensors. Sensors 2022, 22. [Google Scholar] [CrossRef] [PubMed]
- Viehof, M. Objektive Qualitätsbewertung von Fahrdynamiksimulationen durch statistische Validierung. PhD Thesis, Technische Universität Darmstadt, Darmstadt, 2018. [Google Scholar]
- Rosenberger, P. Metrics for Specification, Validation, and Uncertainty Prediction for Credibility in Simulation of Active Perception Sensor Systems. PhD thesis, Technische Universität Darmstadt, Darmstadt, 2023. [CrossRef]
- Roy, C.J.; Balch, M.S. A HOLISTIC APPROACH TO UNCERTAINTY QUANTIFICATION WITH APPLICATION TO SUPERSONIC NOZZLE THRUST. International Journal for Uncertainty Quantification 2012, 2, 363–381. [Google Scholar] [CrossRef]
Figure 1.
Used Methodology for the comparison of different experiment setups (E1 and E2), measurements and input data on radar cuboid as well as detection level.
Figure 1.
Used Methodology for the comparison of different experiment setups (E1 and E2), measurements and input data on radar cuboid as well as detection level.
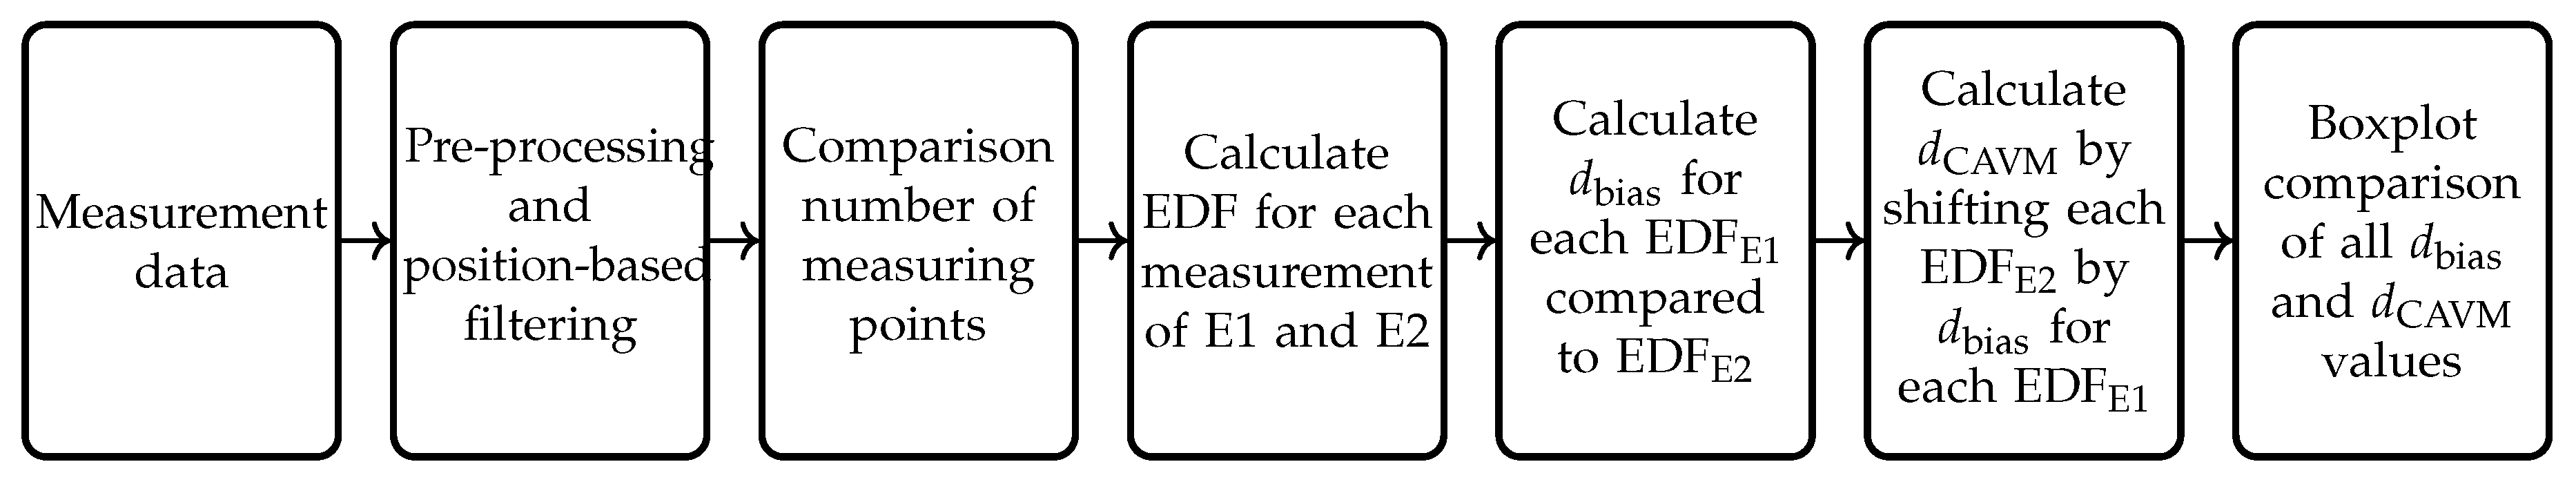
Figure 2.
On the left side a sketch of the experimental setup is shown. The Cartesian sensor coordinate system origin is denoted as and . The parameters for the different experiments are the polar coordinates distance r and azimuth angle . The yaw angle of the object is defined as . On the right side a picture of the measurement setup of the XC90 on the August-Euler airfield is visualized.
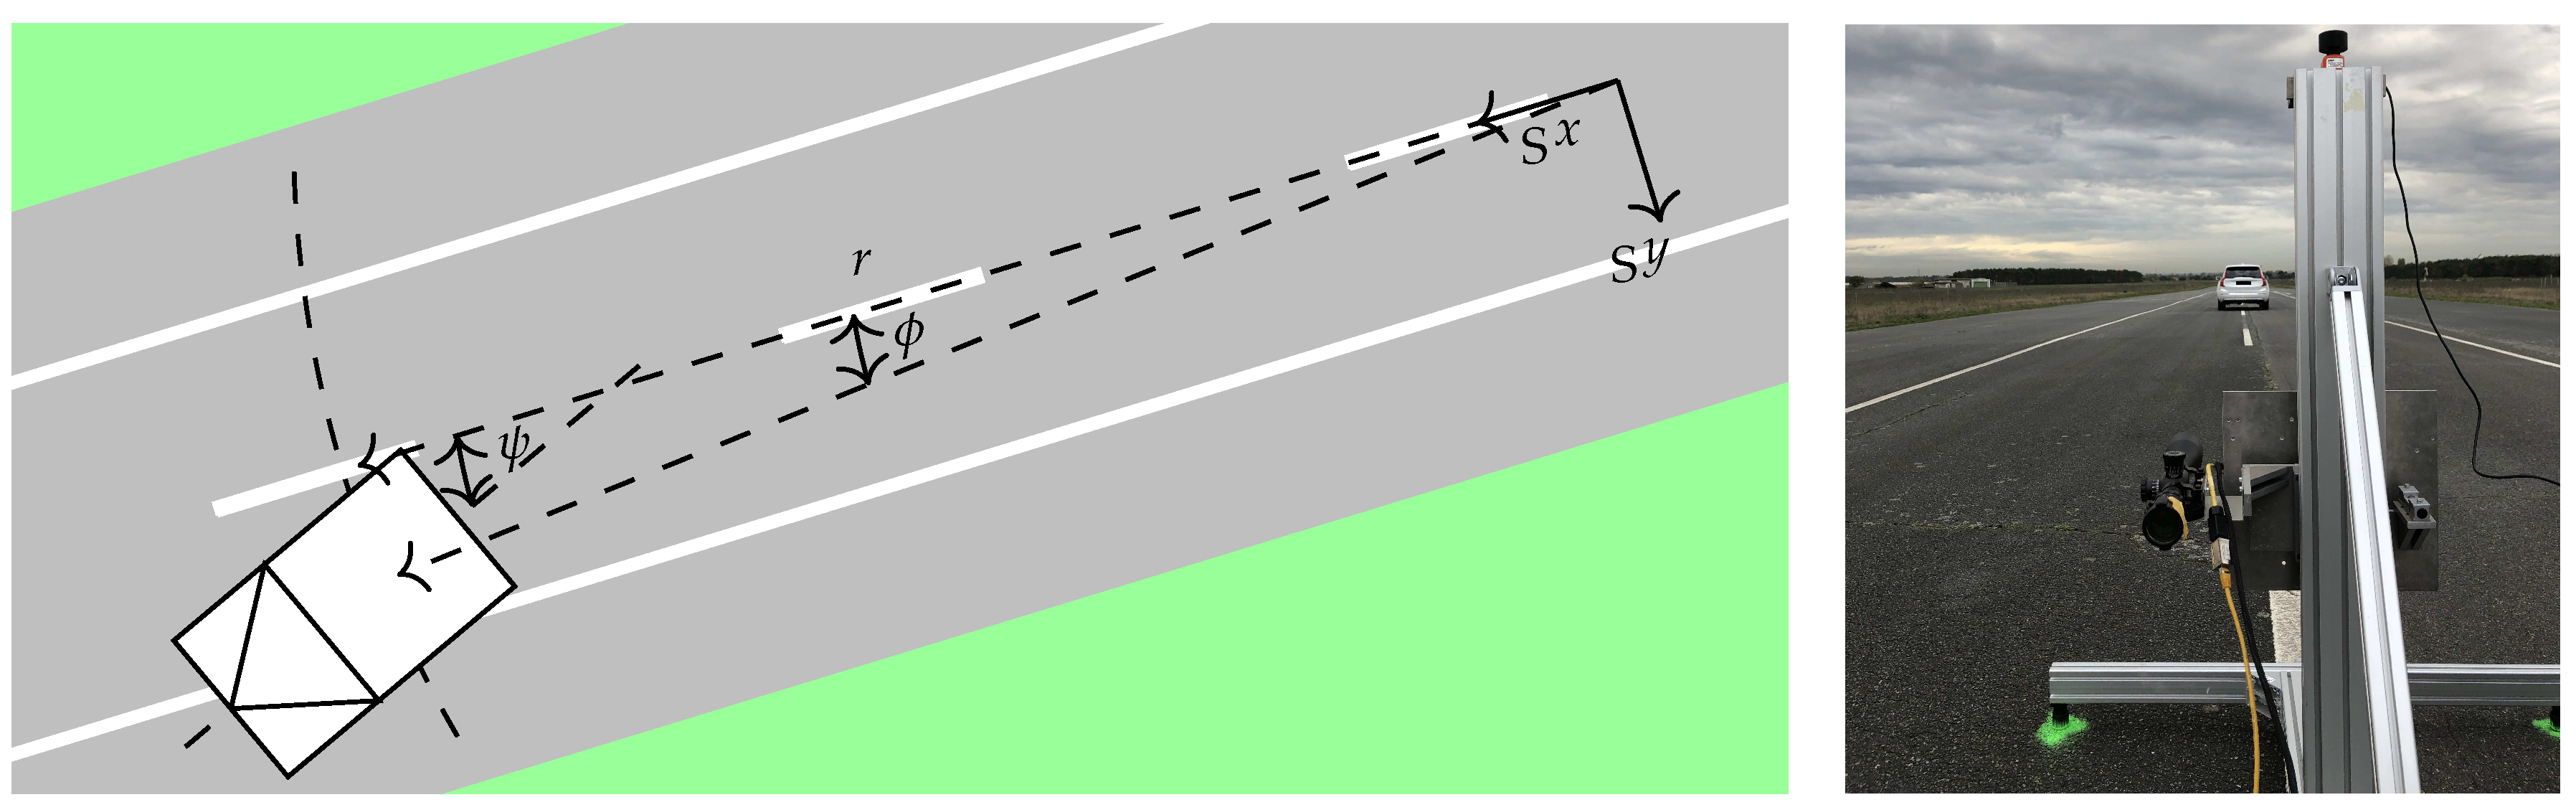
Figure 3.
Plot of the relative deviation for the number of the data points or detections of all measurements of the CCR experiment. The evaluation is shown for the whole radar cuboid (WRC), all detections (WD), the ROI for the radar cuboid (ROI RC) and the detecions (ROI D), as well as each bin of the radar cuboid (EB RC). Experiment 1 is denoted as  and experiment 2 is denoted as
  . The gradations of the respective color delineate the different measurements.
and experiment 2 is denoted as . The gradations of the respective color delineate the different measurements.
Figure 3.
Plot of the relative deviation for the number of the data points or detections of all measurements of the CCR experiment. The evaluation is shown for the whole radar cuboid (WRC), all detections (WD), the ROI for the radar cuboid (ROI RC) and the detecions (ROI D), as well as each bin of the radar cuboid (EB RC). Experiment 1 is denoted as and experiment 2 is denoted as . The gradations of the respective color delineate the different measurements.
and experiment 2 is denoted as . The gradations of the respective color delineate the different measurements.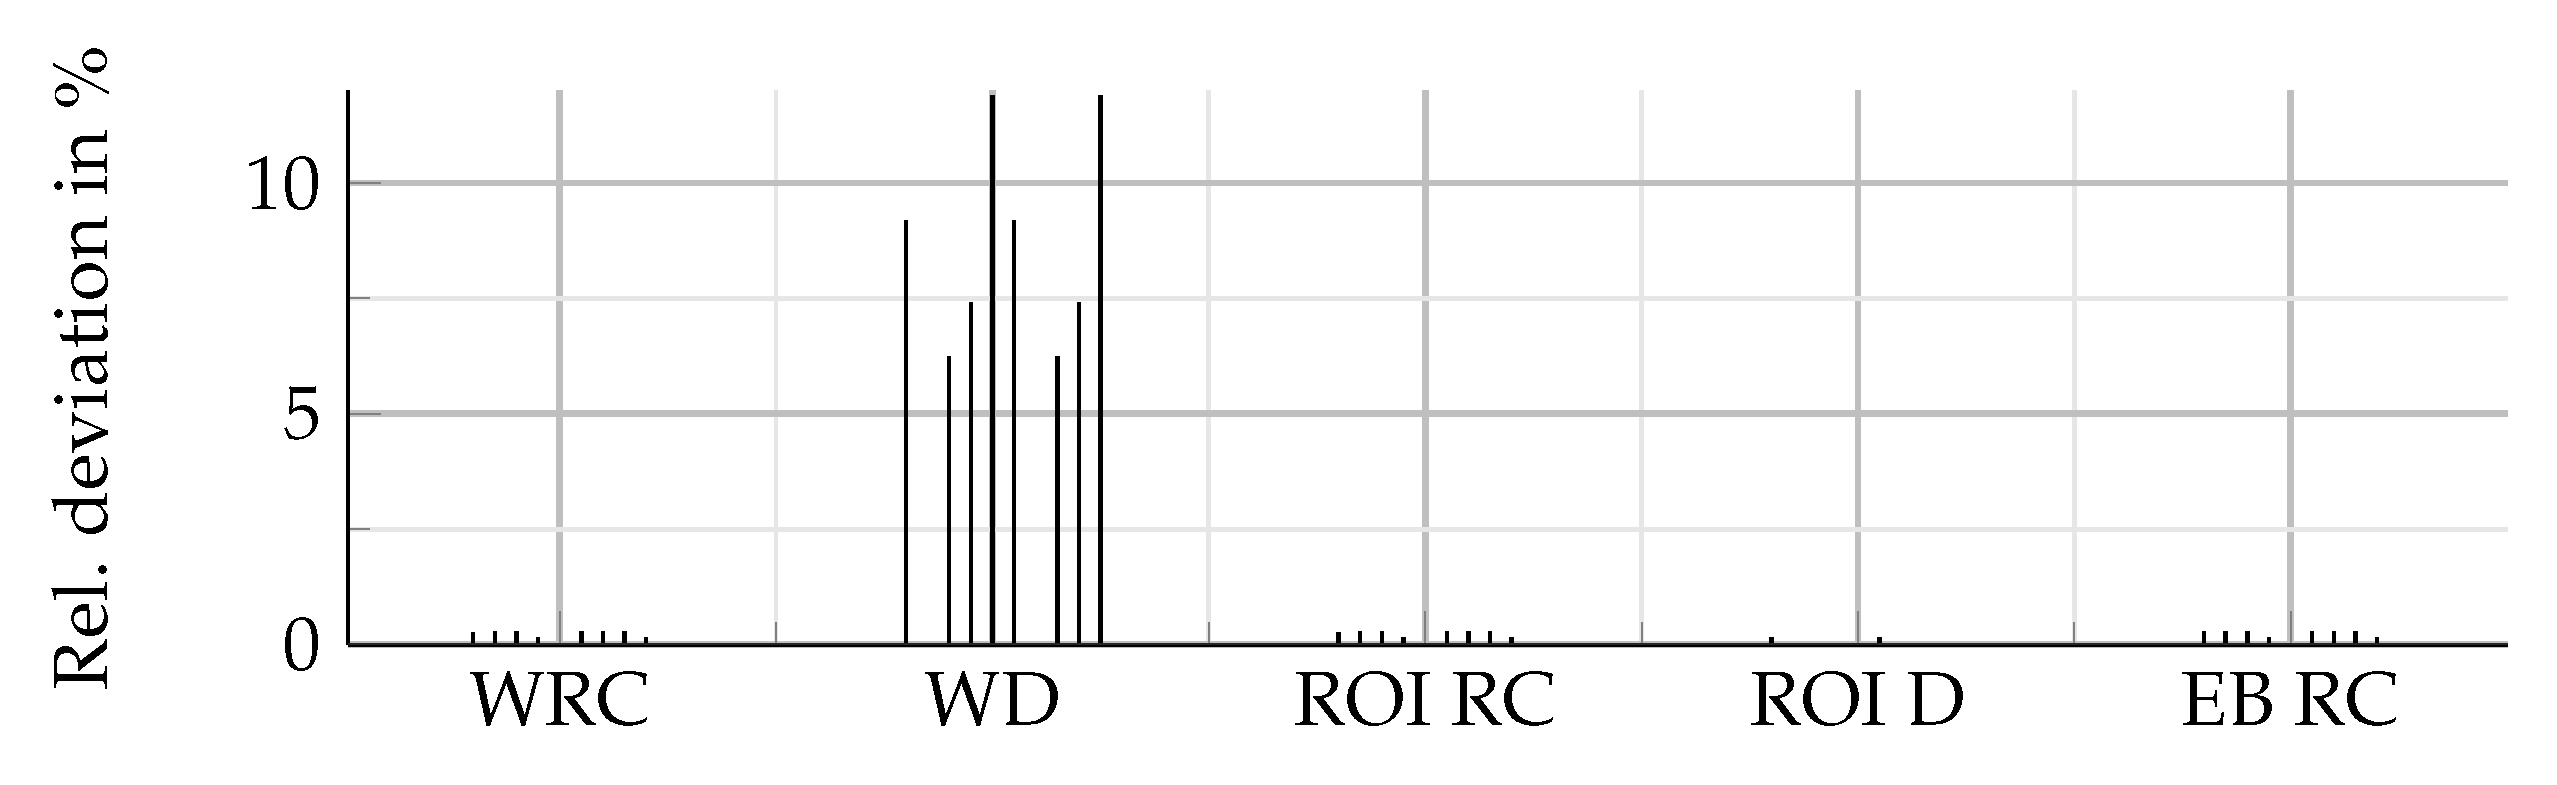
Figure 4.
Edfs of all five measurements of the ccr on the radar cuboid level. The number of aggregated bins is listed below the diagram. On the right side the box plot for and is shown.
Figure 4.
Edfs of all five measurements of the ccr on the radar cuboid level. The number of aggregated bins is listed below the diagram. On the right side the box plot for and is shown.
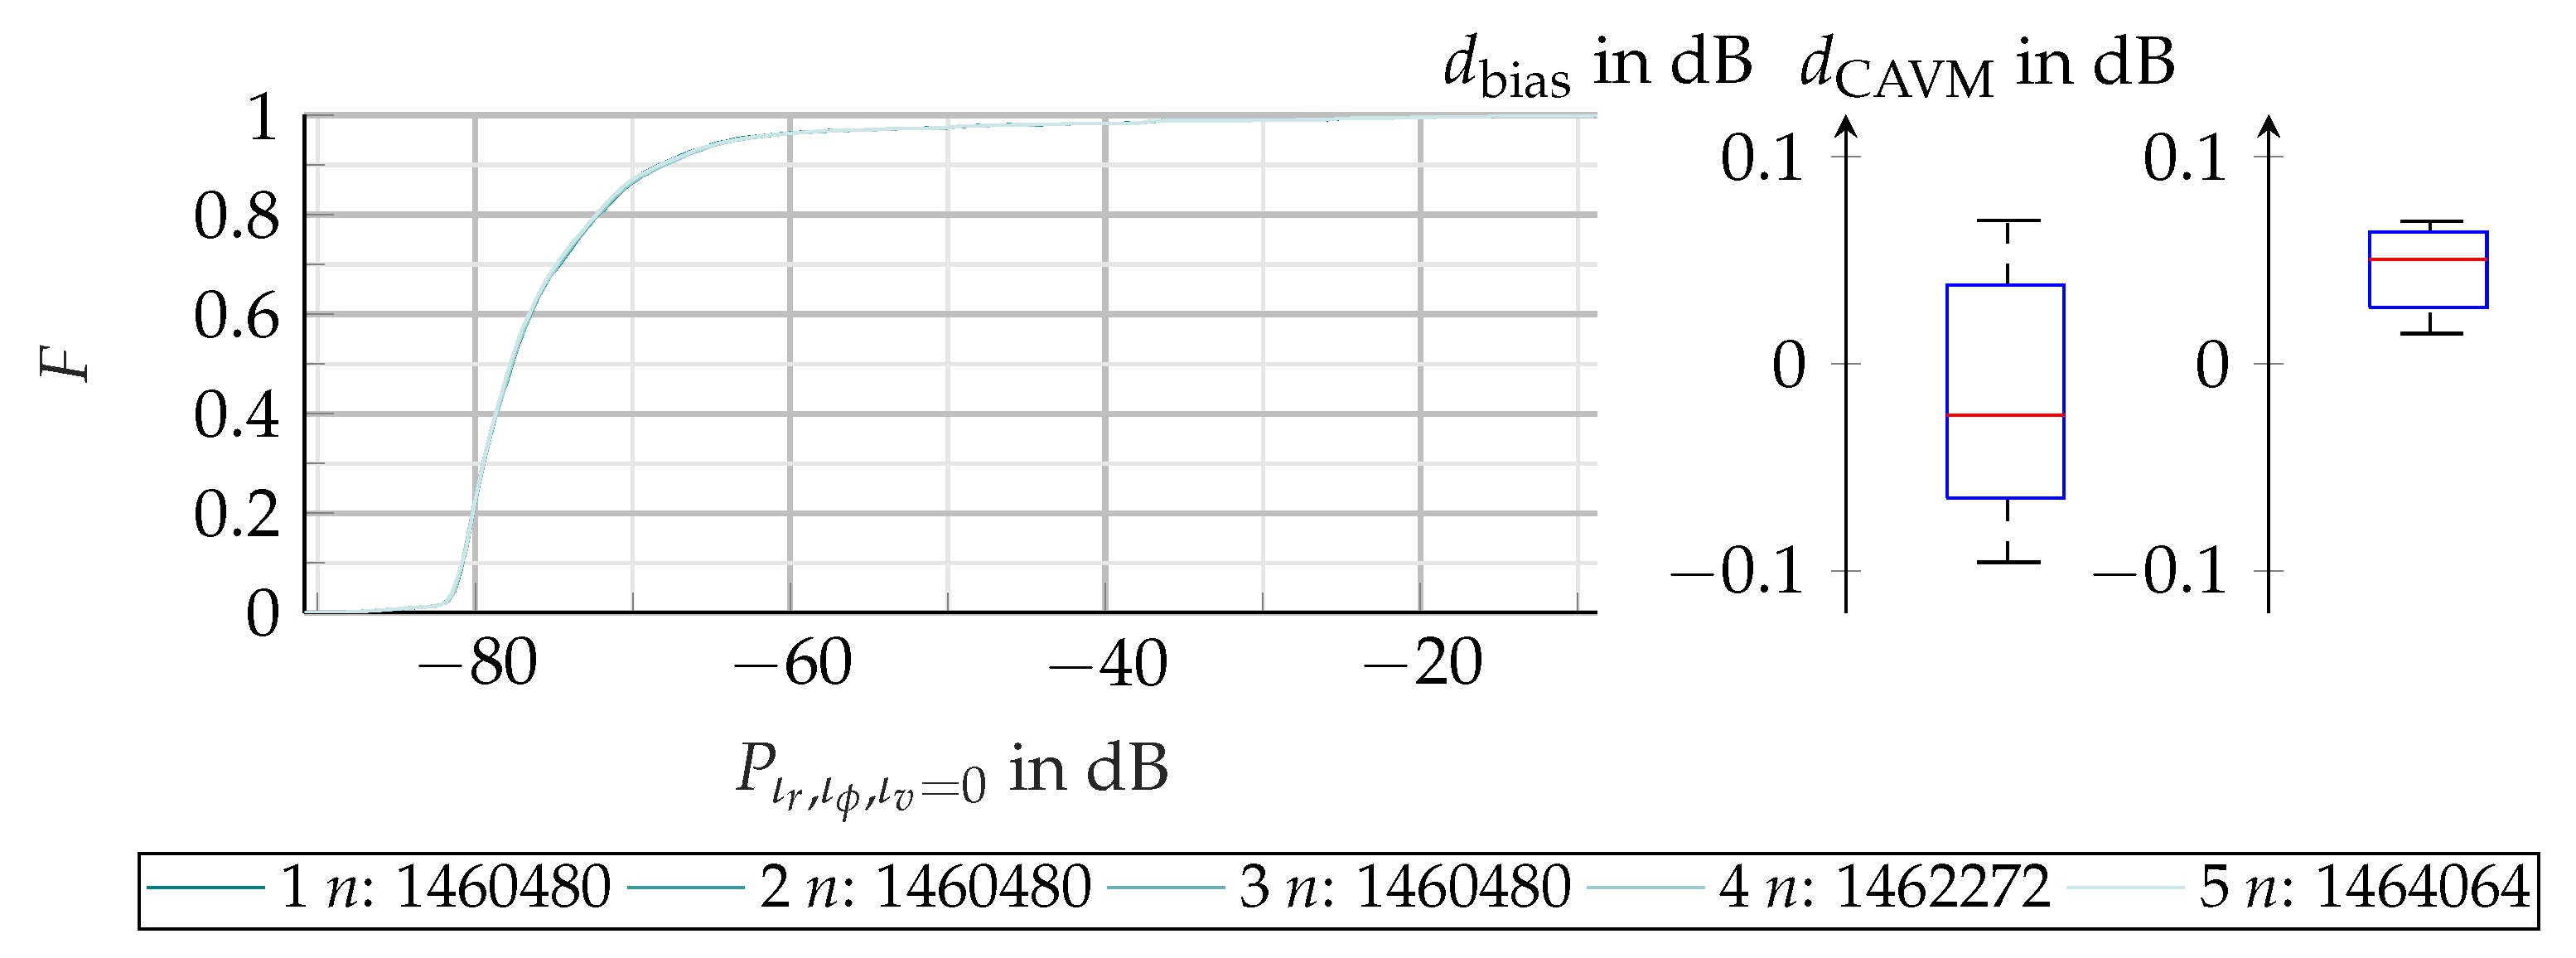
Figure 5.
Edfs of all five measurements of the ccr on the detection level. In the first row the distance distribution, in the second row the azimuth distribution and in the third row the rcs distribution with the corresponding box plot for and are shown. The aggregated number of detections is listed below the diagrams.
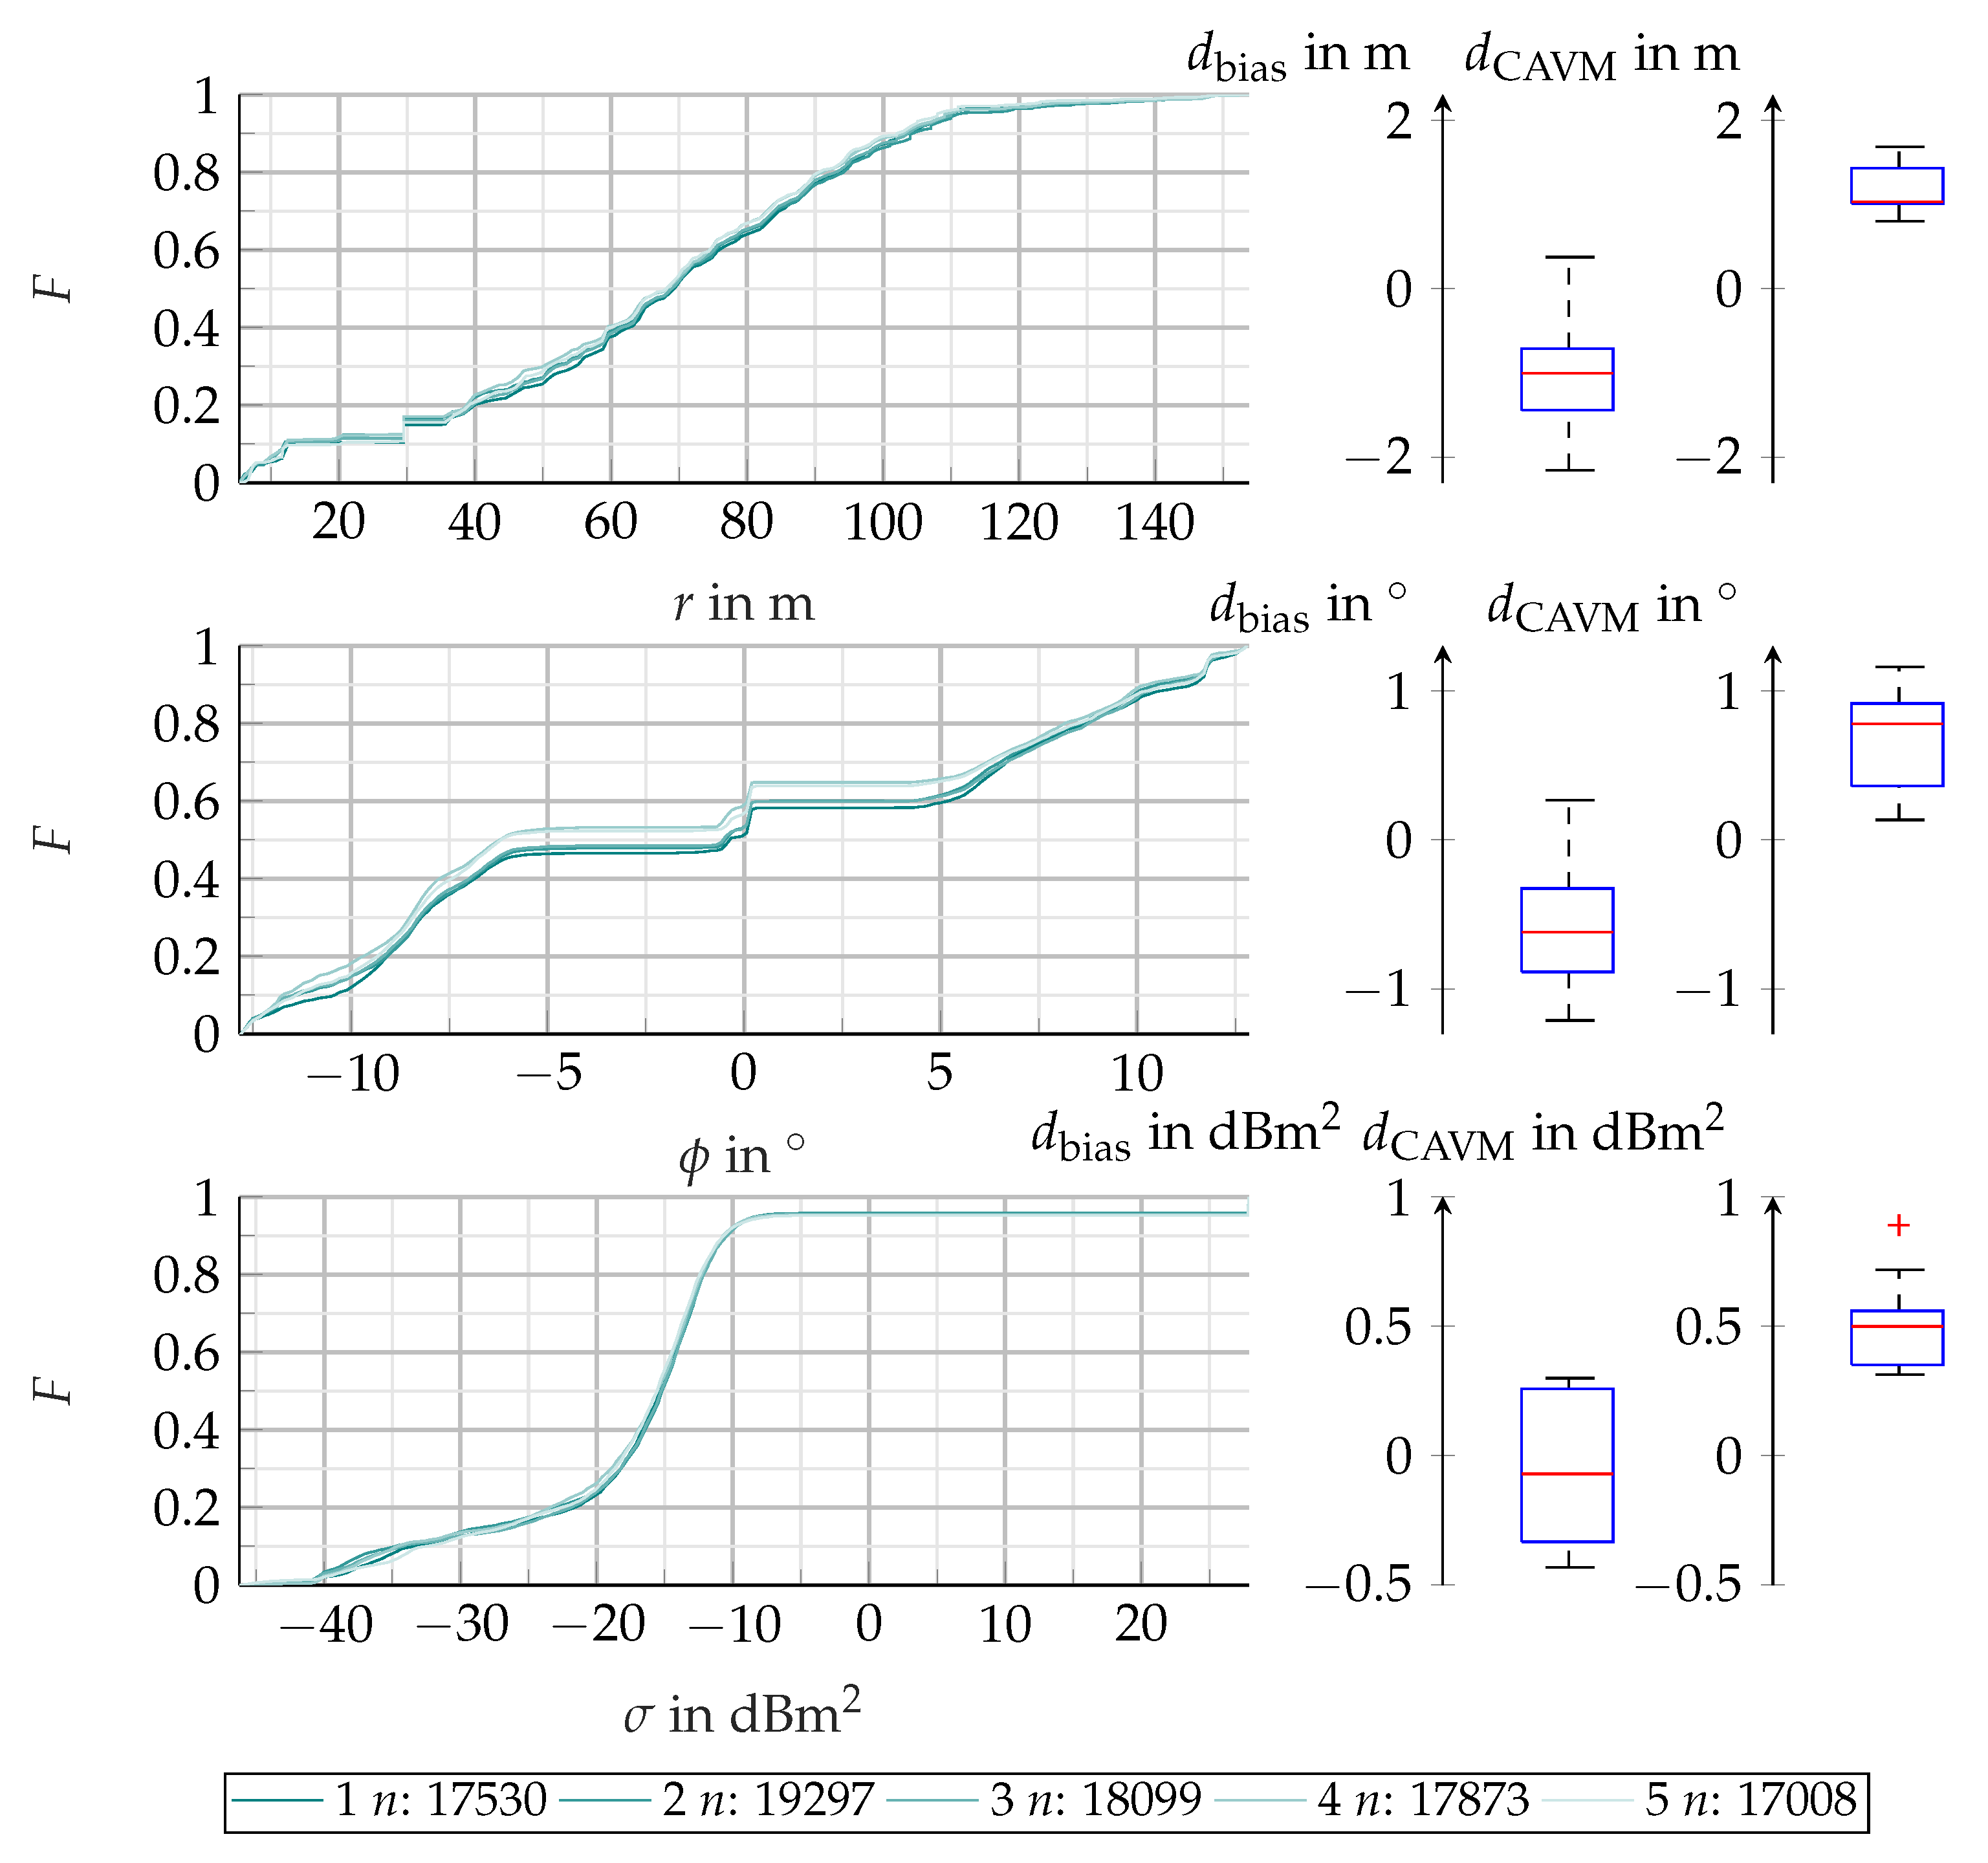
Figure 6.
Edfs of all five measurements of the ccr on the radar cuboid level filterd by an roi are shown in the diagram. The power distribution with the corresponding box plot for and is visualized on the right side. The aggregated number of bins is listed below the diagram.
Figure 6.
Edfs of all five measurements of the ccr on the radar cuboid level filterd by an roi are shown in the diagram. The power distribution with the corresponding box plot for and is visualized on the right side. The aggregated number of bins is listed below the diagram.
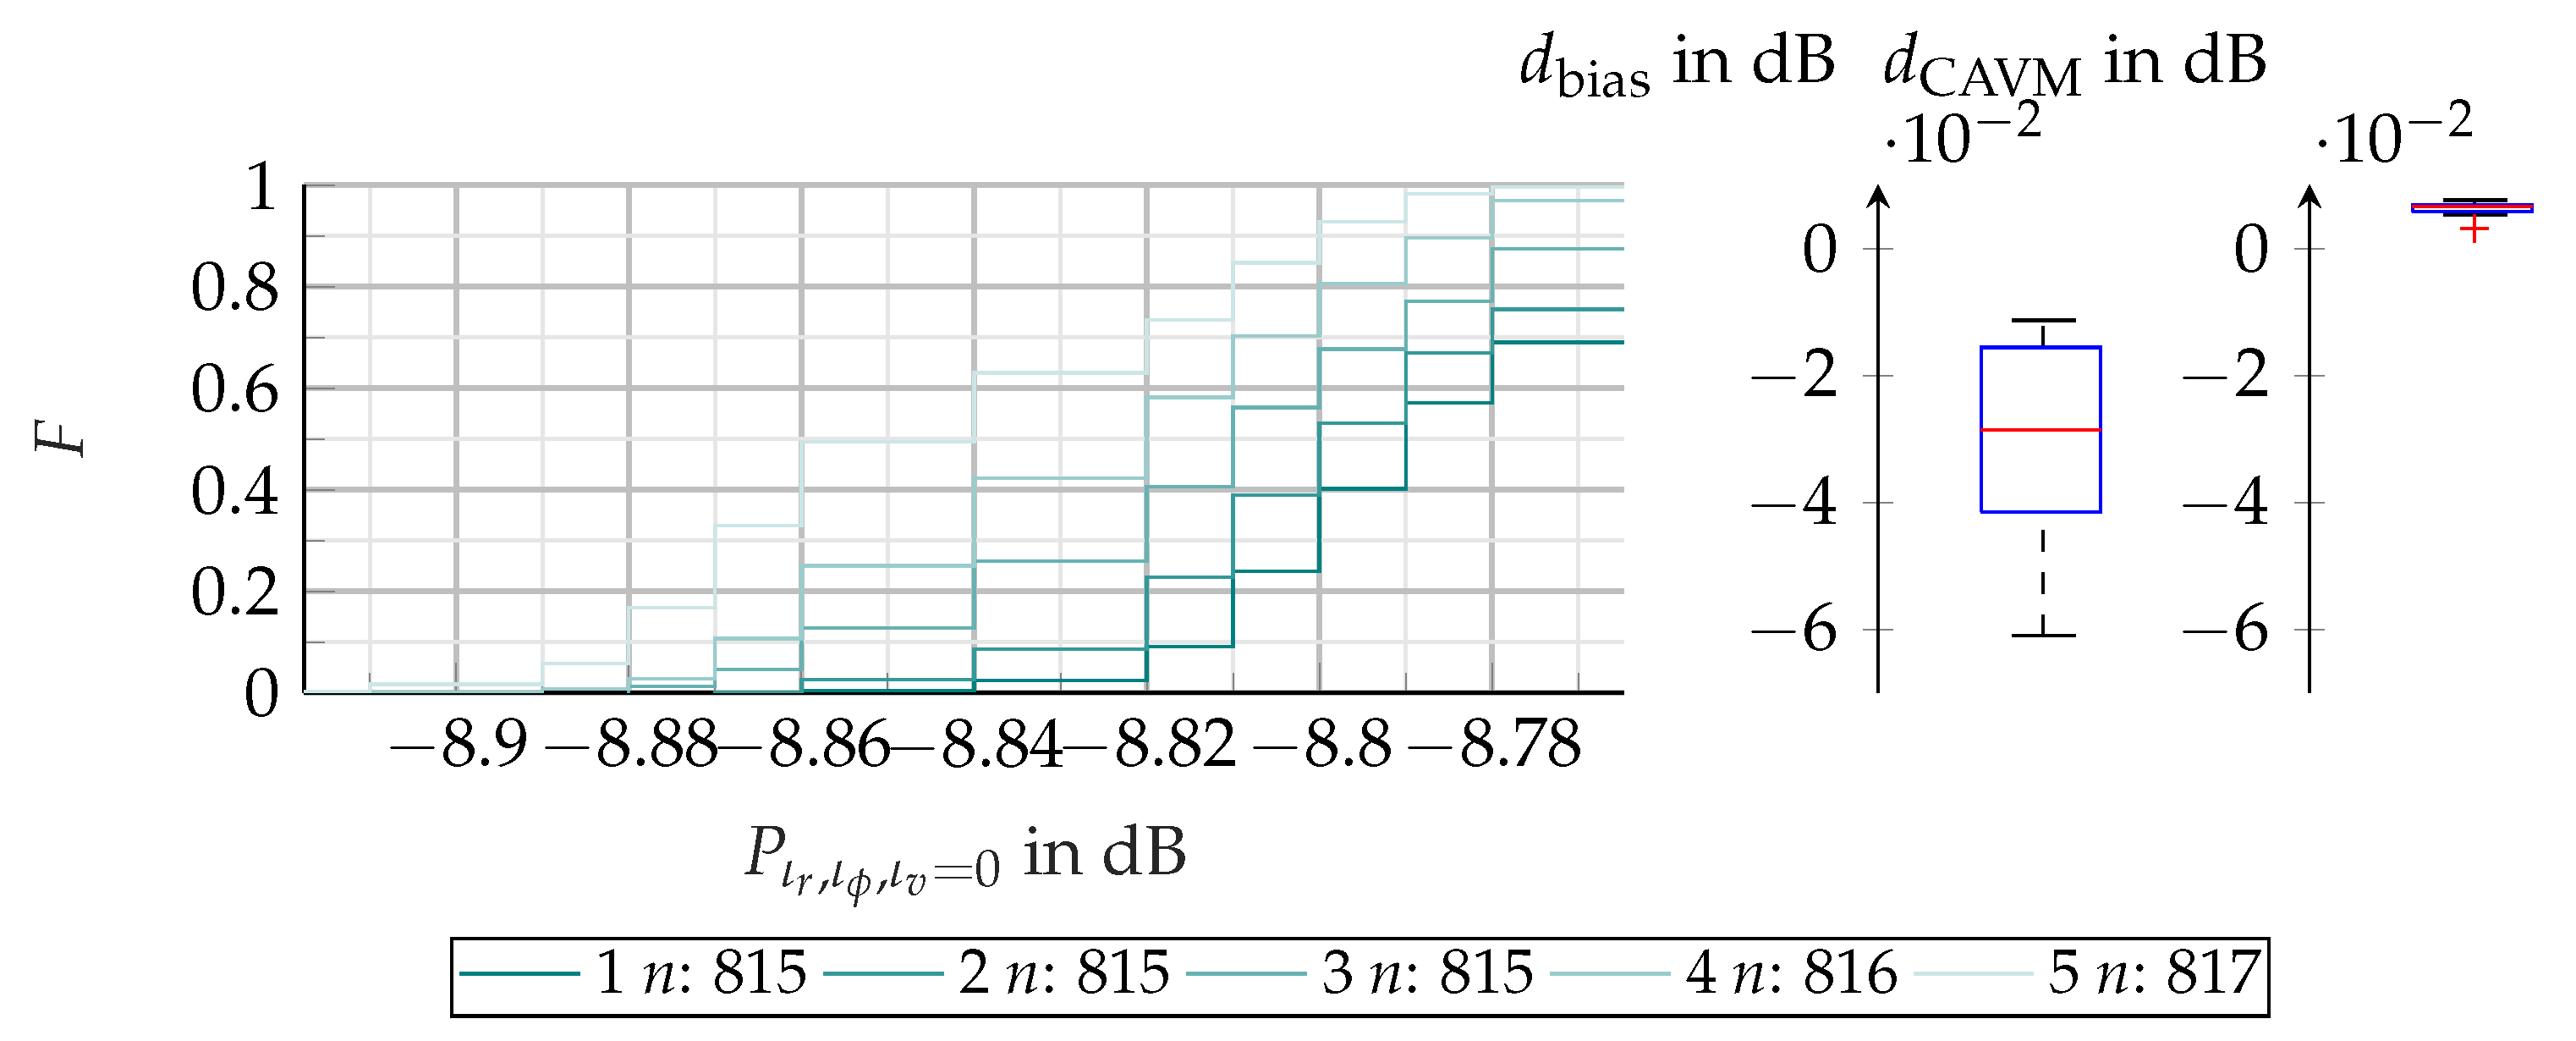
Figure 7.
Edfs of all five measurements of the ccr on the detection level filterd by an roi are shown in the diagram. The rcs distribution with the corresponding box plot for and is visualized on the right side. The aggregated number of detections of all timeframes is listed below the diagram.
Figure 7.
Edfs of all five measurements of the ccr on the detection level filterd by an roi are shown in the diagram. The rcs distribution with the corresponding box plot for and is visualized on the right side. The aggregated number of detections of all timeframes is listed below the diagram.
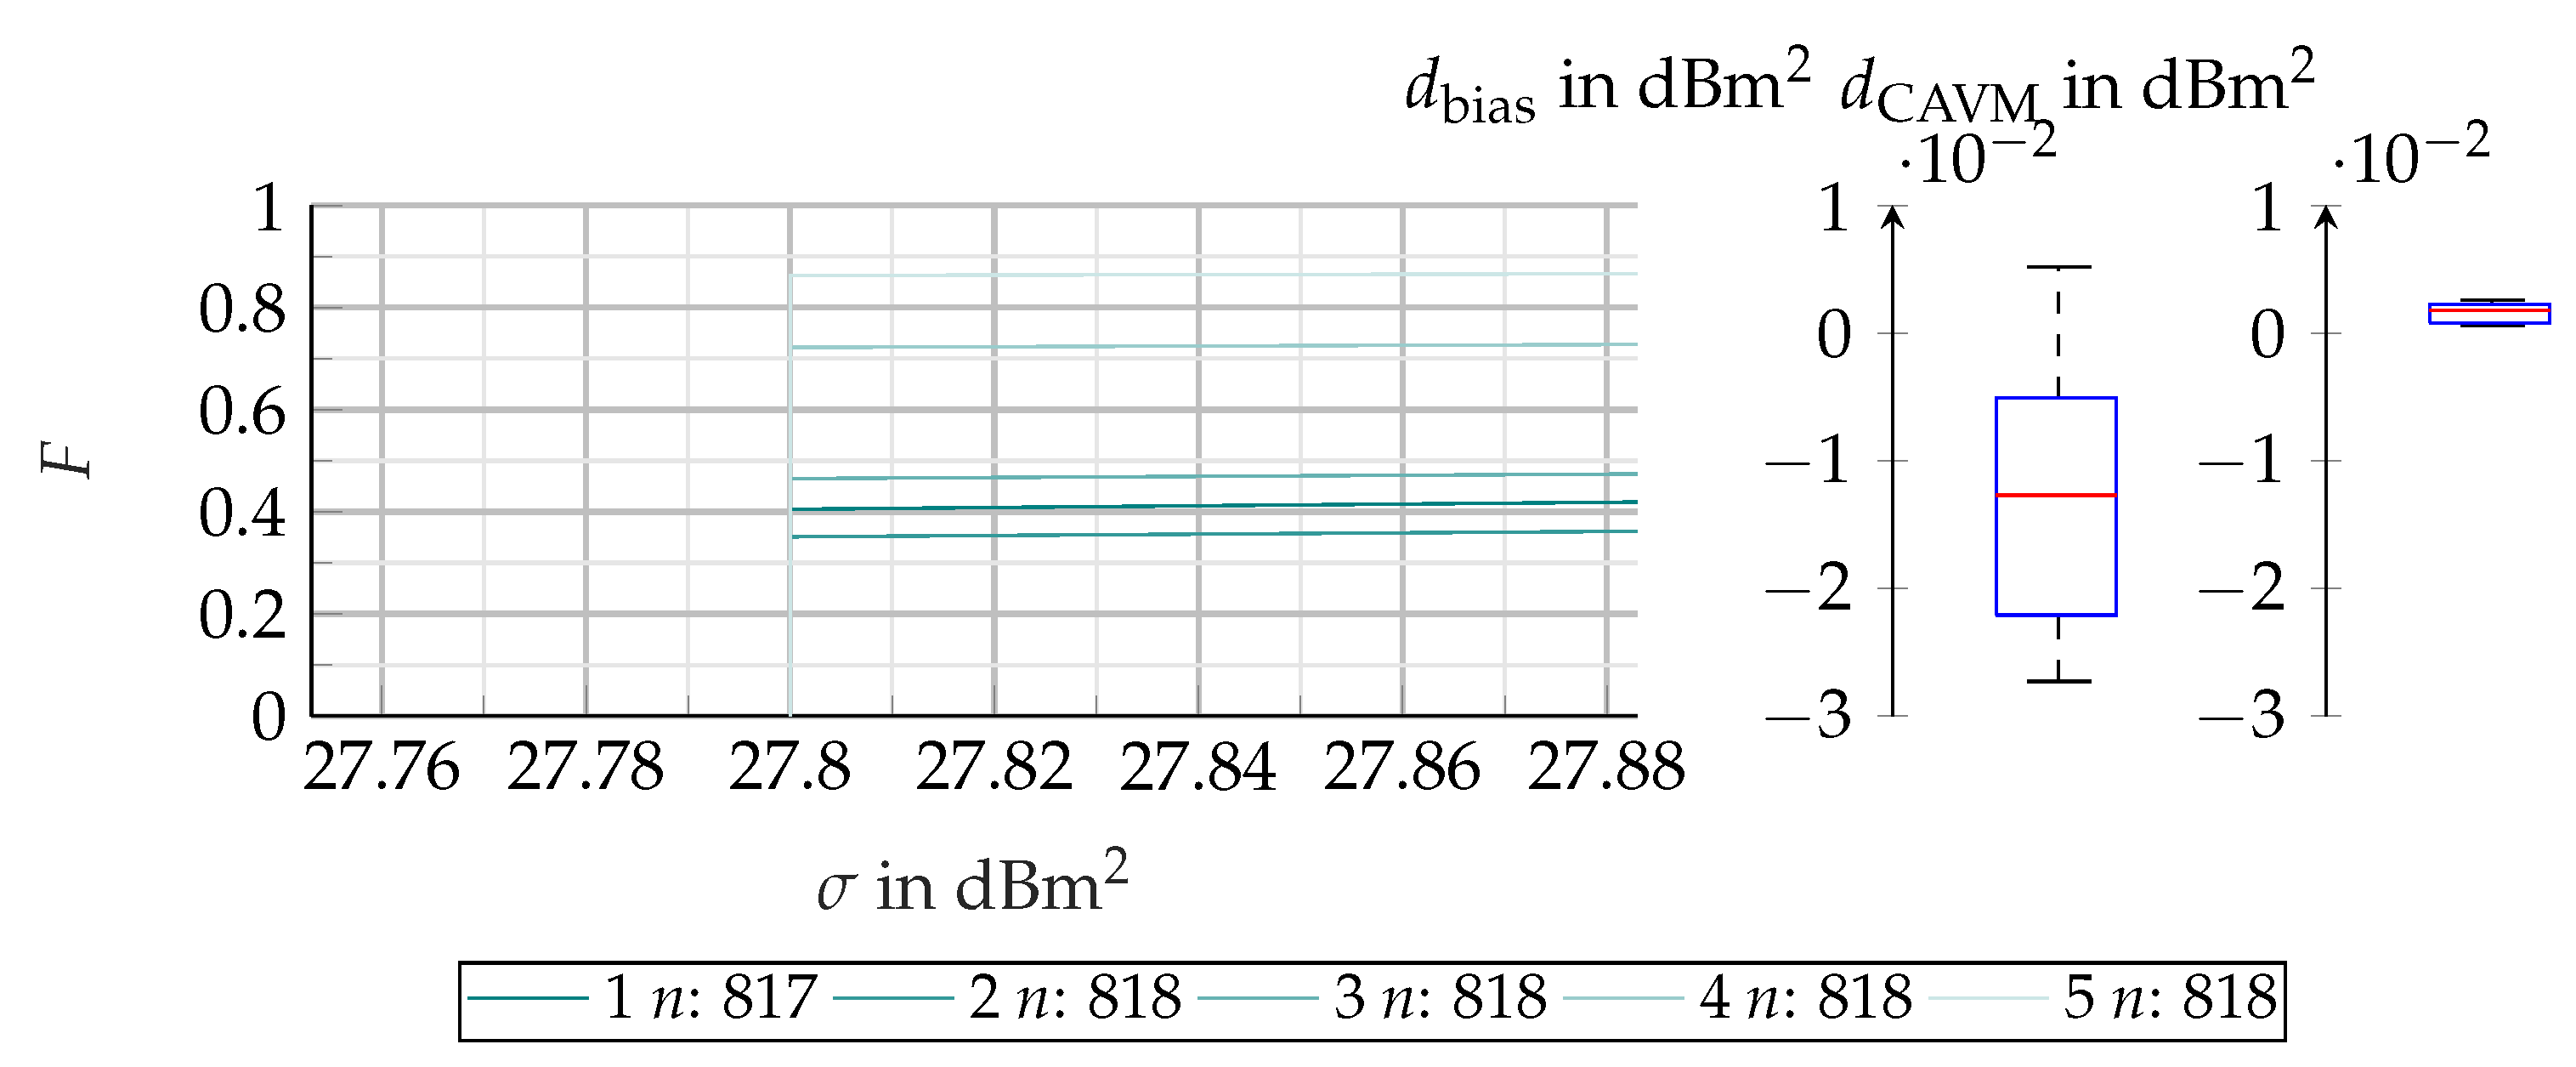
Figure 8.
Satellite image fused with and coded in colors for each range azimuth bin. The red circle visualizes the position of the CCR.
Figure 8.
Satellite image fused with and coded in colors for each range azimuth bin. The red circle visualizes the position of the CCR.
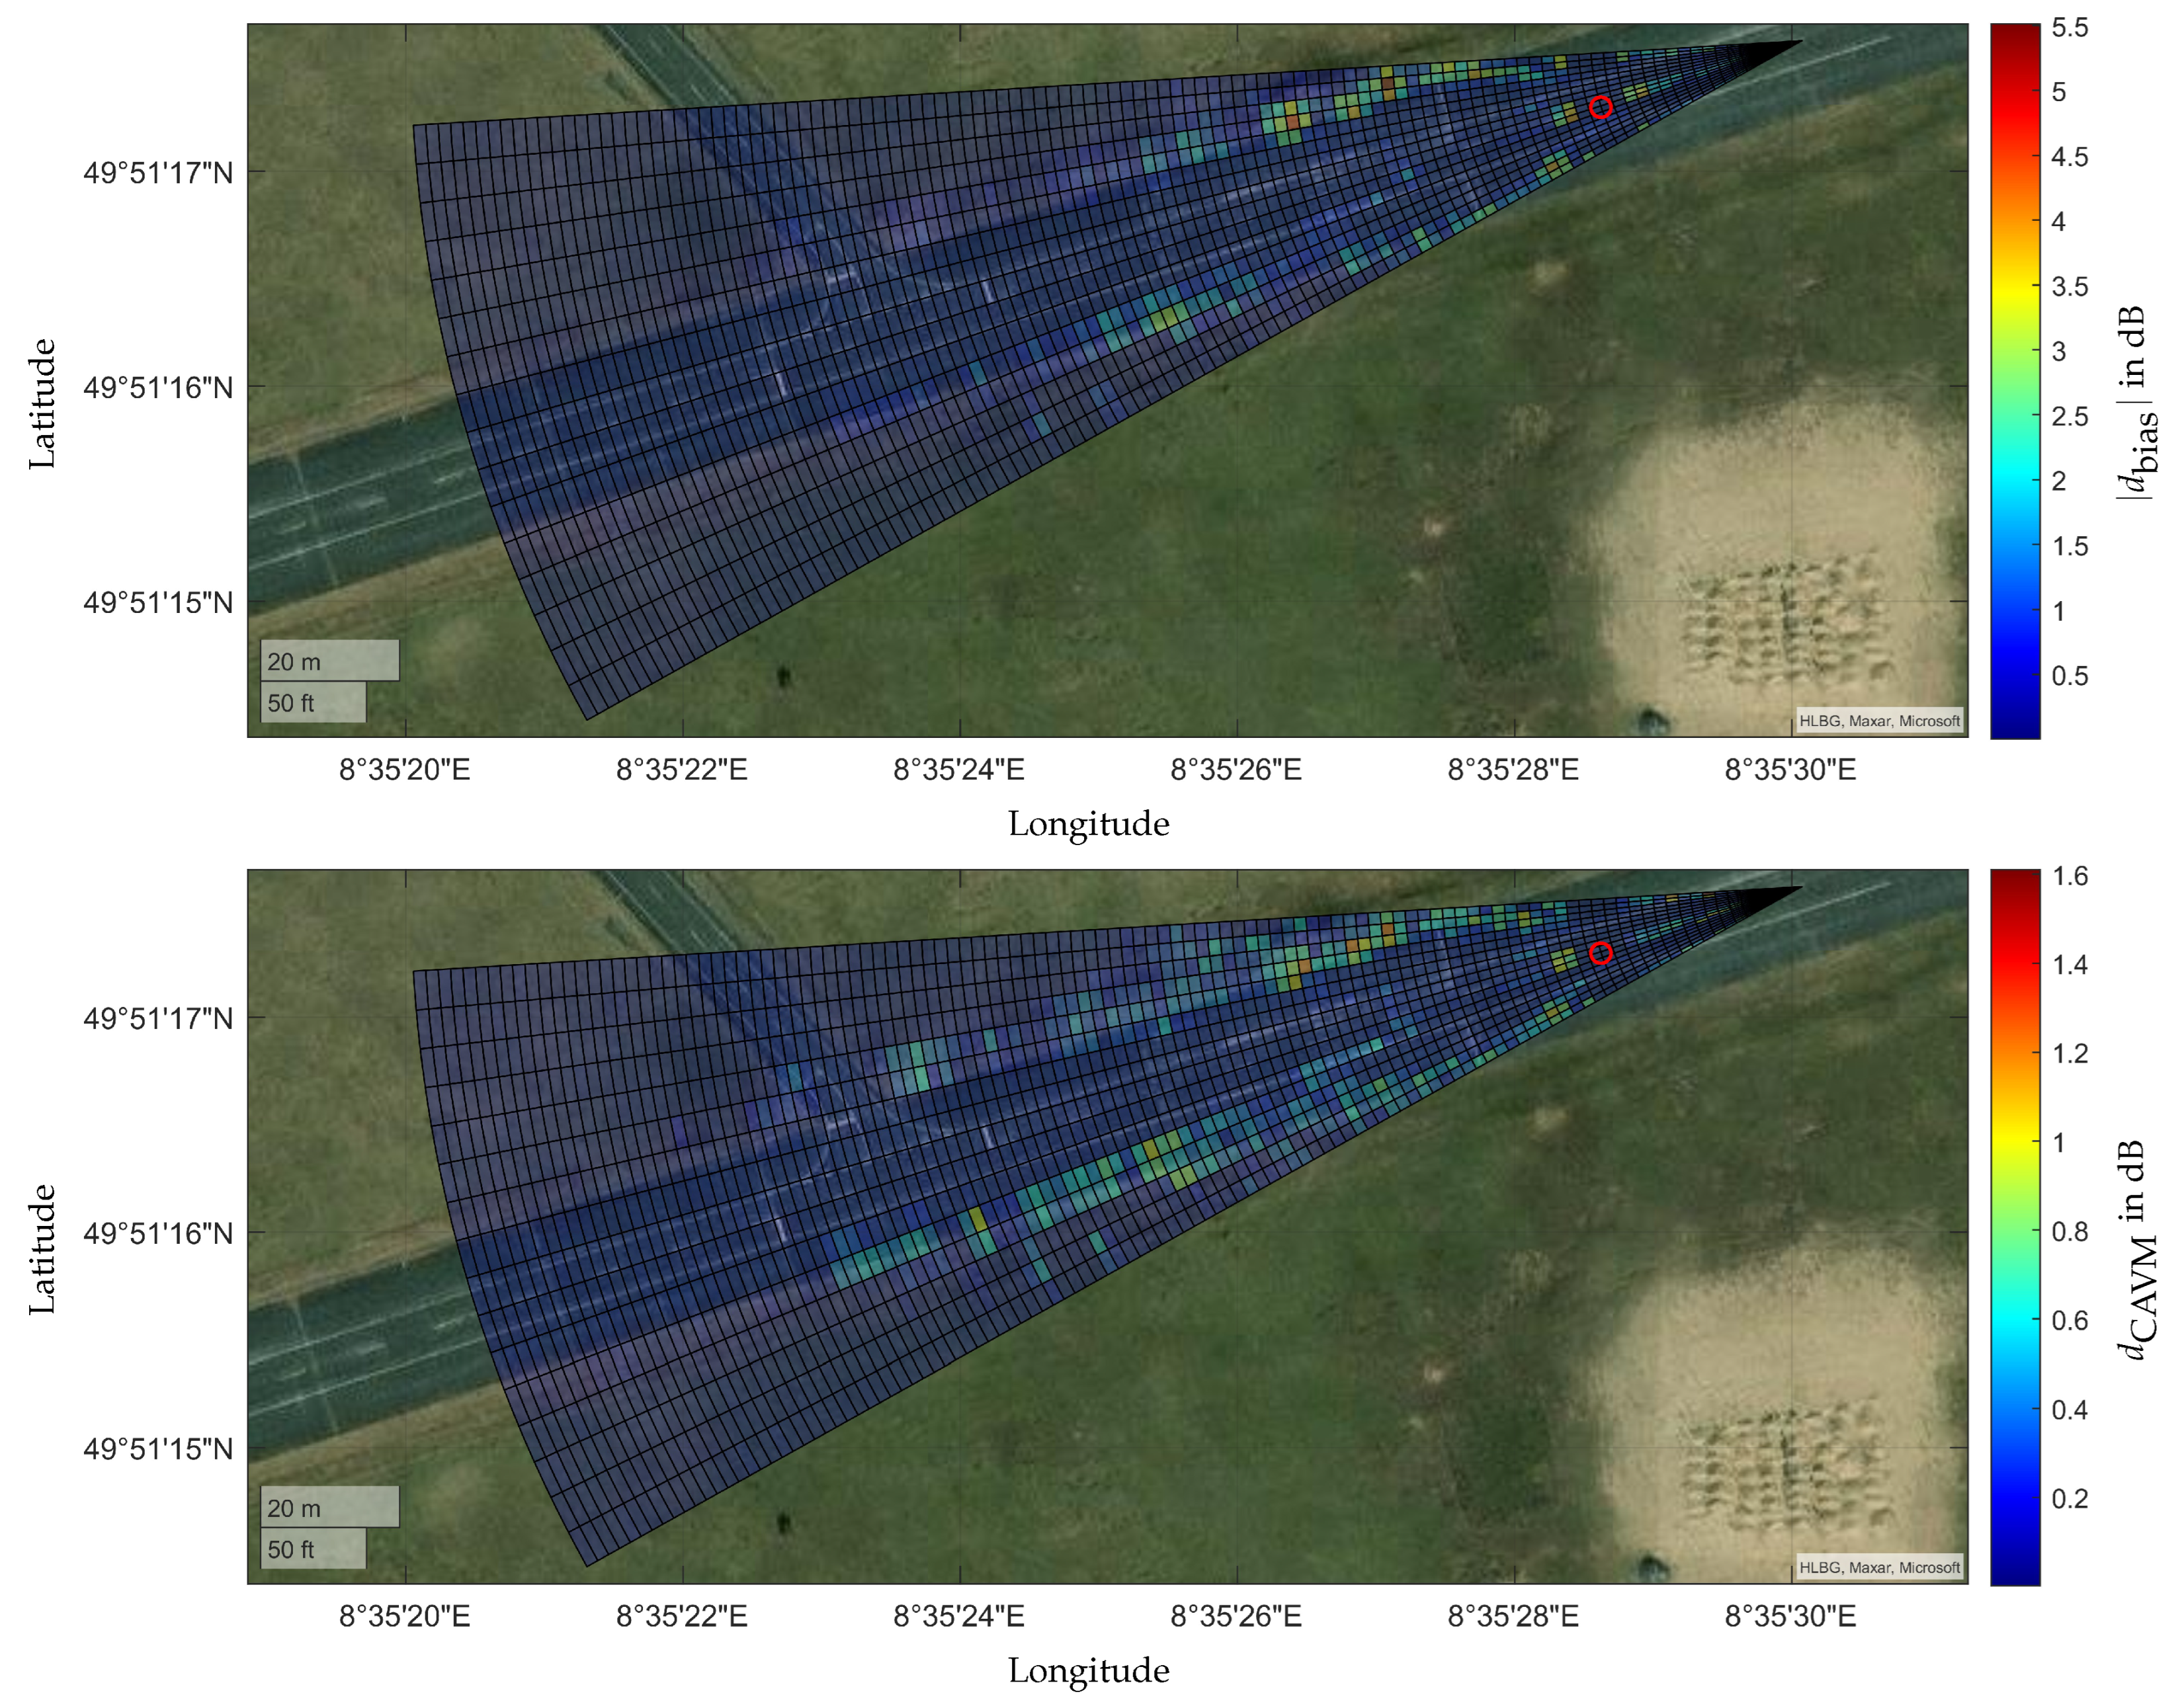
Figure 9.
Plot of the relative deviation for the number of the data points or detections of all measurements of the two test days, Day 1 and Day 2. The compared data are WRC, the ROI for the ROI RC and EB RC. Experiment 1 is denoted as and experiment 2 as . The gradations of the respective color delineate the different measurements.
and experiment 2 as . The gradations of the respective color delineate the different measurements.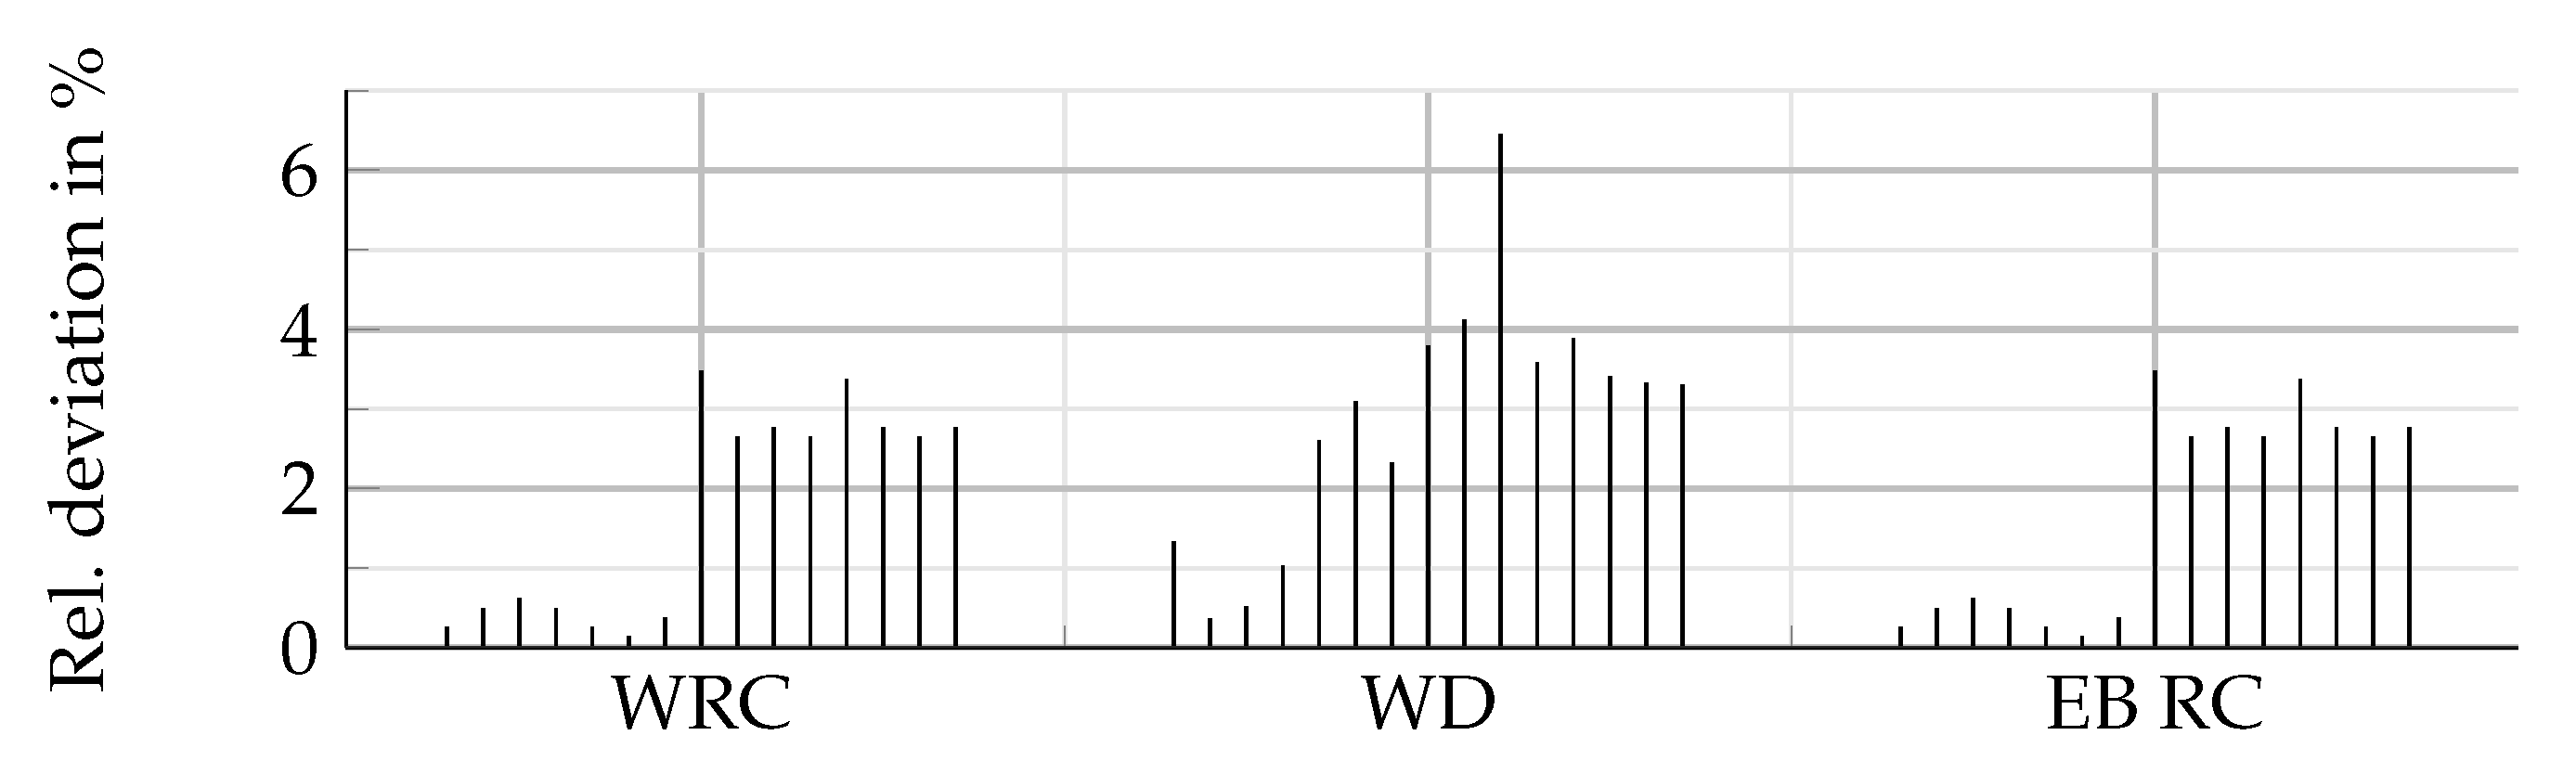
Figure 10.
Edfs of all eight measurements for Day1 ( ) and Day 2 (
 ) each on the radar cuboid level. The number of aggregated bins is listed below the diagram. On the right side the box plot for and in dB is shown.
) and Day 2 () each on the radar cuboid level. The number of aggregated bins is listed below the diagram. On the right side the box plot for and in dB is shown.
Figure 10.
Edfs of all eight measurements for Day1 () and Day 2 () each on the radar cuboid level. The number of aggregated bins is listed below the diagram. On the right side the box plot for and in dB is shown.
) and Day 2 () each on the radar cuboid level. The number of aggregated bins is listed below the diagram. On the right side the box plot for and in dB is shown.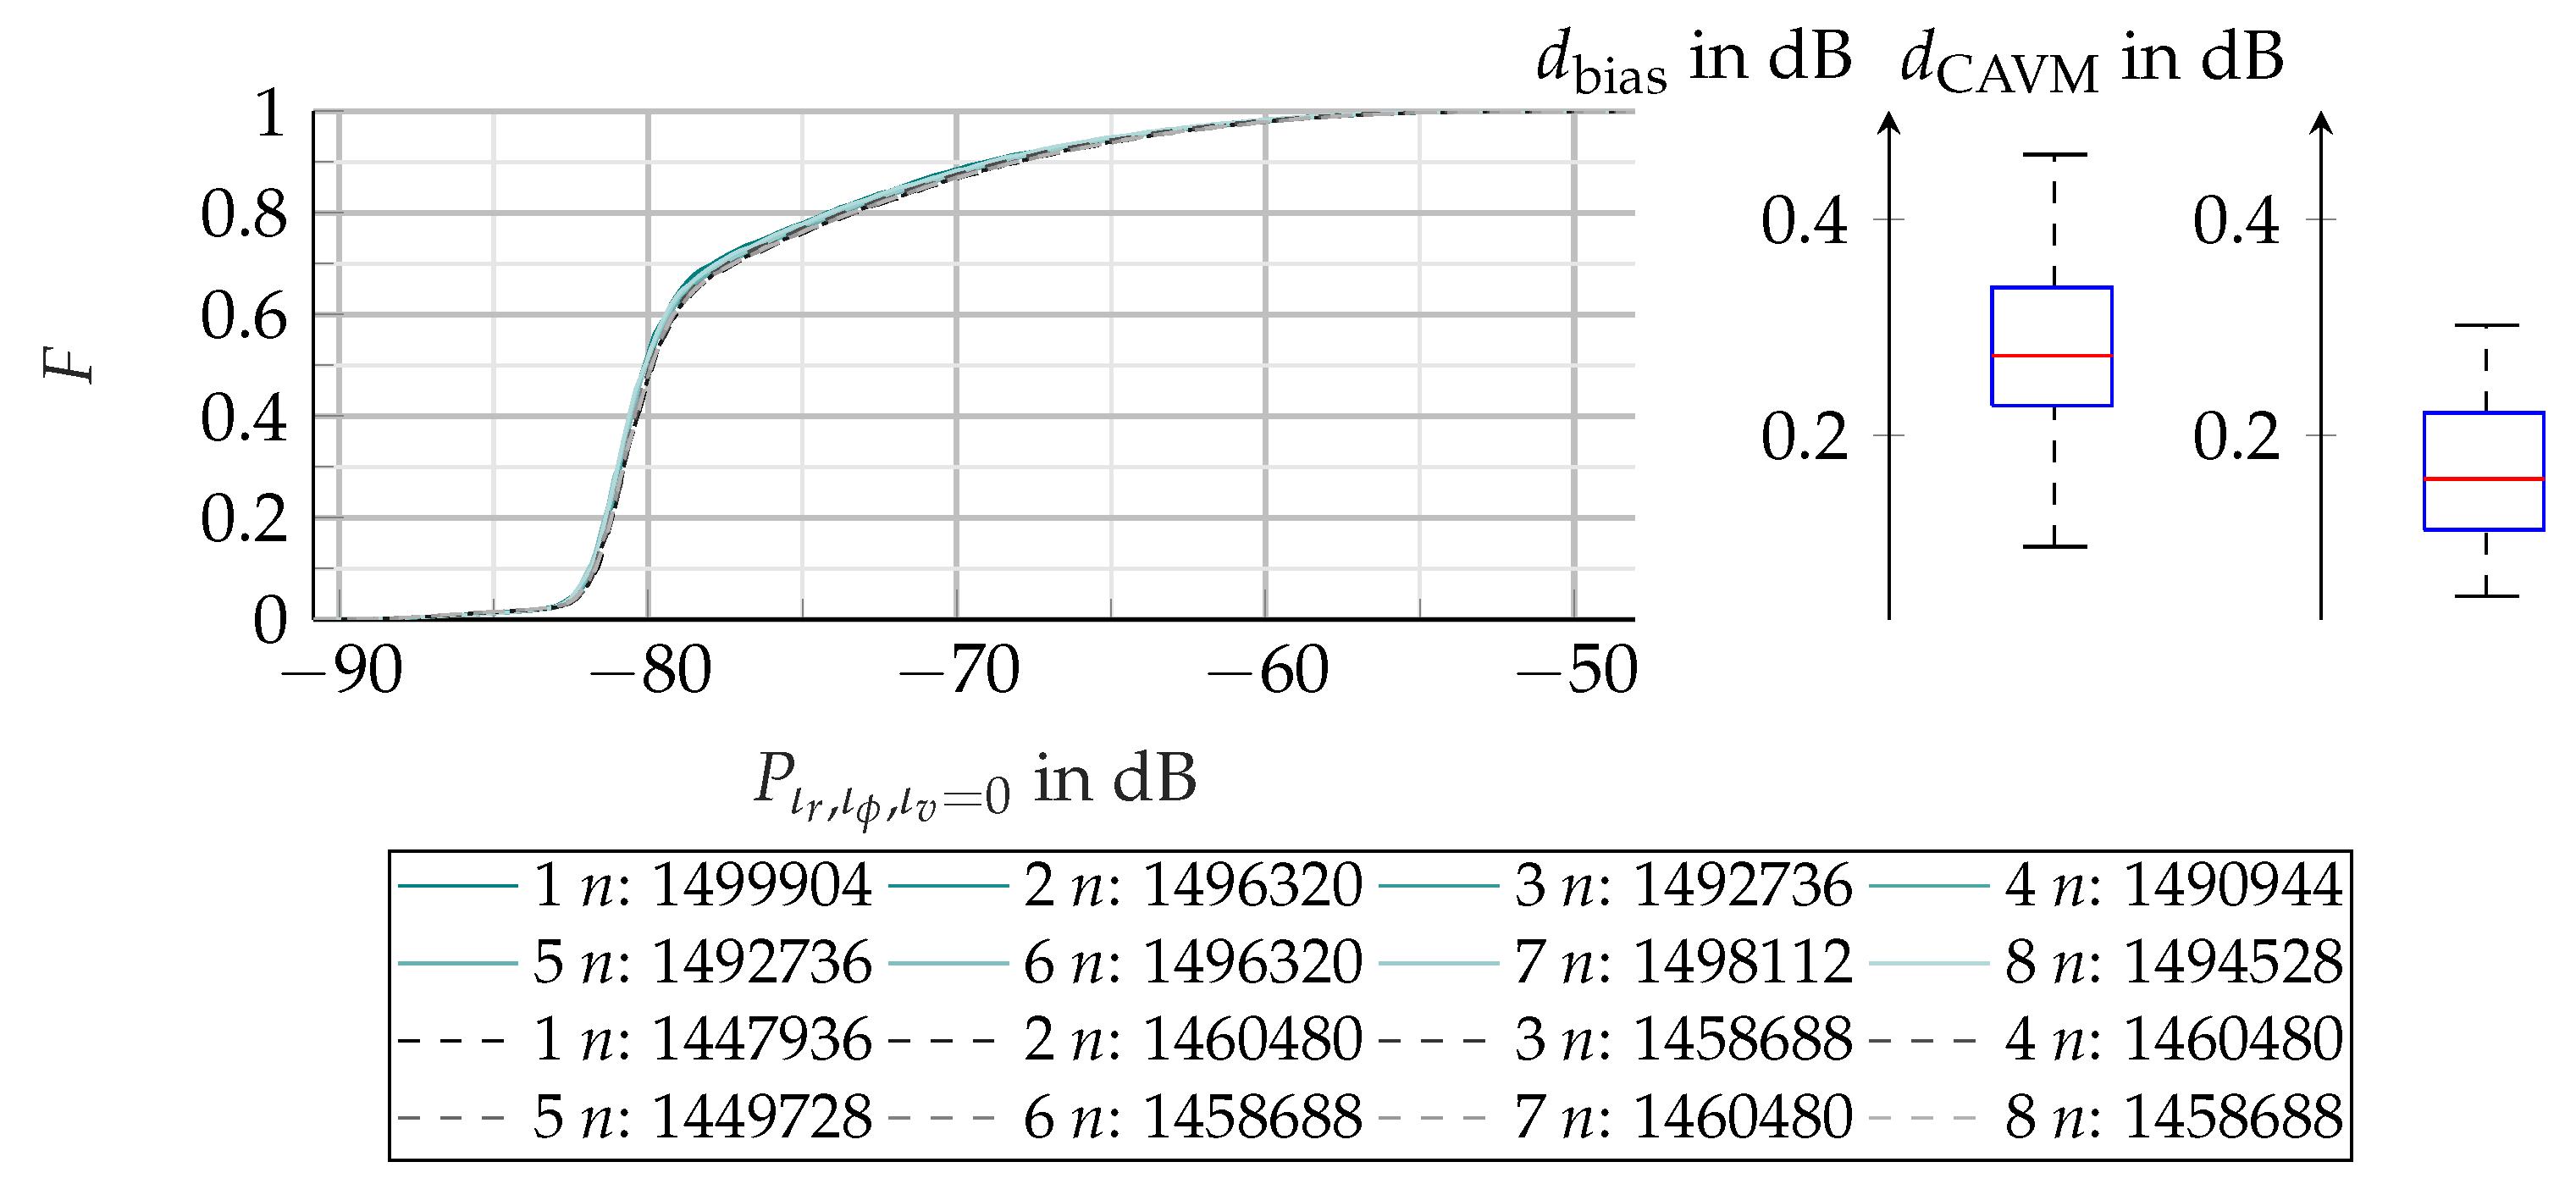
Figure 11.
Comparison of and based on the whole radar cuboid for Day 1/2, Day 1/1 and Day 2/2. The repeatability between the measurements of each day is higher than the reproduciblity of the measurement setup.
Figure 11.
Comparison of and based on the whole radar cuboid for Day 1/2, Day 1/1 and Day 2/2. The repeatability between the measurements of each day is higher than the reproduciblity of the measurement setup.
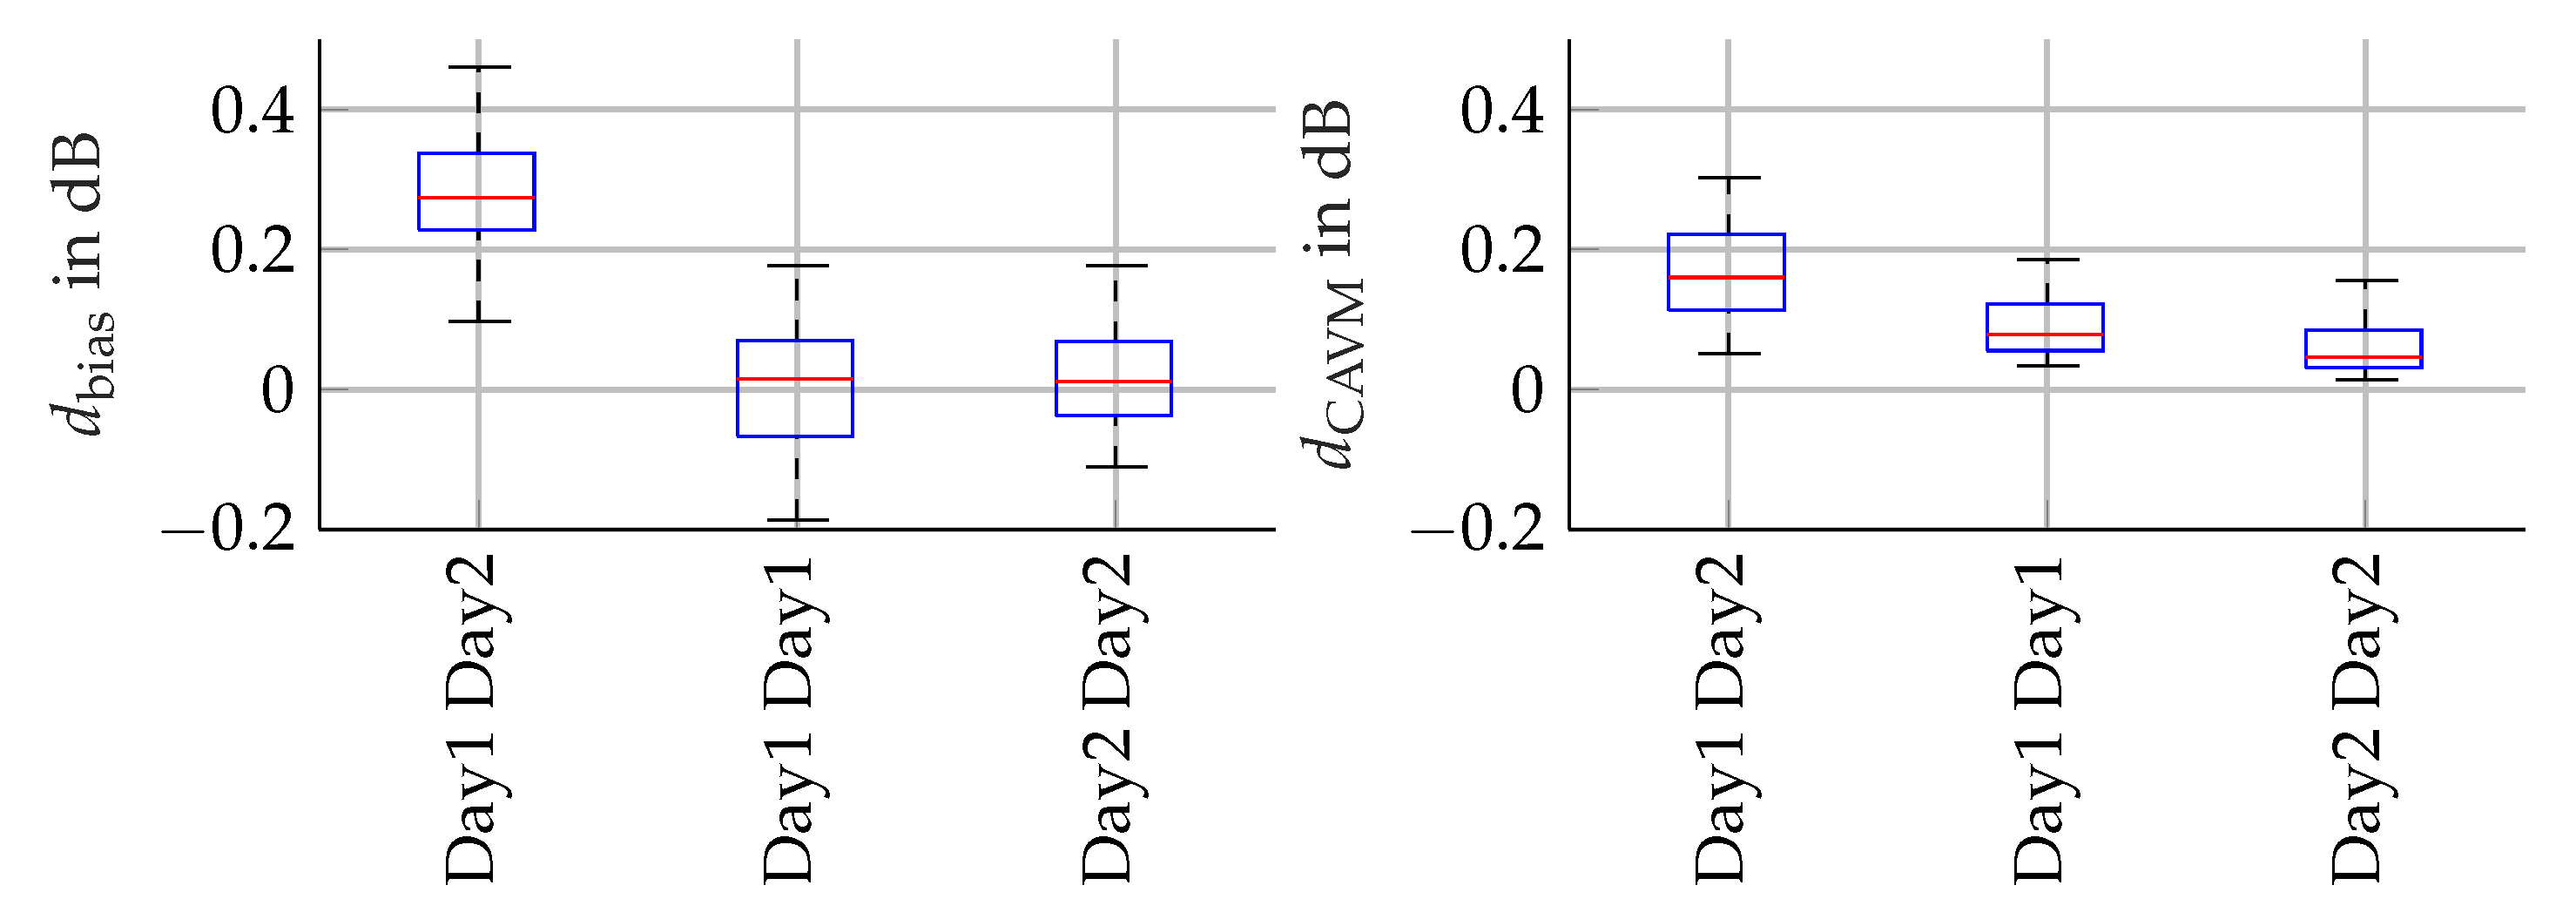
Figure 12.
Satellite image fused with and coded in colors for each range azimuth bin.
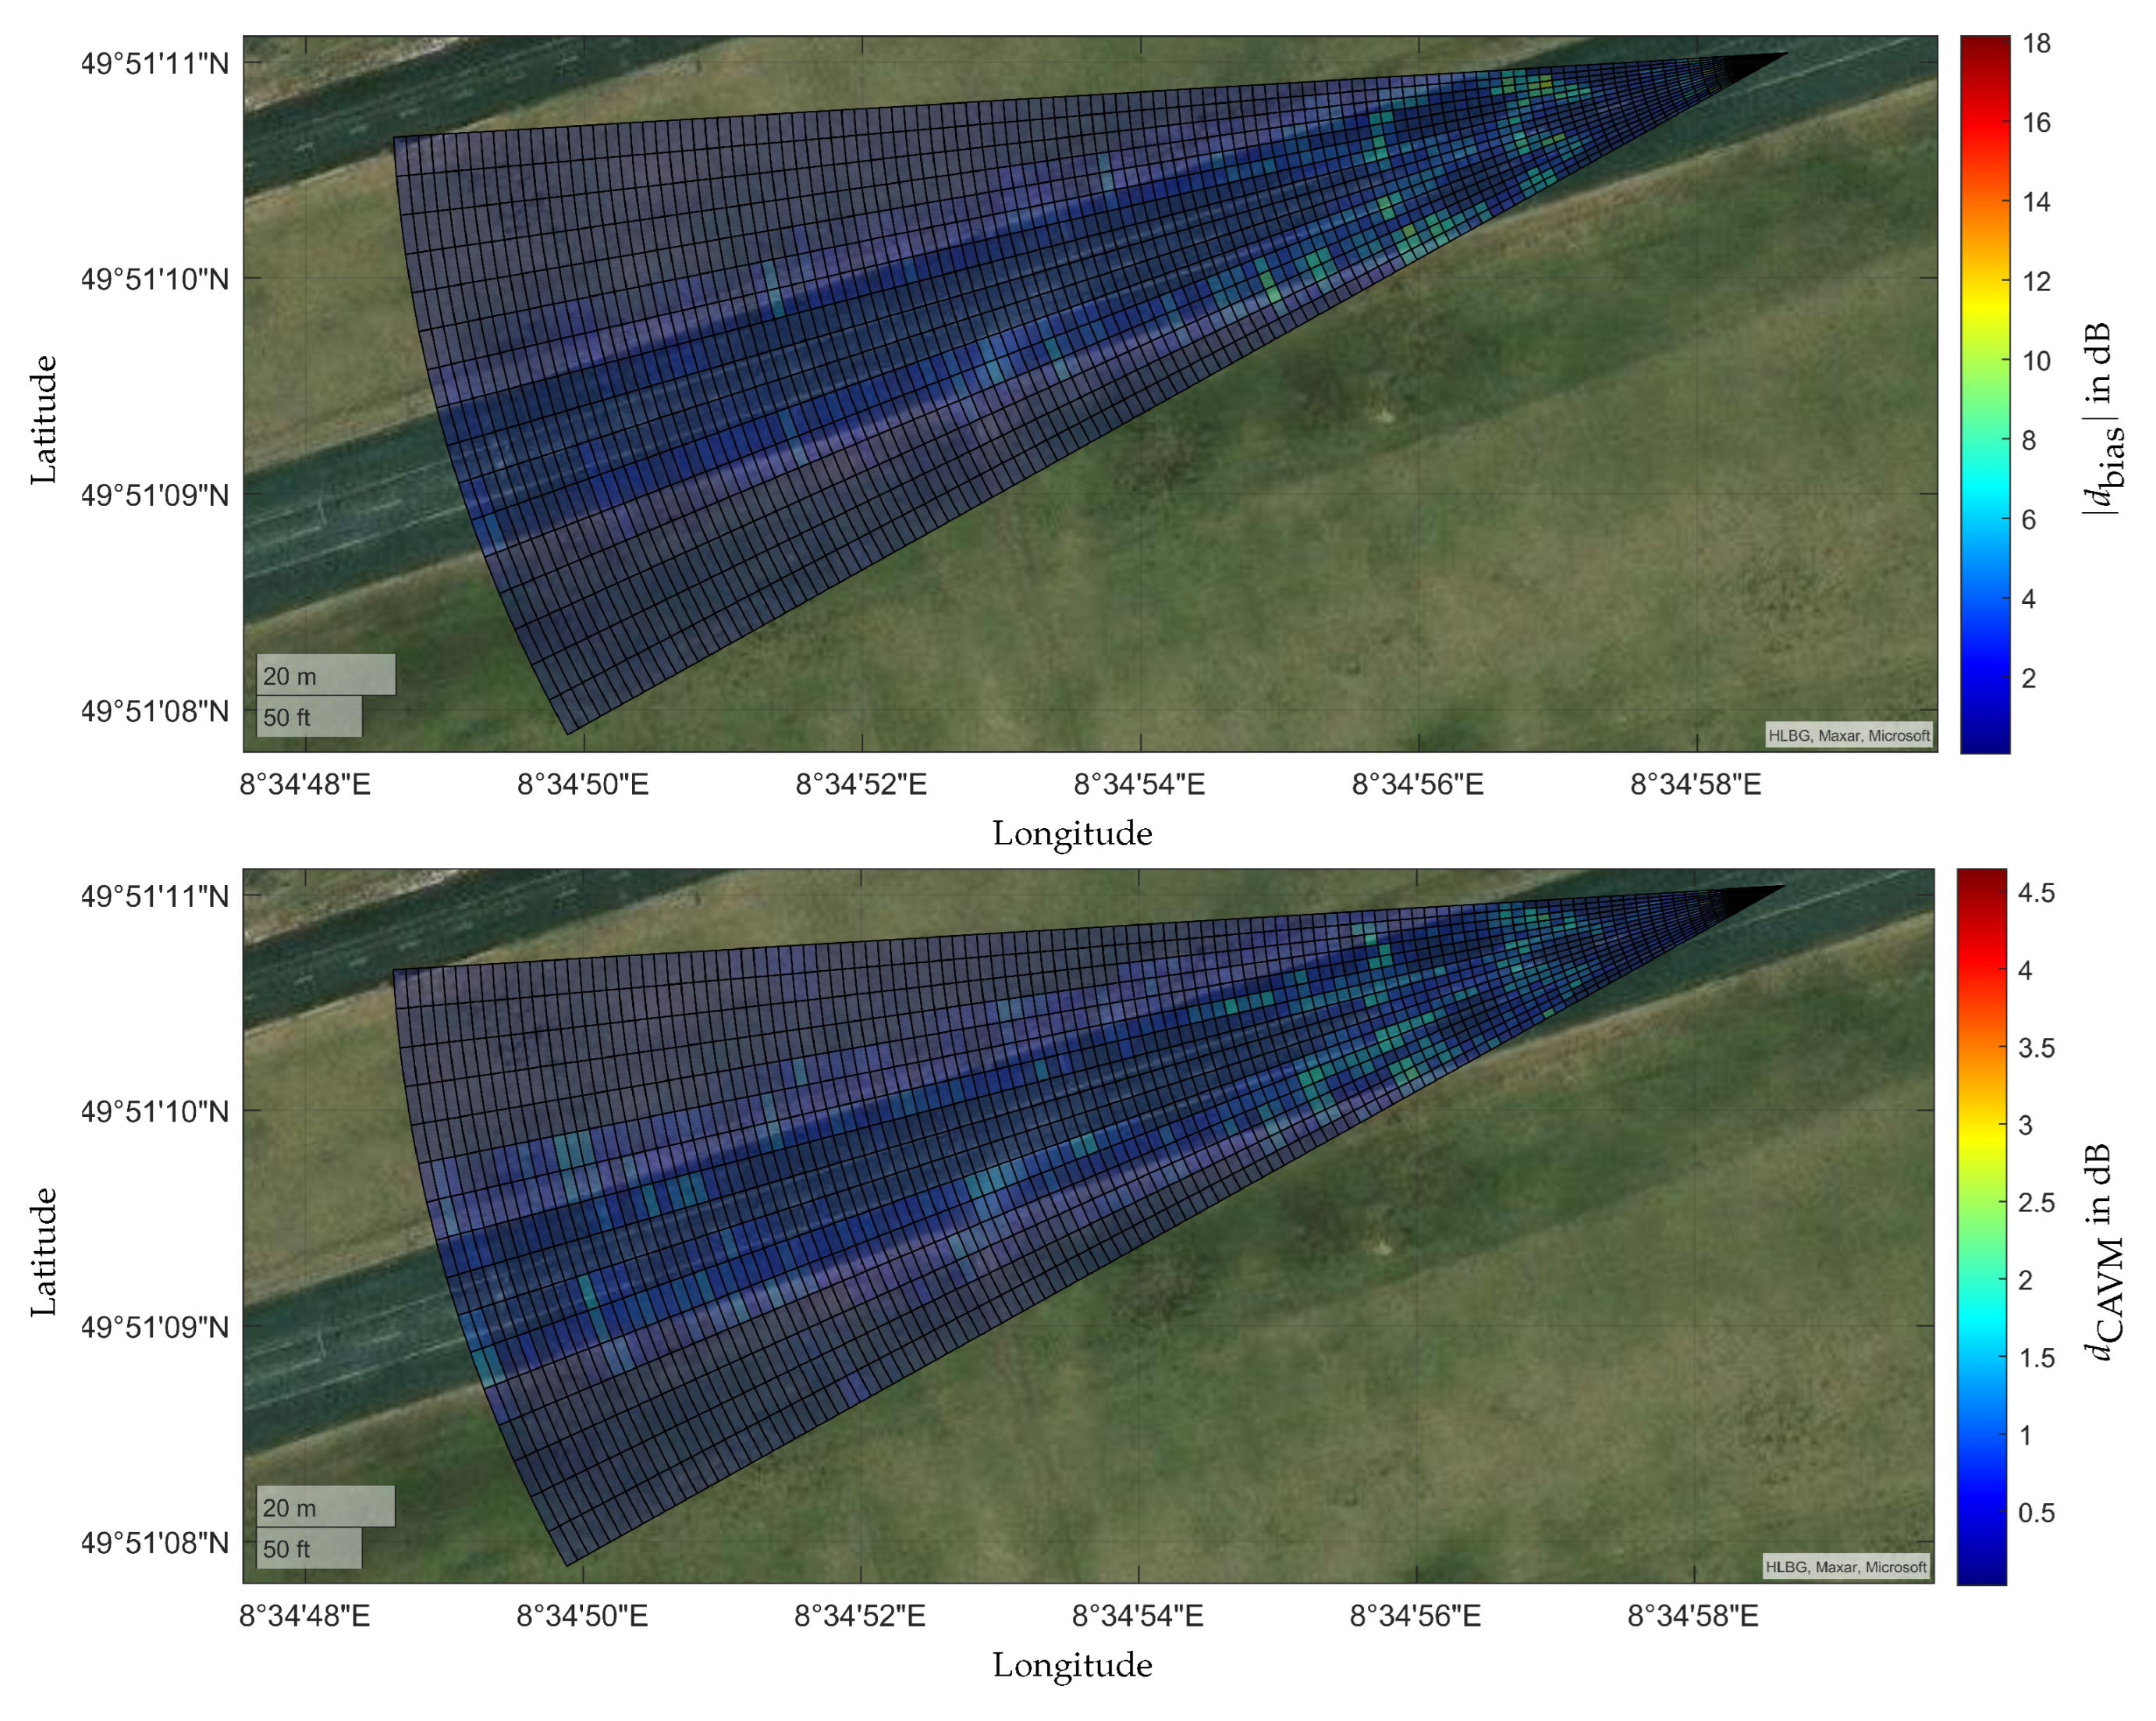
Figure 13.
Plot of the relative deviation for the number of the data points or detections of all measurements of the two experiments (CCR and XC90). All evaluation levels are compared. Experiment 1 is denoted as and experiment 2 as . The gradations of the respective color delineate the different measurements.
and experiment 2 as . The gradations of the respective color delineate the different measurements.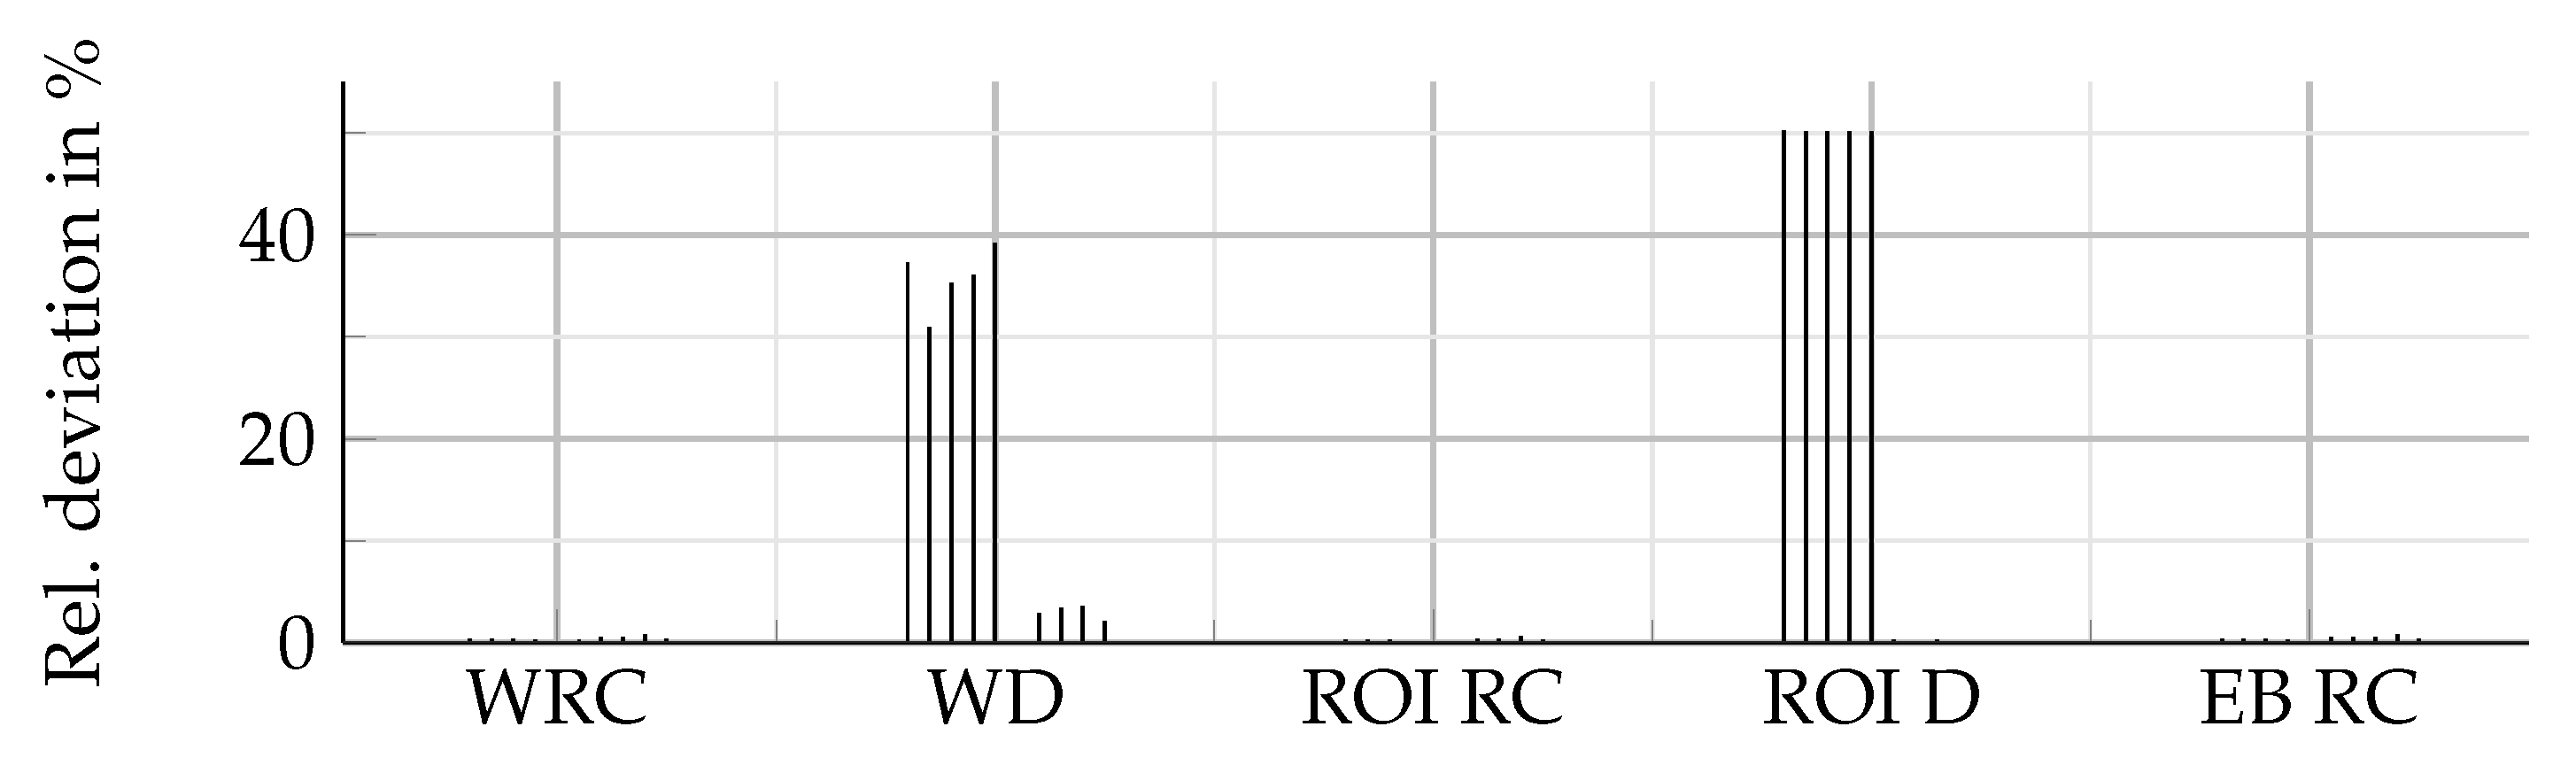
Figure 14.
Edfs of all five measurements for the objects ccr () and the Volvo XC90 () each on the radar cuboid level. The number of aggregated bins is listed below the diagram. On the right side the box plot for and in dB is shown.
) and the Volvo XC90 () each on the radar cuboid level. The number of aggregated bins is listed below the diagram. On the right side the box plot for and in dB is shown.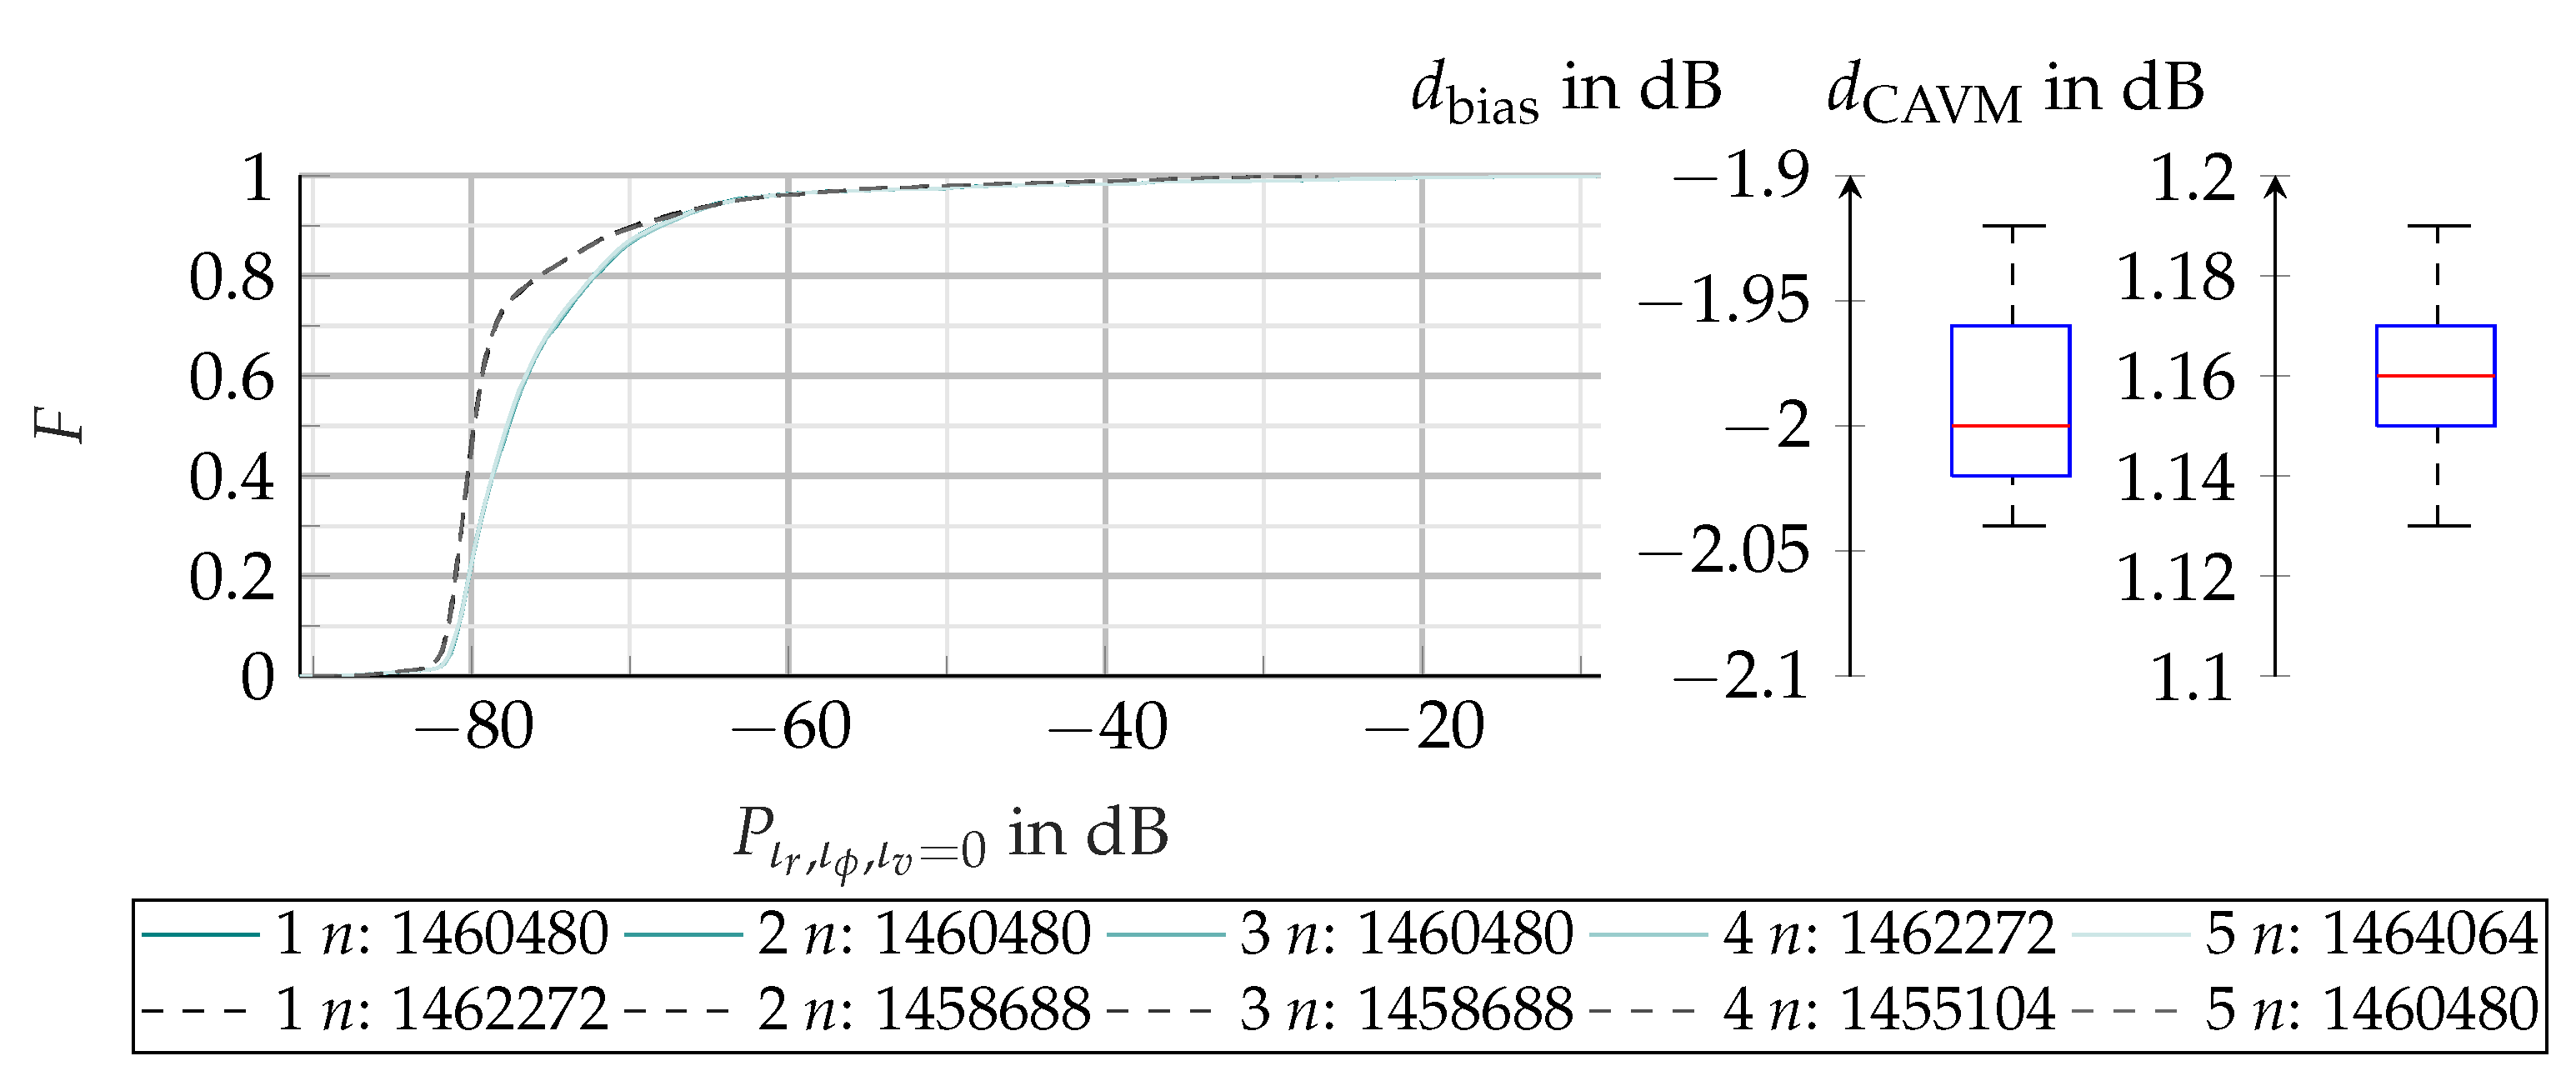
Figure 15.
Satellite image fused with and coded in colors for each range azimuth bin. The objects under examination are a ccr and a Volvo XC90. The red circle visualizes the position of both objects.
Figure 15.
Satellite image fused with and coded in colors for each range azimuth bin. The objects under examination are a ccr and a Volvo XC90. The red circle visualizes the position of both objects.
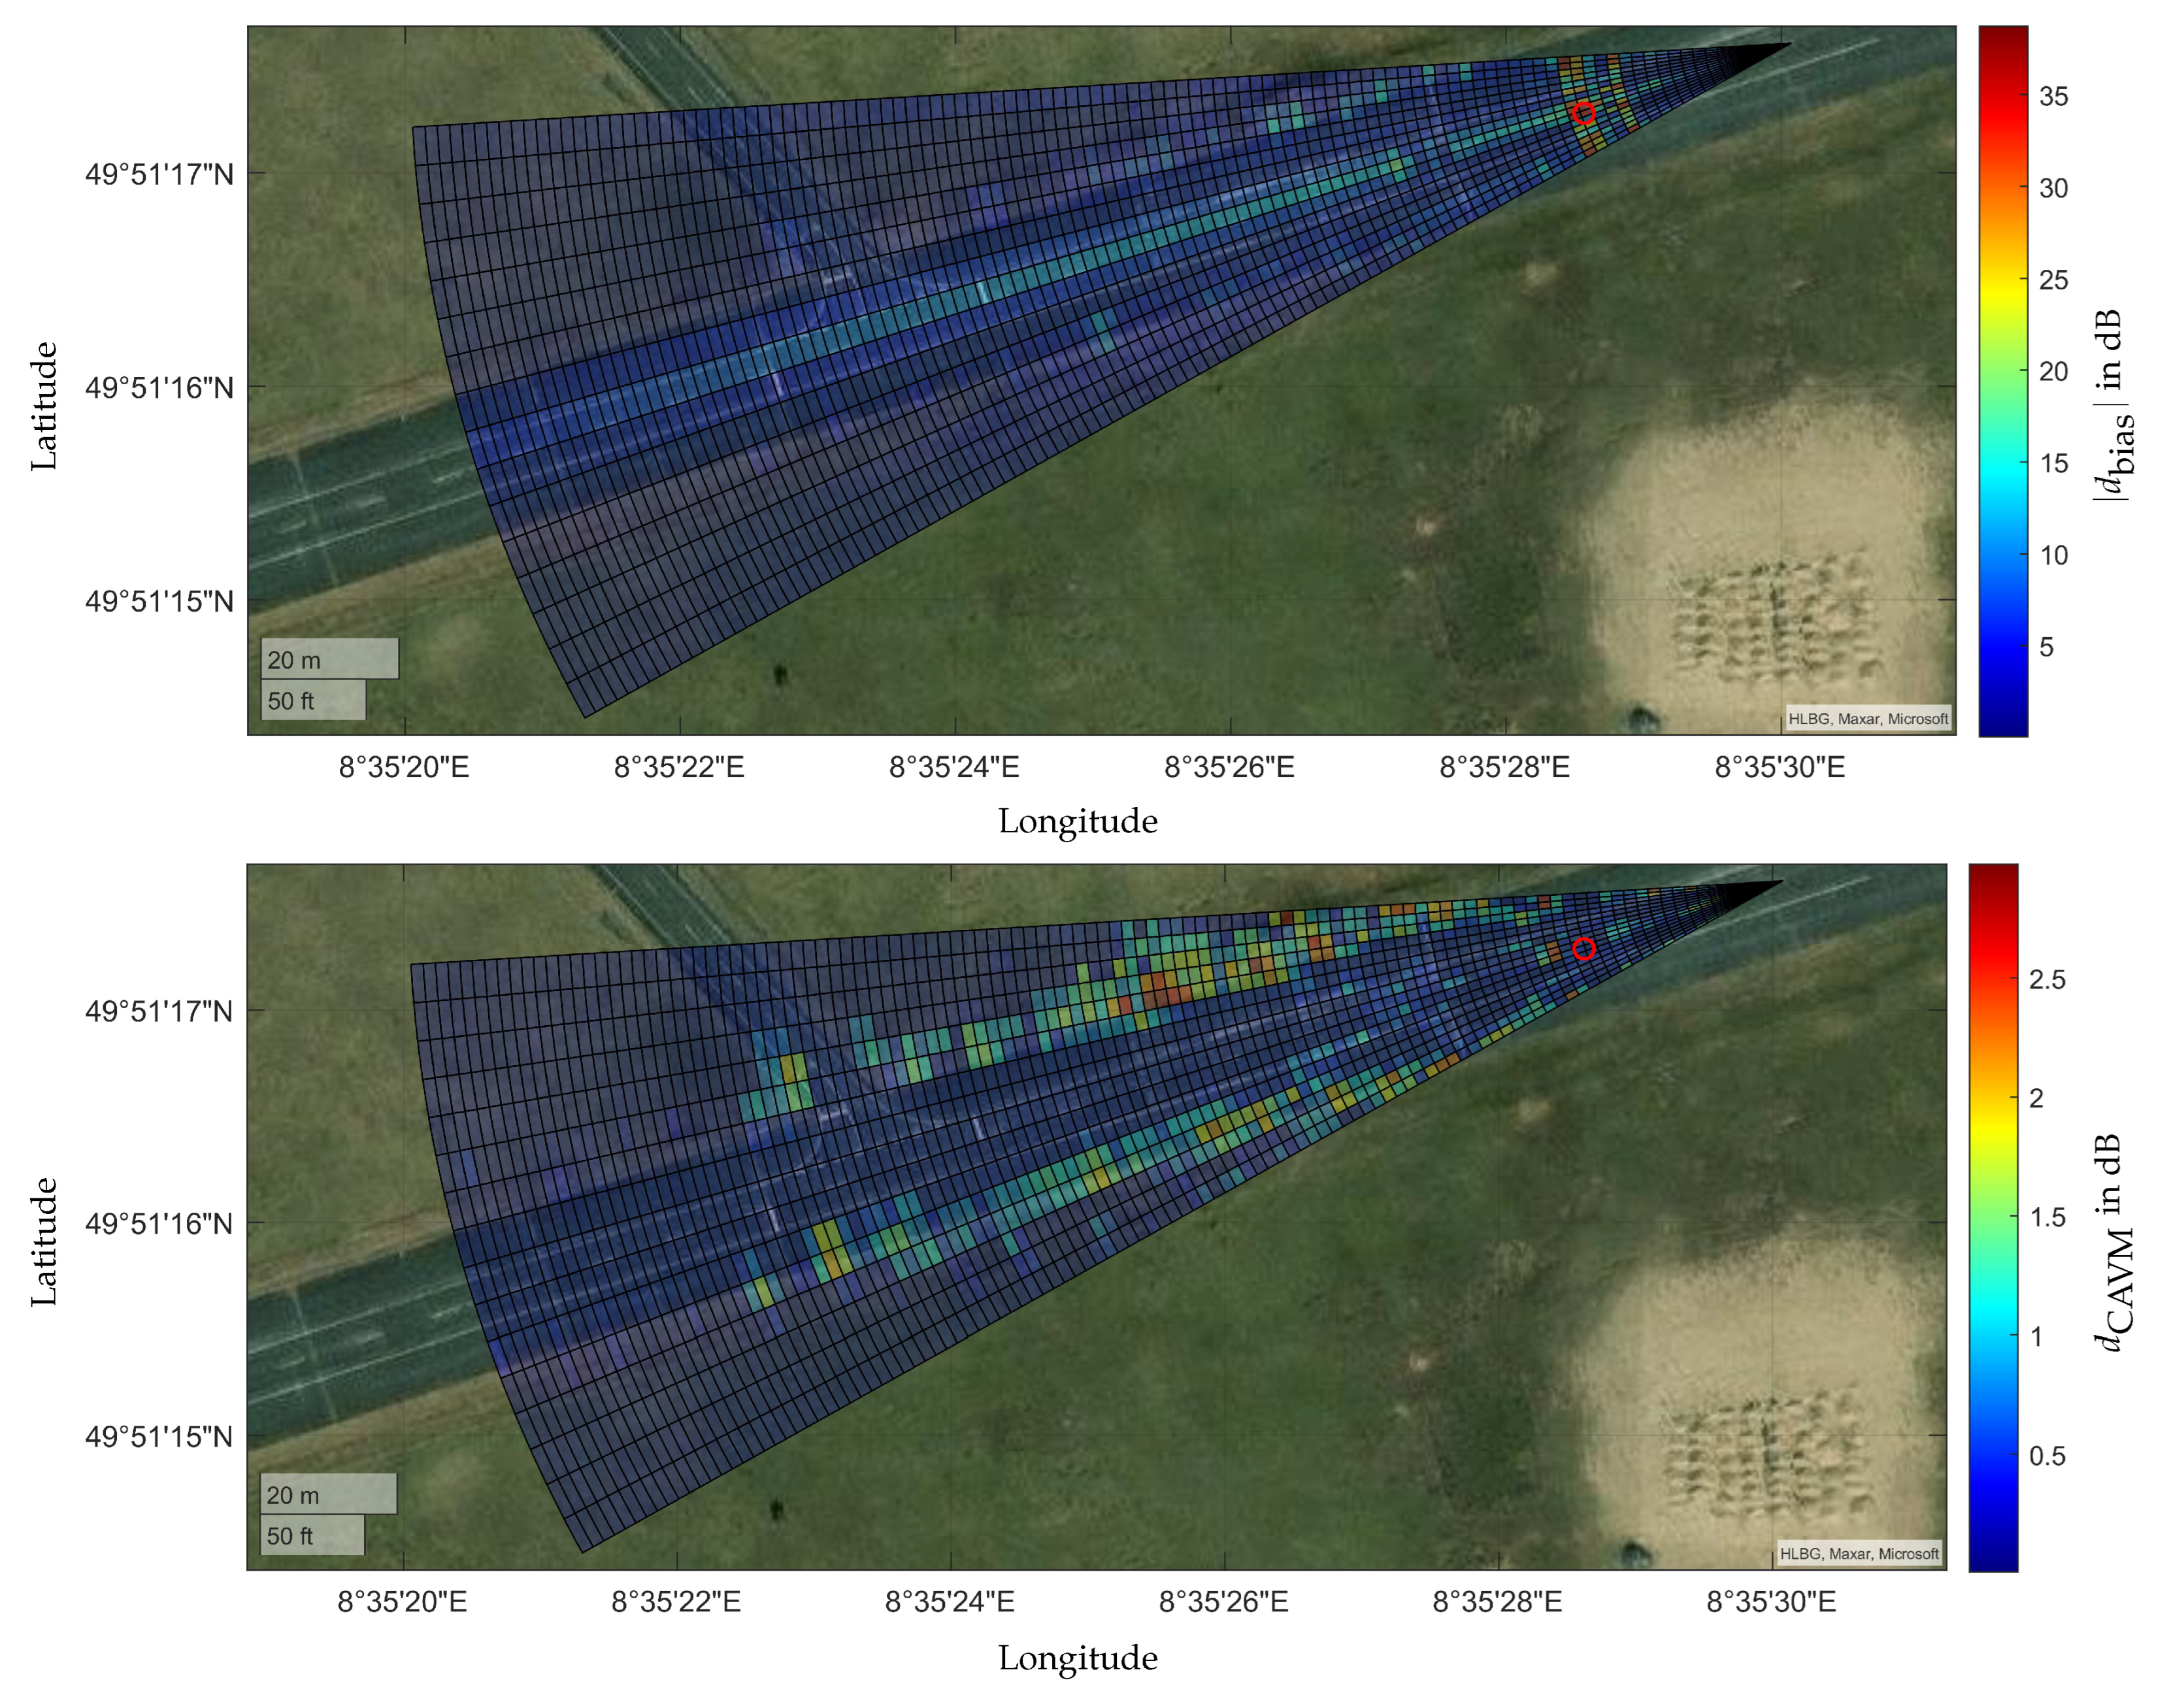
Figure 16.
Plot of the relative deviation for the number of the data points of all measurements of the two experiments (XC90 and XC90 rotated). The WRC, WD, the ROI for the ROI RC and the ROI D, as
well as EB RC are compared. Experiment 1 is denoted as and experiment 2 as . The gradations of the respective color delineate the different measurements.
and experiment 2 as . The gradations of the respective color delineate the different measurements.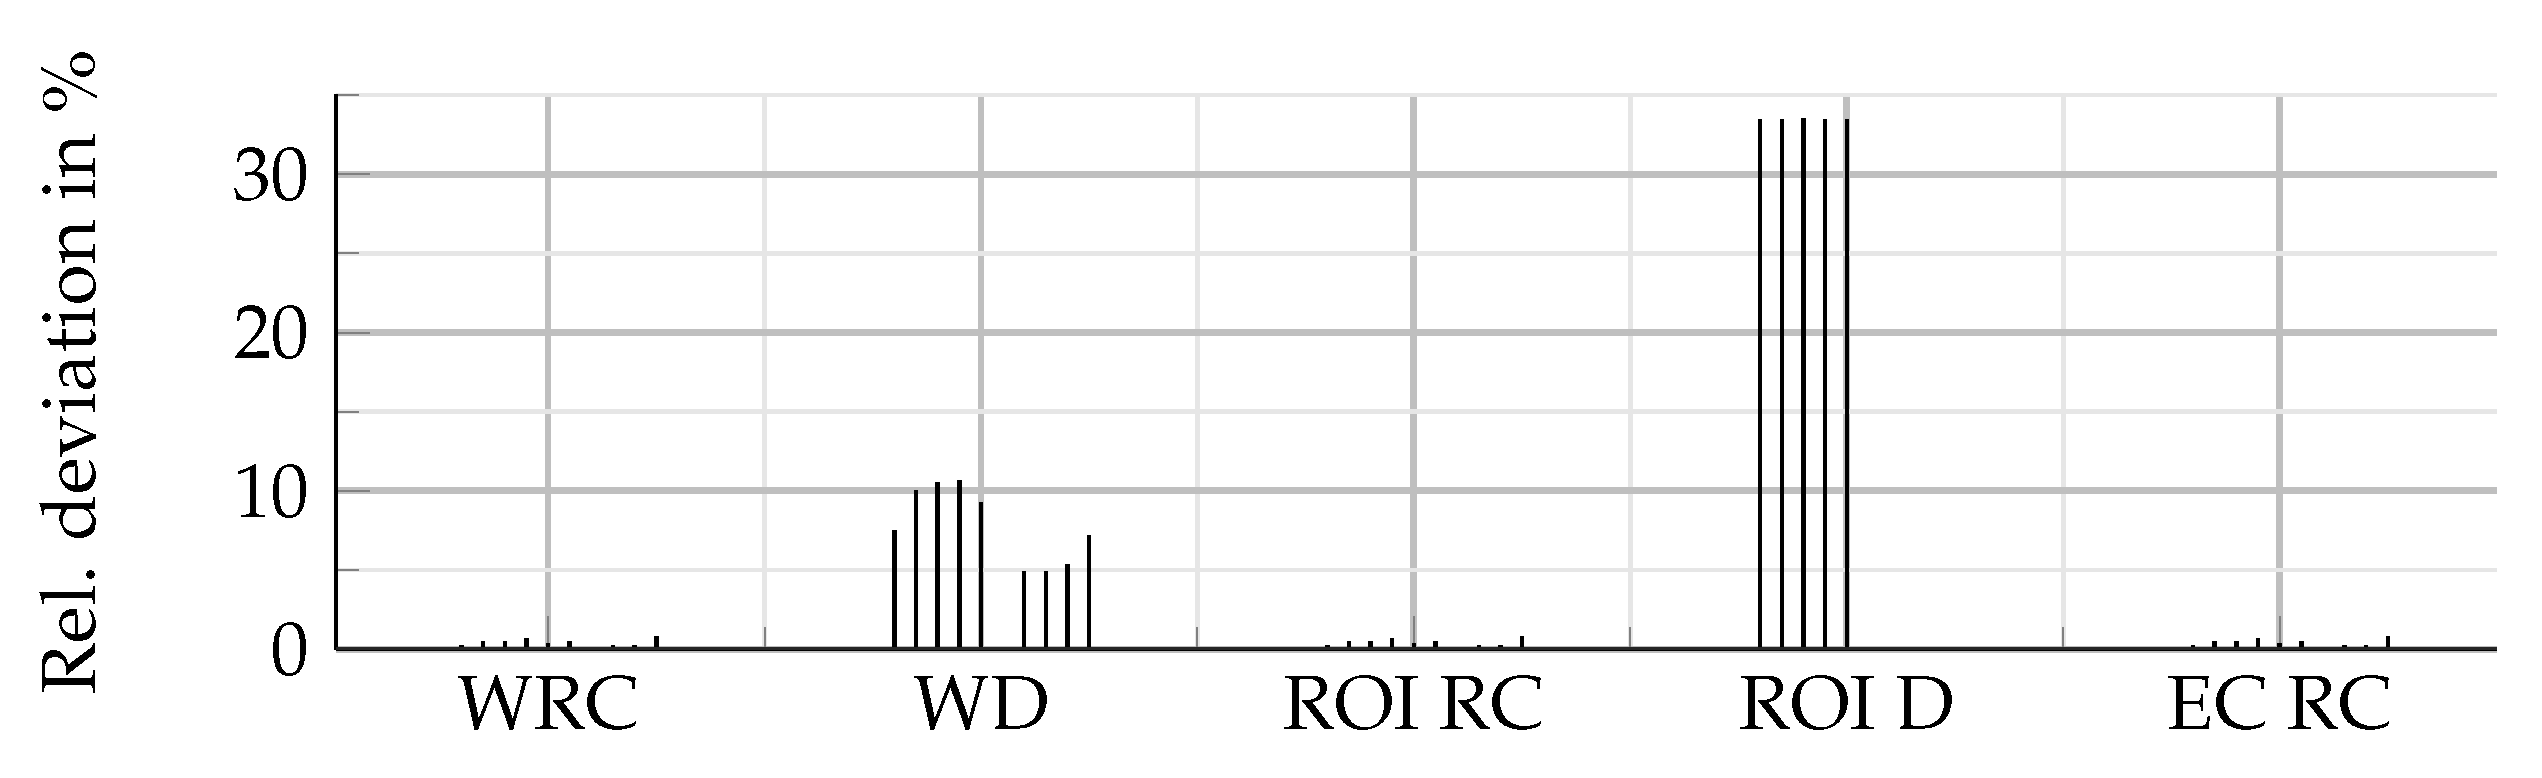
Figure 17.
Edfs of all five measurements for the XC90 () and the XC90 rotated () each on the radar cuboid level. The number of aggregated bins is listed below the diagram. On the right side the box plot for and in dB is shown.
) and the XC90 rotated () each on the radar cuboid level. The number of aggregated bins is listed below the diagram. On the right side the box plot for and in dB is shown.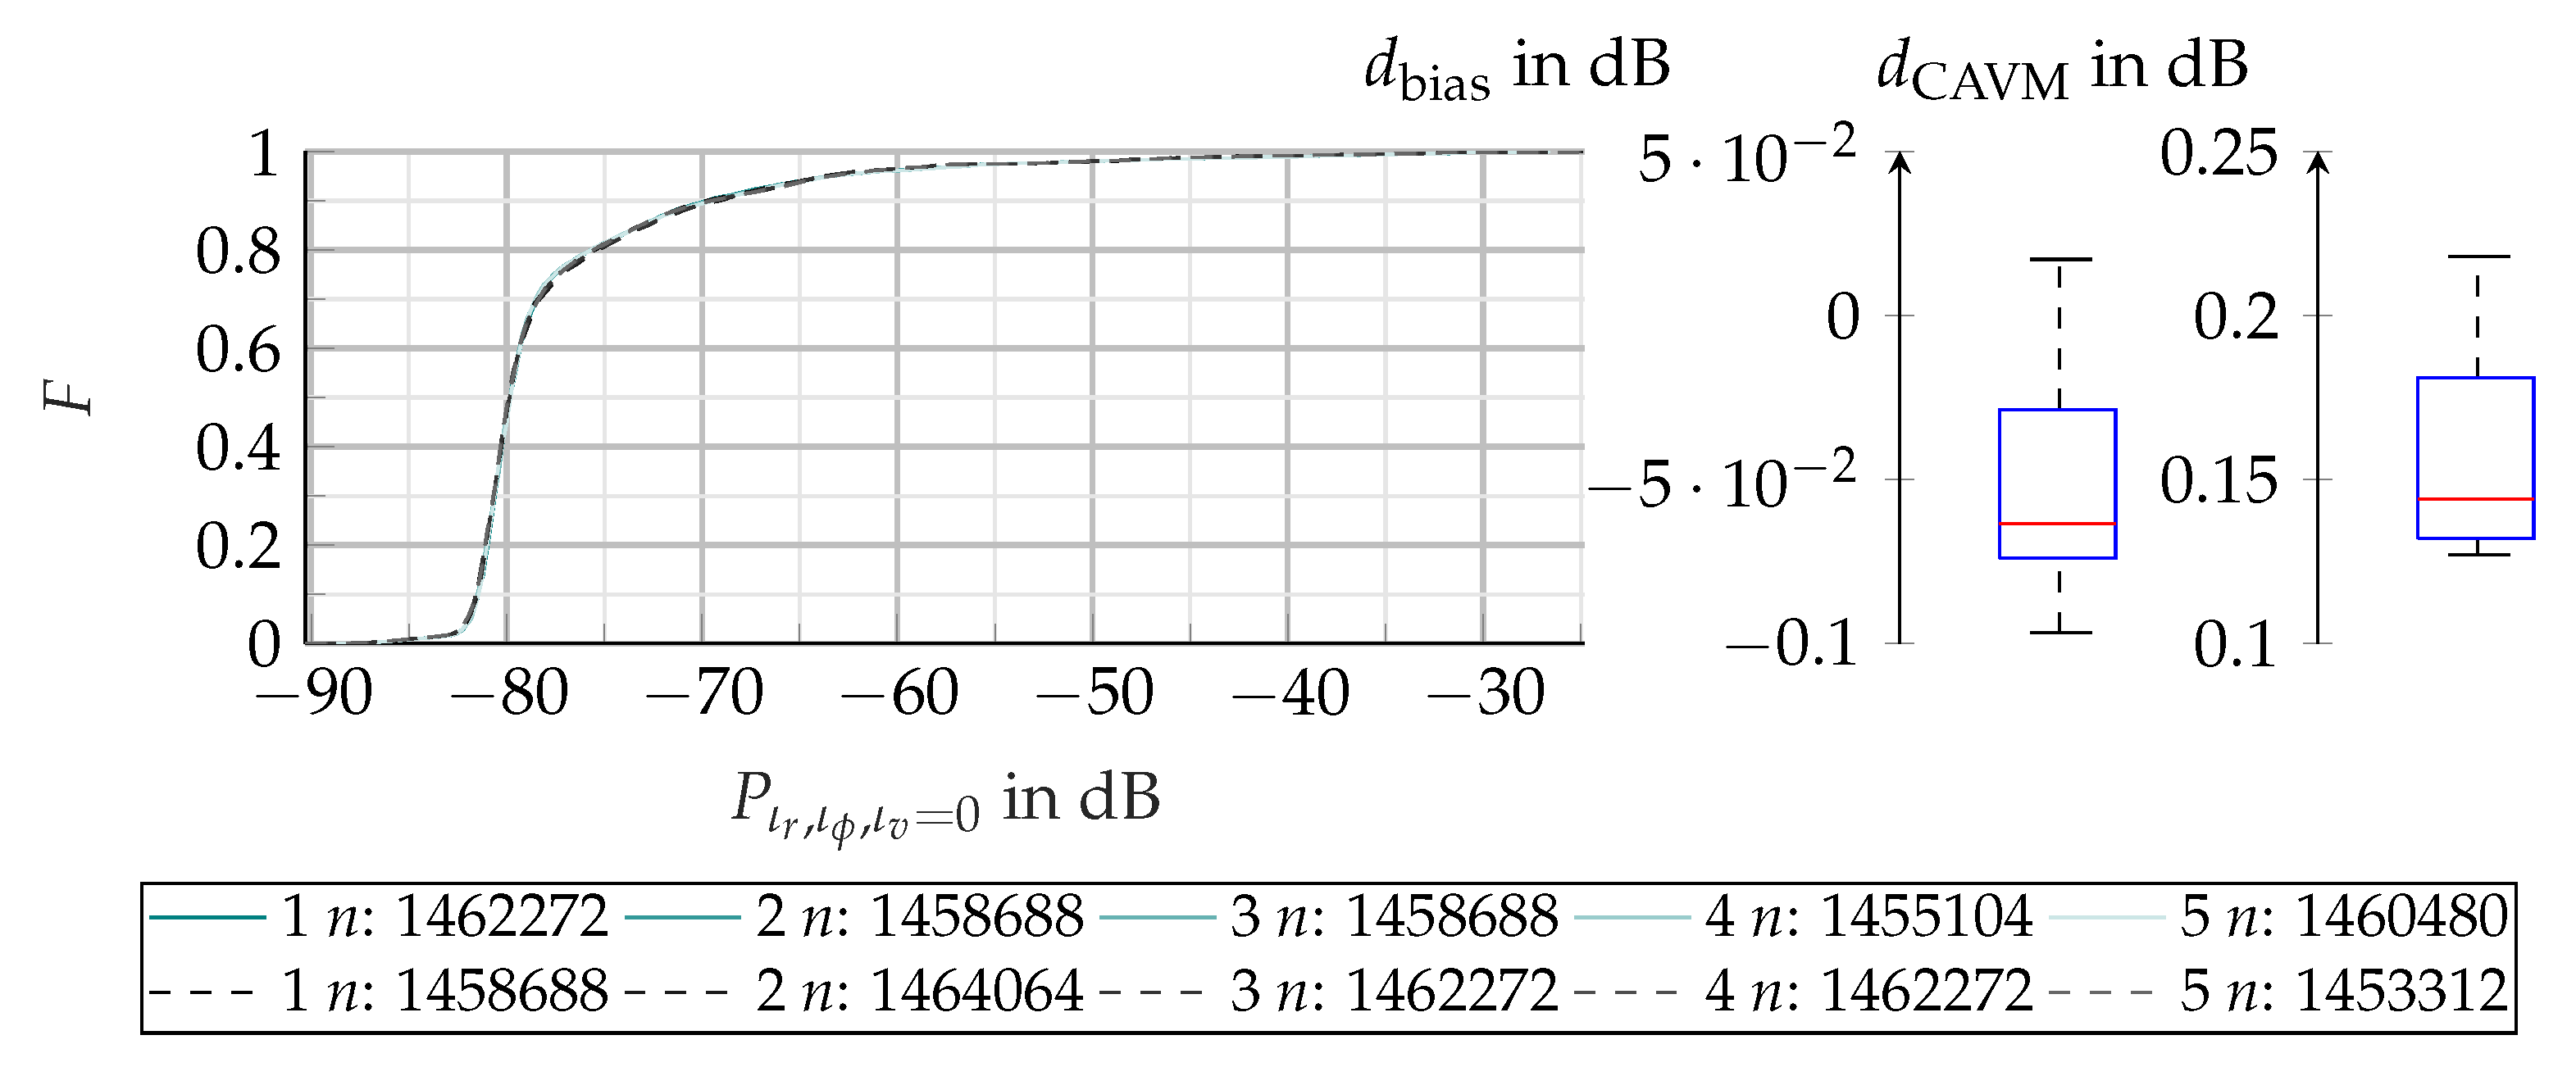
Figure 18.
Edfs of all five measurements of the XC90 () and the rotated XC90 () on the radar cuboid level filterd by an roi are shown in the diagram. The power distribution with the corresponding box plot for and is visualized on the right side. The aggregated number of bins is listed below the diagram.
) and the rotated XC90 () on the radar cuboid level filterd by an roi are shown in the diagram. The power distribution with the corresponding box plot for and is visualized on the right side. The aggregated number of bins is listed below the diagram.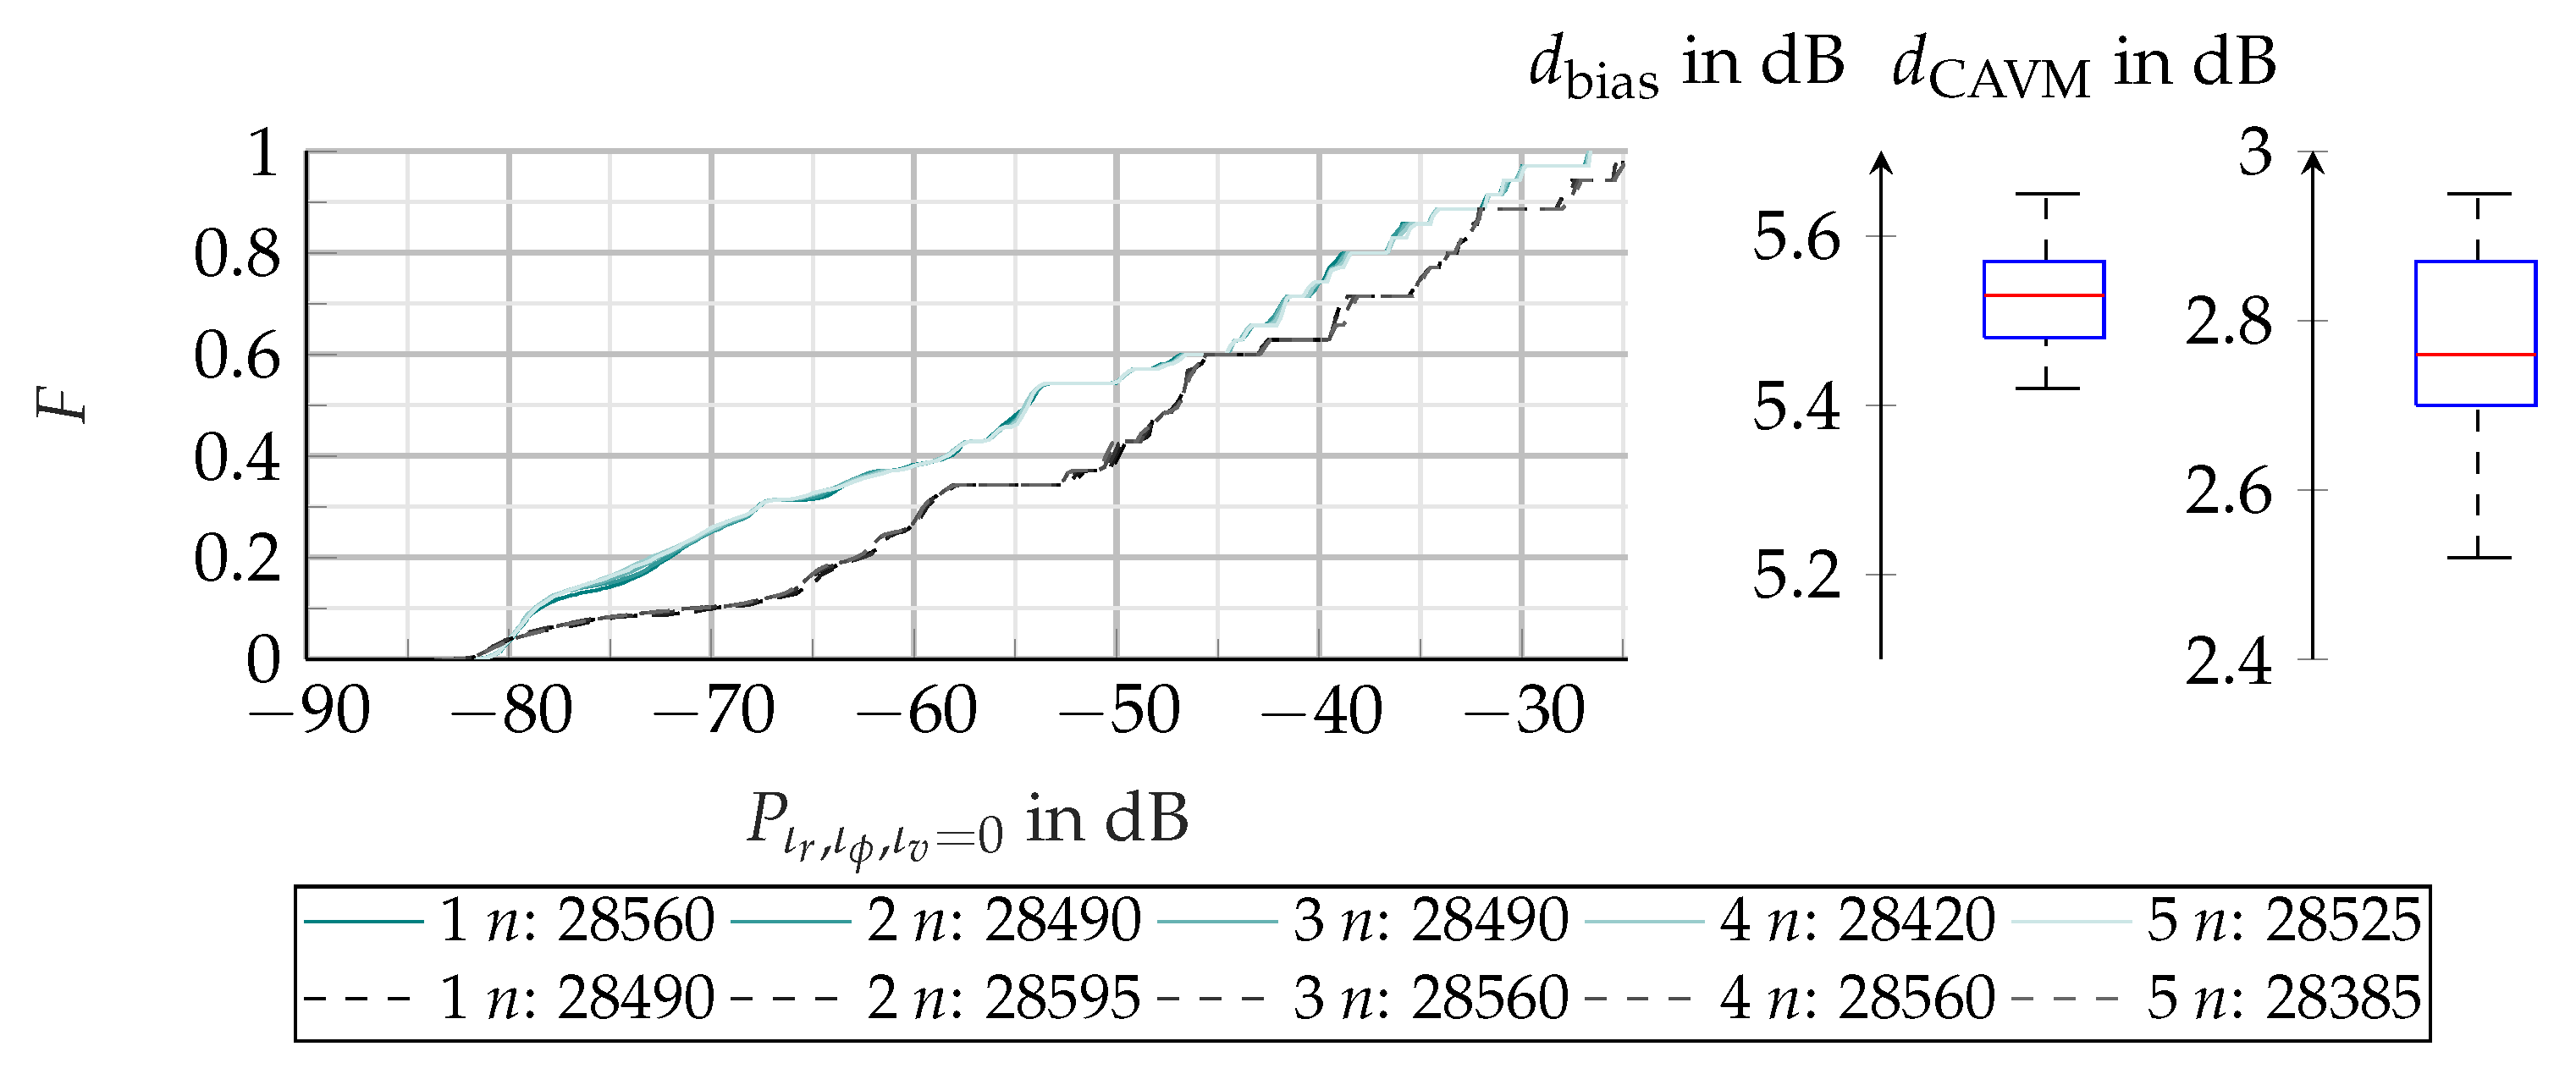
Figure 19.
Satellite image fused with and coded in colors for each range azimuth bin. The object under examination is a Volvo XC90 with different yaw angles. The red circle visualizes the center of the vehicle’s bounding box.
Figure 19.
Satellite image fused with and coded in colors for each range azimuth bin. The object under examination is a Volvo XC90 with different yaw angles. The red circle visualizes the center of the vehicle’s bounding box.
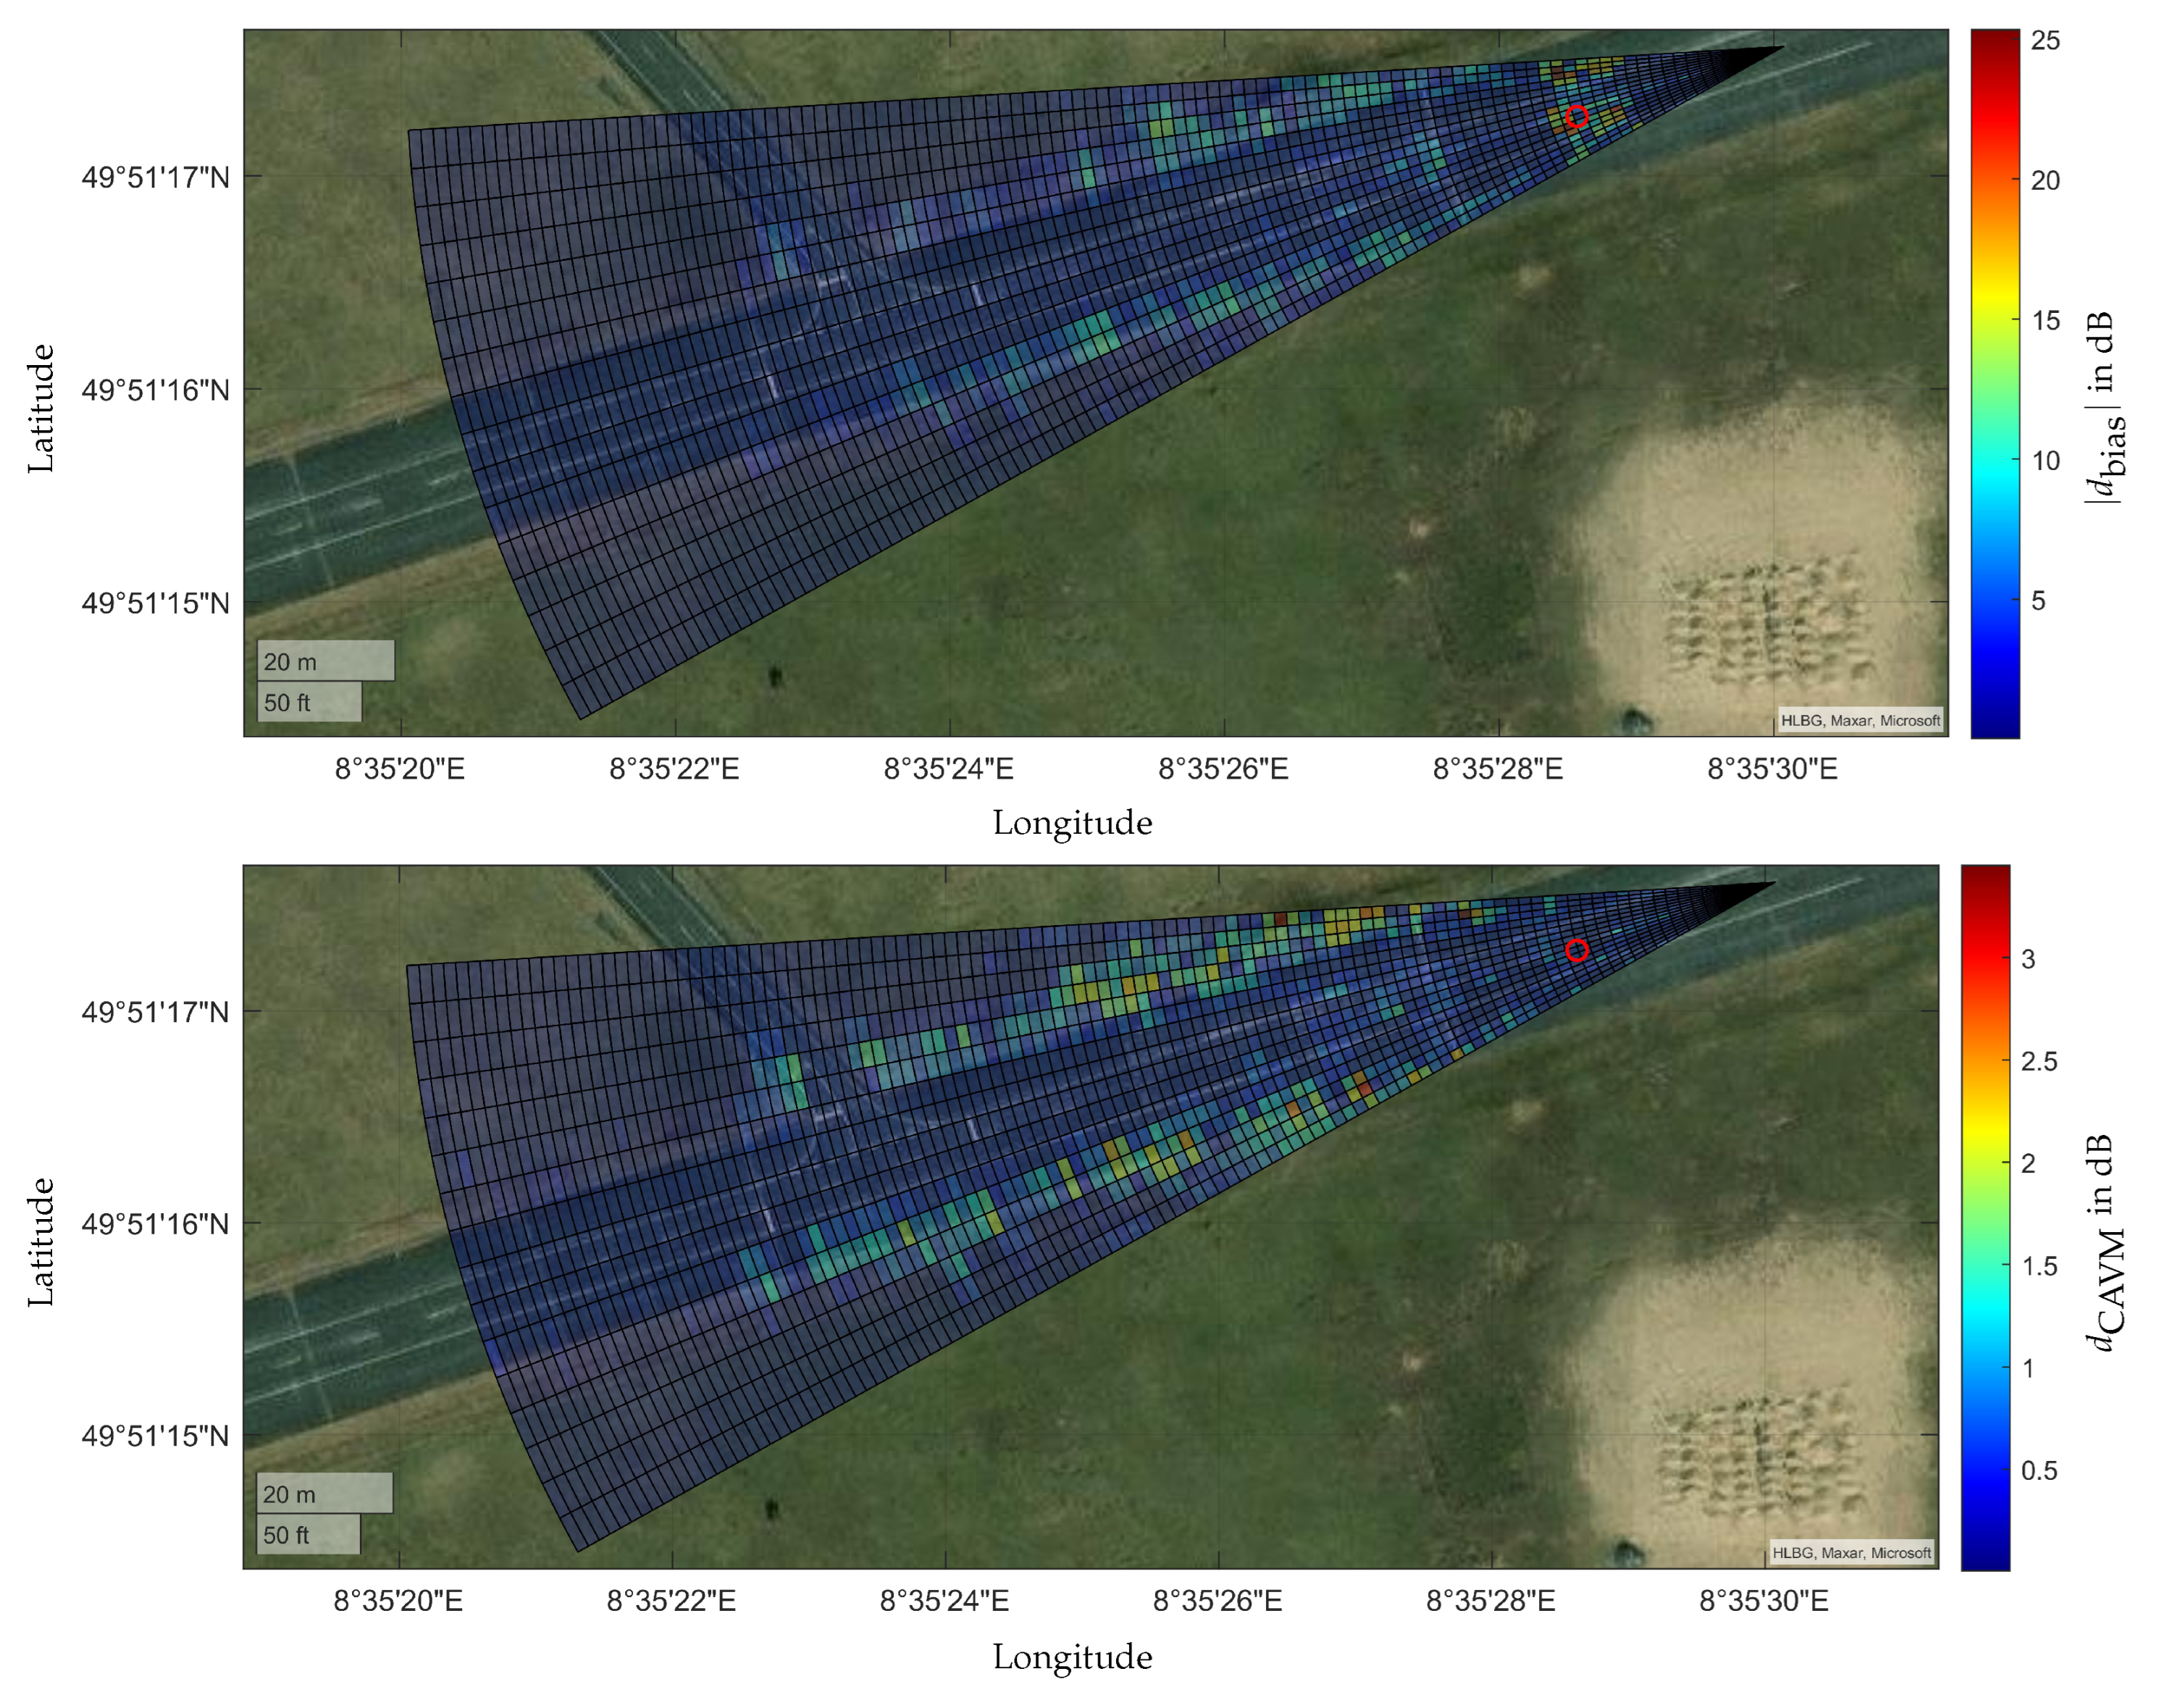
Figure 20.
Plot of the relative deviation for the number of the data points of all measurements of the two experiments (XC90 and Vito). The WRC, WD, the ROI for the ROI RC and the ROI D, as well as EB RC are visualized. Experiment 1 is denoted as and experiment 2 as . The gradations of the respective color delineate the different measurements.
and experiment 2 as . The gradations of the respective color delineate the different measurements.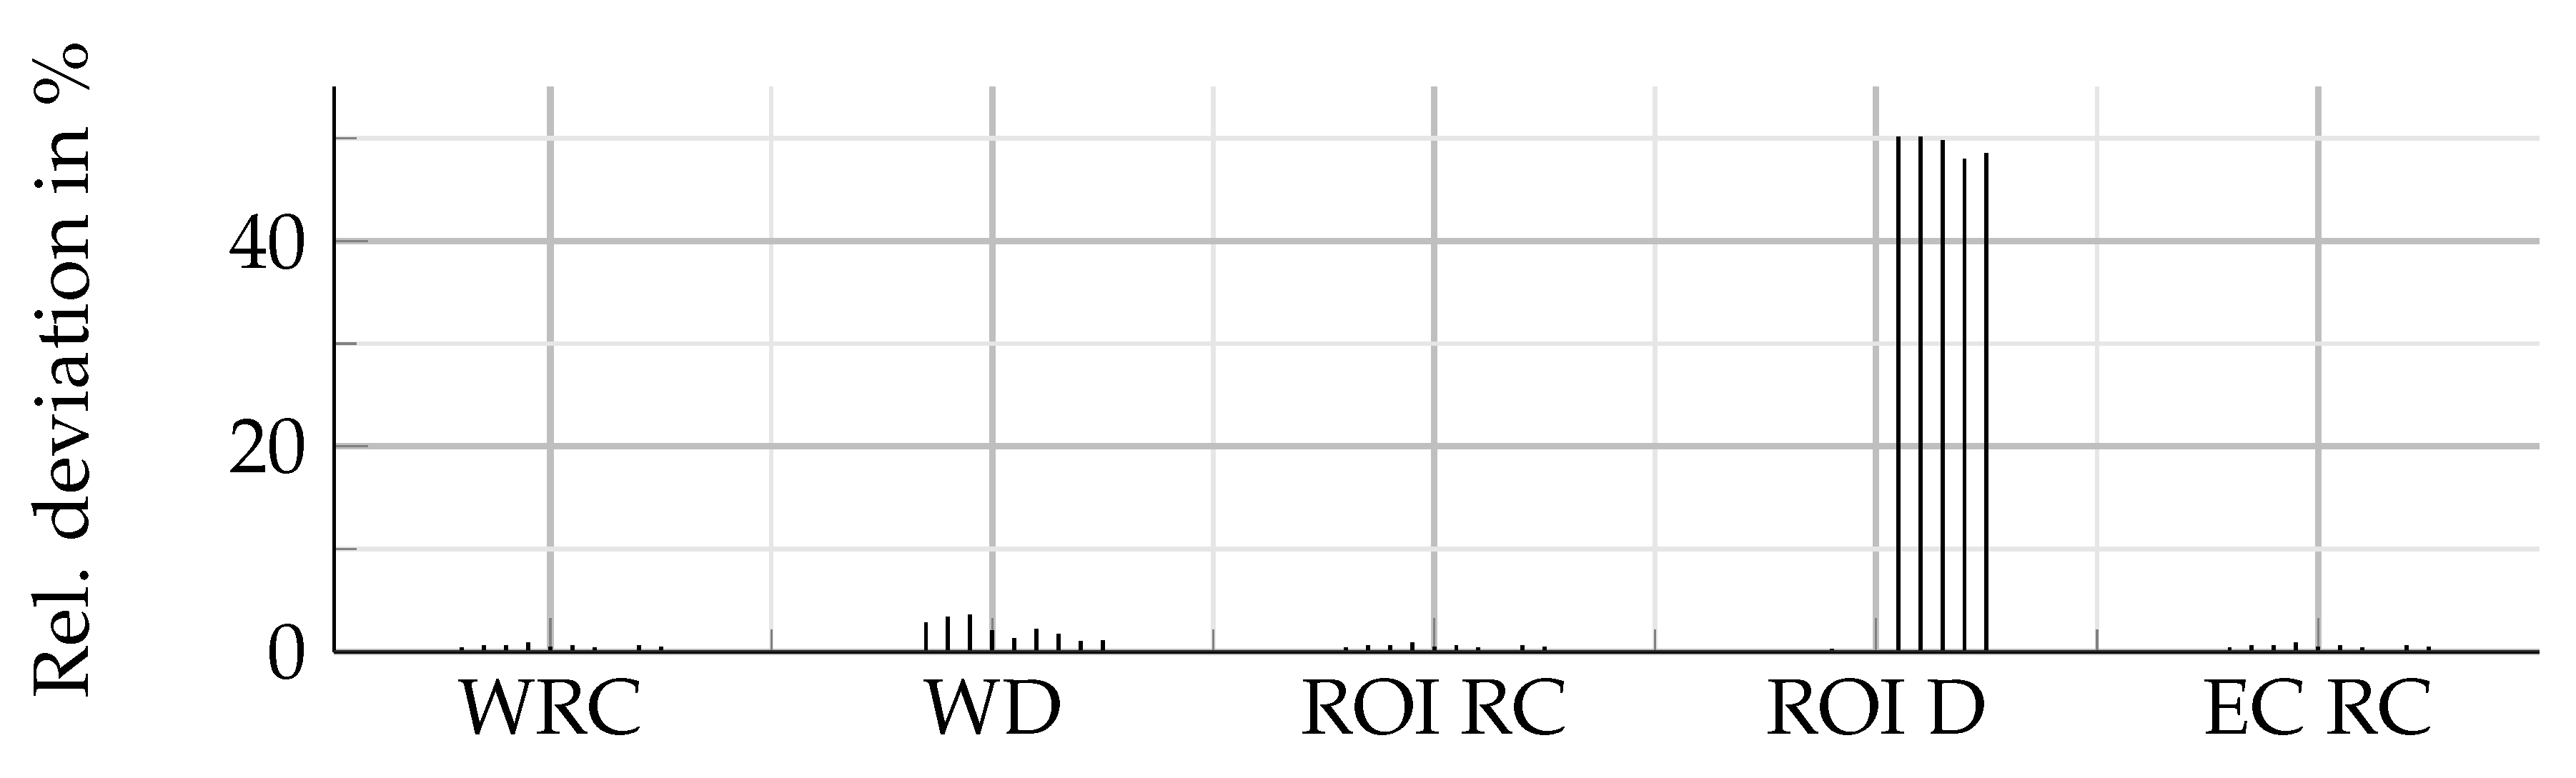
Figure 21.
Edfs of all five measurements for the Volvo XC90 () and the Mercedes Vito () each on the radar cuboid level. The number of aggregated bins is listed below the diagram. On the right side the box plot for and in dB is shown.
) and the Mercedes Vito () each on the radar cuboid level. The number of aggregated bins is listed below the diagram. On the right side the box plot for and in dB is shown.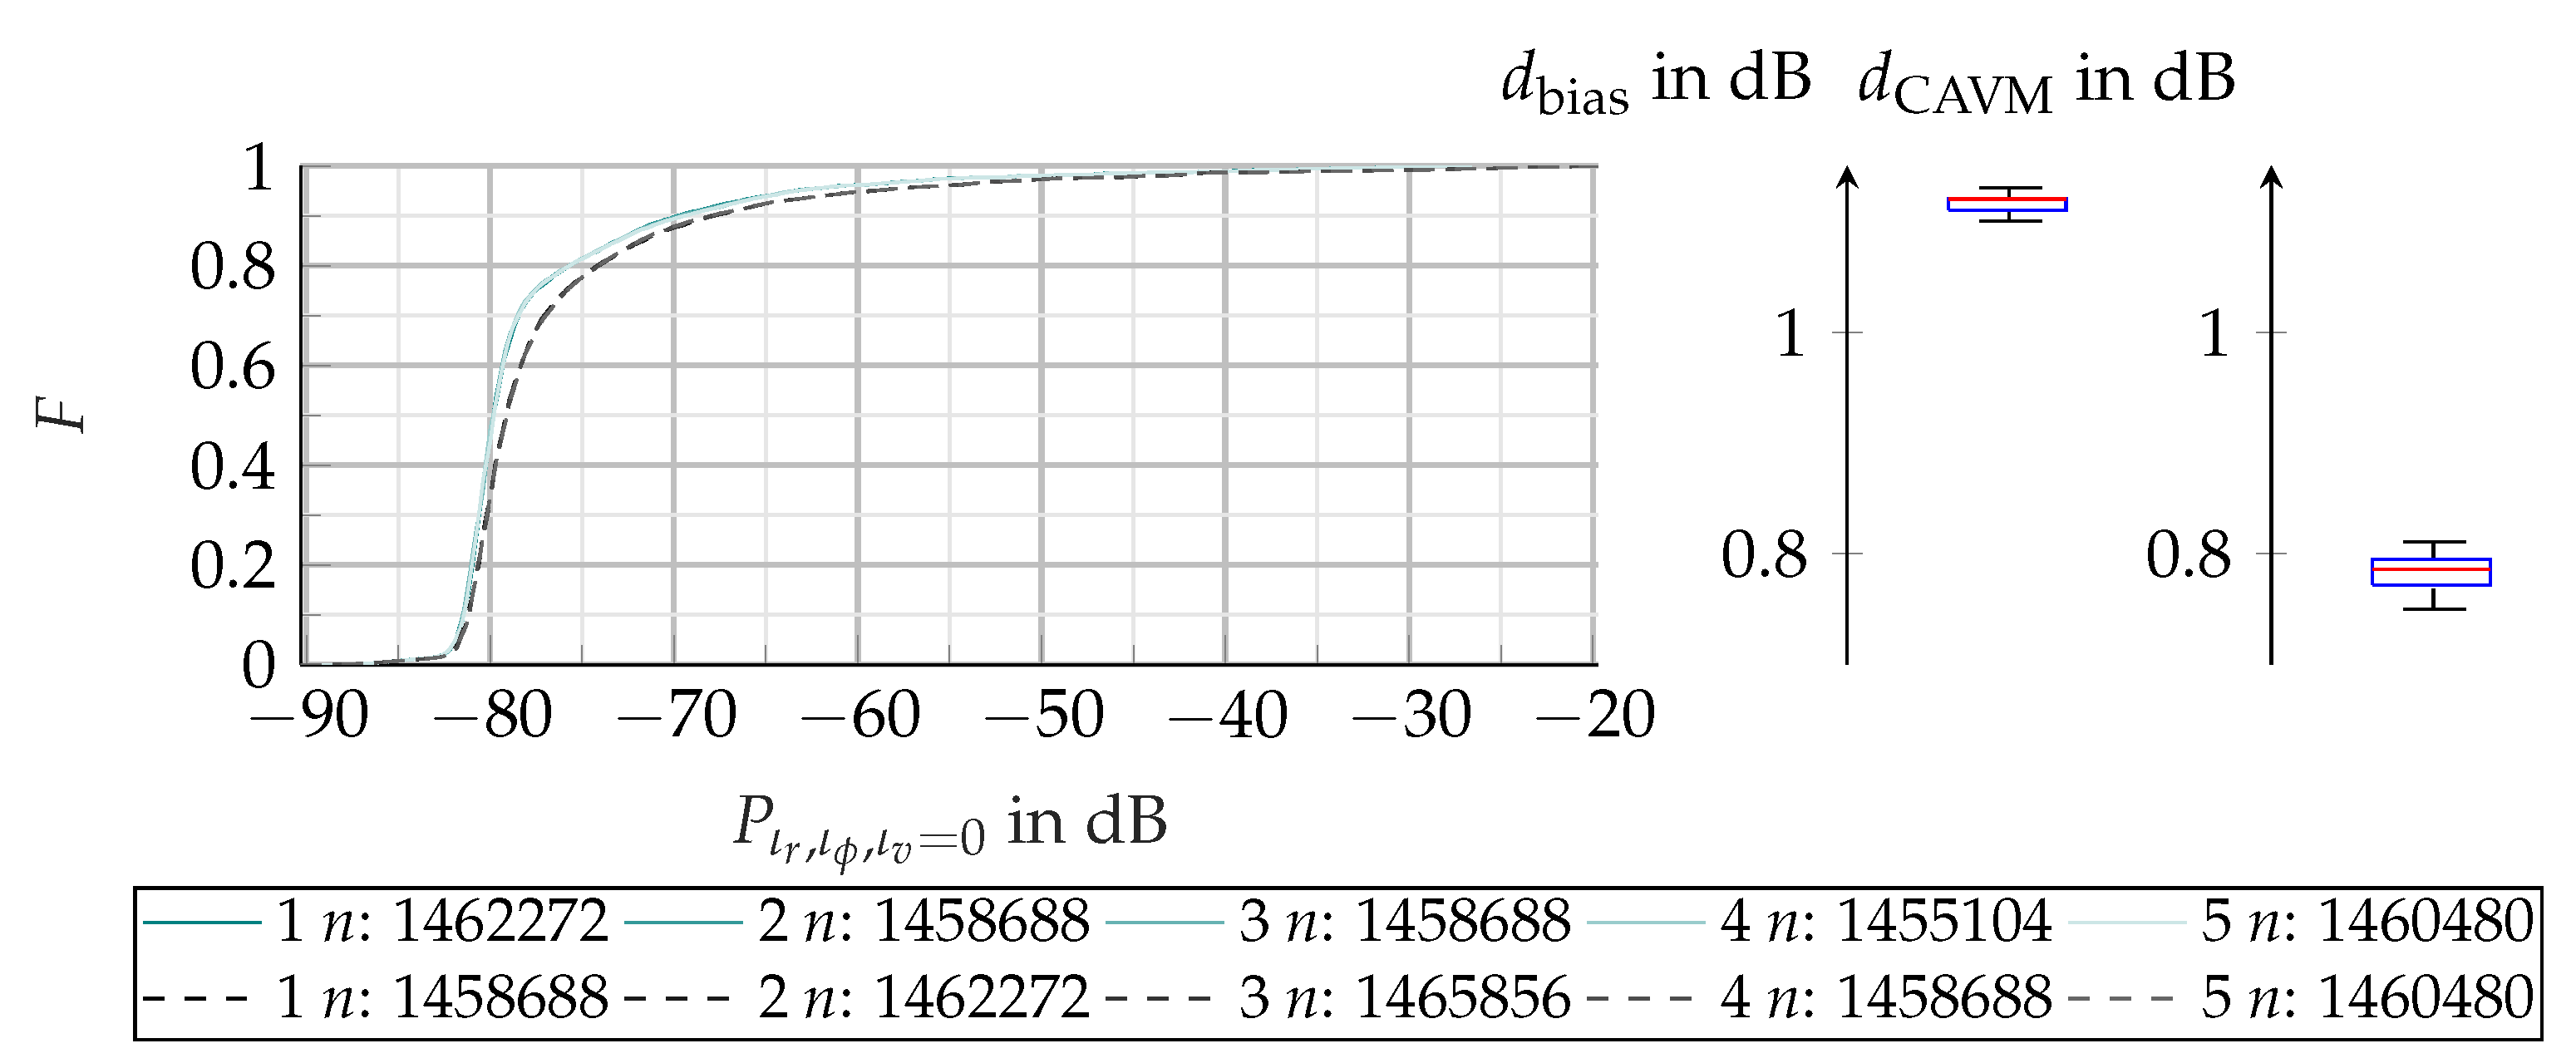
Figure 22.
Edfs of all five measurements of the XC90 () and Vito () on the detection level. In the first row the distance distribution, in the second row the azimuth distribution and in the third row the rcs distribution with the corresponding box plot for and are shown. The aggregated number of detections is listed below the diagrams.
) and Vito () on the detection level. In the first row the distance distribution, in the second row the azimuth distribution and in the third row the rcs distribution with the corresponding box plot for and are shown. The aggregated number of detections is listed below the diagrams.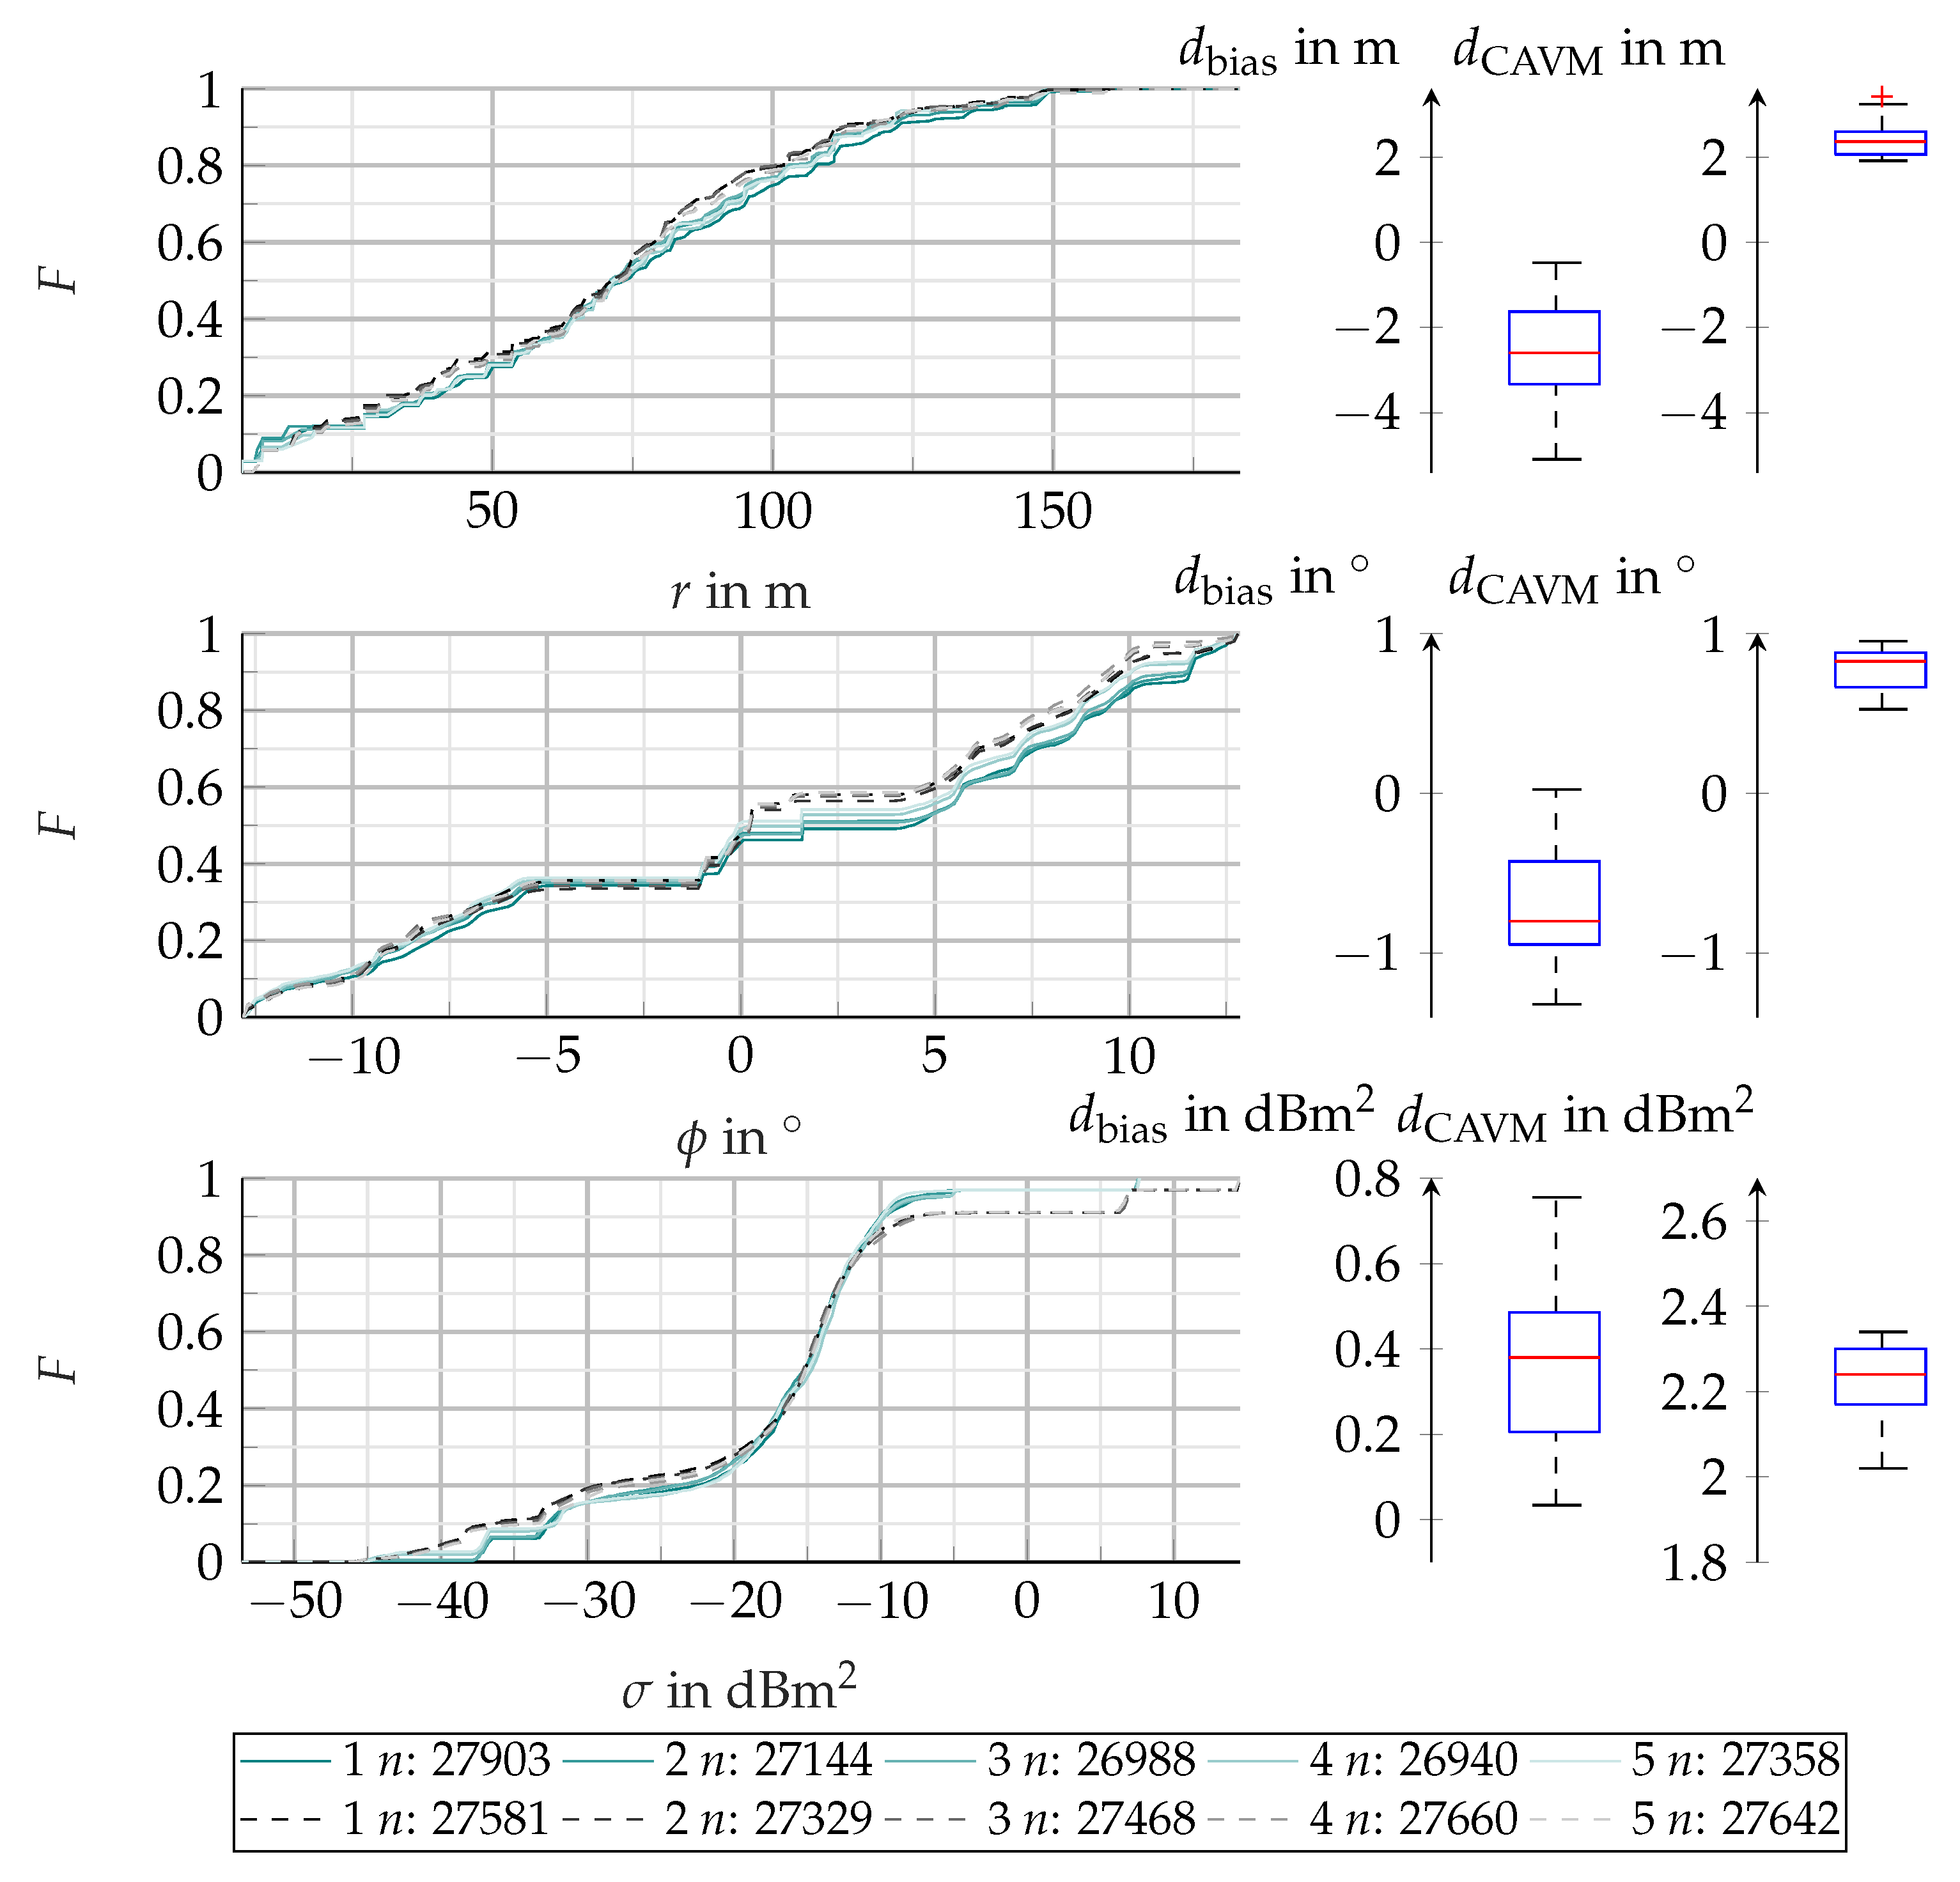
Figure 23.
Edfs of all five measurements of the Volvo XC90 () and Mercedes Vito () on the radar cuboid level filterd by an roi are shown in the diagram. The power distribution with the corresponding box plot for and is visualized on the right side. The aggregated number of bins is listed below the diagram.
) and Mercedes Vito () on the radar cuboid level filterd by an roi are shown in the diagram. The power distribution with the corresponding box plot for and is visualized on the right side. The aggregated number of bins is listed below the diagram.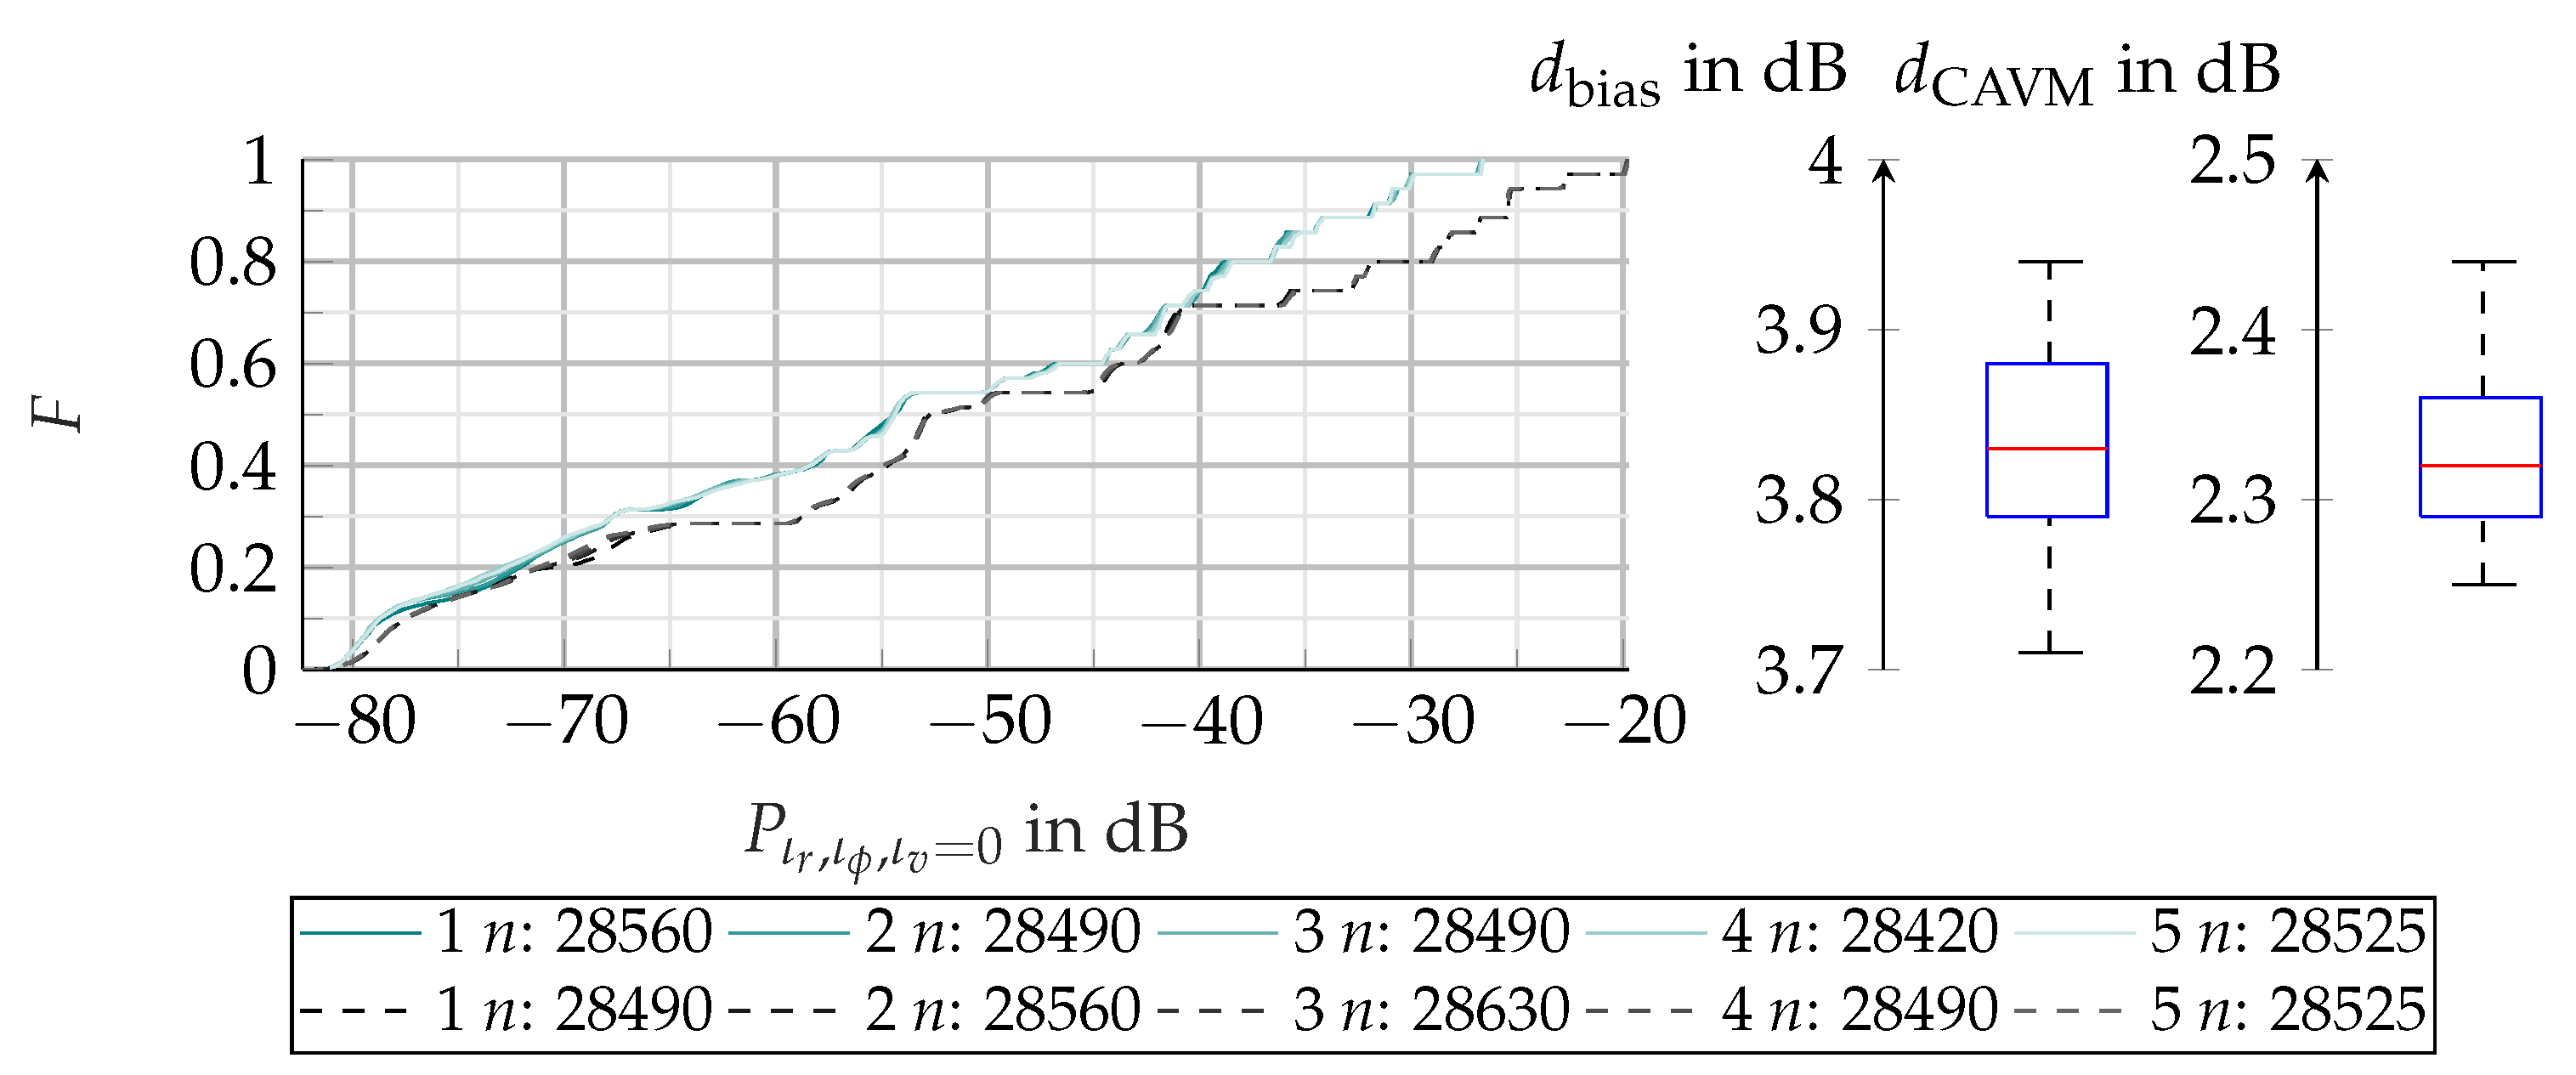
Figure 24.
Satellite image fused with and coded in colors for each range azimuth bin. The object under examination is a Volvo XC90 and a Mercedes Vito at the same position and orientation. The red circle visualizes the center of the vehicles’ bounding boxes.
Figure 24.
Satellite image fused with and coded in colors for each range azimuth bin. The object under examination is a Volvo XC90 and a Mercedes Vito at the same position and orientation. The red circle visualizes the center of the vehicles’ bounding boxes.
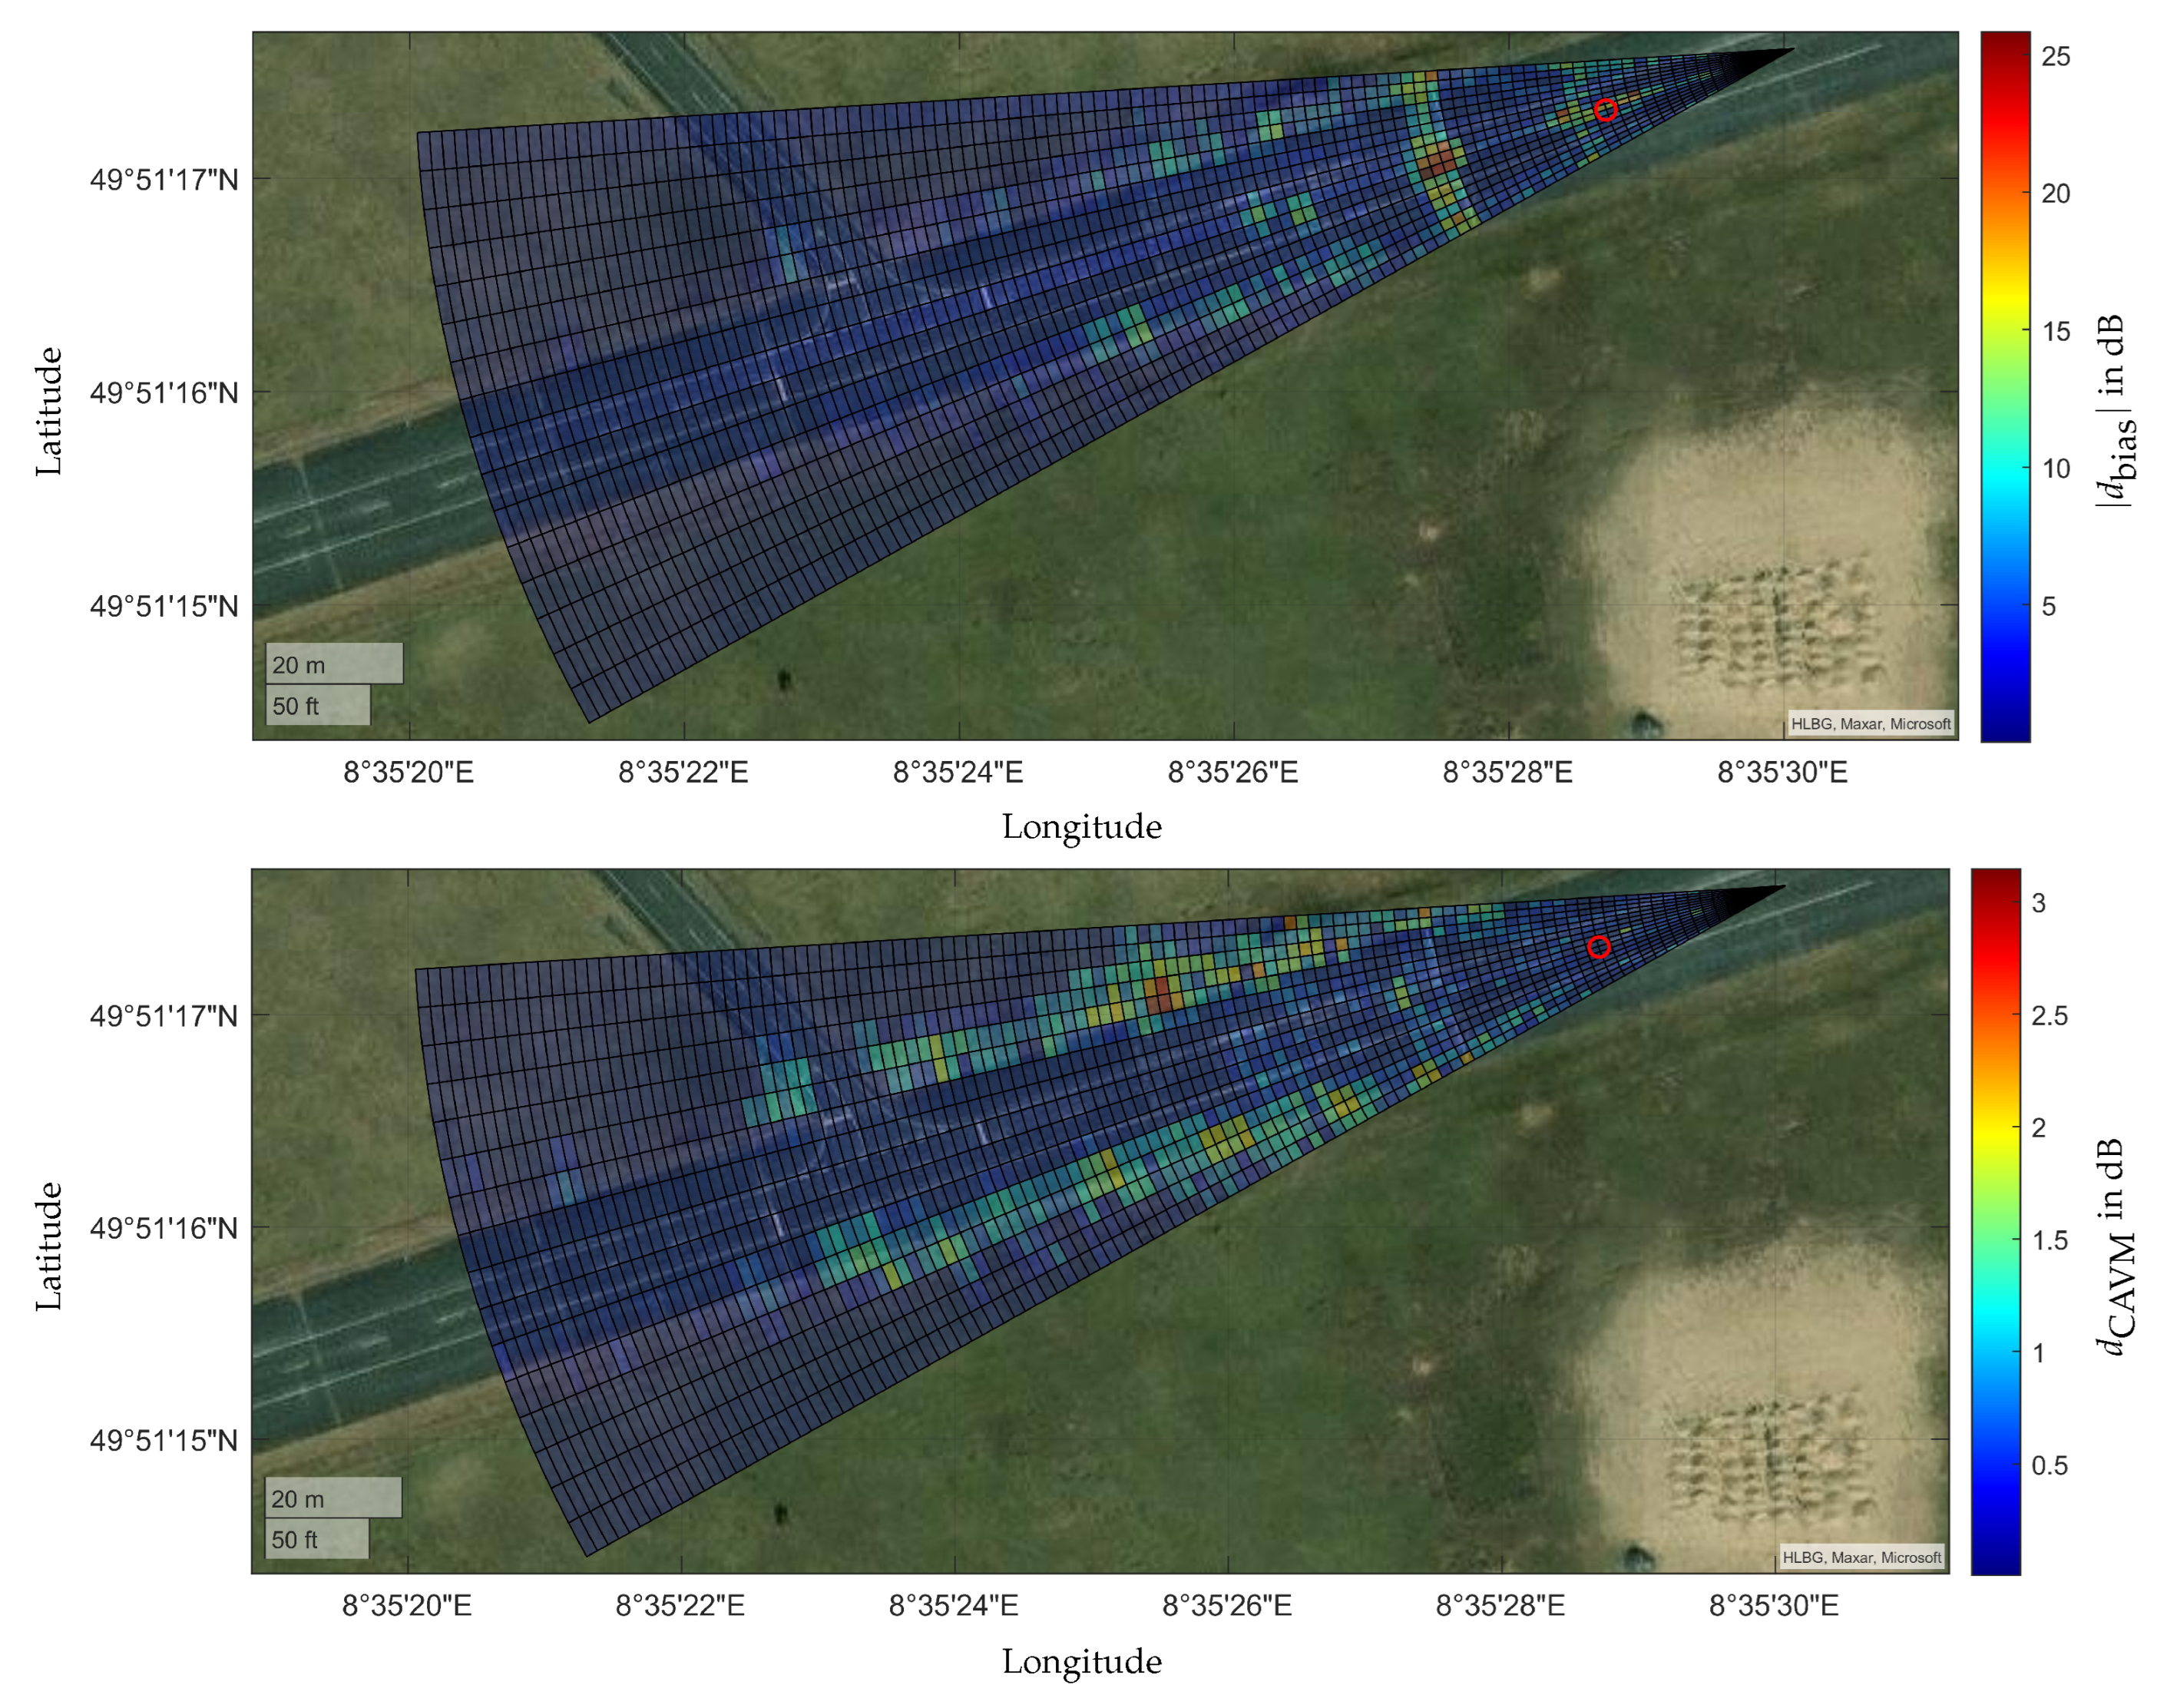
Figure 25.
Plot of the relative deviation for the number of the data points of all measurements of the two experiments (XC90 and XC90 with rain). The WRC, WD, the ROI for the ROI RC and the ROI D, as well as EB RC are compared. Experiment 1 is denoted as and experiment 2 as . The gradations of the respective color delineate the different measurements.
and experiment 2 as . The gradations of the respective color delineate the different measurements.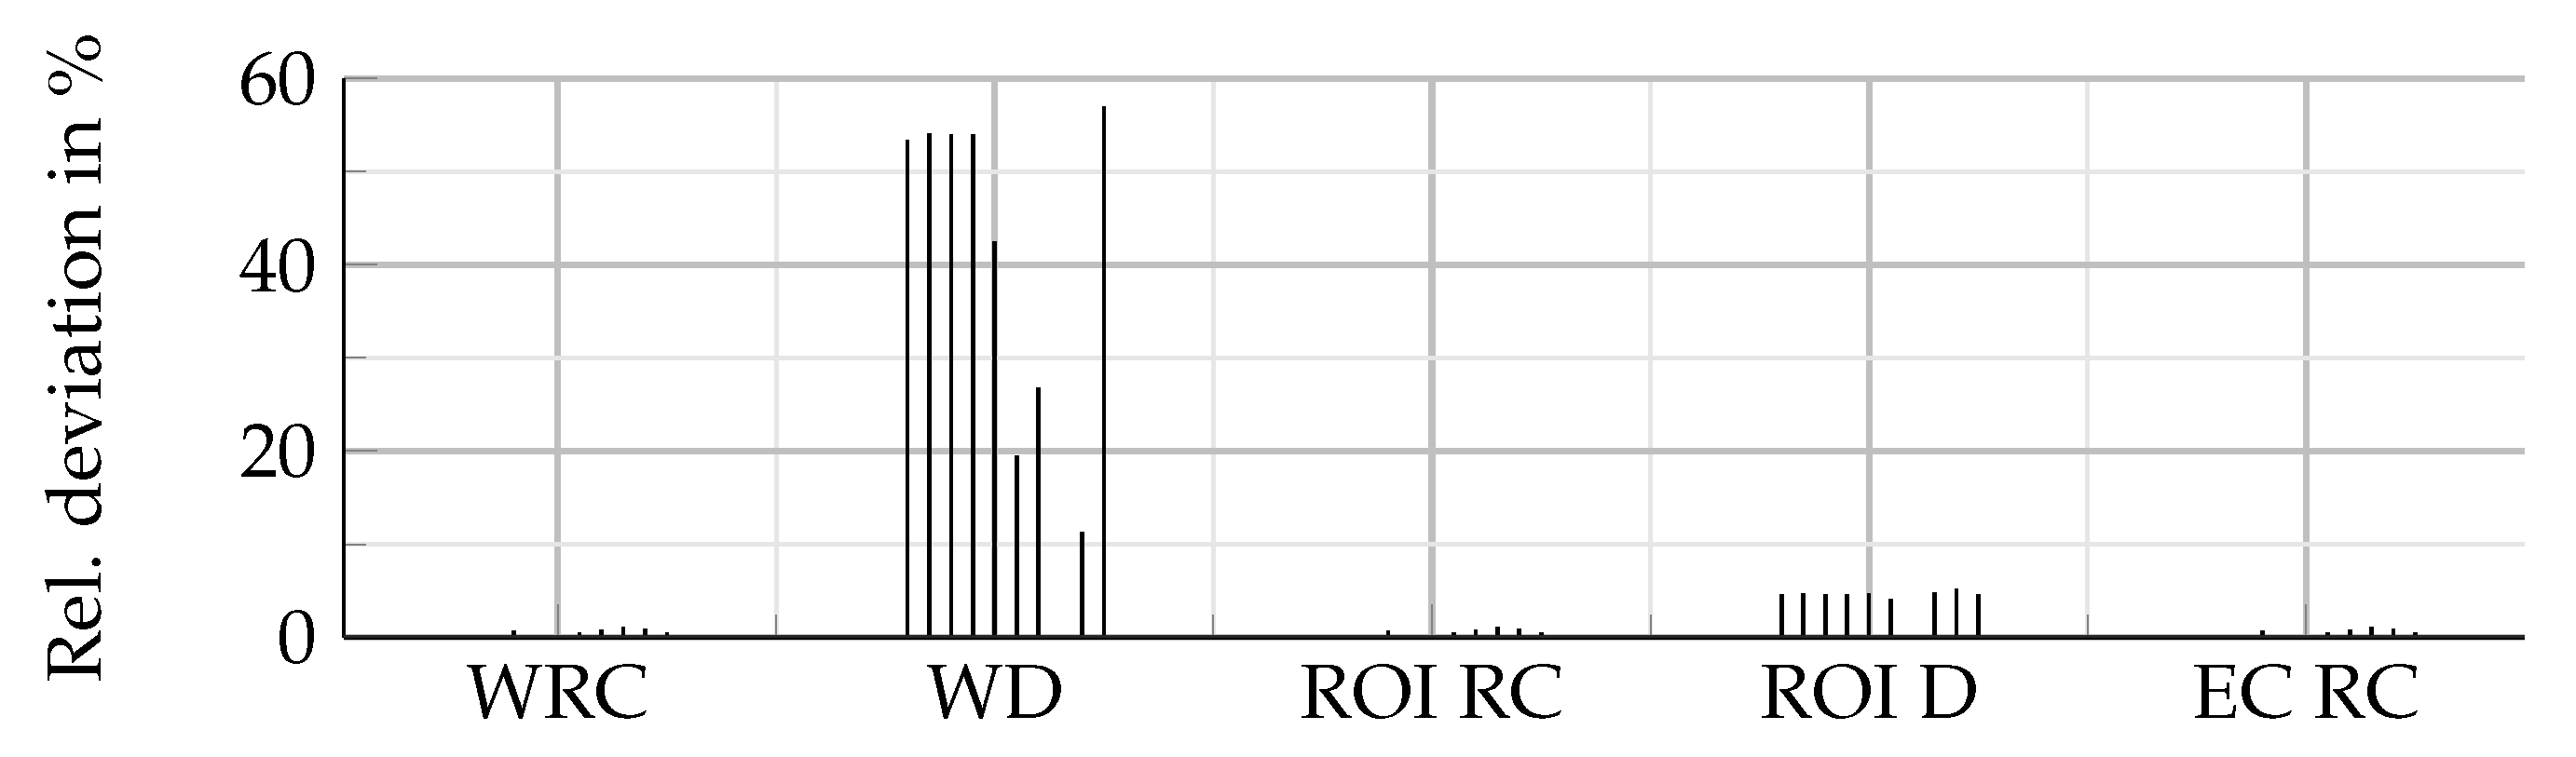
Figure 26.
Edfs of five measurements of the XC90 in dry () and rainy () conditions on the radar cuboid level. The number of aggregated bins is listed below the diagram. On the right side the box plot for and in dB is shown.
) and rainy () conditions on the radar cuboid level. The number of aggregated bins is listed below the diagram. On the right side the box plot for and in dB is shown.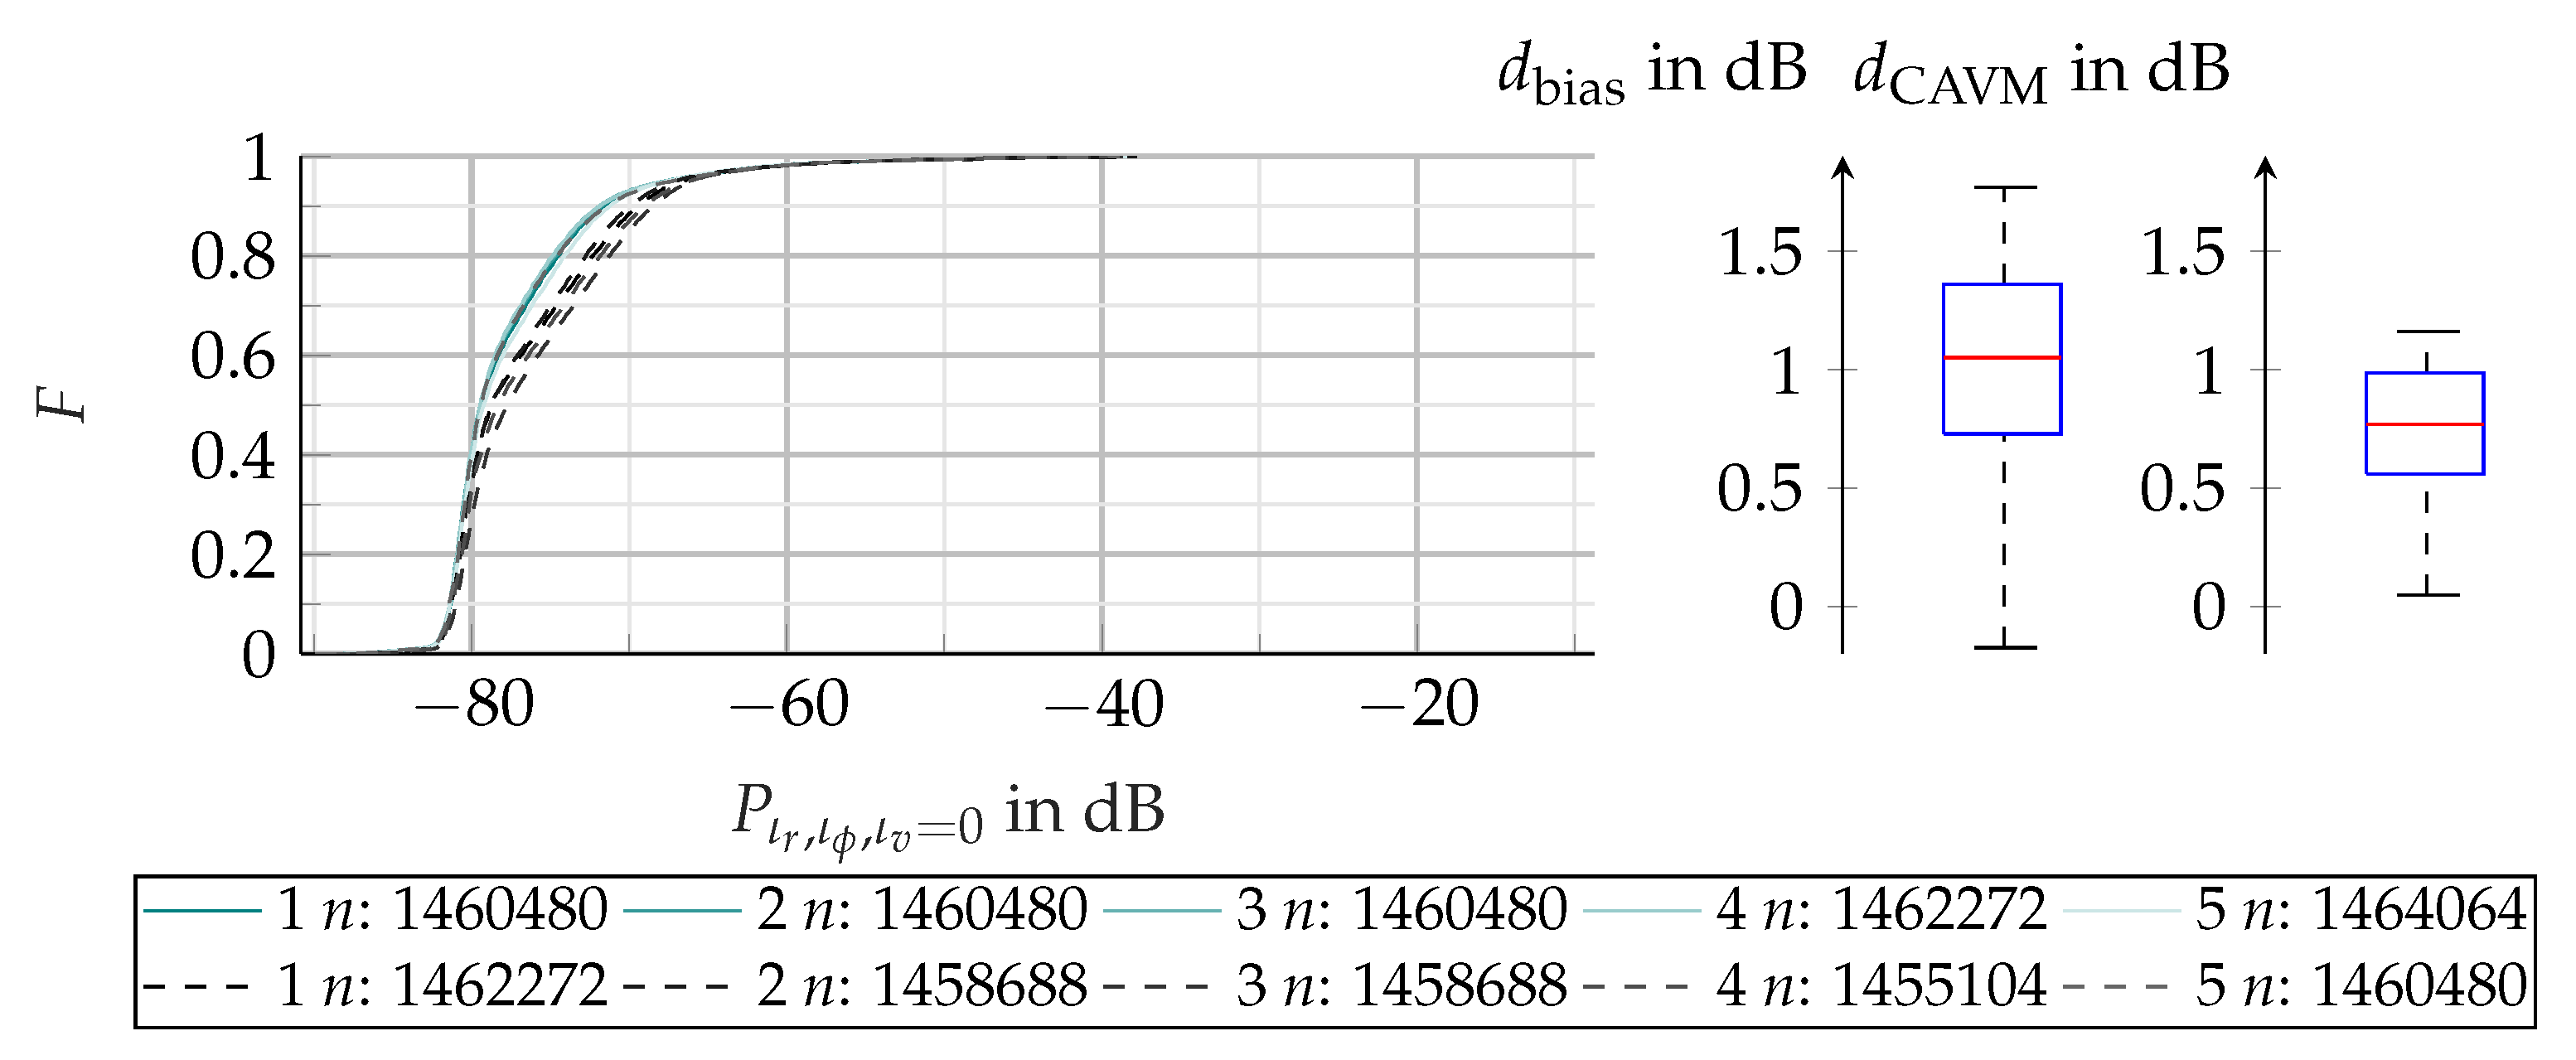
Figure 27.
Satellite image fused with and coded in colors for each range azimuth bin. The object under examination is a Volvo XC90 in rainy and dry conditions. The red circle visualizes the center of the vehicle bounding box.
Figure 27.
Satellite image fused with and coded in colors for each range azimuth bin. The object under examination is a Volvo XC90 in rainy and dry conditions. The red circle visualizes the center of the vehicle bounding box.
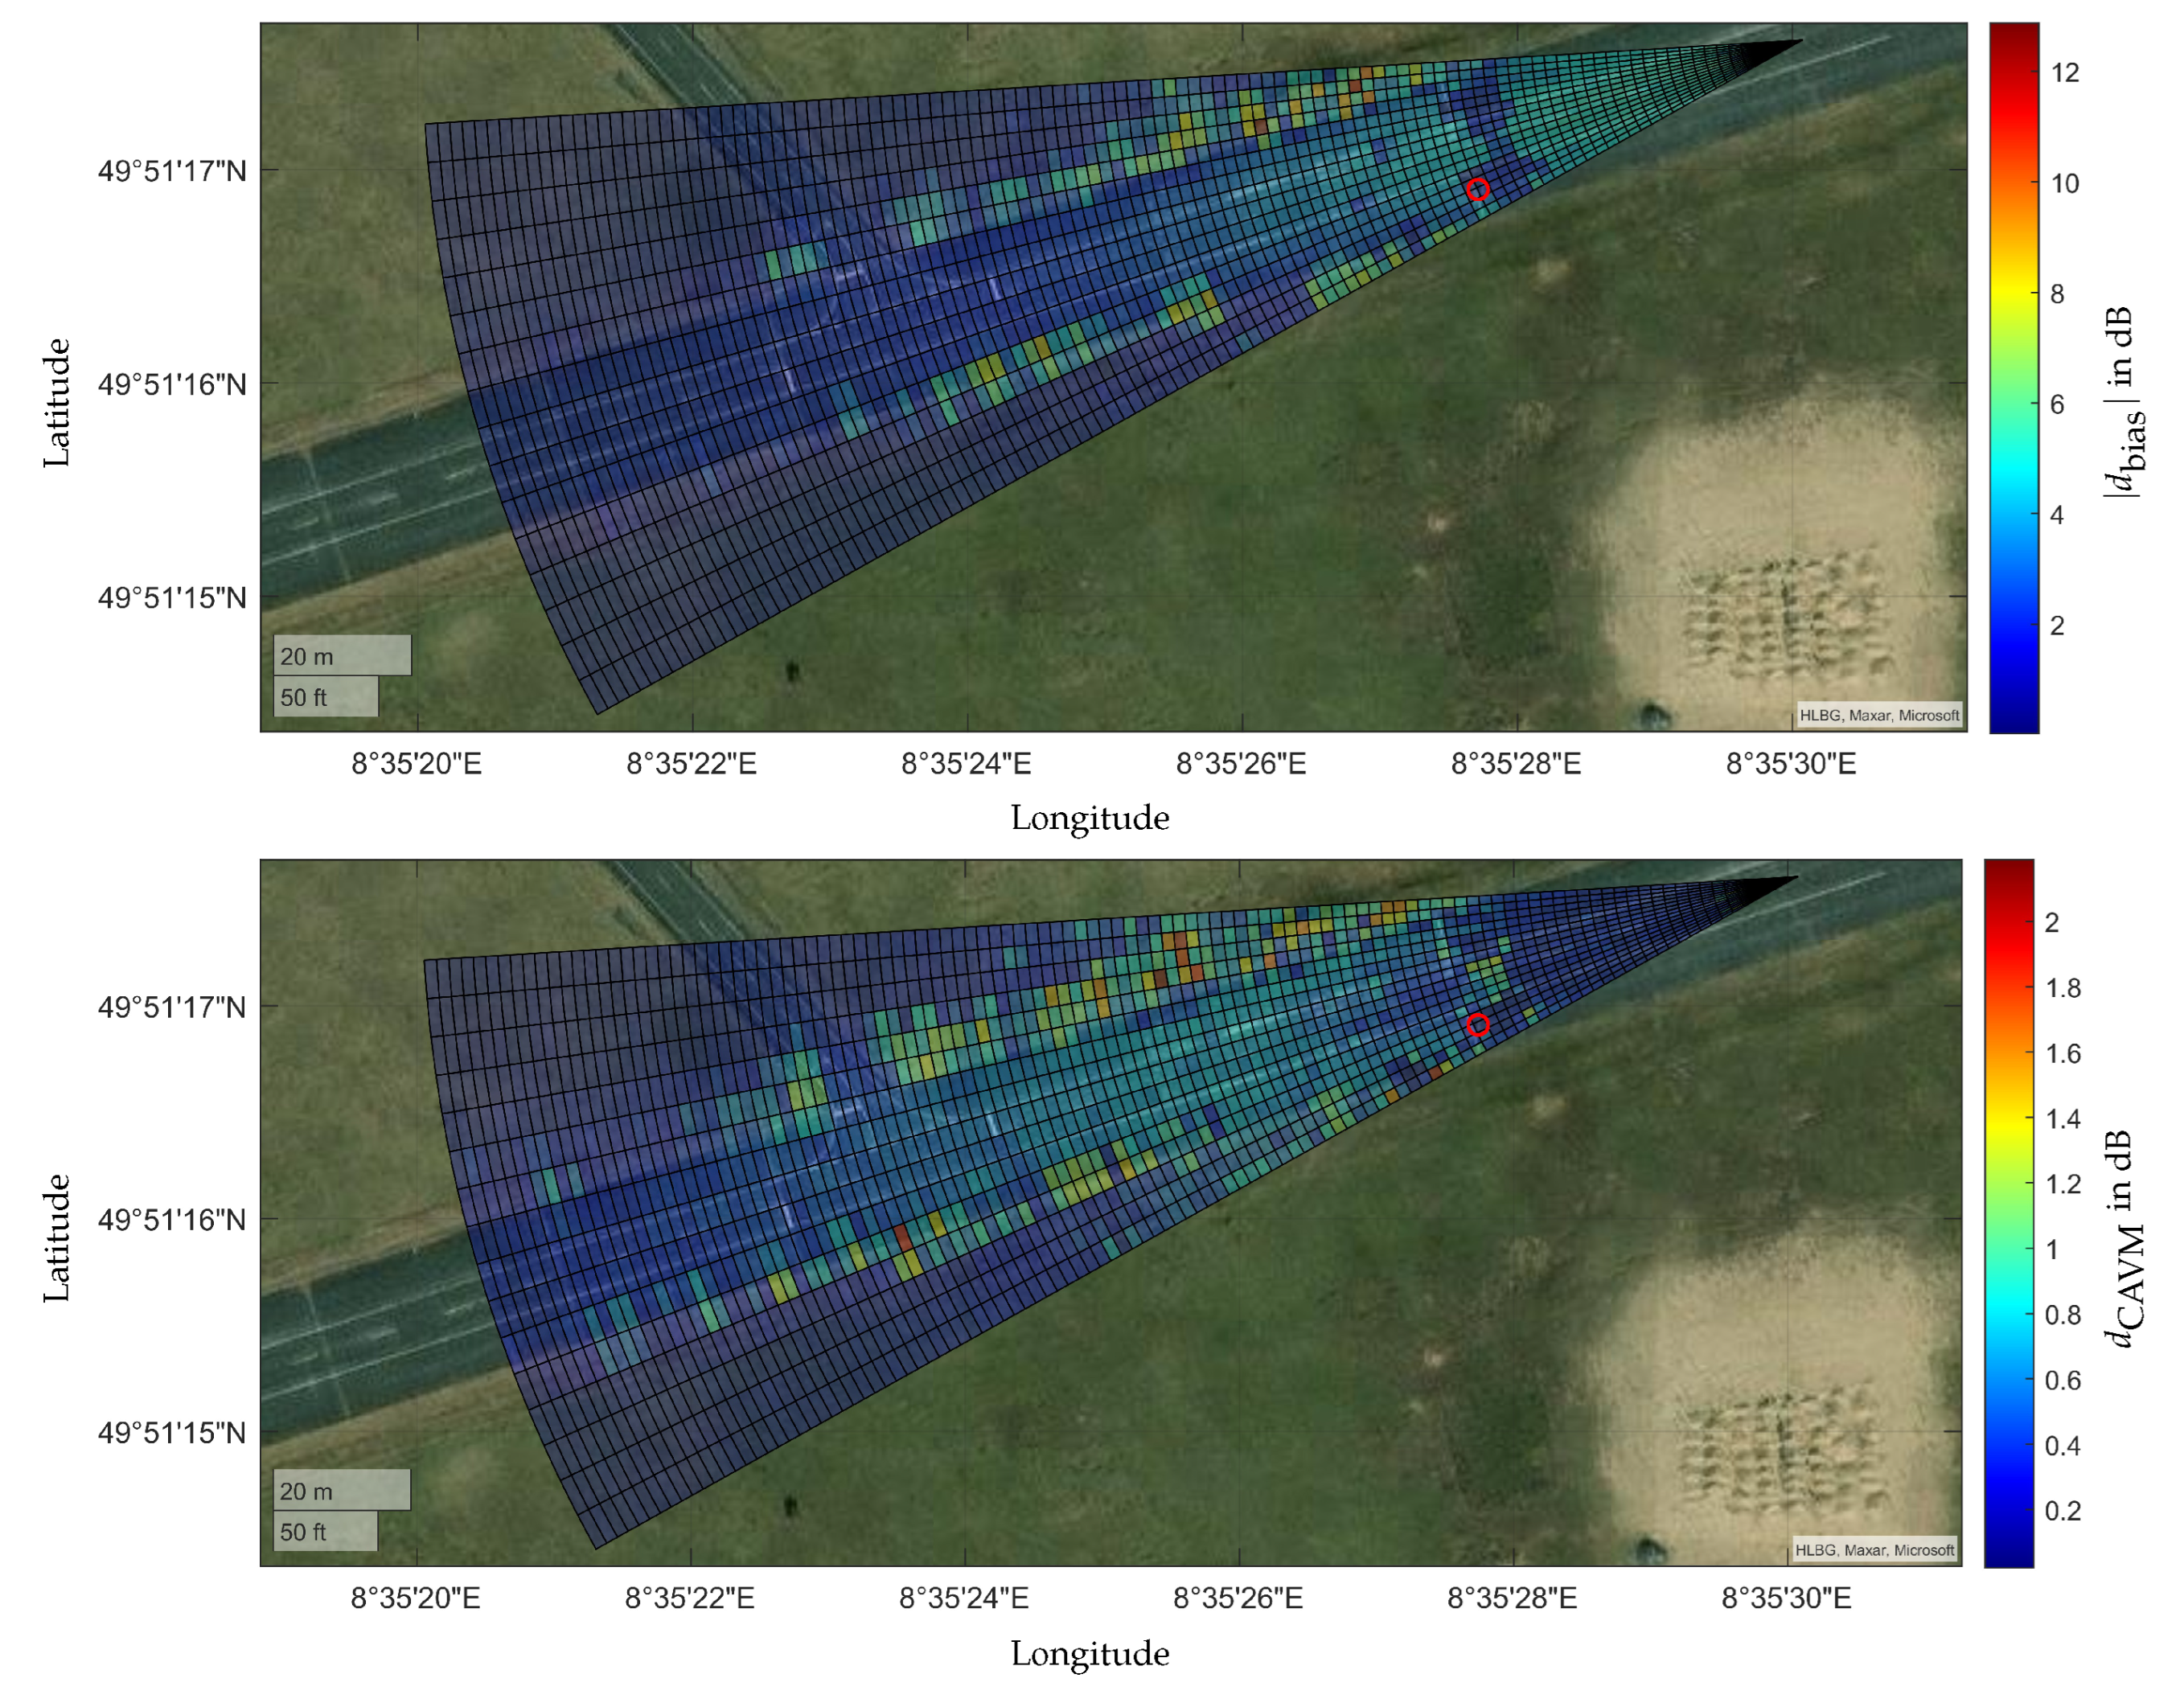

Table 1.
Different parameters in the experimental setups. In the first column the compared objects are listed with the corresponding parameters.
Table 1.
Different parameters in the experimental setups. In the first column the compared objects are listed with the corresponding parameters.
| Experiment | r in m | in | in |
|---|---|---|---|
| CCR \ CCR | 29.56 \ 29.56 | 0 \ 0 | 0 \ 0 |
| Day 1 \ Day 2 | - | - | - |
| CCR \ XC90 | 29.56 \ 29.50 | 0 \ 0 | 0 \ 0.5 |
| XC90 \ XC90 rotated | 29.50 \ 29.68 | 0 \ 0.1 | 0.5 \ 13.7 |
| XC90 \ Vito | 29.50 \ 29.59 | 0 \ 0 | 0.5 \ -0.2 |
| XC90 \ XC90 rain | 48.60 \ 48.60 | 8.1 \ 8.1 | -1.1\ -1.1 |
Disclaimer/Publisher’s Note: The statements, opinions and data contained in all publications are solely those of the individual author(s) and contributor(s) and not of MDPI and/or the editor(s). MDPI and/or the editor(s) disclaim responsibility for any injury to people or property resulting from any ideas, methods, instructions or products referred to in the content. |
© 2023 by the authors. Licensee MDPI, Basel, Switzerland. This article is an open access article distributed under the terms and conditions of the Creative Commons Attribution (CC BY) license (http://creativecommons.org/licenses/by/4.0/).
Copyright: This open access article is published under a Creative Commons CC BY 4.0 license, which permit the free download, distribution, and reuse, provided that the author and preprint are cited in any reuse.


