
Submitted:
28 August 2023
Posted:
30 August 2023
You are already at the latest version
Abstract
Different drought indices are used to quantify its characteristics. This research applied many approaches to assessing the uncertain SPI and SPEI and the most capturing index of drought. Machine learning algorithms are used to predict drought; TBATS and ARIMA models run diverse input sources including observations, CSIC, and CMIP6-ssp126 datasets. The longest drought duration was 14 months. Drought severity and average intensity were found -24.64 and -1.76, -23.80 and -1.83, -23.57 and -1.96, -23.44 and -2.0 where the corresponding drought categories were SPI 12 -Sweileh, SPI 9 Sweileh, SPI 12 Wadi Dhullail, SPI 12 Amman-Airport. The dominant drought incident occurred between Oct 2020 and Dec 2021. CMIP6 can capture the drought occurrence and severity by measuring SPI but did not capture the severity magnitude same as from observations (-2.87 by observation and -1.77 by CMIP6). Using observed SPI and historical CMIP6, ARIMA was the most accurate than TBATS. Regarding SPEI forecast, ARIMA was the most accurate model to forecast drought index using the observed historical SPEI and CSIC over all stations. The performance metrics ME, RMSE, MAE, and MASE implied significantly promising forecasting models; -0.0046, 0.278, 0.179, & 0.193 respectively for ARIMA and -0.0181, 0.538, 0.416, & 0.466 respectively for TBATS. Hybrid modelling is suggested for more consistency and robustness of forecasting approaches.
Keywords:
SPI
; SPEI
; CSIC
; CMIP6 ssp126
; MK Test
; Amman Zarqa Basin-Jordan
; drought forecast
; forecast models
1. Introduction
Drought is a complex environmental threat that its propagation is not yet controllable, causing more environmental, social, and economic damage [1,2,3,4,5,6]. Drought is more severe than any other hydro-meteorological hazards that affect the high number of masses and their livelihoods over a broader geographical extent [7]. More severe droughts are expected globally and regionally due to global warming and climate change with increased drought risk [8,9,10]. Droughts are generally forecast and characterized driven by indices in the purposes of drought mitigation and monitoring [1,2,11]. Drought severity, duration, and affected area have all increased globally since 1970, most notably in the tropics and subtropics, where rising temperatures and decreased precipitation have exacerbated drought conditions.
Because climatic conditions differ by region, many drought indices are used to track droughts worldwide because a single drought index does not provide detailed information about droughts. Drought assessment studies concentrate on single to two indices, therefore, it is favorable to calculate different drought indices. Many studies have been conducted to quantify droughts, and nearly 50 indices based on various variables have been developed. Despite different given drought indices offered, the mainstream only provides a vague explanation and inadequate information of droughts.
In recent decades, drought indices are the widely used to monitor and characterize drought events. Drought and climate scientists have elaborated the number of drought indices for this purpose. The requirements of data inputs vary from index to index and similarly, the indices characterize different types of droughts. To identify meteorological droughts, the indices like Palmer Drought Severity Index (PDSI), Standardized Precipitation Index (SPI), Standardized Precipitation Evapotranspiration Index (SPEI), China Z Index (CZI), and Effective Drought Index (EDI) are used frequently. In agricultural and ecological studies, the drought researchers normally use Vegetation Condition Index (VCI), Temperature Condition Index (TCI), Vegetation Health Index (VHI), Temperature Vegetation Dryness Index (TVDI), Soil Moisture Index (SMI) … etc. Drought can escalate over time when there is no precise method to detect and predict it. However, the prolonged influence of a drought event urge characterizing and forecasting drought where indies are generally used.
The Amman-Zarqa Basin is witnessing drought incidents under the significantly effect of climate change, including changes in precipitation patterns and increased temperatures, which could exacerbate water scarcity and other environmental challenges in the region. In the current study, the meteorological and hydrological droughts will be characterized using SPI, SPEI and VCI indices. The meteorological data from 5 stations in AZB like precipitation, temperature and evaporation used for the calculation of SPI and SPEI using 3-, 6-, 9-, and 12-months scale for the temporal period 1985-2021. The drought severity, intensity, detailed frequency, and probability were calculated for each drought temporal scale.
For wake-up-calls, statistical and numerical models are used to predict drought which were combined later with physical and dynamical models [12]. This study at hand conducted time series analysis using the TBATS and ARIMA models. Various machine learning algorithms and techniques were employed for this analysis. For SPEI index, three groups were derived and built the modelled SPEI; historical observations, historical CSIC, and already-prepared future CMIP6-ssp126. For SPI index, three groups were derived and built the modelled SPI; historical observations, historical CMIP6-SPI, and already-prepared future CMIP6-ssp126. Here the study aimed to gain insights into the relationship between precipitation, evapotranspiration, and climate model projections as well as to make the best modelled forecast for future drought monitoring.
Study Area
The study area comprises the region of Amman Zarqa Basin as one of the important hydrological basins of the Jordan, located in the northwestern part of the country (Figure 1). The climate of the Amman-Zarqa Basin is influenced by a number of factors, including its location in the eastern Mediterranean region, its proximity to the Arabian Desert, and its elevation above sea level of around 700-800 meters above sea level, which contributes to the cooler temperatures compared to lower-lying areas. The summers mostly remain dry while rainfall occurs in winter season where the western part of the basin receives more rainfall from the Mediterranean cold fronts and the eastern parts mostly remain dry. Table 1 represents the temperature and precipitation of different meteorological stations in the study area. The average long-term temperature during 1985-2021 in Wadi Dhullal meteorological station was 18.23 ̊C with average minimum 16.46 ̊C and average maximum 19.28 ̊C during the study period. The highest mean annual total precipitation was observed in the Swaileh meteorological station (459.45 mm) followed by Amman Airport (232.95 mm) and the lowest mean annual total precipitation was found in the Wadi Dhullal meteorological station (128.97 mm). The total annual precipitation during rainy seasonal average equal 232.8 mm ranged from 54.2 to 201.5 mm minimum and 271.6 to 865.8 mm maximum.
For the drought assessment in the Amman Zarqa Basin, the data of meteorological parameters i.e., precipitation and temperature were acquired of the period 1985-2021 from the Meteorological Department Jordan for the calculation SPI and SPEI. SPI and SPEI are calculated for each month with an ongoing display of selected time length according to [13] and the WMO guidelines [14,15]. Each month shows different time scales which provide an early precaution of drought and ease to evaluate drought severity at any time. These timescales reflect the effect of drought on available water in soil, groundwater, stream flow and reservoir storages under the effects of precipitation variances through short- and long-terms.
Meteorological Data Acquisition
The meteorological data of precipitation and temperature for the five meteorological stations namely Amman Airport, Mafraq, Swaileh, Wadi Dhullal and Zarqa located in the Amman Zarqa Basin was acquired from the Meteorological Department Jordan. The acquired data was of average monthly temperature and total monthly precipitation over the period 1985 to 2021. Table (1) shows the details of the meteorological stations.
Standardized Precipitation Index
For determining the meteorological drought characteristics, the SPI index is used in the current study. Standardized Precipitation Index (SPI) is one of the commonly used indexes that is used to detect the meteorological drought. This index had been developed in by [13]. To pursue the objectives, the study elaborated DrinC to calculate the SPI and SPEI for 3, 6, 9 & 12 timescales and monitor the meteorological drought. SPI and SPEI values were classified analyzing the Meteorological drought’s severity level as given in as per WMO standards.
SPI is calculated using Drought Indices Calculator (DrinC) software parallel with the normalization of historical records of monthly rainfall and gamma distribution function [16,17]. According to [13,18] SPI is calculated by the difference between normalized seasonal precipitation and long-term seasonal precipitation divided by the standard deviation [15]:
Where Xij denotes the seasonal precipitation at the ith station and jth period of observation, and Xim is the seasonal mean of long-term (i.e., record of 25-30 years), σ is the standard deviation. Moreover, according to [13] SPI value described the occurrence of drought events as its starts when SPI intensity is continuously negative (reaches -1 or less) and ends when the value of SPI becomes positive. The classification of drought severity (according to [13] is divided into seven main classes namely: extreme drought (SPI< -2), severe drought (-1.99 -1.5), moderate drought (-1.49 -1), near normal (-0.99- 0.99), moderately wet (1.0 -1.49), very wet (1.5- 1.99) and extremely wet (SPI >2). Drought magnitudes were determined by the positive summation of all months’ SPI values within the drought event.
In this study, drought is defined by a combination of three components: (i) Precipitation; which represents the rainfall deficit, and (ii) Temperature; which includes the temperature excess and high-temperature persistence.
SPI calculations require monthly or daily precipitation data. The SPI positive values specify humid conditions while negative values shows dry situations in any area. In this study, the SPI for the past (1985-2021) was calculated based on meteorological observation data and CMIP6 scenario SSP126 dataset. The meteorological observation data was obtained from Jordan Meteorological Department while the CMIP6 SSP126 scenario data was acquired from the World Climate Research Project (from the web page https://esgf-node.llnl.gov/projects/cmip6/). SPI is calculated using the following equations:
where, the shape parameter scale parameter
Г( = Gamma function, are specified based on Maximum Probability method as following:
Where n= the observations with rainfall number.
The Cumulative Probability is commutated as following:
Г( is not defined for, the function of Cumulative Probability given as following:
zero precipitation probability
Through transforming to ( ) a normalized-Variable through an approximation the SPI could be computed as following:
Standardized Precipitation Evapotranspiration Index
Another important drought indicator is Standardized Precipitation Evapotranspiration Index (SPEI) that is used for drought monitoring and characterization. It was proposed by [19] and in this study it is applied for the characterization of meteorological drought assessment. The SPEI uses precipitation (P) and potential evapotranspiration (PET) data that represents the climatic water balance. In current research, the PET is calculated using Thornthwaite method using the following equation:
Average monthly temperature, Dependence coefficient and heat index. To compute SPEI, the Log-Logistic Distribution should be used as shown in the following equation.
are the scale, shape and origin for (D). The values of (D) within . Then, the function of Probability-Distribution for (D) series could be obtained by [15,19]:
The SPEI in this study is calculated at 3, 6, 9, and 12-month scale at each meteorological station. The SPEI-3 and SPEI-6 are useful for monitoring seasonal variation in drought whereas the SPEI-9 as well as SPEI-12 are useful for long term drought assessment. The drought severity si determined from the SPEI calculated values which could be interpreted based on [13,19] drought severity Table 2.
Drought Frequency
The drought frequency was calculated using both SPI and SPEI results during the study period. The frequency of drought means the number of total drought events months (including moderate, severe and extreme drought events) compared to the total number of months. The total number of dry months was divided by the number of total months during the study period and multiplied by 100.
Drought Probability of Occurrence, Severity and Intensity
To define drought characteristics, this study identified drought duration from the beginning of drought condition to the end of drought condition based on index value SPI (1≥SPI). The study chooses the longest drought duration to define drought severity [20]
Drought severity is the summation of SPI drought values parameter during the longest drought duration. When is divided by the maximum drought duration , drought intensity is concluded.
Probability of Occurrence:
In order to determine the chance that a given drought risk occurred, the study calculated the probability of occurrence in (%) , by dividing the number of categorized drought months events occurring to the total number of drought events occurring [21]
Pearson Correlation Coefficient and Mann-Kendall Trend Test
The study applied two tests, The Pearson Correlation Coefficient (PCC) to test the relationship among drought indices, and the Mann-Kendall Trend (MKT) test to compute the drought trend in the study region. PCC is one of the commonly used techniques that determined that the paired variables are strongly related to each other. The PCC for the current study was calculated and value ranges from +1 to -1 indicate the positive to negative perfect linear correlation, and zero or near to zero indicates no correlation among the variables. In this study the PCC is applied to observe the strength and direction of the linear correlation among SPEI and SPI at 3, 6, 9 and 12-months’ time scale using scatterplot. MKT test was applied on SPI and SPEI results. It is a nonparametric test that has been widely used for the measurement of temporal trend in climatic parameters and drought trend [22,23,24].
CSIC SPEI Data
The CSIC SPEI data used in this study is downloaded from the https://spei.csic.es/map/maps.html website developed and maintained by Spanish Ministry of Economy, Industry and Competitiveness, State Agency Superior Council of Scientific Investigations (CSIC), Pyrenean Institute of Ecology (IPE). The data is available at 0.5 X 0.5-degree spatial resolution and monthly temporal resolution. The SPEI global data is provided 1-48 months temporal scale and, in this study, we used for the period 1985-2021 for 3, 6, 9, and 12-months temporal scales. For further validation and comparison, the CSIC SPEI data was used in comparison with the meteorological station based derived SPEI. CSIC is new global dataset available for scientific community used the monthly precipitation and average temperature gridded data as well as Thornthwaite method to calculate evapotranspiration [19]. It uses Kalmogrorov-Smirnov test to determine the performance of SPEI data and the logistic distribution.
Coupling of CMIP6 ssp126 projection to estimate SPI
The CMIP6 scenario ssp126 temperature and precipitation datasets from 1985-2021 were retrieved in this study using the same equations that run with observations to estimate SPI. Through selecting the coordination of each station, the output data were within borders of a grid box for more variance and make the model capture most of the state of the climate in the basin. The study considered the land point only in the basin as there is no sea points in the basin itself where air fluxes in the sea points different than the air fluxes in the land points, which affects the climate characteristics in the basin.
CMIP6 -ssp126
This study used CMIP6 temperatures and rainfall projections as the new age group of climate models ensemble showing best symbolized in simulation of future climate data. This study used the mean ensemble model [25] located to each station grid point under the Shared Socioeconomic Pathway one (ssp1) the sustainable pathway that taking green road for mitigation the climate change effects and adaptation with its consequences. Ssp126 emphasizes development that values the nature boundaries and human prosperity [26].
TBATS vs ARIMA forecast models
The task at hand involves conducting time series analysis using various machine learning algorithms and techniques. The TBATS and ARIMA models were employed for this analysis. The TBATS model, short for Trigonometric seasonality, Box-Cox transformation, ARMA errors, Trend, and Seasonal components, is a sophisticated time-series forecasting model that can handle multiple seasonality and complex patterns. It was likely employed to capture the various seasonal patterns present in the data. ARIMA is shortened to Autoregressive Integrated Moving Average, is frequently used time-series model. It incorporates autoregressive and moving average components, as well as differencing to account for non-stationarity in the data [27,28].
The basic equations of TBATS is that shown in equation 17:
where denotes the box transformation parameter at the time which be applied to observed variable in the local level , & are the inhibited trend and the long-run trend respectively, the seasonal pattern, component, and periods are , , & , and lately is the ARIMA residuals.
Equation (18) estimates the basic ARIMA, denotes the different operator for the possible values , during the autoregressive process, there is a lag order of the order , & are the coefficients of parameters & respectively, at the time there are residuals of errors .
The key features of interest in the dataset were the Standardized Precipitation-Evapotranspiration Index (SPEI), Standardized Precipitation Index (SPI), CSIC, and CMIP6 data. The dataset was divided into four time periods, each spanning three months. These time periods were likely chosen to capture seasonal patterns and trends in the data. By examining the SPEI and SPI from historical observations, CSIC and CMIP6-ssp126 future projections, interpolation of historical observed SPI and SPEI, and CSIC-SPEI interpolation values over time periods were applied. For SPEI index, three groups were derived and built the modelled SPEI; historical observations, historical CSIC, and already-prepared future CMIP6-ssp126. For SPI index, three groups were derived and built the modelled SPI; historical observations, historical CMIP6-SPI, and already-prepared future CMIP6-ssp126.
ARIMA models were likely used to explore the temporal dependencies and trends in the SPEI, SPI, and CMIP6 data. By leveraging machine learning algorithms and techniques, this analysis aimed to uncover important patterns, trends, and relationships within the time series data of SPEI, SPI, CSIC and CMIP6 variables. Such insights can be valuable in understanding and predicting climate-related phenomena, supporting decision-making, and informing climate change mitigation and adaptation strategies.
Top of Form
Data Loading and Pre-Processing:
Handling and organizing multiple datasets based on location and climate variables were coded by RStudio. Data preprocessing and organizing in this way enabled easy access and analysis of historical data for different locations, including Amman, Mafraq, Swaileh, Wadi Dhullal, and Zarqa such as SPEI, SPI, CSIC and CMIP6. Checking for NA values in the resulting data frames began by specifying the features to interpolate for different time periods. Interpolation functions are defined to fill in missing values using the na.approx method. Also, data were checked for outliers using a boxplot. Outliers were removed from Amman-Airport, Zarqa, Mafraq, Sweileh and Dhullail stations using the “ts_data_clean_outliers” function.
Forecasting Function
This approach focused on forecasting using the TBATS and ARIMA single models for different time periods (3, 6, 9, and 12). For each dataset, the code loops through the features and builds a TBATS model. The time series data is prepared by creating a time series object with the appropriate start year and frequency. The TBATS model is then applied to the time series data. Next, a forecast is generated for the future time (2023-2025) using the forecast function. Finally, the forecasted data is plotted. This process is repeated for the SPEI and SPI datasets derived from historical observations and the historical CSIC-SPEI and historical CMIP6-ssp126 to provide forecasts for each dataset and feature combination. The result is a series of forecast plots illustrating the predicted values for the respective time periods up to the near future 2025. The accuracy of the forecast is evaluated using the accuracy function and evaluations for each dataset, feature, and model combination. The study used ME, RMSE, MAE, and MASE to compare the performances of the prediction models. MAE and RMSE are scale-dependent metrics leading to median and mean predictions respectively rather than MASE that is scale-free which is reported as the most reliable error metric for forecast accuracy [28]. The study used autocorrelation function (ACF) to imply the correlation with previous values in the time series. The ARIMA and TBATS time series outputs are then converted into long format using “long_df” function.
3. Results
Drought Indices
In this study, the meteorological drought has been calculated. The SPI and SPEI for time scale 3-, 6-, 9-, and 12-months are used for characterizing and monitoring of drought severity and frequency on spatial and temporal scale for historical period 1985-2021 and projected period 2023-2100 in Amman Zarqa Basin.
3-Months, 6-Months, 9-Months, & 12-Months SPI
The Figure 2 represents the temporal drought situations in five meteorological stations (Amman Airport, Mafraq, Swaileh, Wadi Dhullal, and Zarqa) calculating SPI using the observations of meteorological datasets and the historical baseline datasets derived from CMIP6 SSP126 (the sustainable pathway) at 3-Months, 6-Months, 9-Months, and 12-Months’ time scale. Both the observational and modelled data results of 3-months SPI (Figure 2, see first two plots per each station in column one) show fluctuated results of wet and dry conditions even within a same year. There were extreme wet conditions that prevailed in late 1986 while it was converted to extreme dry in the preceding year i.e., 1987 in almost all meteorological stations. Similarly, 1989, early 1992 and late 1994 were again prevailing wet conditions in the study region. The 3-months SPI results revealed extreme drought in 1995 (-1.6, -2.3, -1.2, -1.7 & -2.2 in Swaileh, Wadi Dhullal, Mafrqa, Amman Airport, and Zarqa, respectively) and extreme drought with extended period was observed during 1998-2000 in the basin. The study downloaded the latest mean ensemble CMIP6 model under the SSP126 since it reflects more justified outcomes that being included in AR6 of IPCC to study climate effects and risks [21]. The historical simulations of CMIP6 indicate decreasing precipitation and increasing temperature, thus, increasing evaporation rates. For CMIP6-SSP126 results, the years 1992 and 2001 was severely wet while there were normal conditions prevailed in the meteorological observational results. In early 2003, severe drought was observed and in late 2003 wetting conditions were concluded from the SPI 3-months results. The preceding year 2004 in late season was again a dry year. Similarly, late 2008 was wet while early 2010 was extremely dry. The results of SPI3 derived from observational data and the ones derived from CMIP6 indicated opposite in 2013 where the conditions were severely wet in observational data while extreme drought was detected in the CMIP6 data results. Similarly, the year 2017 was wet while the 2018 to 2021 observed drought with some with nearly normal conditions in some seasons. The SPI based on CMIP6 model data shows more extreme drought after 2020 and wet conditions prior to 2020 as compared to observational data.
The 6-months SPI determines the cumulative precipitation of six months and the negative values of SPI shows the drought while positive values shows the wet conditions in the study region. The 6-months SPI results (Figure 2, see the 3rd and 4th plots per each station in column one) show more pronounced drought events as compared to 3-months which showed fluctuating drought situations throughout the temporal period. The SPI results of both datasets revealed wetting conditions in 1985 followed by extreme drought in the year 1986 in all meteorological stations in the study area until the end of 1986 when wetting pattern was dominant. Again, the year 1989 was dry while 1990 was moderately dry. Nevertheless, 1992 and 1994 were extremely wet years, late 1995 was an extremely dry year. In all meteorological stations experienced moderate to severe drought during 1998-2000 but consequent year 2001 detected moderate moist in the CMIP6 SPI results where the same was normal conditions in the observational data. Early 2003 was pragmatically wet but the latter half of 2004 was stated as dry. The year 2005 was wet and 2008 was observed as wet based on meteorological stations SPI. Compared to CMIP6 results, the year 2013 was wet and dry during 2014, 2017 and normal in 2018. Similarly, the year 2019 was moderately wet and late 2020 was moderately dry.
The 9-months SPI requires cumulative rainfall data of 9 consecutive months. The 9-months SPI results (Figure 2, see the 5th and 6th plots per each station in column one) of both observational data and direct coupling of CMIP6 SSP126 data were fitted with few observations and overestimation of wetting and drying condition in some years by CMIP6 results (during years 2001, 2010 and 2013). Similar pattern like SPI and SPEI 6-months of drought and wetting condition was observed in 9-Months SPI results. The year 1986 was a wet year for Swaileh, Zarqa and Wadi Dhullal but drought for Amman and Mafraq while the preceding year 1987 observed dry conditions only for Zarqa. Again, the year 1988-1989 detected wetting situations in the study area except for Amman and Mafraq in late 1989. The year 1990 was a dry year according to CMIP6 SSP126 dataset which aligned with observational SPI results except for Zarqa and Wadi Dhullal. The year 1992 and 1993 were again wet years in observational based and CMIP6 SSP126 model based 9-months SPEI results in all stations except Swaileh in late 1993 where it witnessed severe drought. The year 1994 earlier months were again normal. The year 1995 was again a dry year while the early half of the year observed some wetting conditions which were underestimated in the CMIP6 based SPI results. Similarly, there was drought in 1999 across the basin while the same was observed as normal conditions in CMIP6 outputs especially in Wadi Dullail which reached (-2.7). Drought was also observed in 2003 and 2004 in some months of the year with intermittent wetting situations observed in the same years while it contradicted CMIP6 as the latter simulated wet season during 2003. Wetting conditions observed during 2008 in observation data which was underestimated in CMIP6 results. In 2010 and 2011 there was extreme to moderate drought in CMIP6 results while the conditions were almost normal in the observational data results. 2013 was again overestimated as dry while it was normal in observational based SPI results. The year 2019 observed normal while CMIP6 simulated the severe drought in the study area. In contrary, there were severe drought in met stations results in 2021 while the same was observed as normal in CMIP6.
Figure 2 (see the 7th and 8th plots per each station in column one) represents the 12-months’ time scale of SPI based on recorded data precipitation and temperature and CMIP6 output projections data during 1985-2021 in Amman Zarqa Basin. The 12-months SPI are usually used for long term drought monitoring, especially for planning hydrological and agricultural droughts in a region. The results revealed moderate to extreme drought and wet episodes during the study period. The year 1986 showed wet conditions by CMIP6 projections and norm by observed climate data. Similarly, the year 1988 was severely wet while 1989 was moderately dryness. The year 1996 observed extreme dryness in stations SPI particularly in Amman Airport and Swaileh whereas moderate dryness in CMIP6 data-based SPI results. The same situation of severe drought was observed in 1998 in both dataset where CMIP6 data underestimated the severity of drought. In 2001 the CMIP6 based SPI showed moderate moisture whereas the same was near to normal in meteorological based SPI results. CMIP6 indicated moderated drought across stations in late 2003 while there were moist conditions observed. The years 2007 and 2008 were moderately wet whereas late 2010 and early 2011 was dry with more extreme value in CMIP6 results. After 2011 the SPI results of both datasets mostly showed near normal or below normal situations in the study area, and this was more obvious in Zarqa station results. This indicates that in the study the drought is becoming more frequent after 2011. CMIP6 ssp126 has overestimated some peak severe drought (2013 and 2014) and some wet years (1993 and 2002) underestimated other extreme droughts in 1999 and wet years (1991 and 2008). During 2017 and 2021, in Zarqa and Mafraq, the interim in SPI estimation between observations and CMIP6 projections were the same, while it appears heaving trends prior to this period.
3-Months, 6-Months, 9-Months, & 12-Months SPEI
To investigate the 3-months’ time scale SPEI, derived index was calculated from the meteorological data and further evaluation with CSIC global SPEI database were downscaled from the available global scale data for the selected meteorological stations (derived from the https://spei.csic.es/database.html). Figure 2 (see the 2nd plot for each station in the right column) shows SPEI results for the 3-months temporal scale. Wet and dry conditions prevailed throughout the study period – even within the same year – seasonal variations in the drought characteristics. As the study area is the same river basin, negligible variation was observed among the stations results during (1985-2022). The results of the SPEI 3-months of both observational data and CSIC calculated SPEI (Figure 2, see the 1st plot for each station in the right column) show moderate drought conditions in early 1985 in Swaileh and wetting in the remaining stations. A moderate drought was observed in early 1987. CSIC SPEI showed drought conditions in 1988 and consequently at the same year was normal conditions in the observational SPEI results. Similarly, in early 1989, extreme drought was prevailing in the study region and later half of the same year showed wetting conditions. Severe drought was observed in CSIC SPEI results while the same mild to moderate drought in stations observations. The year 1992-1993 was wet in both data results whereas 1995 observed moderate to severe drought. The years 1996 and 1997 were again normal to wet years while there was a prolonged drought during 1998-2000 in the study region. Likewise, the years from 2002 and 2007 ranged from wet to normal situations, and after witnessing seasons, unpredictable situations observed in 2008 where CSIC SPEI detected extreme drought while the same was wet in the observational based SPEI results. The same situation was observed in 2010 where there was extreme drought in CSIC SPEI, and moderate dryness observed in the SPEI results across all meteorological stations. During late 2012, extreme drought was sensed while in early 2013 wetting conditions prevailed in the study region. Early 2014 was also extremely dry whereas the latter half of the year prevailed moderate wet to normal conditions except for Mafraq that witnessed continuous severe drought from 2012 to 2016. Same dry and wet conditions were observed in 2016 while the years 2018 and 2020 were extremely dry in both SPEI results. Generally, the CSIC SPEI results show more severe drought than the calculated SPEI results from climate observations.
The results of 6-months scale SPEI (Figure 2, see 3rd and 4th plots for each station in the right column) revealed somehow different patterns of dry and wet conditions in some years. The CSIC SPEI shows more extreme to severe drought in all meteorological stations as compared to observational data that indicated incidents droughts. CSIC SPEI underestimated the wet periods like in the case in 1987 (particularly in Wadi Dhullal and Zarqa), 1991(particularly in Mafraq), 1992, 2008, 2009 and 2013. It is noticed that the lagged fit of drought severity between the calculated SPEI and the modelled CSIC SPEI might be justified as the results of unbiased estimator of Probability weighted moment’s methodology of CSIC SPEI. In late 1986, the modelled CSIC SPEI showed extreme drought while there were wetting conditions in observations. Similarly, the modelled CSIC SPEI results underestimated the wetting conditions in 1988 and 1989 as these years were moderately wet in observational results. Same situations observed in 1990 where the meteorological station results observed normal to wet conditions while modelled CSIC SPEI observed dry to normal. The study results showed wetting conditions in 1992 and 1993 whereas drought was observed during 1994 and 1995 where observations were aligned with CSIC simulations. The year 1997 was wet while there were droughts in 1998 and 1999 in the study results of both datasets, when Zarqa has severe drought (-2.6) by CSIC simulations. Similarly, 2003 and 2004 were wet years whereas modelled CSIC SPEI underestimated the wet situations in the years 2008-2010 and 2013 in all stations. The drought situations were observed from the analysis results during 2016, 2018 and 2020. Zarqa, Swaileh and Amman Airport witnessed more often severe drought than other stations by modelled CSIS SPEI6. It is noted that Zarqa station has wet seasons during the first two decades (1985-2004) while CSIS SPEI6 underestimated the same period of wetness and implied high frequent drought.
In terms of 9-months scale, outputs showed (Figure 2, see 5th and 6th plots for each station in the right column) dry and wet years during the study period in Amman Zarqa Basin. High variation in meteorological observation based SPEI and CSIC SPEI were observed in earlier years of the study (1985-1993) and during 2008 and 2010 observed in Zarqa while the remaining stations were lined up with CSIS index. In Zarqa meteorological station, the SPEI based on observation data showed continuous mild to moderate dryness since 2002.
Figure 2 (see 7th and 8th plots for each station in the right column) represents the 12-months SPEI results calculated based climate variables and CSIC SPEI results. Both the SPEI results show almost similar wet and dry trends. An almost similar pattern like 9-months SPEI was observed in the 12-months results with a little variation in some years. Long-term dry events show an increase after 2010 and dry events are observed from the SPEI results. The convened trends in SPEI12 for both sources the observations and CSIC were strong and promising in Amman, Mafraq and Swaileh, nevertheless, it didn’t contest with extremes magnitudes of wet and dry years in 1986, 1987 and 2004. Across all stations indices indicated contradicted trends of CSIC from 2008 to 2011 except the year 2010 where it fitted the observational SPEI12. The drought frequency was also found to be high as compared to other temporal scale.
Drought Indices Correlations and Pearson Coefficient
Pearson Correlation Coefficient (PCC) was applied to test the correlation among all the drought indices applied in this study. In five stations (Amman Airport, Mafraq, Swaileh, Wadi Dhullal and Zarqa) four different datasets (i. meteorological station-based precipitation for SPI and ii. Precipitation and temperature for SPEI, iii. CMIP6 SSP126 dataset and iv. CSIC SPEI dataset) were used for drought assessment in the study area and four temporal scales i.e., 3, 6, 9, and 12-months. In Figure 3, the green color represents strong correlation and red color shows weak correlation based on R2 value. All indices correlation was found positive. In Amman Airport meteorological station, the strong correlation was observed among SPI12 vs SPEI12 (R2 = 0.84), SPI9 vs SPEI9 (R2 = 0.79), SPI12 vs SPEI9 (R2 = 0.80), CSIC 9 vs CSIC 6 (R2 = 0.68), CMIP6 SPI 9 vs CMIP6 SPI12 ((R2 = 0.83), SPI 12 and SPI 9 (R2 = 0.71), SPEI9 and SPEI6 (R2 = 0.70).
In Mafraq meteorological station, the significant positive correlation was observed CSIC 9 and CSIC 6 (R2 = 0.76), CMIP6 SPI9 and CMIP6 SPI12 (R2 = 0.83), CMIP6 SPI9 and CMIP6 SPI6 (R2 = 0.73), SPEI 12 and SPEI 9 (R2 = 0.84), SPI 12 and SPI 9 (R2 = 0.74), SPI 12 and SPEI 12 (R2 = 0.79), CSIC 12 and CSIC 9 (R2 = 0.71). The results of Figure 3 in Swaileh station detected strong positive correlation among SPI 9 and SPEI 9 (R2 = 0.91), CMIP6 SPI 9 and CMIP6 SPI 6 (R2 = 0.71), SPEI 12 and SPEI 9 (R2 = 0.77), SPI 12 and SPEI 9 (R2 = 0.72), SPI 12 and SPI 9 (R2 = 0.73), SPI 12 and SPEI 12 (R2 = 0.93), CMIP6 SPI 12 and CMIP6 SPI 9 (R2 = 0.83).
In Wadi Dhullal, the strong positive correlation was observed from the Figure 3 among CSIC 9 and CSIC 6 (R2 = 0.76), CMIP6 SPI 9 and CMIP6 SPI12 (R2 = 0.83), SPEI 12 and SPEI 9 (R2 = 0.82), SPI 12 and SPI 9 (R2 = 0.73), CSIC 12 and CSIC 9 (R2 = 0.70), CMIP6 SPI 12 and CMIP6 SPI 9 (R2 = 0.83). In Zarqa, the strong positive correlation was observed among SPEI9 and SPEI12 (R2 = 0.95), SPEI 9 and SPEI 6 (R2 = 0.91), SPEI 6 and SPEI 12 (R2 = 0.86), CSIC 9 and CSIC 6 (R2 = 0.73), CMIP6 SPI 9 and CMIP6 SPI 6 (R2 = 0.72), SPEI 3 and SPEI 6 (R2 = 0.79), SPI 12 and SPI 9 (R2 = 0.76), SPEI 3 and SPEI 9 (R2 = 0.70), CMIP6 SPI 12 and CMIP6 SPI 9 (R2 = 0.83).
Correlation analysis of 3-months SPEI vs. 3-months SPI in the study sites has indicated that in both 3-months SPEI vs. 3-months SPI are not best fitted and there is some insignificant positive correlation. The R² value of Amman Airport meteorological station was 0.41, Mafraq 0.30, Swaileh 0.49, Wadi Dhullal 0.30 and Zarqa 0.15 (see Figure 3). This might be the fact that the short-term droughts in AZB not only occur due to low precipitation, but it is correspondingly affected by temperature and high rate of evapotranspiration.
6-months of SPEI vs. SPI of 6-months indices are presented in Figure (3) for stations indicated results of almost a best fit of correlation at Swaileh meteorological stations with R² value 0.74 and positive correlation was also observed in Amman Airport (R² = 0.63), Mafraq (R² = 0.51), and Wadi Dhullal (R² = 0.53), but the results are not significantly linear fit. Insignificant correlation was found at Zarqa (R² = 0.32) station (Figure 3).
9-months of SPEI vs. SPI of 9-months indices indicated results of almost a best fit of correlation at Swaileh meteorological stations with R² value 0.91 and positive correlation was also observed in Amman Airport (R² = 0.79), Mafraq (R² = 0.72), and Wadi Dhullal (R² = 0.67), but the results are not significantly linear fit. Insignificant correlation was found at Zarqa (R² = 0.53) station among SPEI vs. SPI as it showed two separate clusters of wet and dry conditions due to its climatic variability and seasonality (Figure 3).
12-months SPEI vs. SPI for the Amman Airport, Mafraq, Swaileh, Wadi Dhullal and Zarqa stations show positive correlation with significant best linear fit in all meteorological stations particularly Swaileh 0.93. The R² value of Amman Airport meteorological station was 0.84, Mafraq 0.79, Wadi Dhullal 0.72, and Zarqa 0.62 (Figure 3).
Results of Mann-Kendall Trend test for SPI and SPEI
The MKT test was applied on all temporal scale of SPI results to determine the drought trend in the study area. To interpret the MKT test results the probability value (P-value) is calculated for 95% confidence level which indicated that if P-value is less than 0.05 means that significant trend exist in the timeseries data. If P-value is greater than 0.05 indicates that there is no significant trend found in the time series data. The results of 3-months SPI revealed significant drought increasing trend only in Zarqq. Similarly, the significant drought increasing trend was observed in 6-months SPI results in Amman Airport, Mafraq, Wadi Dhullal and Zarqa meteorological stations (Table 3) but no trend in Swaileh. The 9 and 12-months SPI results revealed significant drought increasing trend in all stations.
The Mann-Kendall Trend test was also applied on the SPEI results of 3, 6, 9, and 12-months. All the temporal scales observed significant increasing trend of drought in all stations in the study area (Table 4). The results of MKT test for the 3-months and 6-months SPEI are different from that of 3-months and 6-months of SPI as the SPEI analysis more consistent droughts in recent years. The reason for more drought events in the SPEI is that the increasing temperature is causing an increase in the rate of evapotranspiration and SPI only use precipitation variable to measure its index.
Drought Duration, Severity, and Intensity
The probability of occurrence of different SPI scales is shown in Table 6 based on the study period (1985-2021). SPI 9 class has the highest likelihood of occurring over all stations Airport, Mafraq, Swaileh, & Wadi Dhullail of 62.7, 73.2, 63.5, & 55.7% respectively except for Zarqa where SPI 9 and SPI-12 showed the highest probability of 64.9% and 75.9% respectively. The highest occurrences were typified by the moderate class of drought while the highest severe class of drought occurred during SPI 3 in Amman-Airport of 48.2% followed by SPI 6 severe drought in Wadi Dhullail (40.7%). Zarqa, again, received the highest severe drought occurrence among SPI 3 and SPI 6 with 32.8 and 34.5% likelihood happening. Mafraq and Wadi Dhullail were susceptible to extreme drought based on 3-month timescale SPI with probabilities of 32.2 and 41.9% of occurrences respectively.
Number of drought months for the given study period of 444 months all given in details in Table 6, Mafraq received more months of drought equal 71 months with different classes from moderate to extreme drought followed by Airport SPI 9 when it was liable to 67 months long of drought. The shortest drought months in Amman-Airport on 3-month SDI were 54 months out of total analyzed months. The longest duration of drought was in Sweileh 14 months between Jan 1999 to Feb 2020. Most of drought intensities were severe of about 18 drought incidents on multi-temporal scales of 3 month, 6-, 9- and 12-month SPI. Two extreme drought events occurred (SPI≥ -2.0) in Amman-Airport and Wadi Dhullail based on SPI 12 and SPI 6 respectively.
The longest drought duration ranged from 6 months up to 14 months and frequently 12 months duration and 9.9 months on average. The end of drought incident did not necessarily follow by wet period, it often keeps tracked by normal drought months (-1.0 ≥ SPI ≥ 0) or short moist breaks.
Drought severity and average intensity were found -24.64 and -1.76, -23.80 and -1.83, -23.57 and -1.96, -23.44 and -2.0, -22.58 and -1.88, and -22.02 and -1.84. The corresponding drought categories were SPI 12 -Sweileh, SPI 9 Sweileh, SPI 12 Wadi Dhullail, SPI 12 Amman-Airport, SPI 9 Wadi Dhullail and SPI 12 Zarqa. The dominant drought incident occurred among all stations was between Oct 2020 and Dec 2021 as given in Table 6.
SPI and SPEI Drought Frequency
This study evaluated the drought frequency for the SPI 3-months for the station Amman Airport which were 12.22%, Mafraq 13.35%, Swaileh 12.67%, Wadi Dhullal 14.03% and for Zarqa it was 13.12% during the study period (see Table 5).
The SPEI 3-months frequency for these stations was a little higher than the results of SPI as Amman Airport 15.84%, Mafraq 16.74%, Swaileh 14.93%, Wadi Dhullal 16.06%, and Zarqa 17.65%); which means that evapotranspiration rate affect the drought situations in the Amman Zarqa Basin. The drought frequency of SPI6 in Amman Airport meteorological station was 14.35%, Mafraq 15.95%, Swaileh 14.35%, Wadi Dhullal 13.67% and in Zarqa meteorological station it was 13.21% (Table 5).
Regarding SPI 9-months, stations observation data revealed that the drought frequency during the study period was 15.14% in Amman Airport meteorological station, 16.06% in Mafraq, 14.45% in Swaileh, 13.99 in Wadi Dhullal and it was 13.07% in Zarqa station. Extreme to severe drought years in all stations were 1994-1995, 1998-1999, 2016, 2018 and 2020. Almost 13 to 16% was the drought frequency in all meteorological stations. The SPEI results show higher frequency than that of SPI results. The highest drought frequency was observed in Zarqa meteorological station (16.97%) and comparatively the lowest was in Amman Airport meteorological station (15.37). The drought frequency results revealed the highest frequency of drought in Zarqa meteorological station while the lowest was in Amman Airport meteorological station (Table 5).
Prediction Results
The accuracy results for each model are displayed in Figure 4, detailing the forecast results for each dataset, feature, and model combination. Projections of CMIP6-ssp126 were coupling with SPI equations from 2022 to 2025 on monthly basis. Future SPEI and SPI were modelled using TBATS and ARIMA. In Amman—Airport, it is expected that drought index TBATS SPEI-12 will range from (-2.4158 to +1.4591) with the low and high 95 percent confidence interval (5% possibility of being wrong).
The low and high 80 % confidence interval illustrates more susceptibility to droughts and less wet periods, whereas the TBATA modelled SPEI-12 extended from -1.745 to 0.7885. ARIMA modelled SPEI-12 extended from -2.277 to 0.9015. At Mafraq station, TBATS SPEI-12 predicted -1.1795 (Low 95%) to 1.1941 (Hi 95%) with more extreme droughts from -2.0653 in July 2022 to -2.815 in Dec 2024 (95% confidence level). ARIMA SPEI-12 predicts nearly the same drought incident but starting from August 2022 (-2.0295) to Dec 2024 (-3.065). Wet intensity in Swaileh is predicted to be higher than other locations (from -0.243 to 1.724) and (from 0.5075 to 2.0865) as modelled by TBATS SPEI-12 and ARIMA SPEI-12 with hi 95% respectively but still confronting frequent severe droughts. Zarqa forecasts higher drought intensity than the remaining locations. The midpoint implies severe drought from Jan 2023 to the end of forecasting analysis period, 95% TBATS prediction of -1.246 to -2.336 of SPEI-12 intensity. ARIMA forecast expects extreme drought (>-2.0) from Dec 2022 to the end of Dec 2024 (with 95% confidence) in Zarqa.
CSIC-SPEI-12 generated by TBATS in Airport, Mafraq, Swaileh, Wadi Dhullail and Zarqa predicts (-0.951 to -4.073), (-1.0915 to -2.771), (-0.963 to -2.89), (-1.082 to -2.739), and (-0.896 to -2.351) respectively with 95 percent confidence interval. CSIC-SPEI-12 generated by ARIMA in Airport, Mafraq, Swaileh, Wadi Dhullail and Zarqa predicts (-3.248 to -3.566), (-2.76 to -2.91), (-2.929 to -3.127), (-3.299 to -3.904) and (-2.731 to -2.854) respectively with 95 percent confidence interval.
TBATS-SPI intensities predict severe drought most of the times from Jan 2022 to Dec 2024. Amma- Airport confronts severe drought through 2022 (point forecast according to TBATS-SPI-12. Whereas ARIMA-SPI-12 predicts normal conditions by average of low and hi possibilities of drought incidents (-1.221 to -3.126) and (0.117 to 1.773) respectively. Swaileh predicts drought at the beginning of 2021 until April by TBATS-SPI then wetness to the end of 2024 while ARIMA expects no drought but normal conditions (-0.628 < ARIMA-SPI < -0.160). In Wadi Dhullal location, the results of TBATS and ARIMA-SPI are the same as in Swaileh except that ARIMA-SPI intensity (-0.967 < ARIMA-SPI < -0.133). for Zarqa, ARIMA-SPI expects more severe and extreme drought than expected by TBATS, with low to hi 80% and 90% confidences, the TBATS intensity ranges from (-1.809 to 0.758) and from -2.368 to 1.381) respectively, while ARIMA-SPI ranges from (-2.51 to 0.872) and from (-3.31 to 1.428) respectively.
For the future drought prediction and characteristics over Amman Zarqa, the climate model data of CMIP6 under the Shared Socioeconomic Pathway-Representative Concentration Pathway scenario ssp126 was used for 2022-2025. The SPI results, derived from new temperatures and precipitation datasets under the sustainable road, revealed that all months during the study period (2022-2025) will be moist. The maximum wetting condition was found above -0.5 while the drought will be up to extreme (SPI < -1.5) in Oct and Nov 2023. The maximum variation observed in February, April, June, July, September, November and December. For ARIMA, CMIP6 in all stations, the drought SPI concentrates in 2023 and through 2024 of about > -1.0 and less than zero index between Aril 2022 to Oct 2022.
ARIMA-SPI modelled from observations and from historical CMIP6 are approximately the same in Amman-Airport and Swaileh after 2023 but observed SPI is wetter than CMIP6 during 2022 in all stations. In Mafraq (Figure 5 gives an example of modelling process), Wadi Dhullail and Zarqa during 2023 and 2025, ARIMA modelled CMIP6- SPI are wetter than from observed SPI. For TBATS forecast, Zarqa SPI from observations and CMIP6, The modelled index are the same trending. While Amman, Mafraq and Wadi-Dullail are in the same slant but TBATS-SPI-CMIP6 is wetter than TBATS-SPI-observations indices.
Future projections from CMIP6-ssp126 expects the following drought numbers within AZB; CMIP6-SPI-averages are 0.08, 0.077, 0.121, 0.169 and 0.181 in Amman-Airport, Dullail, Mafraq, Swaileh,,and Zarqa respectively. The expected severe drought events are predicted to take place in Oct and Nov 2023, Jan and May 2025, and expected wet events in Sep through Oct to Nov 2024.
SPEI intensity that been modelled using CMIP6 future projections are ranged from (-0.440 to 2.12), (1.45 to 2.07), (-0.54 to 2.16), (-0.48 to 2.15) and (-0.47 to 2.13) in Amman-Airport, Dullail, Mafraq, Swaileh, and Zarqa respectively. No sever incidents are expected to take place by CMIP6-SPEI until 2025.
Evaluation on models’ accuracy provides forecast results for various datasets, features, and models report in Table 7. The forecast metrics for each single model ARIMA and TBATS used ME, RMSE, MAE, and MASE to measure the most accurate model per each station. In all stations, using observed SPI and historical CMIP6, ARIMA was the most accurate than TBATS. By looking at SPEI forecast, ARIMA was the most accurate model to forecast drought index using the observed historical SPEI and CSIC over all stations.
Autocorrelation function (ACF) revealed that the present forecast values were not correlated with former ones. The ACF between each point and the next point in the timeseries ranged (-0.0393 to 0.283) by ARIMA and from (-0.0253 to 0.937) by TBATS for all datasets except CSIC.
SPEI-TBATS modelled index using CSIC over all stations was correlated with previous ones which means that each point in the timeseries is very correlated with the next point. The highest correlation were obtained for the TBATS model which values are (0.926, 0.937, 0.927, 0.933, & 0.922) for Amman-Airport, Dullail, Mafraq, Swaileh,,and Zarqa respectively.
MASE was far lower than 1 in all cases under both models, therefore, all suggested forecasting methods performed significantly except for CSIC-SPEI which were more than 1 in all stations. Using of hybrid models in this case is suggested, as single model performed fair in one dataset and distinctively-well with other sets.
The ARIMA and TBATS timeseries outputs have been merged and converted into long format. The plot (see Figure 5) predicts that severe drought events take place during 2023 by TBATS and ARIMA followed by short wet season and continued with severe drought during
4. Discussion
Evaluation of different indices to measure drought severity and occurrence based on meteorological recordings and comparing with other climate models providers are the main objective of this study. SPI rely on the possibility of precipitation deficit over multiple timescales 3, 6, 9, and 12-month timescales. This deficit considers soil moisture response to precipitation variations over time and different locations on quite short scale, while it considers longer-term for groundwater, streams and reservoirs. Drought events occur and continue (drought intensity) anytime that SPI is negative and reach -1.0 or less. Drought lasts for months as witnessed in the basin, where it proves its prolonged duration.
All gridded stations witnessed extreme drought -2.89, -2.74, -2.82, -2.1 in 1987 at Mafraq, Wadi Dhulail, Amman, and Zarqa except for Swaileh which received its extreme drought in 2020 around -2.32. there was a delay in describing the essence of drought occurrence until 1990 (-1.76) in Zarqa by assimilation of CMIP6 SSP1. Under CMIP6 projections, the highest drought intensity was estimated in 2004, and 2013 in Swaileh while in Zarqa, the drought intensity occurred in 2013, during the last quarter of 2004, and May 2010. In Wadi Dhulail, 2004, 2010 and 2013 were CMIP6 taking drought highest severity around (-1.73 to -2.86) during 1987, 1990, 1995, 1999, 2004, and 2010. In Amman station under CMIP projections (3 months) the highest drought values vary from severe to extreme drought (-1.51 to -2.89) during the years; 1987, 1990, 1995, 2003, 2004, 2010, 2013, 2015, 2019, and 2021.
At Mafraq station as well under CMIP projections (3 months) the highest drought values vary from severe to extreme drought (-1.51 to -2.89) during the years; 1987, 1998, 1999, the last quarter of the years (2009, and 2012), 2014, 2017, 2018, and 2020.
Therefore, CMIP6 is capable of capturing the drought occurrence and severity by measuring SPI but did not capture the severity magnitude same as from observations (-2.87 by observation and -1.77 by CMIP6). Since this study chooses the sustainable pathway that suggests using green approaches for environmental conditions, the only driven variables that affect drought characteristics are changes in precipitation and temperature under different ground cover. Green land cover signifies drought intensity and duration that is less intensified than bare soil or scattered crops. Further to its capability, CMIP6 estimates the sensitivity of the climate of gridded surface temperatures to the increasing atmospheric CO2 which is defined during a longer analysis period than 40 years. This sensitivity cannot be discovered through observations.
The provided observation datasets estimate the 6-month SPI and compare it to the projected CMIP6 temperature and precipitation monthly gridded data for the reference period 1985-2022. The corresponding drought index for SPI6 calculated by CMIP6 ssp1.5 show identical ups and downs of wet and dry intensity but a delay in observing the change. This can be explained by providing information on CMIP6 that evolves surface soil moisture and crop stress conditions at fine-gridded spatial resolution. Drought indices driven by CMIP6 projections for the same period demonstrate the capability for capturing early signals of flash drought, which is carried by combining hot, dry, and windy conditions leading to higher evaporation stress and hence, rapid soil moisture depletion. Except for a few indices, as shown in Figure 6, the extreme drought occurred in 2013 from July to September (-2.96, 2.-2.91, -3.1) in Amman-Airport station show contrary to the calculated observed SPI6 which shows nearly normal conditions (SPI6 values in Amman station 0.48, -0.09, and -0.03 respectively). Other drought indices corresponding to CMIP6 projections are shifts in drought early signals.
The CSIC global SPEI uses Probability Weighted Moments (PWMs) based on the plotting position formula between sites and across time scales, and this method had no solutions at some geographical sites. The unbiased PWMs yielded excellent results and provided SPEI series with equal variance throughout the basin. It is noticed that the lagged fit of drought severity between the calculated SPEI and the modeled CSIC SPEI might be justified as the results of an unbiased estimator of Probability weighted moment’s methodology of CSIC SPEI.
Longer time scale drought analysis shows a better correlation between SPI and SPEI since it suppresses the variability and outliers of data outputs; SPI12 vs SPEI12 best-fit than SPI6 vs SPEI6 and accordingly the outputs of SPI3 vs SPEI3. Long term drought monitoring is significant for planning and mitigating the impacts of hydrological droughts in any region.
The longest drought duration ranged from 6 months up to 14 months and frequently 12 months duration and 9.9 months on average. The end of drought incident did not necessarily followed by wet period, it often keep tracked by normal drought months (-1.0 ≥ SPI ≥ 0) or short moist breaks.
Drought severity and average intensity were found -24.64 and -1.76, -23.80 and -1.83, -23.57 and -1.96, -23.44 and -2.0 where the corresponding drought categories were SPI 12 -Sweileh, SPI 9 Sweileh, SPI 12 Wadi Dhullail, SPI 12 Amman-Airport.
The dominant drought incident occurred among all stations was between Oct 2020 and Dec 2021. The next occurring incident was in 1999 and followed by 2014 and then once chance of dominant occurrence during 2004 and 2010.
In the study period, the drought events are identified using SPI and SPEI at 12-month temporal scale. The results revealed that there will be continuous and more prolonged drought events in the study area. These droughts will be more frequent, severe and of longer duration. This will be the result of decrease in the amount of precipitation, increase in temperature and rate of evapotranspiration. If prior planning and management strategies are not carried out this will convert the whole study region in permanently desert area. The SPI values are more extreme than that of SPEI in the whole temporal period which indicates that there might be abrupt changes in the amount of precipitation but temperature and rate of evapotranspiration might be changing comparatively at slow rate.
We can notice that ARIMA modelled SPEI-12 declared severe droughts more frequent than modelled TBATS SPEI-12 in Amman-Airport point. Amman, Swaileh and Wadi Dhullail by ARIMA are susceptible to more severe drought as point forecast is > -1.0 CSIC-SPEI-12 intensity the means of low to hi 95%. Mafraq confronts normal dryness conditions with average drought intensity ARIMA-SPI by -0.786 but TBATS expects severe drought in Mafraq from Jan 2022 to April 2023. The CMIP6-ssp126 SPI and SPEI modelled TBATS and ARIMA results revealed that all months during the study period (2022-2025) will be dry as compared to the historical period (1985-2021).
The performance metrics ME, RMSE, MAE, and MASE give indication of significantly promising models for forecasting since it corresponds to the observed data. Where the trends differed only a little by using the CSIC index as an input, hybrid modelling is suggested for more consistency and robustness of forecasting approaches. In general, TBATS and ARIMA have performed slightly differently depending on the inputs. The mid-term to long-term prediction generally failed to achieve inevitable certainty which requires continuous scientific future work in drought signals predictions.
5. Conclusions
The longest drought duration ranged from 6 months up to 14 months and fre-quently 12 months duration and 9.9 months on average. The end of drought incident did not necessarily follow by wet period, it often keep tracked by normal drought months (-1.0 ≥ SPI ≥ 0) or short moist breaks.
Drought severity and average intensity were found -24.64 and -1.76, -23.80 and -1.83, -23.57 and -1.96, -23.44 and -2.0 where the corresponding drought categories were SPI 12 -Sweileh, SPI 9 Sweileh, SPI 12 Wadi Dhullail, SPI 12 Amman-Airport.
The dominant drought incident occurred among all stations was between Oct 2020 and Dec 2021. The next occurring incident was in 1999 and followed by 2014 and then once chance of dominant occurrence during 2004 and 2010.
The results revealed that there will be continuous and more prolonged drought events in the study area. These droughts will be more frequent, severe and of longer duration. This will be the result of decrease in the amount of precipitation, increase in tempera-ture and rate of evapotranspiration. If prior planning and management strategies are not carried out this will affect the area vulnerability. The SPI values are more extreme than that of SPEI in the whole temporal period which indicates that there might be abrupt changes in the amount of precipitation, but temperature and rate of evapotranspiration might be changing comparatively at slow rate.
We can notice that ARIMA modelled SPEI-12 declared severe droughts more frequent than modelled TBATS SPEI-12 in Amman-Airport point. Amman, Swaileh and Wadi Dhullail by ARIMA are susceptible to more severe drought as point forecast is > -1.0 CSIC-SPEI-12 intensity the means of low to hi 95%. Mafraq confronts normal dry-ness conditions with average drought intensity ARIMA-SPI by -0.786 but TBATS expects severe drought in Mafraq from Jan 2022 to April 2023.
SPI relies on the possibility of precipitation deficit over multiple timescales 3, 6, 9, and 12-month timescales. This deficit considers soil moisture response to precipitation variations over time and different locations on quite short scale, while it considers longer-term for groundwater, streams and reservoirs. Drought events occur and continue (drought intensity) anytime that SPI is negative and reach -1.0 or less. Drought lasts for months as witnessed in the basin, where it proves its prolonged duration.
By looking at SPEI forecast, ARIMA was the most accurate model to forecast drought index using the observed historical SPEI and CSIC over all stations.
Autocorrelation function (ACF) revealed that the present forecast values were not correlated with former ones. The ACF between each point and the next point in the timeseries ranged (-0.0393 to 0.283) by ARIMA and from (-0.0253 to 0.937) by TBATS for all datasets except CSIC.
CMIP6 is capable of capturing the drought occurrence and severity by measuring SPI but did not capture the severity magnitude same as from observations (-2.87 by obser-vation and -1.77 by CMIP6). Since this study chooses the sustainable pathway that suggests using green approaches for environmental conditions, the only driven varia-bles that affect drought characteristics are changes in precipitation and temperature under different ground cover. Green land cover signifies drought intensity and dura-tion that is less intensified than bare soil or scattered crops. Further to its capability, CMIP6 estimates the sensitivity of the climate of gridded surface temperatures to the increasing atmospheric CO2 which is defined during a longer analysis period than 40 years. This sensitivity cannot be discovered through observations.
The CSIC global SPEI uses Probability Weighted Moments (PWMs) based on the plotting position formula between sites and across time scales, and this method had no solutions at some geographical sites. The unbiased PWMs yielded excellent results and provided SPEI series with equal variance throughout the basin. It is noticed that the lagged fit of drought severity between the calculated SPEI and the modeled CSIC SPEI might be justified as the results of an unbiased estimator of Probability weighted mo-ment’s methodology of CSIC SPEI.
Longer time scale drought analysis shows a better correlation between SPI and SPEI since it suppresses the variability and outliers of data outputs; SPI12 vs SPEI12 best-fit than SPI6 vs SPEI6 and accordingly the outputs of SPI3 vs SPEI3. Long term drought monitoring is significant for planning and mitigating the impacts of hydrological droughts in any region.
The performance metrics ME, RMSE, MAE, and MASE give indication that TBATS and ARIMA are significantly promising models for forecasting since it corresponds to the observed data. Where the trends differed only a little by using the CSIC index as an input, hybrid modelling is suggested for more consistency and robustness of forecasting approaches. In general, TBATS and ARIMA have performed slightly differently depending on the inputs. The mid-term to long-term prediction generally failed to achieve inevitable certainty which requires continuous scientific future work in drought signals pre-dictions.
Author Contributions
Conceptualization, N.H.; methodology, N.H.; software, N.H. F. A. S.; validation, N.H., F.A.-S., and Y.D.; formal analysis, N.H. and F.A.-S.; investigation, N.H.; resources, N.H. and F.A.-S.; data interpretation, N.H., F.A.-S., and Y.D; writing—original draft preparation, N.H.; writing—review and editing, N.H., F.A.-S., and Y.D; visualization, N.H.; supervision, Y.D. and F. A. S.; funding acquisition, Y.D. All authors have read and agreed to the published version of the manuscript.
Funding
This publications fees were funded by Beihang University- Beijing.
Data Availability Statement
data availability upon request.
Acknowledgments
The authors would like to thank the Ministry of Water and Irrigation- Jordan, CMIP6 and CSIC for making their modelling outputs available.
Conflicts of Interest
“The authors declare no conflict of interest.”
References
- Moazzam, M.F.U.; Lee, B.G.; Rahman, G.; Waqas, T. Spatial Rainfall Variability and an Increasing Threat of Drought, According to Climate Change in Uttaradit Province, Thailand. Atmos. Clim. Sci. 2020, 10. [Google Scholar] [CrossRef]
- Rafiq, M.; Li, Y.C.; Cheng, Y.; Rahman, G.; Ullah, I.; Ali, A. Spatial and temporal fluctuation of rainfall and drought in Balochistan province, Pakistan. Arab. J. Geosci. 2022, 15. [Google Scholar] [CrossRef]
- Atta-ur-Rahman; Dawood, M. Spatio-statistical analysis of temperature fluctuation using Mann–Kendall and Sen’s slope approach. Clim. Dyn. 2017, 48. [Google Scholar] [CrossRef]
- Ndayiragije, J.M.; Li, F. Effectiveness of Drought Indices in the Assessment of Different Types of Droughts, Managing and Mitigating Their Effects. Climate 2022, 10. [Google Scholar] [CrossRef]
- Müller, L.M.; Bahn, M. Drought legacies and ecosystem responses to subsequent drought. Glob. Chang. Biol. 2022, 28. [Google Scholar] [CrossRef]
- Mukherjee, S.; Mishra, A.; Trenberth, K.E. Climate Change and Drought: a Perspective on Drought Indices. Curr. Clim. Chang. Reports 2018, 4. [Google Scholar] [CrossRef]
- Khan, A.A.; Zhao, Y.; khan, J.; Rahman, G.; Rafiq, M.; Moazzam, M.F.U. Spatial and Temporal Analysis of Rainfall and Drought Condition in Southwest Xinjiang in Northwest China, Using Various Climate Indices. Earth Syst. Environ. 2021, 5. [Google Scholar] [CrossRef]
- Dai, A. Increasing drought under global warming in observations and models. Nat. Clim. Chang. 2013, 3. [Google Scholar] [CrossRef]
- He, X.; Pan, M.; Wei, Z.; Wood, E.F.; Sheffield, J. A global drought and flood catalogue from 1950 to 2016. Bull. Am. Meteorol. Soc. 2020, 101. [Google Scholar] [CrossRef]
- Asadieh, B.; Krakauer, N.Y. Global trends in extreme precipitation: Climate models versus observations. Hydrol. Earth Syst. Sci. 2015, 19. [Google Scholar] [CrossRef]
- Alamgir, M.; Shahid, S.; Hazarika, M.K.; Nashrrullah, S.; Harun, S. Bin; Shamsudin, S. Analysis of Meteorological Drought Pattern During Different Climatic and Cropping Seasons in Bangladesh. J. Am. Water Resour. Assoc. 2015, 51. [Google Scholar] [CrossRef]
- Strazzo, S.; Collins, D.C.; Schepen, A.; Wang, Q.J.; Becker, E.; Jia, L. Application of a hybrid statistical-dynamical system to seasonal prediction of north american temperature and precipitation. Mon. Weather Rev. 2019, 147. [Google Scholar] [CrossRef]
- McKee, T.B.; Nolan, J.; Kleist, J. The relationship of drought frequency and duration to time scales. Prepr. Eighth Conf. Appl. Climatol. Amer. Meteor, Soc.
- Wilhite, D.; Svoboda, M.; Hayes, M. A: the complex impacts of drought, 2007.
- Vicente-Serrano, S.M.; Beguería, S. Comment on “Candidate distributions for climatological drought indices (SPI and SPEI)” by James H. Stagge et al. Int. J. Climatol. 2016, 36. [Google Scholar] [CrossRef]
- Tigkas, D.; Vangelis, H.; Tsakiris, G. DrinC: a software for drought analysis based on drought indices. Earth Sci. Informatics 2015, 8. [Google Scholar] [CrossRef]
- Surendran, U.; Kumar, V.; Ramasubramoniam, S.; Raja, P. Development of Drought Indices for Semi-Arid Region Using Drought Indices Calculator (DrinC) – A Case Study from Madurai District, a Semi-Arid Region in India. Water Resour. Manag. 2017, 31. [Google Scholar] [CrossRef]
- Li, J.; Wang, Y.; Li, Y.; Ming, W.; Long, Y.; Zhang, M. Relationship between meteorological and hydrological droughts in the upstream regions of the Lancang–Mekong River. J. Water Clim. Chang. 2022, 13. [Google Scholar] [CrossRef]
- Beguería, S.; Vicente-Serrano, S.M.; Angulo-Martínez, M. A multiscalar global drought dataset: The SPEI base: A new gridded product for the analysis of drought variability and impacts. Bull. Am. Meteorol. Soc. 2010, 91. [Google Scholar] [CrossRef]
- Malik, A.; Kumar, A.; Salih, S.Q.; Yaseen, Z.M. Hydrological Drought Investigation Using Streamflow Drought Index. In; 2021.
- Aiyelokun, O.; Ogunsanwo, G.; Ojelabi, A.; Agbede, O. Gaussian Naïve Bayes Classification Algorithm for Drought and Flood Risk Reduction. In; 2021.
- Talukdar, S.; Singha, P.; Mahato, S.; Shahfahad; Pal, S. ; Liou, Y.A.; Rahman, A. Land-use land-cover classification by machine learning classifiers for satellite observations-A review. Remote Sens. 2020, 12. [Google Scholar] [CrossRef]
- Dawood, M.; Rahman, A. ur; Ullah, S.; Mahmood, S.; Rahman, G.; Azam, K. Spatio-statistical analysis of rainfall fluctuation, anomaly and trend in the Hindu Kush region using ARIMA approach. Nat. Hazards 2020, 101. [Google Scholar] [CrossRef]
- Rahman, G.; Rahman, A.; Anwar, M.M.; Dawood, M.; Miandad, M. Spatio-temporal analysis of climatic variability, trend detection, and drought assessment in Khyber Pakhtunkhwa, Pakistan. Arab. J. Geosci. 2022, 15. [Google Scholar] [CrossRef]
- Li, C.; Zwiers, F.; Zhang, X.; Li, G.; Sun, Y.; Wehner, M. Changes in annual extremes of daily temperature and precipitation in CMIP6 models. J. Clim. 2021, 34. [Google Scholar] [CrossRef]
- Riahi, K.; van Vuuren, D.P.; Kriegler, E.; Edmonds, J.; O’Neill, B.C.; Fujimori, S.; Bauer, N.; Calvin, K.; Dellink, R.; Fricko, O.; et al. The Shared Socioeconomic Pathways and their energy, land use, and greenhouse gas emissions implications: An overview. Glob. Environ. Chang. 2017, 42. [Google Scholar] [CrossRef]
- Abotaleb, M.; Makarovskikh, T.; Yonar, A.; Badr, A.; Mishra, P.; Kathal, D.; Williams, A.J.; Yonar, H. State of the art in wind speed in England using BATS, TBATS, Holt’s Linear and ARIMA model. Mausam 2022, 73. [Google Scholar] [CrossRef]
- Perone, G. Comparison of ARIMA, ETS, NNAR, TBATS and hybrid models to forecast the second wave of COVID-19 hospitalizations in Italy. Eur. J. Heal. Econ. 2022, 23. [Google Scholar] [CrossRef] [PubMed]
Figure 1.
study area location and meteorological stations’ location within the basin.2. Materials and Methods.
Figure 1.
study area location and meteorological stations’ location within the basin.2. Materials and Methods.
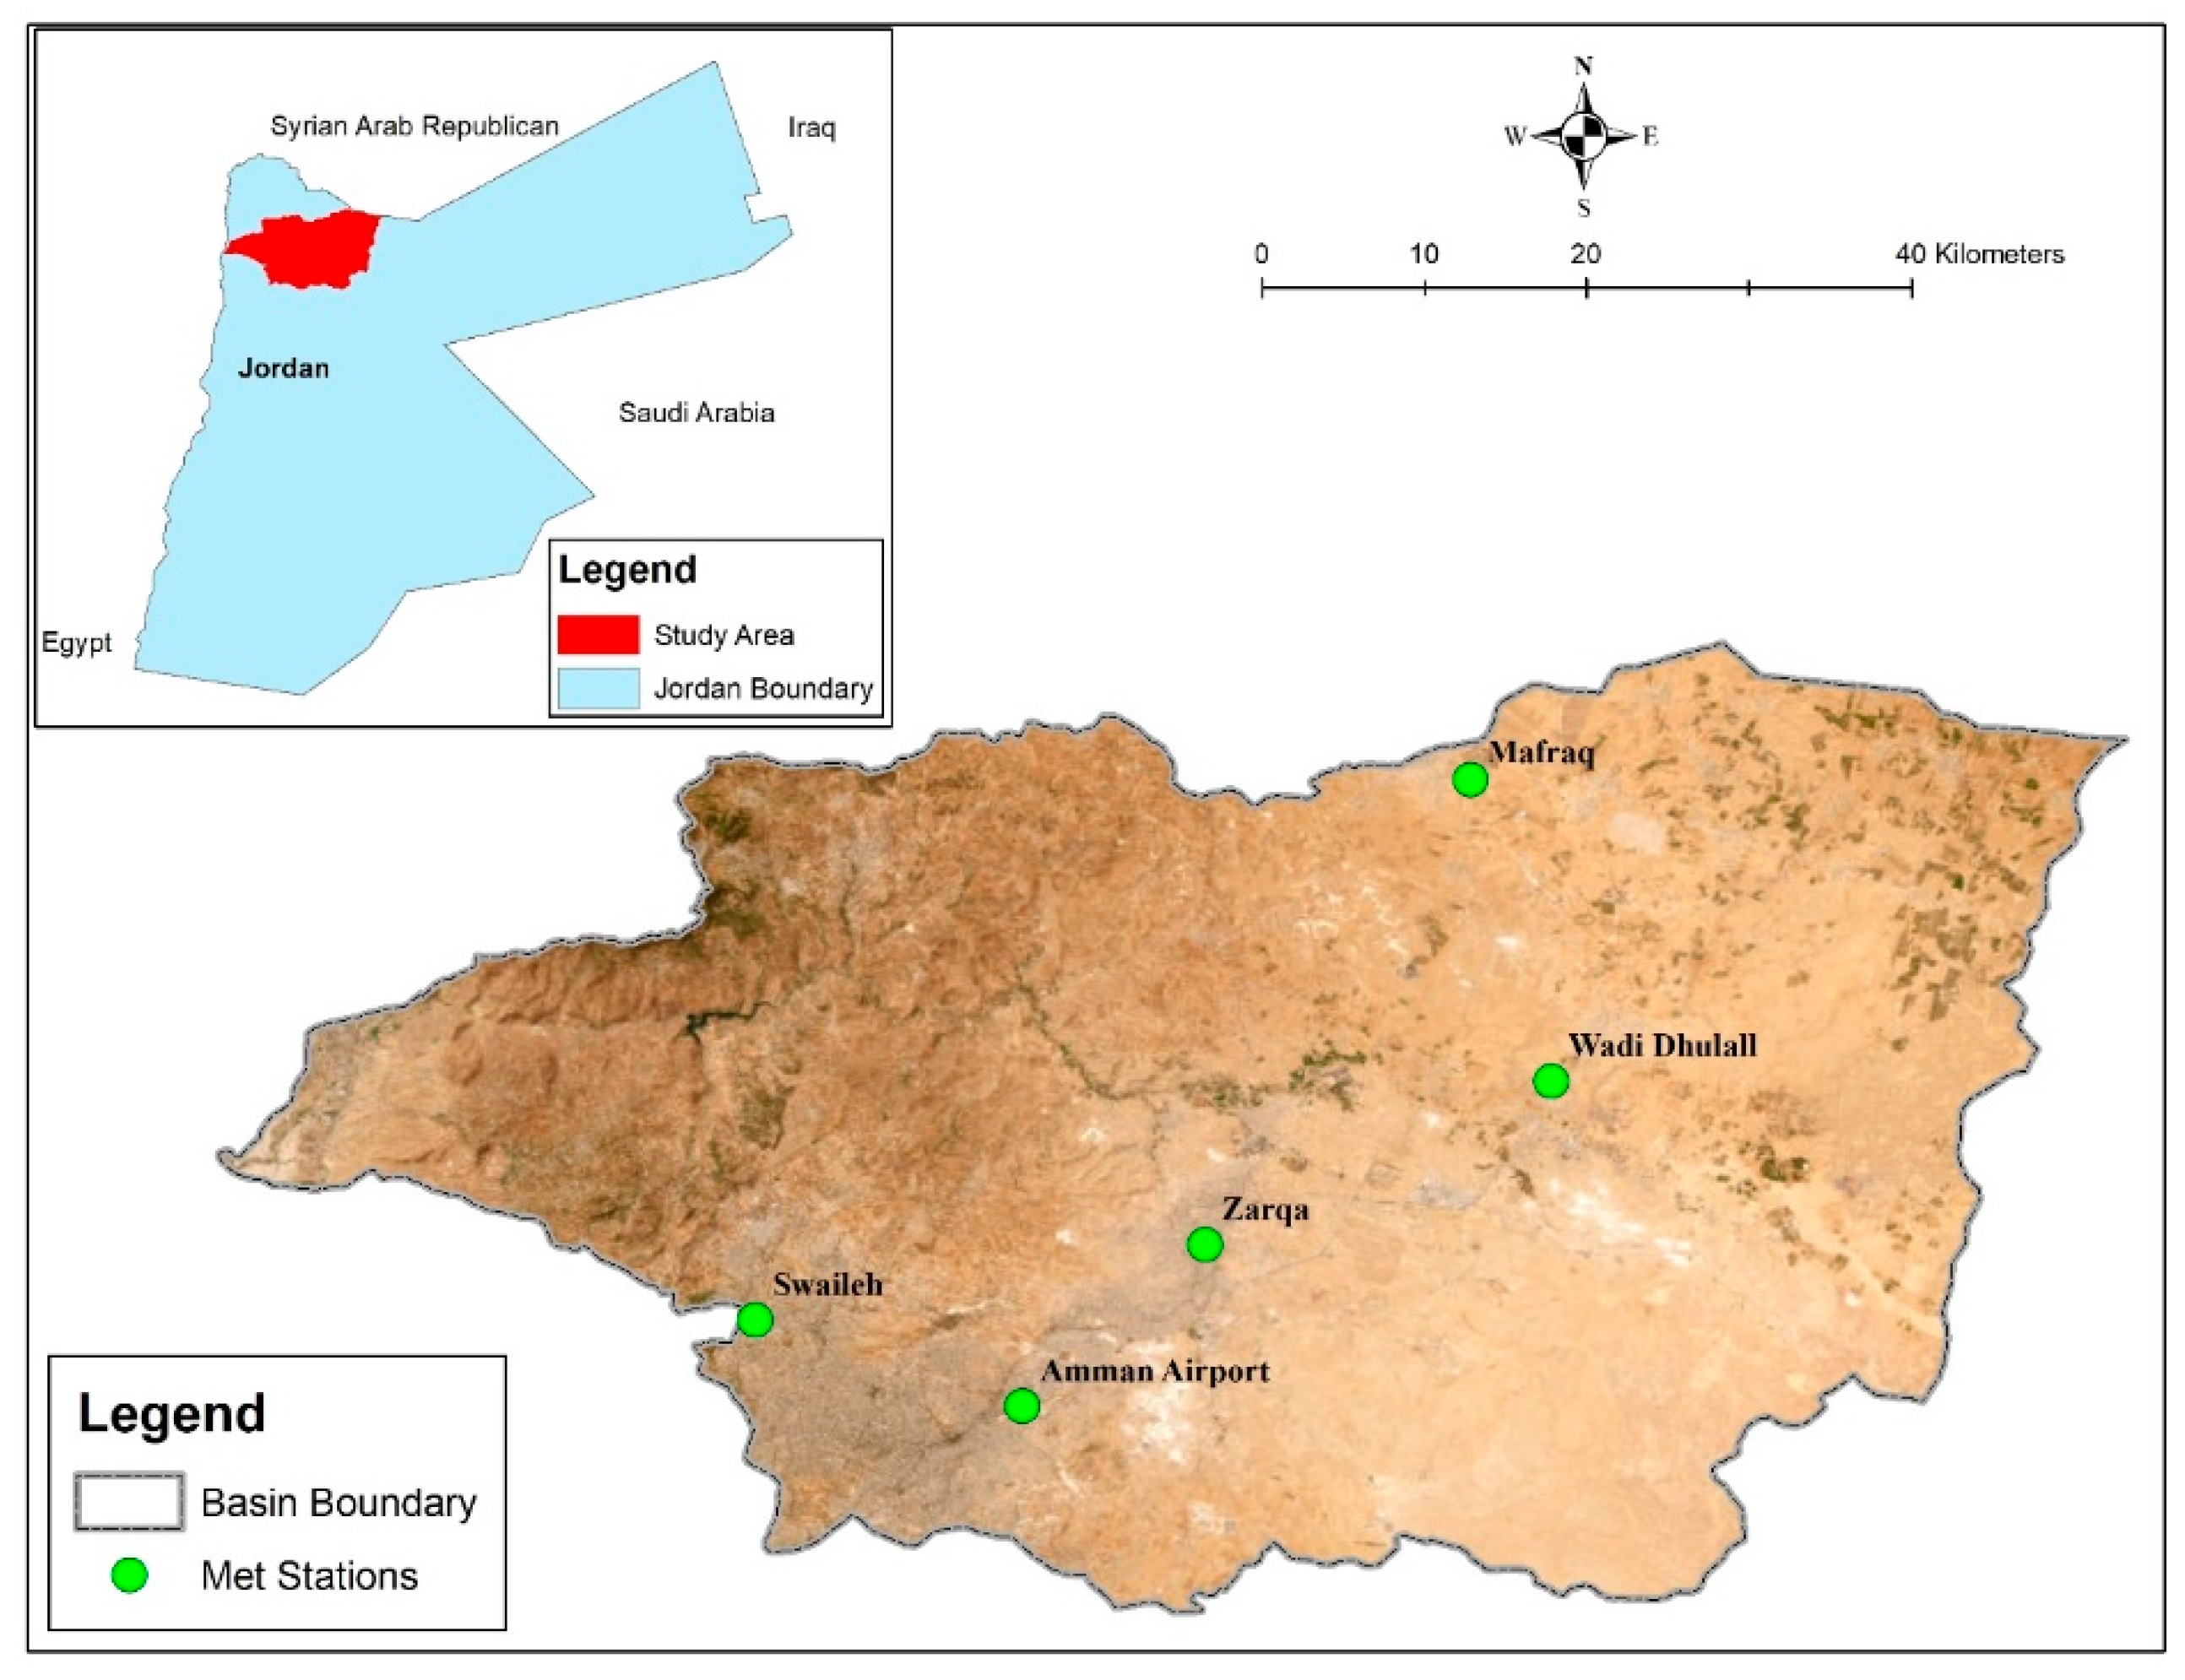
Figure 2.
Temporal Analysis of 3-Months, 6-Months, 9-Months, & 12-Months SPI and SPEI using climatological observations, and projections of climate models for CMIP6-SSP126 and CSIC downscaled datasets across the Basin’s main stations in this order: Amman-Airport, Mafraq, Zarqa, Wadi-Dulail and Swaileh.
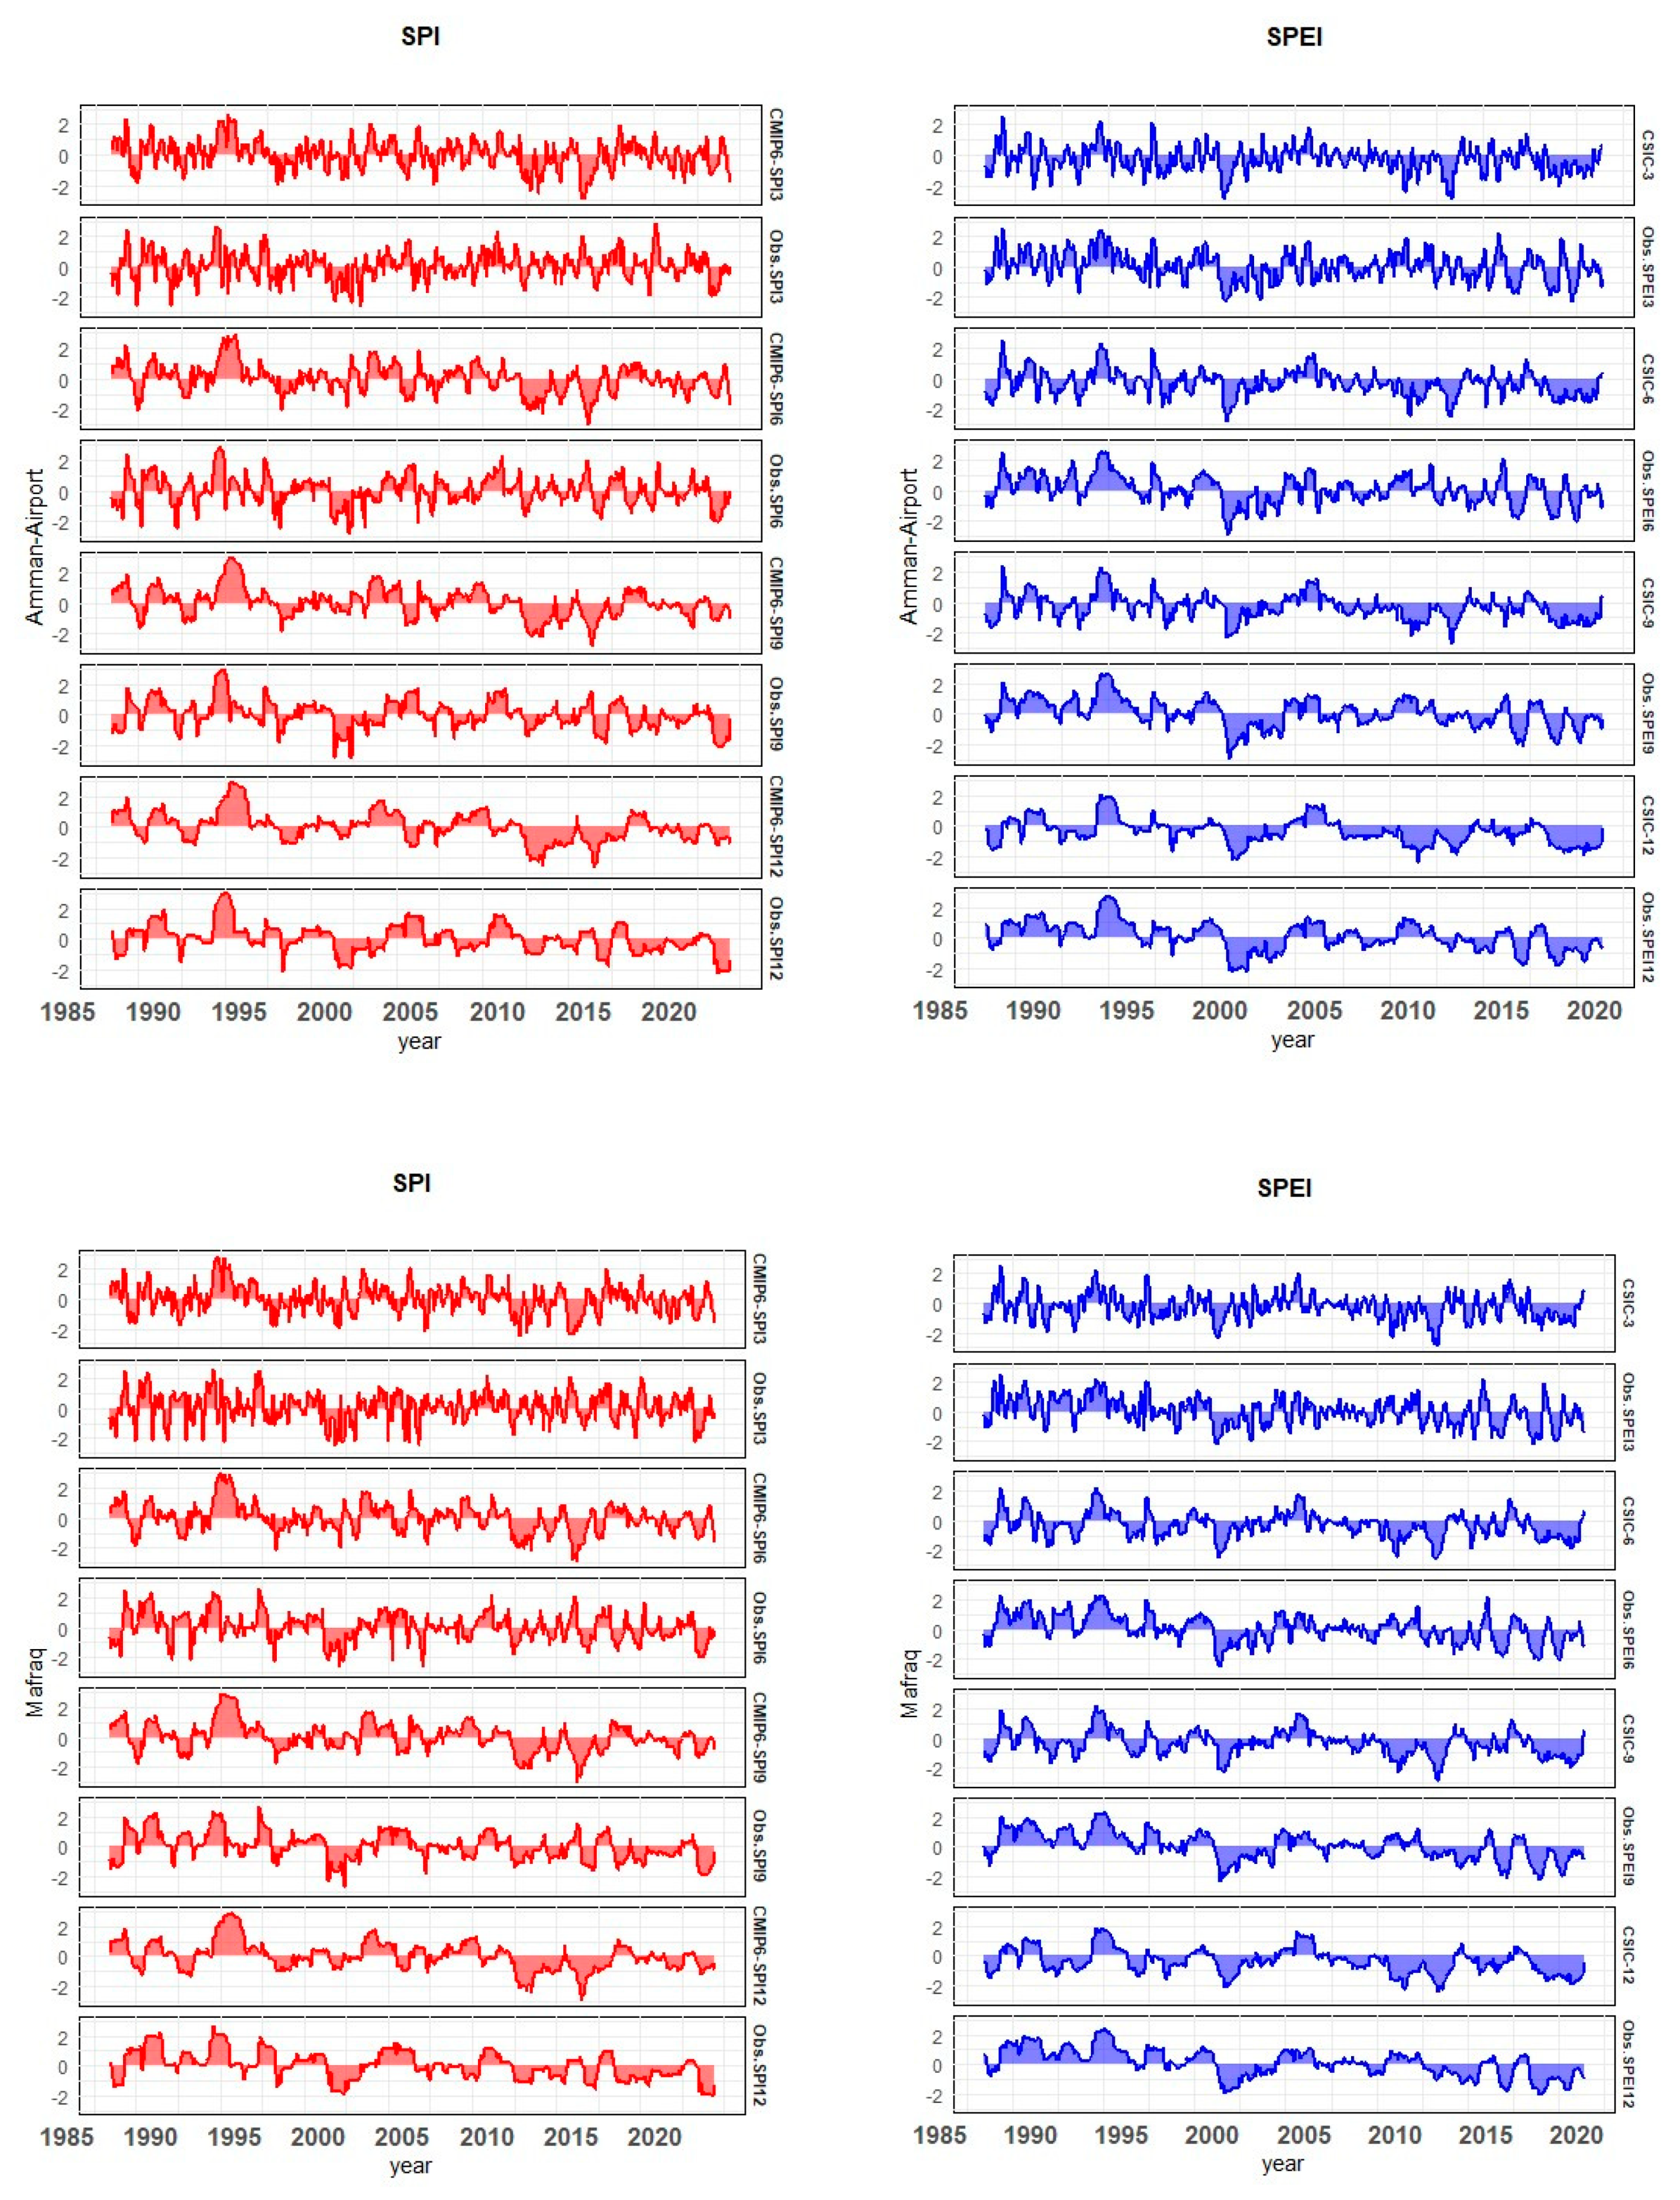
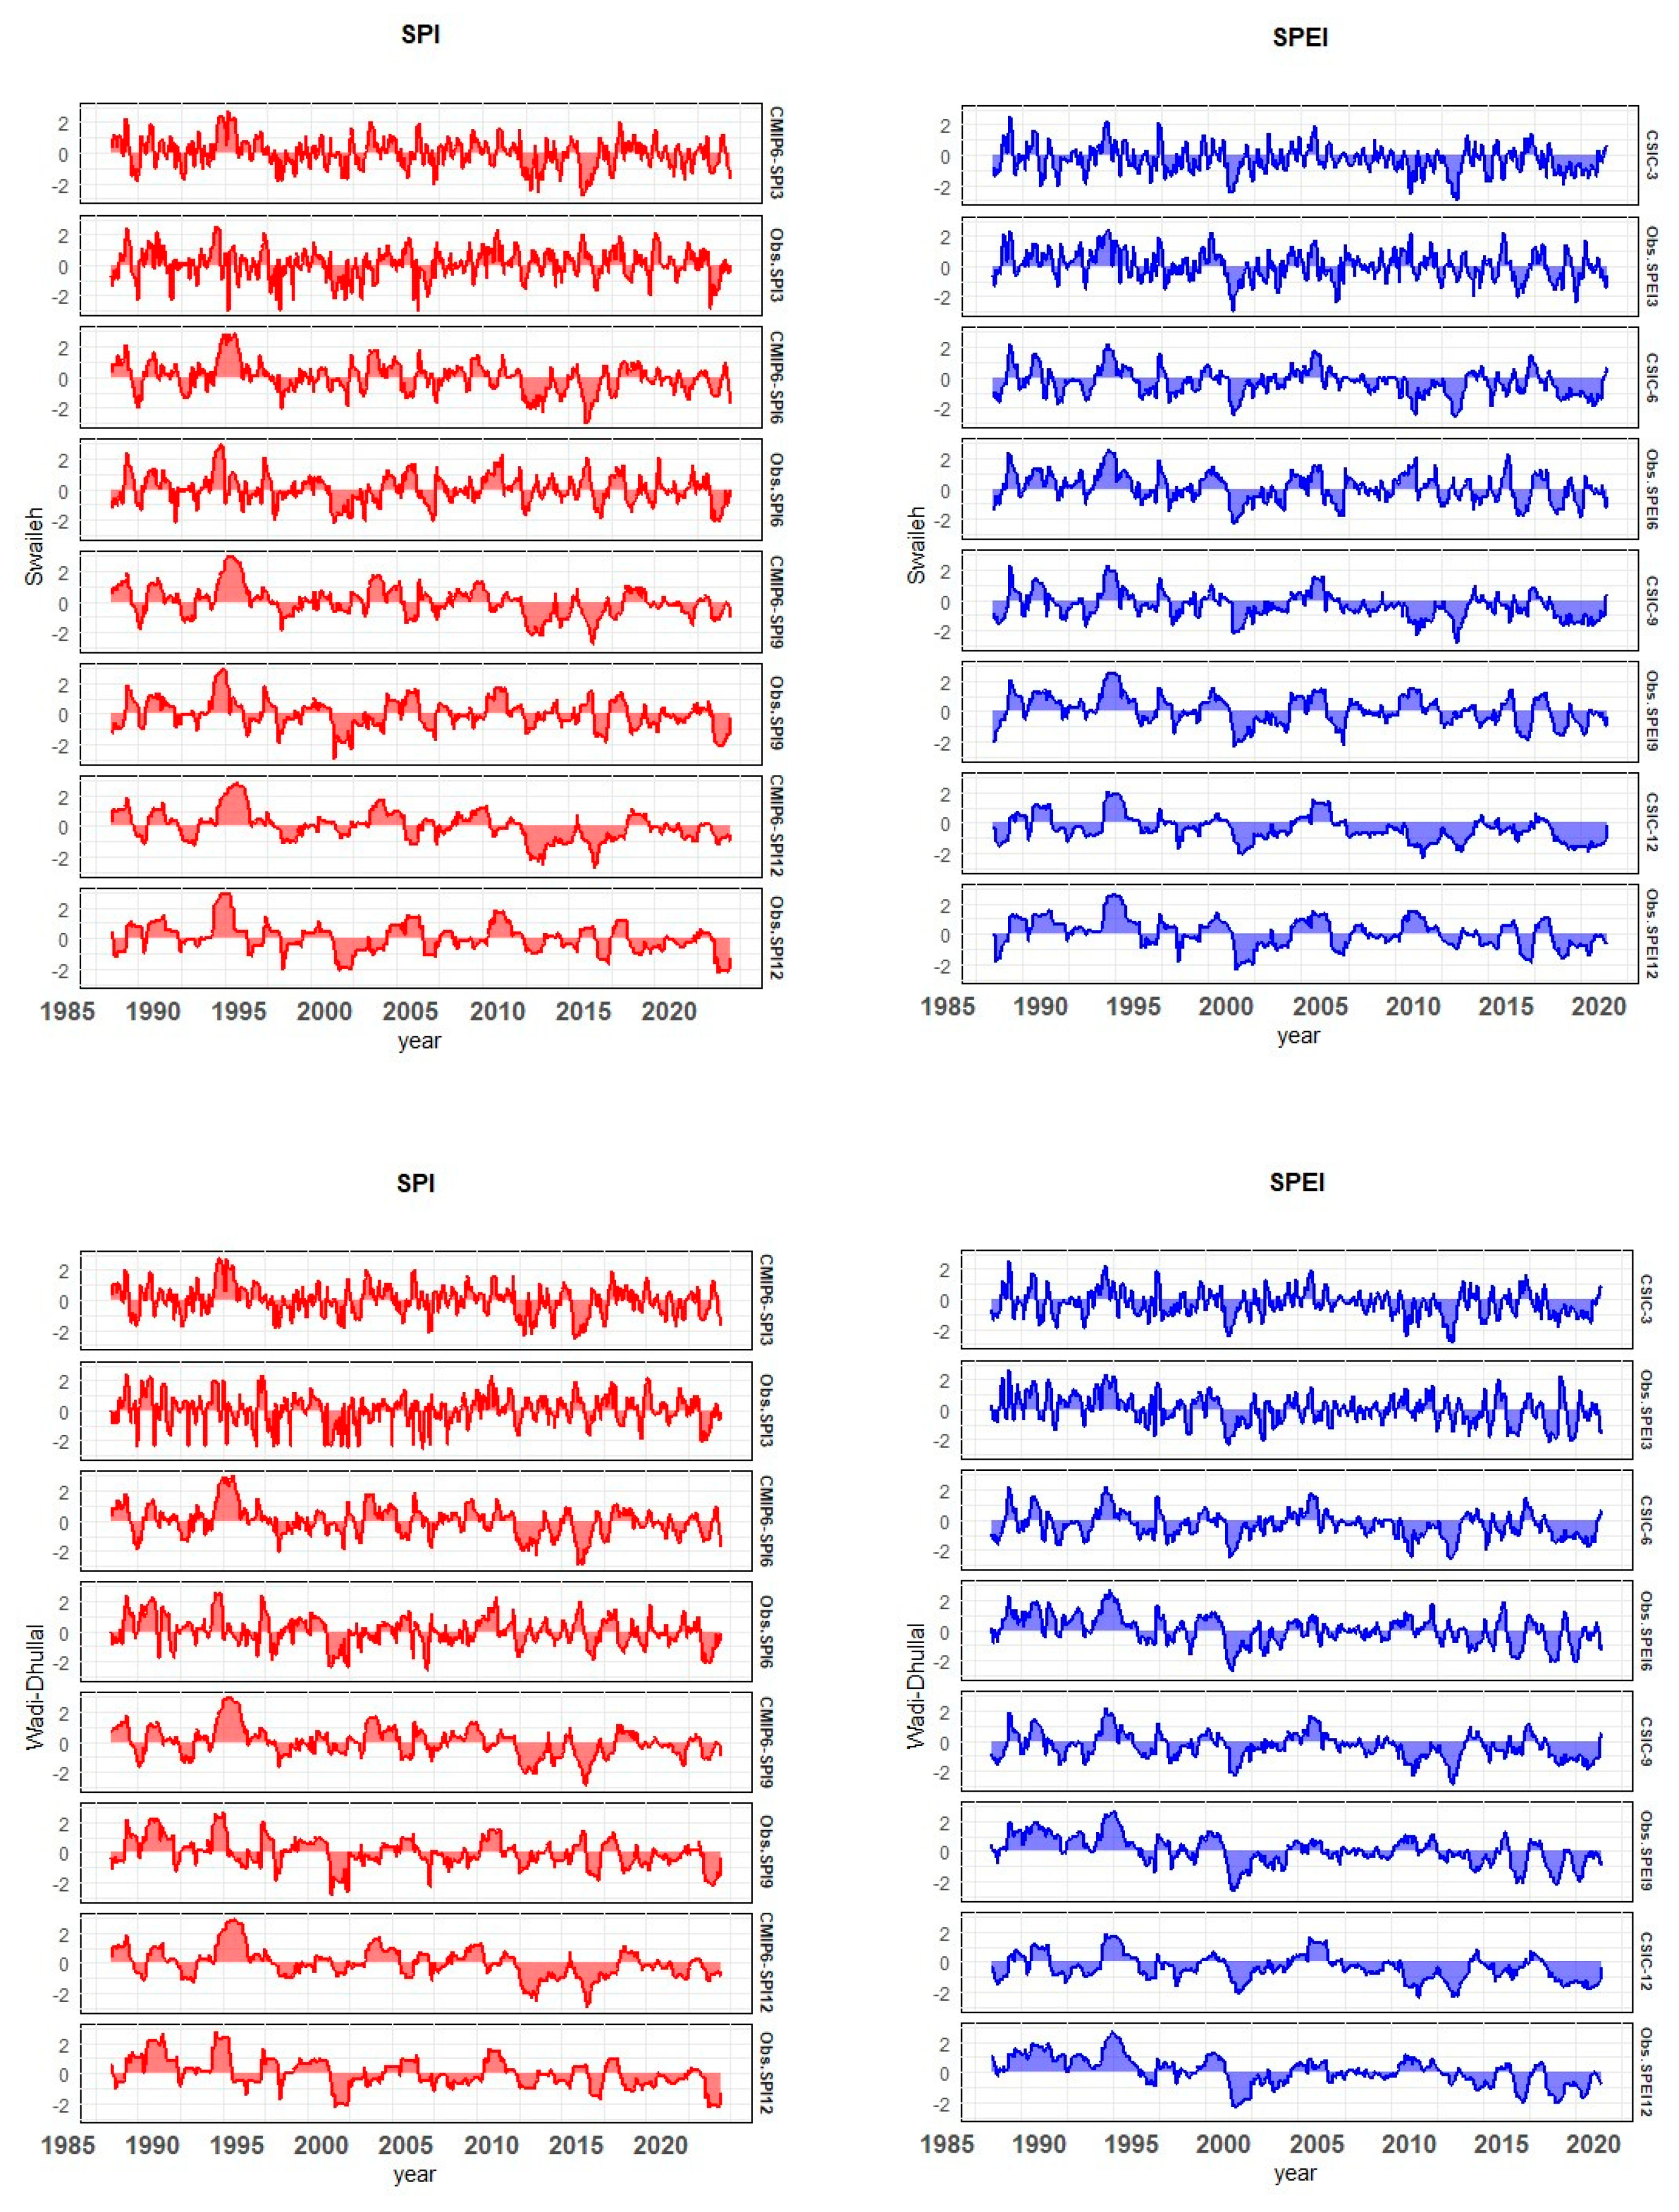
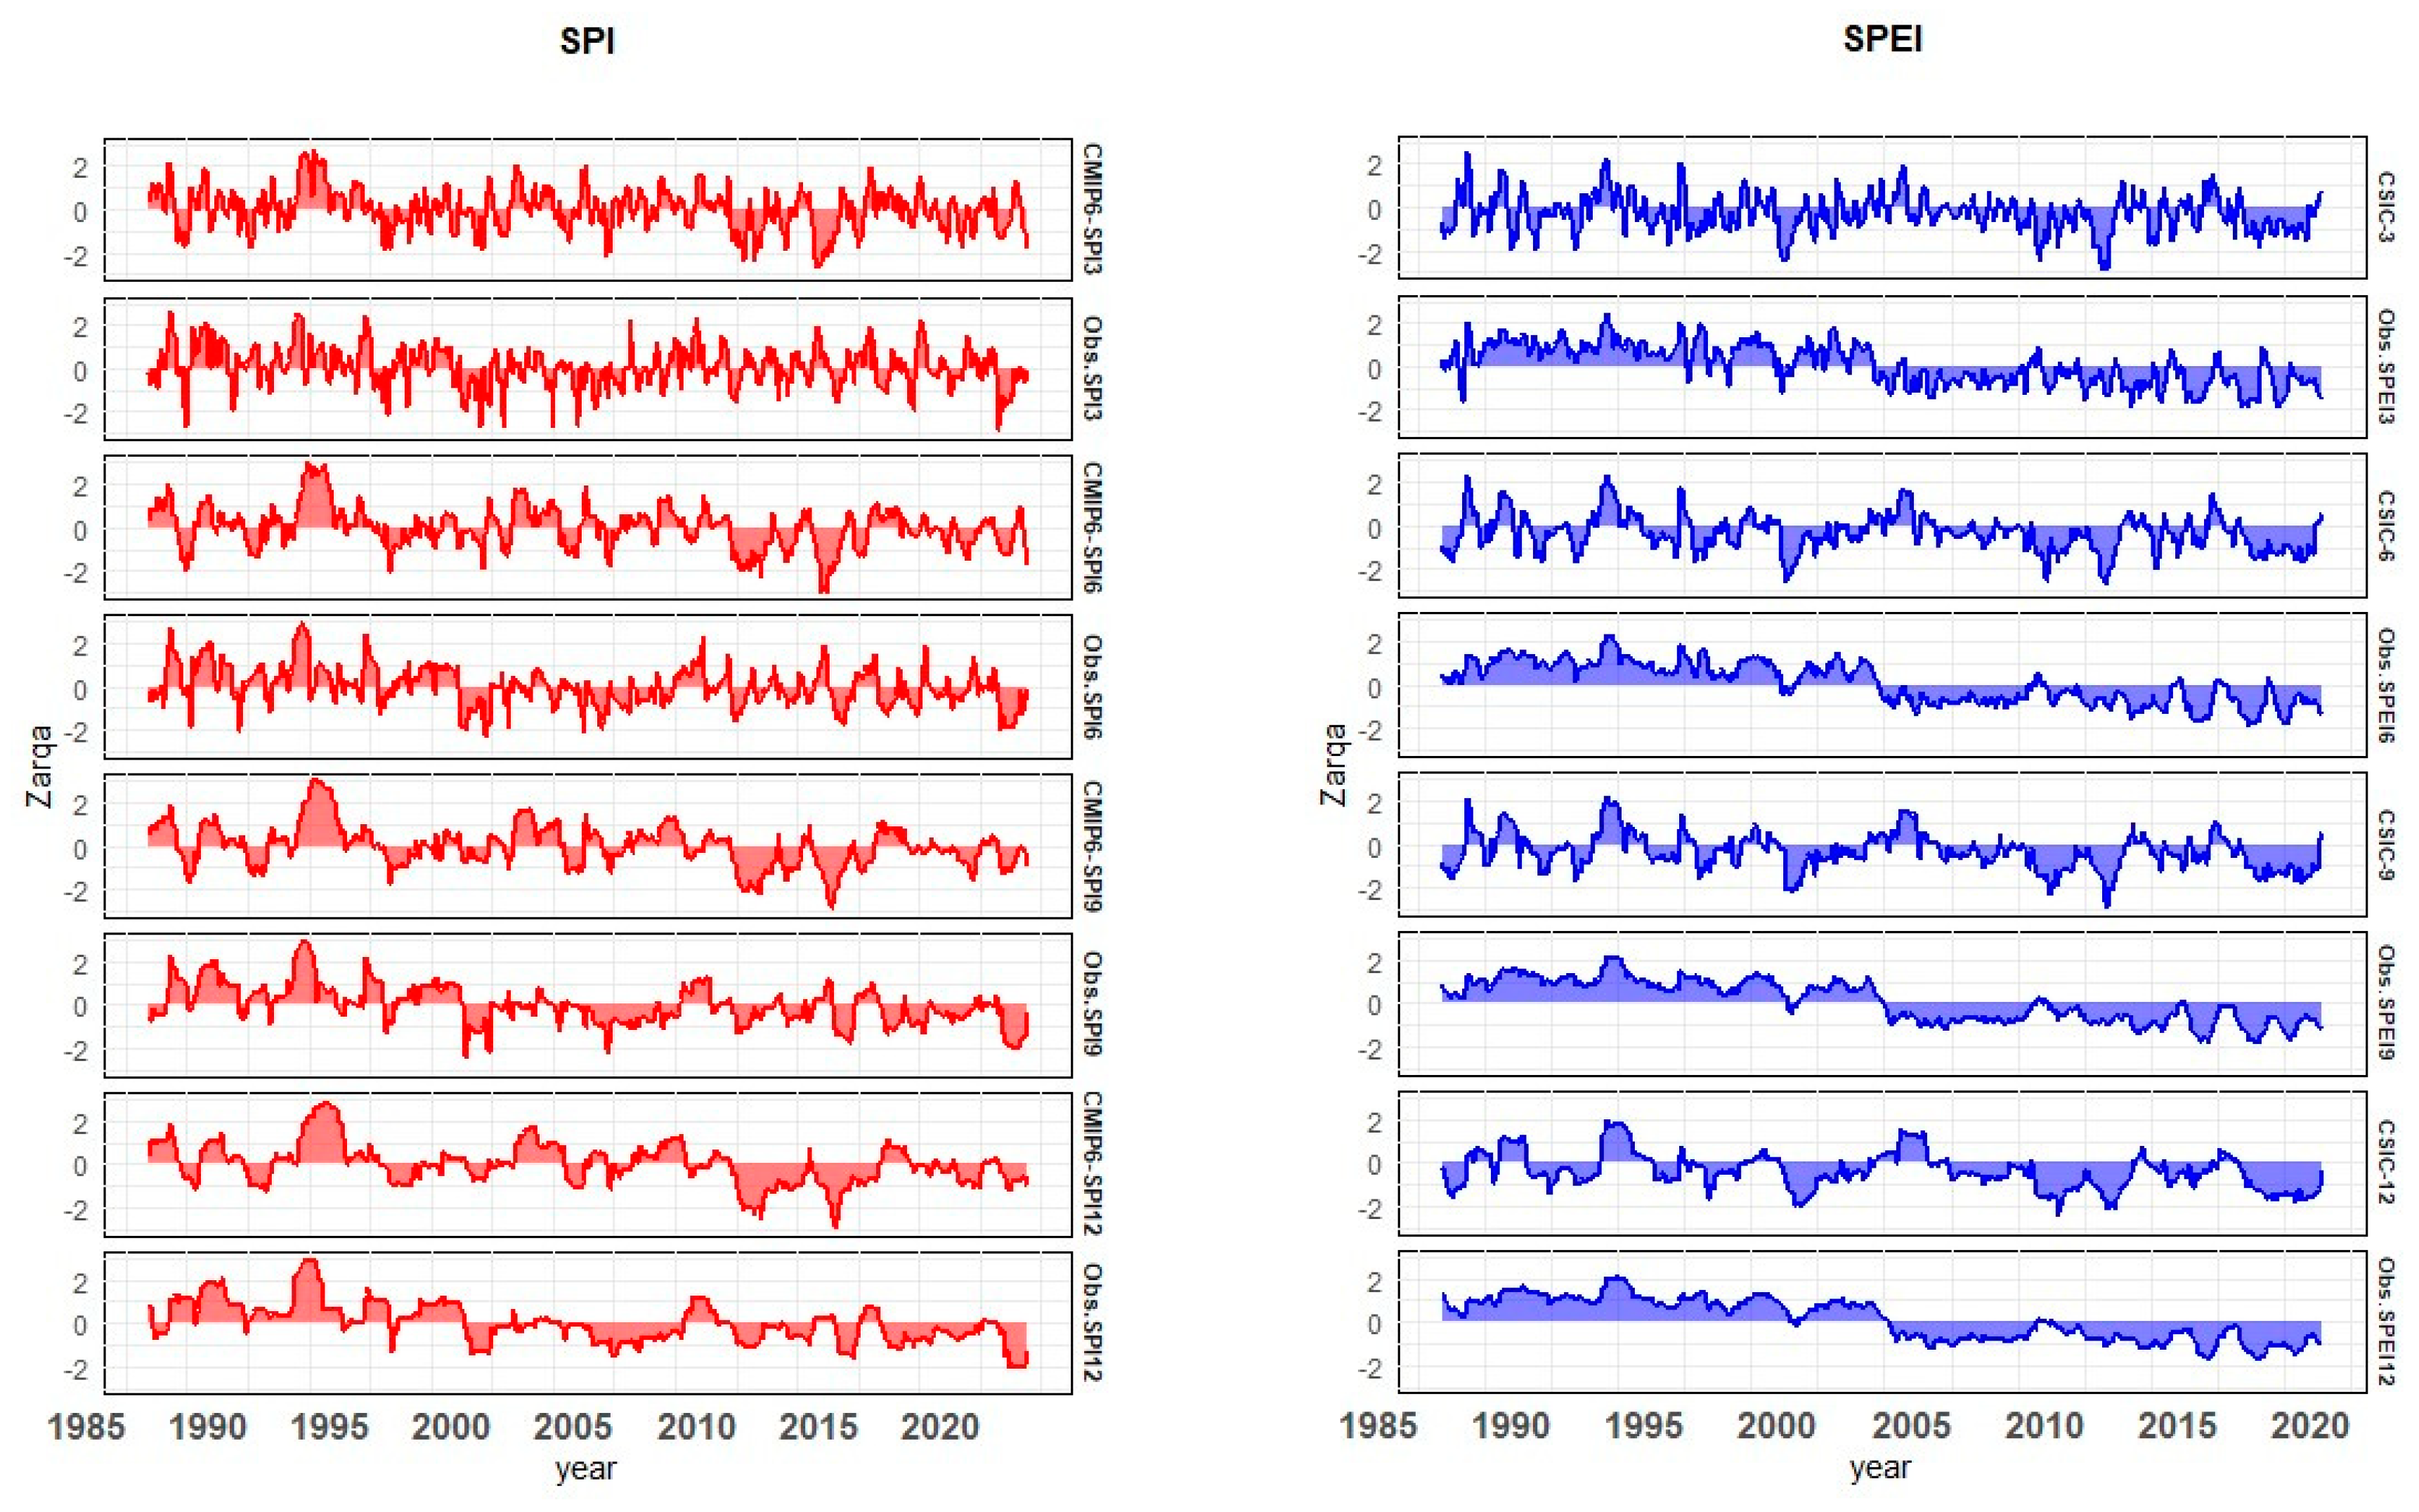
Figure 3.
Pearson Correlation Matrix among different drought indices. Scatterplot of 12-Months SPEI vs. 12-Months SPI in (a) Amman Airport,(b) Zarqa, (c) Wadi Dhullal, (d) Swaileh, (e) Mafraq for the period 1985-2021 showing the R-squared value per each station in the scatterplots.
Figure 3.
Pearson Correlation Matrix among different drought indices. Scatterplot of 12-Months SPEI vs. 12-Months SPI in (a) Amman Airport,(b) Zarqa, (c) Wadi Dhullal, (d) Swaileh, (e) Mafraq for the period 1985-2021 showing the R-squared value per each station in the scatterplots.
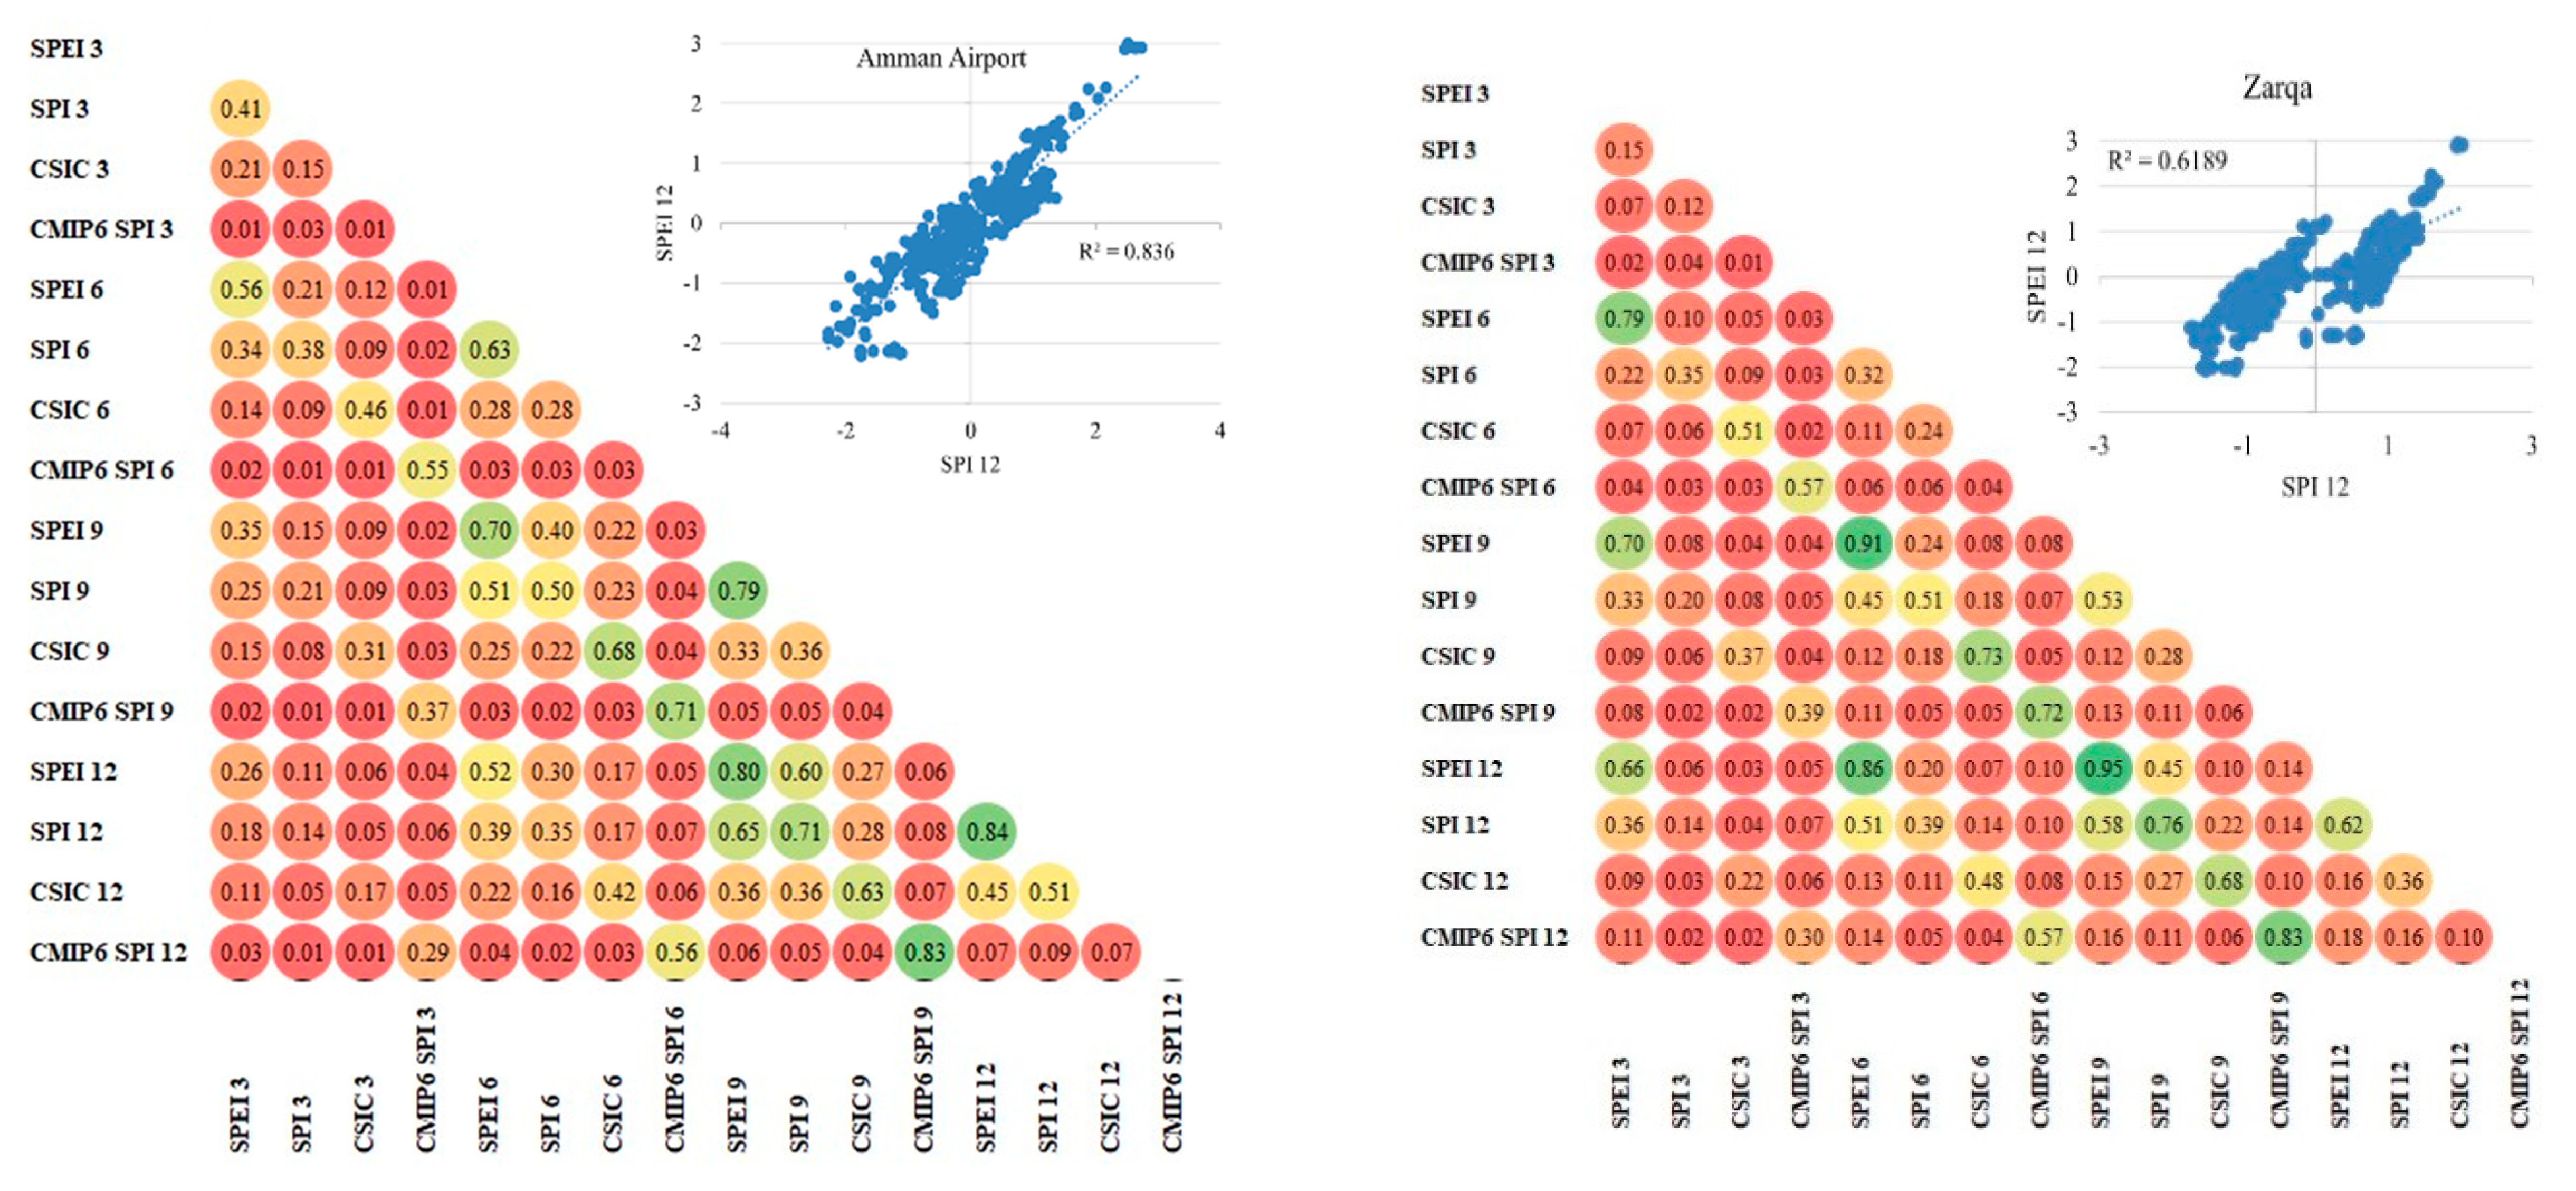
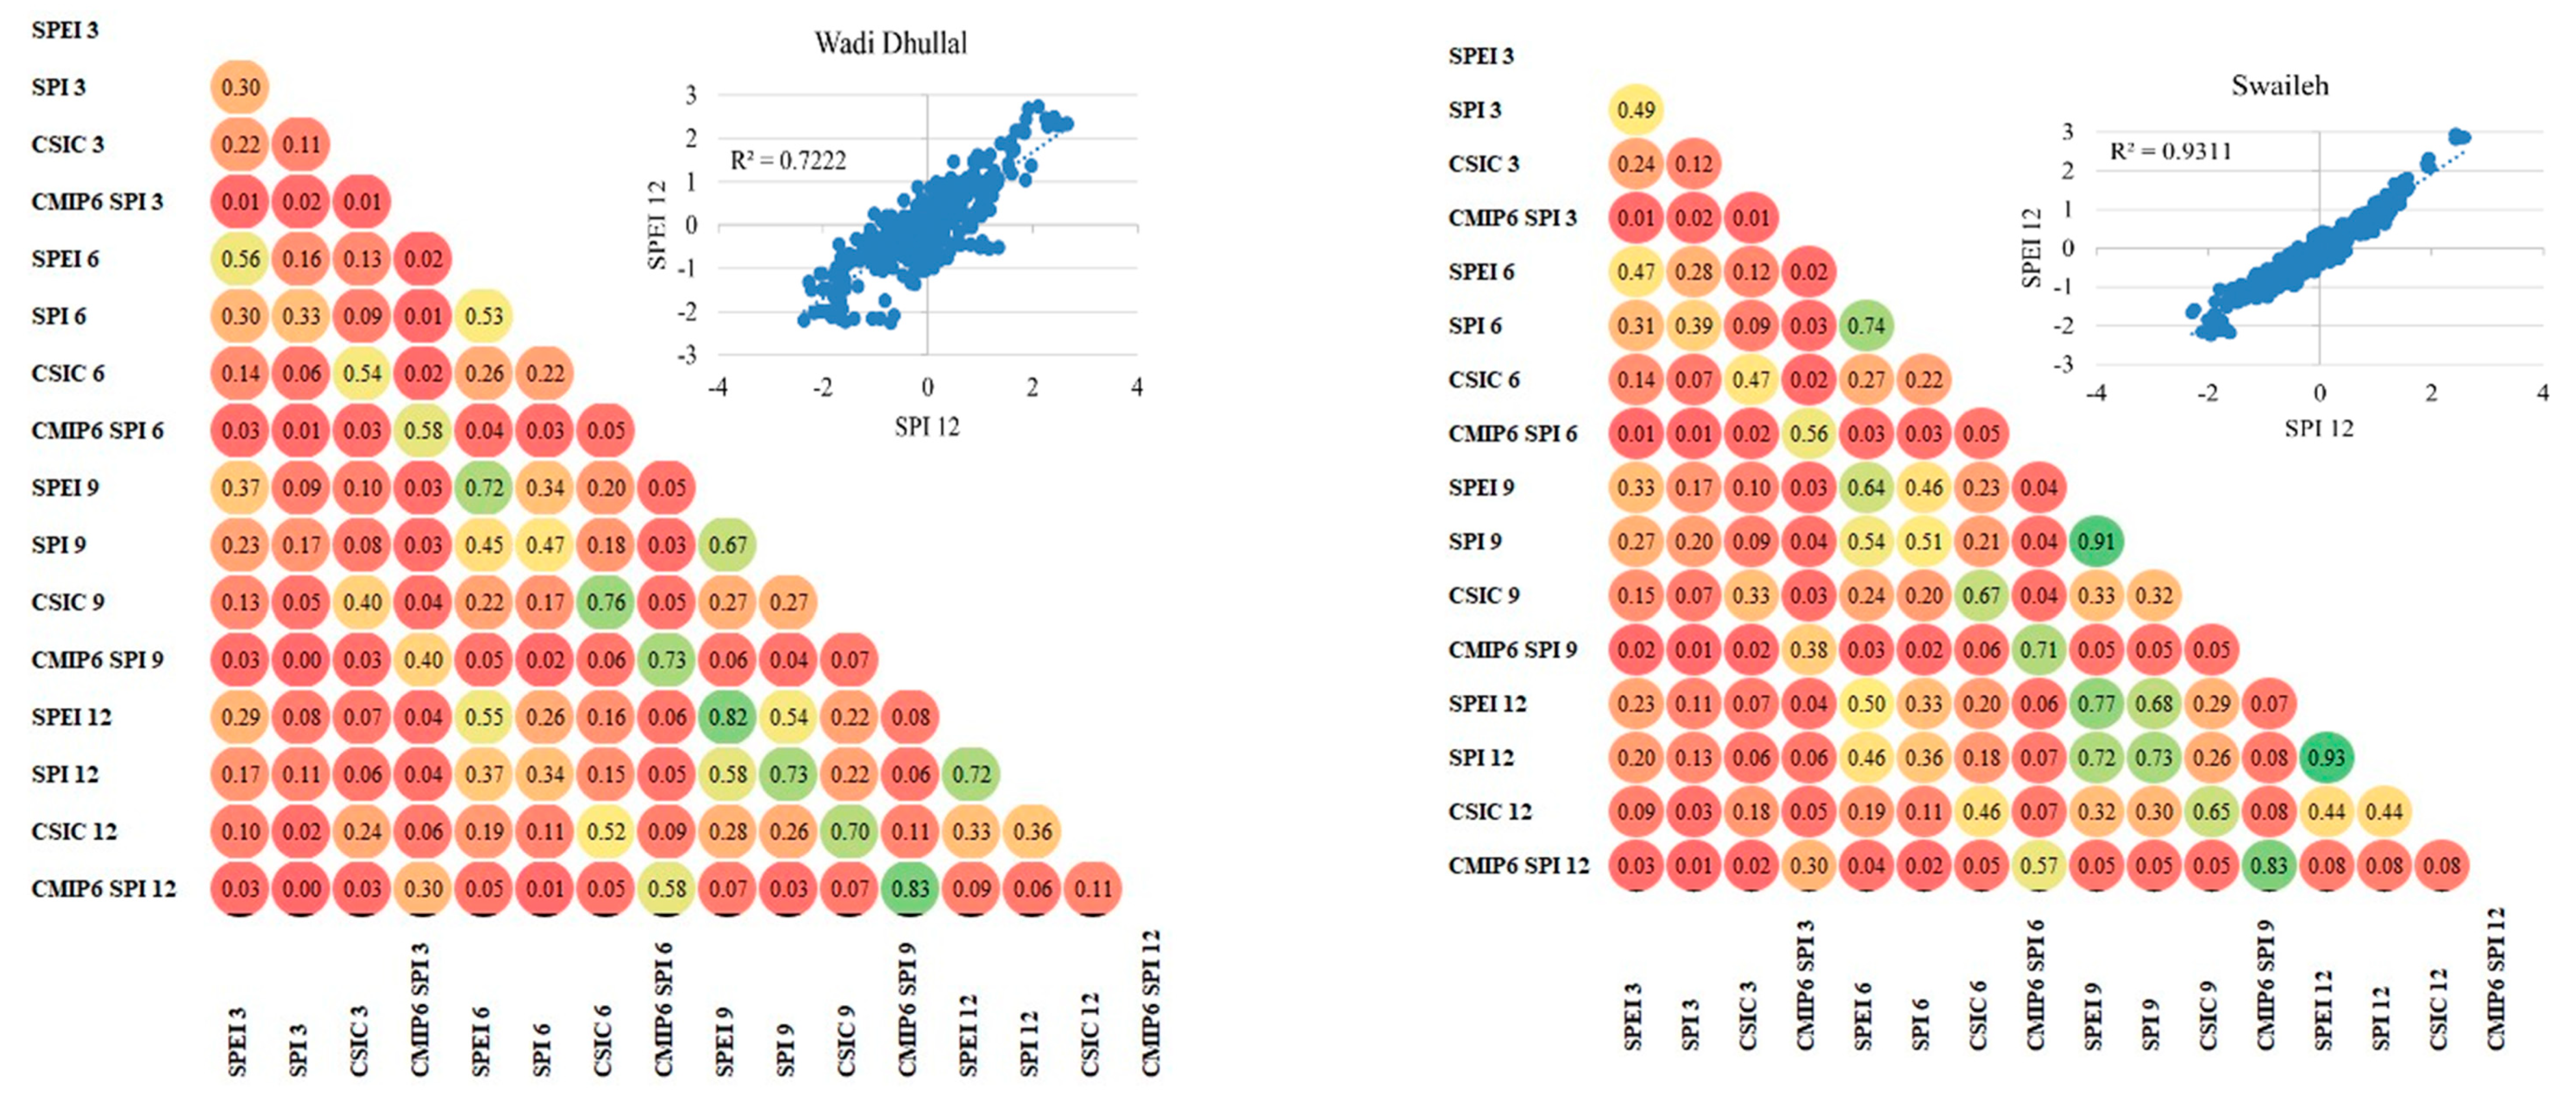
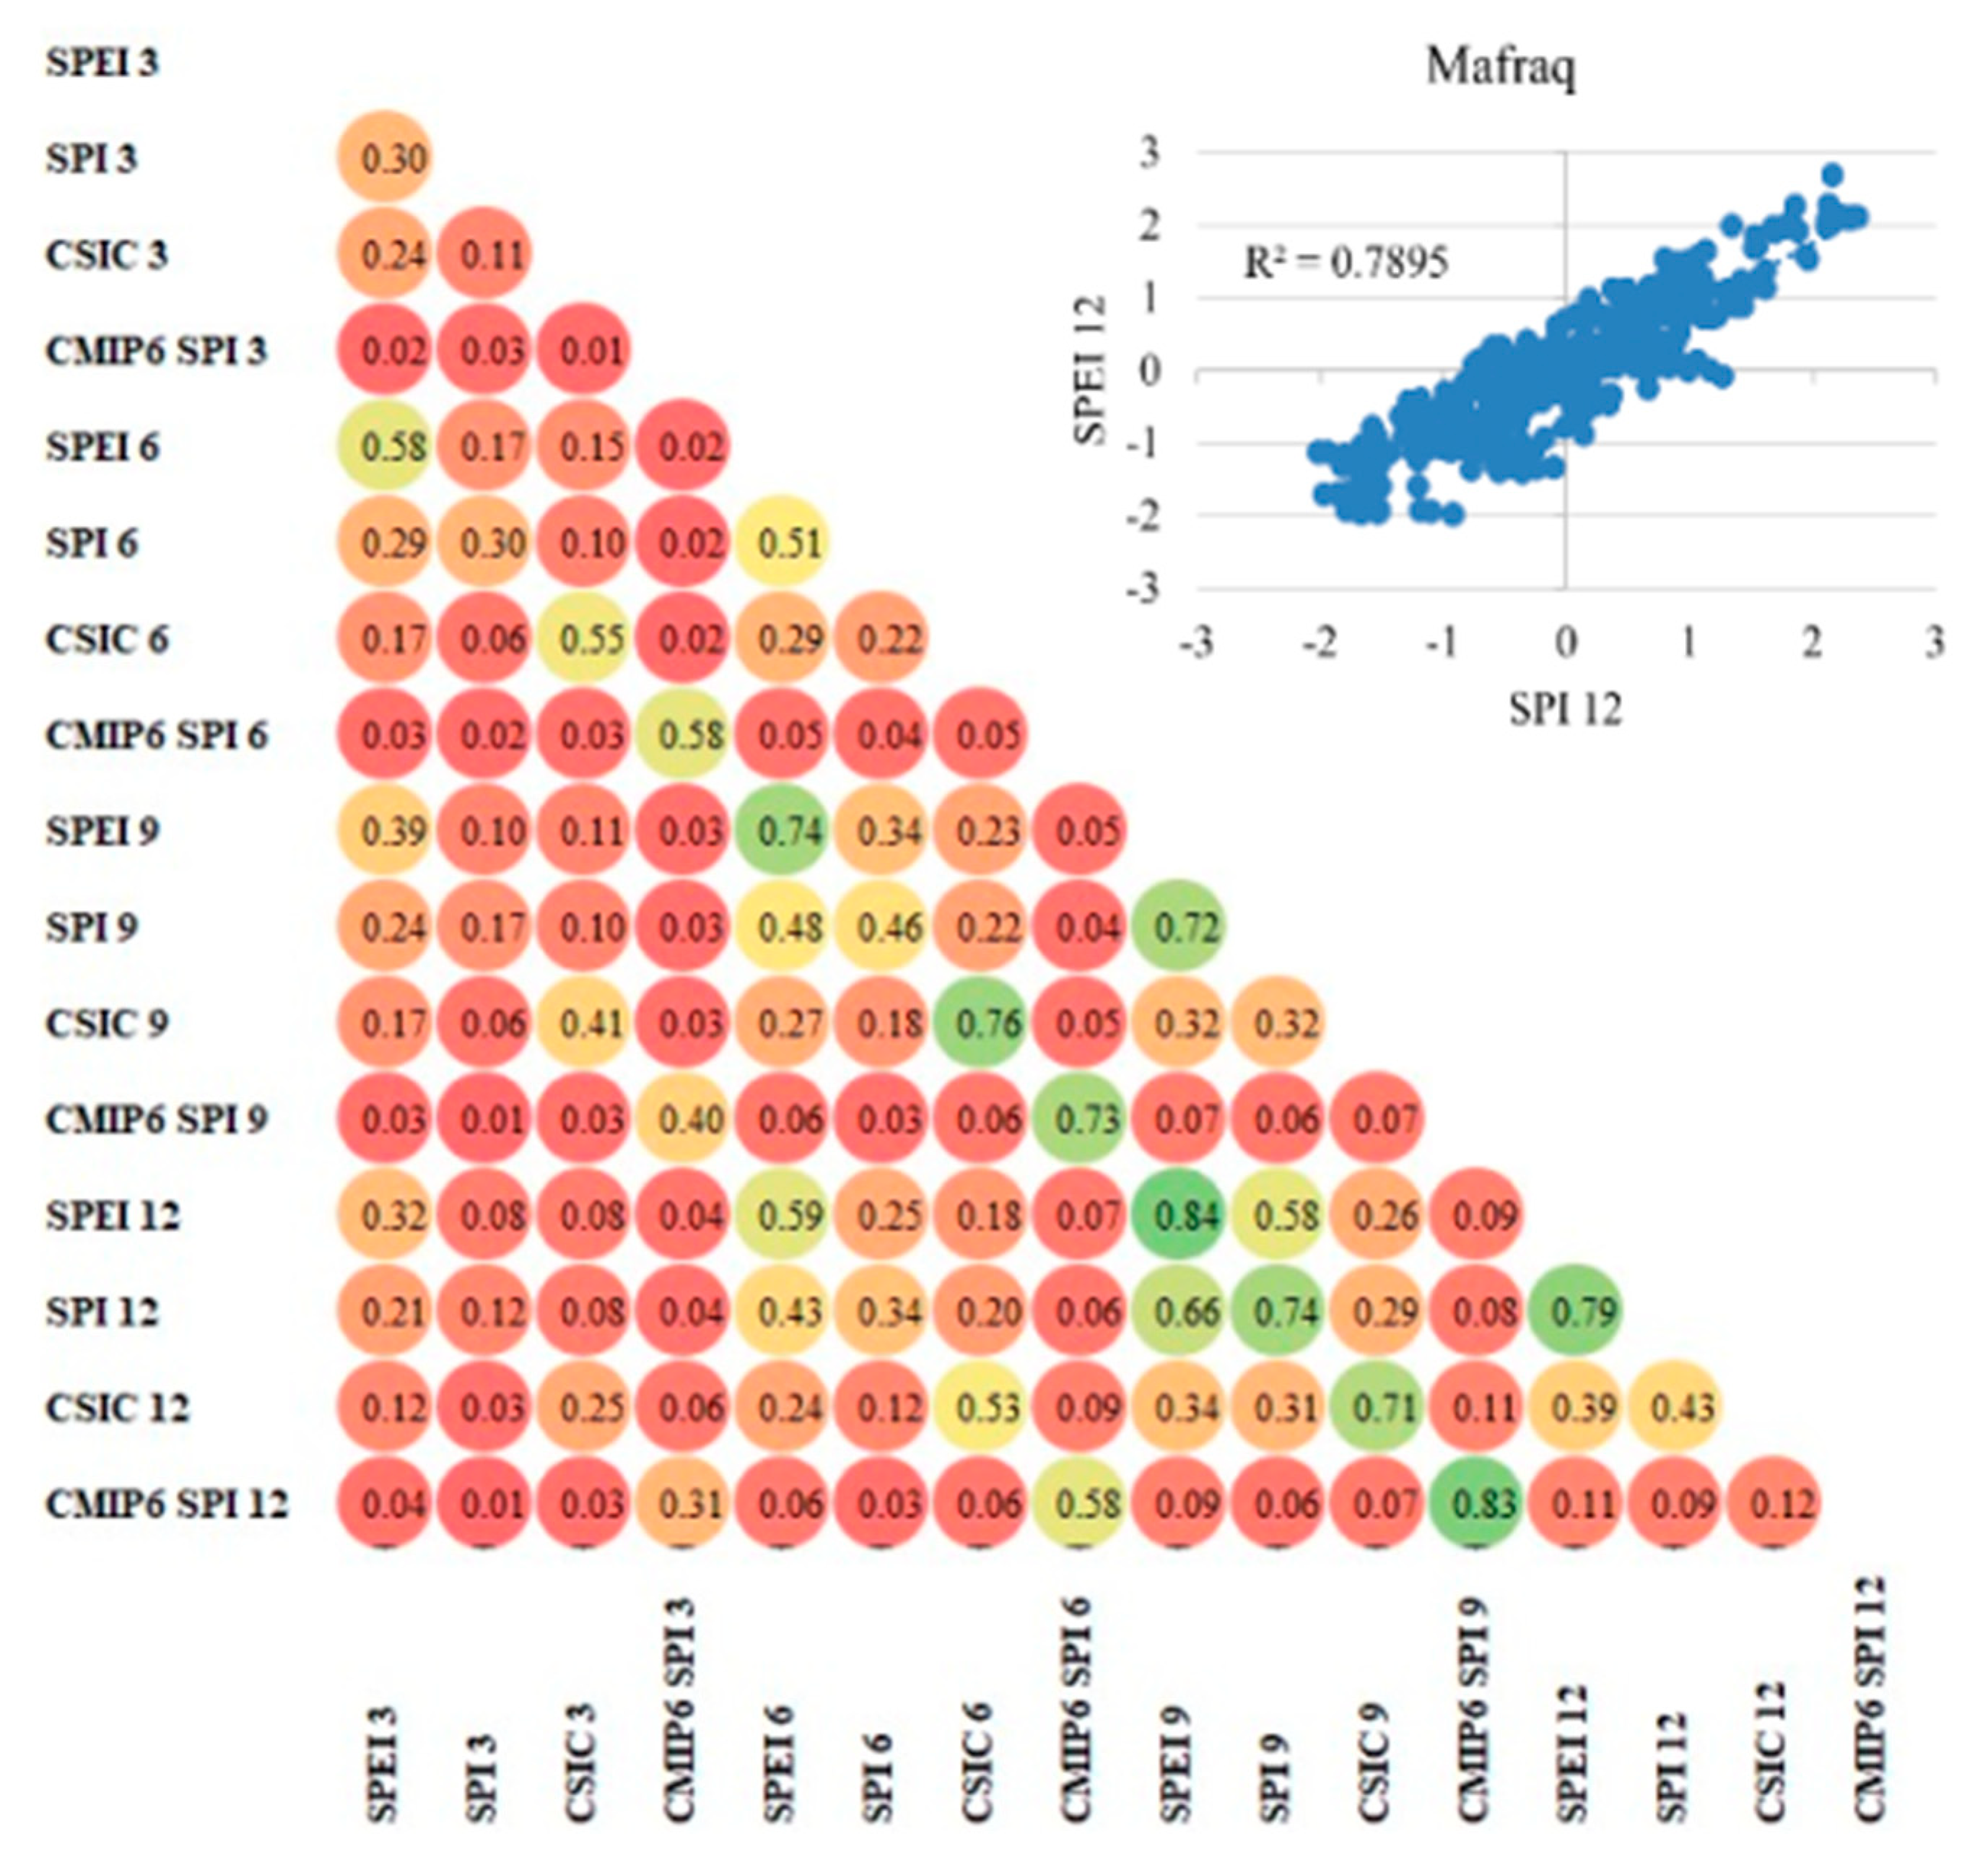
Figure 4.
ARIMA & TBATS models forecast results per each station from 2022 to 2025. Each figure shows comparison plotting of monthly drought using SPI and SPEI. SPI three modelled groups are: ARIMA and TBATS from observations (dark red), from CSIC and CMIP6 (steel-blue), and the future indices calculated from future CMIP6ssp126 projections (2022-2025) in (orange).
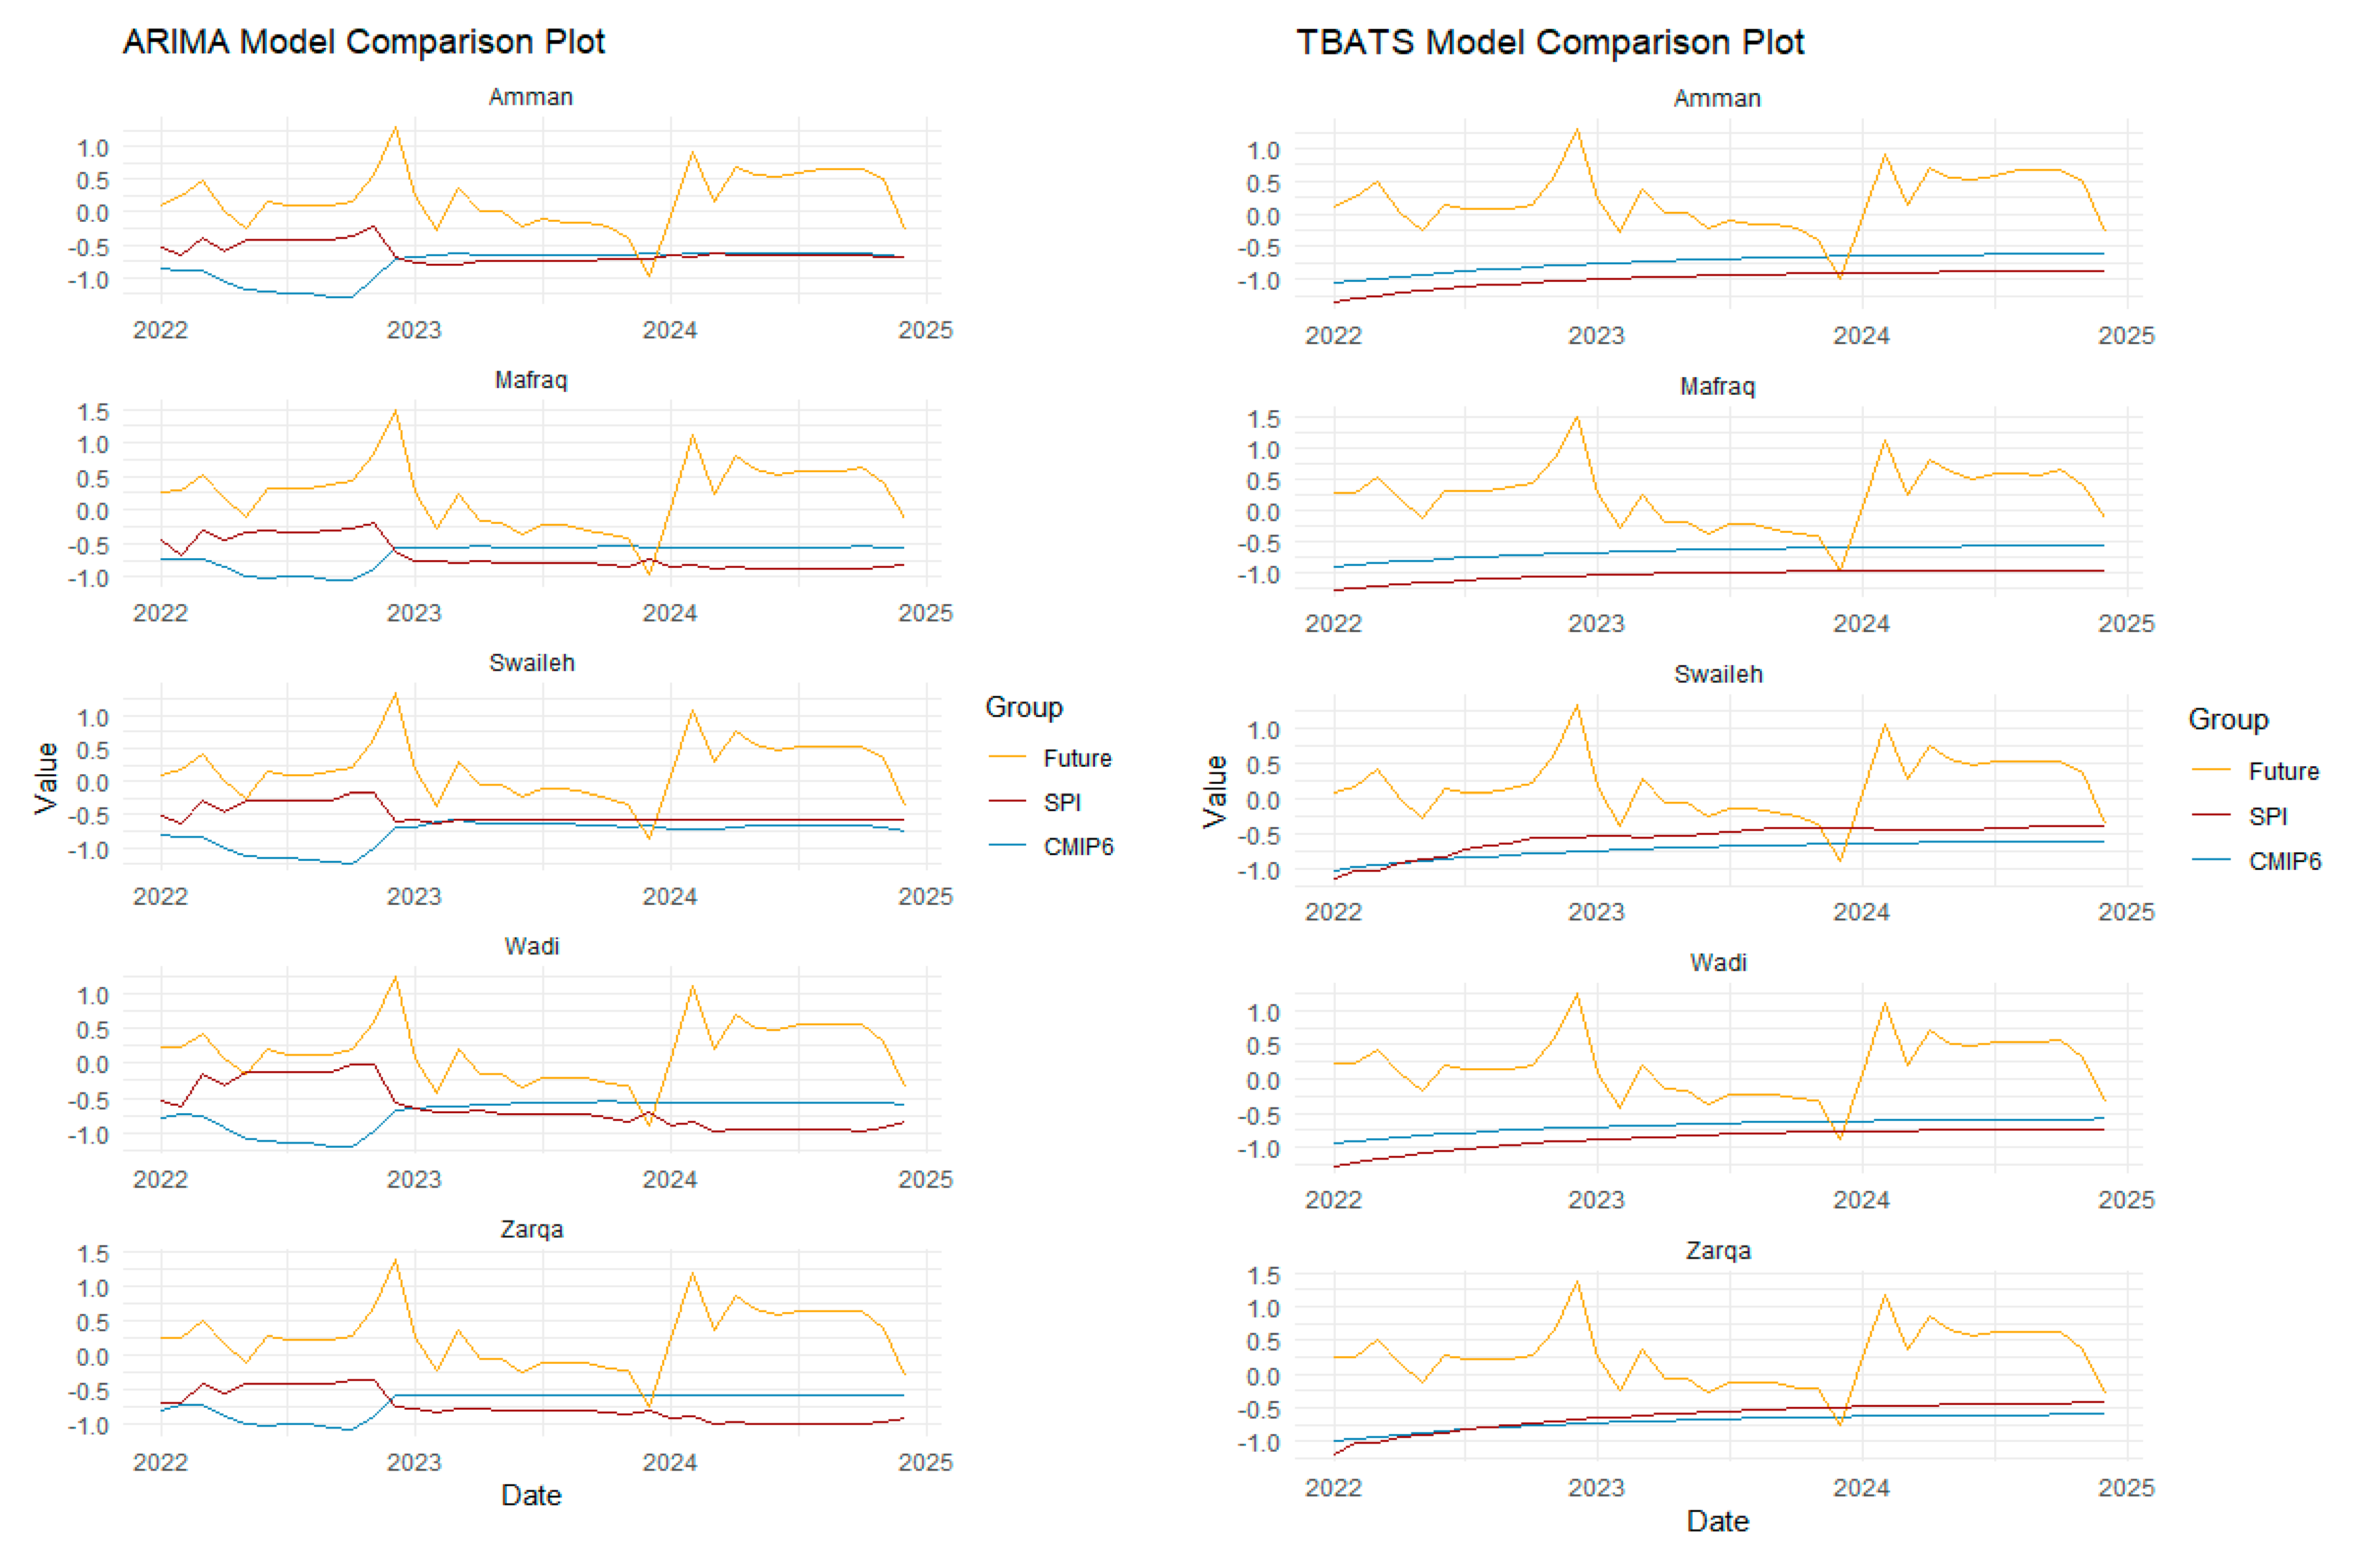
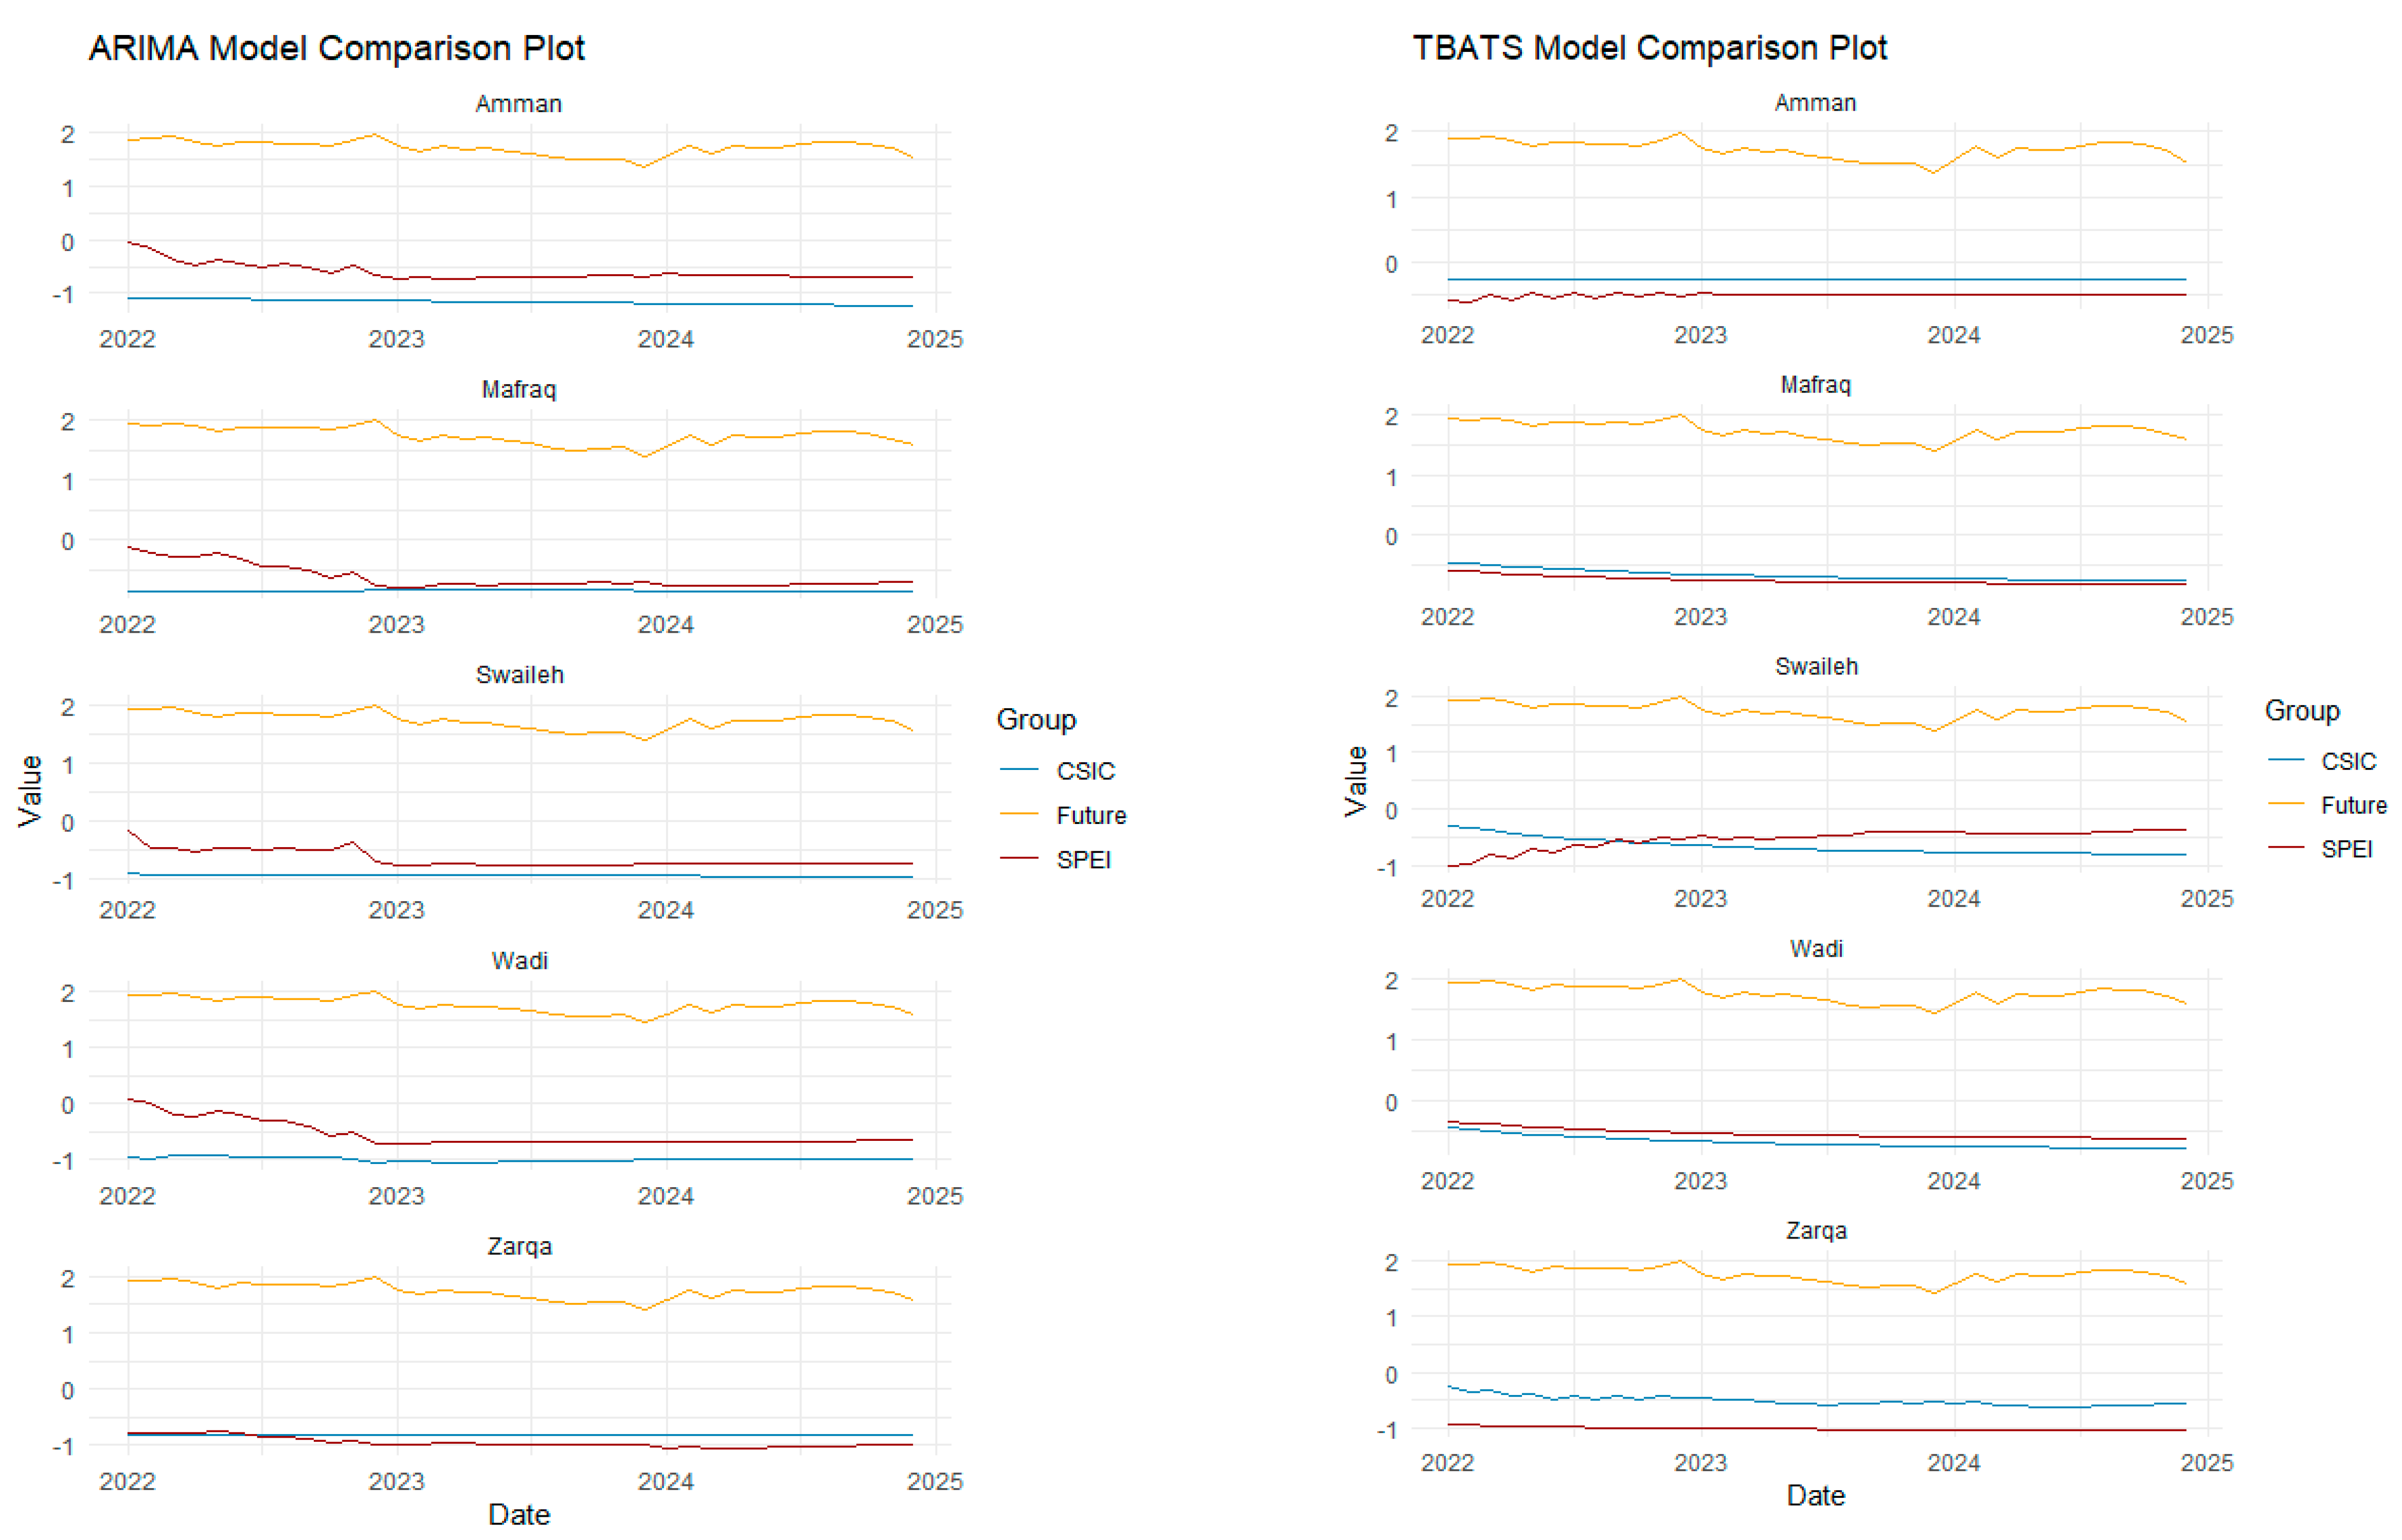
Figure 5.
ARIMA-SPI forecast example for Mafraq modelled from historical observations showing the training period, testing and forecast run periods (light gray is the low and hi 95% confidence interval, dark gray is the 80% confidence interval, and the blue curve is the point average forecast).
Figure 5.
ARIMA-SPI forecast example for Mafraq modelled from historical observations showing the training period, testing and forecast run periods (light gray is the low and hi 95% confidence interval, dark gray is the 80% confidence interval, and the blue curve is the point average forecast).
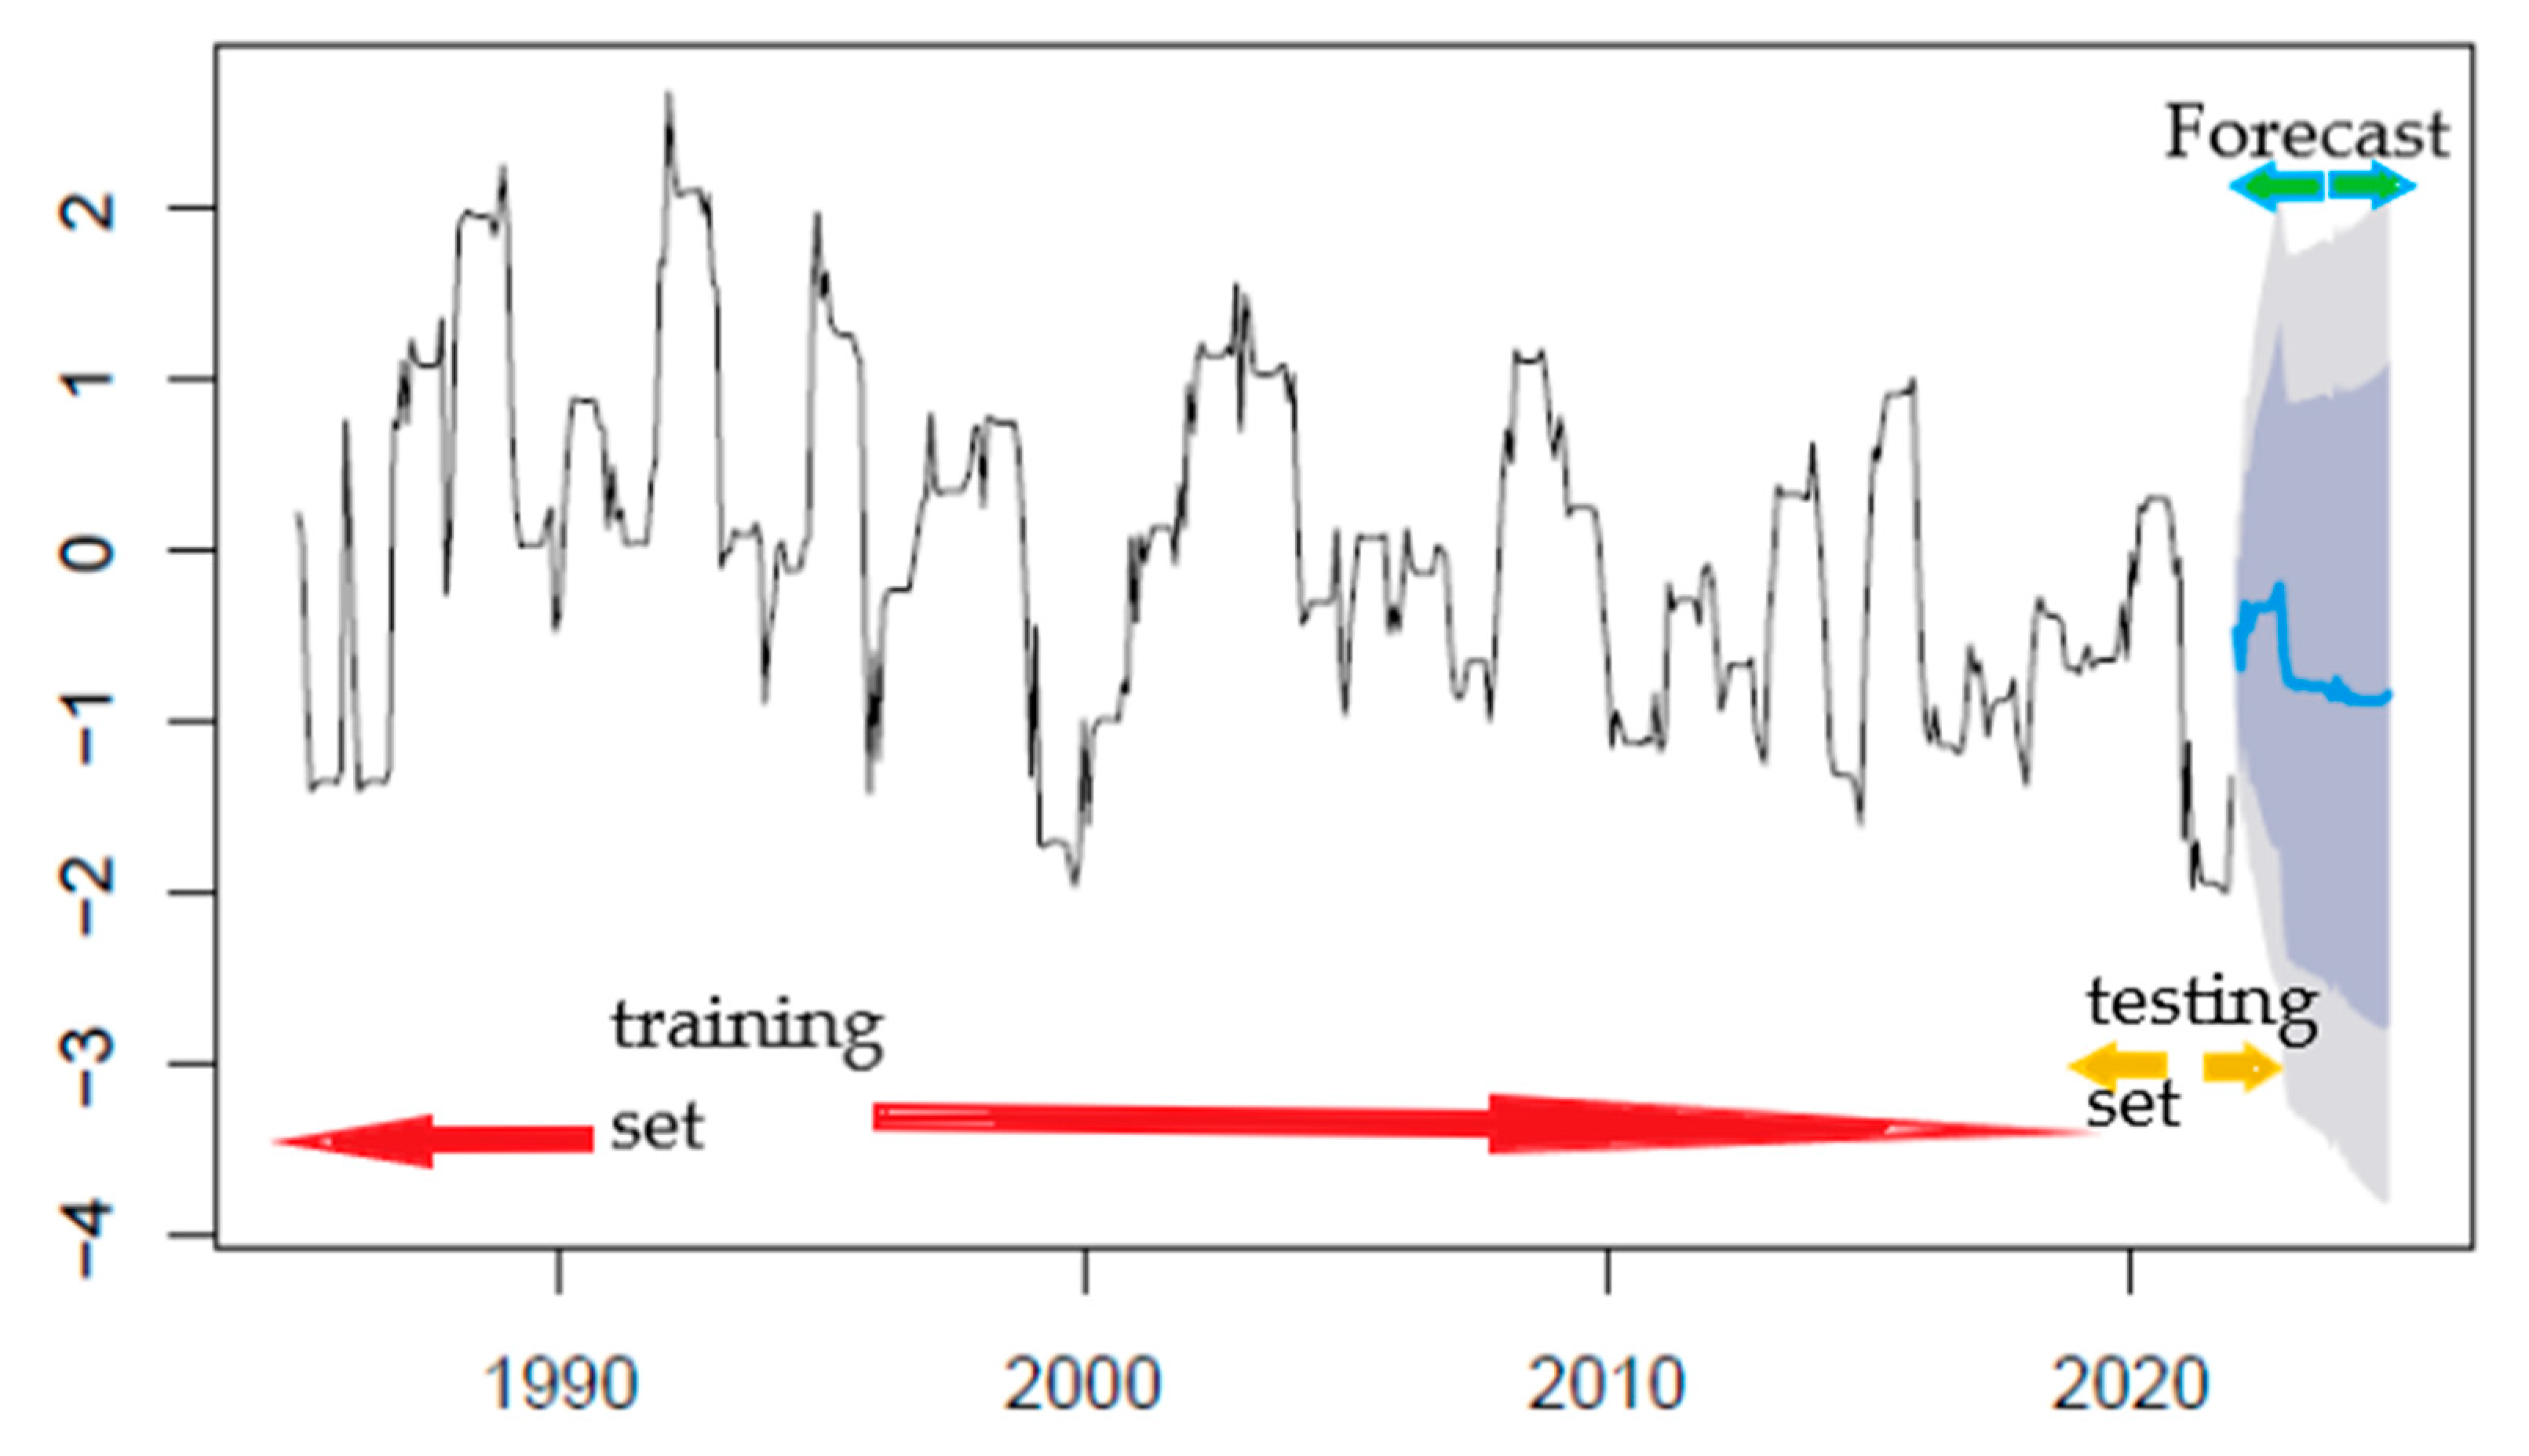
Figure 6.
timeseries (ts-data) for the single models TBATS and ARIMA including the historical baseline drought index and the generated forecast in the near future (black are the training data, generated drought index by ARIMA and TBATS are colored).
Figure 6.
timeseries (ts-data) for the single models TBATS and ARIMA including the historical baseline drought index and the generated forecast in the near future (black are the training data, generated drought index by ARIMA and TBATS are colored).

Table 1.
Basic Statistics of Mean daily Minimum, Mean Maximum, Mean and standard deviation (SD) temperature and precipitation during 1985-2021.
Table 1.
Basic Statistics of Mean daily Minimum, Mean Maximum, Mean and standard deviation (SD) temperature and precipitation during 1985-2021.
| Station Name | Station ID | Stations | Minimum Temperature (°C) | Maximum Temperature (°C) | Average Temperature (°C) | Precipitation (mm/day) | |||||||||||||
|---|---|---|---|---|---|---|---|---|---|---|---|---|---|---|---|---|---|---|---|
| Long.(°E) | Lat.(°N) | Min | Max | Mean | SD | Min | Max | Mean | SD | Min | Max | Mean | SD | Min | Max | Mean | SD | ||
| Amman Airport | AD0019 | 36.2352 | 32.3219 | -5.3 | 29.2 | 12.4 | 6.47 | 1.8 | 43.50 | 23.73 | 8.35 | 16.14 | 19.00 | 18.02 | 0.57 | 0.0 | 52.60 | 0.64 | 2.88 |
| Mafraq | AL0015 | 36.0883 | 32.0641 | -7.2 | 26 | 9.93 | 5.94 | 1.4 | 43.5 | 24.51 | 8.42 | 15.43 | 18.19 | 17.67 | 0.57 | 0.0 | 40.2 | 0.4 | 1.79 |
| Swaileh | AL0017 | 35.8392 | 32.0223 | -6.6 | 30.8 | 11.71 | 6.45 | -0.5 | 39.50 | 20.45 | 8.34 | 14.19 | 17.13 | 16.11 | 0.61 | 0.0 | 100.5 | 1.26 | 5.27 |
| Wadi Dhullal | AL0019 | 35.987 | 31.9746 | -8.1 | 25.7 | 10.41 | 6.30 | 1.7 | 45.50 | 26.13 | 8.83 | 16.46 | 19.28 | 18.23 | 0.53 | 0.0 | 39.10 | 0.35 | 1.63 |
| Zarqa | AL0055 | 36.28 | 32.1547 | -3.68 | 31.59 | 11.55 | 6.75 | 1.22 | 44.78 | 24.52 | 9.24 | 15.42 | 20.28 | 17.99 | 1.67 | 0.0 | 49.04 | 0.54 | 2.37 |
Table 2.
Drought Severity Based on SPI And SPEI Value.
| SPI AND SPEI VALUE | DROUGHT CATEGORIES |
|---|---|
| >2 | Extremely Wet |
| 1.50 – 1.99 | Severely Wet |
| 1.00 – 1.49 | Moderately Wet |
| -0.99 – 0.99 | Nearly Normal |
| -1.49 – -1.0 | Moderate Drought |
| -1.99 – -1.5 | Severe Drought |
| < -2 | Extreme Drought |
Table 1.
MKT test results of SPI for the meteorological stations located in Amman Zarqa Basin
| Met-Station | SPI 3 | SPI 6 | SPI 9 | SPI 12 | ||||
|---|---|---|---|---|---|---|---|---|
| Kendall’s tau | p-value | Kendall’s tau | p-value | Kendall’s tau | p-value | Kendall’s tau | p-value | |
| Amman Airport | -0.0115 | 0.7197 | -0.0751 | 0.0188 | -0.1679 | < 0.0001 | -0.2167 | < 0.0001 |
| Mafraq | -0.0474 | 0.1375 | -0.1501 | < 0.0001 | -0.2494 | < 0.0001 | -0.3017 | < 0.0001 |
| Swaileh | -0.0044 | 0.8915 | -0.0542 | 0.0896 | -0.1247 | 0.0001 | -0.1678 | < 0.0001 |
| Wadi Dhullail | -0.0407 | 0.2027 | -0.1316 | < 0.0001 | -0.2288 | < 0.0001 | -0.2793 | < 0.0001 |
| Zarqa | -0.1141 | 0.0004 | -0.2182 | < 0.0001 | -0.3378 | < 0.0001 | -0.4032 | < 0.0001 |
Table 4.
MKT test results of SPEI for the meteorological stations located in Amman Zarqa Basin.
| Met-Station | SPEI 3 | SPEI 6 | SPEI 9 | SPEI 12 | ||||
|---|---|---|---|---|---|---|---|---|
| Kendall’s tau | p-value | Kendall’s tau | p-value | Kendall’s tau | p-value | Kendall’s tau | p-value | |
| Amman Airport | -0.1657 | < 0.0001 | -0.2401 | < 0.0001 | -0.2938 | < 0.0001 | -0.3453 | < 0.0001 |
| Mafraq | -0.2518 | < 0.0001 | -0.3379 | < 0.0001 | -0.4079 | < 0.0001 | -0.4575 | < 0.0001 |
| Swaileh | -0.1477 | < 0.0001 | -0.1798 | < 0.0001 | -0.2231 | < 0.0001 | -0.2613 | < 0.0001 |
| Wadi Dhullail | -0.2065 | < 0.0001 | -0.2966 | < 0.0001 | -0.3733 | < 0.0001 | -0.4300 | < 0.0001 |
| Zarqa | -0.5111 | < 0.0001 | -0.5848 | < 0.0001 | -0.6170 | < 0.0001 | -0.6480 | < 0.0001 |
Table 5.
Percentage of Frequency of drought to the total number of months during 1985-2021 at different temporal scale based on SPI and SPEI at Amman Zarqa Basin.
Table 5.
Percentage of Frequency of drought to the total number of months during 1985-2021 at different temporal scale based on SPI and SPEI at Amman Zarqa Basin.
| Met Stations | SPI 3 | SPI 6 | SPI 9 | SPI 12 | SPEI-3 | SPEI-6 | SPEI-9 | SPEI-12 |
|---|---|---|---|---|---|---|---|---|
| Amman Airport | 12.22 | 14.35 | 15.14 | 14.09 | 15.84 | 15.49 | 15.37 | 13.86 |
| Mafraq | 13.35 | 15.95 | 16.06 | 16.17 | 16.74 | 17.08 | 16.74 | 17.55 |
| Swaileh | 12.67 | 14.35 | 14.45 | 13.16 | 14.93 | 16.40 | 14.91 | 13.86 |
| Wadi Dhullal | 14.03 | 13.67 | 13.99 | 12.24 | 16.06 | 16.40 | 16.06 | 15.94 |
| Zarqa | 13.12 | 13.21 | 13.07 | 12.47 | 17.65 | 16.40 | 16.97 | 18.24 |
Table 6.
Drought characteristics for Basin stations under SPI scales include drought percentage, drought duration, severity, intensity and probability of occurrences.
Table 6.
Drought characteristics for Basin stations under SPI scales include drought percentage, drought duration, severity, intensity and probability of occurrences.
| Station | SPI | Total months | No of drought months | Drought percentage(%) | Longest drought duration | Longest drought duration (months) | Drought severity | Drought intensity | Probability of Occurrence(%) | ||
|---|---|---|---|---|---|---|---|---|---|---|---|
| Moderate | Severe | Extreme | |||||||||
| Amman-Airport | SPI 3 | 442 | 54 | 12.22 | Oct 2020 to May 2021 | 8 | -12.16 | -1.52 (Severe) | 38.9 | 48.2 | 13 |
| SPI 6 | 440 | 64 | 14.6 | Sep 1998 to May 1999 | 9 | -14.60 | -1.62 (Severe) | 53.1 | 25 | 21.9 | |
| SPI 9 | 437 | 67 | 15.3 | Jan 2014 to Oct 2014 and Jan 2021 to Nov 2021 | 11 | -20.63 | -1.87 (Severe) | 62.7 | 22.4 | 14.9 | |
| SPI 12 | 434 | 62 | 14.3 | Jan 1999 to Feb 2000 and Jan 2021 to Dec 2021 | 12 | -23.44 | -2.0 (Extreme) | 59.7 | 24.2 | 16.2 | |
| Mafraq | SPI 3 | 442 | 59 | 13.3 | Oct 2020 to March 2021 | 6 | -10.62 | -1.77 (Severe) | 44.1 | 23.7 | 32.2 |
| SPI 6 | 440 | 71 | 16.1 | Nov 2020 to July 2021 and Feb 2014 to July 2014 | 9 | -15.03 | -1.67 (Severe) | 57.8 | 25.4 | 19.7 | |
| SPI 9 | 437 | 71 | 16.3 | Dec 2020 to Nov 2021 and Feb 2014 to Nov 2014 | 12 | -20.13 | -1.68 (Severe) | 73.2 | 22.5 | 7.04 | |
| SPI 12 | 434 | 71 | 16.4 | Dec 2020 to Nov 2021 and Feb 2010 to Nov 2010 | 12 | -21.37 | -1.78 (Severe) | 69.01 | 32.4 | 0 | |
| Swaileh | SPI 3 | 442 | 56 | 12.7 | Oct 2020 to March 2021 and March 2004 to July 2004 | 6 | -11.32 | -1.89 (Severe) | 44.6 | 26.8 | 28.6 |
| SPI 6 | 439 | 63 | 14.4 | Sep 1998 to Aug 1999 and Nov 2020 to August 2021 | 10 | -18.31-16.85 | -1.83(Severe)-1.69 | 55.6 | 31.7 | 12.7 | |
| SPI 9 | 436 | 63 | 14.5 | Dec 1998 to Dec 1999 | 13 | -23.80 | -1.83 (Severe) | 63.5 | 23.8 | 12.7 | |
| SPI 12 | 434 | 57 | 13.1 | Jan 1999 to Feb 2000 | 14 | -24.64 | -1.76 (Severe) | 57.9 | 21.1 | 21.1 | |
| Wadi Dhullail | SPI 3 | 442 | 62 | 14.0 | Oct 2020 to March 2021 | 6 | -10.64 | -1.77 (Severe) | 32.3 | 27.4 | 41.9 |
| SPI 6 | 439 | 59 | 13.4 | Oct 1998 to Aug 1999 | 10 | -20.32 | -2.03 (Extreme) | 40.7 | 40.7 | 20.3 | |
| SPI 9 | 436 | 61 | 14.0 | Jan 1999 to Dec 1999 and Jan 2021 to Nov 2021 | 12 | -22.58 | -1.88 (Severe) | 55.7 | 27.9 | 16.4 | |
| SPI 12 | 433 | 53 | 12.2 | Jan 1999 to Dec 1999 and Jan 2021 to Dec 2021 | 12 | -23.14-23.57 | -1.93(Severe)-1.96 | 54.7 | 18.9 | 26.4 | |
| Zarqa | SPI 3 | 442 | 58 | 13.1 | Oct 2020 to May 2021 | 8 | -13.41 | -1.68 (Severe) | 48.3 | 32.8 | 19.0 |
| SPI 6 | 439 | 58 | 13.2 | Nov 2020 to Aug 2021 | 10 | -16.73 | -1.67 (Severe) | 55.2 | 34.5 | 10.3 | |
| SPI 9 | 436 | 57 | 13.1 | Dec 2020 to Nov 2021 and Jan 2014 to Oct 2014 | 12 | -21.12 | -1.76 (Severe) | 64.9 | 24.6 | 10.5 | |
| SPI 12 | 434 | 54 | 12.4 | Jan 2021 to Dec 2021 and March 1999 to Dec 1999 | 12 | -22.02 | -1.84 (Severe) | 75.9 | 11.1 | 13.0 | |
Table 7.
Forecast accuracy metrics for the TBATS and ARIMA, including the autocorrelation coefficient (ACF) to SPI and SPEI among the 5 stations in the basin.
Table 7.
Forecast accuracy metrics for the TBATS and ARIMA, including the autocorrelation coefficient (ACF) to SPI and SPEI among the 5 stations in the basin.
| Forecast Model | Performance Metrics | Amman-Airport | Mafraq | Sweileh | Wadi-Dhullail | Zarqa | ||||||||||||||||
|---|---|---|---|---|---|---|---|---|---|---|---|---|---|---|---|---|---|---|---|---|---|---|
| SPI | SPEI | SPI | SPEI | SPI | SPEI | SPI | SPEI | SPI | SPEI | |||||||||||||
| Obs. SPI | CMIP6 | Obs. SPEI | CSIC | Obs. SPI | CMIP6 | Obs. SPEI | CSIC | Obs. SPI | CMIP6 | Obs. SPEI | CSIC | Obs. SPI | CMIP6 | Obs. SPEI | CSIC | Obs. SPI | CMIP6 | Obs. SPEI | CSIC | |||
| ARIMA | ME | -0.00812 | 0.000103 | -0.0097 | 0.007619 | -0.00378 | -0.00507 | -0.00515 | -0.00516 | -0.00703 | 0.000546 | -0.00381 | -0.00113 | -0.00613 | -0.0054 | -0.009217 | -0.00288 | -0.00666 | -0.0078 | -0.00731 | -0.006423 | |
| RMSE | 0.33797 | 0.2534 | 0.2924 | 0.2843 | 0.3295 | 0.2557 | 0.2649 | 0.2587 | 0.3357 | 0.2546 | 0.3493 | 0.2829 | 0.328 | 0.25 | 0.2718 | 0.2697 | 0.2835 | 0.2532 | 0.1398 | 0.2685 | ||
| MAE | 0.19799 | 0.1651 | 0.20085 | 0.1809 | 0.1877 | 0.1676 | 0.1863 | 0.182 | 0.1956 | 0.1659 | 0.213 | 0.1813 | 0.1898 | 0.1674 | 0.1996 | 0.1895 | 0.1643 | 0.1657 | 0.1001 | 0.1811 | ||
| MASE | 0.1808 | 0.1684 | 0.2038 | 0.2291 | 0.1787 | 0.1657 | 0.2086 | 0.1996 | 0.17596 | 0.16688 | 0.1961 | 0.2162 | 0.1795 | 0.1661 | 0.2276 | 0.2125 | 0.1877 | 0.1656 | 0.2171 | 0.2115 | ||
| ACF | -0.00353 | -0.0195 | -0.00529 | -0.0393 | -0.001855 | -0.01948 | 0.00076 | 0.004896 | -0.00021 | 0.03832 | 0.00227 | 0.2828 | 0.00613 | -0.0189 | 0.0208 | 0.001871 | -0.00031 | -0.0206 | -0.00123 | -0.000809 | ||
| TBATS | ME | 0.007987 | -0.02138 | -0.0104 | -0.0709 | 0.006229 | -0.0207 | 1.43E-06 | -0.0705 | 0.01236 | 0.0212 | 0.00445 | -0.06594 | 0.00529 | -0.0206 | -0.00491 | -0.06782 | 0.0208 | -0.0209 | -0.00568 | -0.06081 | |
| RMSE | 0.4062 | 0.3079 | 0.3358 | 1.225 | 0.38052 | 0.315 | 0.3029 | 1.2488 | 0.3821 | 0.3108 | 0.386 | 1.2217 | 0.3915 | 0.3073 | 0.3176 | 1.212 | 0.03196 | 0.308 | 0.1589 | 1.2102 | ||
| MAE | 0.2448 | 0.2115 | 0.2312 | 1.0239 | 0.226 | 0.2157 | 0.2127 | 1.0222 | 0.2506 | 0.2126 | 0.2447 | 1.0213 | 0.2398 | 0.2128 | 0.2317 | 0.9963 | 0.1977 | 0.2124 | 0.1138 | 1.0003 | ||
| MASE | 0.2235 | 0.2157 | 0.2346 | 1.2965 | 0.21515 | 0.2134 | 0.2381 | 1.121 | 0.2254 | 0.2139 | 0.2252 | 1.2184 | 0.2268 | 0.2114 | 0.2642 | 1.1174 | 0.2257 | 0.2122 | 0.2467 | 1.1684 | ||
| ACF | 0.000367 | 0.00374 | -0.00722 | 0.9265 | 0.001415 | 0.00378 | 0.00682 | 0.9367 | -0.02531 | 0.00363 | 0.00492 | 0.9273 | 3.36E-06 | 0.00608 | 0.00499 | 0.9328 | -0.00094 | 0.0522 | 0.01125 | 0.9223 | ||
Disclaimer/Publisher’s Note: The statements, opinions and data contained in all publications are solely those of the individual author(s) and contributor(s) and not of MDPI and/or the editor(s). MDPI and/or the editor(s) disclaim responsibility for any injury to people or property resulting from any ideas, methods, instructions or products referred to in the content. |
© 2023 by the authors. Licensee MDPI, Basel, Switzerland. This article is an open access article distributed under the terms and conditions of the Creative Commons Attribution (CC BY) license (http://creativecommons.org/licenses/by/4.0/).
Copyright: This open access article is published under a Creative Commons CC BY 4.0 license, which permit the free download, distribution, and reuse, provided that the author and preprint are cited in any reuse.


