
Submitted:
28 August 2023
Posted:
30 August 2023
You are already at the latest version
Abstract
In this study, we have focused on studying the heterogenous degradation kinetics of regarding the decomposition of emergency contraceptive agent levonorgestrel (LNG), which is a second-generation synthetic progestogen that is the active component of the racemic mixture of norgestrel. The degradation processes of the active pharmaceutical ingredient (API) were compared with the ones obtained from model system containing the API along with the excipients that are found in a commercialized pharmaceutical formulation in a mass ratio of 1:1 (LNGMIX), in order to observe if the excipients have a stabilizing or destabilizing effect for the degradation of this progestogen. To achieve this, the following investigational methods were used: FTIR (Fourier transform infrared) spectroscopy and thermal analysis (TG/DTG/DSC analysis). For the kinetic analysis the data obtained from two main decomposition processes observed on the DTG curves were used and processed with a preliminary method, namely ASTM E698 and two isoconversional methods: Friedman and Flynn-Wall-Ozawa. The isoconversional study revealed that the decomposition mechanism of both LNG and LNGMIX are complex, and the excipients have a stabilizing effect over decomposition of API in tablet.
Keywords:
levonorgestrel
; thermal analysis
; kinetic study
; decomposition
; isoconversional methods
1. Introduction
Kinetic studies are, nowadays, of great importance in the characterization of pharmaceuticals, including active pharmaceutical ingredients, excipients and even coating and packaging materials [1,2,3,4]. The degradation processes that occur can be physical (crystallization of amorphous drugs, transitions in crystalline states, moisture adsorption, formation and growth of crystals) or chemical (hydrolysis, oxidation, photolysis, dehydration and racemization). The main role of the kinetic analysis is in determining the shelf life and the storage conditions of the pharmaceutical formulations, in order to maintain an optimal concentration and release profile of the active substances [5].
Levonorgestrel, namely 17alpha-ethynyl-18-methylestr-4-en-17beta-ol-3-one (Figure 1), is a second-generation synthetic progestogen that is the active component of the racemic mixture of norgestrel, primary used as an emergency contraceptive [6,7]. It is also used off-label for treating endometrial hyperplasia, menorrhagia, endometriosis, and menopausal hormone therapy. The therapeutic effect is the result of the interaction of levonorgestrel with the progesterone and androgen receptors. Thus, postponing the releasing of gonadotropin-releasing hormone, furthermore suppressing the secretion of the luteinizing hormone. These effects will delay or even inhibit the ovulation and will increase the thickness of the layer of the cervical mucus, which will block the passage of the spermatozoon [6,8]. The pharmacokinetics of levonorgestrel are well known, the active substance presenting a rapid absorption reaching the maximal serum concentration in 2 hours and a half-time absorption of approximately 1 hour. However, when administered alongside with estrogens, such as ethinylestradiol, the pharmacokinetic profile of levonorgestrel becomes unpredictable disclosing a significant variation of the plasma concentrations [9,10]. Currently in the pharmaceutical field there are various pharmaceutical formulations containing levonorgestrel, such as: intrauterine devices, tablets and implants.
A pharmaceutical formulation contains beside de APIs, numerous pharmaceutical excipients, added both to increase the patient's compliance with the treatment and to facilitate the technological process of obtaining the pharmaceutical form. Nowadays the biggest challenge for pharmaceutical technology is to develop a drug formula, in which the interactions between the APIs and excipients is reduced to minimum, in order to not interfere with the biopharmaceutical profile of the therapeutic molecule. Those interactions can be observed in the preformulation state with the help of thermoanalytical tools. The analysis method implies the heating of the sample in isothermal or non-isothermal conditions and evaluating the mass loss, phase transitions and polymorphic transformations [11]. Even more, thermal analysis offers valuable information about the thermal stability of inclusion complexes of the APIs with cyclodextrins[12,13,14], binary or ternary adducts [15] and cocrystals [16,17].
Due to the lack of information about the thermal stability and the decomposition process of levonorgestrel, the main purpose of this paper is to elucidate the thermolysis mechanism of LNG by using the kinetic analysis. This type of analysis uses the data obtained from the thermoanalytical curves and isoconversional methods in order to calculate the activation energy (Ea). The main advantage of the isoconversional methods is represented by the possibility of using them without knowing or assuming an explicit model for the differential or integral conversion functions. The kinetic analysis was performed by following the recommendations made by the International Confederation for Thermal Analysis and Calorimetry (ICTAC) Kinetics Committee [18,19,20,21,22].
The Flynn-Wall-Ozawa isoconversional method (FWO) is a relatively easy method used for the determination of the Ea in function of the conversion degree, by employing the data from the thermal gravimetric analysis curves, mass loss vs temperature [23]. The disadvantage of this method is the using of various approximations for the temperature integral [24].
The Friedman isoconversional method (Fr) is a differential method in which no approximation is used. Usually, the values obtained for the Ea are higher than the values calculated with the FWO method due to the different way of calculation and the lack of approximations [24,25] .
In this study we aim to fully characterize the thermal stability of LNG, but also the decomposition process that takes place when the sample is heated in oxidative atmosphere. The results obtained for the pure API are going to be compared to those acquired for a pharmaceutical formulation that contains 1.5 mg LNG/tablet and for an enriched mixture formed between the tablet and LNG in a mass ratio of 1:1. Firstly, for the kinetic studies, a preliminary method was implied, namely ASTM E698, and then two isoconversional methods were used for the approximation of the activation energy: Flynn-Wall-Ozawa and Friedman. To confirm the identity and the purity of the LNG, FTIR analysis was performed, but also the same analytical method was used to confirm the presence of LNG in the tablet and the mixture.
2. Materials and Methods
2.1. Samples and preparation
Levonorgestrel (LNG) was acquired from Sigma-Aldrich (St. Louis, MO, USA) and the purity was according to British Pharmacopoeia (BP) Reference Standard. The sample was used in the studies as received.
The pharmaceutical formulation (LNGTAB) that was investigated contained 1.5 mg LNG/tablet, sold under the name Escapelle 1.5 mg (batch T2C001E), produced in Budapest, Hungary by Gedeon Richter. In this study one tablet was used and the excipients, as presented on the summary of product features, are: potato starch, anhydrous silicon dioxide, magnesium stearate, talc, corn starch and lactose monohydrate. The mass of the tablet was 201.38 mg, which was crushed in an agate mortar with pestle, triturated, sieved and then placed in a sealed brown vial at 25 °C, in absence of light.
For the preparation of mixture (LNGMIX), 75.2 mg of the powder obtained by triturating the tablet in an agate mortar and an equivalent quantity of LNG was added to obtain a mass ratio of 1:1. The LNGMIX was processed and stored identically as LNGTAB.
2.2. FTIR analysis
For obtaining the FTIR data, a Jasco FT/IR – 670 Plus instrument was used, without any further purification of the samples, using the KBr dispersion and pelleting method. The selected spectral domain was between 4000–400 cm–1. The spectrum was built after 32 successive scans at 2 cm–1.
2.3. Thermal analysis
For the thermal analysis, the Setline TGA (SETARAM, Caluire, France) instrument was employed, in order to obtain the TG (thermogravimetric/mass curve) and DTG data (derivative thermogravimetric/mass derivative), using an open alumina crucible. The heating process was conducted in dynamic air flow (100 mL·min−1) under non-isothermal conditions, employing five different heating rates of β = 2, 4, 6, 8 and 10 °C·min–1, from a temperature of 40 °C up to 500 °C. DSC curve of LNG was recorded on a NETZSCH DSC 204F1 Phoenix (NETZSCH, Selb, Germany) using sealed aluminum crucibles in inert nitrogen medium with a flow rate of 20 mL·min–1.
2.4. Kinetic analysis
The kinetic analysis was performed on the data obtained from the first decomposition process observed on the DTG curves for LNG, tablet and mixture, using the AKTS—Thermokinetics Software version 4.46 (AKTS AG TechnoArk, Siders, Switzerland). The abbreviations used respects the recommendations of the International Confederation for Thermal Analysis and Calorimetry (ICTAC) Kinetics Committee: α—conversion degree, t—time, β—linear heating rate (C·min–1), A—pre-exponential factor according to kinetic model of Arrhenius (min–1), f(α)—the differential conversion function, g(α)—the integral conversion function, Ea—activation energy (kJ·mol–1), R—universal gas constant (J·mol–1·K–1), T—absolute temperature (K), Δm—mass loss on a certain temperature interval
3. Results and Discussion
3.1. FTIR analysis
The FTIR spectra were determined for all three samples, namely levonorgestrel as pure active pharmaceutical ingredient (LNG), the powder obtained from triturating the tablet containing 1.5 mg of levonorgestrel (LNGTAB) and the mixture (LNGMIX), which contains in a mass ratio of 1:1 LNG and LNGTAB. The spectra of LNGTAB and LNGMIX confirmed the presence of LNG in each sample. The obtained FTIR spectra for all three samples are presented in Figure 2.
The wavenumbers of each absorption band observed on the spectrum of LNG can be correlated with the functional groups and chemical bonds of the API. The results correspond to the data presented in the scientific literature [26,27], which demonstrates both the identity and the degree of analytical purity of the analyzed substance. Firstly, it is observed a large absorption band with two bands at 3430 cm–1 and 3348 cm–1, characteristic for the stretching vibrations of the dimeric hydroxyl group. Also, for this functional group at 1066 cm–1 it is revealed a strong absorption band caused by the stretching vibration of the C–O bond. The in-plane bending vibrations of the –OH group are found at 1363 cm–1. For the carbonyl group the absorption band is shifted to a lower wavenumber, due to the conjugation of the double bond determining a delocalization of the π electrons of those unsaturated groups, thus the stretching vibrations are observed at the wavenumber equal to 1653 cm–1. The stretching and bending vibrations of C–C(=O)–C group show a moderate absorption with two medium intensity bands at 1210 cm–1 and 1131 cm–1 ,which results from the stretching of C–C–C and C–C(=O)–C bending in the C–C–C group. The C=C bond from the cycloalkene determine an absorption band at 1653 cm–1 due to the stretching vibrations of this group. The out-of-plane bending vibrations of the C–H bond, made by the carbon atoms from the alkene, appears as two intense absorption bands at 692 cm–1 and 657 cm–1. For the monosubstituted terminal alkyne no absorption band is observed in the spectral range of 2140-2100 cm–1, but the stretching vibrations of the C–H bond are detected as an intense band at 3267 cm–1. Also, the bending vibrations of the same bond are highlighted by two strong bands at 692 cm–1 and 657 cm–1, which are overtoned by a weak, broad band with a maxim at 1233 cm–1. For the methyl group the FTIR spectra revealed an absorption band at 2957 cm–1 characteristic for the symmetrical stretching vibrations and a band at 2868 cm–1 associated with the asymmetrical stretching vibrations. The symmetrical bending vibrations for –CH3 is observed at the wavenumber 1389 cm–1 and the asymmetrical ones at 1446 cm–1, usually it overlaps the scissoring vibration of the methylene groups, but in this case, due to conjugation, the band for this type of vibration is distinct at 1469 cm–1. For the cycloalkanes, the stretching vibrations of C–H bonds appear at 2979 cm–1 and 2932 cm–1, a slight shift is caused by the conjugation. The bending vibrations of the same bond are observed at 1458 cm–1.
The spectra for LNGTAB and LNGMIX are more complex due to the presence of excipients, namely: potato starch, anhydrous silicon dioxide, magnesium stearate, talc, corn starch and lactose monohydrate. Even so, the absorption bands which characterize each functional group and chemical bond observed on the chemical structure of LNG can be distinguished, confirming the presence of the API in each sample. The FTIR spectrum of LNGTAB shows more attenuated absorption bands for LNG, due the presence of the excipients. For the excipients, the presence of lactose monohydrate and starch is certified by the broader absorption band in the spectral region of 3715-2994 cm–1, with two bands at 3383 cm–1 and 3562 cm–1, which is determined by the stretching vibrations of the hydroxyl group. The ether group from the starch molecule revealed a strong absorption band at 1094 cm–1, caused by the asymmetrical stretching vibrations of the C–O–C bond. The enriched sample with the API, namely LNGMIX, shows a FTIR spectrum with more accentuated absorption bands for LNG, than the one of LNGTAB, confirming the addition of LNG and allowing a more accurate identification of the absorption bands for the excipients.
3.2. Thermal analysis
The TG/DTG data obtained for LNG, LNGTAB and LNGMIX are presented in Figure 3, Figure 4 and Figure 5.
Thermal profile of LNG (Figure 3) reveals a two-step degradation process, as seen in data collected in Table 1. The small mass loss that takes place below 70 °C represents the release of superficially adsorbed water, and after this process, LNG is thermally stable up to 192 °C. The mass loss is accompanied by the melting of the API, which takes place at 243 °C (DSC curve shown on Figure S1), in good agreement with the 232-239 °C temperature range mentioned in PubChem [28].
The two main decomposition processes that occur during thermolysis of LNG are well-individualized in the TG/DTG curves, the mass loss becoming considerable with the increase of the temperature. However, TG data indicate for this API a considerable thermal stability, which can be explained by the presence of the nortestosterone moiety in the structure, grafted with functional moieties that can form H-bonds in solid state (namely the 17β-hydroxy and respectively 3-carbonyl groups).
Thermal profile of LNGTAB (Figure 4) reveals a four-step degradation process, as seen in data collected in Table 1. The more complex decomposition profile of the tablet was expected, since it contains several excipients that are reactive under thermal treatment. The first decomposition process that occurs up to 115 °C is associated with the water loss from the tablet, mainly contained in the excipients, especially in lactose monohydrate. In order to get a clear view of the decomposition process of LNGTAB, the thermal data for lactose monohydrate was recorded in same experimental conditions (TG/DTG curve shown on Figure S2). As can be seen in Table 1, the additional processes on the thermoanalytical profile of LNGTAB are due to the presence of excipients, mainly lactose. However, the shifting of the additional processes in LNGTAB vs. Lactose monohydrate is due to the presence of the other excipients, which were not investigated individually. Also, the presence of API in this sample is hard to be evidenced due to overlapping effect of lactose decomposition, but as well for the missing thermal events that take place in the 355–483 °C temperature range observed for LNG and not for LNGTAB.
In Figure 5 we present the thermal behavior of the LNGMIX sample, consisting in equal mass amounts of tablet and API. The necessity of preparing such a mixture for the kinetic study is due to the fact that in the commercialized formulation, the mass of API represents only approximately 0.75% of the total mass of the tablet, so a clear revealing of the processes using thermal analysis would be impossible. The preparation of an enriched mixture where the API represents 50% of the mass in the mixture with excipients makes this system more appropriate for kinetic investigations. As can be seen in data presented in Table 1, in corroboration with thermoanalytical data shown in Figure 4, the profile of LNGMIX reveal all the processes of LNG and LNGTAB, making it the ideal system in characterizing the behavior of API in the presence of excipients.
3.3. Kinetic Investigations
Since thermal analysis did not reveal the second process of decomposition of the API in LNGTAB, kinetic investigations were abandoned for this sample. In order to check the excipients effect, we have prepared the LNGMIX sample, as described in Section 2.1.
Initially, we have investigated the kinetic of degradation “process 1” for both LNG (consisting in process I from Table 1) and LNGMIX (consisting in processes III+IV from Table 1), on the DTG ranges presented for each heating rate in Table 2, followed by the investigations of “process 2”.
First of all, using the selected DTG temperature intervals shown in Table 2, we have generated the reaction progress vs. T (Figure 6), and as well the reaction rate vs. T curves for both samples (Figure 7). For both samples, it can be seen that the increase of the heating rate determines the shift of the investigated process to higher temperatures, in good agreement with the well-known fact that mass/heat transfer is affected by a higher inertia at higher heating rates.
The analysis of the reaction rate vs. T reveal the increase of reaction rate for each sample, with the increase of temperature, as well the shifting of the peak to higher temperatures. For LNG, the reaction rate reveals single maxima, while for LNGMIX, the reaction rate reveal a multistep process, as shown in Figure 7.
Initially, the ASTM E698 method was employed as a preliminary investigational tool (Figure S3); the linear plotting of ASTM E698 method indicate for both investigated samples two practically identical apparent activation energies, namely: for LNG, Ea is 92.5 kJ·mol–1, while for LNGMIX Ea is 93.9 kJ·mol–1, which may suggest that the degradation process of this API is independent to the presence of excipients in the analytical matrix.
In order to investigate in-depth the kinetics of degradation, with the effects of the excipients, two isoconversional methods, namely the differential method of Friedman (FR) and integral method of Flynn-Wall-Ozawa were used. The theoretical fundamentals of heterogeneous solid-state kinetics was elsewhere reported [29], so here we present only the linearized equations that mathematically correlate the physical quantities that describe the above-mentioned kinetic models.
The linearized model of differential FR method is shown in equation (1), while for the integral FWO method is shown in equation (2), with the respect to the abbreviations presented in Section 2.4.
The plotting ofvs. (1/T) generates the so-called Friedman family of linear dependencies, and from their slopes the values of apparent activation energies can be obtained (Figure 8).
The plotting ofvs. (1/T) generates the FWO family of linear dependencies (Figure 9), and the apparent activation energies can be obtained in a similar manner as for FR method, results which are summarized in Table 3.
The analysis of variation of each individual Ea value vs. α allows an estimation of the complexity of degradation of the heterogenous process, since it is generally known that the main cause of this variation is due to the existence of parallel, consecutive or reversible reactions that accompany the main transformation [30,31]. For the processes which consist in sequences of complex reactions, the Ea vs. α can reveal minimum and/or maximum inflection points, and as well sequences where Ea is independent of conversion degree. In order to get a clear view over the variation of Ea vs. α data presented in Table 3, Figure 10 were drawn up.
As can be seen in Figure 10a, the decreasing dependence of Ea on α by the FWO method may suggest that the “process 1” of degradation of LNH is a kinetic process that consist in an endothermic reversible reaction followed by an irreversible one; for such processes, at low conversions (α < 0.3), the beginning of the irreversible reaction is limited by the reversible reaction, while at high conversions (α > 0.3), Ea is dictated solely by the irreversible degradative process [30]. For the variation of Ea on α by the FR method, the tendency is similar at the beginning of the process (for α < 0.2, Ea decreases on α), while in the 0.2< α<0.95 range, the Ea is not α-dependent, remaining in the variation range, which confirm the complex mechanism of decomposition of LNG, but which is independent on the heating rate of the samples.
In the case on LNGMIX (Figure 10b), a different mechanism of decomposition is evidenced: at conversion degrees α ≤ 0.4, the tendency is similar to pure LNG, but with increase of α, the mechanism drastically changes. This can be simply explained by the fact that competitive processes that degrade the excipients take place (especially lactose monohydrate, which has the main decomposition process in this temperature, as seen in Figure S1). However, by comparing the values of activation energies for degradation of these two samples at α < 0.4, we can conclude that excipients have a stabilizing role in formulation, leading to an increase of stability of approx. 30% in terms of apparent activation energy.
In order to check the stabilizing effect of lactose and/or other excipients over decomposition of LNG, we have investigated the second process of degradation of LNG and LNGMIX. The advantage of investigating the kinetics of degradation of this process is due to the fact that lactose does not longer exist in the analytical matrix, so the values of activation energies are no longer influenced by it. All the iconography and data associated with this investigation is presented in Supplementary materials (Figures S4-S8 and Table S1), except the variation of Ea vs. α, which is presented in Figure 11.
The variation of Ea values on α for the investigated “process 2” reveal a similar FWO profile for LNG, suggesting that the decomposition mechanism is similar with the one the decompose LNG in the inferior temperature range. Due to differential processing of kinetic data, the FR variation is more scattered, confirming that this decomposition is also complex. For LNGMIX, a clear change of mechanism is observed, in comparison with the tendencies observed for LNGMIX during process 1.
Taking into account that “process 2” takes place in the absence of lactose, we have checked the stabilizing/destabilizing effect of this excipient over the first decomposition process, by calculation the ration between the mean Ea values for LNGMIX and LNG for each isoconversional method, using the values from Table 3 (“process 1”, Ēa,LNG,FR1 = 89.1 kJ·mol–1; Ēa,LNG,FWO1 = 103.2 kJ·mol–1; Ēa,LNGMIX,FR1 = 129.9 kJ·mol–1; Ēa,LNGMIX,FWO1 = 133.8 kJ·mol–1) and Table S1 (“process 2”, Ēa,LNG,FR2 = 142.9 kJ·mol–1; Ēa,LNG,FWO2 = 178.9 kJ·mol–1; Ēa,LNGMIX,FR2 = 176.0 kJ·mol–1; Ēa,LNGMIX,FWO2 = 216.2 kJ·mol–1 ).
The ratios obtained for process 1 were Ēa,LNGMIX,FR1 / Ēa,LNG,FR1 = 1.46 for FR method and Ēa,LNGMIX,FWO1 / Ēa,LNG,FWO1 = 1.30 for FWO method (in the presence of lactose) and for process 2 were Ēa,LNGMIX,FR2 / Ēa,LNG,FR2 = 1.23 for FR method and Ēa,LNGMIX,FWO2 / Ēa,LNG,FWO2 = 1.21 (in the absence of lactose). By analyzing the obtained ratios, we can conclude that the thermolysis of mixture require more energy for process 1, where lactose is present (by at least 30% higher in terms of activation energy), while in the second process, the stability is increased by approx. 20% by the remaining auxiliaries from formulation.
4. Conclusions
In this study we deal with instrumental screening of the emergency contraceptive agent levonorgestrel, both as a pure pharmaceutical ingredient and also in the presence of a complex analytical matrix, containing the excipients from a commercialized pharmaceutical formulation, prepared in our lab, in a mass ratio 1:1 LNG and mixture of excipients.
Initially, three samples were investigated by FTIR spectroscopy in order to confirm the presence/identity of API: LNG, LNGTAB and LNGMIX; the results of spectral analysis confirmed the identity and purity of LNG, and as well the presence of this API in both commercialized tablet (LNGTAB) and the enriched formulation LNGMIX. However, thermal analysis data failed to reveal the presence of API in LNGTAB (the second process of decomposition of the API in LNGTAB is not evidenced in thermoanalytical curves), kinetic investigations were abandoned for this sample. In order to check the excipients effect, we have compared the kinetics of decomposition of LNG versus LNGMIX, for both process 1 of degradation and respectively, process 2 of degradation.
As first kinetic study, the ASTM E698 method was employed as a preliminary investigational tool which indicate for both investigated samples two practically identical apparent activation energies, namely: for LNG, Ea is 92.5 kJ·mol–1, while for LNGMIX Ea is 93.9 kJ·mol–1, which may suggest that the degradation process of this API is independent to the presence of excipients in the analytical matrix. Obtaining these values that are independent of any particular model involves a forced fitting to a first order reaction mechanism, which can lead up to eronated values for Ea.
In order to investigate in-depth the kinetics of degradation, with the effects of the excipients, two isoconversional methods, namely the differential method of Friedman (FR) and integral method of Flynn-Wall-Ozawa were used. A discussion regarding the complexity of the mechanism of decomposition is carried out, emphasizing as well the stabilizing effects of excipients, especially the one of lactose.
Supplementary Materials
The following supporting information can be downloaded at: Preprints.org, Figure S1. The DSC curve recorded for LNG at β = 10 °C·min–1 on 40-250 °C temperature range; Figure S2. Thermoanalytical data (TG/DTG) recorded for Lactose monohydrate in dynamic air atmosphere at β = 10 °C·min–1; Figure S3. The plot according to the ASTM E698 kinetic method with the estimated activation energy of “process 1” for: (a) LNG and (b) LNGMIX; Figure S4. The reaction progress vs. temperature for “process 2” at selected heating rates for: (a) LNG and (b) LNGMIX; Figure S5. The reaction rate vs. temperature for “process 2” at selected heating rates for: (a) LNG and (b) LNGMIX; Figure S6. The plot according to the ASTM E698 kinetic method with the estimated activation energy of “process 2” for: (a) LNG and (b) LNGMIX; Figure S7. Linear plotting of FR differential isoconversional method of the analyzed “process 1” of decomposition for: (a) LNG and (b) LNGMIX; Figure S8. Linear plot of FWO integral isoconversional method of the analyzed “process 2” of decomposition process for: (a) LNG and (b) LNGMIX; Table S1. Variation of Ea vs. α for both samples LNG and LNGMIX for “process 2” using the FR and FWO isoconversional methods.
Author Contributions
Conceptualization, Amalia Ridichie and Matilda Rădulescu; Data curation, Amalia Ridichie, Adriana Ledeţi, Ionuţ Ledeţi, Cornelia Muntean and Matilda Rădulescu; Formal analysis, Ionuţ Ledeţi and Cornelia Muntean; Investigation, Amalia Ridichie, Francisc Peter and Cornelia Muntean; Methodology, Adriana Ledeţi, Francisc Peter, Ionuţ Ledeţi, Cornelia Muntean and Matilda Rădulescu; Resources, Matilda Rădulescu; Software, Amalia Ridichie and Adriana Ledeţi; Supervision, Adriana Ledeţi, Francisc Peter and Ionuţ Ledeţi; Validation, Adriana Ledeţi; Visualization, Matilda Rădulescu; Writing – original draft, Amalia Ridichie; Writing – review & editing, Adriana Ledeţi, Francisc Peter and Ionuţ Ledeţi. All authors have read and agreed to the published version of the manuscript.
Data Availability Statement
Raw data are available from the corresponding author of this work, on request.
Acknowledgments
Not applicable.
Conflicts of Interest
The authors declare that they have no known competing financial interests or personal relationships that could have appeared to influence the work reported in this paper.
References
- Rodante, F.; Catalani, G.; Vecchio, S. Kinetic analysis of single or multi-step decomposition processes. Limits introduced by statistical analysis. In Proceedings of the Journal of Thermal Analysis and Calorimetry; 2002; Vol. 68, pp. 689–713. [CrossRef]
- Vecchio, S.; Rodante, F.; Tomassetti, M. Thermal stability of disodium and calcium phosphomycin and the effects of the excipients evaluated by thermal analysis. In Proceedings of the Journal of Pharmaceutical and Biomedical Analysis; Elsevier, 2001; Vol. 24, pp. 1111–1123. [CrossRef]
- Verma, R.K.; Szilagyi, I.M.; Pielichowska, K.; Raftopoulos, K.N.; Šimon, P.; Melnikov, A.P.; Ivanov, D.A. Good laboratory practice in thermal analysis and calorimetry. J. Therm. Anal. Calorim. 2023, 148, 2211–2231. [CrossRef]
- Wan, Y.; He, H.; Li, F.; Zhang, P.; Gao, X.; Wang, Y.; Gan, Z.; Li, Y. Thermal stability, thermodynamics and kinetic study of (R)-(–)-phenylephrine hydrochloride in nitrogen and air environments. J. Therm. Anal. Calorim. 2023, 148, 2483–2499. [CrossRef]
- Akash, M.S.H.; Rehman, K. Drug Stability and Chemical Kinetics. Drug Stab. Chem. Kinet. 2020, 1–284. [CrossRef]
- Vrettakos, C.; Bajaj, T. Levonorgestrel. In; Treasure Island (FL), 2023.
- Lee, S.C.; Norman, W. V. Emergency contraception subsidy in Canada: a comparative policy analysis. BMC Health Serv. Res. 2022, 22, 1110. [CrossRef]
- Dinehart, E.; Lathi, R.B.; Aghajanova, L. Levonorgestrel IUD: is there a long-lasting effect on return to fertility? J. Assist. Reprod. Genet. 2020, 37, 45–52. [CrossRef]
- Basaraba, C.N.; Westhoff, C.L.; Pike, M.C.; Nandakumar, R.; Cremers, S. Estimating systemic exposure to levonorgestrel from an oral contraceptive. Contraception 2017, 95, 398–404. [CrossRef]
- Fotherby, K. Pharmacokinetics of gestagens: Some problems. Am. J. Obstet. Gynecol. 1990, 163, 323–328. [CrossRef]
- Saadatkhah, N.; Carillo Garcia, A.; Ackermann, S.; Leclerc, P.; Latifi, M.; Samih, S.; Patience, G.S.; Chaouki, J. Experimental methods in chemical engineering: Thermogravimetric analysis—TGA. Can. J. Chem. Eng. 2020, 98, 34–43. [CrossRef]
- Topuz, F.; Kilic, M.E.; Durgun, E.; Szekely, G. Fast-dissolving antibacterial nanofibers of cyclodextrin/antibiotic inclusion complexes for oral drug delivery. J. Colloid Interface Sci. 2021, 585, 184–194. [CrossRef]
- Pires, F.Q.; Pinho, L.A.; Freire, D.O.; Silva, I.C.R.; Sa-Barreto, L.L.; Cardozo-Filho, L.; Gratieri, T.; Gelfuso, G.M.; Cunha-Filho, M. Thermal analysis used to guide the production of thymol and Lippia origanoides essential oil inclusion complexes with cyclodextrin. J. Therm. Anal. Calorim. 2019, 137, 543–553. [CrossRef]
- Szente, L.; Puskás, I.; Sohajda, T.; Varga, E.; Vass, P.; Nagy, Z.K.; Farkas, A.; Várnai, B.; Béni, S.; Hazai, E. Sulfobutylether-beta-cyclodextrin-enabled antiviral remdesivir: Characterization of electrospun- and lyophilized formulations. Carbohydr. Polym. 2021, 264, 118011. [CrossRef]
- Rout, S.R.; Kenguva, G.; Giri, L.; Kar, A.; Dandela, R. Binary to ternary drug-drug molecular adducts of the antihypertensive drug ketanserin (KTS) with advanced physicochemical properties. Chem. Commun. 2023, 59, 4640–4643. [CrossRef]
- Gunnam, A.; Nangia, A.K. Solubility improvement of curcumin with amino acids. CrystEngComm 2021, 23, 3398–3410. [CrossRef]
- Nugrahani, I.; Jessica, M.A. Amino acids as the potential co-former for co-crystal development: A review. Molecules 2021, 26. [CrossRef]
- Vyazovkin, S.; Chrissafis, K.; Di Lorenzo, M.L.; Koga, N.; Pijolat, M.; Roduit, B.; Sbirrazzuoli, N.; Suñol, J.J. ICTAC Kinetics Committee recommendations for collecting experimental thermal analysis data for kinetic computations. Thermochim. Acta 2014, 590, 1–23. [CrossRef]
- Vyazovkin, S.; Burnham, A.K.; Criado, J.M.; Pérez-Maqueda, L.A.; Popescu, C.; Sbirrazzuoli, N. ICTAC Kinetics Committee recommendations for performing kinetic computations on thermal analysis data. Thermochim. Acta 2011, 520, 1–19. [CrossRef]
- Koga, N.; Vyazovkin, S.; Burnham, A.K.; Favergeon, L.; Muravyev, N. V.; Pérez-Maqueda, L.A.; Saggese, C.; Sánchez-Jiménez, P.E. ICTAC Kinetics Committee recommendations for analysis of thermal decomposition kinetics. Thermochim. Acta 2023, 719, 179384. [CrossRef]
- Vyazovkin, S.; Achilias, D.; Fernandez-Francos, X.; Galukhin, A.; Sbirrazzuoli, N. ICTAC Kinetics Committee recommendations for analysis of thermal polymerization kinetics. Thermochim. Acta 2022, 714, 179243. [CrossRef]
- Vyazovkin, S.; Burnham, A.K.; Favergeon, L.; Koga, N.; Moukhina, E.; Pérez-Maqueda, L.A.; Sbirrazzuoli, N. ICTAC Kinetics Committee recommendations for analysis of multi-step kinetics. Thermochim. Acta 2020, 689, 178597. [CrossRef]
- Flynn, J.H.; Wall, L.A. A quick, direct method for the determination of activation energy from thermogravimetric data. J. Polym. Sci. Part B Polym. Lett. 1966, 4, 323–328. [CrossRef]
- Starink, M.J. The determination of activation energy from linear heating rate experiments: A comparison of the accuracy of isoconversion methods. Thermochim. Acta 2003, 404, 163–176. [CrossRef]
- Friedman, H.L. New methods for evaluating kinetic parameters from thermal analysis data. J. Polym. Sci. Part B Polym. Lett. 1969, 7, 41–46. [CrossRef]
- Silverstein, R.M.; Webster, F.X.; Kiemle, D.J. Spectrometric Identification of Organic Compounds. Spectrom. Identif. Org. Compd. 6th ed. 2004.
- Stuart, B.H. Infrared spectroscopy: fundamentals and applications; John Wiley & Sons, 2004; ISBN 0470011130. [CrossRef]
- Norgestrel on Pubchem Available online: https://pubchem.ncbi.nlm.nih.gov/compound/Norgestrel (accessed on Aug 22, 2023).
- Baul, B.; Ledeţi, A.; Cîrcioban, D.; Ridichie, A.; Vlase, T.; Vlase, G.; Peter, F.; Ledeţi, I. Thermal Stability and Kinetics of Degradation of Moxonidine as Pure Ingredient vs. Pharmaceutical Formulation. Processes 2023, 11, 1738. [CrossRef]
- Vyazovkin, S.; Wight, C.A. Kinetics in Solids. Annu. Rev. Phys. Chem. 1997, 48, 125–149. [CrossRef]
- Vyazovkin, S. V.; Lesnikovich, A.I. An approach to the solution of the inverse kinetic problem in the case of complex processes. Part 1. Methods employing a series of thermoanalytical curves. Thermochim. Acta 1990, 165, 273–280. [CrossRef]
Figure 1.
Chemical structure of levonorgestrel.
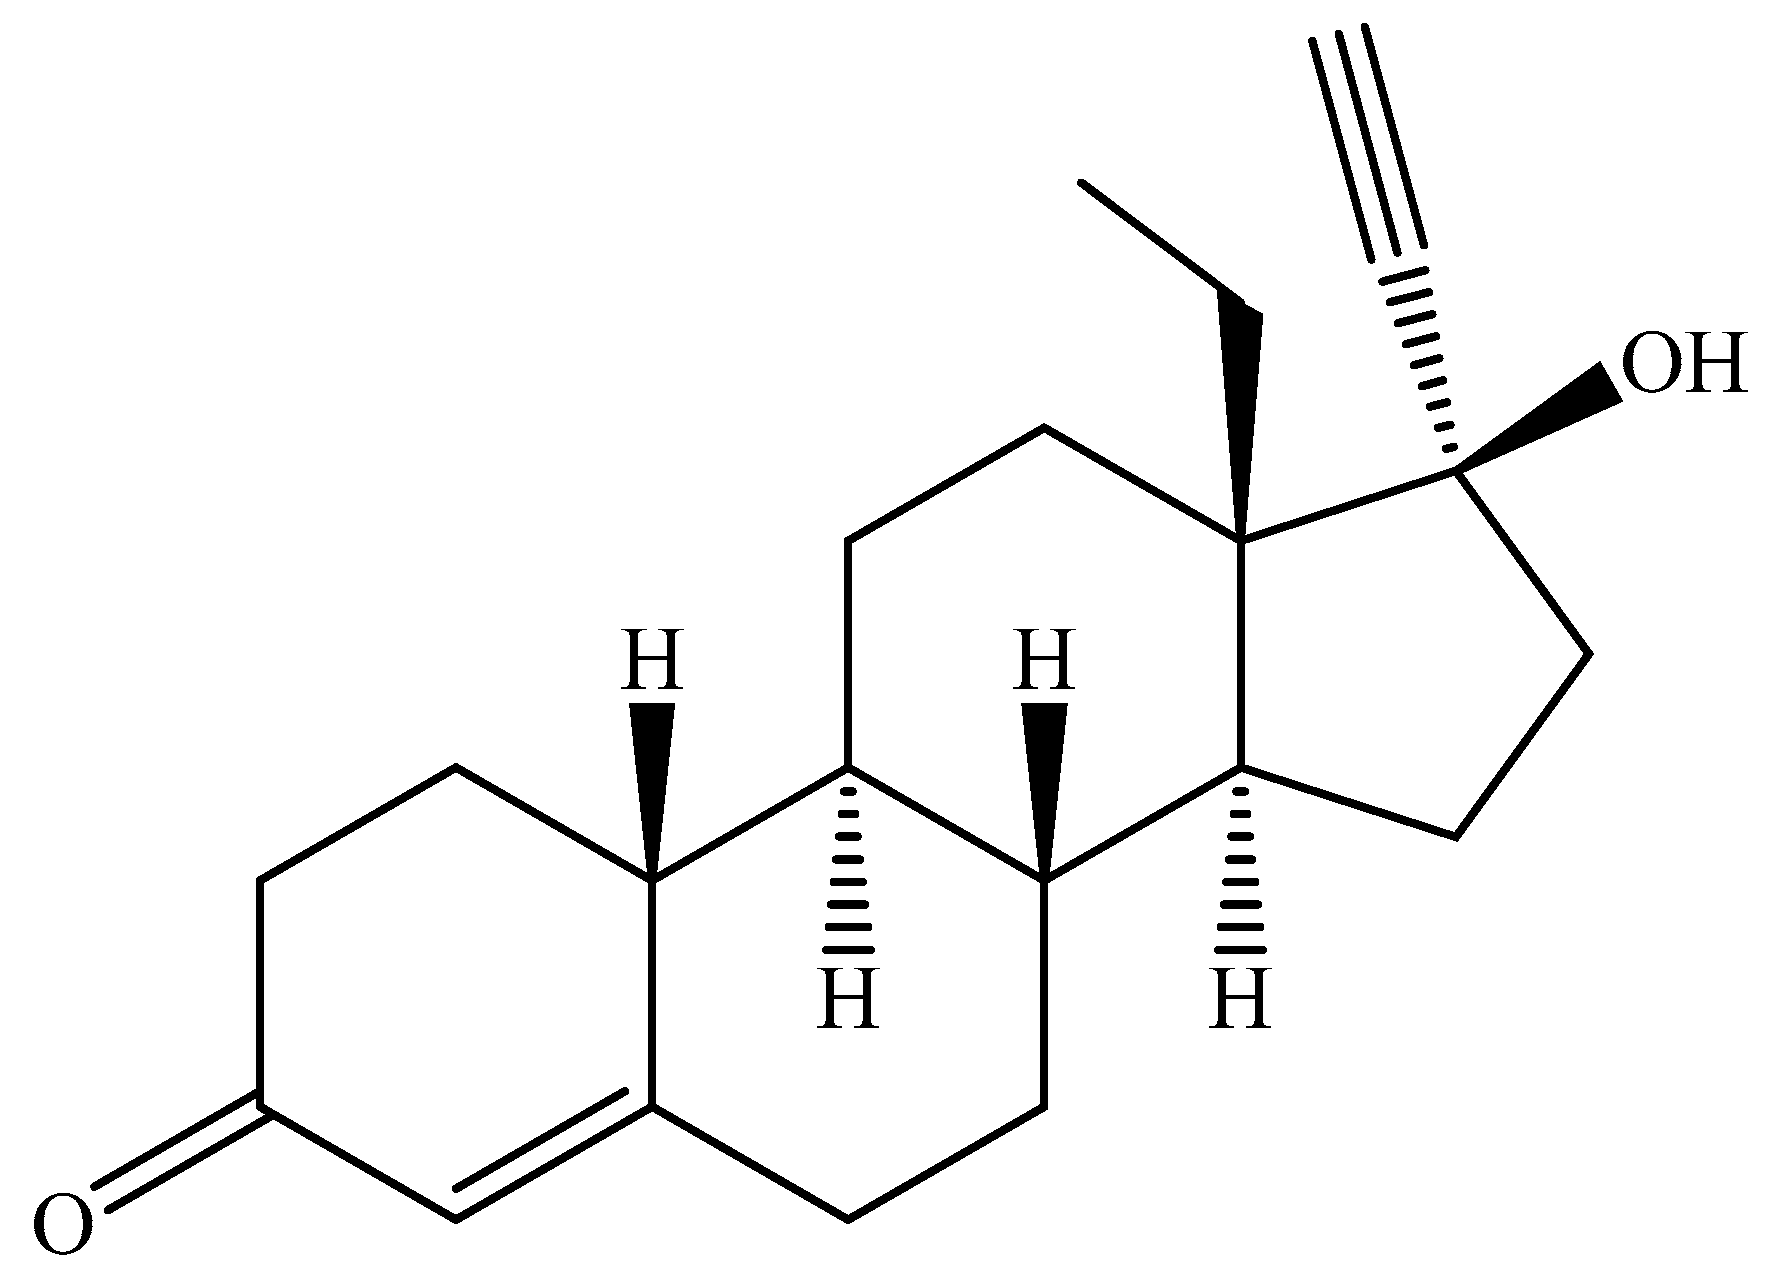
Figure 2.
FTIR spectra for LNG, LNGTAB and LNGMIX.
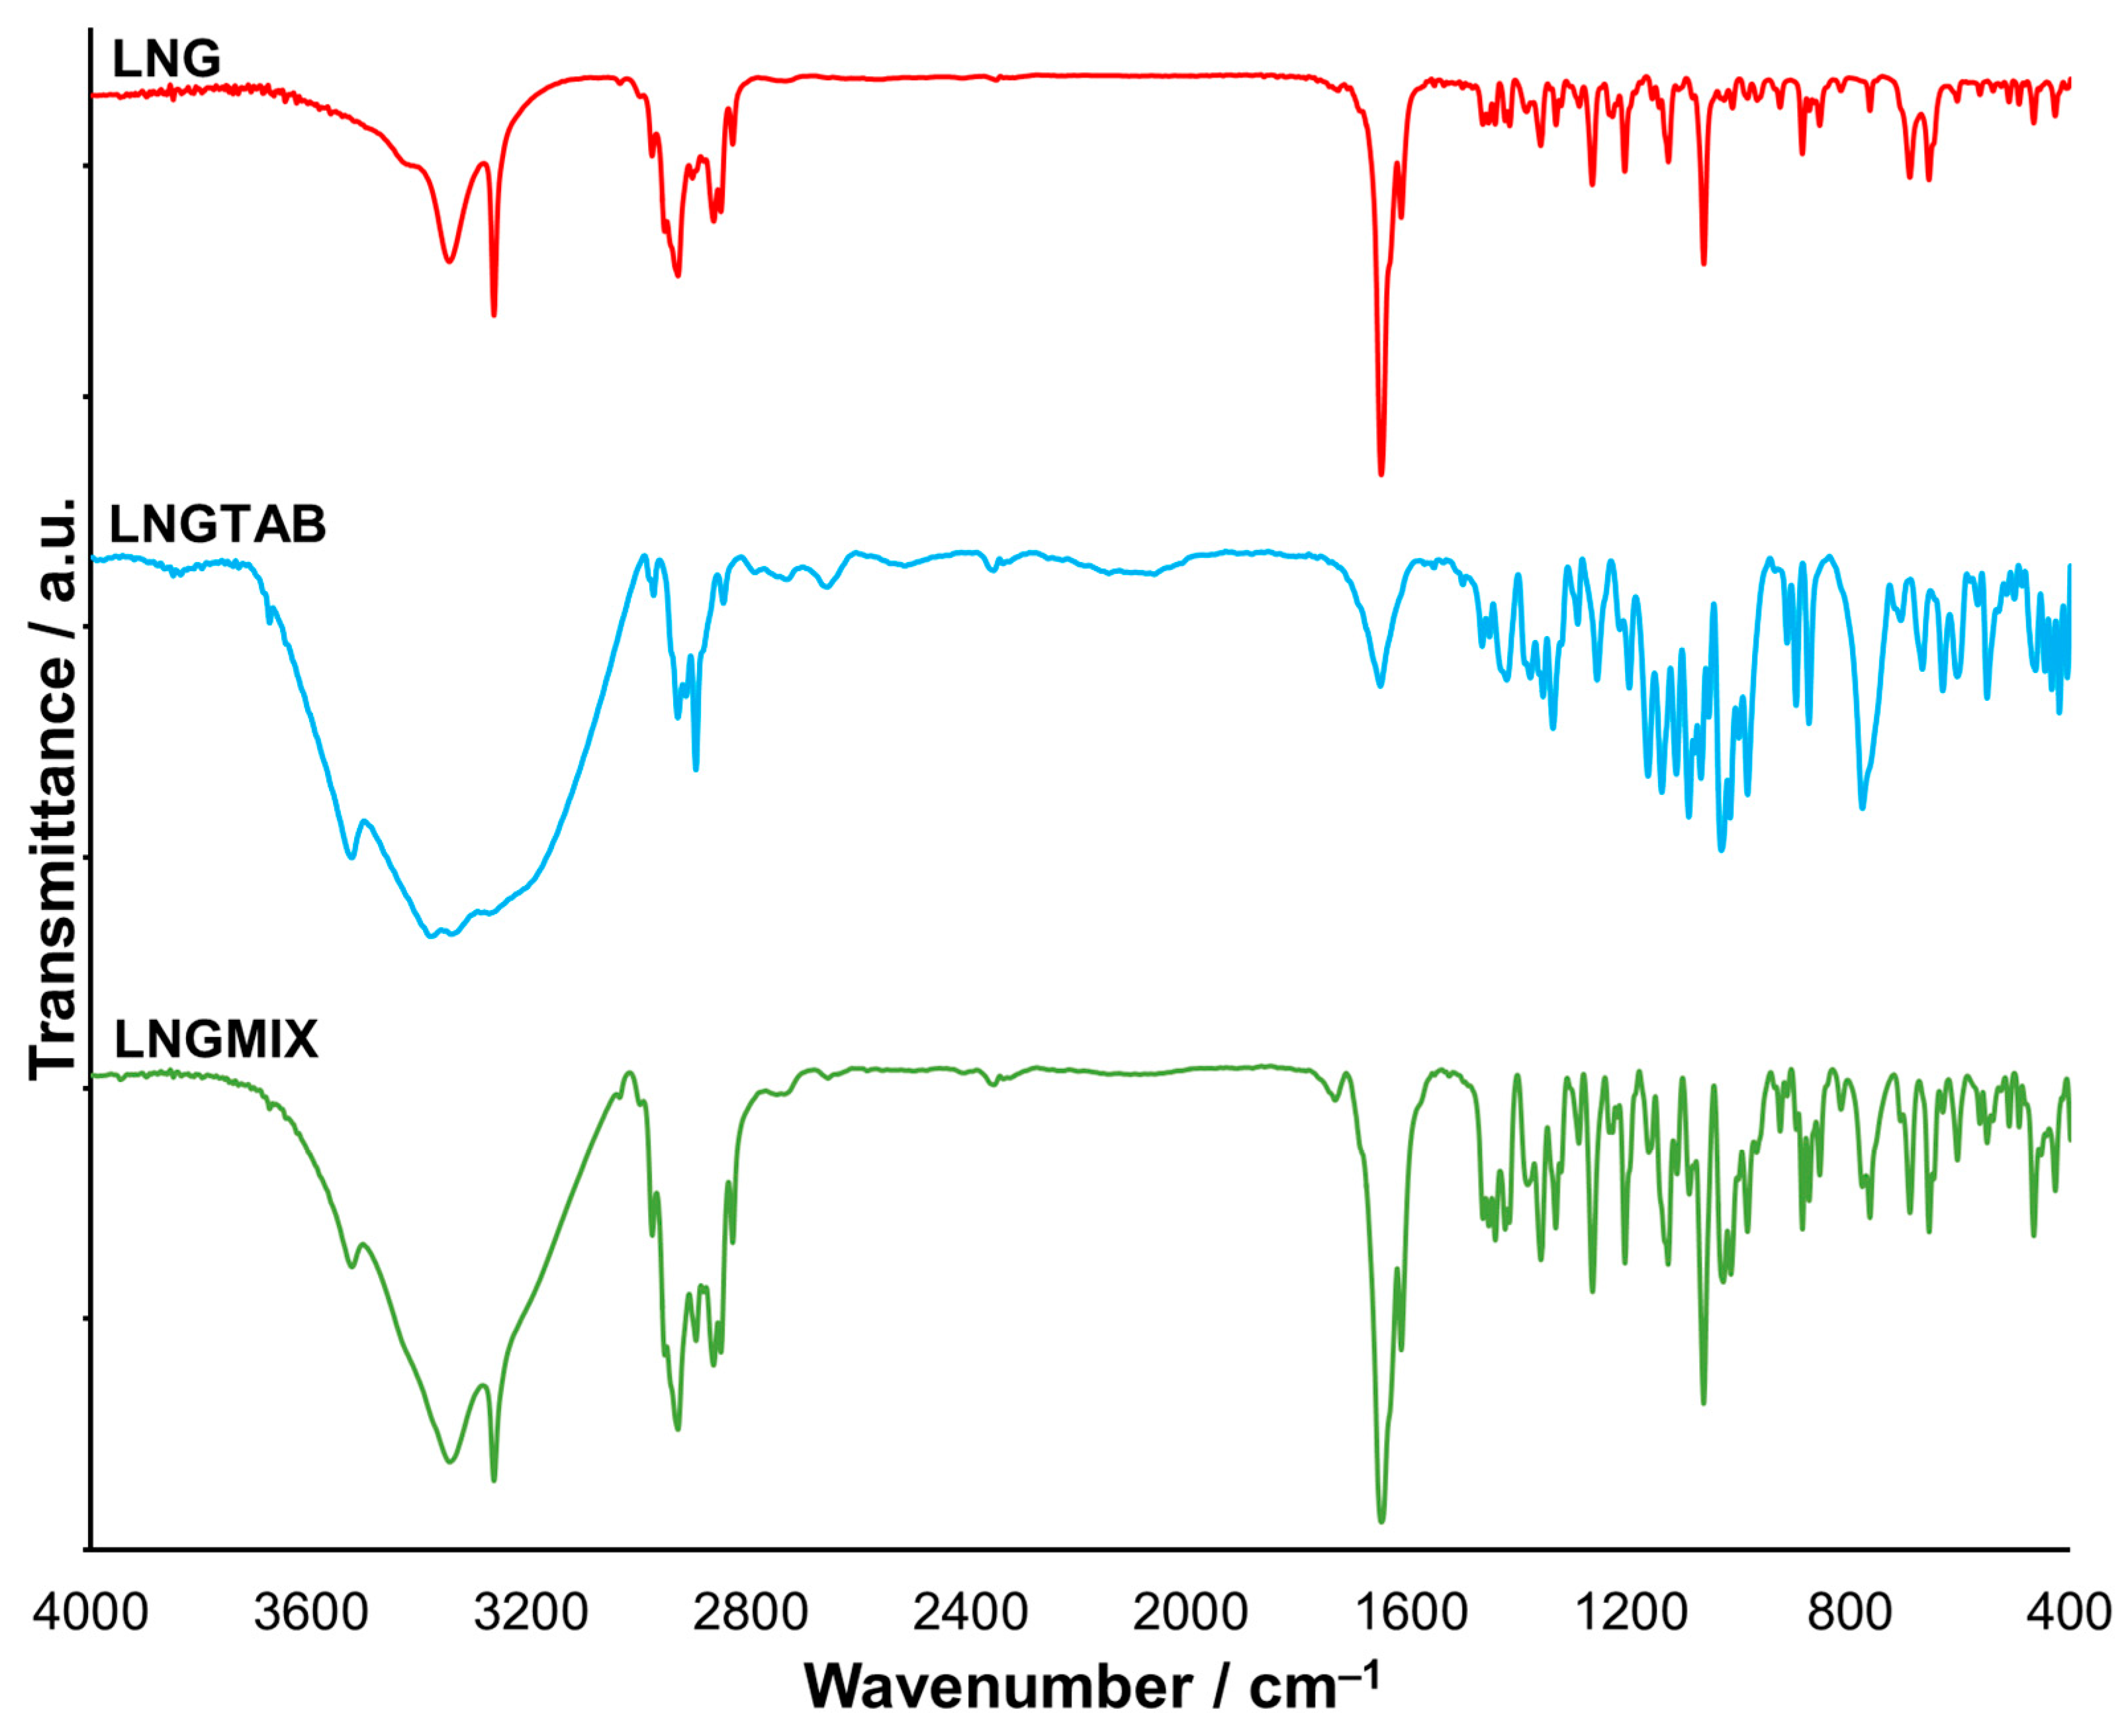
Figure 3.
Thermoanalytical data (TG/DTG) recorded for LNG in dynamic air atmosphere at β = 10 °C·min–1.
Figure 3.
Thermoanalytical data (TG/DTG) recorded for LNG in dynamic air atmosphere at β = 10 °C·min–1.
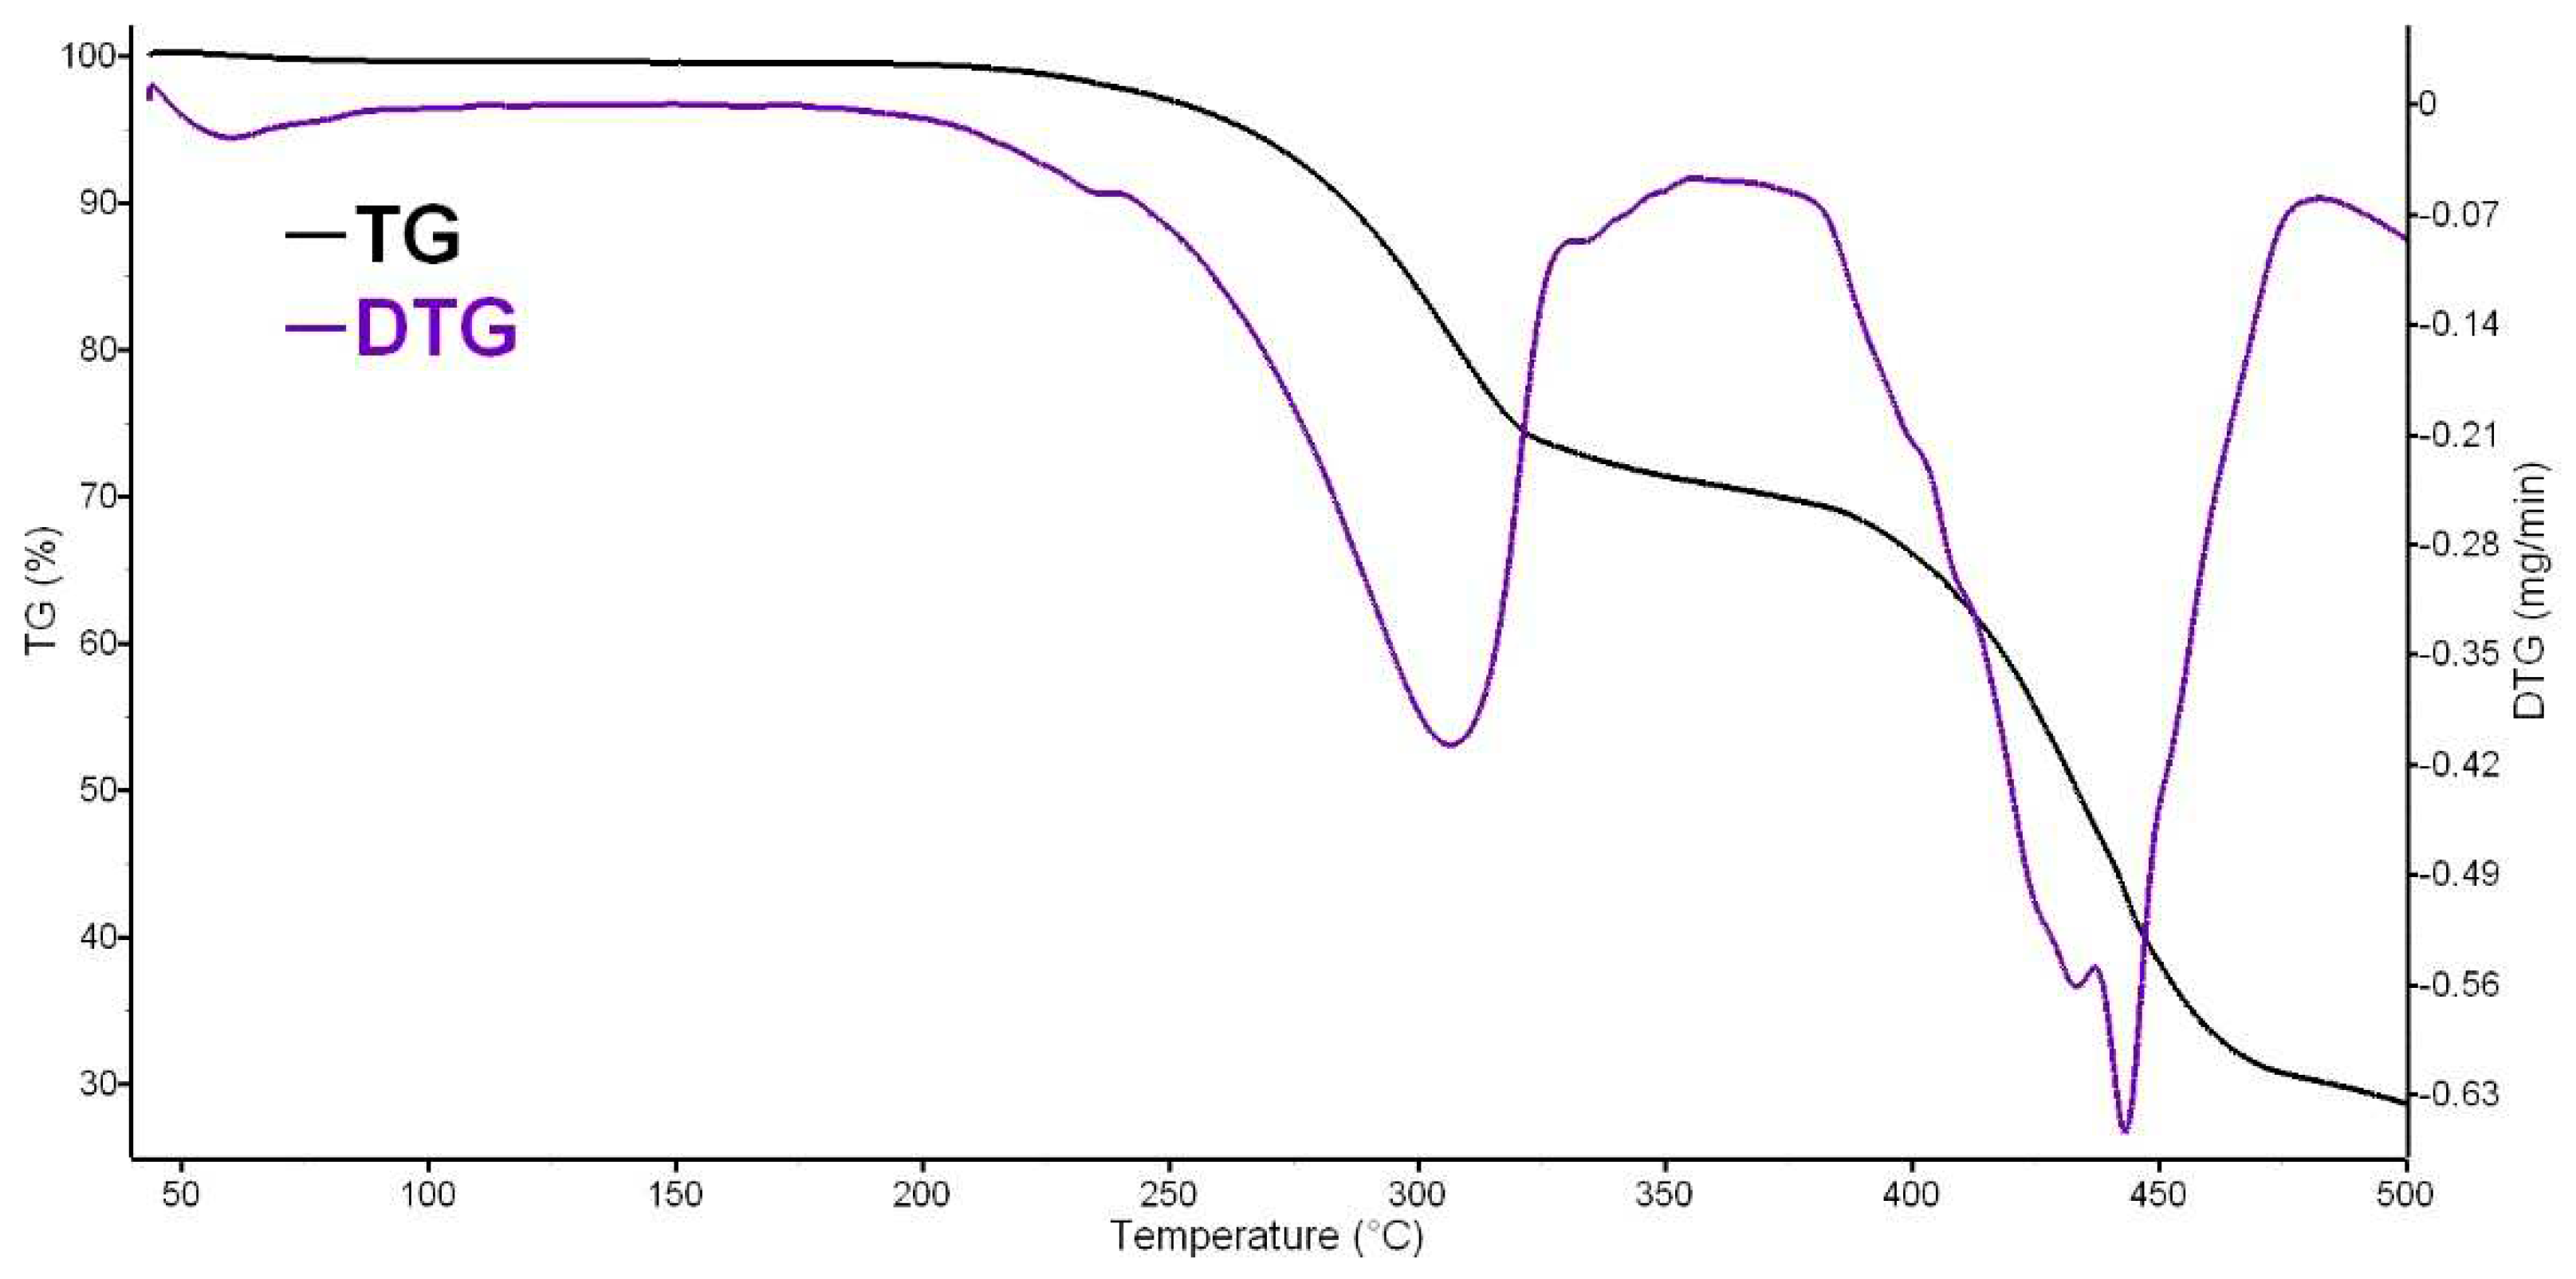
Figure 4.
Thermoanalytical data (TG/DTG) recorded for LNGTAB in dynamic air atmosphere at β = 10 °C·min–1.
Figure 4.
Thermoanalytical data (TG/DTG) recorded for LNGTAB in dynamic air atmosphere at β = 10 °C·min–1.
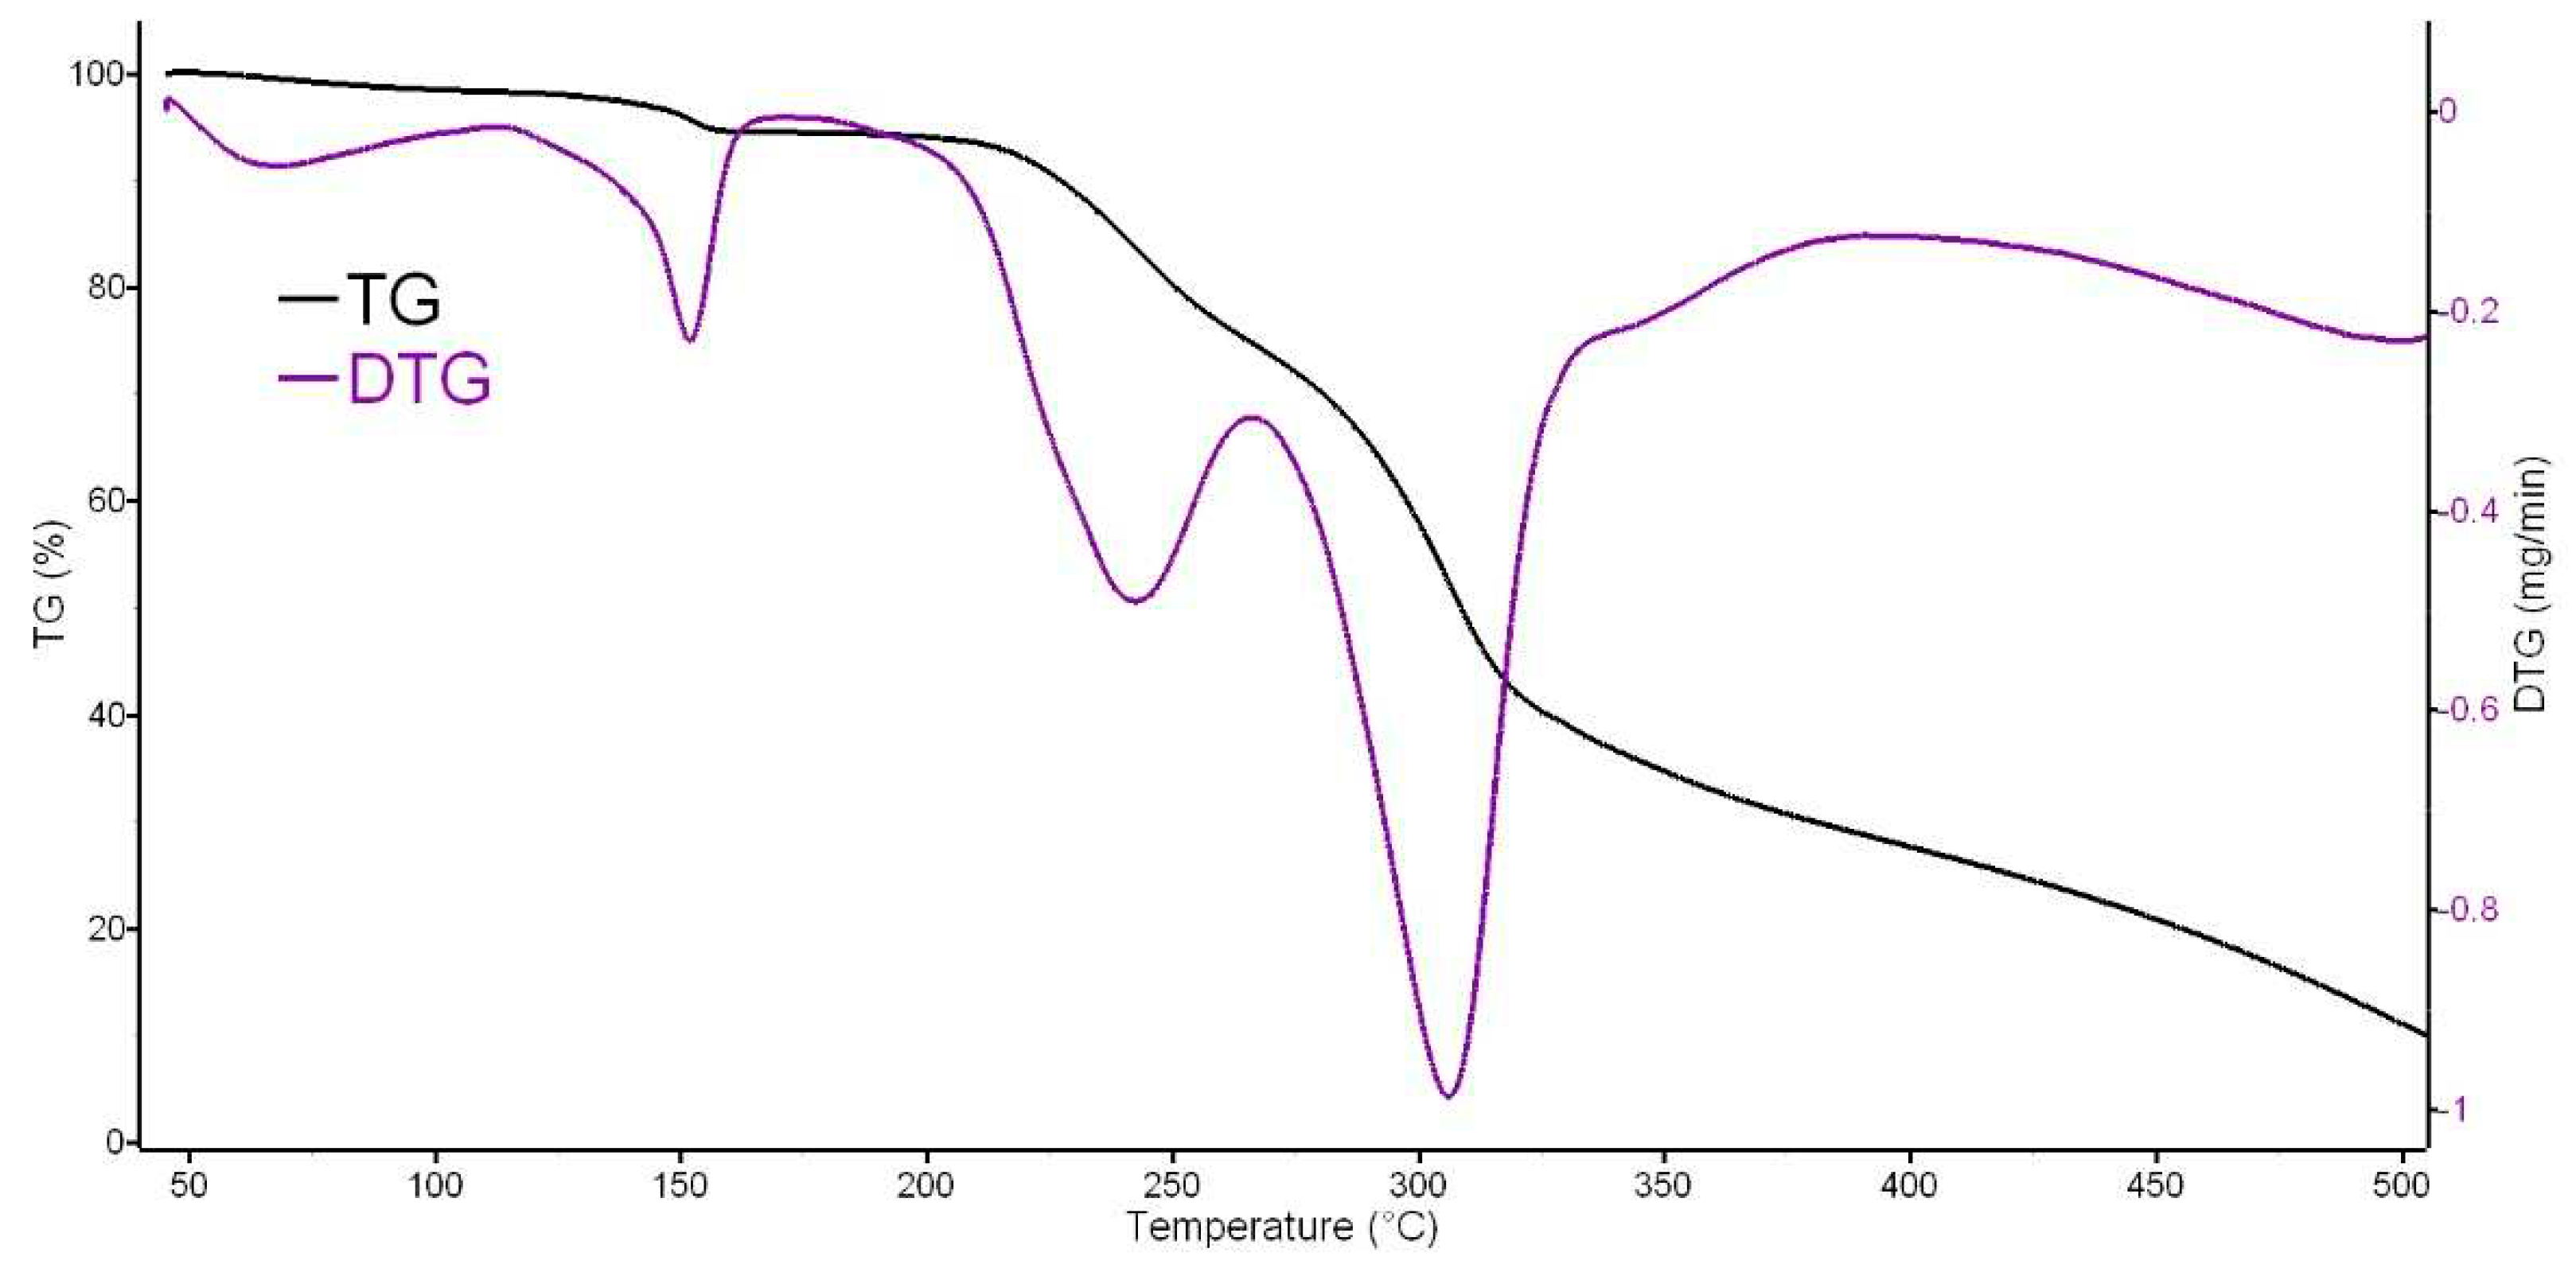
Figure 5.
Thermoanalytical data (TG/DTG) recorded for LNGMIX in dynamic air atmosphere at β = 10 °C·min–1.
Figure 5.
Thermoanalytical data (TG/DTG) recorded for LNGMIX in dynamic air atmosphere at β = 10 °C·min–1.
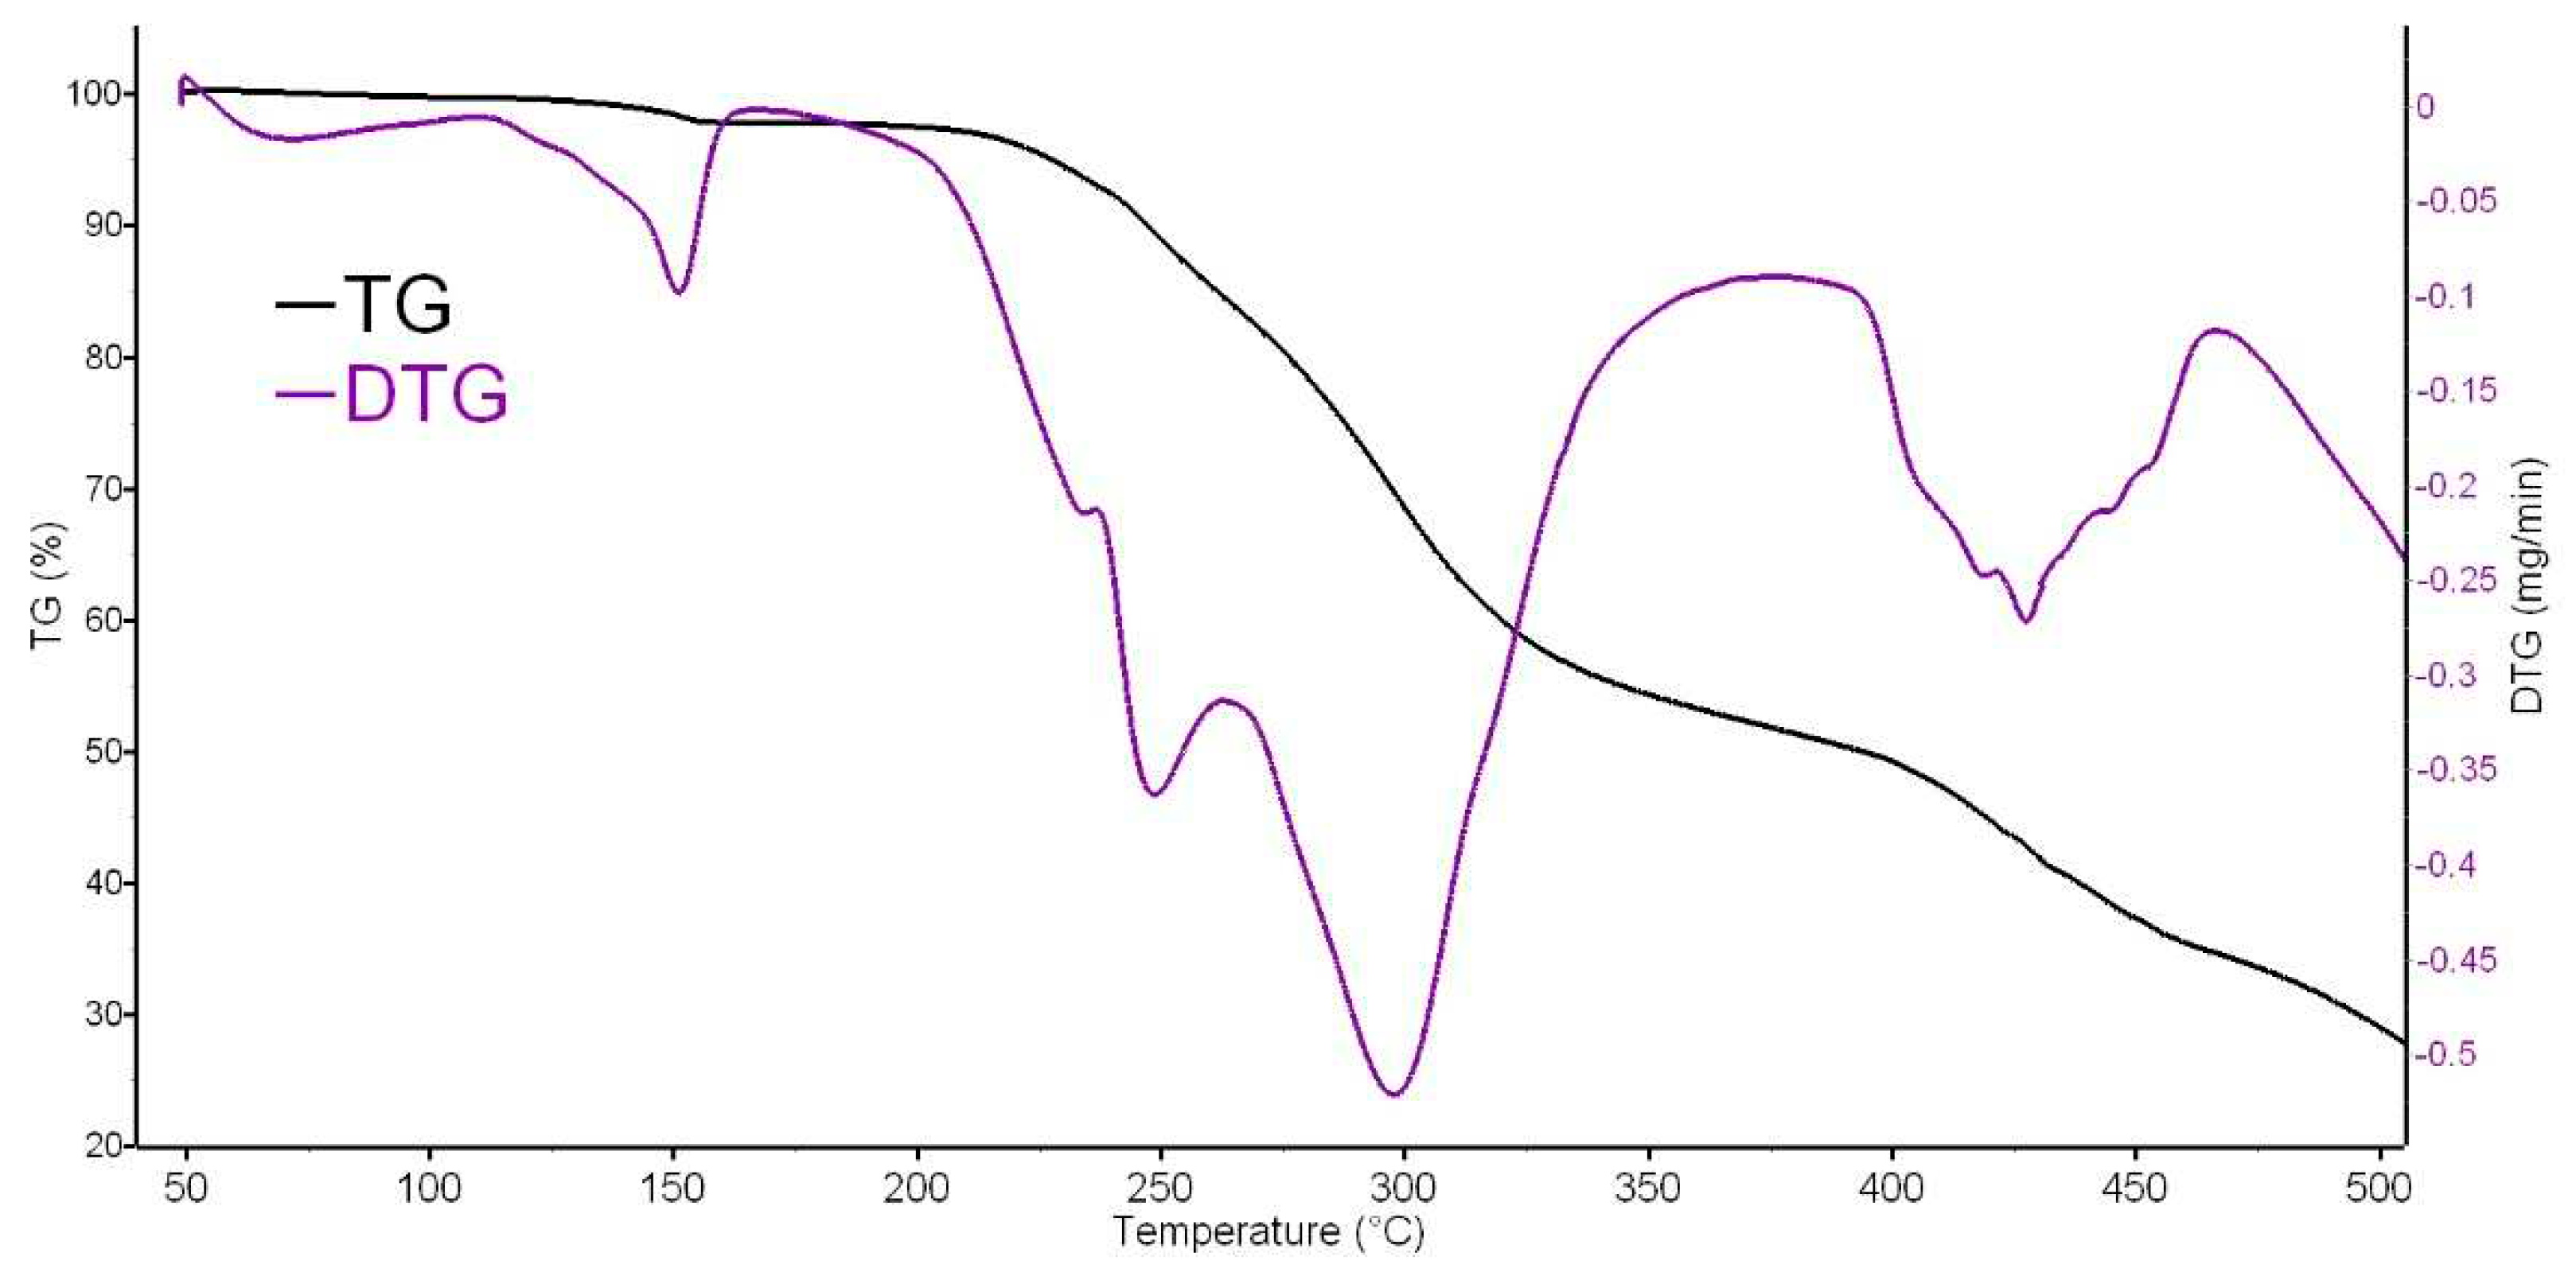
Figure 6.
The reaction progress vs. temperature for “process 1” at selected heating rates for: (a) LNG and (b) LNGMIX.
Figure 6.
The reaction progress vs. temperature for “process 1” at selected heating rates for: (a) LNG and (b) LNGMIX.
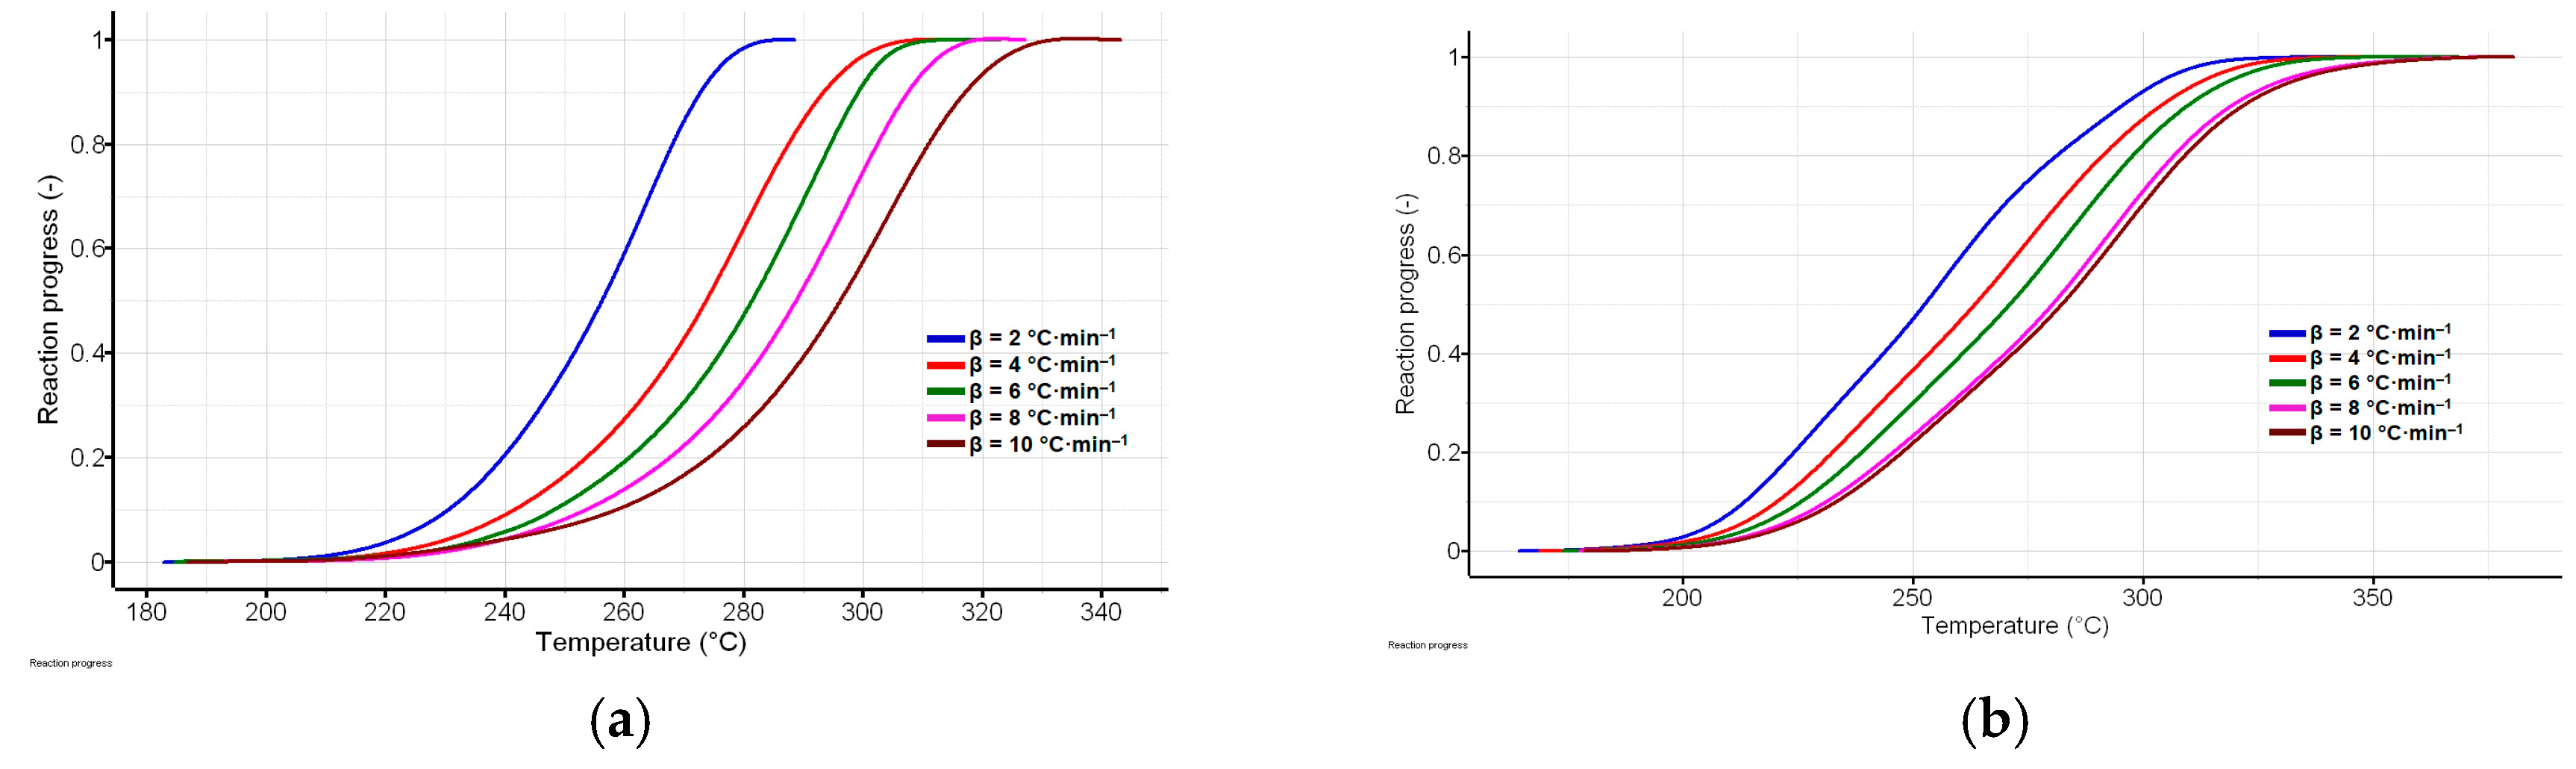
Figure 7.
The reaction rate vs. temperature for “process 1” at selected heating rates for: (a) LNG and (b) LNGMIX.
Figure 7.
The reaction rate vs. temperature for “process 1” at selected heating rates for: (a) LNG and (b) LNGMIX.
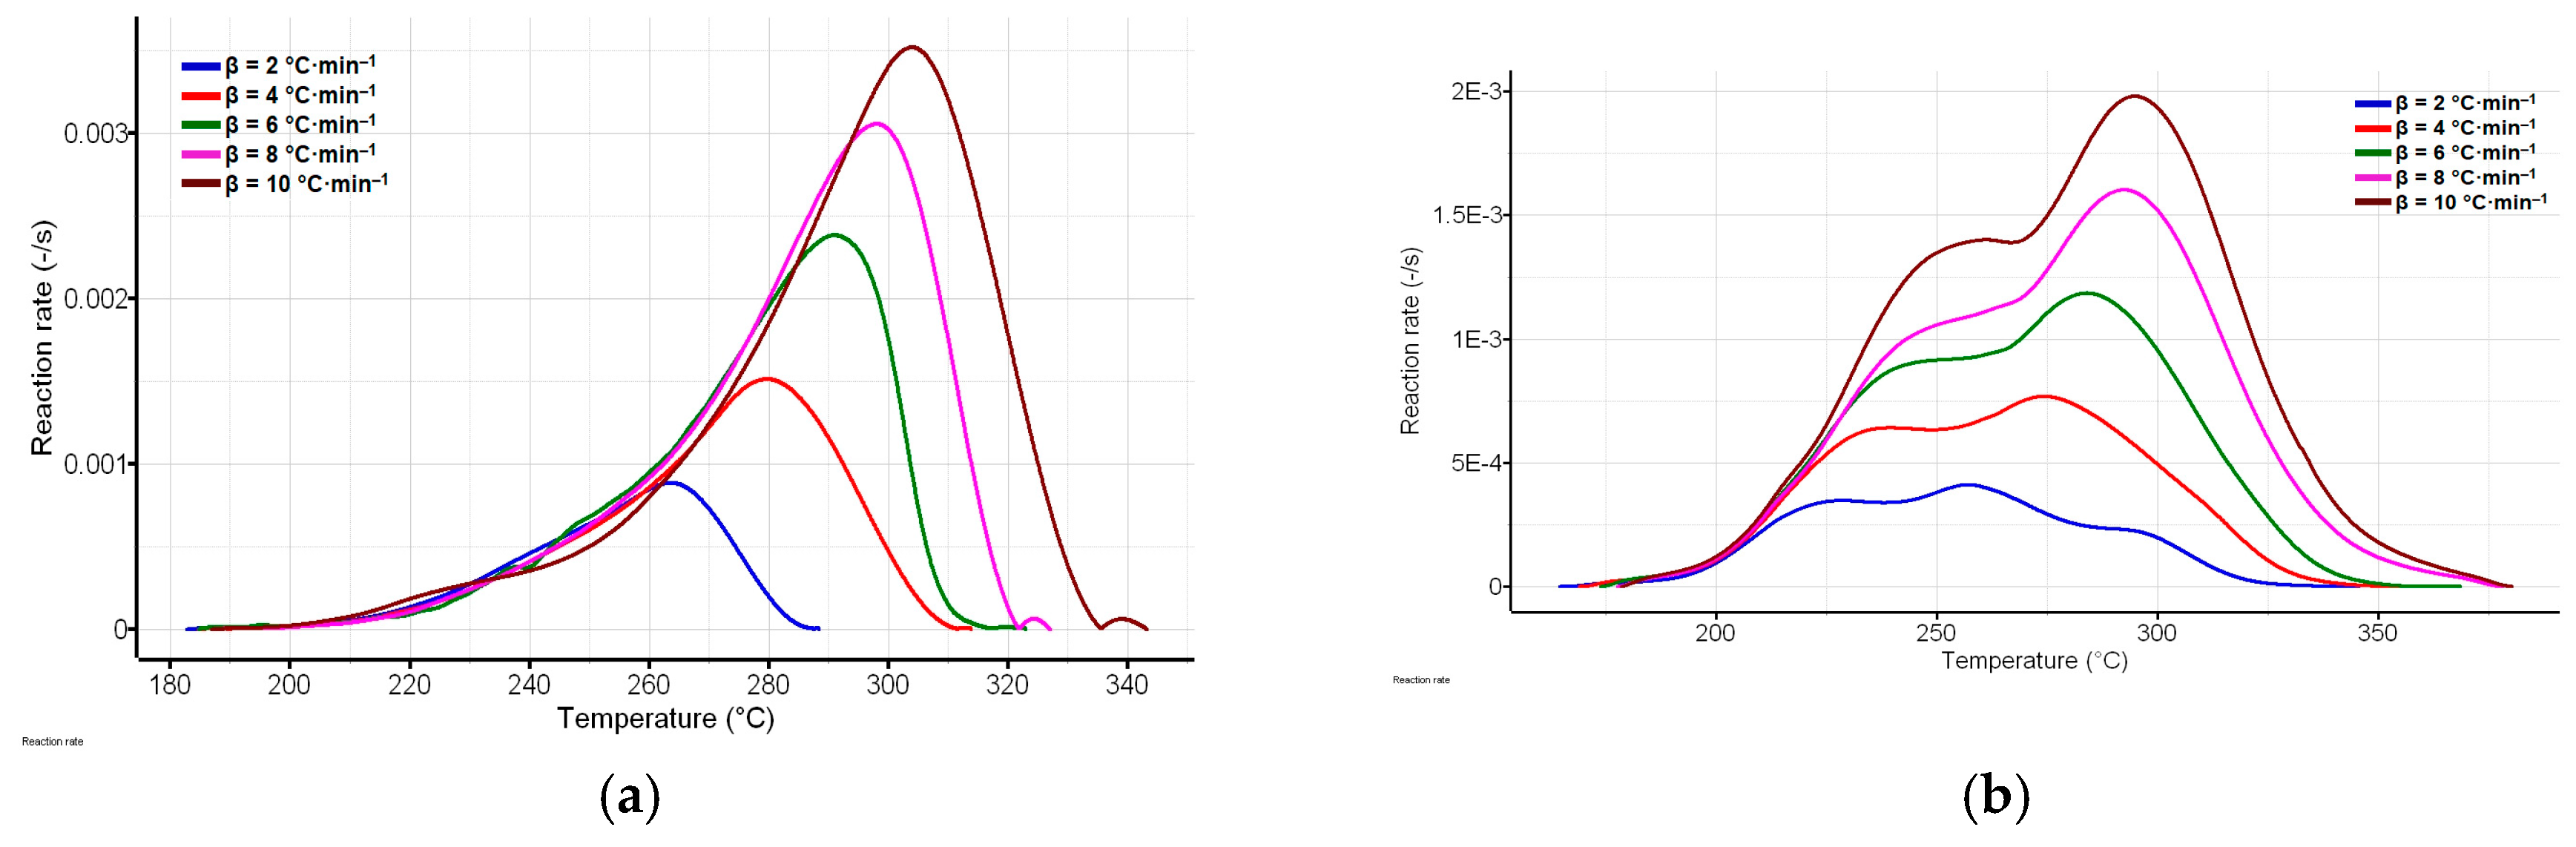
Figure 8.
Linear plotting of FR differential isoconversional method of the analyzed “process 1” of decomposition for: (a) LNG and (b) LNGMIX.
Figure 8.
Linear plotting of FR differential isoconversional method of the analyzed “process 1” of decomposition for: (a) LNG and (b) LNGMIX.
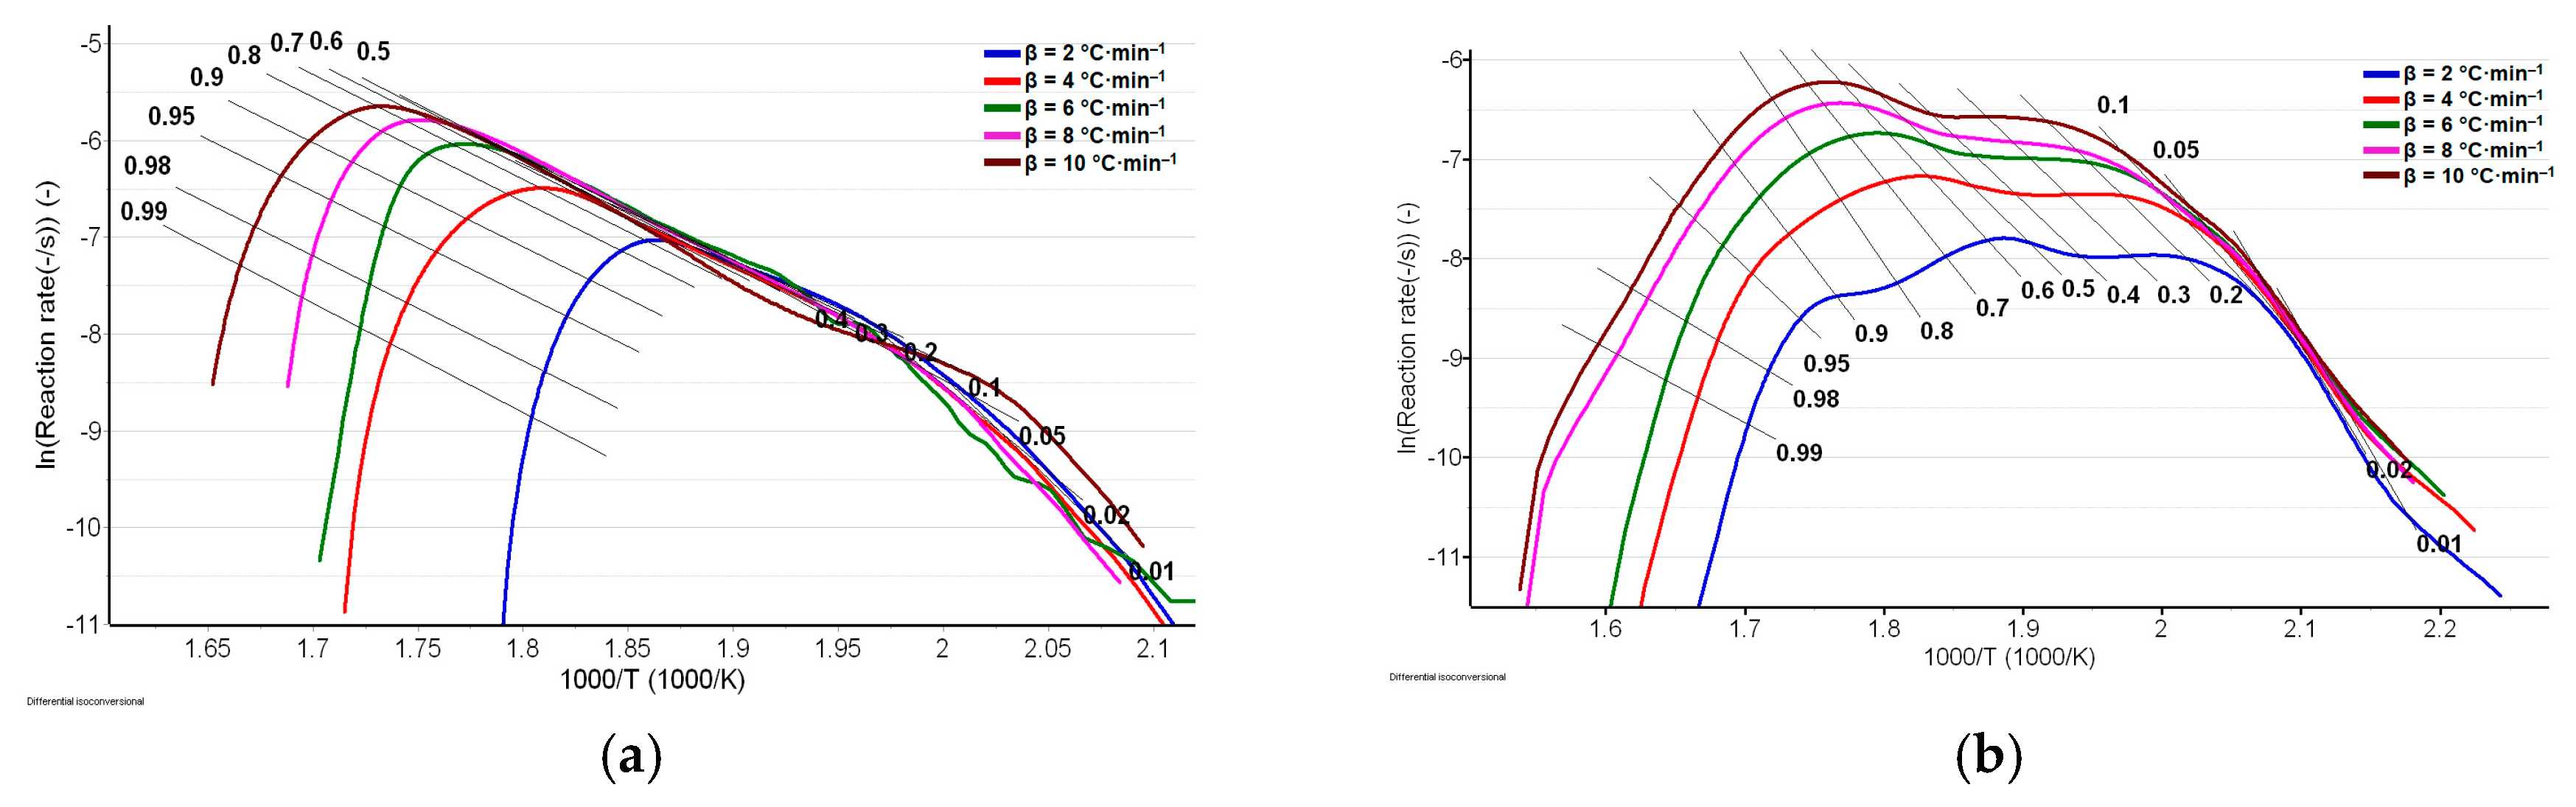
Figure 9.
Linear plot of FWO integral isoconversional method of the analyzed “process 1” of decomposition process for: (a) LNG and (b) LNGMIX.
Figure 9.
Linear plot of FWO integral isoconversional method of the analyzed “process 1” of decomposition process for: (a) LNG and (b) LNGMIX.
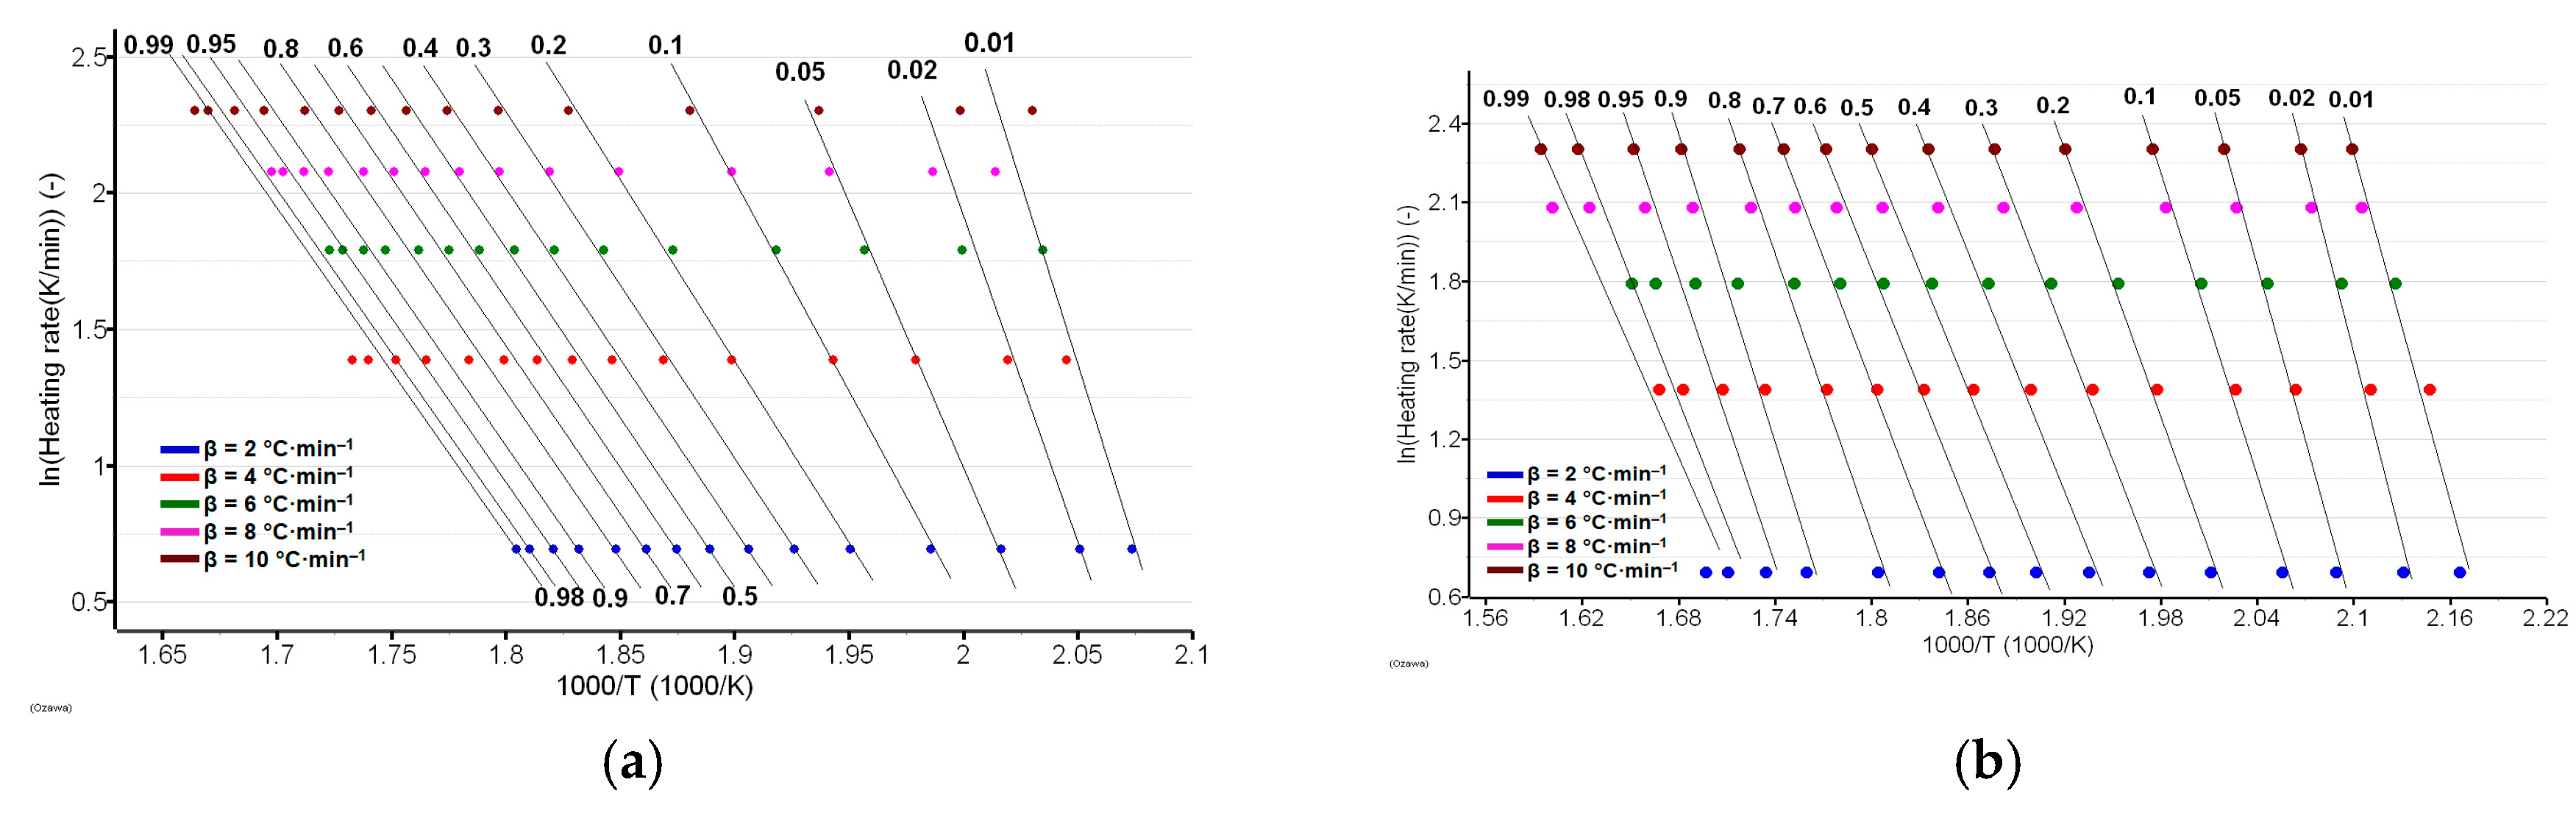
Figure 10.
Variation of Ea vs. α according to FWO and FR isoconversional method of the analyzed decomposition “process 1” for: (a) LNG and (b) LNGMIX.
Figure 10.
Variation of Ea vs. α according to FWO and FR isoconversional method of the analyzed decomposition “process 1” for: (a) LNG and (b) LNGMIX.
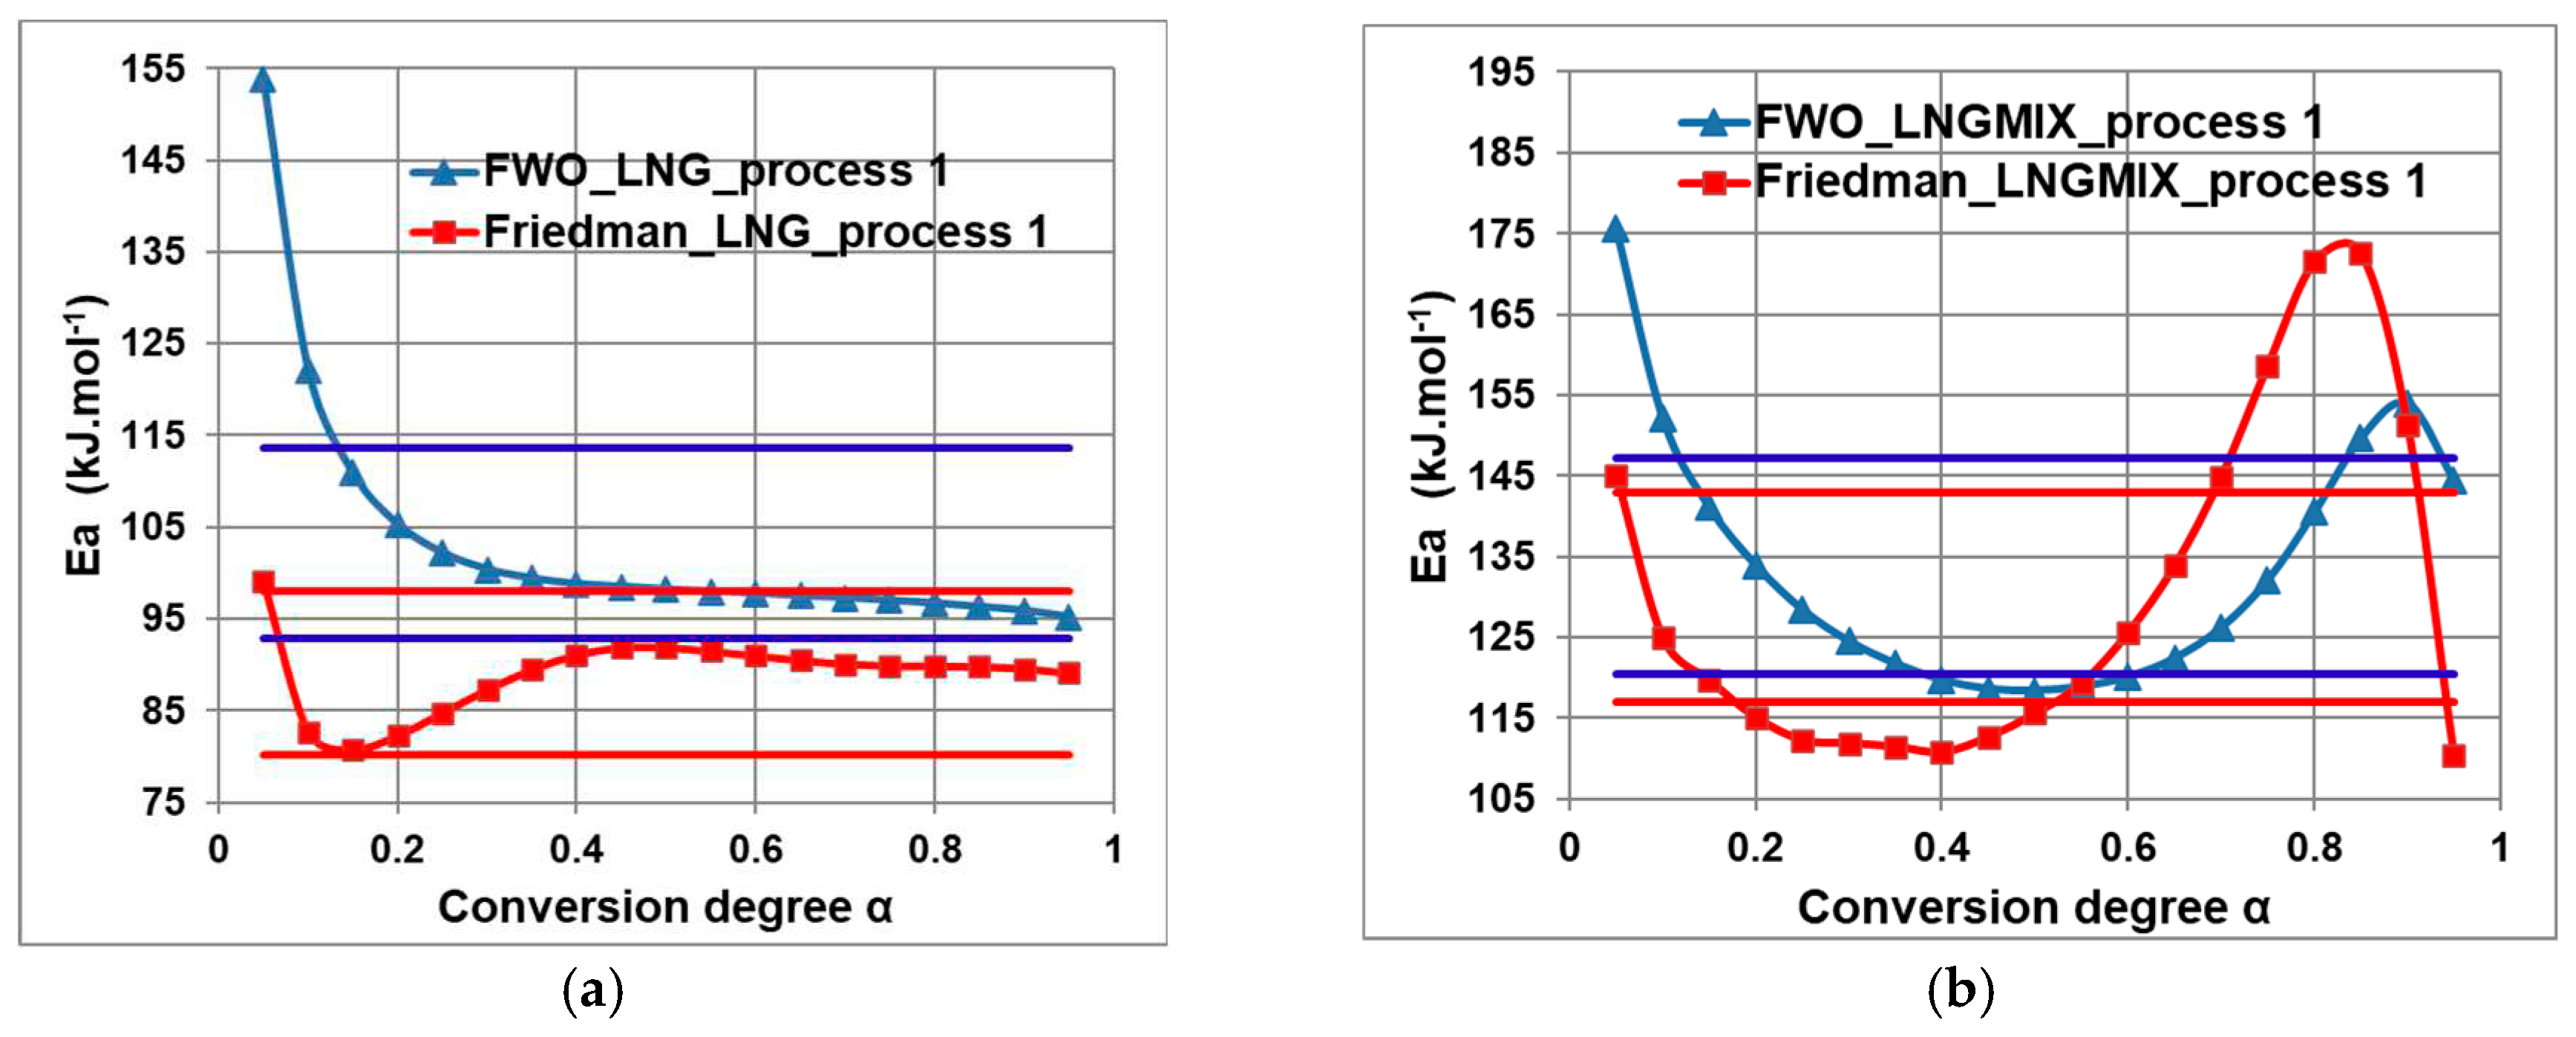
Figure 11.
Variation of Ea vs. α according to FWO and FR isoconversional method of the analyzed decomposition “process 2” for: (a) LNG and (b) LNGMIX.
Figure 11.
Variation of Ea vs. α according to FWO and FR isoconversional method of the analyzed decomposition “process 2” for: (a) LNG and (b) LNGMIX.
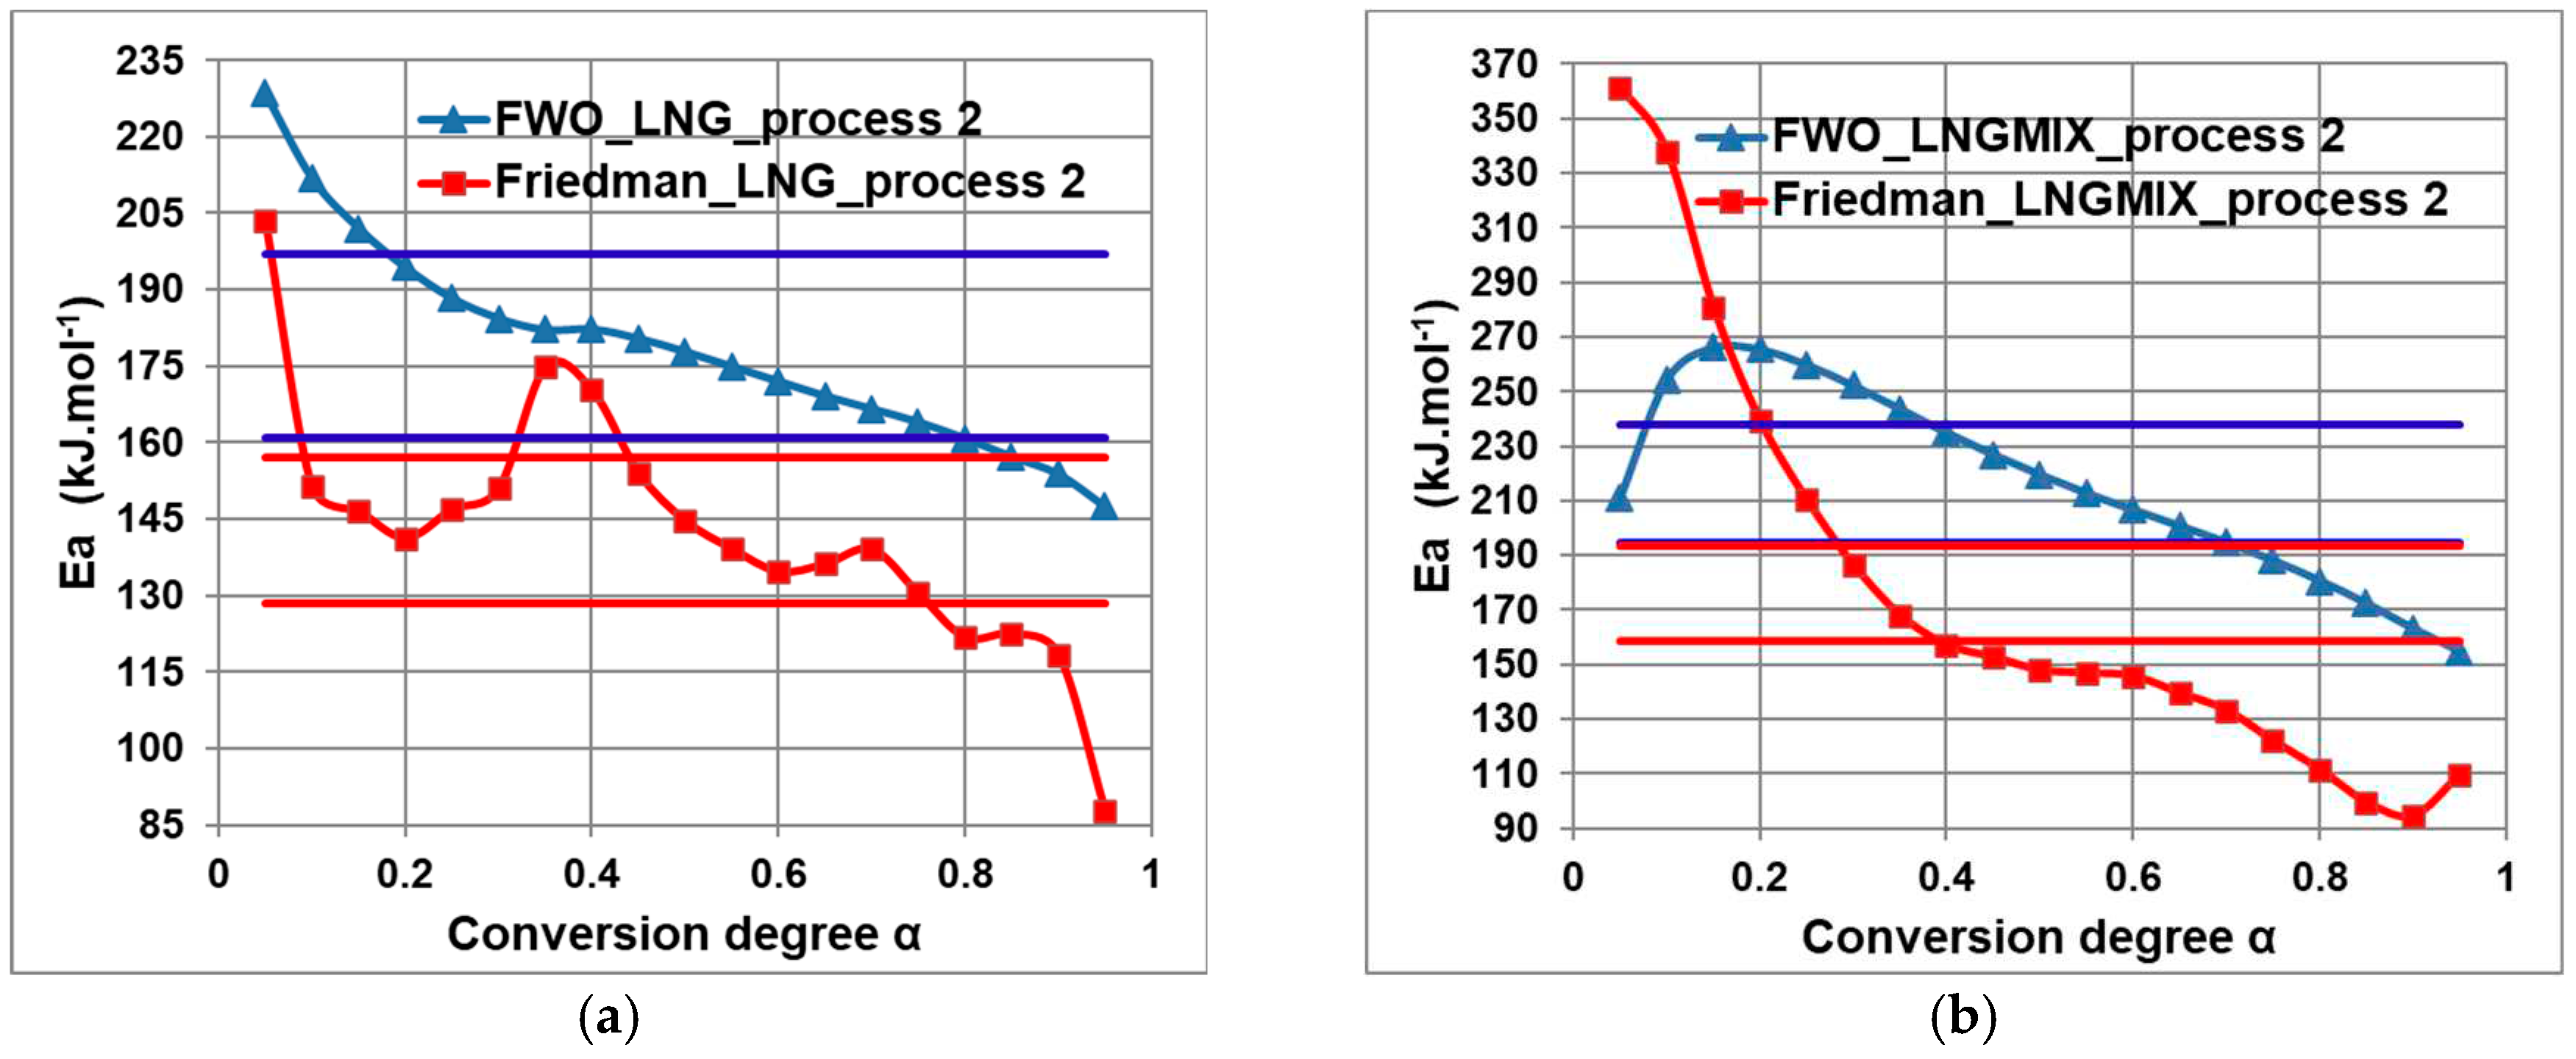

Table 1.
Decomposition steps observed during thermolysis of LNG, LNGTAB, LNGMIX and lactose at β = 10 °C·min–1 in dynamic air flow.
Table 1.
Decomposition steps observed during thermolysis of LNG, LNGTAB, LNGMIX and lactose at β = 10 °C·min–1 in dynamic air flow.
| Sample | Decomposition step | Ti (°C) |
Tf (°C) |
Tmax DTG (°C) |
Tpeak DSC (°C) |
Δm (%) |
|---|---|---|---|---|---|---|
| LNG | I | 192 | 355 | 306 | 243 | 28.3 |
| II | 355 | 483 | 433; 443 | 41.04 | ||
| LNGTAB | I | 50 | 115 | 68 | 1.8 | |
| II | 115 | 165 | 151 | 3.72 | ||
| III | 165 | 267 | 242 | 19.9 | ||
| IV | 267 | 384 | 306 | 45.4 | ||
| LNGMIX | I | 51 | 110 | 71 | 0.48 | |
| II | 110 | 178 | 151 | 1.88 | ||
| III | 178 | 263 | 233; 248 | 13.34 | ||
| IV | 263 | 380 | 297 | 32.61 | ||
| V | 380 | 466 | 418; 427 | 17.17 | ||
|
Lactose monohydrate |
I | 100 | 171 | 146 | 4.99 | |
| II | 218 | 264 | 236 | 8.7 | ||
| III | 264 | 391 | 306 | 60.6 |
Table 2.
DTG temperature interval for “process 1” (°C) for kinetic analysis of both LNG and LNGTAB at selected heating rates.
Table 2.
DTG temperature interval for “process 1” (°C) for kinetic analysis of both LNG and LNGTAB at selected heating rates.
| β (°C·min–1) |
DTG temperature interval for “process 1” (°C) for kinetic analysis of samples | |
|---|---|---|
| LNG | LNGMIX | |
| 2 | 182–288 | 164–345 |
| 4 | 184–313 | 169–356 |
| 6 | 184–322 | 173–368 |
| 8 | 187–327 | 177–378 |
| 10 | 192–355 | 178–380 |
Table 3.
Variation of Ea vs. α for both samples LNG and LNGMIX for “process 1” using the FR and FWO isoconversional methods.
Table 3.
Variation of Ea vs. α for both samples LNG and LNGMIX for “process 1” using the FR and FWO isoconversional methods.
| α | Variation of Ea (kJ·mol–1) vs. α for process 1 for | |||
|---|---|---|---|---|
| LNG | LNGMIX | |||
| FR | FWO | FR | FWO | |
| 0.05 | 99.1 | 153.8 | 145.1 | 175.6 |
| 0.1 | 82.7 | 122.1 | 124.9 | 152.1 |
| 0.15 | 80.8 | 110.9 | 119.7 | 141.1 |
| 0.2 | 82.3 | 105.3 | 115.1 | 133.9 |
| 0.25 | 84.8 | 102.2 | 112.3 | 128.4 |
| 0.3 | 87.3 | 100.4 | 111.9 | 124.5 |
| 0.35 | 89.5 | 99.4 | 111.5 | 121.7 |
| 0.4 | 91.1 | 98.8 | 110.8 | 119.7 |
| 0.45 | 91.9 | 98.5 | 112.7 | 118.6 |
| 0.5 | 91.9 | 98.2 | 115.6 | 118.4 |
| 0.55 | 91.5 | 98.0 | 119.3 | 118.9 |
| 0.6 | 91.0 | 97.8 | 125.6 | 120.1 |
| 0.65 | 90.5 | 97.5 | 133.9 | 122.4 |
| 0.7 | 90.1 | 97.3 | 144.9 | 126.2 |
| 0.75 | 89.9 | 97.0 | 158.7 | 132.1 |
| 0.8 | 89.9 | 96.7 | 171.5 | 140.5 |
| 0.85 | 89.8 | 96.3 | 172.6 | 149.7 |
| 0.9 | 89.6 | 95.9 | 151.4 | 154.0 |
| 0.95 | 89.1 | 95.2 | 110.3 | 144.5 |
| Ēa / kJ·mol–1 | 89.1±1.0 | 103.2±3.2 | 129.9±4.8 | 133.8±3.6 |
Disclaimer/Publisher’s Note: The statements, opinions and data contained in all publications are solely those of the individual author(s) and contributor(s) and not of MDPI and/or the editor(s). MDPI and/or the editor(s) disclaim responsibility for any injury to people or property resulting from any ideas, methods, instructions or products referred to in the content. |
© 2023 by the authors. Licensee MDPI, Basel, Switzerland. This article is an open access article distributed under the terms and conditions of the Creative Commons Attribution (CC BY) license (http://creativecommons.org/licenses/by/4.0/).
Copyright: This open access article is published under a Creative Commons CC BY 4.0 license, which permit the free download, distribution, and reuse, provided that the author and preprint are cited in any reuse.


