
Submitted:
21 August 2023
Posted:
22 August 2023
You are already at the latest version
Abstract
This study aimed to identify sociodemographic and health indicators of diet quality in pre-frail community-dwelling older adults. Pre-frail older adults are those at risk of progression to clinical manifestations of frailty and are targets for preventative intervention. We previously reported that pre-frail older adults have reasonably good overall diet quality. However, further analyses found low intake of energy, protein and several micronutrients. Methods: We collected detailed dietary intake from pre-frail (FRAIL scale 1-2) older adults using NZ Intake24, an online version of 24-hour multiple pass dietary recall. Diet quality was ascertained with the Diet Quality Index-International (DQI-I). We used regression Generalised Linear Models to determine predictors of diet quality and Classification and Regression Tree (CART) analysis to examine the complex relationships of predictors and identified profiles of sub-groups of older adults that predict diet quality. Results. The median age in this sample (n=468) was 80.0 years (77.0-84.0). Living with others, high deprivation index and a higher BMI were independent predictors of poorer diet quality. With CART analysis, we found that those with a BMI >29 kg/m2, living with others and younger than 80 years were likely to have a lower diet quality. Conclusions: We found BMI, living arrangement and socioeconomic status were independent predictors of diet quality in pre-frail older adults, with BMI being the most important variable in this sample when the interacting relationships of these variables were considered. Future research is needed to determine the similarities and/or differences in the profile of subgroups of older adults with poorer diet quality.
Keywords:
frailty
; older adults
; diet quality
; sociodemographic
; BMI
1. Introduction
Frailty is a condition of accumulated decline in physiological reserves resulting in weakened homeostatic responses to stressors [1, 2]. The prevalence of physical frailty increases with age with almost half of individuals aged over 50 years old classified as pre-frail and 12-24% as frail [3]. In a New Zealand survey, M āori living in the community had a 10 to 15 years earlier onset of frailty compared to non-Māori [4]. Older adults displaying features of frailty are vulnerable to poor health outcomes like falls and prolonged hospital stays [1]. Pressure is put on the health sector to work against this inequity and reduce the burden of frailty in the community, especially population groups most at risk.
Poor nutrition can influence frailty indicators such as weight loss and exhaustion [1]. A systematic review and meta-analysis of 10 studies (n = 5447 community-dwelling older adults, mean age 77 years) found that one of four malnourished older adults were pre-frail and two of three were frail [5]. Increasingly, studies have also found higher risks of frailty in older adults with obesity and sarcopenic obesity (low muscle mass and function coupled with high fat mass) [6-9]. In the NHANES study, pre-frail older adults had greater central adiposity than their robust counterparts [7]. These findings suggest that even at early stages of frailty progression, or else termed "pre-frailty" [10], both undernutrition and overnutrition may be key risk factors (amongst many others).
Diet quality is a measure of quality, quantity, and variety of the entire diet allowing examination of the association between whole food and health status [11]. Many factors are associated with diet quality in older adults. The complexity of each population group and determinants of diet quality makes it challenging to single out individual factors as collectively, there are many factors involved with varying interactions dependent of specific situations [12]. Sociodemographic and health indicators are associated with diet quality in older adults [13-27]. In frail older adults, the higher presence of mobility and functional limitations and poorer health status may impact access to healthy food, predisposing them to risk of malnutrition [1, 5, 28].
We have previously described the diet quality of pre-frail older adults in New Zealand [29]. We found that pre-frail older adults had nutritional gaps in energy and nutrient deficiencies and a disproportionate consumption of empty calories. Dietary moderation and balance scores averaged below 50% of the maximum score in the diet quality index–international (DQI-I) tool [29]. The nutritional gaps call into question how clinicians and policymakers can influence diet quality in at-risk groups for frailty prevention. This current paper aimed to identify the predictors of diet quality in pre-frail community-dwelling older adults and identify mutually exclusive subgroups in the sample who shared common characteristics that influence diet quality.
2. Materials and Methods
2.1. Study sample
Community-dwelling older adults aged 75+ (or 60 for Māori and Pacific people) were invited through general practices across New Zealand to participate in the Staying UPright and Eating well Research (SUPER) study. Those who were interested were screened for pre-frailty using the self-administered FRAIL questionnaire. Those scoring 1 or 2 out of 5 in the tool (i.e., pre-frailty) were recruited [30]. The lower threshold for Māori and Pacific people was implemented to reflect the inequitable earlier occurrence of disability, poor health and mortality in these population groups compared to the general population in New Zealand [31]. A total of 468 pre-frail older adults were recruited. All study participants provided written informed consent.
The Southern Health and Disability Ethics Committee, Ministry of Health, New Zealand (Ref 14/STH/101/, 13 August 2014) approved this study.
2.2. Data Collection
Dietary intake was recorded on two separate days using a 24-hour multiple pass dietary recall method (24h-MPR) through the online Intake24 platform developed by Newcastle University [32, 33]. The 24h-MPR has showed to be a feasible dietary assessment method to capture detailed dietary intake in older adults. [34] We adapted the Intake24 online platform to be relevant to New Zealand older adults' dietary intake based on the 24h-MPR paper-based version from more than 500 octogenarians. The backend of the Intake24 online platform was updated with the New Zealand FOODfiles database from 2014 to 2016 [35], leading to 158 food codes being retired and 215 updated. Meticulous data checking and coding were completed by qualified nutritionists ensuring the database fit the purpose of the study. A workflow summary is presented in the supplementary material (Figure S1).
Diet quality was ascertained using the Diet Quality Index-International (DQI-I) tool developed by Kim et al., which measures intake according to four categories: variety (20 points), adequacy (40 points), moderation (30 points) and balance (10 points) – that adds up to a maximum score of 100; a higher score indicates a better diet quality [36]. The DQI-I is validated for international comparisons and has been previously utilised effectively in older population groups [29, 37]. Adaptations to the DQI-I for our study was reported previously [29].
Sociodemographic and health information collected using a standardised questionnaire at home interviews included: age, sex, ethnic group, education level, New Zealand Deprivation Index, living arrangement, medical conditions, medications, supplements, alcohol, smoking, vision, hearing, Nottingham Extended Activities of Daily Living (NEADL), Montreal Cognitive Assessment (MoCA), and Geriatric Depression Scale (GDS), and short physical performance battery (SPPB) [30].
Anthropometric information was measured using a Tanita BC-545N scale and Stadiometer. BMI was calculated as weight (kg)/ height (m2). Waist circumference was measured with a non-stretchable tape taken at the natural narrowing midway between the last rib and the crest of the ilium.
Further data collection details are recorded in the study protocol [30].
2.3. Statistical tests
2.3.1. Descriptive data
Quantitative data are presented as median (interquartile range (IQR)) or mean (standard deviation (SD)) depending on data distribution, and categorical data are presented as count (percentage).
2.3.2. Regression and Tree Analysis
Univariate analysis was conducted between DQI-I scores, sociodemographic and health variables using generalised linear models (GLM). All independent variables except BMI, waist circumference, NEADL, and SPPB were categorical. Variables with a p-value less than 0.2 were systematically included in the regression model by groups (i.e., sociodemographic, lifestyle, sensory, body composition, physical function, and health status) to construct parsimonious models. Multivariate analysis was conducted to determine the effect of sociodemographic and health variables on diet quality. Further analyses were conducted on DQI-I subcomponents, i.e., diet variety, adequacy, moderation, and overall balance.
Classification and Regression tree (CART) analysis is a machine learning technique that helps make predictions by breaking down complex interactions of multiple variables to produce mutually exclusive and exhaustive subgroups of population that share common characteristics that predict the outcome of interest [38]. We used CART to identify mutually exclusive sub-groups within our sample through partitioning groups based on the interaction between demographic and health characteristics that best describe diet quality. The minimum number of cases for child nodes was set to five (1% of the total sample) [38], and the maximum number of tree depths was 5. Cross-validation was used to improve confidence in the final trees (k=10). Separate trees were created for low-energy reporters (LER = total energy intake/basal metabolic rate ≤ 0.92) and plausible reporters due to the strong relationship between low-energy reporting and DQI-I [29]. We then compared the results obtained from CART to the GLM regression models.
Statistical significance was set at p < 0.05. All statistical tests in this paper were conducted using IBM SPSS Statistics for Macintosh, version 27 (IBM Corp., Armonk, NY, USA).
3. Results
3.1. Sample descriptives
Of the sample of 468 participants, three had missing dietary assessments due to technical difficulties. Median age was 80.0 years (77.0-84.0), 59% were female and a majority were of European descent (Table 1).
3.2. Associations: Generalised Linear Models
3.2.1. Univariate analysis
In univariate analysis, living alone, low deprivation and lower BMI were significantly associated with higher (better) overall DQI-I score (p< 0.05) (Table A1). More specifically, those living alone had a higher score for moderation of food/nutrient intake that may require restriction, e.g., saturated fat and sodium; lower BMI was associated with higher scores in variety and adequacy, and better socioeconomic status was associated with higher adequacy scores.
3.2.2. Multivariate analysis
Multivariate analyses show those living with others (p=0.042), lower socioeconomic status (p=0.024), and a higher BMI p=0.026) were associated with poorer diet quality (lower DQI-I scores) (Table 2). Living with others and having a higher BMI were associated with lower diet variety scores. Lower socioeconomic status and higher BMI were associated with lower adequacy scores. It was interesting to observe that impaired cognitive function and regular alcohol consumption were inversely associated with overall balance in dietary score (Table 2).
In sensitivity analyses completed among LER, we found no associations between demographic and health variables with DQI-I. In further analyses, we observed various variables associated with adequacy, moderation, and balance. Participants living in medium-deprived areas were associated with higher adequacy than those living in highly deprived areas (p = 0.007); the difference was not seen between low and high areas (p = 0.111) (Table S1). For plausible reporters, associations were found for DQI-I and all subcomponents apart from variety. Participants of non-European ethnicity were marginally associated with a lower DQI-I, which is linked to a lower adequacy score (p=0.003). Smokers were associated with lower adequacy (p = 0.027) than non-smokers (Table S2).
3.3. Relationships between variables: Classification and Regression Tree (CART) analysis
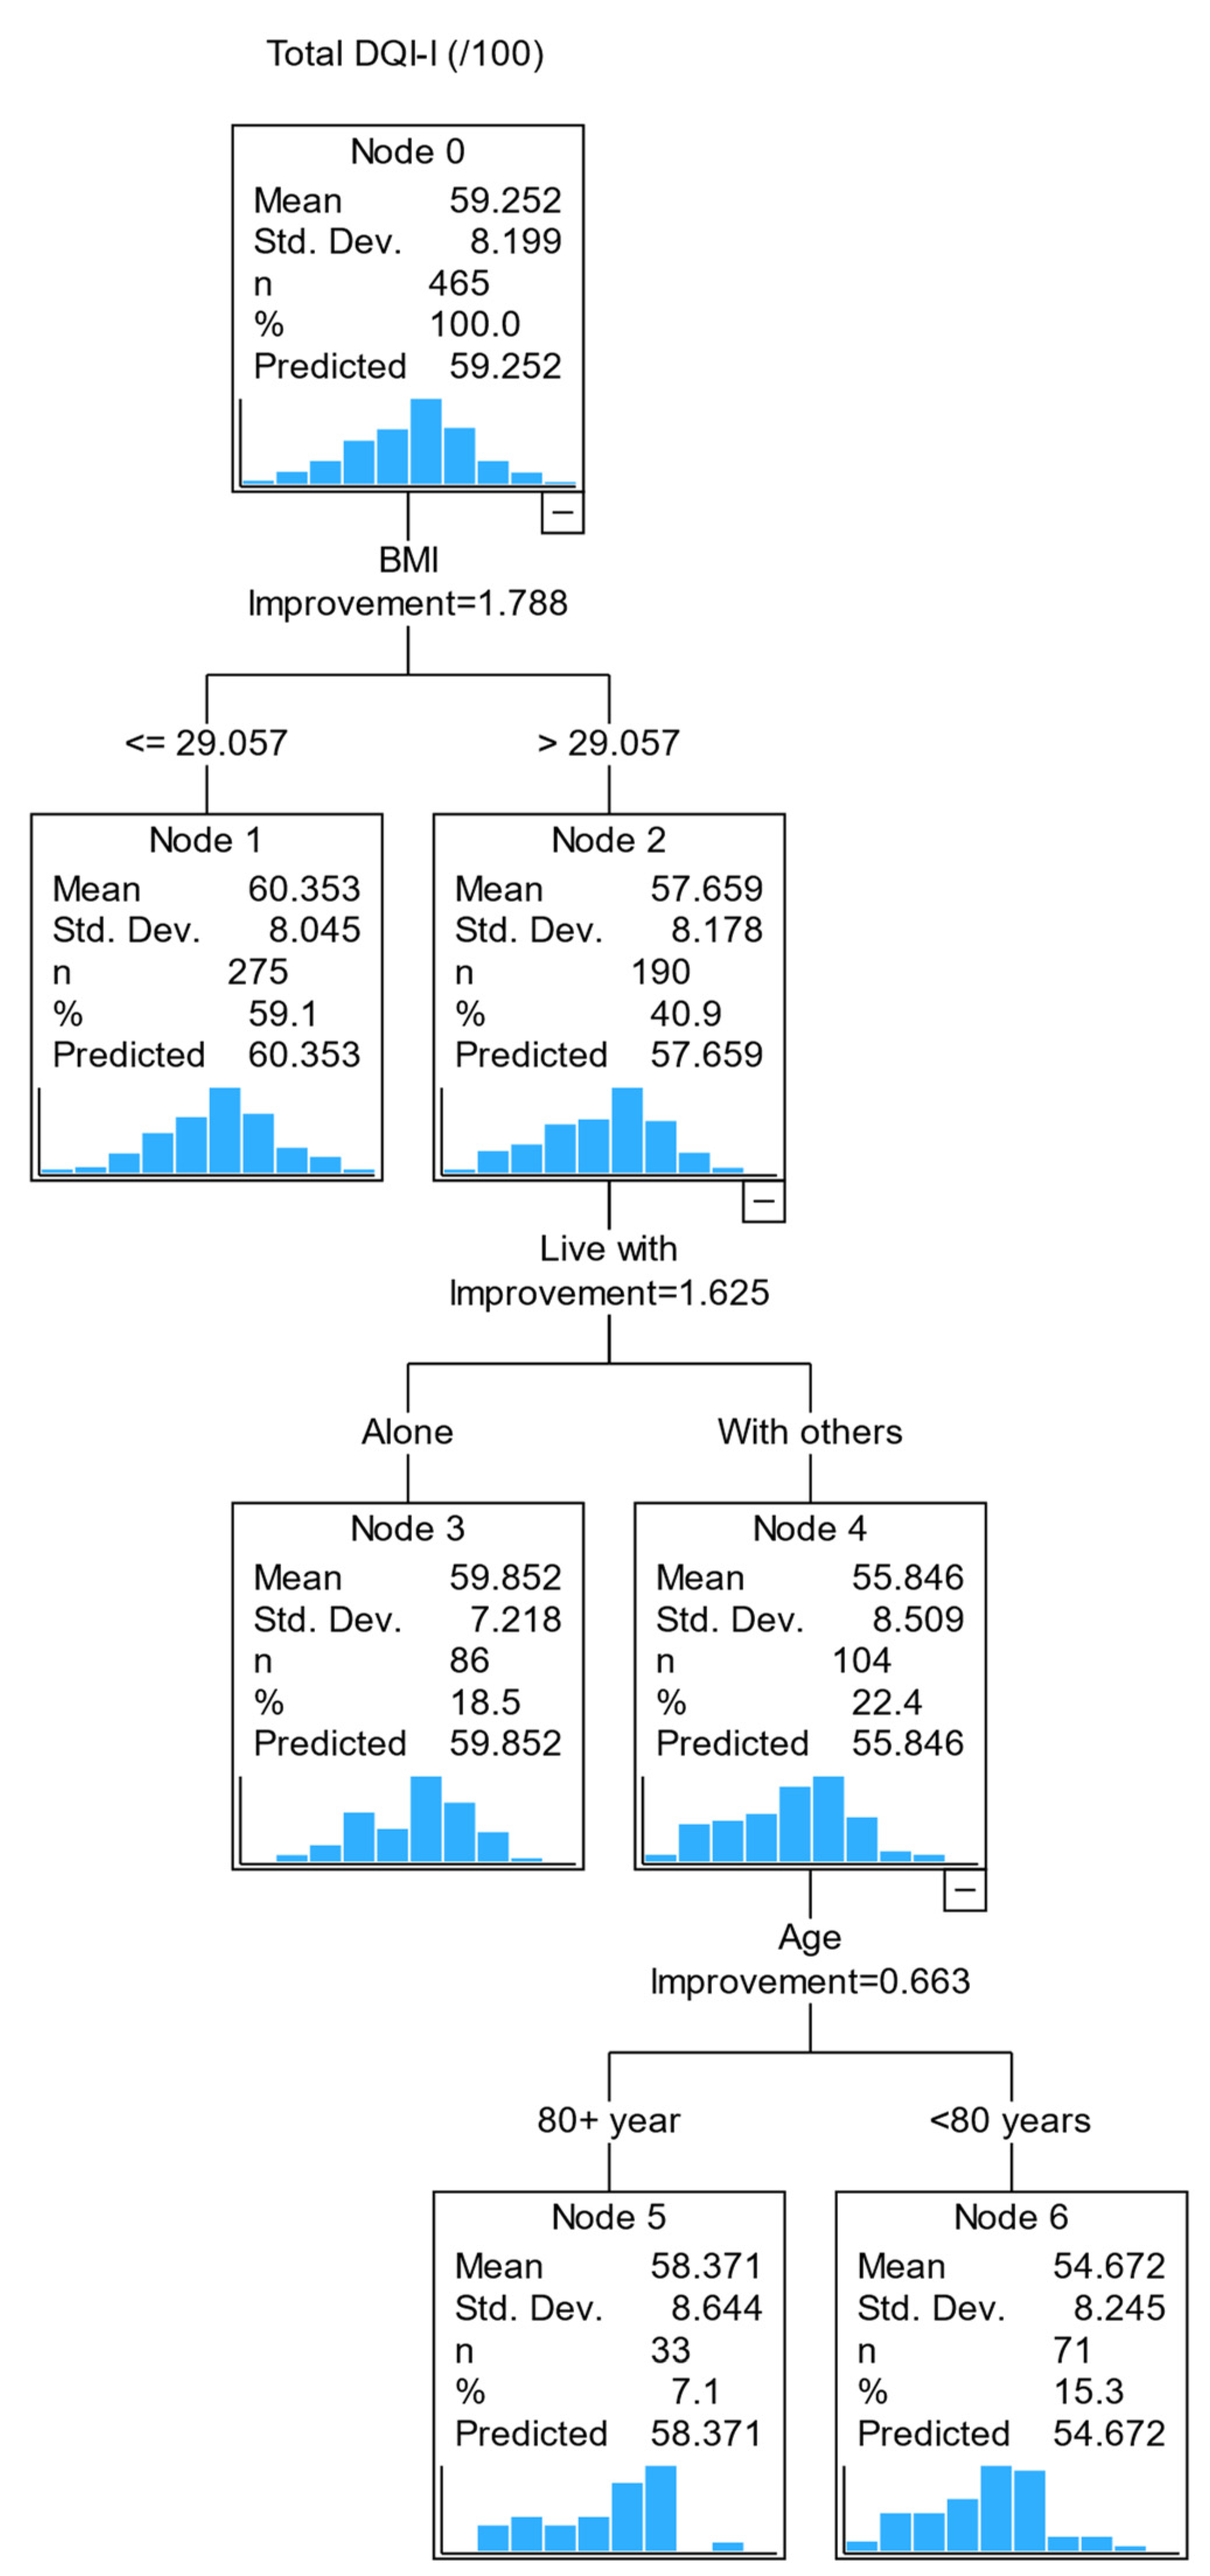
We completed regression tree analysis to identify the profile of subgroups of older adults with poorer diet quality. Four variables had twice the importance values in predicting diet quality: age, BMI, living arrangement and vision. These four variables contribute most to the model's accuracy. However, in the decision tree model below, splitting the sample into mutually exclusive subgroups (Figure 1), only BMI, living arrangement and age were included; due to the small number of participants with vision impairment, vision was excluded from the final tree model to prioritise more stable predictors.
The first decision point is whether an older adult has a BMI above or below 29kg/m2 (i.e., the best-split value from the regression tree analysis). A person with a BMI of >29 kg/m2 was predicted to have a lower diet quality than those with a BMI of ≤29kg/m2. The second decision point was the living arrangement, i.e., living with others or alone. Those with a BMI >29 kg/m2 and living with others had a lower DQI score than those who lived alone with a similar BMI range. The third decision point was age (< 80 and ≥ 80). Those with a BMI >29 kg/m2, living with others and less than 80 years old had a lower diet quality than those age ≥ 80. This model identified that those with a BMI >29 kg/m2 living with others younger than 80 years were likely to have a lower diet quality.
Separate tree diagrams were constructed for DQI-I subcomponents (Figure S1). In each tree diagram, BMI remains a key (first) independent variable for all subcomponents, except for moderation, where sex was a predictor of moderation score (male sex has a lower moderation score). The second independent variable varies across the DQI-I subcomponents: living arrangements for diet variety, medication for adequacy, and NEADL for balance.
When we compared the tree diagrams (CART analysis) to the GLM regression models, we found BMI to be a consistent predictor for the overall DQI-I score and subcomponents adequacy and balance scores; sex was also identified consistently for moderation score in both the GLM model and the CART analysis.
Figure 1.
CART diagram of factors associated with Diet Quality (DQI-I) in pre-frail older adults.
4. Discussion
This paper aims to identify predictors of diet quality in community-dwelling pre-frail older adults and to identify mutually exclusive subgroups in the sample who share common characteristics that influence diet quality. We found that BMI, living arrangement, and socioeconomic status were associated with diet quality. In GLM models, those with low socioeconomic status, living with others and higher BMI were independently associated with poorer diet quality. It is somewhat surprising that living alone was independently associated with better diet quality, contrary to a previous study of octogenarians that living alone was associated with high nutrition risk [39]; in a younger group of adults (mean age 74±12), there was no conclusive evidence on living arrangement and nutrition risk [40]. This is likely to be attributed to the interplay between living arrangement and other factors; for example social networks in the neighbourhood was shown to attenuate the negative association between living alone and daily fruit and vegetable consumption [41].
In the CART analysis, which considered interactions of all variables of interest, we found BMI was the most important predictive factor of diet quality, followed by living arrangement and age. A BMI >29 kg/m2 was the best-split value in predicting diet quality, i.e. those with BMI>29 kg/m2 had a lower diet quality (57.6) than those with BMI≤29kg/m2 (60.4). However, further subgroups were identified based on living arrangements and age. Those who lived alone and ≥80 years old with a similar BMI range had similar diet quality to those with BMI≤29kg/m2. In other words, in this sample, those with BMI>29 kg/m2, living with others and <80 years old were predictive of lower diet quality. Further analysis showed that BMI remains the most important factor in predicting all subcomponents of diet quality except for moderation (i.e., energy intake from dietary fat, cholesterol, sodium, and empty calorie foods), in which the male sex had a lower moderation score than their female counterparts. After BMI, living arrangement was predictive of diet variety; medication was predictive of diet adequacy and NEADL score for the overall balance of macronutrient and fatty acid ratios. Studies have shown eating with others increases food intake [42]. Our study further details the relationship between eating with others and food intake. Interesting, compared to living alone, we observed that those living with others (82% of this group were living with a spouse/partner only) had a lower diet variety score. Two studies reported that some older adults living on their own relished the opportunity to experiment different foods while others felt a sense of release from the constraint of eating food that pleased the preferences of other. [16, 43] These findings might partly explain a higher diet variety score of those living alone in our study. We recommend further research to untangle the interaction of social networks and diet quality in older adults.
Previous studies found diet quality is like to health outcomes. In a longitudinal study of more than 7000 adults with a mean age of 65 years, diet quality was associated inversely with ADL-based disability and depression [44], and the Physicians Health Study found a dose-response relationship between diet quality with pre-frailty and frailty [45]. Enhancing diet quality can be advantageous for older adults. One approach to enhance diet quality in older adults is increasing nutritional literacy (e.g., interpreting food labels), awareness of food choices and knowledge of healthy food swaps.
These tree diagrams enable primary care providers to visualise factors important for dietary quality in pre-frail older adults. Nutrition plays a vital role in physical and mental health. Inadequate nutrition can exacerbate pre-frailty progression to the clinical manifestation of frailty [46]. Early identification of factors important to diet quality may facilitate timely and specific intervention (e.g., education in increasing diet variety and/or specific nutrients, or moderation in empty calories) to optimise physical functionality.
Strengths and limitations
We collected detailed dietary intake from a sample of community-dwelling older adults using the 24-hour multiple-pass dietary recall method. To the best of our knowledge, this is the first paper to explore the sociodemographic, socioeconomic, and health indicators associated with the diet quality of pre-frail older adults.
This study has several limitations, including the nature of data analysis. We cannot draw a cause-effect relationship observed in this study. Influence can go both ways. Longitudinal studies are warranted to identify the directions and effects of determinants [12]. We were restricted to completing a training validation for the CART analysis to increase confidence and reduce the risk of bias in the study findings to allow for some external validation [47]. However, with the current sample size (n=468), k-fold cross-validation is acceptable [38]. A small sample size is prone to prediction errors, including erroneous splits within the tree structures. In our GLM regression models, BMI and living alone were independent predictors of diet quality, agreeing with CART analysis regarding strength and direction of the association.
This sample includes only those pre-frail, as determined using the FRAIL scale. This limit the generalizability of our findings to those who are 'robust' or 'frail'. Also, the FRAIL scale is comprised of five items: fatigue, resistance, ambulation, number of illnesses and unintentional weight loss greater than 5% (12), and it was self-administered, which may be subject to recall bias (medical conditions) or social desirability bias (ambulation, climbing stairs without aid, or physical activity levels). While a more objective measure of frailty phenotype (e.g., Fried phenotype of frailty) is desired, a simple test is desired in a primary care setting where resources are constrained. Similarly, finding the right balance between the availability of resources (e.g., trained clinicians) and the robustness of a tool to detect an outcome of interest need is essential. The FRAIL scale has moderate to good agreement with many published frailty measures, including the Fried phenotype of frailty and Comprehensive Geriatric Assessment (CGA) [48].
The 24h MPR dietary assessment method is subjected to biases, including social desirability, memory, and seasonal variability. However, it minimises participants' burden and employing multiple passes allow detailed information about portion sizes, recipes, and preparation methods. This method was used by the New Zealand Adult National Nutrition Survey [49] and validated in advanced age [34, 50]. The online platform relies on good network coverage and comprehensiveness of the food composition databases.
Future research is needed to identify predictors of diet quality in other settings and beyond pre-frail older adults to determine similarities and/or differences of subgroups of older adults who may benefit from timely and targeted nutrition intervention to improve diet quality.
5. Conclusions
Sociodemographic and health factors are associated with dietary intake in older adults. We found BMI, living arrangement and socioeconomic status were associated with diet quality in pre-frail older adults, and profile of subgroups of sample with poorer diet quality were identified. Findings from this paper add a different dimension of appropriate screening strategies to improve the nutritional status of older adults at risk of frailty.
Supplementary Materials
The following supporting information can be downloaded at the website of this paper posted on Preprints.org, Figure S1: Summary of systems and changes implemented for cleaning Intake24 data, Figure S2: CART diagram of factors associated with DQI-I subcomponents in pre-frail older adults, Figure S3: CART diagram of factors associated with DQI-I and subcomponents in pre-frail older adults for LER only. Figure S4: CART diagram of factors associated with DQI-I and subcomponents in pre-frail older adults for low energy reporter (LER) only. Table S1: Multivariate regression against DQI-I score and subcomponents for Low Energy Reporter (LER) only, Table S2: Multivariate regression against DQI-I score and subcomponents for plausible reporters only. Video S1: title.
Author Contributions
Conceptualisation, RT, ET; methodology, ET, RT; software, MR; validation, ET, MR, RT; formal analysis, ET, DB; investigation, ET, RT; resources, RT; data curation, ET, RT; writing—original draft preparation, ET, RT; writing—review and editing, RT; supervision, RT; project administration, ET, EL; funding acquisition, RT, NK, DLW. All authors have read and agreed to the published version of the manuscript.
Funding
The SUPER study was funded by the Ageing Well Challenge, Ministry of Business Innovation and Employment (UoA Ref: 3710944; UoO Ref 13538). The Health Research Council New Zealand funded the feasibility phase of the SUPER Study. (UoA Ref 3715401; HRC 14/604).
Institutional Review Board Statement
The study was conducted according to the guidelines of the Declaration of Helsinki and approved by the Southern Health and Disability Ethics Committee (Ref 14/STH/101) Ministry of Health New Zealand.
Informed Consent Statement
Informed consent was obtained from all subjects involved in the study.
Data Availability Statement
The data presented in this study are available on request from the corresponding author.
Acknowledgments
We acknowledge the contribution from the SUPER study participants, the study site coordinators, and interviewers/assessors. We acknowledge the local Primary Healthcare Organizations (East Health Trust, Manaia Health, Western Bay of Plenty, and Well South) for enabling recruitment through general practices, and Dr. Anna Rolleston facilitating recruitment from the Centre of Health. We also acknowledge Eruera Maxted (Lakes District Health Board) for supporting the dietary assessment during the pilot study phase. Margaret Dando from Age Concern Otago for providing training to the SAYGO facilitators, Older Persons’ Health Canterbury District Health Board for providing training to the Senior Chef facilitators, and the local stakeholders (Anglican Care Whangarei, Howick Communicare, Regent Community Trust 4Cs, Senior Citizens Whangarei, local Age Concern) for being instrumental in delivery of the programme.
Conflicts of Interest
The authors declare no conflict of interest. The funders had no role in the design of the study; in the collection, analyses, or interpretation of data; in the writing of the manuscript, or in the decision to publish the results.
Appendix A

Table A1.
Univariate characteristics associated with DQI-I and subcomponents. .
| Demographic and health variables | DQI-I | Variety | Adequacy | Moderation | Balance | ||||||||||
|---|---|---|---|---|---|---|---|---|---|---|---|---|---|---|---|
| B | Std. error | p-value | B | Std. error | p-value | B | Std. error | p-value | B | Std. error | p-value | B | Std. error | p-value | |
| Age, (<80 years; reference: 80+ years) | -1.474 | 0.7572 | 0.052 | -0.247 | 0.3085 | 0.423 | -0.426 | 0.4101 | 0.299 | -0.622 | 0.3931 | 0.114 | -0.178 | 0.1395 | 0.202 |
| Sex (male; reference: female) | -0.776 | 0.7718 | 0.314 | 0.375 | 0.3132 | 0.231 | 0.083 | 0.4173 | 0.843 | -1.394 | 0.3953 | <0.001 | 0.159 | 0.1418 | 0.261 |
| Ethnic group (European; reference: non-European) | 2.260 | 1.2934 | 0.081 | 0.458 | 0.5264 | 0.384 | 1.381 | 0.6979 | 0.048 | 0.117 | 0.6727 | 0.862 | 0.305 | 0.2381 | 0.200 |
| Education level (primary; reference: tertiary) | 0.041 | 2.2660 | 0.985 | -0.108 | 0.9196 | 0.907 | -1.280 | 1.2224 | 0.295 | 1.201 | 1.1728 | 0.306 | 0.227 | 0.4164 | 0.585 |
| (Secondary; reference: tertiary) | -0.079 | 0.7784 | 0.919 | -0.225 | 0.3159 | 0.477 | -0.205 | 0.4199 | 0.625 | 0.365 | 0.4029 | 0.365 | -0.014 | 0.1430 | 0.924 |
| Live with (alone; reference: others) | 1.578 | 0.7619 | 0.038 | 0.356 | 0.3103 | 0.251 | 0.341 | 0.4131 | 0.409 | 0.999 | 0.3941 | 0.011 | -0.118 | 0.1406 | 0.399 |
| Deprivation (reference: high) Low | 1.959 | 0.9405 | 0.037 | 0.604 | 0.3827 | 0.114 | 1.137 | 0.5072 | 0.025 | -0.082 | 0.4900 | 0.867 | 0.300 | 0.1731 | 0.083 |
| Medium | 1.621 | 0.9595 | 0.091 | 0.474 | 0.3904 | 0.225 | 1.112 | 0.5174 | 0.032 | -0.244 | 0.4998 | 0.626 | 0.279 | 0.1766 | 0.115 |
| Medical conditions (1; reference: 2+) | 0.120 | 0.8882 | 0.892 | -0.004 | 0.3606 | 0.992 | -0.244 | 0.4796 | 0.611 | 0.129 | 0.4604 | 0.779 | 0.238 | 0.1629 | 0.143 |
| Vision (impaired; reference: non impaired) | -0.569 | 1.5001 | 0.705 | -0.546 | 0.6086 | 0.370 | 0.513 | 0.8100 | 0.527 | -0.108 | 0.7778 | 0.890 | -0.428 | 0.2751 | 0.120 |
| Hearing (impaired; reference: non impaired) | 1.966 | 1.4367 | 0.171 | -0.008 | 0.5845 | 0.989 | 1.046 | 0.7760 | 0.178 | 0.950 | 0.7450 | 0.202 | -0.022 | 0.2646 | 0.934 |
| BMI, kg/m2 | -0.194 | 0.0769 | 0.012 | -0.062 | 0.0312 | 0.047 | -0.093 | 0.0416 | 0.025 | -0.023 | 0.0401 | 0.574 | -0.016 | 0.0141 | 0.258 |
| Waist circumference, cm | -0.055 | 0.0298 | 0.064 | -0.009 | 0.0121 | 0.461 | -0.022 | 0.0160 | 0.165 | -0.022 | 0.0155 | 0.150 | -0.002 | 0.0055 | 0.753 |
| Medications (1; reference: 2+) | -1.160 | 1.2710 | 0.361 | 0.403 | 0.5162 | 0.435 | -1.236 | 0.6847 | 0.071 | -0.248 | 0.6594 | 0.707 | -0.079 | 0.2338 | 0.735 |
| Supplements (0; reference: 1+) | -0.133 | 0.7653 | 0.862 | -0.274 | 0.3105 | 0.377 | -0.278 | 0.4132 | 0.501 | 0.106 | 0.3968 | 0.790 | 0.314 | 0.1399 | 0.025 |
| Alcohol consumption (never; reference: regular) | -0.369 | 1.0012 | 0.713 | -0.806 | 0.4055 | 0.047 | -0.311 | 0.5409 | 0.565 | 0.428 | 0.5192 | 0.410 | 0.321 | 0.1835 | 0.081 |
| (Occasional; reference: regular) | 0.806 | 0.8704 | 0.355 | -0.289 | 0.3525 | 0.412 | 0.316 | 0.4702 | 0.501 | 0.501 | 0.4514 | 0.267 | 0.278 | 0.1596 | 0.082 |
| Smoking (non-smoker; reference: smoker) | 4.936 | 3.6754 | 0.179 | 2.202 | 1.4917 | 0.140 | 3.936 | 1.9806 | 0.047 | -2.404 | 1.9059 | 0.207 | 1.202 | 0.6746 | 0.075 |
| NEADL score | 0.219 | 0.1662 | 0.188 | 0.052 | 0.0676 | 0.444 | 0.143 | 0.0897 | 0.112 | 0.042 | 0.0863 | 0.623 | -0.018 | 0.0306 | 0.562 |
| SPPB score | 0.187 | 0.1785 | 0.295 | 0.172 | 0.0721 | 0.017 | 0.123 | 0.0963 | 0.202 | -0.099 | 0.0925 | 0.286 | -0.009 | 0.0328 | 0.781 |
| MoCA score (not impaired; reference: impaired) | -0.507 | 0.9252 | 0.583 | -0.307 | 0.3752 | 0.414 | -0.413 | 0.4986 | 0.408 | 0.700 | 0.4779 | 0.143 | -0.488 | 0.1686 | 0.004 |
| GDS score (no depression; reference: depression) | -0.228 | 1.0013 | 0.820 | -0.124 | 0.4065 | 0.760 | 0.028 | 0.5409 | 0.959 | -0.313 | 0.5190 | 0.546 | 0.181 | 0.1839 | 0.324 |
Italicised p-values are significant at the 0.05 level.
Table A2.
Univariate characteristics associated with DQI-I and subcomponents for LER only. .
| Demographic and health variables | DQI-I | Variety | Adequacy | Moderation | Balance | ||||||||||
|---|---|---|---|---|---|---|---|---|---|---|---|---|---|---|---|
| B | Std. error | p-value | B | Std. error | p-value | B | Std. error | p-value | B | Std. error | p-value | B | Std. error | p-value | |
| Age, (<80 years; reference: 80+ years) | -1.838 | 1.3889 | 0.186 | -0.344 | 0.5442 | 0.527 | -0.754 | 0.7696 | 0.327 | -0.600 | 0.6749 | 0.374 | -1.404 | 2.4930 | 0.573 |
| Sex (male; reference: female) | -0.732 | 1.4186 | 0.606 | -0.112 | 0.5537 | 0.840 | 0.697 | 0.7826 | 0.373 | -1.763 | 0.6726 | 0.009 | 4.461 | 2.5103 | 0.076 |
| Ethnic group (European; reference: non-European) | -0.733 | 2.4075 | 0.761 | 0.019 | 0.9393 | 0.983 | 0.098 | 1.3309 | 0.941 | -1.502 | 1.1601 | 0.195 | 6.520 | 4.2694 | 0.127 |
| Education level (primary; reference: tertiary) | 0.734 | 4.4166 | 0.868 | 1.427 | 1.7175 | 0.406 | 0.094 | 2.4257 | 0.969 | 0.542 | 2.1298 | 0.799 | -13.295 | 7.8215 | 0.089 |
| (Secondary; reference: tertiary) | -0.736 | 1.4238 | 0.605 | -0.325 | 0.5537 | 0.557 | -1.146 | 0.7820 | 0.143 | 0.896 | 0.6866 | 0.192 | -1.615 | 2.5214 | 0.522 |
| Live with (alone; reference: others) | 2.731 | 1.4060 | 0.052 | 1.038 | 0.5488 | 0.058 | 1.034 | 0.7822 | 0.186 | 0.956 | 0.6851 | 0.163 | -2.985 | 2.5313 | 0.238 |
| Deprivation (low; reference: high) | 2.422 | 1.7735 | 0.172 | 0.049 | 0.6975 | 0.943 | 1.910 | 0.9638 | 0.047 | 0.030 | 0.8638 | 0.972 | 4.318 | 3.1674 | 0.173 |
| (Medium; reference: high) | 2.507 | 1.7245 | 0.146 | 0.106 | 0.6782 | 0.876 | 2.570 | 0.9372 | 0.006 | -0.630 | 0.8400 | 0.453 | 4.612 | 3.0799 | 0.134 |
| Medical conditions (1; reference: 2+) | -1.263 | 1.5795 | 0.424 | -0.183 | 0.6172 | 0.767 | -0.657 | 0.8731 | 0.452 | -0.709 | 0.7646 | 0.354 | 2.858 | 2.8181 | 0.311 |
| Vision (impaired; reference: non impaired) | -4.390 | 2.7860 | 0.115 | -1.730 | 1.0865 | 0.111 | -0.623 | 1.5515 | 0.688 | -1.651 | 1.3539 | 0.223 | -3.856 | 5.0079 | 0.441 |
| Hearing (impaired; reference: non impaired) | 1.092 | 2.4885 | 0.661 | -0.430 | 0.9706 | 0.658 | 0.514 | 1.3755 | 0.709 | 1.280 | 1.2017 | 0.287 | -2.720 | 4.4429 | 0.540 |
| BMI, kg/m2 | -0.001 | 0.1381 | 0.994 | 0.066 | 0.0535 | 0.220 | 0.125 | 0.0757 | 0.098 | -0.153 | 0.0657 | 0.020 | -0.388 | 0.2447 | 0.113 |
| Waist circumference, cm | 0.046 | 0.0558 | 0.406 | 0.028 | 0.0217 | 0.199 | 0.082 | 0.0298 | 0.006 | -0.059 | 0.0268 | 0.029 | -0.050 | 0.1007 | 0.618 |
| Medications (1; reference: 2+) | -2.636 | 2.0071 | 0.189 | 0.090 | 0.7873 | 0.909 | -1.769 | 1.1062 | 0.110 | -0.823 | 0.9755 | 0.399 | -1.339 | 3.6044 | 0.710 |
| Supplements (0; reference: 1+) | -0.095 | 1.4198 | 0.947 | -0.367 | 0.5530 | 0.507 | -0.393 | 0.7840 | 0.616 | 0.121 | 0.6877 | 0.860 | 5.436 | 2.4976 | 0.030 |
| Alcohol consumption (never; reference: regular) | -2.726 | 1.8244 | 0.135 | -0.643 | 0.7194 | 0.371 | -1.759 | 1.0080 | 0.081 | 0.045 | 0.8956 | 0.960 | -3.688 | 3.2937 | 0.263 |
| (Occasional; reference: regular) | 1.112 | 1.5913 | 0.485 | 0.185 | 0.6275 | 0.768 | 0.318 | 0.8793 | 0.718 | 0.614 | 0.7812 | 0.432 | -0.049 | 2.8729 | 0.986 |
| Smoking (non-smoker; reference: smoker) | 5.788 | 8.5987 | 0.501 | 1.192 | 3.3576 | 0.723 | 5.772 | 4.7360 | 0.223 | -0.797 | 4.1710 | 0.849 | -3.793 | 15.3810 | 0.805 |
| NEADL score | 0.057 | 0.2766 | 0.836 | 0.009 | 0.1079 | 0.935 | 0.006 | 0.1529 | 0.969 | 0.063 | 0.1339 | 0.638 | -0.207 | 0.4940 | 0.676 |
| SPPB score | -0.080 | 0.3031 | 0.791 | 0.049 | 0.1182 | 0.681 | -0.035 | 0.1675 | 0.836 | -0.112 | 0.1466 | 0.444 | 0.179 | 0.5414 | 0.740 |
| MoCA score (not impaired; reference: impaired) | 1.281 | 1.7996 | 0.477 | 0.604 | 0.6973 | 0.386 | 0.868 | 0.9930 | 0.382 | 0.050 | 0.8717 | 0.954 | -2.413 | 3.2173 | 0.453 |
| GDS score (no depression; reference: depression) | 0.079 | 1.8228 | 0.965 | 0.909 | 0.7071 | 0.199 | -0.094 | 1.0073 | 0.926 | -0.783 | 0.8807 | 0.374 | 0.474 | 3.2561 | 0.884 |
Italicised p-values are significant at the 0.05 level.
Table A3.
Univariate characteristics associated with DQI-I and subcomponents for Plausible reporters only. .
Table A3.
Univariate characteristics associated with DQI-I and subcomponents for Plausible reporters only. .
| Demographic and health variables | DQI-I | Variety | Adequacy | Moderation | Balance | ||||||||||
|---|---|---|---|---|---|---|---|---|---|---|---|---|---|---|---|
| B | Std. error | p-value | B | Std. error | p-value | B | Std. error | p-value | B | Std. error | p-value | B | Std. error | p-value | |
| Age, (<80 years; reference: 80+ years) | -1.252 | 0.8823 | 0.156 | -0.108 | 0.3431 | 0.753 | -0.157 | 0.4212 | 0.709 | -0.761 | 0.4480 | 0.090 | -2.258 | 1.6636 | 0.175 |
| Sex (male; reference: female) | -0.730 | 0.8991 | 0.417 | 0.603 | 0.3472 | 0.083 | -0.188 | 0.4282 | 0.661 | -1.190 | 0.4527 | 0.009 | 0.450 | 1.6962 | 0.791 |
| Ethnic group (European; reference: non-European) | 3.720 | 1.4864 | 0.012 | 0.680 | 0.5807 | 0.242 | 2.026 | 0.7053 | 0.004 | 0.864 | 0.7618 | 0.257 | 1.508 | 2.8284 | 0.594 |
| Education level (primary; reference: tertiary) | -0.399 | 2.5654 | 0.876 | -0.879 | 0.9930 | 0.376 | -2.029 | 1.2146 | 0.095 | 1.627 | 1.3014 | 0.211 | 8.825 | 4.8104 | 0.067 |
| (Secondary; reference: tertiary) | 0.228 | 0.9074 | 0.802 | -0.238 | 0.3512 | 0.499 | 0.190 | 0.4296 | 0.659 | 0.192 | 0.4603 | 0.676 | 0.836 | 1.7014 | 0.623 |
| Live with (alone; reference: others) | 0.805 | 0.8860 | 0.363 | -0.106 | 0.3439 | 0.757 | -0.237 | 0.4221 | 0.574 | 1.182 | 0.4461 | 0.008 | -0.335 | 1.6721 | 0.841 |
| Deprivation (low; reference: high) | 1.705 | 1.0818 | 0.115 | 0.750 | 0.4183 | 0.073 | 0.658 | 0.5155 | 0.202 | 0.020 | 0.5522 | 0.970 | 2.769 | 2.0418 | 0.175 |
| (Medium; reference: high) | 1.378 | 1.1286 | 0.222 | 0.821 | 0.4363 | 0.060 | 0.630 | 0.5378 | 0.241 | -0.238 | 0.5760 | 0.680 | 1.646 | 2.1300 | 0.440 |
| Medical conditions (1; reference: 2+) | 1.014 | 1.0485 | 0.333 | 0.256 | 0.4068 | 0.529 | 0.208 | 0.4997 | 0.677 | 0.369 | 0.5336 | 0.489 | 1.815 | 1.9767 | 0.359 |
| Vision (impaired; reference: non impaired) | 1.257 | 1.7273 | 0.467 | 0.031 | 0.6702 | 0.963 | 1.107 | 0.8205 | 0.177 | 0.562 | 0.8785 | 0.523 | -4.422 | 3.2490 | 0.173 |
| Hearing (impaired; reference: non impaired) | 2.267 | 1.7240 | 0.188 | 0.040 | 0.6702 | 0.953 | 1.069 | 0.8206 | 0.193 | 1.002 | 0.8772 | 0.254 | 1.581 | 3.2574 | 0.627 |
| BMI, kg/m2 | -0.171 | 0.1028 | 0.096 | 0.000 | 0.0399 | 0.991 | -0.011 | 0.0491 | 0.817 | -0.134 | 0.0520 | 0.010 | -0.249 | 0.1936 | 0.198 |
| Waist circumference, cm | -0.064 | 0.0367 | 0.083 | 0.013 | 0.0143 | 0.345 | -0.015 | 0.0175 | 0.383 | -0.056 | 0.0185 | 0.002 | -0.055 | 0.0695 | 0.428 |
| Medications (1; reference: 2+) | 0.726 | 1.6297 | 0.656 | 1.286 | 0.6278 | 0.041 | 0.122 | 0.7759 | 0.875 | -0.556 | 0.8283 | 0.502 | -1.265 | 3.0719 | 0.681 |
| Supplements (0; reference: 1+) | 0.053 | 0.8877 | 0.953 | -0.118 | 0.3441 | 0.733 | -0.017 | 0.4225 | 0.969 | -0.023 | 0.4514 | 0.960 | 2.096 | 1.6690 | 0.209 |
| Alcohol consumption (never; reference: regular) | 1.012 | 1.1664 | 0.386 | -0.817 | 0.4504 | 0.070 | 0.564 | 0.5548 | 0.309 | 0.581 | 0.5930 | 0.327 | 6.840 | 2.1656 | 0.002 |
| (Occasional; reference: regular) | 0.755 | 1.0085 | 0.454 | -0.405 | 0.3894 | 0.298 | 0.461 | 0.4797 | 0.337 | 0.311 | 0.5127 | 0.544 | 3.883 | 1.8724 | 0.038 |
| Smoking (non-smoker; reference: smoker) | 5.214 | 3.9235 | 0.184 | 2.823 | 1.5169 | 0.063 | 4.061 | 1.8586 | 0.029 | -3.235 | 1.9923 | 0.104 | 15.647 | 7.3633 | 0.034 |
| NEADL score | 0.266 | 0.2050 | 0.195 | 0.038 | 0.0796 | 0.632 | 0.164 | 0.0974 | 0.092 | 0.077 | 0.1044 | 0.462 | -0.132 | 0.3873 | 0.733 |
| SPPB score | 0.195 | 0.2209 | 0.377 | 0.135 | 0.0854 | 0.114 | 0.029 | 0.1052 | 0.784 | 0.047 | 0.1124 | 0.674 | -0.162 | 0.4167 | 0.697 |
| MoCA score (not impaired; reference: impaired) | -0.982 | 1.0486 | 0.349 | -0.505 | 0.4061 | 0.213 | -0.650 | 0.4985 | 0.192 | 0.777 | 0.5322 | 0.144 | -6.024 | 1.9498 | 0.002 |
| GDS score (no depression; reference: depression) | -0.397 | 1.1694 | 0.734 | -0.683 | 0.4518 | 0.131 | 0.037 | 0.5567 | 0.947 | -0.016 | 0.5948 | 0.979 | 2.647 | 2.1996 | 0.229 |
Italicised p-values are significant at the 0.05 level.
References
- Fried, L.P.; Tangen, C.M.; Walston, J.; Newman, A.B.; Hirsch, C.; Gottdiener, J.; Seeman, T.; Tracy, R.; Kop, W.J.; Burke, G.; et al. Frailty in Older adults: Evidence for a phenotype. J. Gerontol. Ser. A Biol. Sci. Med. Sci. 2001, 56, M146–M156. [CrossRef]
- Rockwood, K.; Song, X.; MacKnight, C.; Bergman, H.; Hogan, D.B.; McDowell, I.; Mitnitski, A. A global clinical measure of fitness and frailty in elderly people. CMAJ 2005, 173, 489–495, . [CrossRef]
- O’caoimh, R.; Sezgin, D.; O’donovan, M.R.; Molloy, D.W.; Clegg, A.; Rockwood, K.; Liew, A. Prevalence of frailty in 62 countries across the world: a systematic review and meta-analysis of population-level studies. Age Ageing 2020, 50, 96–104, . [CrossRef]
- Barrett P, Twitchin S, Kletchko S, Ryan F. The living environments of community-dwelling older people who become frail: another look at the living standards of older New Zealanders survey. Social Policy Journal of New Zealand. 2006;28:133-57.
- Verlaan, S.; Ligthart-Melis, G.C.; Wijers, S.L.; Cederholm, T.; Maier, A.B.; de van der Schueren, M.A.E. High Prevalence of Physical Frailty Among Community-Dwelling Malnourished Older Adults–A Systematic Review and Meta-Analysis. J. Am. Med. Dir. Assoc. 2017, 18, 374–382. [CrossRef]
- Hirani, V.; Naganathan, V.; Blyth, F.; Le Couteur, D.G.; Seibel, M.J.; Waite, L.M.; Handelsman, D.J.; Cumming, R.G. Longitudinal associations between body composition, sarcopenic obesity and outcomes of frailty, disability, institutionalisation and mortality in community-dwelling older men: The Concord Health and Ageing in Men Project. Age Ageing 2016, 46, 413–420, . [CrossRef]
- Crow, R.S.; Lohman, M.C.; Titus, A.J.; Cook, S.B.; Bruce, M.L.; Mackenzie, T.A.; Bartels, S.J.; Batsis, J.A. Association of Obesity and Frailty in Older Adults: NHANES 1999–2004. J. Nutr. Heal. Aging 2018, 23, 138–144, . [CrossRef]
- Villareal, D.T.; Banks, M.; Siener, C.; Sinacore, D.R.; Klein, S. Physical Frailty and Body Composition in Obese Elderly Men and Women. Obes. Res. 2004, 12, 913–920, . [CrossRef]
- Woo J, Leung J, Kwok T. BMI, Body Composition, and Physical Functioning in Older Adults. 2007;15(7):1886-94.
- Lang, P.-O.; Michel, J.-P.; Zekry, D. Frailty Syndrome: A Transitional State in a Dynamic Process. Gerontology 2009, 55, 539–549, . [CrossRef]
- Wirt A, Collins CE. Diet quality - what is it and does it matter? Public Health Nutrition. 2009;12(12):2473-92.
- Payette H, Shatenstein B. Determinants of Healthy Eating in Community-dwelling Elderly People. Canadian Journal of Public Health. 2005;96(3):S30-S5.
- Thiele, S.; Mensink, G.B.; Beitz, R. Determinants of diet quality. Public Heal. Nutr. 2004, 7, 29–37, . [CrossRef]
- Thorpe, M.G.; Milte, C.M.; Crawford, D.; McNaughton, S.A. A Revised Australian Dietary Guideline Index and Its Association with Key Sociodemographic Factors, Health Behaviors and Body Mass Index in Peri-Retirement Aged Adults. Nutrients 2016, 8, 160, . [CrossRef]
- Huang, C.H.; Okada, K.; Matsushita, E.; Uno, C.; Satake, S.; Martins, B.A.; Kuzuya, M. Sex-Specific Association between Social Frailty and Diet Quality, Diet Quantity, and Nutrition in Community-Dwelling Elderly. Nutrients 2020, 12, 2845, . [CrossRef]
- Host, A.; McMahon, A.-T.; Walton, K.; Charlton, K. Factors Influencing Food Choice for Independently Living Older People—A Systematic Literature Review. J. Nutr. Gerontol. Geriatr. 2016, 35, 67–94, . [CrossRef]
- Bloom, I.; Edwards, M.; Jameson, K.A.; Syddall, H.E.; Dennison, E.; Gale, C.R.; Baird, J.; Cooper, C.; Sayer, A.A.; Robinson, S. Influences on diet quality in older age: the importance of social factors. Age Ageing 2016, 46, 277–283, . [CrossRef]
- Atkins, J.L.; Ramsay, S.E.; Whincup, P.H.; Morris, R.W.; Lennon, L.T.; Wannamethee, S.G. Diet quality in older age: the influence of childhood and adult socio-economic circumstances. Br. J. Nutr. 2015, 113, 1441–1452, . [CrossRef]
- Bailey, R.L.; Ledikwe, J.H.; Smiciklas-Wright, H.; Mitchell, D.C.; Jensen, G.L. Persistent oral health problems associated with comorbidity and impaired diet quality in older adults. J. Am. Diet. Assoc. 2004, 104, 1273–1276, . [CrossRef]
- Deierlein, A.L.; Morland, K.B.; Scanlin, K.; Wong, S.; Spark, A. Diet Quality of Urban Older Adults Age 60 to 99 Years: The Cardiovascular Health of Seniors and Built Environment Study. J. Acad. Nutr. Diet. 2013, 114, 279–287, . [CrossRef]
- Schoufour, J.D.; de Jonge, E.A.; Jong, J.C.K.-D.; van Lenthe, F.J.; Hofman, A.; Nunn, S.P.; Franco, O.H. Socio-economic indicators and diet quality in an older population. Maturitas 2018, 107, 71–77, . [CrossRef]
- Pinto de Souza Fernandes D, Duarte MSL, Pessoa MC, Franceschini SdCC, Ribeiro AQ. Evaluation of diet quality of the elderly and associated factors. Archives of Gerontology and Geriatrics. 2017;72:174-80.
- de Freitas, T.I.; Previdelli, .N.; Ferreira, M.P.D.N.; Marques, K.M.; Goulart, R.M.M.; Aquino, R.d.C.d. Factors associated with diet quality of older adults. 2017, 30, 297–306, . [CrossRef]
- Park, S.; Kim, H.J.; Kim, K. Do Where The Elderly Live Matter? Factors Associated with Diet Quality among Korean Elderly Population Living in Urban Versus Rural Areas. Nutrients 2020, 12, 1314, . [CrossRef]
- Bloom, I.; Lawrence, W.; Barker, M.; Baird, J.; Dennison, E.; Sayer, A.A.; Cooper, C.; Robinson, S. What influences diet quality in older people? A qualitative study among community-dwelling older adults from the Hertfordshire Cohort Study, UK. Public Health Nutr. 2017, 20, 2685–2693, . [CrossRef]
- Nohan AF, Adznam SNA, Jamaluddin R, Norazman CW. Diet quality and its associated factors among community dwelling older adults in urban district in Kuala Lumpur, Malaysia. Malays J Med Health Sci. 2020;16:153-62.
- Wong, J.E.; Haszard, J.J.; Howe, A.S.; Parnell, W.R.; Skidmore, P.M.L. Development of a Healthy Dietary Habits Index for New Zealand Adults. Nutrients 2017, 9, 454, . [CrossRef]
- Kim, C.-O. Food choice patterns among frail older adults: The associations between social network, food choice values, and diet quality. Appetite 2016, 96, 116–121, . [CrossRef]
- Tay, E.; Barnett, D.; Leilua, E.; Kerse, N.; Rowland, M.; Rolleston, A.; Waters, D.L.; Edlin, R.; Connolly, M.; Hale, L.; et al. The Diet Quality and Nutrition Inadequacy of Pre-Frail Older Adults in New Zealand. Nutrients 2021, 13, 2384, . [CrossRef]
- Teh, R.; Kerse, N.; Waters, D.L.; Hale, L.; Pillai, A.; Leilua, E.; Tay, E.; Rolleston, A.; Edlin, R.; Maxted, E.; et al. Study protocol of a randomised controlled trial to examine the impact of a complex intervention in pre-frail older adults. Aging Clin. Exp. Res. 2019, 31, 1407–1417, . [CrossRef]
- Statistics New Zealand. National and subnational period life tables: 2017–2019. Wellington, New Zealand: New Zealand Government; 2021.
- Simpson, E.; Bradley, J.; Poliakov, I.; Jackson, D.; Olivier, P.; Adamson, A.J.; Foster, E. Iterative Development of an Online Dietary Recall Tool: INTAKE24. Nutrients 2017, 9, 118, . [CrossRef]
- Dietary intake data were collected using Intake24.org (NZ 2018): an open source dietary assessment research tool, freely available to researchers, maintained and developed by the Nutrition Measurement Platform, MRC Epidemiology Unit, University of Cambridge, in collaboration with Open Lab, Newcastle University.
- Adamson, A.; Davies, K.; Wham, C.; Kepa, M.; Foster, E.; Jones, A.; Mathers, J.; Granic, A.; Teh, R.; Moyes, S.; et al. Assessment of Dietary Intake in Three Cohorts of Advanced Age in Two Countries: Methodology Challenges. J. Nutr. Heal. Aging 2023, 27, 59–66, . [CrossRef]
- Sivakumaran S, Huffman L, Gilmore Z, Sivakumaran S. New Zealand FOODfiles 2016 manual. The New Zealand Institute for Plant & Food Research Limited and Ministry of Health. 2017.
- Kim, S.; Haines, P.S.; Siega-Riz, A.M.; Popkin, B.M. The Diet Quality Index-International (DQI-I) Provides an Effective Tool for Cross-National Comparison of Diet Quality as Illustrated by China and the United States. J. Nutr. 2003, 133, 3476–3484, . [CrossRef]
- Chan, R.; Leung, J.; Woo, J. Dietary Patterns and Risk of Frailty in Chinese Community-Dwelling Older People in Hong Kong: A Prospective Cohort Study. Nutrients 2015, 7, 7070–7084, . [CrossRef]
- Lemon, S.C.; Roy, J.; Clark, M.A.; Friedmann, P.D.; Rakowski, W. Classification and regression tree analysis in public health: Methodological review and comparison with logistic regression. Ann. Behav. Med. 2003, 26, 172–181, . [CrossRef]
- Wham, C.A.; Teh, R.; Moyes, S.; Dyall, L.; Kepa, M.; Hayman, K.; Kerse, N. Health and social factors associated with nutrition risk: Results from life and living in advanced age: A cohort study in New Zealand (LILACS NZ). J. Nutr. Health Aging 2015, 19, 637–645, . [CrossRef]
- O'Keeffe M, Kelly M, O'Herlihy E, O'Toole PW, Kearney PM, Timmons S, et al. Potentially modifiable determinants of malnutrition in older adults: A systematic review. Clinical nutrition: official journal of the European Society of Parenteral and Enteral Nutrition. 2019;38(6):2477-98.
- Choi, Y.J.; A Ailshire, J.; Crimmins, E.M. Living alone, social networks in neighbourhoods, and daily fruit and vegetable consumption among middle-aged and older adults in the USA. Public Heal. Nutr. 2020, 23, 3315–3323, . [CrossRef]
- Herman, C.P. The social facilitation of eating. A review. Appetite 2015, 86, 61–73, . [CrossRef]
- Lane K, Poland F, Fleming S, Lambert N, Macdonald H, Potter J, et al. Older women's reduced contact with food in the Changes Around Food Experience (CAFE) study: choices, adaptations and dynamism. Ageing & Society. 2014;34(4):645-69.
- Zhao, H.; Andreyeva, T. Diet Quality and Health in Older Americans. Nutrients 2022, 14, 1198, . [CrossRef]
- Ward, R.E.; Orkaby, A.R.; Chen, J.; Hshieh, T.T.; Driver, J.A.; Gaziano, J.M.; Djousse, L. Association between Diet Quality and Frailty Prevalence in the Physicians’ Health Study. J. Am. Geriatr. Soc. 2019, 68, 770–776, . [CrossRef]
- Feart C. Nutrition and frailty: Current knowledge. Progress in Neuro-Psychopharmacology and Biological Psychiatry. 2019;95:109703.
- Wray, C.M.; Byers, A.L. Methodological Progress Note: Classification and Regression Tree Analysis.. J. Hosp. Med. 2020, 15, 549–551.
- Aguayo, G.A.; Donneau, A.-F.; Vaillant, M.T.; Schritz, A.; Franco, O.H.; Stranges, S.; Malisoux, L.; Guillaume, M.; Witte, D.R. Agreement Between 35 Published Frailty Scores in the General Population. Am. J. Epidemiology 2017, 186, 420–434, . [CrossRef]
- University of Otago and Ministry of Health. A Focus on Nutrition: Key findings of the 2008/09 New Zealand Adult Nutrition Survey. Wellington: Ministry of Health; 2011.
- Adamson AJ, Collerton J, Davies K, Foster E, Jagger C, Stamp E, et al. Nutrition in advanced age: dietary assessment in the Newcastle 85+ study. Eur J Clin Nutr. 2009;63(S1):S6-S18.
Adamson, A.J.; Collerton, J.; Davies, K.; Foster, E.; Jagger, C.; Stamp, E.; Mathers, J.C.; Kirkwood, T.; The Newcastle 85+ Study Core Team Nutrition in advanced age: dietary assessment in the Newcastle 85+ study. Eur. J. Clin. Nutr. 2009, 63, S6–S18, https://doi.org/10.1038/ejcn.2008.60.Disclaimer/Publisher’s Note: The statements, opinions and data contained in all publications are solely those of the individual author(s) and contributor(s) and not of MDPI and/or the editor(s). MDPI and/or the editor(s) disclaim responsibility for any injury to people or property resulting from any ideas, methods, instructions or products referred to in the content. |
Table 1.
Sample characteristics.
| Characteristics | All (n = 465) |
|---|---|
| Age, n (% ≥ 80 years) | 242 (52) |
| Sex, n (% female) | 275 (59.1) |
| Ethnic group a, n (% European/ Pākehā) | 421 (90.5) |
| Education level, n (%) | |
| Primary | 14 (3.0) |
| Secondary | 256 (55.1) |
| Tertiary | 195 (41.9) |
| Living arrangement, n (%) | |
| Alone | 204 (43.9) |
| With others | 261 (56.1) |
| NZ Dep Index 2018, n (%) | |
| Low, 1 – 4 | 174 (37.4) |
| Medium, 5 – 7 | 159 (34.2) |
| High, 8 – 10 | 132 (28.4) |
| Medical conditions, n (%) | |
| 0-1 | 112 (24.1) |
| ≥ 2 | 353 (75.9) |
| Vision, n (% impaired) | 32 (6.9) |
| Hearing, n (% impaired) | 35 (7.5) |
| BMI (kg/m2) median (IQR) | 28.3 (25.3 – 31.4) |
| Waist circumference (cm) median (IQR) Male Female |
102.5 (95.8 – 109.5) 93.8 (85.4 – 101.9) |
| Medications, n (%) | |
| 1 | 46 (9.9) |
| ≥ 2 | 419 (90.1) |
| Supplements, n (%) | |
| 0 | 261 (56.1) |
| ≥ 1 | 204 (43.9) |
| Alcohol consumption, n (%) | |
| Never | 111 (23.9) |
| Occasional | 187 (40.2) |
| Regular | 167 (35.9) |
| Smoking, n (% smoker) | 5 (1.1) |
| NEADL score, median (IQR) | 20 (18 – 21) |
| SPPB score, median (IQR) | 9 (8 – 10) |
| MoCA, median (IQR) Cognitive impairment b, n (%) |
25 (23 - 27) 100 (21.5) |
| Total DQI-I scores, median (IQR) Variety, median (IQR) Adequacy, median (IQR) Moderation, median (IQR) Balance, median (IQR) |
60 (11) 14 (5) 30 (7) 12 (6) 7 (2) |
Note: missing data for waist circumference (3), BMI (5), and MoCA (1). a Ethnicity: 39 Māori, 4 Pasifika, 2 Asians and 1 Syrian and South African respectively. b MoCA score ≤22. BMI, body mass index; DQI-I, Diet Quality Index-International; IQR, interquartile range; MoCA, Montreal Cognitive Assessment; NEADL, Nottingham Extended Activities of Daily Living; NZ Dep Index, New Zealand Deprivation Index; SPPB, short physical performance battery.
Table 2.
Multivariate regression against DQI-I score and subcomponents.
| Demographic and health variables | B | 95% CI | p-value |
|---|---|---|---|
| DQI-I total score | |||
| (Intercept) | 52.36 | 42.28, 62.43 | <0.001 |
| Age (<80 year; reference: 80+ years) | -0.99 | -2.55, 0.57 | 0.213 |
| NZ Dep Index (low; reference: high) | 2.14 | 0.29, 3.99 | 0.024 |
| (Medium; reference: high) | 1.49 | -0.39, 3.37 | 0.121 |
| Live alone (reference: with others) | 1.60 | 0.06, 3.15 | 0.042 |
| BMI, kg/m2 | -0.17 | -0.33, -0.02 | 0.026 |
| Smoking (reference: smoker) | 5.91 | -1.22, 13.03 | 0.104 |
| NEADL | 64.32 | 56.53, 73.20 | 0.164 |
| Variety score | |||
| (Intercept) | 11.174 | 7.52, 14.82 | <0.001 |
| Deprivation (low; reference: high) | 0.38 | -0.37, 1.14 | 0.320 |
| (Medium; reference: high) | 0.28 | -0.49, 1.04 | 0.478 |
| BMI, kg/m2 | -0.06 | -0.12, 0.01 | 0.068 |
| Alcohol consumption (never; reference: regular) | -0.84 | -1.65, -0.04 | 0.040 |
| (Occasional; reference: regular) | -0.23 | -0.93, 0.47 | 0.526 |
| Smoking (reference: smoker) | 2.71 | -0.20, 5.63 | 0.068 |
| SPPB score | 0.13 | -0.02, 0.27 | 0.086 |
| Adequacy score | |||
| (Intercept) | 26.378 | 21.657, 31.099 | <0.001 |
| Deprivation (low; reference: high) | 1.08 | 0.09, 2.07 | 0.033 |
| (Medium; reference: high) | 0.97 | -0.04, 1.97 | 0.060 |
| BMI, kg/m2 | -0.10 | -0.181, -0.018 | 0.016 |
| Smoking (non-smoker; reference: smoker) | 3.92 | 0.08, 7.75 | 0.045 |
| Medications (1; reference: 2+) | -1.54 | -2.87, -0.20 | 0.025 |
| NEADL | 0.15 | -0.03, 0.32 | 0.093 |
| Moderation score | |||
| (Intercept) | 12.882 | 12.047, 13.716 | <0.001 |
| Age, (<80 years; reference: 80+ years) | -0.65 | -1.41, 0.11 | 0.095 |
| Sex (male; reference: female) | -1.41 | -2.18, -0.63 | <0.001 |
| Balance score | |||
| (Intercept) | 4.39 | 3.96, 4.82 | <0.001 |
| Deprivation (low; reference: high) | 0.28 | -0.06, 0.62 | 0.104 |
| (Medium; reference: high) | 0.29 | -0.05, 0.64 | 0.092 |
| Supplement (no, reference: yes) | 0.31 | 0.04, 0.59 | 0.023 |
| Alcohol consumption (never; reference: regular) | 0.38 | 0.02, 0.73 | 0.039 |
| (Occasional; reference: regular) | 0.28 | -0.02, 0.59 | 0.072 |
| MoCA score (not impaired; reference: impaired) | -0.49 | -0.82, -0.16 | 0.003 |
Italicised p-values are significant at the 0.05 level. Note: BMI, body mass index; IQR, interquartile range; MoCA, Montreal Cognitive Assessment; NEADL, Nottingham Extended Activities of Daily Living; NZ Dep Index, New Zealand Deprivation Index; SPPB, short physical performance battery.
Disclaimer/Publisher’s Note: The statements, opinions and data contained in all publications are solely those of the individual author(s) and contributor(s) and not of MDPI and/or the editor(s). MDPI and/or the editor(s) disclaim responsibility for any injury to people or property resulting from any ideas, methods, instructions or products referred to in the content. |
© 2023 by the authors. Licensee MDPI, Basel, Switzerland. This article is an open access article distributed under the terms and conditions of the Creative Commons Attribution (CC BY) license (http://creativecommons.org/licenses/by/4.0/).
Copyright: This open access article is published under a Creative Commons CC BY 4.0 license, which permit the free download, distribution, and reuse, provided that the author and preprint are cited in any reuse.


