Submitted:
18 August 2023
Posted:
21 August 2023
Read the latest preprint version here
Preprints on COVID-19 and SARS-CoV-2
Abstract
This study updates previous research showing that 22 all-cause mortality in 31 European countries increased over time the higher the 21 COVID-19 full vaccination uptake. The update illuminates that a one percentage point increase in 21 full vaccination uptake initially decreased all-cause mortality from Jan to Mar 22 by –0.423 percent (95% CI –0.577, –0.270), but the following 14 months, a one percentage point increase in 21 booster vaccination uptake oppositely increased mortality by 0.366 percent (95% CI 0.250, 0.482). The findings indicate that full vaccination initially prevented mortality, but subsequently, booster vaccination, in particular, detrimentally and consistently induced higher mortality. The effects remained robust when controlling for alternative explanations. Studies have argued that heat waves caused mortality in the 22 summer and energy prices caused mortality in the 22-23 winter. However, the update shows that booster vaccination consistently induced higher mortality when neither heat waves nor energy prices were likely explanations.
Keywords:
COVID-19
; full vaccination
; booster vaccination
; all-cause mortality
; excess mortality
1. Introduction
This paper updates previous research by Aarstad and Kvitastein [1], showing that all-cause
mortality in 31 European countries during the nine first months of 22 increased over time the higher
the COVID-19 full vaccination uptake by the end of 21. The following paragraphs address the update’s
contributions.
First, it adds eight monthly observations of country-level all-cause mortality, extending the study
period from Jan 22 to May 23. I.e., it extends the study period from nine to 17 months.
Second, it includes country-level first booster vaccination uptake by the end of 21 as an additional
explanatory variable of mortality in the following months. Booster vaccination in this study implies that
three doses have been administered, and the motive for including the measure is Uversky, et al. [2]
asserting that repeated injections can suppress natural antiviral responses in addition to causing
autoimmune diseases, including myocarditis and promote cancer growth. In line with these statements,
I do not rule out that booster vaccination may affect mortality, which the update investigates.
Third, the update in more detail than the Aarstad and Kvitastein [1] study assesses how the
association between vaccination uptake by the end of 21 and subsequent mortality has changed over
time. They showed that the overall association increased from Jan 22 to Sep 22, which does not rule out
it may have been negative initially, i.e., vaccination having a temporal preventive mortality effect.
Subsequently, the association likely turned positive, which implies that vaccination, in the longer run,
has had a detrimental harmful mortality effect. To gain more detailed and explicit knowledge about
these issues, the update examines the association between vaccination uptake by the end of 21 and
mortality for each of the following 17 months of observation. The approach assesses in which months
during 22 and 23 the mortality may have decreased or increased from vaccination uptake by the end of
21. It further contributes to other research showing that the preventive effect of COVID-19 vaccination
against hospital admission and death waned [3], but to my knowledge, we do not know when the
preventive effect may have gone into negative terrain, causing increased mortality.
Fourth, the update particularly emphasizes the association between COVID-19 vaccination uptake
and mortality in Apr and May, 22 and 23, plus Sep and Oct in 22. The motive for emphasizing those six
months is a recent study arguing that heat waves increased mortality between Jun and Aug in the
summer of 22 [4], and a second study arguing that increased energy prices caused increased mortality
in the following winter between Nov 22 and Mar 23 [5]. Analyzing Apr and May in 22 and 23, plus Sep
and Oct in 22 – during spring and autumn months neither strongly exposed to heat waves nor adverse
effects of increased energy prices – partakes to rule out alternative explanations of mortality as
suggested by the two studies.
2. Materials and Methods
The 31 countries studied are EU member states, plus Norway, Iceland, Switzerland, and Liechtenstein. The dependent variable is monthly country-level excess all-cause mortality compared to average pre-pandemic all-cause mortality in the same months between 16 and 19. Values higher (lower) than zero indicate positive (negative) excess mortality. E.g., a value of 10 (–10) for a given month in a given country indicates ten percent
higher (lower) mortality than the pre-pandemic average, i.e., positive (negative) excess mortality. The data were sourced from the Eurostat mortality database [6]. At the time of data collection, the database
included complete mortality data from all 31 countries from Jan 22 to May 23,
except for Italy, missing data for May 23. In total, the study includes 526
country-level observations of monthly mortality.
Table 1 reports descriptive statistics concerning the dependent variable, excess
mortality, for different country-level months (on which I will report in
further detail shortly). All the study’s statistics are weighted by the
countries’ population size at the beginning of 20 (intuitively except for
minimum and maximum values), as reported in Table 2, sourced from Eurostat [7]. The blue
line in Figure 1 reports weighted average
excess mortality between Jan 22 and May 23 for all the 31 countries (except for
missing data from Italy in May 23). The blue line shows positive excess
mortality throughout the study period, except for Feb 23 when it was slightly
negative (shortly, I report on the figure in more detail, including the red and
green lines).
As independent explanatory variables, the study
includes data on country-level full vaccination and first booster vaccination
uptake by the end of 21. Full vaccination implies the percentage of the total
population in each country having taken the primary course, i.e., two doses,
and booster vaccination implies the percentage of the population having taken a
third dose. The data were accessed from the European Centre for Disease
Prevention and Control [8], except for
Switzerland where the they were accessed from Our World in Data [9]. Table 2
reports full vaccination and booster vaccination uptake for each country.
To account for alternative explanations, the study
includes models controlling for the country-level average 20-21 all-cause
mortality relative to the average 16-19 all-cause mortality [10], the life expectancy in 19 [11], the median age in 18 [12], and the purchasing power adjusted per capita
GDP in 19 [13] where I include the same number
for Liechtenstein as reported for Switzerland. Aarstad and Kvitastein [1] explain the motive for including the two first
control variables, but briefly, the concepts account for mortality and the
countries’ health conditions prior to examining the study’s dependent variable.
Concerning the two latter control variables, the median age is an additional
proxy for a country’s health conditions, as people in countries with old
populations, ceteris paribus, are more prone to sickness and death than in
countries with young populations. GDP is an indicator of countries’ financial ability
to handle challenges related to health issues.
3. Results
Initially, I carried out explorative analyses, which showed that the independent variables, country-level full- and booster vaccination uptake by the end of 21, respectively, were negatively associated with the dependent variable, excess all-cause mortality, Jan, Feb, and Mar 22. The following 14 months, i.e., from Apr 22 to May 23, the association turned positive. (Shortly, I will report on and explain these findings in detail.)
Based on the negative associations between the independent and dependent variables from Jan 22 to Mar 22, Models 1-3 (Table 5) conducted multilevel mixed effects random intercept linear regressions for this period. The dependent variable observations of monthly excess mortality were nested at the country level [for further readings, see 15,16]. The regressions were weighted by the countries’ population size (cf. Table 2) and report robust standard errors concerning the fixed effects (intercepts and regressors). Model 1 includes full vaccination uptake only as an independent variable. It shows that between Jan 22 and Mar 22 full vaccination uptake was negatively and significantly associated with all-cause mortality. Specifically, a one percentage point increase in country-level full vaccination uptake decreased all-cause mortality by –0.423 percent (95% CI –0.577, –0.270). Model 2 includes booster vaccination uptake only as an independent variable and also shows a significant negative association with the dependent variable, but the effect is weaker than in the previous model. Model 3 includes both the independent variables and indicates that full vaccination uptake had a genuine negative significant association with the dependent variable, while booster vaccination uptake had a non-significant negative association. Having said that, as the correlation between the two independent variables is high, taking a value of 0.827 (cf. Table 4) and reflected in a high variance inflation factor, I do not rule out multicollinearity in Model 3. Therefore, I conclude that both the independent variables had a strong negative association with the dependent variable between Jan 22 and Mar 22, but full vaccination uptake probably had a more dominant and genuine effect on excess mortality than booster vaccination uptake. Thus, full vaccination uptake by the end of 21 seems to have reduced excess mortality the three first months of the following year. In other words, the findings indicate that full vaccination prevented mortality during this period.
Based on the positive associations between the independent and dependent variables from Apr 22 to May 23 in the explorative analyses referred to above (and which I will report on in more detail shortly), Models 4-6 (Table 5) conducted multilevel mixed effects random intercept linear regressions for this period similarly as reported above. Model 4 includes full vaccination uptake only as an independent variable. It shows that between Apr 22 and May 23 full vaccination uptake was positively and significantly associated with all-cause mortality. Model 5 includes booster vaccination uptake only as an independent variable and also shows a significant positive association with the dependent variable, and the effect is stronger than in the previous model. Specifically, a one percentage point increase in country-level booster vaccination uptake increased country-level all-cause mortality by 0.366 percent (95% CI 0.250, 0.482). Model 6 includes both the independent variables and indicates that booster vaccination uptake had a genuine positive significant association with the dependent variable, while full vaccination uptake had a non-significant positive association. Again, multicollinearity may be an issue when including both independent variables in the same model (cf. my discussion above). Therefore, I conclude that both the independent variables had a strong positive association with the dependent variable between Apr 22 and May 23, but booster vaccination uptake probably had a more dominant and genuine effect on excess mortality than full vaccination uptake. Thus, booster vaccination uptake by the end of 21 seems to have increased excess mortality from Apr 22 to May 23. In other words, the findings indicate that booster vaccination had a detrimental effect leading to higher mortality during this period.
To account for alternative explanations concerning the negative association between full vaccination uptake and excess mortality between Jan 22 and Mar 22, Table 6 includes the control variables without altering any statistical conclusion. Similarly, Table 7 includes the control variables to account for eventual alternative explanations concerning the positive association between booster vaccination uptake and excess mortality between Apr 22 and May 23, but without altering any statistical conclusion.
Graph A in Figure 2, based on Model 1 in Table 5, shows how the country-level mortality decreased between Jan 22 and Mar 22 as a function of country-level full vaccination uptake. Similarly, Graph B, based on Model 5 in Table 5, shows how the country-level mortality between Apr 22 and May 23 increased as a function of country-level booster vaccination uptake. The graphs report 95% confidential intervals (CIs) for minimum, weighted mean, and maximum vaccination values. Graphs C and D are based on regressions that add interaction terms between month dummies and vaccination uptake. Consistent with Graph A, Graph C shows how the mortality decreased as a function of full vaccination uptake, but in addition, it illustrates the association for each month between Jan 22 and Mar 22. Similarly, and consistent with Graph B, Graph D shows how the mortality increased as a function of booster uptake, but in addition, it illustrates the association for each month between Apr 22 and May 23.
Returning to Figure 1, its red line illustrates the association between full vaccination uptake by the end of 21 and mortality the following 17 months, and its green line similarly illustrates the association between booster vaccination uptake and mortality. The lines show that the associations from Jan 22 to Mar 22 were negative, which aligns with the results I have reported above. However, from Apr 22 the associations turned positive and remained so for the rest of the study period till May 23, which also aligns with the results I have reported above. In addition, the red and green lines show that the associations had increasing trends at least the first half of 22, which aligns with Aarstad and Kvitastein [1] also showing that the association between vaccination uptake and excess mortality increased over time. Roughly between May 22 and Jul 22 the positive association between full vaccination uptake and mortality was stronger than between booster vaccination and mortality, but from Sep 22 the positive association between booster vaccination and mortality was stronger than between full vaccination and mortality, except for Feb 23. The results indicate that booster vaccination over time appears to have a stronger effect on mortality than full vaccination uptake, and they align with findings reported above. Finally, it is worth mentioning that particularly from Apr 22, a change in the association between booster vaccination and mortality was strongly correlated with a change in mortality (correlation coefficient is 0.851), which is also possible to observe from the blue and green lines in Figure 1. It indicates that months with increasing mortality mainly occurred in countries with high booster vaccination uptakes.
Table 8 reports statistical details concerning the associations between full- and booster vaccination uptake by the end of 21, respectively, and mortality in the following 17 months. It shows that the monthly associations were statistically significant, i.e., p<0.05, except for a few months where they either were non-significant (Jan 22 for both vaccination types and Sep 22 for full vaccination) or borderline-significant (Sep 22 for booster vaccination and Jan 23 for full vaccination), i.e., p<0.10.
Figure 2 shows that the associations between booster vaccination uptake and mortality were positive in Apr, May 22, and 23, and Sep and Oct in 22. Table 4 additionally reveals that the positive associations were statistically significant in all those months except for Sep 23, which was borderline significant. Multilevel mixed effects random intercept linear regression moreover shows an overall positive significant association between booster vaccination uptake and excess mortality when observations for these six months are included as the dependent variable. I conclude from the results that booster vaccination uptake consistently induced higher mortality in months when, as suggested by other studies [4,5], neither heat waves nor energy prices were likely explanations.

Table 9.
Multilevel mixed-effects random intercept linear regressions with robust standard errors and monthly all-cause mortality as the dependent variable. Months included are Apr and May in 22 and 23, plus Sep and Oct in 22.
Table 9.
Multilevel mixed-effects random intercept linear regressions with robust standard errors and monthly all-cause mortality as the dependent variable. Months included are Apr and May in 22 and 23, plus Sep and Oct in 22.
| FIXED EFFECTS | |
| Intercept | -1.35 |
| (1.96) | |
| Booster vacc by the end of 21 | 0.316*** |
| (0.061) | |
| RANDOM EFFECTS | |
| Residual | 25.6 |
| (2.93) | |
| Country effect | 3.84 |
| (2.52) | |
| Wald χ2 | 26.6*** |
| Log pseudo-likelihood | –8.39e9 |
Estimates are weighted the countries’ population size by Jan 1, 20, and I report robust standard errors in parentheses concerning the fixed effects. For fixed effects, I also report conservative two-tailed tests of significance. † p < 0.10; * p < 0.05; ** p < 0.01; *** p< 0.001. The number of monthly observations is 185.
4. Discussion
This study updates previous research by Aarstad and Kvitastein [1] showing that 22 all-cause mortality in 31 European countries increased over time the higher the 21 COVID-19 full vaccination uptake. The update illuminates that a one percentage point increase in 21 full vaccination uptake initially decreased all-cause mortality from Jan 22 to Mar 22 by –0.423 percent (95% CI –0.577, –0.270), but the following 14 months, a one percentage point increase in 21 booster vaccination uptake oppositely increased mortality by 0.366 percent (95% CI 0.250, 0.482). The findings indicate that full vaccination initially prevented mortality, but subsequently, booster vaccination, in particular, detrimentally and consistently induced higher mortality. Studies have argued that heat waves caused mortality in the 22 summer [4] and energy prices caused mortality in the 22-23 winter [5]. However, the update shows that booster vaccination uptake consistently induced higher mortality in months when neither heat waves nor energy prices were likely explanations.
Fortunately, the excess mortality has been reduced from its peak on Dec 22. However, as the weighted average excess mortality in the 31 countries was positive in 20, 21 [1], and 22, one should expect that it would be markedly negative at the beginning of 23, but this is not the case. Instead, the country-level mortality is higher the higher the country-level booster vaccination uptake in particular, and the association remains positive even when the time asymmetry between the determination of the independent and dependent variable has increased. In other words, the more months between the determination of the independent and the dependent variable there is a significant association, the more likely a genuine causal relationship. Moreover, the initial negative association between full vaccination uptake and excess mortality Jan 22 - Mar 22, and later the extended positive association between booster vaccination uptake and excess mortality Apr 22 - May 23, remained statistically significant when controlling for alternative explanations [for a discussion about how time asymmetry and accounting for alternative explanations partake to assess causality, please see Stuart Mill cited in Cook and Campbell, 17, pp. 18-20]. Adding to this, Aarstad and Kvitastein [1] discussed how their study addressed the issue of ecological fallacy [18], e.g., the classical Robinson’s paradox [19,20] and the Simpson’s paradox [21,22,23,24], which also applies to this updated version.
However, despite addressing the issues of causality and ecological fallacy, a limitation of my paper is nonetheless that it researches country-level data only. Therefore, I encourage future research to also investigate person-level data by, for instance, emphasizing different types of vaccination, the timing, and the number of doses given to males and females in different age cohorts as potential carriers of long-term mortality. Similarly, I suggest using person-level chronic morbidity as a dependent variable. Person-level data, too, can have limitations, which the literature has labeled individualistic fallacy [20,24], but additional research addressing COVID-19 vaccination uptakes as potential causes of excess mortality and chronic morbidity – important research questions, in my opinion – at different levels of analysis using different methodologies is warranted, I argue.
Funding
This research has no external funding.
Data Availability Statement
This study uses publicly available data only.
Conflicts of Interest
The author declares no conflict of interest.
References
- Aarstad, J.; Kvitastein, O.A. Is there a Link between the 2021 COVID-19 Vaccination Uptake in Europe and 2022 Excess All-Cause Mortality? Preprints 2023. [Google Scholar] [CrossRef]
- Uversky, V.N.; Redwan, E.M.; Makis, W.; Rubio-Casillas, A. IgG4 Antibodies Induced by Repeated Vaccination May Generate Immune Tolerance to the SARS-CoV-2 Spike Protein. Vaccines 2023, 11. [Google Scholar] [CrossRef] [PubMed]
- Nordstrom, P.; Ballin, M.; Nordstrom, A. Risk of infection, hospitalisation, and death up to 9 months after a second dose of COVID-19 vaccine: a retrospective, total population cohort study in Sweden. Lancet 2022, 399, 814–823. [Google Scholar] [CrossRef] [PubMed]
- Ballester, J.; Quijal-Zamorano, M.; Méndez Turrubiates, R.F.; Pegenaute, F.; Herrmann, F.R.; Robine, J.M.; Basagaña, X.; Tonne, C.; Antó, J.M.; Achebak, H. Heat-related mortality in Europe during the summer of 2022. Nature Medicine 2023, 29, 1857–1866. [Google Scholar] [CrossRef] [PubMed]
- The Economist. Expensive energy may have killed more Europeans than covid-19 last winter. 10 May 2023.
- Eurostat. Excess mortality by month. Available online: https://ec.europa.eu/eurostat/databrowser/view/DEMO_MEXRT__custom_1210067/bookmark/table?lang=en&bookmarkId=fc27a3a9-082b-461d-830b-a4c7b36caf4f (accessed on 15 July 2023).
- Eurostat. Population on 1 January 2022. Available online: https://ec.europa.eu/eurostat/databrowser/view/tps00001/default/table?lang=en (accessed on 23 November 2022).
- European Centre for Disease Prevention and Control. COVID-19 Vaccine Tracker. Available online: https://vaccinetracker.ecdc.europa.eu/public/extensions/COVID-19/vaccine-tracker.html#uptake-tab (accessed on 15 July 2023).
- Our World in Data. Coronavirus (COVID-19) Vaccinations. Available online: https://ourworldindata.org/covid-vaccinations (accessed on 15 January 2023).
- Eurostat. Deaths and crude death rate. Available online: https://ec.europa.eu/eurostat/databrowser/view/tps00029/default/table?lang=en (accessed on 15 November 2022).
- Eurostat. Life expectancy by age and sex. Available online: https://ec.europa.eu/eurostat/databrowser/view/demo_mlexpec/default/table?lang=en (accessed on 23 November 2022).
- CIA. The World Factbook: Median Age. Available online: https://www.cia.gov/the-world-factbook/field/median-age/country-comparison/ (accessed on 23 November 2022).
- Eurostat. GDP per capita in PPS. Available online: https://ec.europa.eu/eurostat/databrowser/view/tec00114/default/table?lang=en (accessed on 23 November 2022).
- O'Brien, R.M. A caution regarding rules of thumb for variance inflation factors. Qual. Quant. 2007, 41, 673–690. [Google Scholar] [CrossRef]
- Raudenbush, S.W.; Bryk, A.S. Hierarchical Linear Models: Applications and Data Analysis Methods, 2nd ed.; Sage: Thousand Oaks, CA, 2002. [Google Scholar]
- Snijders, T.A.B. Multilevel Analysis. In International Encyclopedia of Statistical Science; Lovric, M., Ed.; Springer: Berlin, Heidelberg, 2011; pp. 879–882. [Google Scholar]
- Cook, T.D.; McCleary, R.; McCain, L.J.; Reichardt, C.S.; Fankhauser, G.; Campbell, D.T. Quasi-experimentation : design & analysis issues for field settings; Houghton Mifflin Co.: Boston, 1979. [Google Scholar]
- Hsieh, J.J.; Encyclopedia Britannica. Ecological fallacy. Available online: https://www.britannica.com/science/ecological-fallacy (accessed on 26 January 2023).
- Robinson, W.S. Ecological Correlations and the Behavior of Individuals. Am. Sociol. Rev. 1950, 15, 351–357. [Google Scholar] [CrossRef]
- Subramanian, S.V.; Jones, K.; Kaddour, A.; Krieger, N. Revisiting Robinson: The perils of individualistic and ecologic fallacy. International Journal of Epidemiology 2009, 38, 342–360. [Google Scholar] [CrossRef] [PubMed]
- Blyth, C.R. On Simpson's Paradox and the Sure-Thing Principle. J. Am. Stat. Assoc. 1972, 67, 364–366. [Google Scholar] [CrossRef]
- Simpson, E.H. The Interpretation of Interaction in Contingency Tables. Journal of the Royal Statistical Society: Series B (Methodological) 1951, 13, 238–241. [Google Scholar] [CrossRef]
- Rothman, K.J. A pictorial representation of confounding in epidemiolog1c studies. Journal of Chronic Diseases 1975, 28, 101–108. [Google Scholar] [CrossRef] [PubMed]
- Loney, T.; Nagelkerke, N.J. The individualistic fallacy, ecological studies and instrumental variables: a causal interpretation. Emerging Themes in Epidemiology 2014, 11, 18. [Google Scholar] [CrossRef] [PubMed]
Figure 1.
The blue line shows monthly excess mortality between Jan 22 and May 23. For the same months the red line shows the monthly full vaccination association with excess mortality, and the green line shows the monthly booster vaccination association with excess mortality.
Figure 1.
The blue line shows monthly excess mortality between Jan 22 and May 23. For the same months the red line shows the monthly full vaccination association with excess mortality, and the green line shows the monthly booster vaccination association with excess mortality.
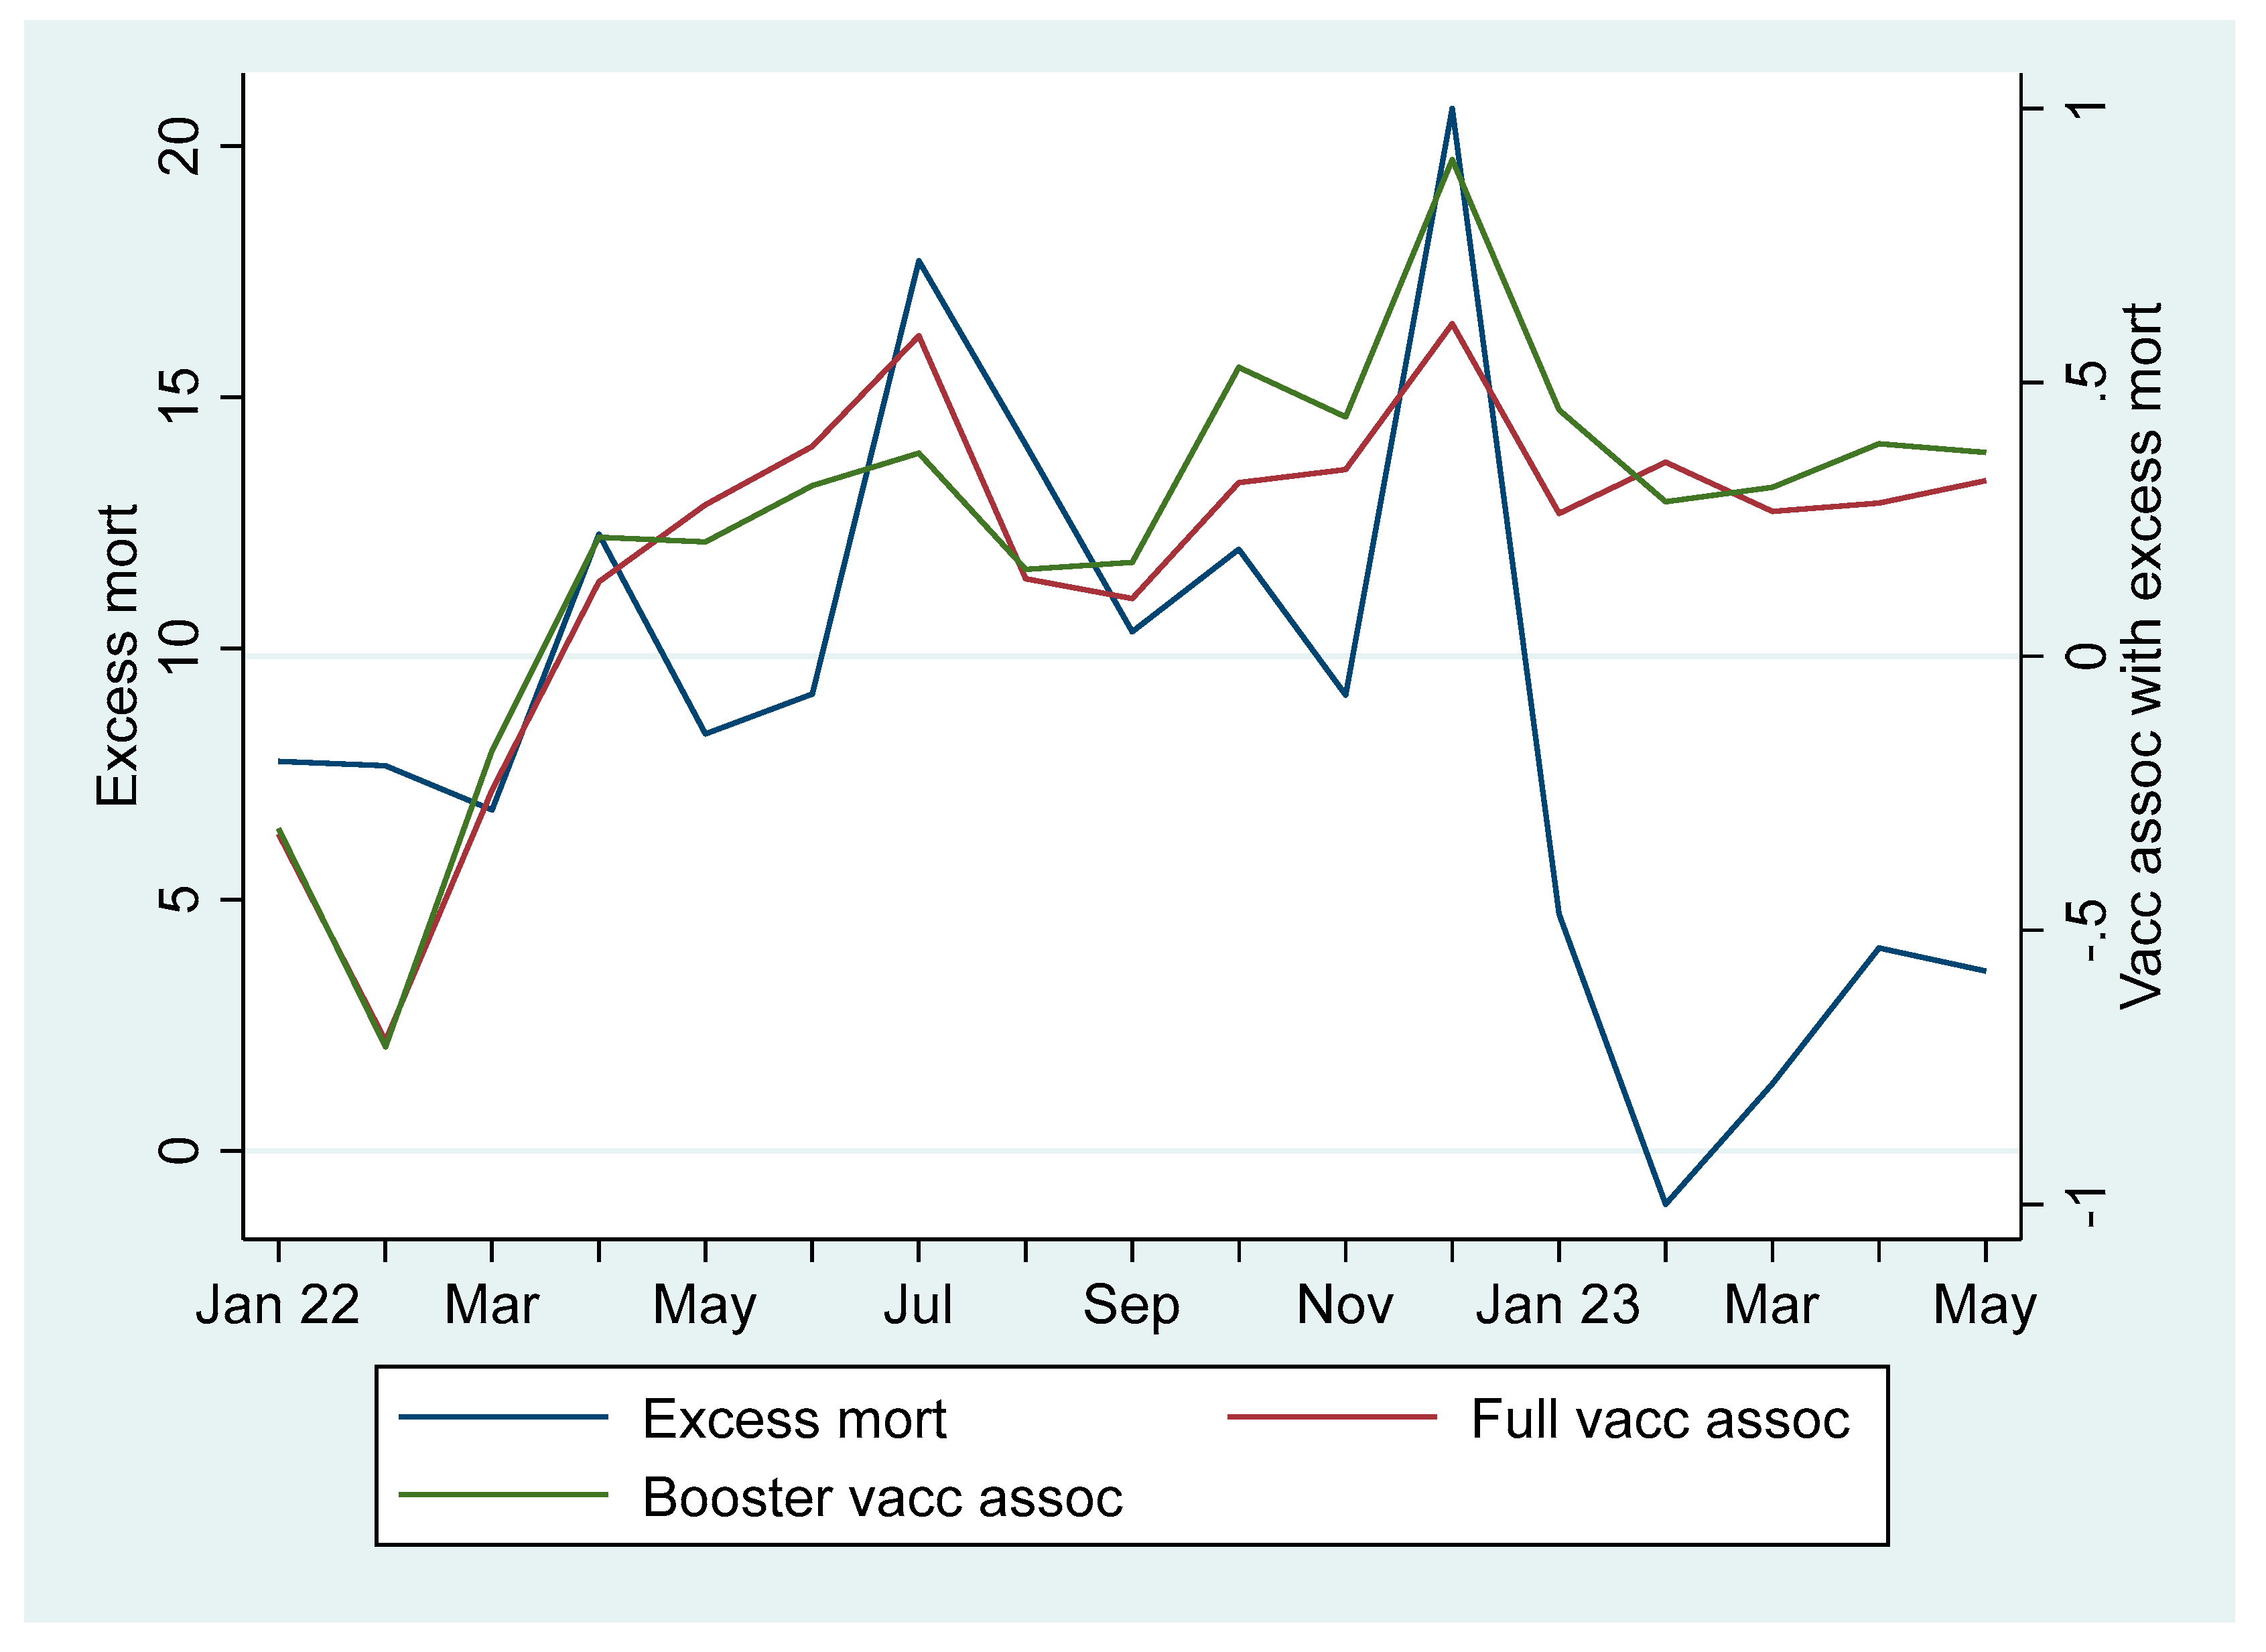
Figure 2.
Graph A shows country-level variation in excess mortality between Jan 22 and Mar 22 as a function of country-level full vaccination by the end of 2021 (based on Model 1, Table 5). Graph B shows country-level variation excess mortality between Apr 22 and May 23 as a function of country-level booster vaccination by the end of 21 (based on Model 5, Table 5). Graphs C and D show monthly country-level variations in excess mortality. Minimum, weighted mean, and maximum values are reported with 95% confidential intervals.
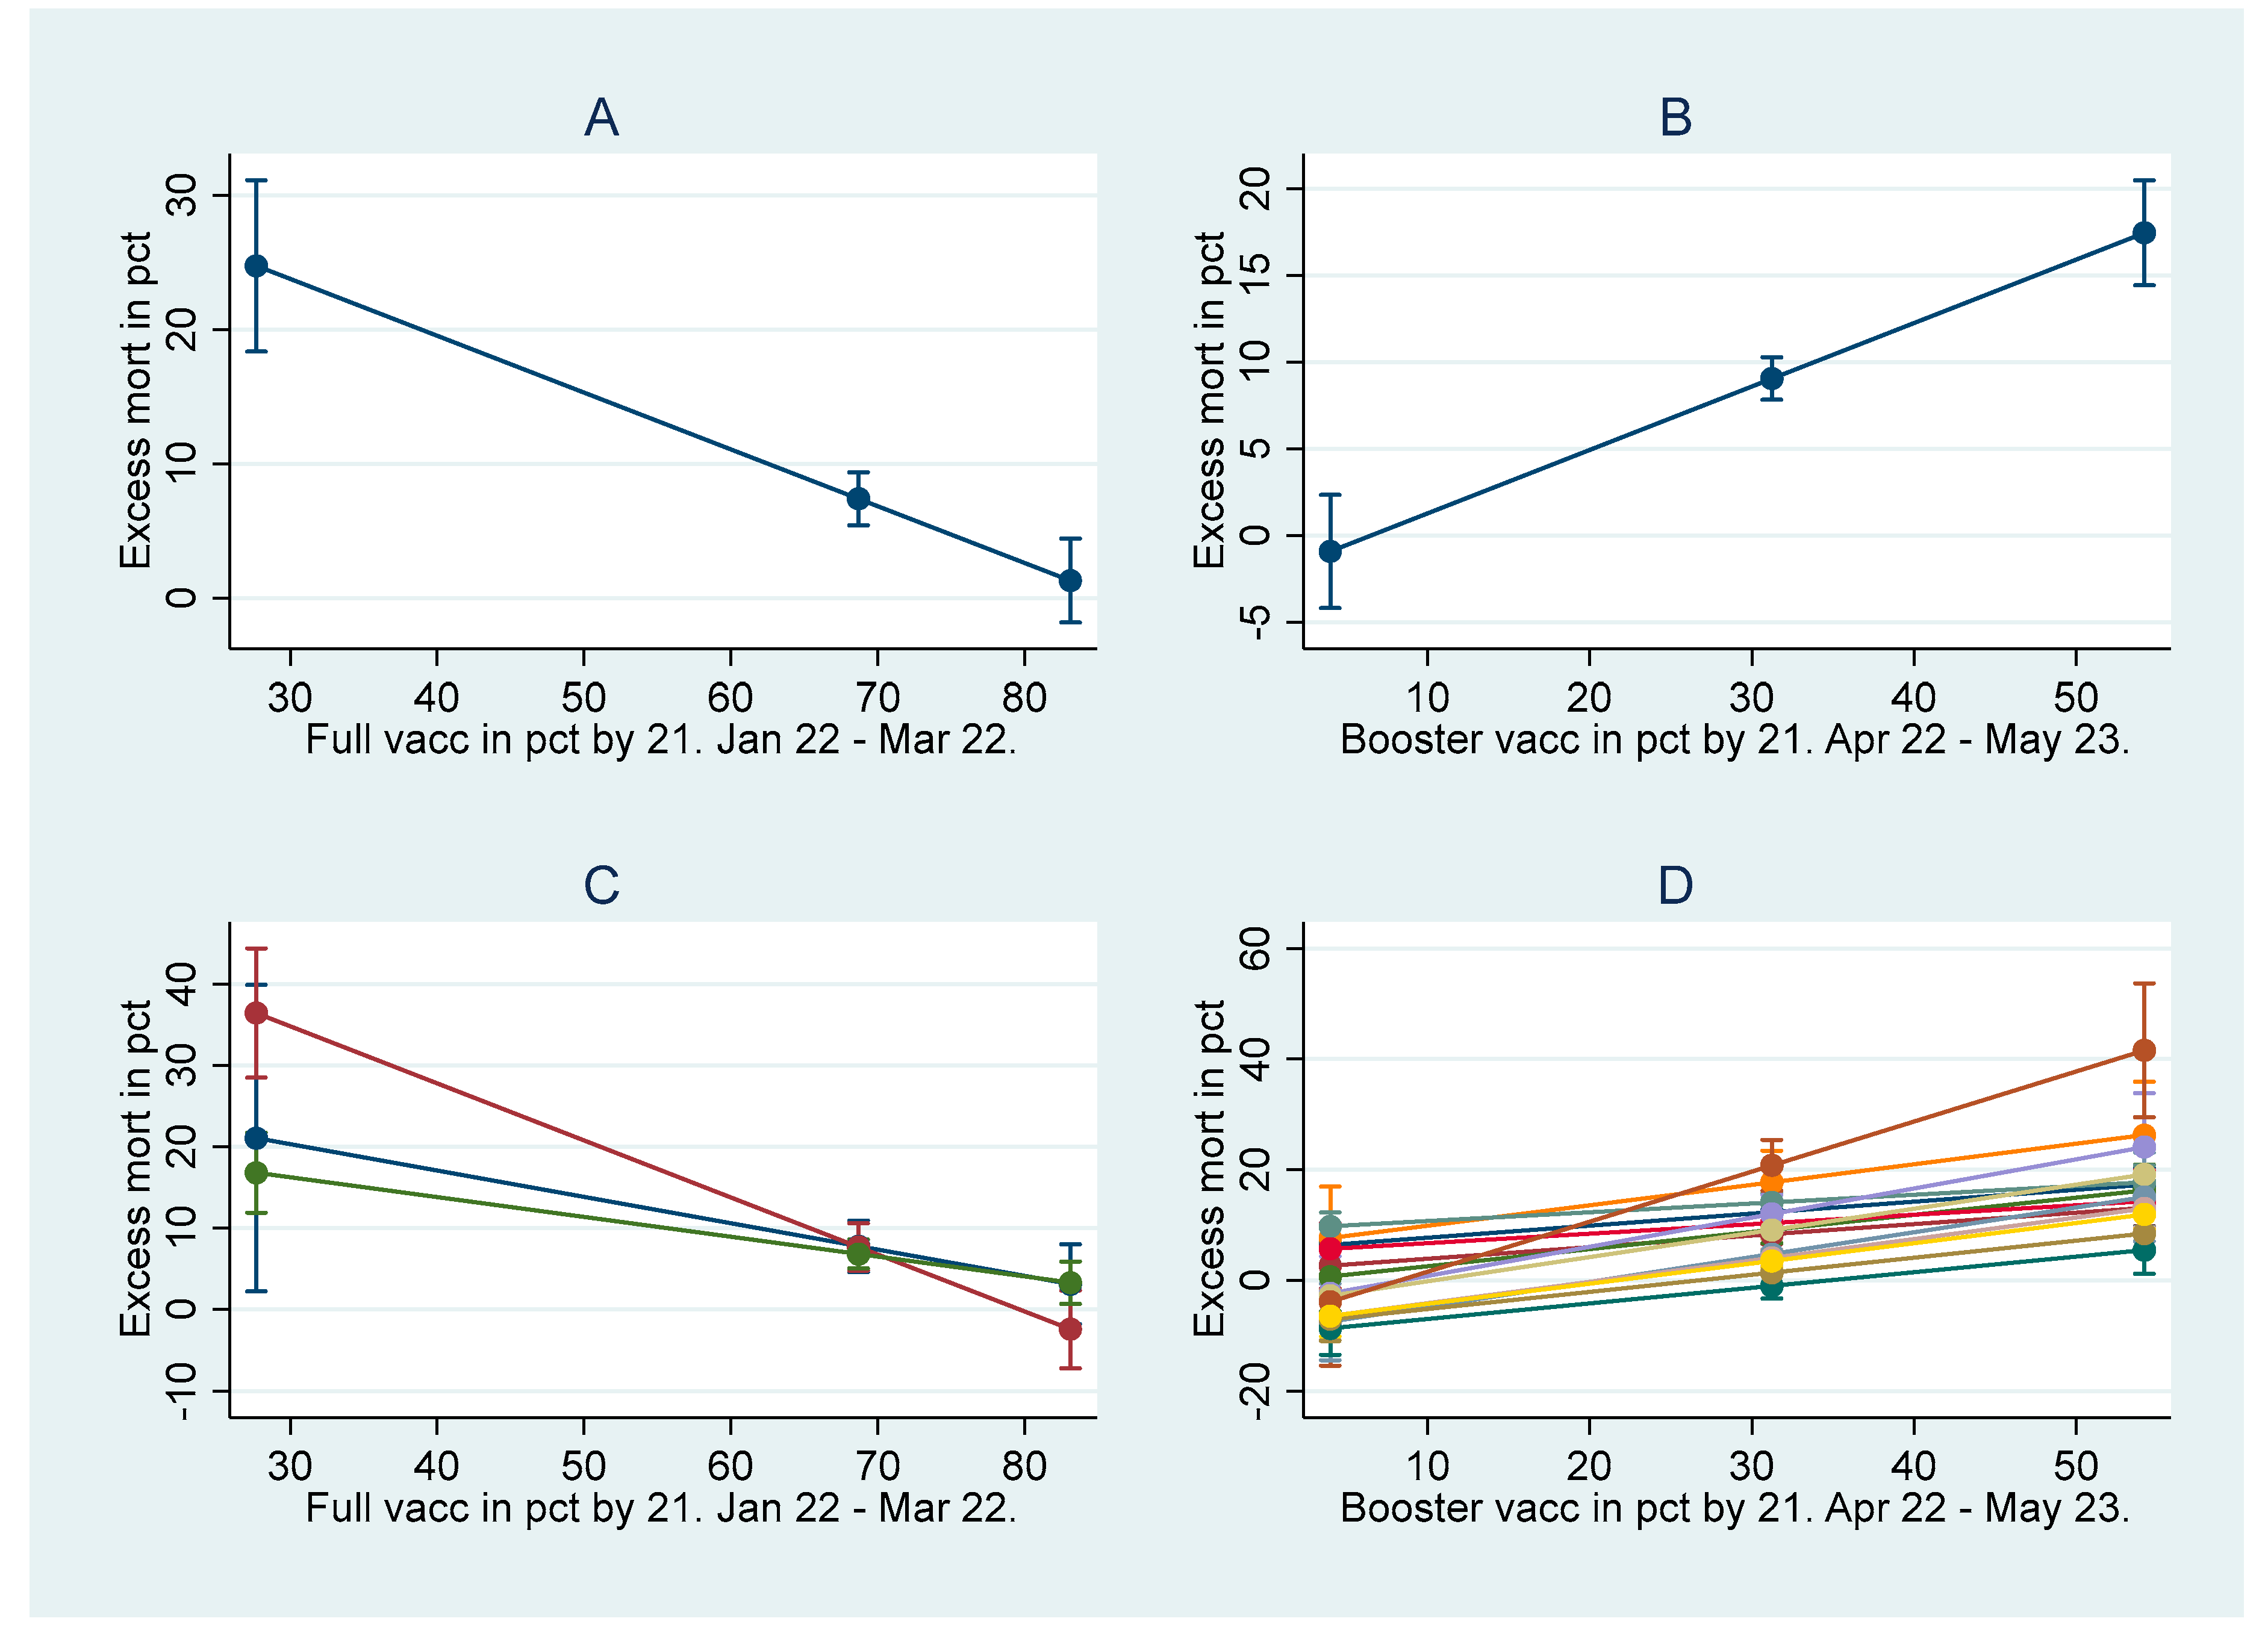
Table 1.
Descriptive statistics concerning the dependent variable, excess mortality. Mean values and standard deviations are weighed by countries’ population size.
Table 1.
Descriptive statistics concerning the dependent variable, excess mortality. Mean values and standard deviations are weighed by countries’ population size.
| Months included | Min | Max | Mean | St dev | Monthly obs |
|---|---|---|---|---|---|
| Jan22-May23 | –27.9 | 54.4 | 8.77 | 8.66 | 526 |
| Jan22-Mar22 | –4.5 | 54.4 | 7.40 | 7.59 | 93 |
| Apr22-May23 | –27.9 | 38.2 | 9.06 | 8.86 | 433 |
| Apr22, May22, Sep22, Oct22, Apr23, May23 | –27.9 | 36.8 | 8.52 | 6.27 | 185 |
Table 2.
Full vaccination uptake, booster vaccination uptake, and countries’ population size. The table is sorted by booster uptake.
Table 2.
Full vaccination uptake, booster vaccination uptake, and countries’ population size. The table is sorted by booster uptake.
| Country | Full vacc | Booster vacc | Population |
|---|---|---|---|
| Bulgaria | 27.7 | 4 | 6951482 |
| Romania | 40.8 | 5.9 | 19328838 |
| Croatia | 53.3 | 13.2 | 4058165 |
| Latvia | 64.9 | 13.7 | 1907675 |
| Poland | 55.8 | 18.4 | 37958138 |
| Slovakia | 48.5 | 20.2 | 5457873 |
| Slovenia | 55.6 | 21.5 | 2095861 |
| Lithuania | 65.7 | 22.6 | 2794090 |
| Finland | 75 | 23.2 | 5525292 |
| Estonia | 61.3 | 24.2 | 1328976 |
| Sweden | 69.3 | 24.3 | 10327589 |
| Switzerland | 67.1 | 25.2 | 8606033 |
| Czechia | 62.2 | 27.7 | 10693939 |
| Netherlands | 67.6 | 27.8 | 17407585 |
| Norway | 73 | 29 | 5367580 |
| Spain | 74.9 | 30.2 | 47332614 |
| Portugal | 83.1 | 30.7 | 10295909 |
| Liechtenstein | 65.4 | 31.1 | 38747 |
| Luxembourg | 68.2 | 31.8 | 626108 |
| Hungary | 61 | 32.4 | 9769526 |
| Italy | 74.9 | 33.5 | 59641488 |
| Cyprus | 69.4 | 33.8 | 888005 |
| Greece | 66.3 | 34.1 | 10718565 |
| France | 73.3 | 36.1 | 67320216 |
| Belgium | 76.2 | 37.9 | 11522440 |
| Germany | 72.8 | 41.4 | 83166711 |
| Ireland | 76.6 | 43.5 | 4964440 |
| Malta | 82.1 | 44.5 | 514564 |
| Austria | 70.4 | 44.7 | 8901064 |
| Denmark | 78.7 | 46.9 | 5822763 |
| Iceland | 76.4 | 54.2 | 364134 |
Table 3.
Descriptive statistics concerning the independent- and control variables. The number of countries included is 31. Mean values and standard deviations are weighed by countries’ population size.
Table 3.
Descriptive statistics concerning the independent- and control variables. The number of countries included is 31. Mean values and standard deviations are weighed by countries’ population size.
| Variable | Min | Max | Mean | St dev |
|---|---|---|---|---|
| Full vacc by the end of 21 | 27.7 | 83.1 | 68.7 | 10.5 |
| Booster vacc by the end of 21 | 4 | 54.2 | 31.2 | 9.88 |
| Avg 2020-2021 mort rel to 16-19 | 101.4 | 126.1 | 112.5 | 5.67 |
| Life expectancy 19 | 75.1 | 84.3 | 81.5 | 2.51 |
| Median age 18 | 36.5 | 47.1 | 43.3 | 2.45 |
| Per capita GDP 19 | 53 | 254 | 101.6 | 24.5 |
N=31.
Table 4.
Correlations concerning the independent- and control variables. The number of countries included is 31. Correlations are weighed by countries’ population size.
Table 4.
Correlations concerning the independent- and control variables. The number of countries included is 31. Correlations are weighed by countries’ population size.
| Full vacc by the end of 21 (1) | 1 | 2 | 3 | 4 | 5 |
| Booster vacc by the end of 21 (2) | 0.827*** | ||||
| Avg. 20-21 mort rel to 16-19 (3) | –0.742*** | –0.750*** | |||
| Life expectancy 19 (4) | 0.857*** | 0.629*** | –0.620*** | ||
| Median age 18 (5) | 0.316† | 0.488** | –0.308† | 0.195 | |
| Per capita GDP 19 | 0.544** | 0.629*** | –0.740*** | 0.515** | 0.168 |
Two-tailed tests of significance. † p < 0.10; * p < 0.05; ** p < 0.01; *** p < 0.001. N=31.
Table 5.
Multilevel mixed-effects random intercept linear regressions with robust standard errors and monthly all-cause mortality as the dependent variable.
Table 5.
Multilevel mixed-effects random intercept linear regressions with robust standard errors and monthly all-cause mortality as the dependent variable.
| Model 1 | Model 2 | Model 3 | Model 4 | Model 5 | Model 6 | |
|---|---|---|---|---|---|---|
| Months included in the analysis | Jan22-Mar22 | Jan22-Mar22 | Jan22-Mar22 | Apr22-May23 | Apr22-May23 | Apr22-May23 |
| FIXED EFFECTS | ||||||
| Intercept | 36.5*** | 19.9*** | 34.4*** | -12.5*** | -2.37 | -6.07 |
| (5.36) | (2.95) | (6.30) | (3.94) | (1.89) | (3.72) | |
| Full vacc by the end of 21 | –0.423*** | –0.351* | 0.314*** | 0.090 | ||
| (0.078) | (0.138) | (0.061) | (0.090) | |||
| Booster vacc by the end of 21 | –0.400*** | –0.092 | 0.366*** | 0.288* | ||
| (0.085) | (0.161) | (0.059) | (0.113) | |||
| RANDOM EFFECTS | ||||||
| Residual | 29.8 | 29.8 | 29.8 | 61.9 | 61.9 | 61.9 |
| (11.3) | (11.3) | (11.3) | (6.22) | (6.21) | (6.21) | |
| Country effect | 8.30 | 12.2 | 8.05 | 5.76 | 3.57 | 3.29 |
| (5.76) | (7.81) | (5.89) | (2.34) | (2.64) | (2.31) | |
| Wald χ2 | 29.3*** | 22.0*** | 28.5*** | 26.2*** | 38.6*** | 44.4*** |
| Log pseudo-likelihood | –4.46e9 | –4.50e9 | –4.45e9 | –2.25e10 | –2.24e10 | –2.24e10 |
| Monthly observations | 93 | 93 | 93 | 433 | 433 | 433 |
| Variance inflation factor | 3.16 | 3.17 |
Estimates are weighted by countries’ population size, and I report robust standard errors in parentheses concerning the fixed effects. For fixed effects, I also report conservative two-tailed tests of significance. † p < 0.10; * p < 0.05; ** p < 0.01; *** p< 0.001.
Table 6.
Multilevel mixed-effects random intercept linear regressions with robust standard errors and monthly all-cause mortality as the dependent variable. Months included are Jan 22 to Mar 22.
Table 6.
Multilevel mixed-effects random intercept linear regressions with robust standard errors and monthly all-cause mortality as the dependent variable. Months included are Jan 22 to Mar 22.
| Model 1 | Model 2 | Model 3 | Model 4 | |
|---|---|---|---|---|
| FIXED EFFECTS | ||||
| Intercept | –3.05 | –13.7 | 50.0** | 37.7*** |
| (26.6) | (40.0) | (15.9) | (5.02) | |
| Full vacc by the end of 2021 | –0.310** | –0.576*** | –0.397*** | –0.316*** |
| (0.098) | (0.138) | (0.079) | (0.084) | |
| Avg. 2020-2021 mort rel to 2016-2019 | 0.282 | |||
| (0.187) | ||||
| Life expectancy 2019 | 0.745 | |||
| (0.585) | ||||
| Median age 2018 | –0.356 | |||
| (0.380) | ||||
| Per capita GDP 2019 | –0.085* | |||
| (0.037) | ||||
| RANDOM EFFECTS | ||||
| Residual | 29.8 | 29.8 | 29.8 | 29.8 |
| (11.3) | (11.3) | (11.3) | (11.3) | |
| Country effect | 7.19 | 7.40 | 7.64 | 5.39 |
| (6.20) | (5.46) | (6.11) | (4.88) | |
| Wald χ2 | 38.9*** | 35.2*** | 29.5*** | 38.9*** |
| Log pseudo-likelihood | –4.44e9 | –4.44e9 | –4.459 | –4.42e9 |
| Variance inflation factor | 2.23 | 3.76 | 1.11 | 1.42 |
Estimates are weighted by country size in population by Jan 1, 20, and I report robust standard errors in parentheses concerning the fixed effects. For fixed effects, I also report conservative two-tailed tests of significance. † p < 0.10; * p < 0.05; ** p < 0.01; *** p< 0.001. The number of monthly observations is 93.
Table 7.
Multilevel mixed-effects random intercept linear regressions with robust standard errors and monthly all-cause mortality as the dependent variable. Weighted by countries’ population size. Months included are Apr 22 to May 23.
Table 7.
Multilevel mixed-effects random intercept linear regressions with robust standard errors and monthly all-cause mortality as the dependent variable. Weighted by countries’ population size. Months included are Apr 22 to May 23.
| Model 1 | Model 2 | Model 3 | Model 4 | |
|---|---|---|---|---|
| FIXED EFFECTS | ||||
| Intercept | 7.10 | –28.6 | –12.7 | –4.63* |
| (19.5) | (25.6) | (8.83) | (2.28) | |
| Booster vacc by the end of 21 | 0.334*** | 0.311** | 0.334*** | 0.300*** |
| (0.092) | (0.094) | (0.063) | (0.078) | |
| Avg. 2020-2021 mort rel to 16-19 | –0.075 | |||
| (0.152) | ||||
| Life expectancy 19 | 0.343 | |||
| (0.339) | ||||
| Median age 18 | 0.262 | |||
| (0.220) | ||||
| Per capita GDP 19 | 0.043 | |||
| (0.027) | ||||
| RANDOM EFFECTS | ||||
| Residual | 61.9 | 61.9 | 61.9 | 61.9 |
| (6.21) | (6.22) | (6.22) | (6.21) | |
| Country effect | 3.49 | 3.12 | 3.25 | 2.94 |
| (2.58) | (2.04) | (2.68) | (2.27) | |
| Wald χ2 | 36.1*** | 39.4*** | 45.6*** | 41.9*** |
| Log pseudo-likelihood | –2.24e10 | –2.24e10 | –2.24e10 | –2.24e10 |
| Variance inflation factor | 2.30 | 1.66 | 1.31 | 1.66 |
Estimates are weighted by countries’ population size by Jan 1, 20, and I report robust standard errors in parentheses concerning the fixed effects. For fixed effects, I also report conservative two-tailed tests of significance. † p < 0.10; * p < 0.05; ** p < 0.01; *** p< 0.001. The number of monthly observations is 433.
Table 8.
The monthly associations between 21 full- and booster vaccination uptake, respectively, and excess mortality. .
Table 8.
The monthly associations between 21 full- and booster vaccination uptake, respectively, and excess mortality. .
| Year | Month | Full vacc assoc with mort | Booster vacc assoc with mort |
|---|---|---|---|
| 22 | Jan | –0.324 (0.214) [–0.761, 0.113] | –0.315 (0.220) [–0.764, 0.135] |
| Feb | –0.702*** (0.106) [–0.919, –0.484] | –0.712*** (0.127) [–0.973, –0.452] | |
| Mar | –0.244*** (0.061) [–0.369, –0.119] | –0.172* (0.069) [–0.314, –0.031] | |
| Apr | 0.136* (0.058) [0.018, 0.254] | 0.218** (0.061) [0.094, 0.341] | |
| May | 0.277*** (0.057) [0.159, 0.394] | 0.209** (0.067) [0.071, 0.346] | |
| Jun | 0.383*** (0.091) [0.196, 0.569] | 0.311** (0.101) [0.104, 0.519] | |
| Jul | 0.585** (0.153) [0.273, 0.897] | 0.371* (0.158) [0.047, 0.694] | |
| Aug | 0.141* (0.051) [0.036, 0.246] | 0.159** (0.047) [0.063, 0.254] | |
| Sep | 0.105 (0.075) [–0.048, 0.259] | 0.172† (0.100) [–0.033, 0.376] | |
| Oct | 0.317* (0.141) [0.030, 0.604] | 0.527** (0.160) [0.200, 0.855] | |
| Nov | 0.341** (0.091) [0.154, 0.527] | 0.437*** (0.081) [0.272, 0.602] | |
| Dec | 0.607* (0.247) [0.101, 1.11] | 0.907*** (0.226) [0.444, 1.369] | |
| 23 | Jan | 0.145† (0.145) [–0.035, 0.557] | 0.450** (0.138) [0.168, 0.731] |
| Feb | 0.354*** (0.065) [0.220, 0.488] | 0.282** (0.079) [0.120, 0.445] | |
| Mar | 0.265** (0.074) [0.114, 0.416] | 0.309*** (0.059) [0.188, 0.430] | |
| Apr | 0.280*** (0.069) [0.138, 0.422] | 0.388*** (0.056) [0.273, 0.502] | |
| May | 0.321*** (0.073) [0.172, 0.470] | 0.372*** (0.058) [0.254, 0.491] |
The estimates are weighted by the countries’ population size. I report robust standard errors in parentheses and 95% CIs in brackets. Also, I report conservative two-tailed tests of significance. † p < 0.10; * p < 0.05; ** p < 0.01; *** p< 0.001. N=31, except for May 23 when N=30 (due to missing data from Italy that month).
Disclaimer/Publisher’s Note: The statements, opinions and data contained in all publications are solely those of the individual author(s) and contributor(s) and not of MDPI and/or the editor(s). MDPI and/or the editor(s) disclaim responsibility for any injury to people or property resulting from any ideas, methods, instructions or products referred to in the content. |
© 2023 by the authors. Licensee MDPI, Basel, Switzerland. This article is an open access article distributed under the terms and conditions of the Creative Commons Attribution (CC BY) license (http://creativecommons.org/licenses/by/4.0/).
Copyright: This open access article is published under a Creative Commons CC BY 4.0 license, which permit the free download, distribution, and reuse, provided that the author and preprint are cited in any reuse.


