
Submitted:
15 August 2023
Posted:
16 August 2023
You are already at the latest version
Abstract
Four-polarisation camera was used to map absorbance of olivine micro-grains before and after high temperature annealing (HTA). It is shown that HTA of olivine xenolith at above 1200∘C in O2 flow makes it magnetised. Different mode of operation of polariscope with polarisation control before and after the sample in transmission and reflection modes was used. The reflection type was assembled for non-transparent samples of olivine after HTA. Sample for optical observation in transmission was placed on an achromatic plastic quarter-wavelength waveplate as a sample holder. Inspection for sample’s birefringence (retardance) as well as absorbance can be made. A best fit of transmitted intensity or transmittance T (hence absorbance A=−log10T) becomes accessible by simple best-fit using only three orientations (from measured four orientations by the camera). When intensity of transmitted light at one of the orientations was very low due to cross-polarised condition (polariser-analyser arrangement), the three-points fit can be used. Three-point fit in transmission and reflection modes was validated for T(θ)=Amp×cos(2θ−2θshift)+offset, where amplitude Amp, offset offset and orientation azimuth θshift are extracted for each pixel via the best fit.
Keywords:
Anisotropy
; polarisation analysis
; Stokes parameters
; polarimetry
; olivine
1. Introduction
Color is one of the most popular qualitative inspection tools in microscopic observation of minerals. Cross-polarised imaging together with full-wave nm or nm waveplates inserted at orientation to the cross-Nikol setup are utilised to make vivid colors which represent optical retardance. For example, the 530 nm wavelength is blocked in cross-Nikol setup with such waveplate, while the other RGB colors experience different retardance causing magenta colored background (no sample). Color determines the presence of , i.e., birefringence , and total difference in optical thickness due to physical thickness d at the location on the sample. More information can be extracted using images taken at different linear polarisations, e.g., the absorbance from the measured transmittance can be determined, here are the transmitted and incident intensities, respectively. However, due to unevenness of natural samples, imaging at different sample’s (or polariser) orientations bring about lateral shifts as well as distortions into image. This limits application potential of imaging at different polarisations when either sample or polariser has to be rotated between image acquisitions.
Motivation of this study was to use polarisation-resolved imaging at visible wavelengths m and comparable resolution for mapping complex morphologies of naturally occurring micro-crystals, typical for research in mineral resource exploration, volcanic lava flows or fallout particles from eruptions, meteorites, etc. Usually, such 0.1-1 mm grains are analysed at IR wavelengths at the chemical fingerprinting spectral range of m (in wavenumbers cm), where spatial resolution is markedly reduced . Moreover, the crystalline and glass absorption at specific phonon modes defining micro-volumes of specific materials/crystals is carried out even at the longer wavelengths in THz domain with wavenumbers cm or m at a further reduced spatial resolution. Here, we use high optical resolution imaging with the resolution at m to identify structure and morphology changes due to inhomogeneous composition, grain, boundaries, mass density swirls, etc., which plays a paramount importance in formation of new phases and materials during annealing. Optical images of high quality and resolution with revealed anisotropy in absorbance, retardance, or reflectance can be correlated with IR-THz maps (chemical, phonon) taken at low spatial resolution and combined/correlated with Raman and Brillouin imaging of (visco)mechanical/elastic properties at micro-scale [1,2]. We have demonstrated that anisotropies in absorption and/or retardance can be detected via orientation azimuth angles even when spatial resolution is more than ten times lower [3,4]. This makes comparison of anisotropy mapping at 100 times different resolutions a potentially useful tool for correlations throughout the visible-IR-THz spectra (m). As a protypype sample, we used a volcanic xenolith of olivine (Fe,Mg)2SiO4 (Mortlake, Australia). Olivine, as the major constituent of Earth’s mantle, contributes Fe to its core defining the Earth’s magnetic properties. We show here that olivine in xenolith becomes magnetised after high temperature annealing (HTA) above 1300C in O2 flow. Current hypothesis suggests that Mg-rich olivine (forsterite) has precipitation of magnetite Fe3O4 (FeFeO) along the defects and crystallite boundaries, similar to those observed in volcanic olivines at 600C and 900C HTA under O2 environment [5]. Complex phase modifications between Fe-oxides and silicates are expected including formation of magnetic FeO which has IR active absorption bands [6,7]. The same orientation-resolved optical technique, proposed in this study, is applicable to the analysis of orientation in femtosecond laser induced nano-crystallisation inside multi-layered nano-stacks [8].
Here, we take advantage of the recently introduced 4-polarisation cameras with wire grid polarisers integrated directly onto the pixels of a CMOS sensor. This allows for simultaneous detection of intensity at four orientations and access to anisotropy of retardance and absorbance mapping, i.e., the absolute value and its azimuth (orientation). In the case of absorption-dominated transmission changes, it is shown that a cos-fit can be used for each pixel of the camera and can be made using only three points (three from four polarisation images). This technique is shown for transmission and reflection modes using natural olivine micro-crystals, but it is fully transferable to other polarisation-resolved imaging techniques, e.g., bio-medical [9,10], 3D optical coherent tomography [11,12], analysis of structural colors in natural materials [13], and industrial applications such as edge detection of fast moving materials and workpieces [14].
2. Method and samples
We use -level grey scale CMOS camera (CS505MUP1 Thorlabs) for imaging at the visible spectral range. The camera was setup on a Nikon OptoPhot-pol microscope for polarisation resolved measurements and imaging. It is noteworthy that a circular polariser, usually set just in front of a CCD or CMOS camera to homogenise the image, is required to be removed for imaging with the 4-pol. camera.
2.1. Method: detection of anisotropy
Linear dichroism or azimuthal dependence of absorption of linearly polarised light is usually measured by changing the orientation of incident polarisation and measuring (or imaging) the transmitted signal. For an absorber oriented at angle , the absorbance is defined [15]:
Here, we adopt such technique, only the measurement is carried out with non-polarised or circularly polarised incident light and detected at selected four polarisations with 4-pol. camera. In the case of circular polarisation, this assumes no circular dichroism exists within the sample. With 4-pol. camera, four images are directly acquired in a single acquisition while the incident light is non-polarised (isotropic random). This is a fast (instantaneous) imaging technique and useful for monitoring and imaging of fast changing events in real time, e.g., phase transitions induced by laser heating or applied pressure in a diamond anvil cell.
By setting the circular polarisation at the IN-port (RHC or LHC) and without the waveplate before the 4-pol. camera, it is possible to measure absorbance A image using Eqn. 1.
With linearly polarisation illuminated onto the sample , the setup to measure birefringence and absorbance anisotropies is realised [16] (Figure 1(a)); i.e., a typical polariser-analyser arrangement only using 4-pol. camera. Since absorbance is -folded (same absorbance at 0 and ), while birefringence has a twice higher angular frequency, the fit function to account for the two contributions in transmittance is conveniently chosen as:
where and are the amplitudes related to absorbance and retardance contributions, and are the orientation dependent angles (which can be different for the two anisotropies), and are their corresponding offsets. Using , a normalised form expression of Eqn. 2 for the absorbance part becomes . The last term defines the -angle averaged transmittance and the corresponding absorbance is . The absorption coefficient is found from the optical density as , where d is the thickness of the sample.
Figure 1.
(a) Transmission setup with 4-pol. camera for measurements of absorbance and transmittance for characterisation of a micro-grain of olivine. (b) Optical images of transmitted light at four polarisations. Measurements were carried out with linearly polarised illumination and 4-pol. detection (the achromatic plate is aligned with linear polariser and is used as sample holder). This setup can be used for retardance and absorbance measurements. Circular polariser is realised by a pair of plate and plate at angle to orientation of the (plastic-pair, Edmund optics).
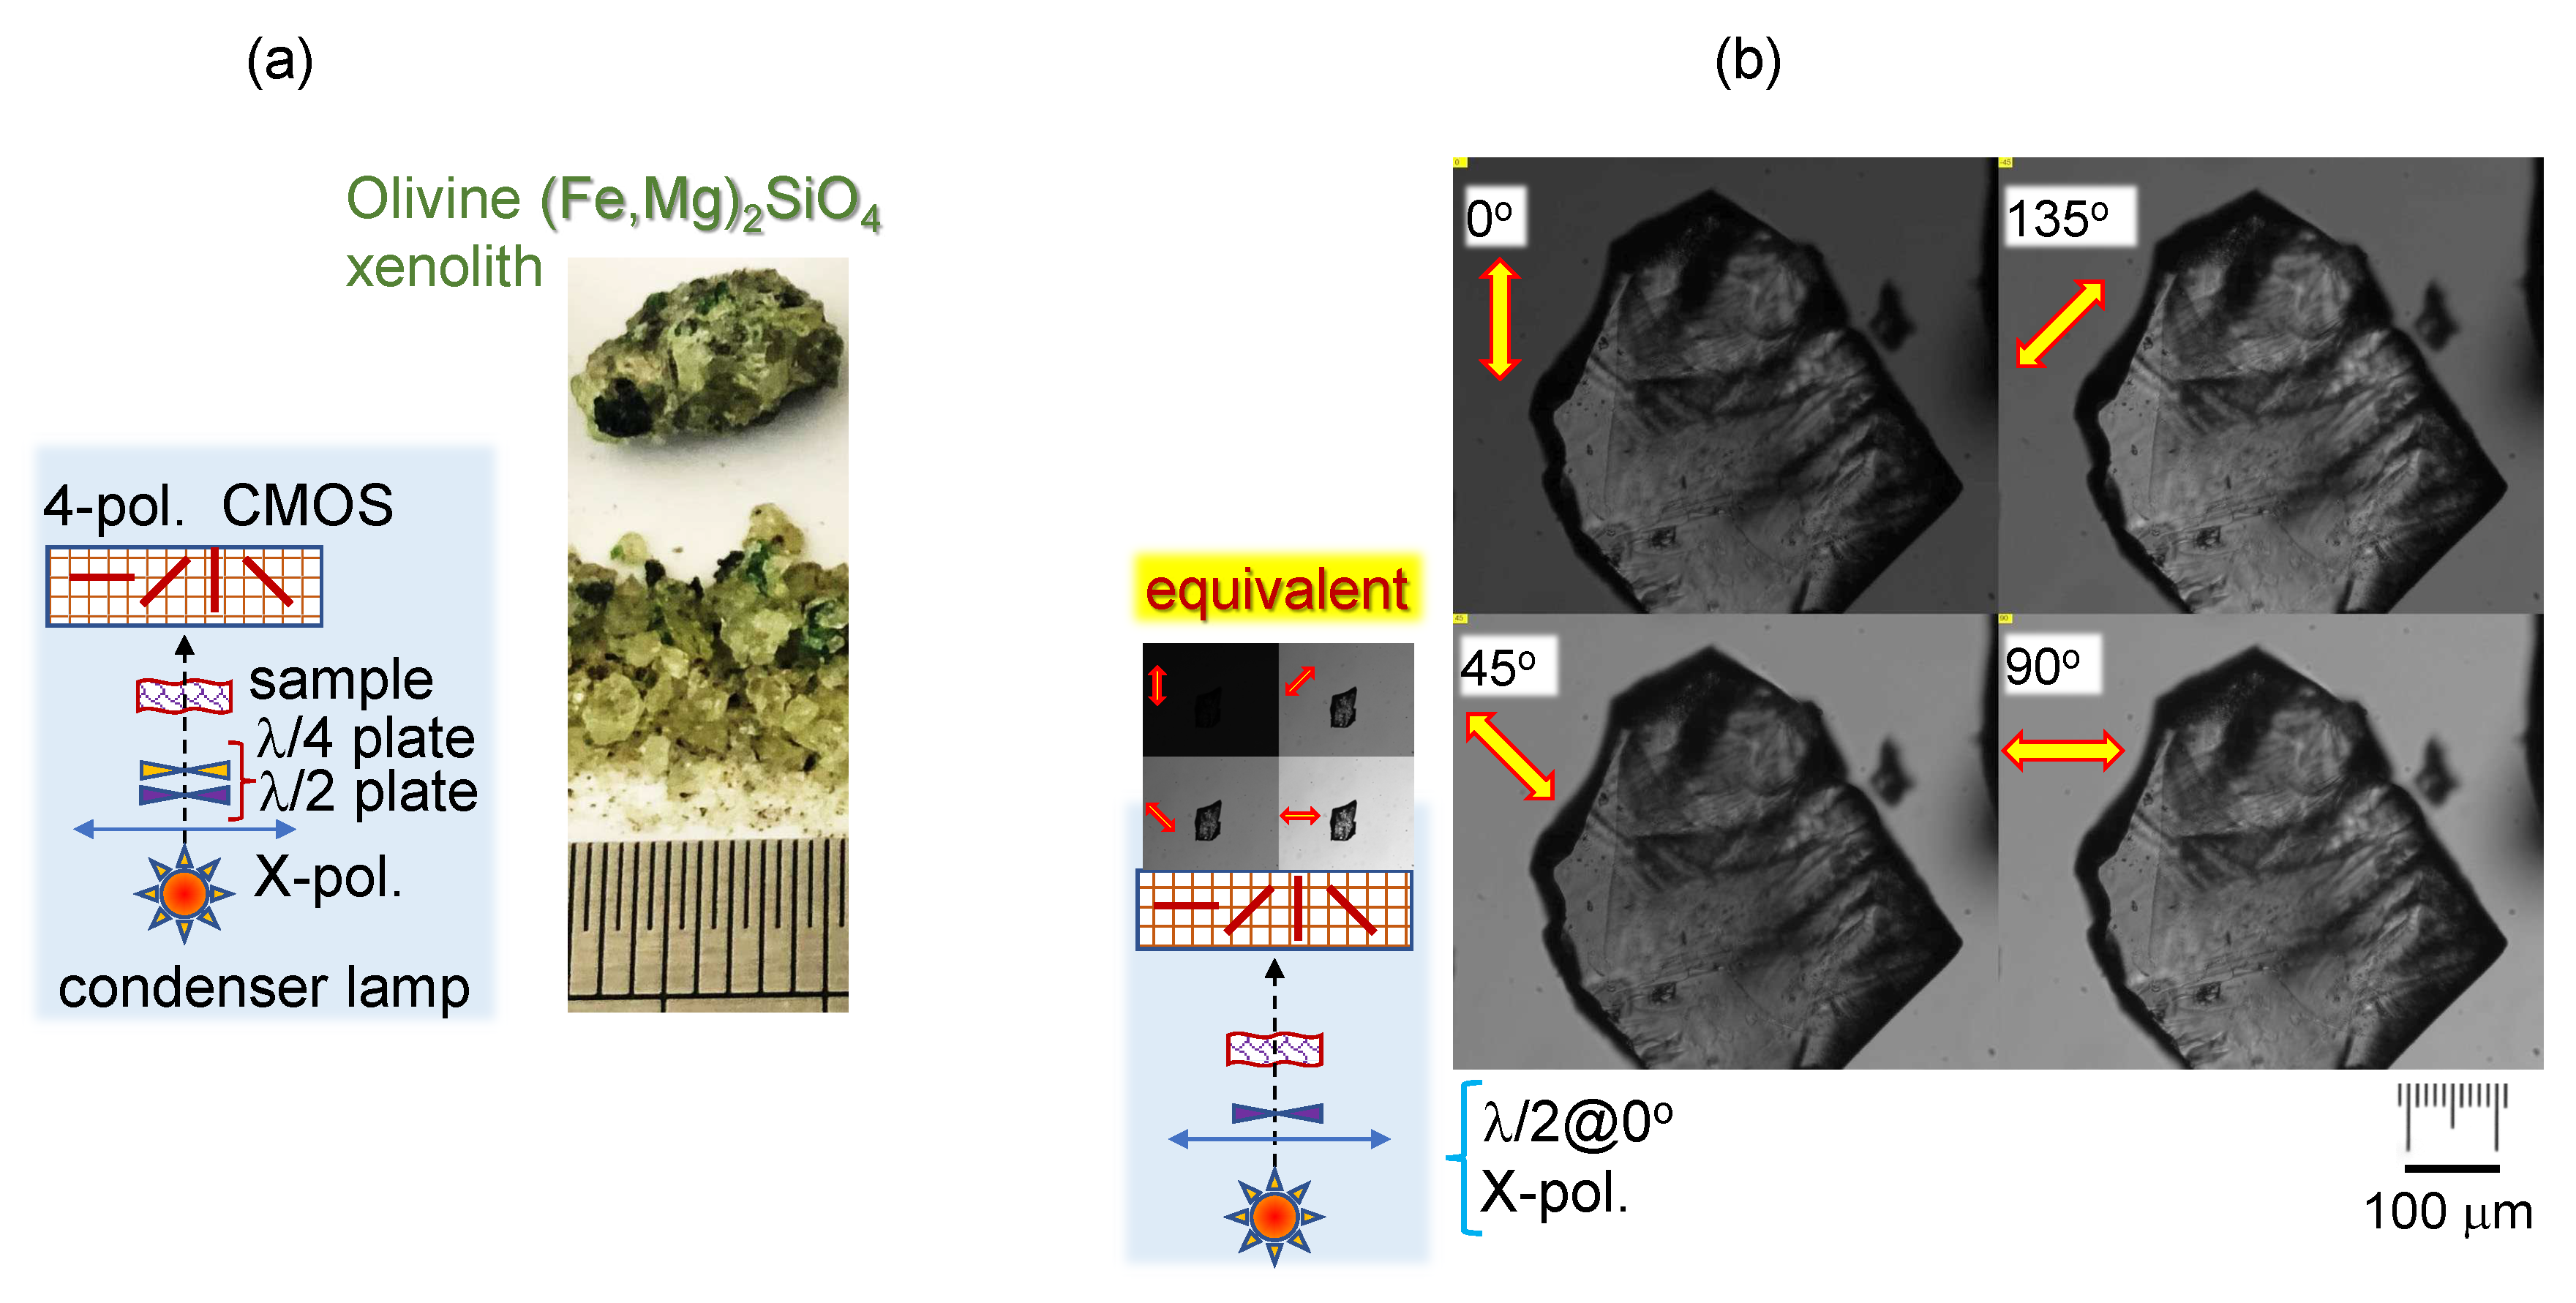
Figure 2.
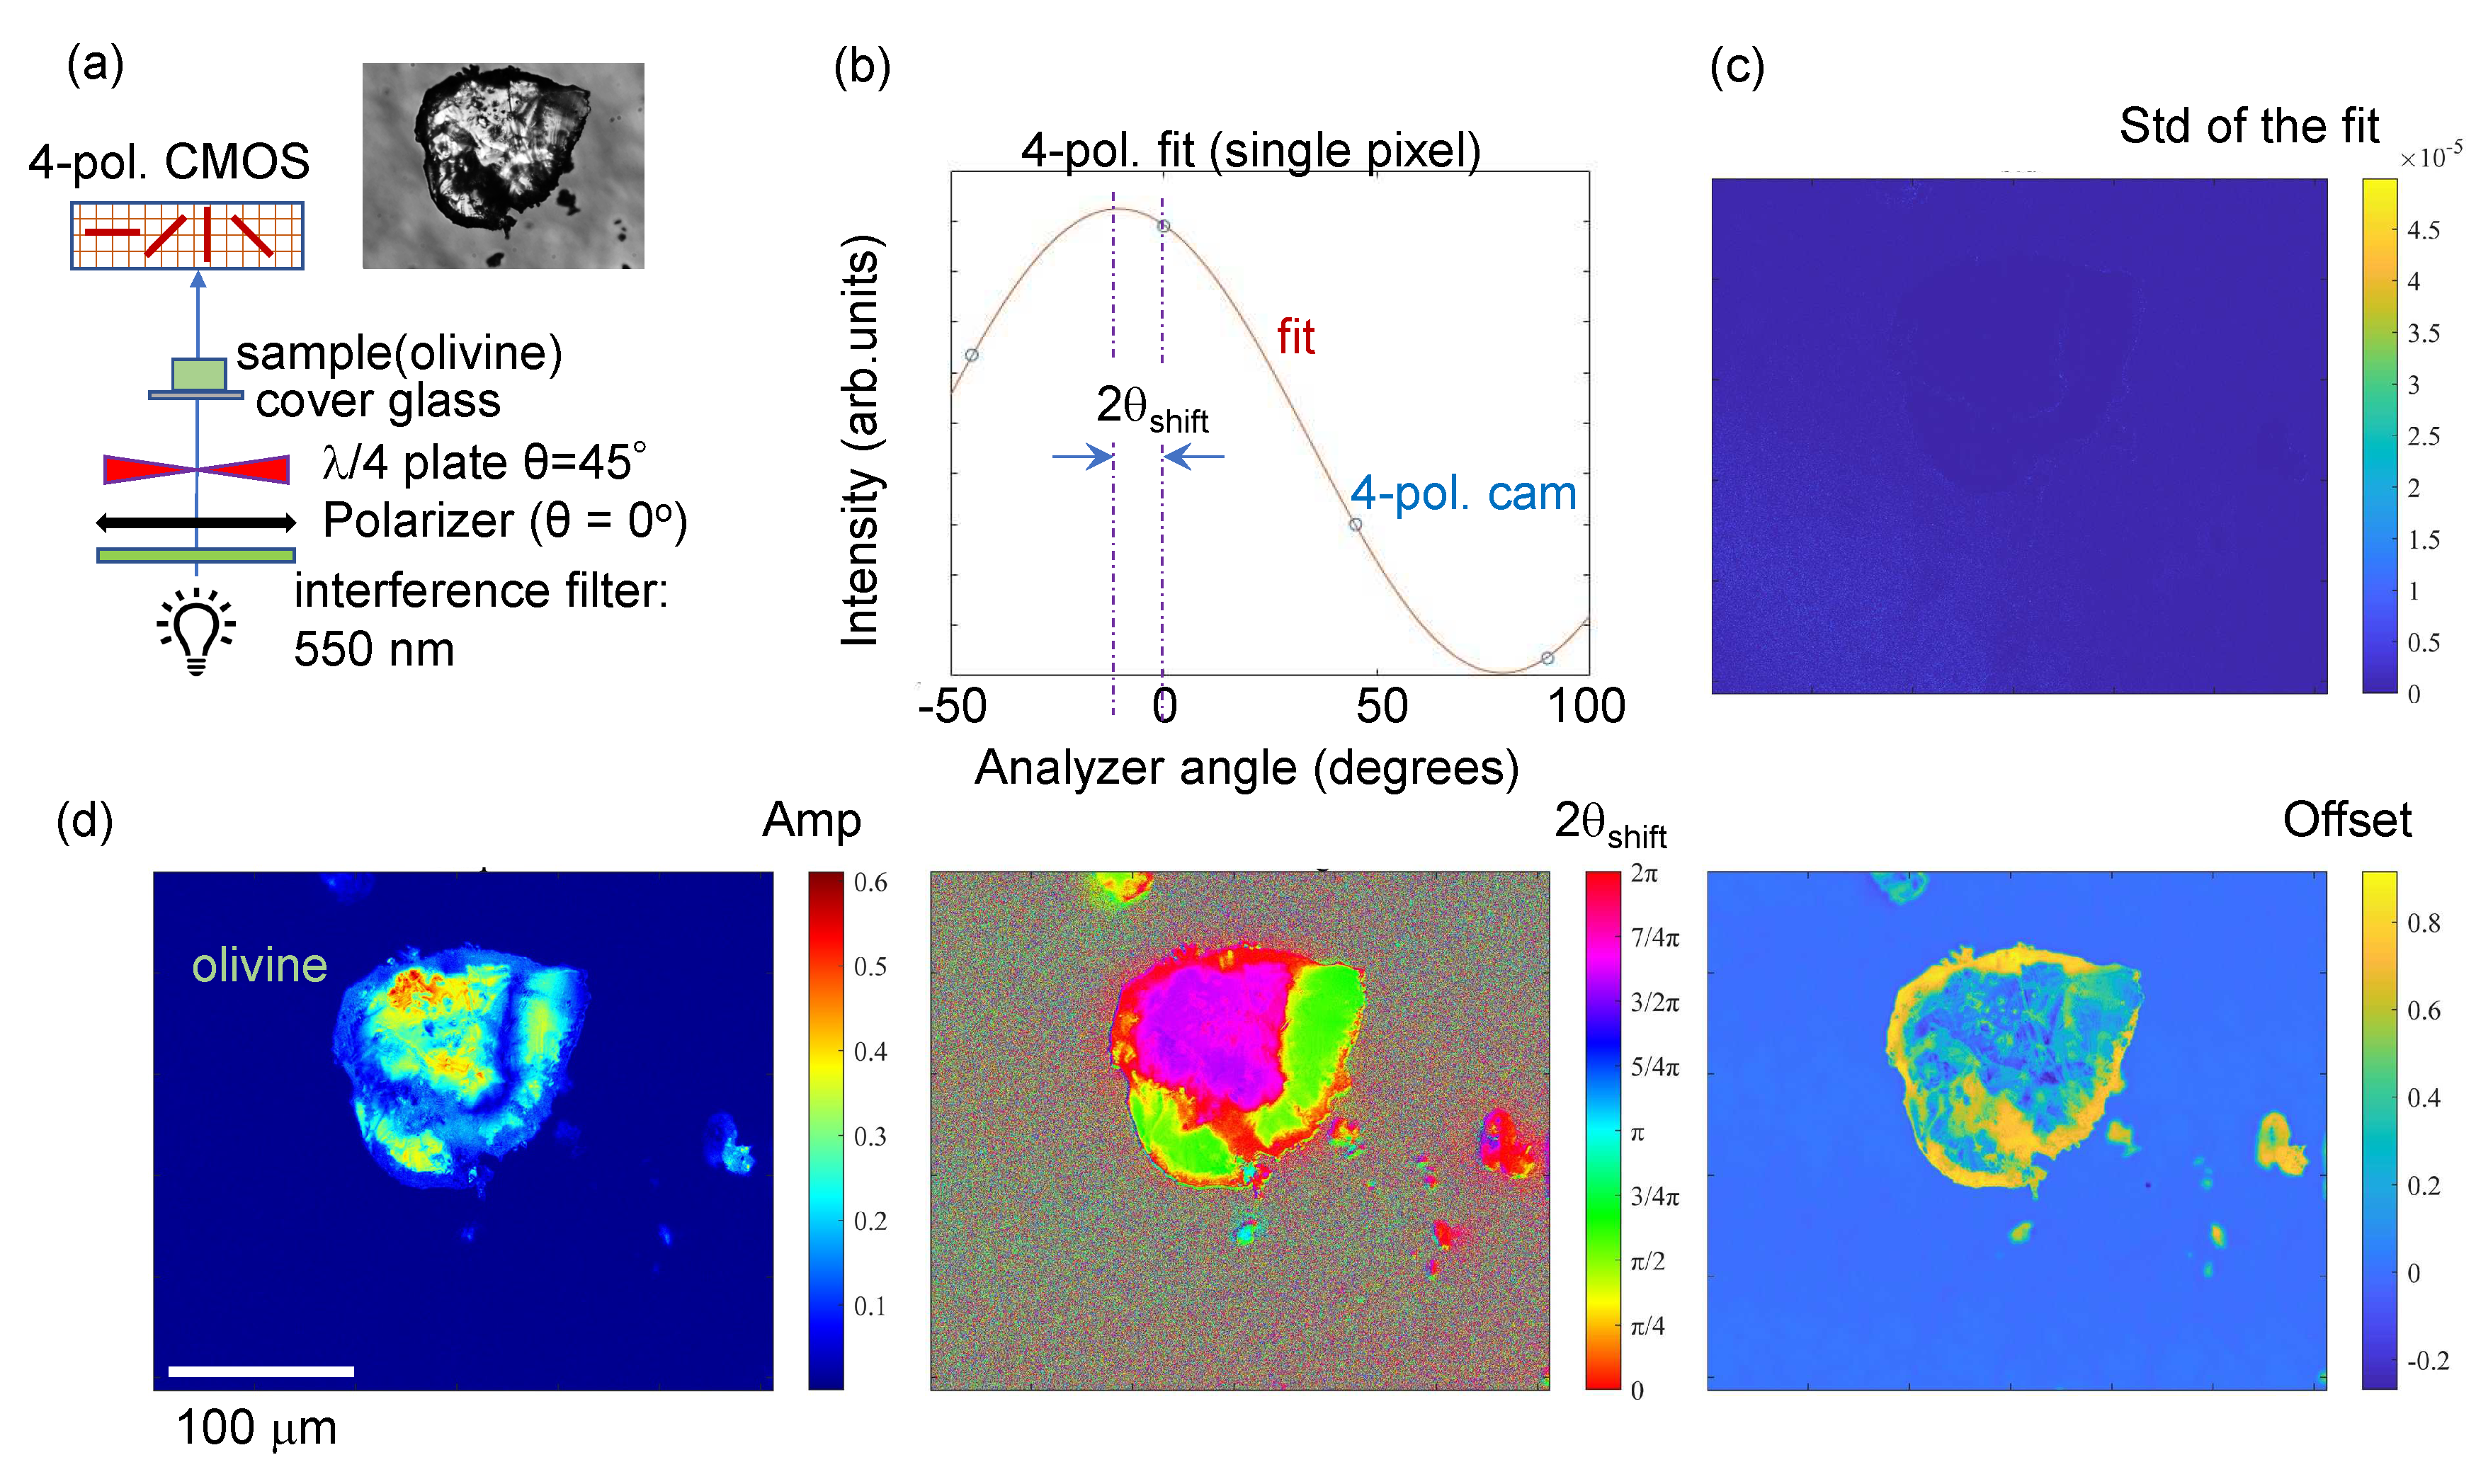
Absorbance measurements of an olivine micro-particle. (a) Absorbance measurement with a linearly polarised illumination and 4-pol. detection. A pair of and makes an achromatic plastic circular polariser (Edmund optics) at -orientation; it corresponds to the linearly polarised illumination (the x-pol. of the microscope condenser). (b) Optical image of olivine micro-grain by a combined intensity of the 4-pol. camera. Illumination was set circular using single plastic plate (Edmund optics) at orientation and 550 nm band pass filter ( nm). (c) Absorbance spectra for two distinct experimental results selected from (d) to illustrate the fit. The amplitude and offset values were retrieved from the best fit. Four-markers at 4-pol. camera orientation are shown. (d) The fit results for each pixel for the values of , , and over a selected region of interest (ROI). The orientation corresponds to the largest absorbance.
Figure 2.
Absorbance measurements of an olivine micro-particle. (a) Absorbance measurement with a linearly polarised illumination and 4-pol. detection. A pair of and makes an achromatic plastic circular polariser (Edmund optics) at -orientation; it corresponds to the linearly polarised illumination (the x-pol. of the microscope condenser). (b) Optical image of olivine micro-grain by a combined intensity of the 4-pol. camera. Illumination was set circular using single plastic plate (Edmund optics) at orientation and 550 nm band pass filter ( nm). (c) Absorbance spectra for two distinct experimental results selected from (d) to illustrate the fit. The amplitude and offset values were retrieved from the best fit. Four-markers at 4-pol. camera orientation are shown. (d) The fit results for each pixel for the values of , , and over a selected region of interest (ROI). The orientation corresponds to the largest absorbance.
2.2. Mueller matrices used for modeling of transmittance
The Mueller matrix formalism was used to test transmittance of the -plate using 4-pol. camera. The polarizer at the angle of is given by Mueller matrix [17]:
The matrix corresponds to the wire grid polarizer on the pixel of CMOS detectors at 4-pol. angles are set on each quadrant of the camera at , respectively. A retarder, e.g., a plate or the sample, with the phase retardance of and retardance azimuth of is given :
A quarter-wave plate with phase retardance is added. The quarter-wave plate aligned along direction is given by (follows from Eqn. 4):
The incident light was set to the horizontal (x-direction) so that it can be described by the Stokes vector . Finally, the output light (Stokes vector) detected by CMOS 4-pol. camera is the solution of the following matrix equation (sample is represented by ):
The last two terms in Eqn. 6 for the linear-horizontal incident polarisation (x-pol.) onto -plate at angles define the Stokes vector of light incident onto the sample:
With this simplification and use of sample’s (retarder) expression with the 4-pol. analyser angles in polariser matrix , one obtains the output intensity at the 4-pol. camera (the Stokes parameter measured experimentally).
2.3. Annealed olivine samples
The samples in this study were volcanic olivine xenolith (Mortlake, Victoria, Australia; Figure 1(a)). Sub-mm grains of olivine were high-temperature annealed (HTA) at C for 1-2 hours. Such HTA treatment made the samples magnetised in the presence of O2 flow.
The HTA was carried out using a Nabertherm tube furnace. Figure 7 shows sample annealed at 1500C for 2 hours in O2 flow. Magnetisation of samples was evident by their strong attraction to Nb- or Sm-magnets. The O2 flow was required for initial weakly magnetic olivine xenolith samples ((Fe,Mg)2SiO4 xenolith from Mortlake, Victoria, Australia) to become magnetised; the smallest micro-grains only were attracted to Nd-magnet in the case of pristine olivine, while large samples with cross section of sub-cm were attracted to the same magnet after HTA. The origin of magnetisation is under investigation and it is out of the scope of this study focused on the optical polariscopy. Several temperatures were tested for HTA in the range of 600-1200C (600, 800, 1000, 1200C) in O2 flow. However, samples were not magnetised even when they changed color at above 900, possibly due to a hematite -Fe2O3 formation [18]. Even after HTA at the highest 1500C temperatures, samples were maintaining their grainy structure without turning into glassy substance solidified from a molten phase. For optical polariscopy, annealed olivine xenolith was hammer smashed into micro-/macro-particles aiming at tens-of-micrometers in size, which can also be partly transparent. Those micro-particles were magnetised, as revealed by their ordering on a slide glass (1 mm thick) using Sm-Co and Nd-magnets (Figure 6(a)).
3. Results and Discussion
3.1. Four-polarisation detection of transmitted intensity
Figure 1(a) shows the setup for realisation of polariser-analyser and one analyser measurement in the transmission mode for linear or circular polarisation incident onto the sample. Such setup is sensitive to both retardance and absorbance (b) and only absorbance, when equivalent of two or one polariser is utilised. Noteworthy, the setup with a circularly polarised light (isotropic in terms of polarisation incident onto the sample) can be used to measure linear dichroism if there is no circular dichroim in the sample; i.e., the polaristion-isotropic incident light is prepared by a linear polariser and achromatic waveplate at orientation (Figure 1). Images taken by 4-pol. camera using an achromatic plate aligned with linearly polarised incident light show four different images (Figure 1(b)); plastic polariser was used as a sample holder. For some mutual orientations of the sample and waveplate, one of the 4-images has low intensity (cross-polarised; see inset in (b)). As it is shown later, even three images acquired at three orientations are enough for the best fit and extraction of orientation azimuth of absorbers.
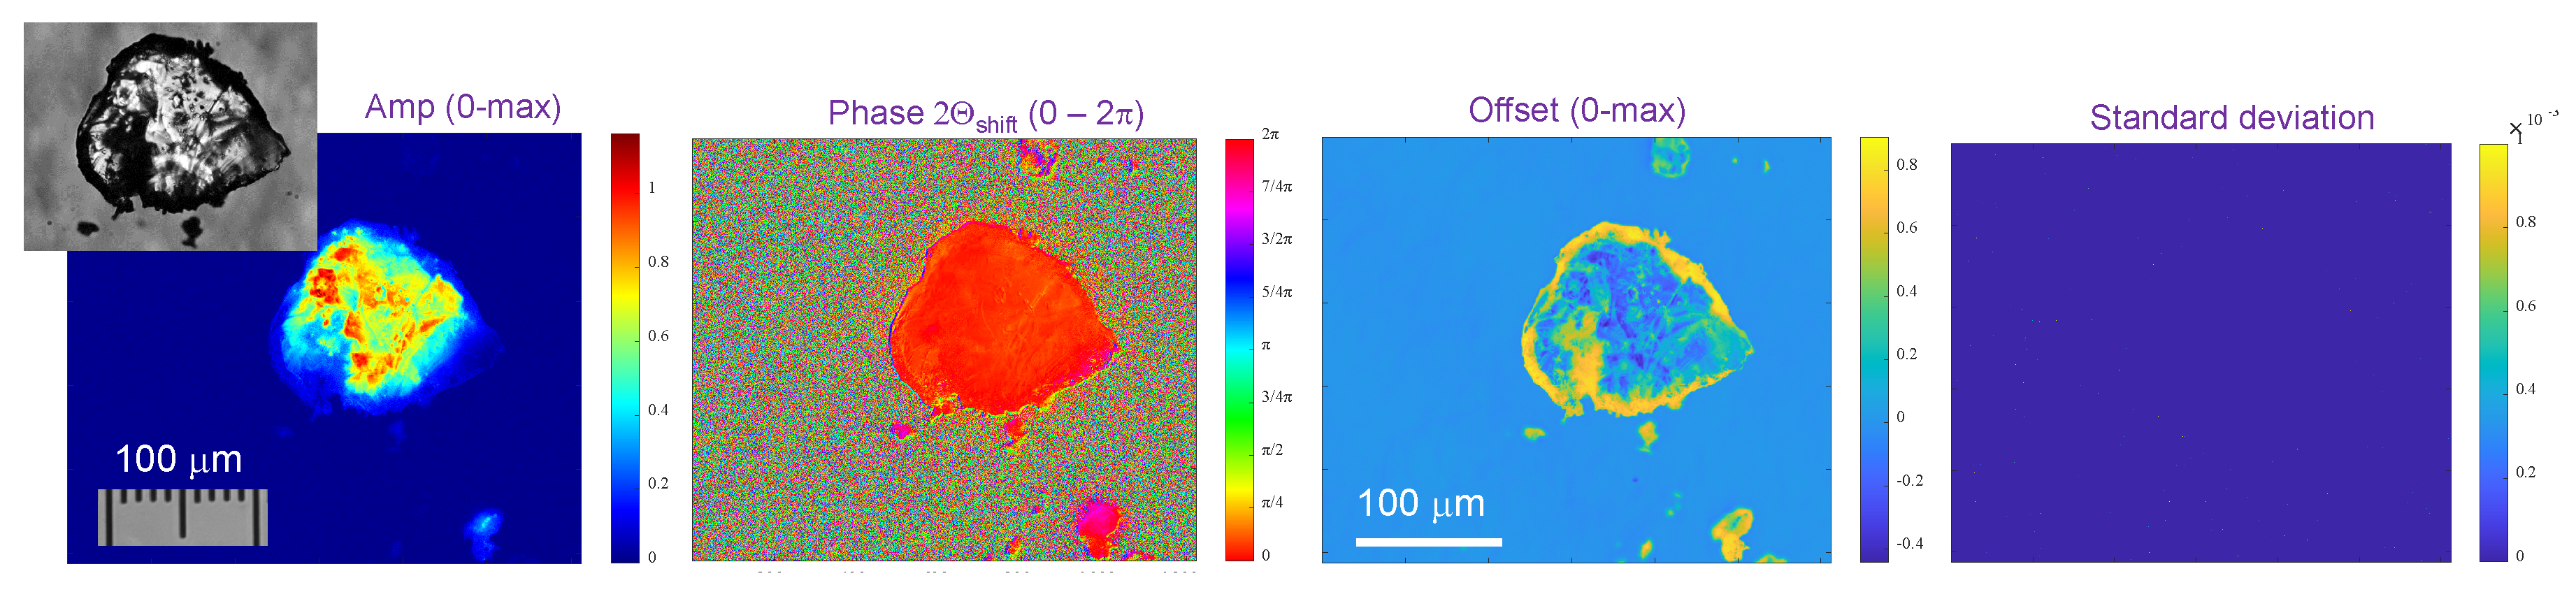
Equation 1 was applied for absorbance plot at each pixel under circularly polarised illumination of olivine micro-particle (Figure 3). A waveplate was used to set circularly polarised light and 550 nm filter with nm bandwidth. The best fit was carried out for the amplitude , the azimuth of absorber angle and the offset for single pixel using Matlab. In the fit, there were regions with negative offset, which correspond to a phase change (). The strong absorbance near edges (low and high ) is due to light scattering contribution since collection of light corresponded to the angle defined by the numerical aperture of the objective lens (Nikon). Resolution defined as radius of the Airy disk of a plane wave focusing was m at green nm wavelength.
The described 4-pol. imaging with a 4-points absorbance fit (Eqn. 2) under isotropic incident polarisation (circular or random) provides a map of average optical density , its amplitude and azimuthal orientation of absorbers at the pixel level. The quality of the fit is judged by the standard deviation map . Figure 3 shows the results of such presentation. For the high fidelity fit, there was no difference in at the regions with and without micro-grain (c) with (maximum intensity offset and amplitude values were ). The same procedure can be carried out at different wavelengths. Under illumination of the sample with isotropic polarisation, all four images on 4-pol. camera have intensity values satisfactory for the fit at four values of . However, for the case of linearly polarised illumination, one segment of 4-pol. camera fit usually has too small values of intensity (see dark segment in the inset of Figure 1(b)) and calculation of absorbance (it is a ratio) makes unreliable fit. In such case, only three values can be used to extract three parameters , as described next.
Figure 3.
(a) Setup for sample’s illumination by a circular polarisation (isotropic) illumination and 4-pol. camera imaging. (b) Four-points fit of absorbance . (c) The standard deviation of the intensity fit : , with i being index for 4-pol. angles. (c) Maps for best fit parameters amplitude , phase azimuth and are shown in corresponding panels for the circularly polarised illumination. Offset had no bounds defined for the fit and the angle was bound to range during fitting procedure.
3.2. Three-points fit of 4-pol. camera images
When the two-polariser system is used on the IN- and OUT-ports (a cross Nicol) sensitive to retardance as well as absorbance changes, there was a large difference in intensity of 4-pol. camera segments (Figure 1(b)). The best fit of transmitted intensity was carried out with a generic expression and is shown in Figure 4 for linearly polarised illumination at two different orientations of a -plate. The absorption azimuth is close to or , which, for a randomly chosen micro-grain implies the absence of preferential orientation. This is understandable since olivine is transparent in visible spectral range (see the central inset in Figure 1). Importantly, the use of four intensity images for calculation on Transmittance using the acquired images was not successful due to very low intensity in one of the quadrant images; it was even checked to not have a division by zero error. However, for the fit by a harmonic cos-function with three parameters, only three points are enough and allows for the extraction of single pixel transmittance , hence, absorbance . The obtained maps from 3-angles fit are shown in Figure 4. This procedure relies on the three highest intensity points measured (from the four points of the 4-pol. camera).
The three-points best fit by was also carried out for a linear incident polarisation using a -plate at 0 degrees (Figure 5). In this fit the condition only for positive values of was enforced and also , as expected for the absorption dominated azimuthal transmission. The 3-point fit was closely matching the calculated absorbance given by Eqn. 1 (Figure 2(d)) for the circularly polarised (polarisation isotropic) case. The 3-point fit at highest intensity values of the 4-pol. camera images is validated for and plates.
3.3. Annealed olivine under reflection (3-points) polariscopy
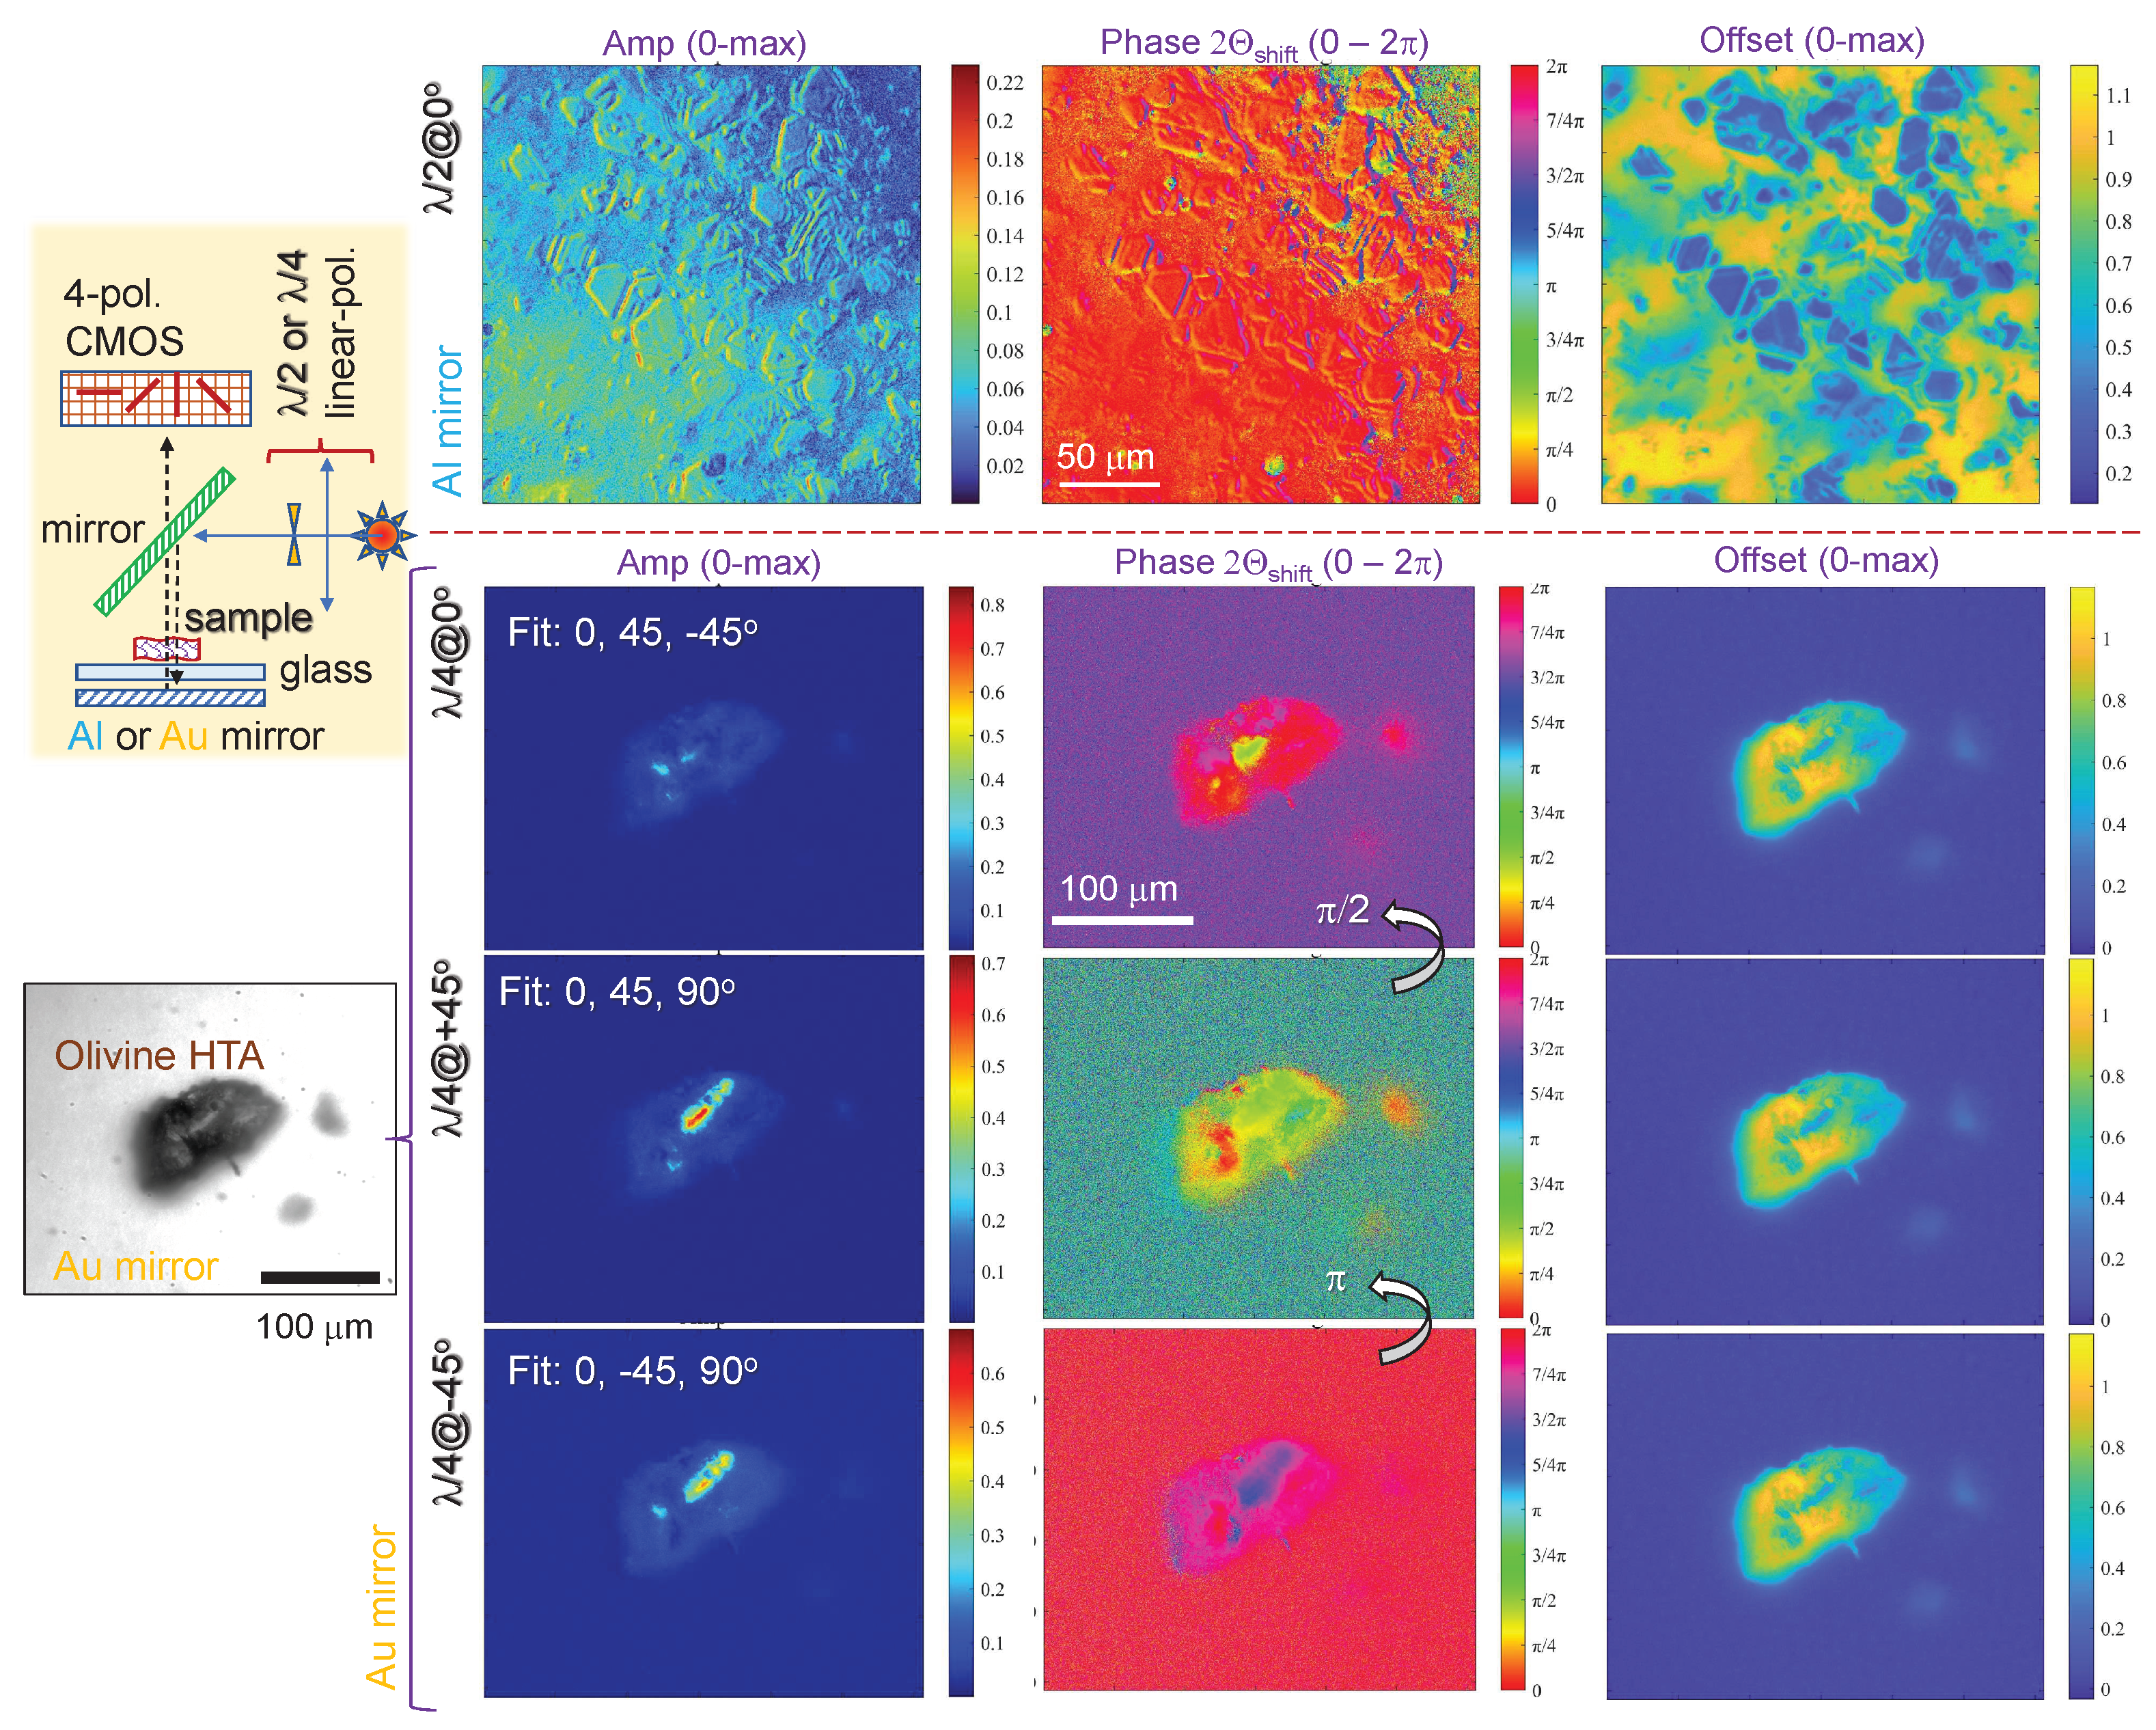
The samples of olivine xenolith were annealed at 1500C temperature for 2 hours in O2 flow. This made them magnetic as shown in Figure 6(a) before mechanical fragmentation. After fragmetation, magnetic particles/grains were assembled using a Nd-magnet (NdFeB; washer type) placed on Sm-Co magnet (disk-type). Since HTA-olivine turned not optically transparent with black-brown appearance, a reflection-type microscopy was used for polarisation analysis using 4-pol. camera (Figure 6(b)). Two achromatic waveplates were used at the IN- and OUT-ports with the sample placed on an Al-foil (or Au mirror) serving as a back-reflecting mirror. The waveplates were crossed by orientation of their slow axis, hence, compensating phases of each other. They were used for qualitative inspection if an optical activity or circular dichroism exist in semi-transparent parts of the HTA olivine. For reflection microscopy under linear polarisation, the orientation of the or waveplate was set at (slow axis aligned with linear polariser at the IN-port). In such a case, no waveplate was used before the 4-pol. detector (OUT-port).
Figure 6.
High temperature annealing (HTA) of olivine xenolith. (a) Sample annealed at 1500C for 2 hours hold on a magnet rod (left) and after its fragmentation (right). Micro-/mili-grains of HTA olivine were gathered by a magnets placed below slide glass for microscopy observation. (b) A reflection-type microscope assembly used for this study (setup on Nikon Optiphot-pol). Two plastic achromatic waveplates were used to have capability to detect circular dichroism or optical activity. Slow axis of the plates were crossed and linear polariser was rotated to setup righ or left circular polarisations (RCP/LCP), respectively. Convention of sign was for the anti-clockwise rotation of the linear polariser at the IN-port (see inset in (b)).
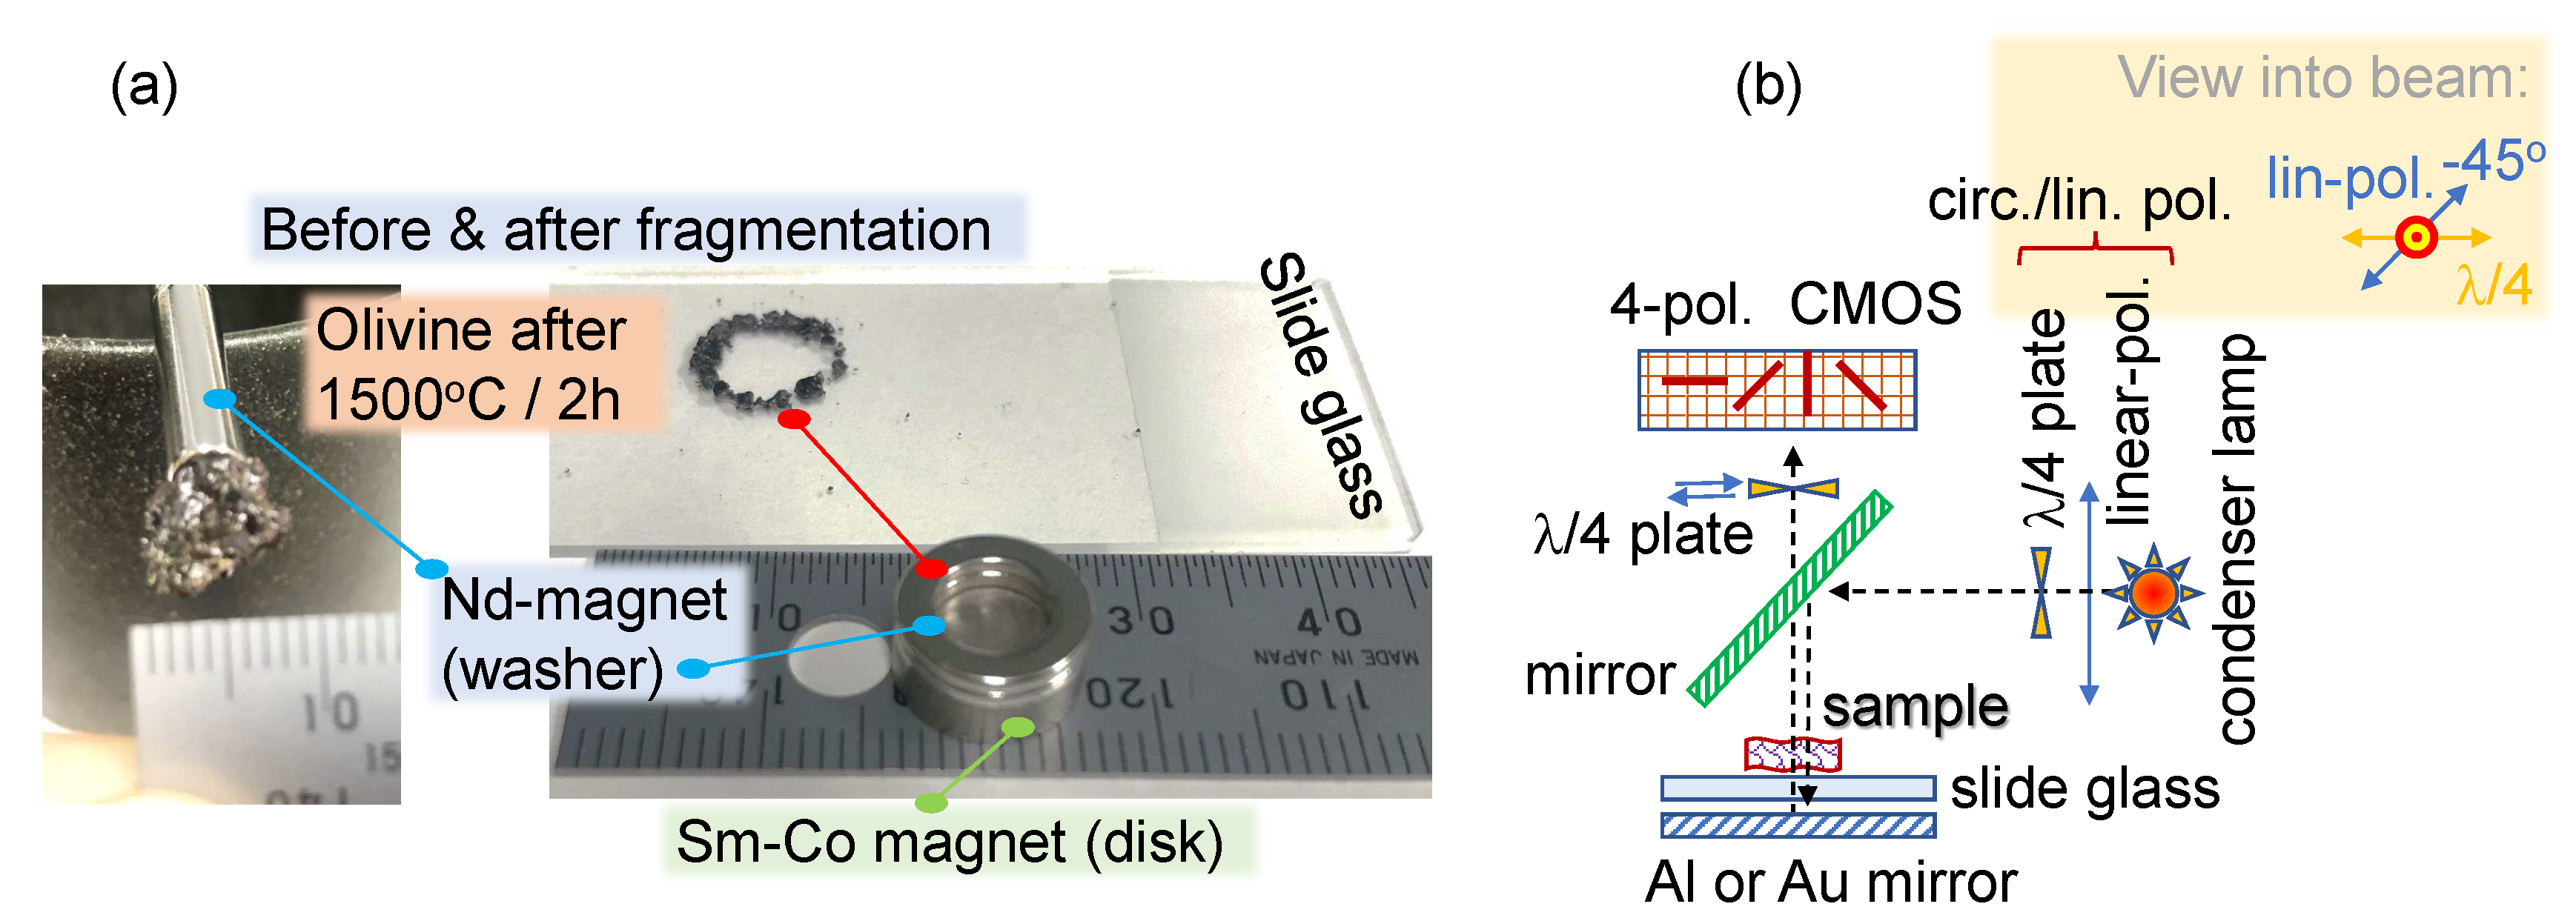
Figure 7 shows optical images of HTA olivine in O2 with clearly visible micro-crystallites in a dark rock. When N2 flow was used, there where almost no coloration change. This sample was fractioned to produce a small grain of sub-1 mm in size. The grain was captured with Nd-magnet (washer) to confirm its magnetisation and was brought into optical path for reflectance measurements. The same 3-points fitting procedure shown for transmittance was applied for reflectance. Figure 8 shows the fitting results. Micro-crystallites on a larger ( mm) olivine are recognised by their edges (top-row in Figure 8). For illumination by circularly polarised light plate was used and a smaller grain was set on a Au mirror (Figure 8). The color of the phase map shows change of the background between 0 and orientations of the plate. As we showed earlier, the structure patterns can be recognised in reflection/scattering mode imaging with the same camera even when optical resolution was poor for the small feature size [19]. For quantitative measurement of reflectance R, gold coated (∼60 nm) cover glass was used as a reference (or as a sample holder). A simpler setup for RHC and LHC polarisations can be made using plastic polariser films (CIR RH or LH, Edmund optics), which are combined polariser and pairs.
Figure 7.
High temperature annealing (HTA) of olivine xenolith. Optical images at increasing maginification (left-to-right) of a sample annealed at 1500C for 2 hours in O2 flow. The left inset shows typical olivine macro-grains before annealing. The right-inset shows photo of samples after HTA 1500C for 2 hours in O2 and N2 flow.
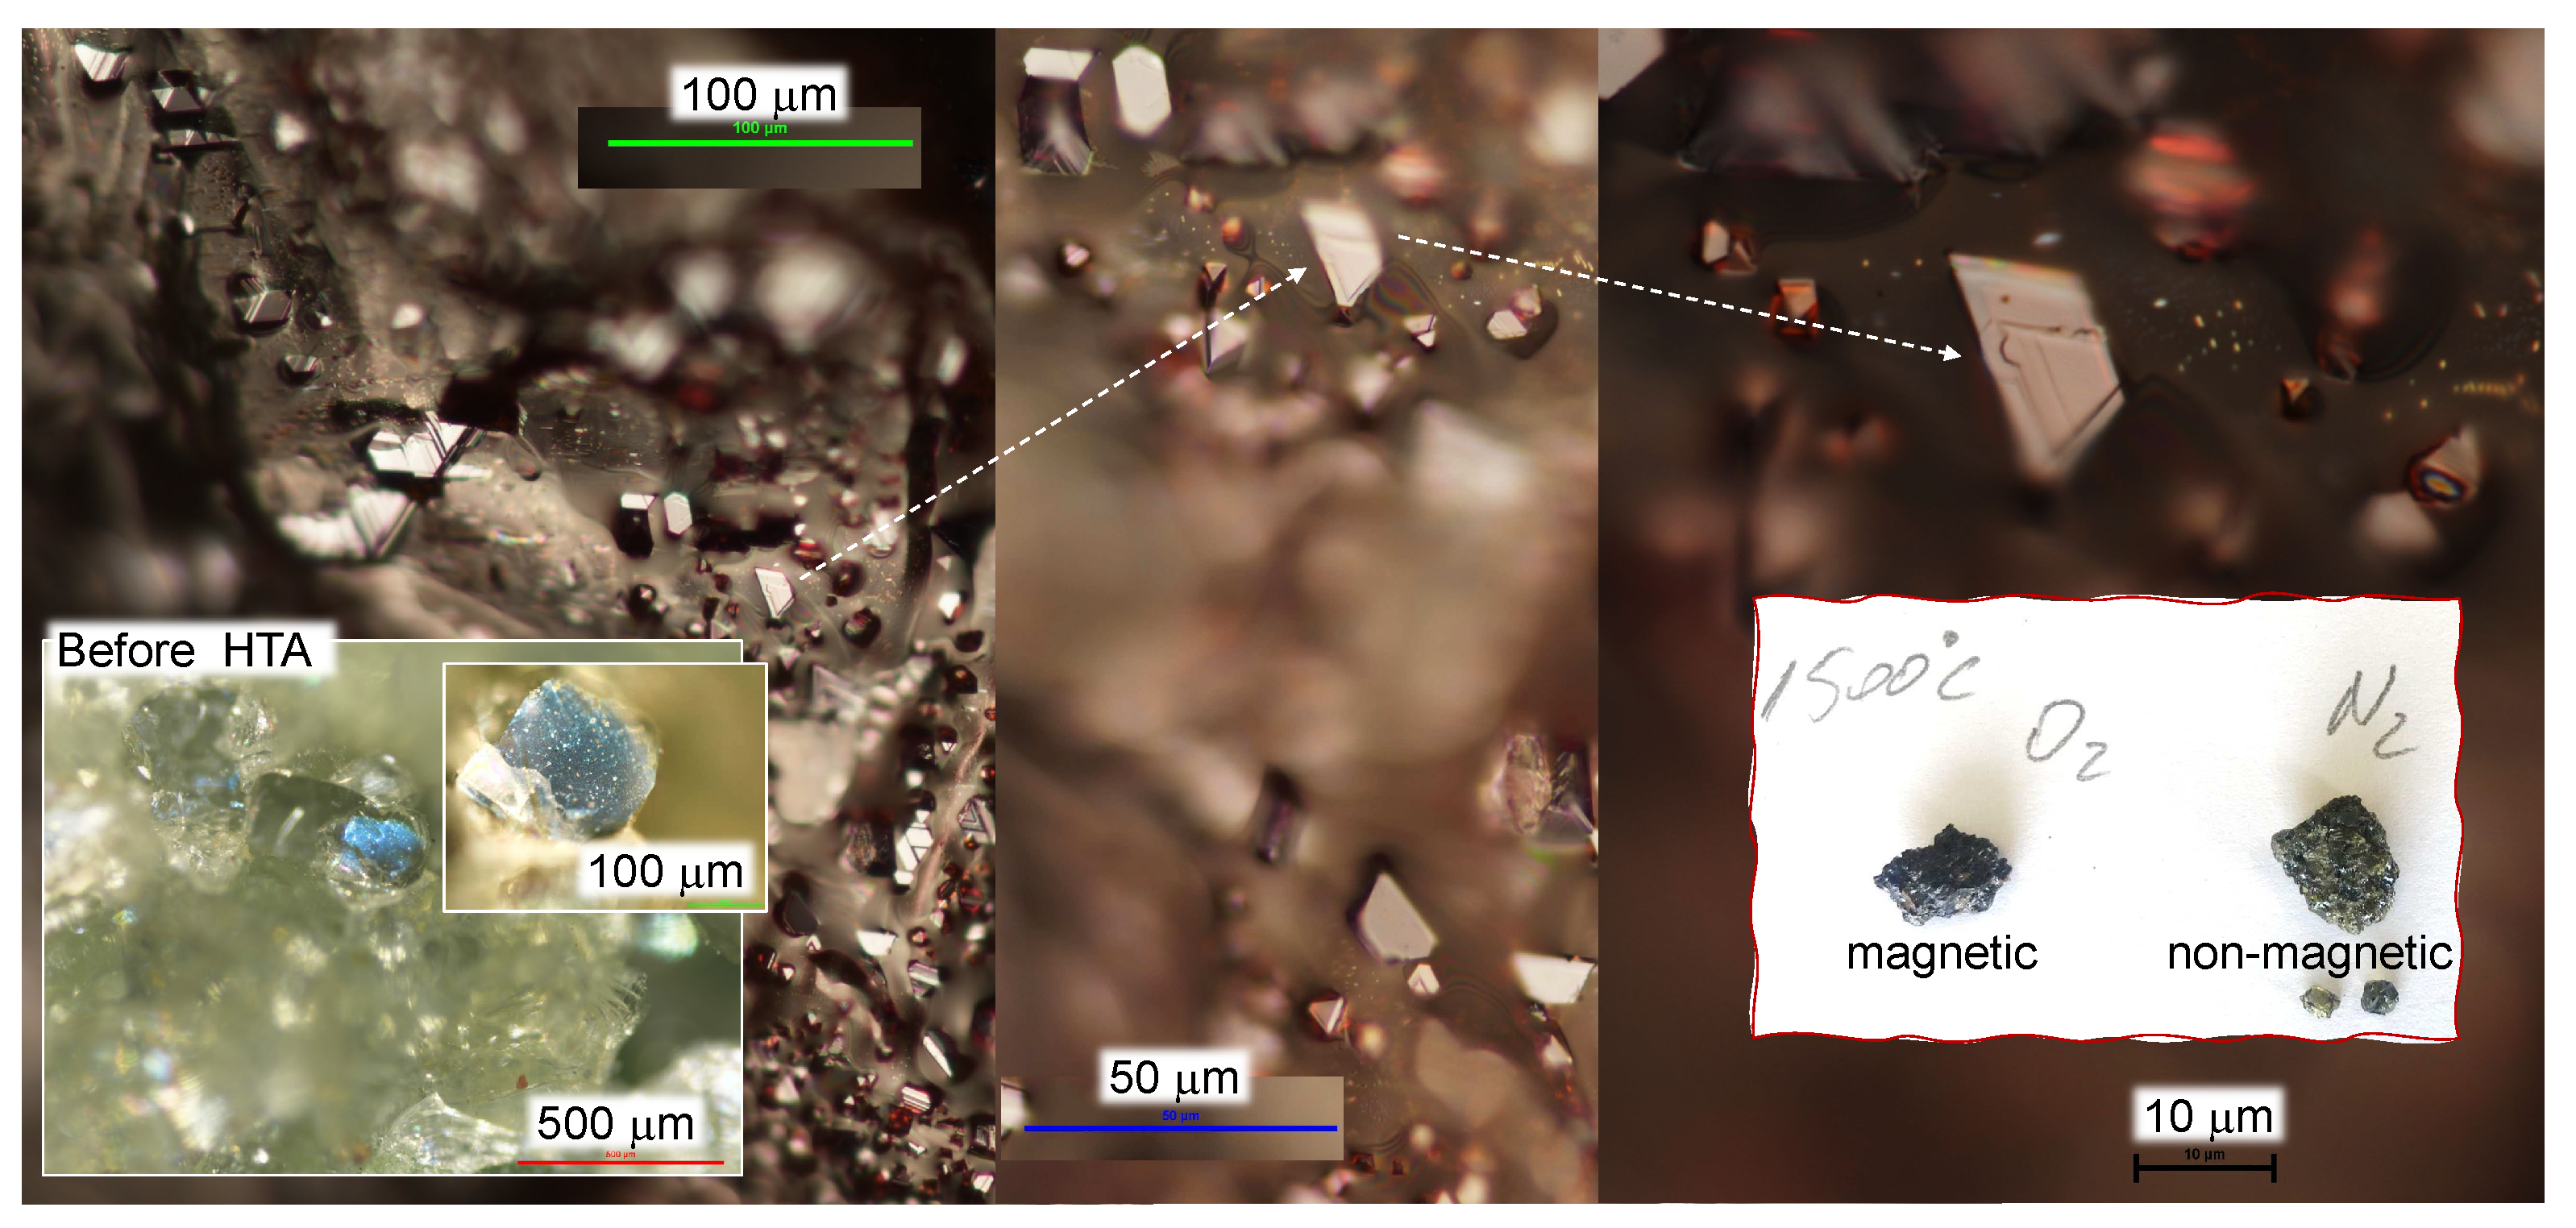
Figure 8.
High temperature annealed olivine (magnetic). Reflectance spectra are fit by 3-points, which are most intense on 4-pol. camera. Reflection from macro-particle ( mm in size; top-row) at illumination by a linearly polarised illumination ( at ). Smaller grain of HTA olivine: linear and circular polarised illumination ( at 0 (lin.) and (circ.); the left inset shows schematics of the reflection experiment. HTA was at 1500C for 2 hours in O2. The grain was fixed to a washer magnet and brought into reflection mode (top-row). Three-point method of the fit was used for Reflectance ; the background was measured from Au mirror with sample moved out of the beam. Standard deviation maps (not shown) had for all measurements.
4. Conclusions and outlook
This study introduced polarisation analysis at visible spectral range of 3D complex samples which are usually further scrutinised under IR and THz spectral range with correspondingly reduced resolutions: visible m, IR m, THz m. By using polarisation analysis at visible spectral range with 4-pol. camera, simple 4 or 3-points (angles) fit of transmitted or reflected light provides detailed maps of sample’s structure related to its shape, composition and thickness. Tracing changes during various thermal treatments, e.g., HTA, gas-sample reactions (olivine with CO2) using polarisation-resolved optical imaging can provide useful pin-point definition of location of the induced changes, precipitation of new phases, changes related to melting and surface tension induced flows.
The 3-points fit of 4-pol. camera images is introduced and validated for transmittance and reflectance. As prototype material, olivine in its original and thermally modified magnetic states was optically mapped using polarisation imaging. The proposed analysis is applicable to linearly and circularly polarised light. Reflectivity change of materials due to dielectric-to-metallic state change or formation of micro-precipitates could be visualised using polarisation analysis with two perpendicular polarisations [20]. The polarisation-resolved imaging presented here can be used for analysis of 3D polymerised structures where hatching of 3D volume and pulse-to-pulse overlap along a linear scan are important for structural quality of the 3D polymerised object [21]. Laser ablated targets in liquids form chains of magnetised nanoparticles [22,23] whose orientation could be recognised even below spatial resolution by the proposed polarisation analysis [3].
Author Contributions
Conceptualization, J.M., M.R., S.J.; methodology, M.R., S.K., J.V.; software development, S.K., M.R.; validation, S.H.N., H.H, P.M., D.M.; formal analysis, S.K., M.R., J.M.; investigation, T.K., P.M., H.H., D.M., J.V.; resources, J.M.; data curation, S.K., M.R.; writing—original draft preparation, S.K., S.J.; writing—review and editing, all the authors; visualization, S.K., S.J.; supervision, J.M.; All authors have read and agreed to the published version of the manuscript.
Funding
This research was funded by the ARC Linkage LP190100505 project. J.M. and M.R. were funded by JSPS KAKENHI Grant No. 22H02137 and JST CREST Grant No. JPMJCR19I3. M.R. was funded by JSPS KAKENHI Grant No. 22K14200. Polarisation analysis at visible wavelengths was done in preparation of IR analysis in M18753 proposal of the Australian Synchrontron.
Data Availability Statement
Data can be made available upon reasonable request.
Acknowledgments
We are grateful to a volunteer fossicking guide Mr. Joe Mooney from Mortlake, Victoria for leading our collection of xenolith olivines from Mortlake quarry in 2016.
Conflicts of Interest
The authors declare no conflict of interest.
References
- Scarcelli, G.; Yun, S.H. Confocal Brillouin microscopy for three-dimensional mechanical imaging. Nature Photonics 2008, 2, 39. [Google Scholar] [CrossRef] [PubMed]
- Traverso, A.J.; Thompson, J.V.; Steelman, Z.A.; Meng, Z.; Scully, M.O.; Yakovlev, V.V. Dual Raman-Brillouin Microscope for Chemical and Mechanical Characterization and Imaging. Analytical Chemistry 2015, 87, 7519–7523. [Google Scholar] [CrossRef] [PubMed]
- Honda, R.; Ryu, M.; Moritake, M.; Balcytis, A.; Mizeikis, V.; Vongsvivut, J.; Tobin, M.J.; Appadoo, D.; Li, J.L.; Ng, S.H.; Juodkazis, S.; Morikawa, J. Infrared Polariscopy Imaging of Linear Polymeric Patterns with a Focal Plane Array. Nanomaterials 2019, 9, 732. [Google Scholar] [CrossRef] [PubMed]
- Ryu, M.; Nishijima, Y.; To, S.M.N.; Hashizume, T.; Matsubara, R.; Kubono, A.; Hu, J.; Ng, S.; Juodkazis, S.; Morikawa, J. Hyperspectral Molecular Orientation Mapping in Metamaterials. Appl. Sci. 2021, 11, 1544. [Google Scholar] [CrossRef]
- Kadziolka-Gawel, M.; Adamczyk, Z.; Kalinowski, L. Mössbauer study of changes in Olivine after heating in air. The Canadian Mineralogist 2019, 57, 1–11. [Google Scholar] [CrossRef]
- Schrettle, F.; Kant, C.; Lunkenheimer, P.; Mayr, F.; Deisenhofer, J.; Loidl, A. Wüstite: electric, thermodynamic and optical properties of FeO. The European Physical Journal B 2012, 85, 164. [Google Scholar] [CrossRef]
- Koike, C.; Matsuno, J.; Chihara, H. Variations in the Infrared Spectra of Wüstite with Defects and Disorder. The Astrophysical Journal 2017, 845, 115. [Google Scholar] [CrossRef]
- Ricca, R.; Bellouard, Y. Single-Layer Subwavelength Femtosecond-Laser-Induced Confined Nanocrystallization in Multistack Dielectrics. Phys. Rev. Applied 2023, 19, 044035. [Google Scholar] [CrossRef]
- Gassner, C.; Vongsvivut, J.; Ng, S.; Ryu, M.; Tobin, M.; Juodkazis, S.; Morikawa, J.; Wood, B. Linearly Polarized Infrared Spectroscopy for the Analysis of Biological Materials. Applied Spectroscopy 2023, 19 July (online first), 1–32. [Google Scholar] [CrossRef]
- He, C.; He, H.; Chang, J.; Chen, B.; Ma, H.; Booth, M. Polarisation optics for biomedical and clinical applications: a review. Light: Science & Applications 2021, 10, 194. [Google Scholar]
- Roth, J.; Kozak, J.; Yazdanfar, S.; Rollins, A.; Izatt, J. Simplified method for polarization-sensitive optical coherence tomography. Optics Letters 2001, 26, 1069–1071. [Google Scholar] [CrossRef] [PubMed]
- de Boer, J.; Hitzenberger, C.; Yasuno, Y. Polarization sensitive optical coherence tomography – a review. Biomedical Optics Express 2017, 8, 1838–1873. [Google Scholar] [CrossRef] [PubMed]
- Linklater, D.; Vailionis, A.; Ryu, M.; Kamegaki, S.; Morikawa, J.; Mu, H.; Smith, D.; Maasoumi, P.; Ford, R.; Katkus, T.; Blamires, S.; Kondo, T.; Nishijima, Y.; Moraru, D.; Shribak, M.; O’Connor, A.; Ivanova, E.; Ng, S.H.; Masuda, H.; Juodkazis, S. Structure and Optical Anisotropy of Spider Scales and Silk: The Use of Chromaticity and Azimuth Colors to Optically Characterize Complex Biological Structures. Nanomaterials 2023, 12, 1894. [Google Scholar] [CrossRef]
- Onuma, T.; Otani, Y. A development of two-dimensional birefringence distribution measurement system with a sampling rate of 1.3 MHz. Optics Communications 2014, 315, 69–73. [Google Scholar] [CrossRef]
- Hikima, Y.; Morikawa, J.; Hashimoto, T. FT-IR Image Processing Algorithms for In-Plane Orientation Function and Azimuth Angle of Uniaxially Drawn Polyethylene Composite Film. Macromolecules 2011, 44, 3950–3957. [Google Scholar] [CrossRef]
- Honda, R.; Ryu, M.; Moritake, M.; Balcytis, A.; Mizeikis, V.; Vongsvivut, J.; Tobin, M.J.; Appadoo, D.; Li, J.L.; Ng, S.H.; Juodkazis, S.; Morikawa, J. Hyperspectral mapping of anisotropy. Nanoscale Horizons 2019, 4, 1443–1449. [Google Scholar]
- Collett, E. Polarization, 3 ed.; SPIE Press, Field guides: Bellingham, 2005. [Google Scholar]
- Roberts, A.; Zhao, X.; Hu, P.; Abrajevitch, A.; Chen, Y.H.; Harrison, R.; Heslop, D.; Jiang, Z.; Li, J.; Liu, Q.; Muxworthy, A.; Oda, H.; O’Neill, H.; Pillans, B.; Sato, T. Magnetic Domain State and Anisotropy in Hematite (α-Fe2O3) From First-Order Reversal Curve Diagrams. J. Geophysical Research: Solid Earth 2021, 126, e2021JB023027. [Google Scholar] [CrossRef]
- Ng, S.; Allan, B.; Ierodiaconou, D.; Anand, V.; Babanin, A.; Juodkazis, S. Drone Polariscopy—Towards Remote Sensing Applications. Eng. Proc. 2021, 11, 46. [Google Scholar]
- Chen, H.; Wolff, L. Polarization Phase-Based Method For Material Classification In Computer Vision. Int. J. Computer Vision 1998, 28, 73–83. [Google Scholar] [CrossRef]
- Fritzsche, S.; Pauw, B.; Weimann, C.; Sturm, H. First of its kind: a test artifact for direct laser writing. Meas. Sci. Technol. 2023, 34, 075004. [Google Scholar] [CrossRef]
- Semaltianos, N.; Karczewski, G. Laser Synthesis of Magnetic Nanoparticles in Liquids and Application in the Fabrication of Polymer–Nanoparticle Composites. ACS Appl. Nano Mater. 2021, 4, 6407–6440. [Google Scholar] [CrossRef]
- Jakobi, J.; Petersen, S.; Menéndez-Manjón, A.; Wagener, P.; Barcikowski, S. Magnetic Alloy Nanoparticles from Laser Ablation in Cyclopentanone and Their Embedding into a Photoresist. Langmuir 2010, 26, 6892–6897. [Google Scholar] [CrossRef] [PubMed]
Figure 4.
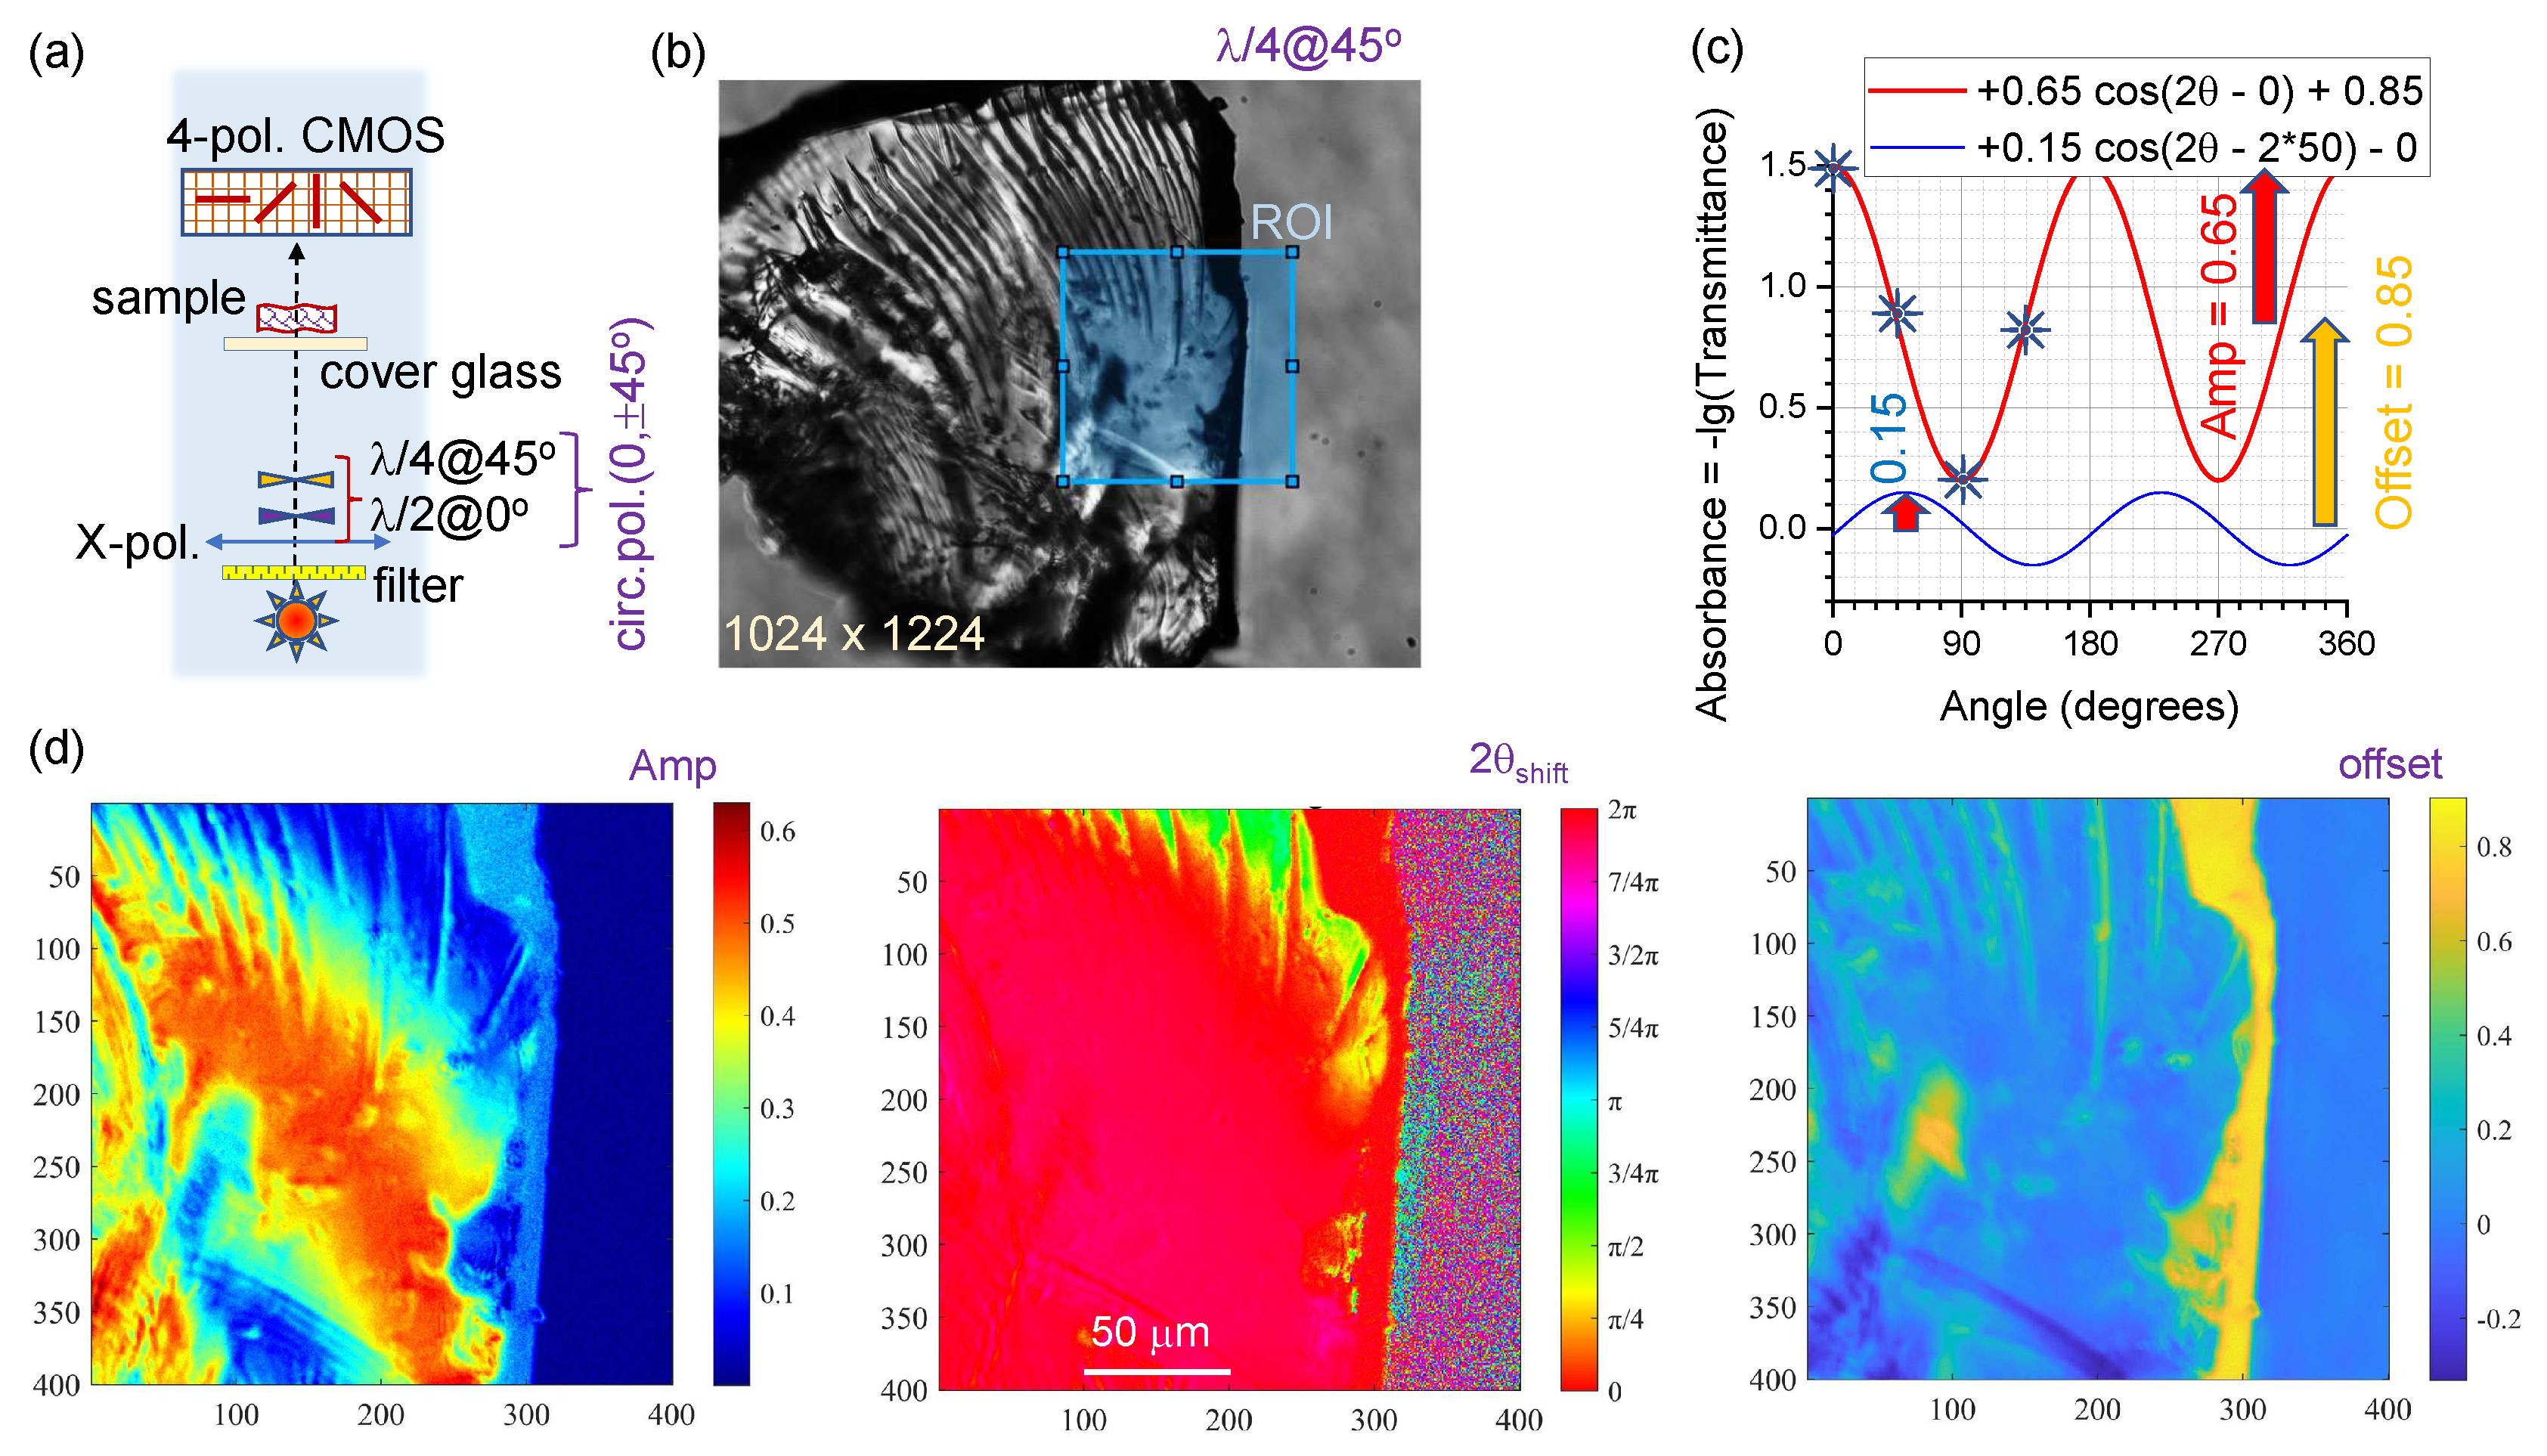
(a) Transmittance of the -plate at different orientation angles: dots - experiment, lines Mueller matrix calculations (see Sec. Section 2.2); selected area pixels was averaged for plotting. Three-point fit to . Maps for best fit parameters amplitude , phase azimuth and are shown in corresponding panels for the linearly polarised illumination at different orientations of the -plate : (a) and 0 (b). Amplitude and offset were set to be positive and angle was bound to range during the fitting procedure. The achromatic polymer waveplate was used as a sample holder. A cross with marker between phase maps of (b) and (c) illustrates ⊥-orientation of the background color maps as expected for the phase difference for -plate at 0 vs. orientations.
Figure 4.
(a) Transmittance of the -plate at different orientation angles: dots - experiment, lines Mueller matrix calculations (see Sec. Section 2.2); selected area pixels was averaged for plotting. Three-point fit to . Maps for best fit parameters amplitude , phase azimuth and are shown in corresponding panels for the linearly polarised illumination at different orientations of the -plate : (a) and 0 (b). Amplitude and offset were set to be positive and angle was bound to range during the fitting procedure. The achromatic polymer waveplate was used as a sample holder. A cross with marker between phase maps of (b) and (c) illustrates ⊥-orientation of the background color maps as expected for the phase difference for -plate at 0 vs. orientations.
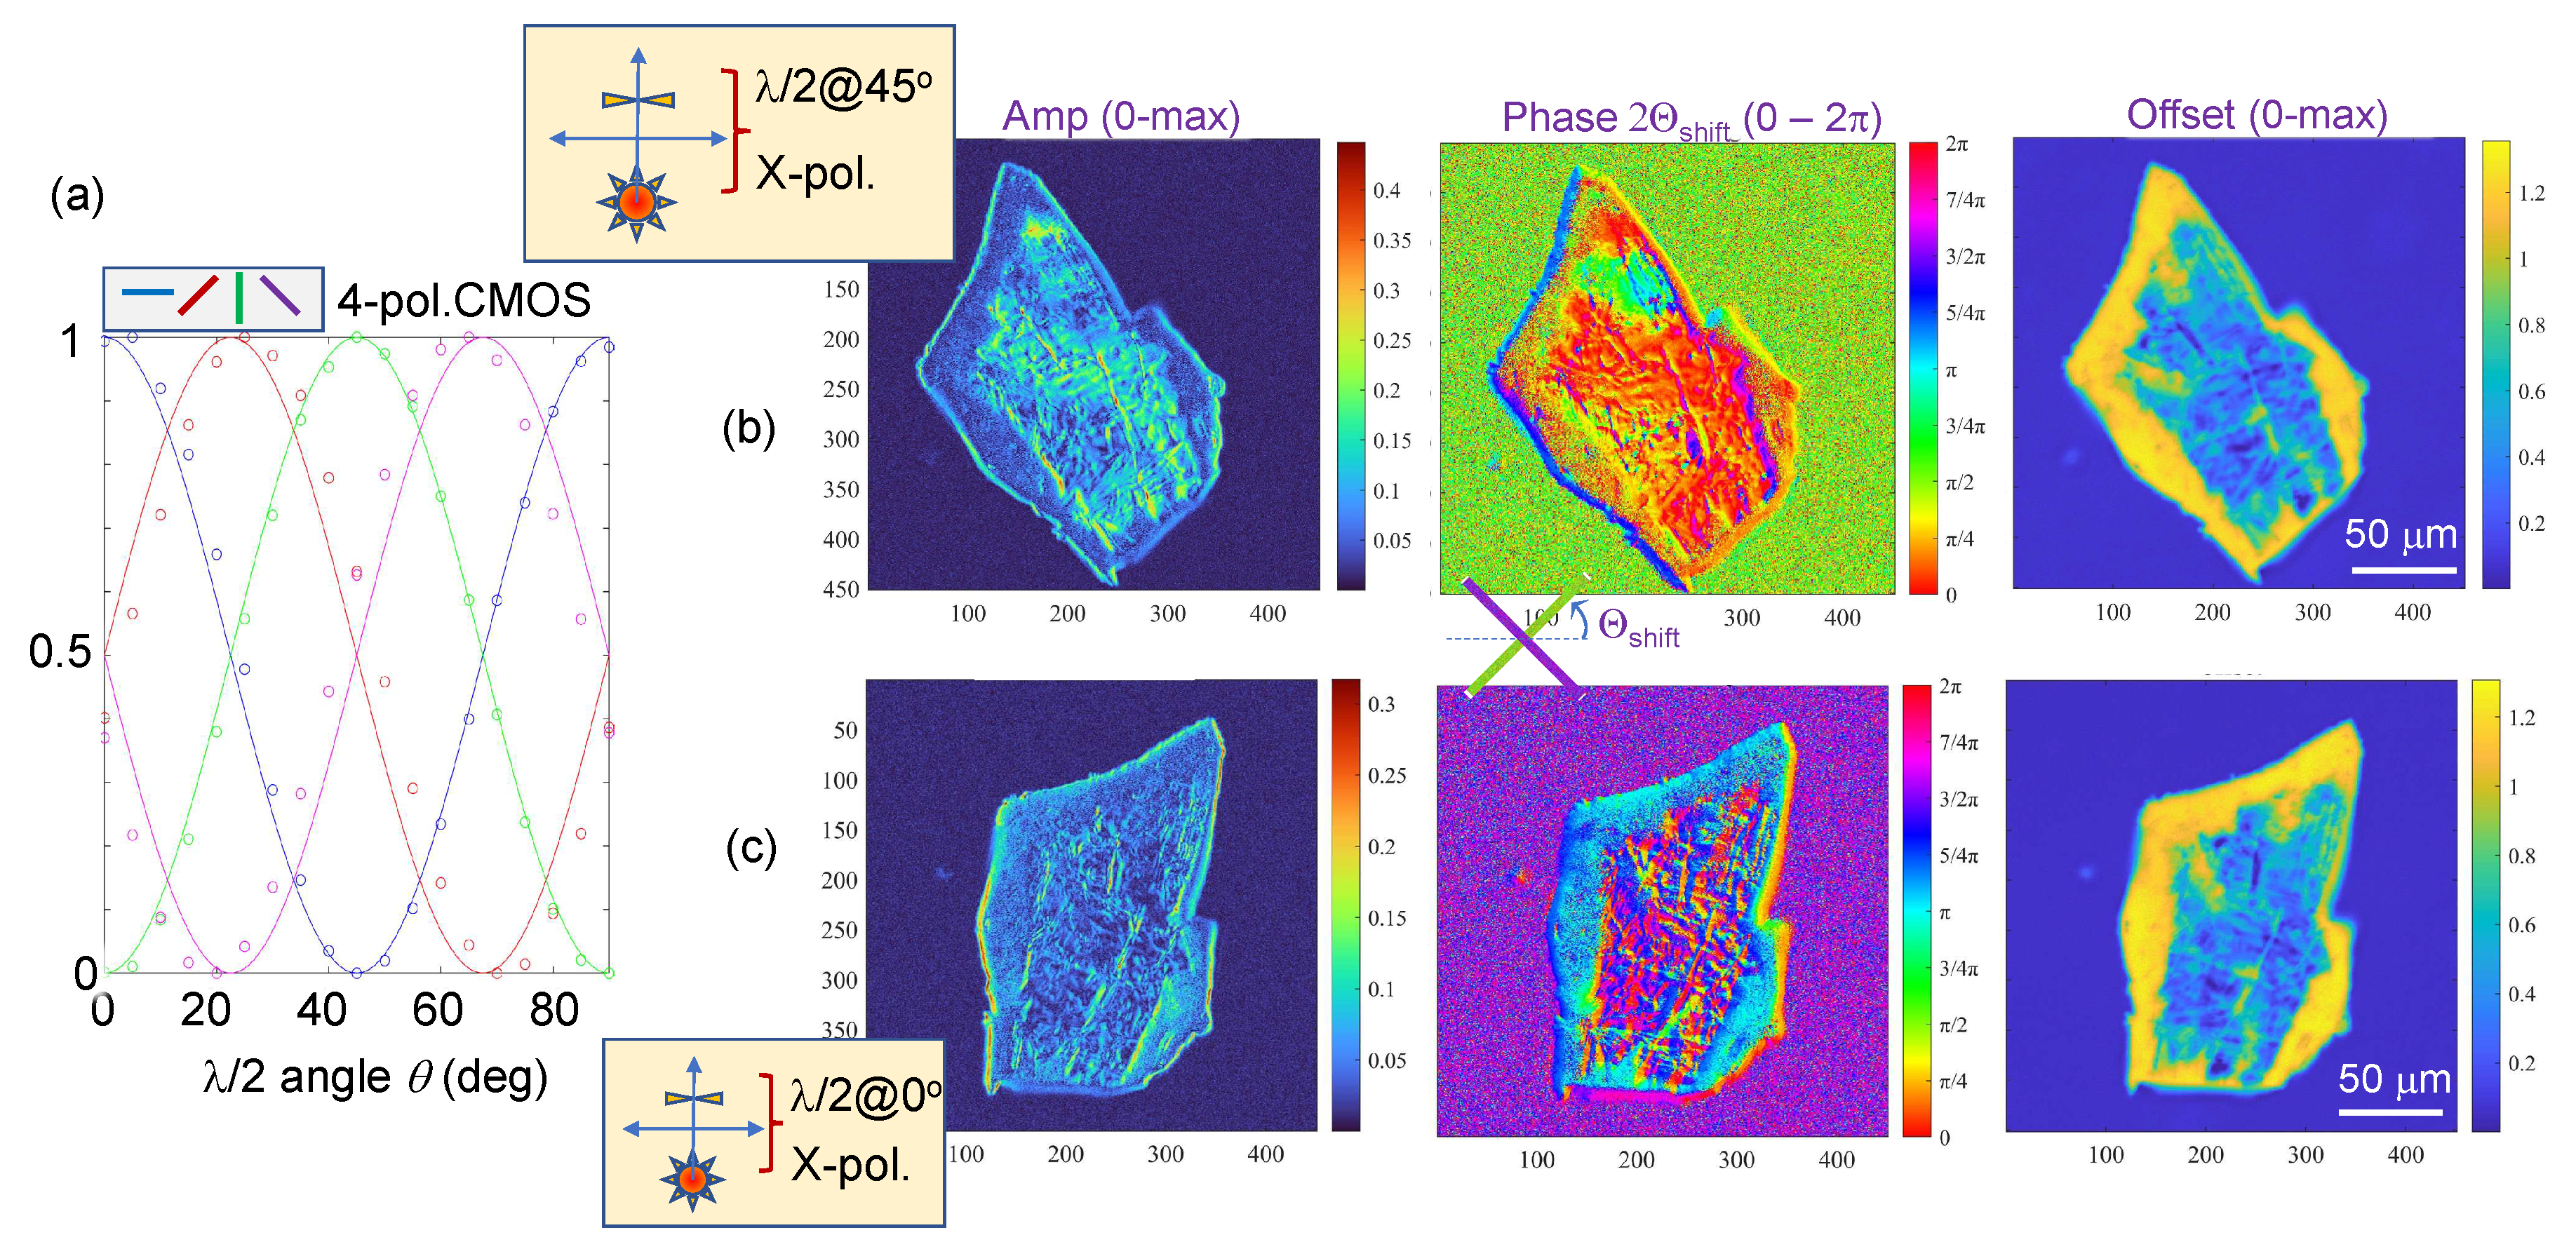
Figure 5.
Three-points () fit of absorbance for the illumination of olivine grain by linear polarised light using at (same sample as in Figure 3). The standard deviation shows a good fit for the three points (angles). An interference bandpass filter nm was used for illumination.
Figure 5.
Three-points () fit of absorbance for the illumination of olivine grain by linear polarised light using at (same sample as in Figure 3). The standard deviation shows a good fit for the three points (angles). An interference bandpass filter nm was used for illumination.
Disclaimer/Publisher’s Note: The statements, opinions and data contained in all publications are solely those of the individual author(s) and contributor(s) and not of MDPI and/or the editor(s). MDPI and/or the editor(s) disclaim responsibility for any injury to people or property resulting from any ideas, methods, instructions or products referred to in the content. |
© 2023 by the authors. Licensee MDPI, Basel, Switzerland. This article is an open access article distributed under the terms and conditions of the Creative Commons Attribution (CC BY) license (http://creativecommons.org/licenses/by/4.0/).
Copyright: This open access article is published under a Creative Commons CC BY 4.0 license, which permit the free download, distribution, and reuse, provided that the author and preprint are cited in any reuse.


