
Submitted:
15 August 2023
Posted:
16 August 2023
You are already at the latest version
Preprints on COVID-19 and SARS-CoV-2
Abstract
The outbreak of the COVID-19 pandemic has raised concerns about potential environmental factors that could influence the spread and severity of the SARS-CoV-2 virus. Atmospheric pollution, particularly particulate matter (PM), has been suggested as a contributing factor to viral infections and respiratory complications. This two-year observational study aimed to investigate the relation between air pollution and the spread of COVID-19, focusing on PM2.5. Unlike previous studies limited to specific cities or countries, inevitable to use temporal data. Our research analyzed data from various states across the United States, considering both spatial and temporal correlation. The analysis considered the number and geographic distribution of COVID-19 cases along with daily PM2.5 exposure levels, accounting for monthly average PM2.5 exposure, from March 2020 to December 2021. The observed conflicting results of the temporal and spatial correlation present challenges for researchers in understanding the true nature of the relationship between PM2.5 air pollution and COVID-19 cases. The correlation between various factors, such as population density, PM2.5, temperature, and wind speed, and COVID-19 refers to an association or statistical relationship, not causation. Moreover, the intricate interplay of these variables makes it difficult to establish a clear cause-and-effect relationship.
Keywords:
COVID-19
; population density
; air pollution
; PM2.5
1. Introduction
A study conducted by Doremalen et al [1] has demonstrated that SARS-CoV-2 can remain viable and infectious in aerosols for several hours and on certain surfaces. Building upon this research, the hypothesis arises for other researchers that COVID-19, caused by the coronavirus, might potentially interact with air pollution. Groulx et al. [2] confirm that microbial agents of communicable diseases, such as viruses, have interactions with air pollution, affecting public health .A study conducted in Poland found a significant association between particulate matter and the number of new COVID-19 infections [3]. Similar studies across Europe suggest that short-term exposure to particulate matter (PM) is related to the spread of SARS-CoV-2, with PM levels in England and Italy specifically implicated [4,5]. In the Middle East, a study of Baghdad and Kuwait found that PM2.5 levels were positively related to deaths caused by COVID-19, with a decrease in particulate matter leading to a significant decrease in the death rate. In Kuwait, a 38.4% decrease in deaths was observed during the travel ban period, with an average decrease of 22.3% in PM2.5 levels. This study also found a positive relationship between air temperature and a negative relationship between humidity and the number of deaths [6].Therefore, some studies have found a relationship between PM and corona [7,8,9], while others have not found any significant association between the two [10]. Some studies have merely identified a correlation between PM and the daily number of confirmed cases without providing a p-value [5] . In a study conducted in Delhi, researchers found that the number of COVID-19 cases exhibited a significant negative correlation with PM2.5 levels (correlation=−0.63, p-value<0.01) during the pre-lockdown phase. However, the number of COVID-19 cases during the lockdown phase also showed a positive correlation with PM2.5, with a correlation value of 0.56. Despite these contrasting correlations, the researchers concluded that there is a dependence of COVID-19 transmission on the concentration of PM2.5 in Delhi’s environment [11].
The reason why some studies find a positive relationship between PM and COVID-19 cases, while others do not, can be attributed to the fact that correlation does not imply causation. To establish causation, researchers need to conduct carefully designed studies, such as randomized controlled trials or longitudinal studies, to demonstrate a direct cause-and-effect relationship between PM levels and COVID-19 outcomes.
Indeed, emissions from the combustion of diesel fuel in cars and other vehicles are recognized as a significant source of particulate matter (PM) in urban areas [12,13]. As a result, regions with higher population density tend to have more transportation activities, contributing to increased levels of PM [14,15] During the COVID-19 lockdowns implemented in response to the pandemic, there were significant reductions in urban activity, including a decrease in transportation and industrial activities. As a result, there was a noticeable reduction in emissions, including those of particulate matter. This reduction in human activity led to improvements in air quality in many urban areas during the lockdown periods [16]. Population is a crucial factor in urban areas, as it reflects the concentration of individuals in a given space. Areas with higher population are more likely to experience quick spreading of infectious diseases, including COVID-19 [17]. While areas with larger populations tend to have more reported COVID-19 cases (correlation), it does not necessarily mean that population itself directly causes the spread of the virus (causation). Just like flipping a coin multiple times increases the likelihood of observing both heads and tails, having a larger population in an area might lead to more reported COVID-19 cases due to an increased chance of encountering infected individuals. However, this correlation does not imply that population size directly causes the occurrence of COVID-19 cases. Two study Malaysia found a strong positive and statistically significant correlation between the total population and Covid-19 cases, indicating that larger populations were associated with higher case numbers. However, the relationship between population density and the spread of Covid-19 was weaker [18,19]. Two common mistakes made by researchers are using cumulative frequency reports of Covid-19 cases or deaths directly in their analysis without considering their implications, and applying linear regression analysis, which assumes a continuous dependent variable, to model the discrete nature of the number of people infected with Covid-19. Despite this, many studies still utilize linear regression inappropriately. For instance, two study on the correlation between population density and Covid-19 in the USA [20,21], linear mixed models were used. Additionally, it appears that the data in the linked article uses cumulative frequency instead of frequency. Of course, the population density in specific places, such as hospitals, public transportation, and cruise ships [22], can significantly contribute to the transmission of Covid-19 in localized settings. However, it’s important to clarify that the primary objective of our study is to investigate this phenomenon on a larger macro scale, encompassing provinces, cities, and countries. Therefore, there is a difference between the two concepts of population density and physical distance. In another study conducted in America, focusing on 913 counties, they found that metropolitan population density played a significant role as a predictor of infection rates. However, they observed that county density, by itself, was not significantly related to the infection rate. Instead, the study highlighted that connectivity, which involves factors beyond just density, appears to have a more significant impact on infection rates [23].
Considering the complexities of the association between air pollution and the spread of COVID-19, it would be reasonable to expect that regions with higher wind speeds, resulting in lower pollution levels, would also have fewer COVID-19 cases if all other factors were equal. However, despite this logical expectation, studies have not consistently shown this correlation between wind speed, pollution, and COVID-19 cases. The Gaussian air pollutant dispersion equation is indeed one of the earliest and simplest forms of pollutant dispersion modeling. It describes how air pollutants disperse and spread in the atmosphere under the influence of wind and other meteorological factors [24] Higher wind speeds can enhance the dispersion of air pollutants, leading to lower local pollution levels in densely populated cities. In areas with high wind speeds, it is expected that air pollutants would disperse more effectively, potentially reducing the concentration of pollutants in the air. In the study conducted in New York, the Spearman Correlation Coefficient of +0.172 suggests a positive correlation between wind speed and COVID-19 cases. This means that higher wind speeds were associated with higher COVID-19 case counts in that particular area [25] On the other hand, the study in Jakarta, Indonesia, revealed a significantly negative correlation (r = −0.314; p < 0.05) between low wind speed and higher COVID-19 cases [26]. Moreover, the study by Shao et al. found a positive and negative correlation between wind and the number of infected, indicating a connection between pollution and COVID-19 [27]. The limitations observed in existing investigations stem from the fact that both air pollution and COVID-19 infections are correlated both spatially and temporally. Both spatial and temporal correlations between air pollution and infections can introduce biases in the estimation of results. Typically, researchers choose to consider either spatial or temporal correlations, depending on the research question and the nature of the data being analyzed. Our study possesses several advantages. Firstly, it benefits from a large number of statistical samples, which enhances the robustness and reliability of the findings. Additionally, the research employs two different types of correlations, namely spatial, temporal to thoroughly investigate the relationship between air pollution and COVID-19. This comprehensive approach allows for a more comprehensive understanding of the potential link between air pollution and the incidence of the disease. By utilizing various correlation methods and a substantial dataset, this study aims to provide valuable insights into the impact of air pollution on COVID-19.
2. Materials and Methods
2.1. Sample
● This study centers on fifty-one (N= 51) states in the USA, one of the countries significantly impacted by the COVID-19 pandemic, with over 54 million cases reported over the course of two years (2020 and 2021). Due to the larger dataset of people infected with COVID-19 compared to the number of deaths, this study utilized data on the number of infected individuals for analysis.
2.2 Sources
2.3. Measurements
● The data of PM2.5 is often reported using the Air Quality Index (AQI), which provides an overall measure of air quality based on various pollutants, including PM2.5. However, the AQI is a dimensionless index and not directly usable for quantitative analyses due to its scale and unitless nature.To facilitate statistical analysis and comparisons, researchers often convert AQI values to a more quantitative and usable unit such as micrograms per cubic meter (µg/m³) using appropriate conversion equations. This conversion allows for the data to be expressed in a standard unit that can be utilized in statistical models and helps to establish a more meaningful relationship between PM2.5 concentrations and other variables.While the correlation between AQI and µg/m³ values not be 1, converting AQI to µg/m³ provides a more accurate representation of PM2.5 concentrations, enabling researchers to better understand its relationship with other variables in quantitative analyses. The AQI is given by eqn(1) [30].
where;
Conci(PM2.5)= input concentration for a given pollutant(pm2.5)
ConcLo= the concentration breakpoint that is less than or equal to Conci
ConcHi(PM2.5)= the concentration breakpoint that is greater than or equal to Conci
AQILo= the AQI breakpoint corresponding to ConcLo
AQIHi= the AQI breakpoint corresponding to ConcHi
● The average wind speed is measured in meters per second (m/s) using the Instrumental - RM Young Model 05103, which is designed to measure wind speed at low altitudes. It is important to note that wind speed can vary with height, and therefore, different devices and methods may yield different results due to the variations in wind patterns at different altitudes.
● Time series data for COVID-19 confirmed cases in the United States for the years 2020 and 2021 can be obtained from the CSSE (Center for Systems Science and Engineering) at Johns Hopkins University public archive data [31]. In the archive, the data is initially provided as cumulative frequency, which represents the total number of COVID-19 cases up to a specific date. To use this data for analysis, it needs to be transformed into daily frequency by taking the difference between consecutive data points. To clarify, for each day, the number of new COVID-19 cases (frequency) can be calculated by subtracting the cumulative count at the previous day (t0) from the cumulative count at the current day (t1), denoted as x(t1) - x(t0). In addition, the ratio of the number of cases to the total time the population is at risk of disease can also be calculated. This ratio provides insights into the incidence rate of COVID-19 cases per unit time for each state. Furthermore, to determine population density, one can obtain the population of each state and divide it by the area of each state. In the majority of studies, researchers commonly employ Pearson correlation for assessing the relationship between variables. While some studies use Kendall and Spearman correlation, the differences in results are not significant. To facilitate comparison with other research, we also utilize Pearson correlation. Pearson’s correlation coefficient (r) is a widely used measure that evaluates the strength, type, and direction of the relationship between two variables. The Pearson correlation (r) is defined as shown in Equation (2) [32].
where:
r=correlation coefficient,
are the values of the variable in a sample ,
,= mean of the values of the y-variable.
3. Results
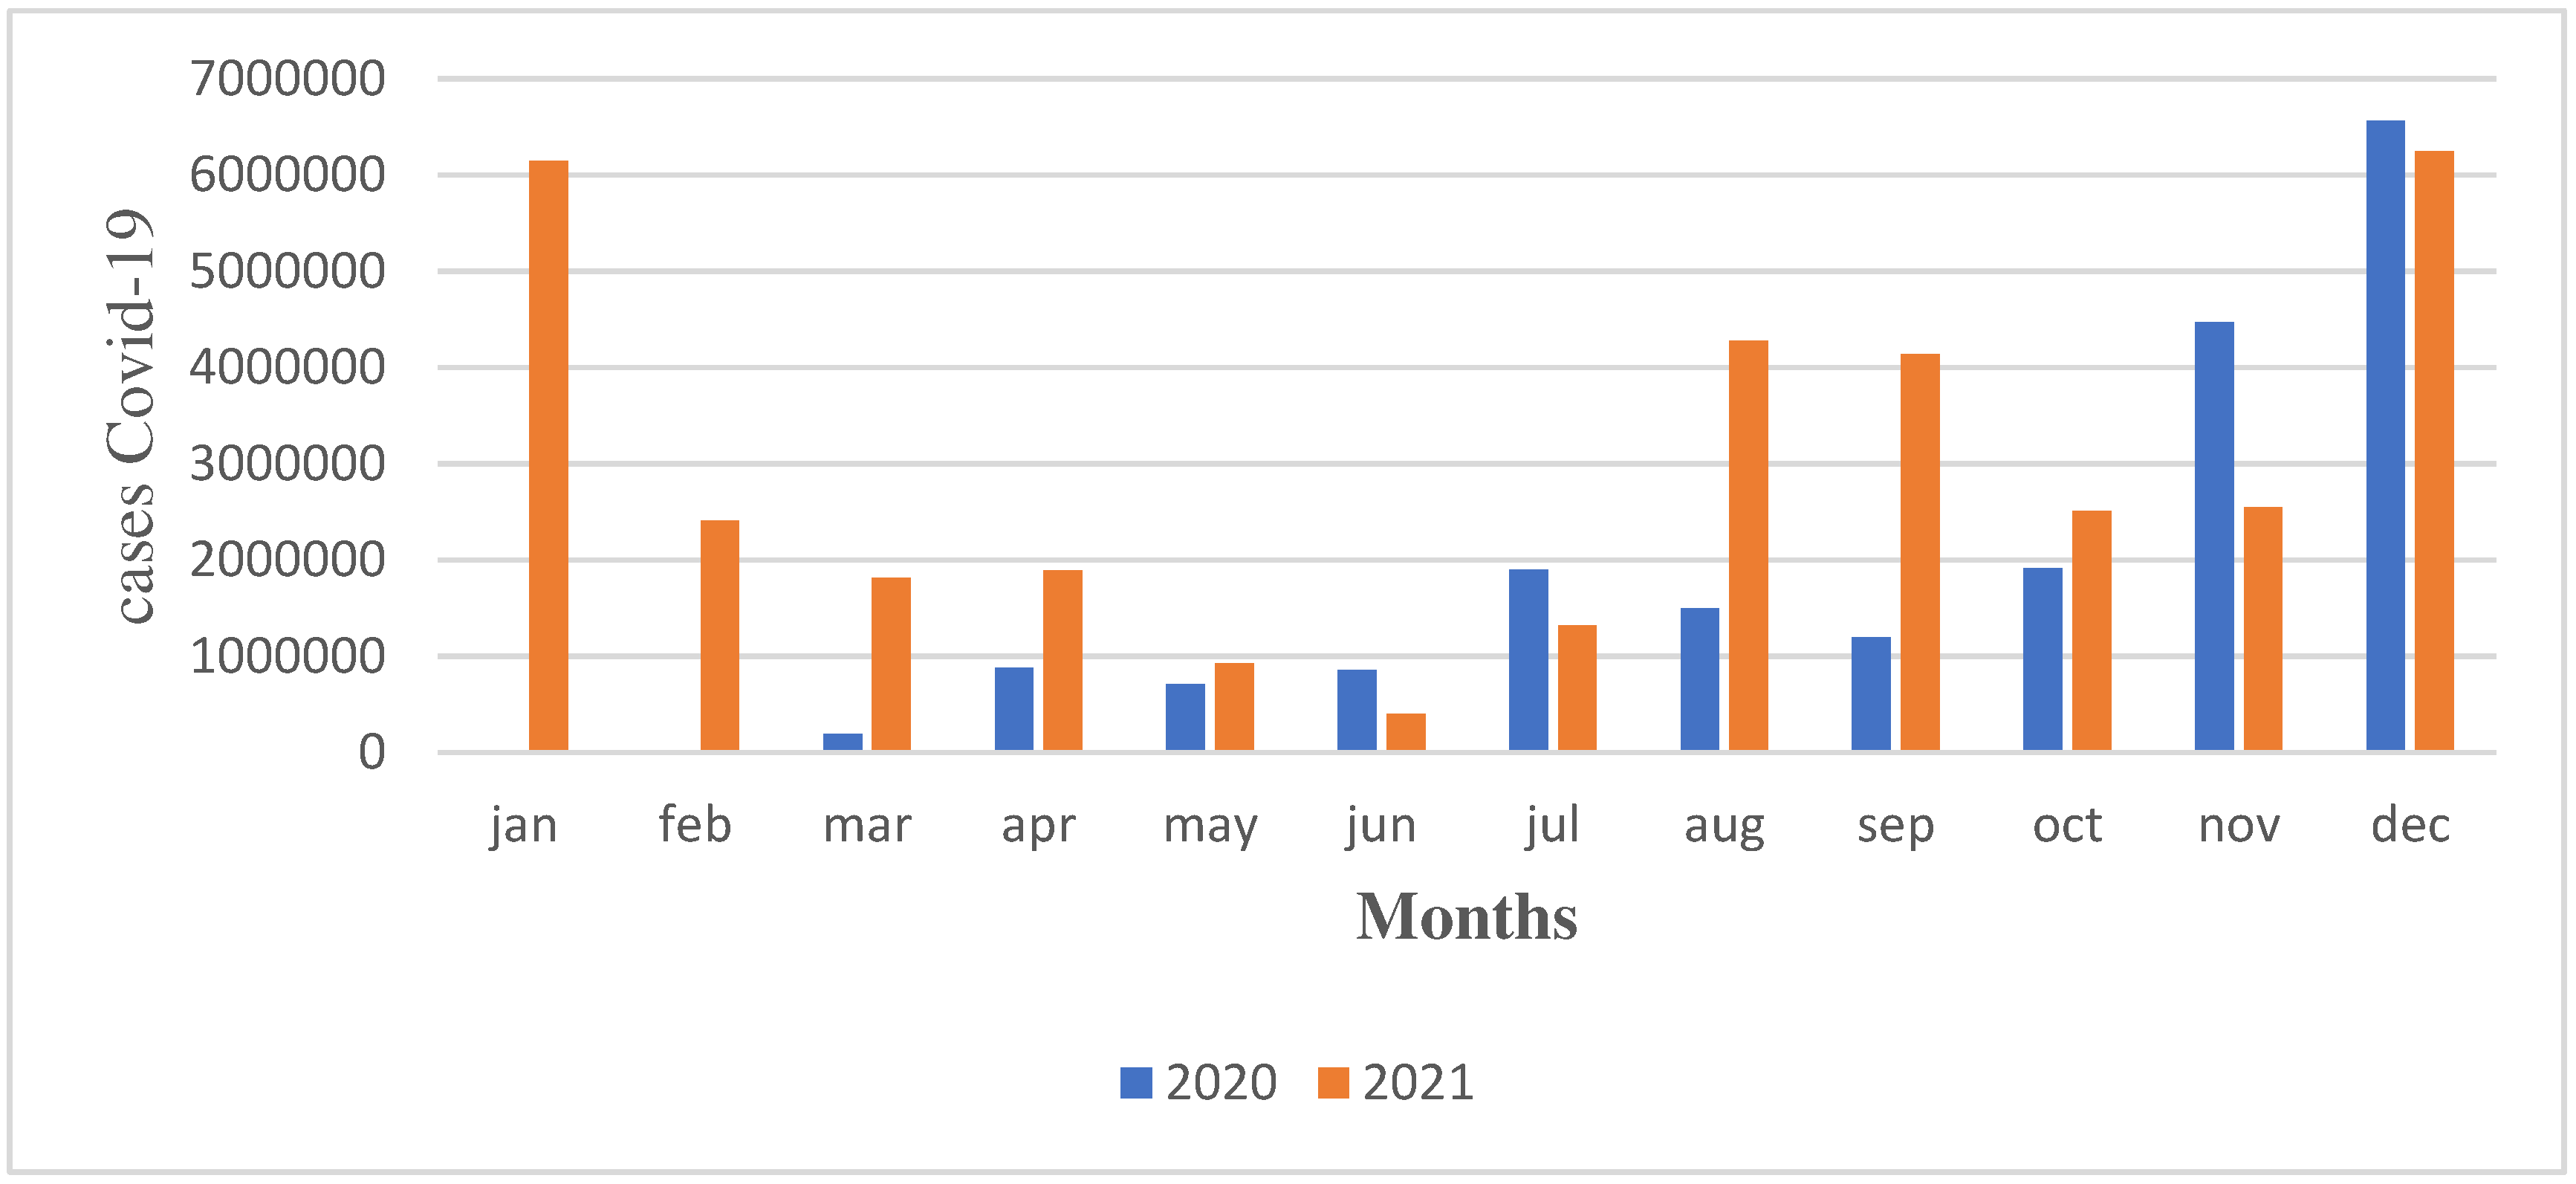
Figure 1 depicts the number of confirmed COVID-19 cases in the United States throughout the years 2020 and 2021. The data shows that the peak of COVID-19 infections in 2020 occurred in December, while in 2021, the highest number of cases was reported in January. Over the entire year of 2020, a total of 20,126,950 confirmed COVID-19 cases were recorded in the United States, and this number surged to 34,505,103 in 2021. The figure effectively presents the overall trend of COVID-19 cases over the two-year period, highlighting fluctuations and changes in infection rates across different months in both years.
Figure 1.
The number of confirmed Covid-19 cases in the years 2020 and 2021.
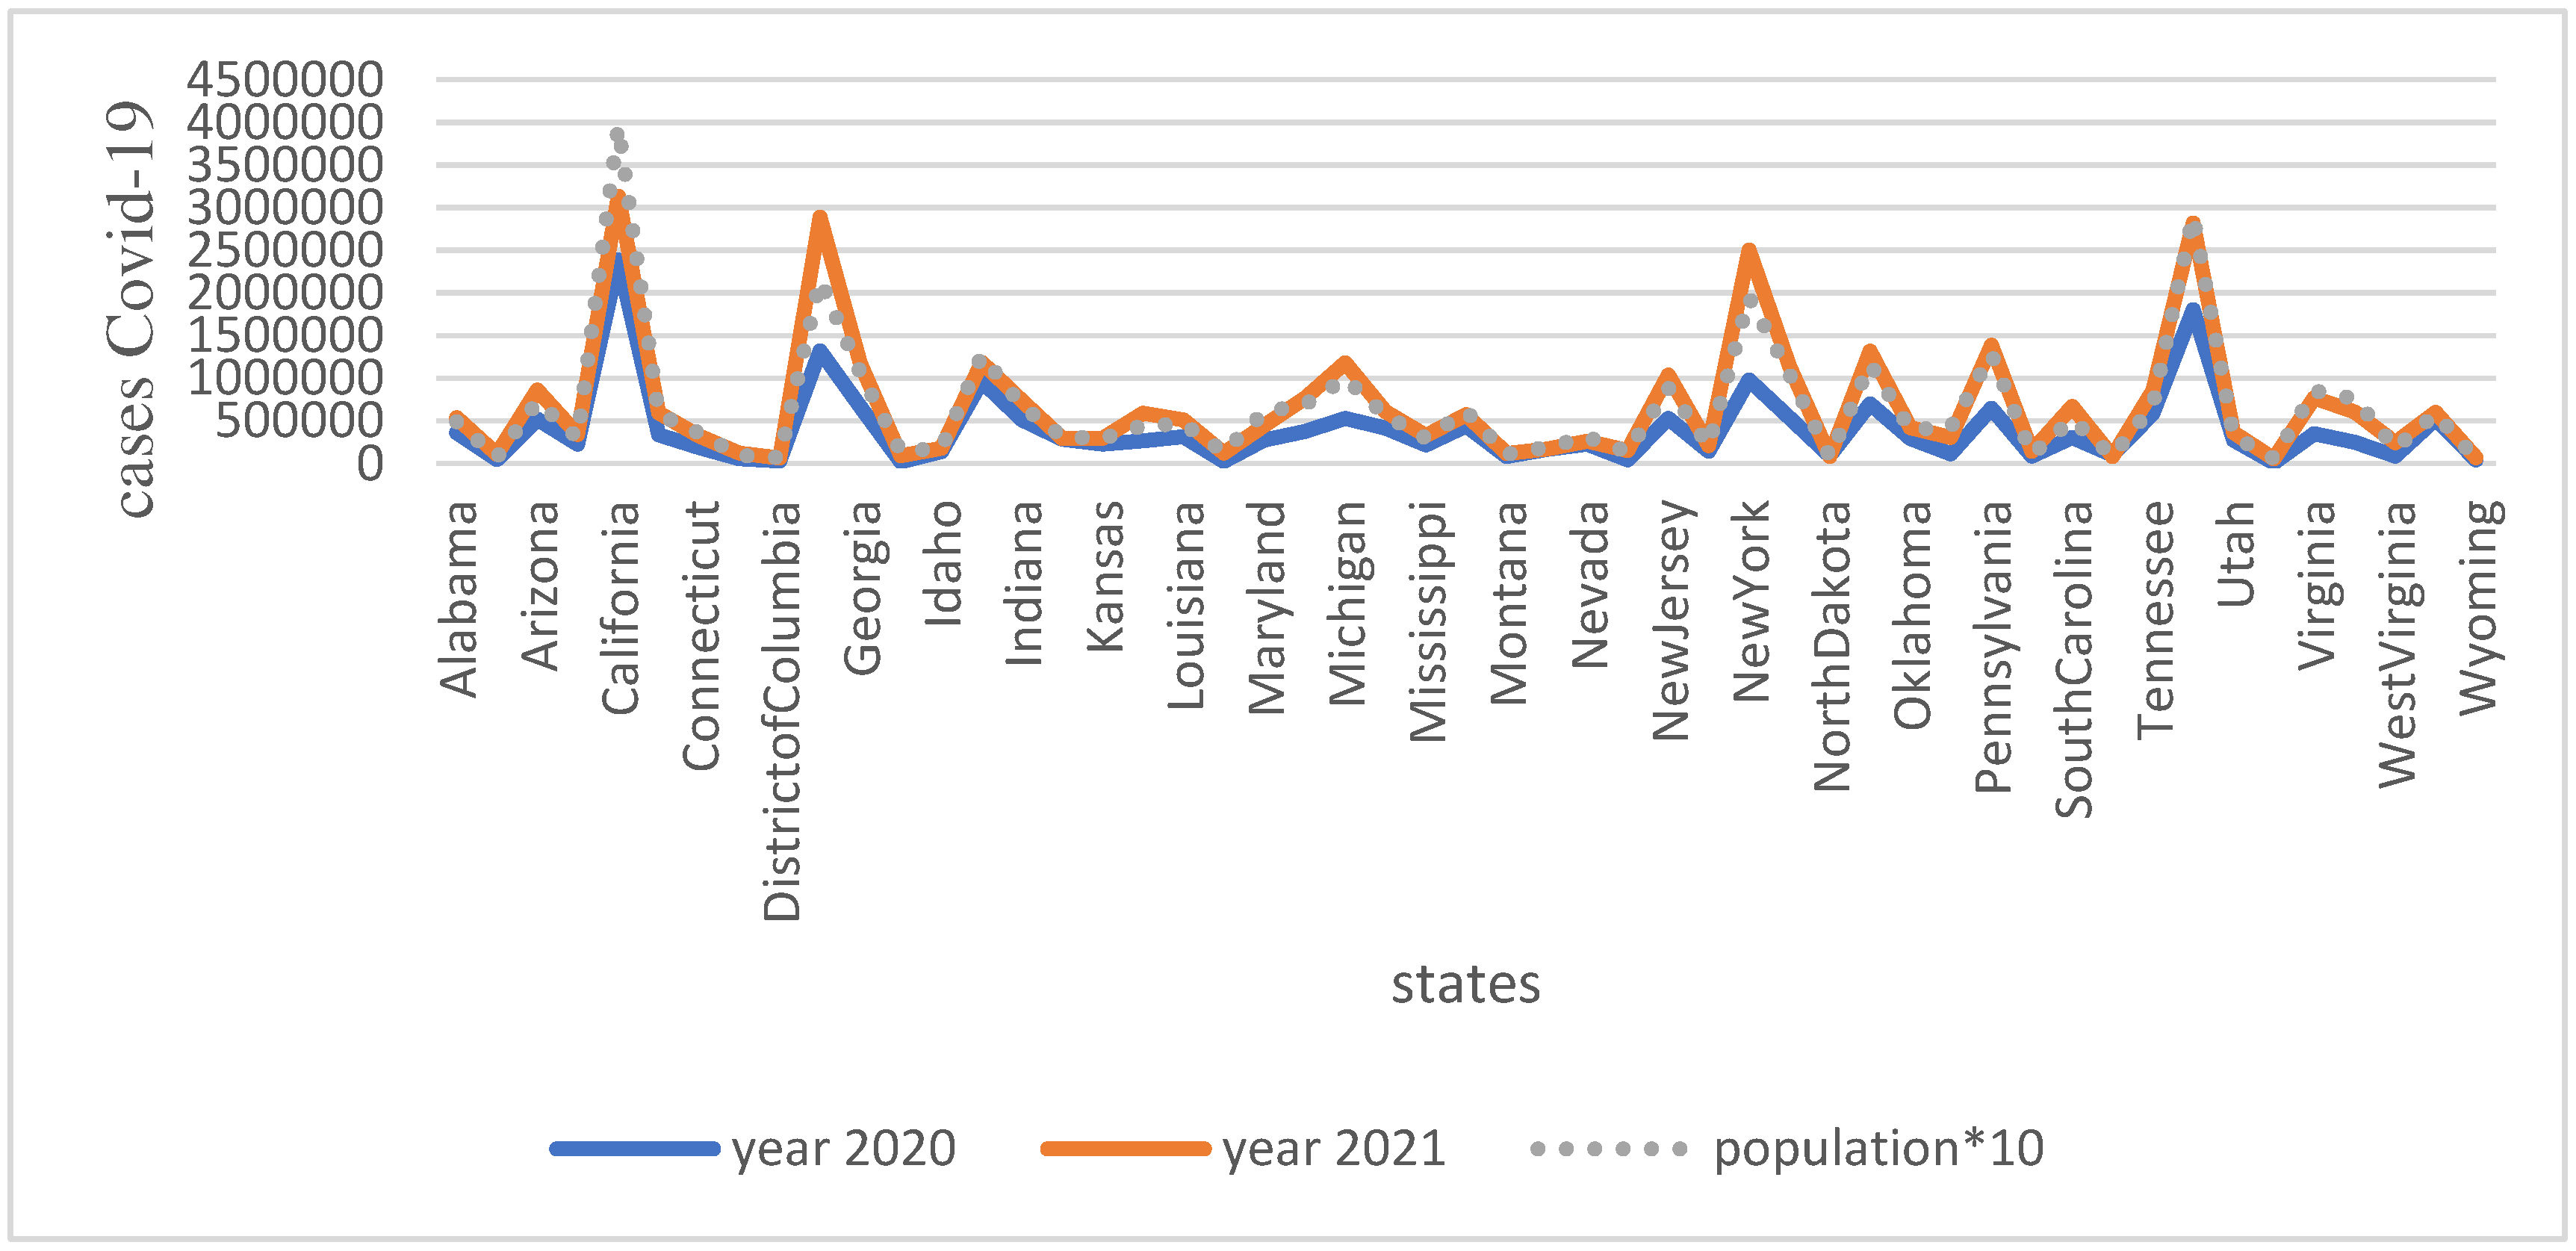
The data analysis presented in Figure 2 consistently demonstrates a high prevalence of COVID-19 cases in California, Florida, New York, and Texas throughout the two-year period. The three graphs indicate that the pattern of COVID-19 cases in these states closely correlates with their respective population sizes. States with larger populations tend to have a higher number of COVID-19 cases, suggesting that population size plays a significant role in the spread of the virus.
Figure 2.
Number of confirmed Covid-19 in the years 2020 and 2021.
The strong spatial correlation between COVID-19 cases in 2020 and 2021 suggests that the pattern of infections for each state repeated in the following year (Table 1). There is a significant positive correlation between the population and COVID-19 cases(r=0.98), supporting the idea discussed in the introduction that population size can influence the likelihood of infection. The weak correlations, close to zero, between the rate of COVID-19 cases and population, as well as population density and COVID-19 cases. Wind speed shows no correlation with COVID-19 cases, indicating it has little impact on transmission dynamics. Temperature, on the other hand, exhibits a positive correlation with COVID-19 cases. Regarding PM2.5, COVID-19 cases in 2020 show a significant positive correlation (r=0.468) with PM2.5, while in 2021, the correlation remains positive (r=0.168) but not significant. Additionally, the correlation between the rate of COVID-19 cases and PM2.5 is close to zero, suggesting their independence.

Table 1.
Spatial correlation and Covid-19 cases in different states.
| covid2020 | covid2021 | r2020 | r2021 | pop | density | pm2020 | pm2021 | temp2020 | temp2021 | wind2020 | wind2021 | |
| covid2020 | 1 | .948** | 0.045 | -0.023 | .982** | -0.095 | .468** | .289* | .338* | .333* | -0.012 | -0.011 |
| covid2021 | .948** | 1 | -0.071 | 0.1 | .967** | -0.084 | .340* | 0.168 | .349* | .338* | -0.092 | -0.101 |
| rate2020 | 0.045 | -0.071 | 1 | 0.253 | -0.083 | -0.169 | 0.09 | .368** | -0.13 | -0.113 | .374** | .392** |
| rate2021 | -0.023 | 0.1 | 0.253 | 1 | -0.054 | -0.082 | -0.139 | -0.067 | -0.105 | -0.136 | -.286* | -.304* |
| population | .982** | .967** | -0.083 | -0.054 | 1 | -0.082 | .450** | 0.244 | .324* | .316* | -0.065 | -0.065 |
| density | -0.095 | -0.084 | -0.169 | -0.082 | -0.082 | 1 | 0.092 | 0.09 | 0.12 | 0.104 | -0.1 | -0.104 |
| pm2020 | .468** | .340* | 0.09 | -0.139 | .450** | 0.092 | 1 | .803** | 0.076 | 0.071 | 0.032 | 0.057 |
| pm2021 | .289* | 0.168 | .368** | -0.067 | 0.244 | 0.09 | .803** | 1 | -0.052 | -0.046 | 0.17 | 0.188 |
| temp2020 | .338* | .349* | -0.13 | -0.105 | .324* | 0.12 | 0.076 | -0.052 | 1 | .998** | -0.115 | -0.083 |
| temp2021 | .333* | .338* | -0.113 | -0.136 | .316* | 0.104 | 0.071 | -0.046 | .998** | 1 | -0.078 | -0.046 |
| wind2020 | -0.012 | -0.092 | .374** | -.286* | -0.065 | -0.1 | 0.032 | 0.17 | -0.115 | -0.078 | 1 | .973** |
| wind2021 | -0.011 | -0.101 | .392** | -.304* | -0.065 | -0.104 | 0.057 | 0.188 | -0.083 | -0.046 | .973** | 1 |
| **. Correlation is significant at the 0.01 level (2-tailed). *. Correlation is significant at the 0.05 level (2-tailed). | ||||||||||||
Table 2 displays the time correlation between different variables. The correlation between COVID-19 cases in 2020 and 2021 is found to be r=0.384, which is much weaker than the spatial correlation observed earlier. This suggests that the relationship between COVID-19 cases in consecutive years is not as strong as the spatial relationship across different states. The correlation between temperatures in 2020 and 2021 is high, indicating that the temperature pattern remains consistent in most states of America and is repeated year after year. The 7th and 8th months of the year are typically the hottest months. Additionally, there is a high and significant correlation between wind speed in 2020 and 2021 (r=0.899). Wind speed and temperature tend to have an inverse relationship, where higher wind speeds are associated with cooler temperatures. Furthermore, the correlation between wind speed and PM2.5 is -0.685 and -0.613 (p-value <0.01) for the years 2020 and 2021, respectively. This indicates that when wind speed is higher, PM2.5 levels tend to be lower. Regarding COVID-19 cases, there is a positive correlation with PM2.5 in both 2020 (r=0.111) and 2021 (r=0.235).
Table 2.
Temporal correlation between pollution and Covid-19 cases.
| covid2020 | covid2021 | temp2020 | temp2021 | wind2020 | wind2021 | pm2020 | pm2021 | ||
|---|---|---|---|---|---|---|---|---|---|
| covid2020 | 1 | 0.384 | -0.175 | -0.104 | -0.273 | -0.182 | 0.111 | -0.005 | |
| covid2021 | 0.384 | 1 | -0.455 | -0.398 | -0.375 | -0.176 | 0.355 | 0.235 | |
| temp2020 | -0.175 | -0.455 | 1 | .986** | -0.529 | -.620* | 0.295 | 0.528 | |
| temp2021 | -0.104 | -0.398 | .986** | 1 | -0.551 | -.603* | 0.327 | 0.477 | |
| wind2020 | -0.273 | -0.375 | -0.529 | -0.551 | 1 | .899** | -.685* | -.689* | |
| wind2021 | -0.182 | -0.176 | -.620* | -.603* | .899** | 1 | -0.556 | -.613* | |
| pm2020 | 0.111 | 0.355 | 0.295 | 0.327 | -.685* | -0.556 | 1 | 0.331 | |
| pm2021 | -0.005 | 0.235 | 0.528 | 0.477 | -.689* | -.613* | 0.331 | 1 | |
| **. Correlation is significant at the 0.01 level (2-tailed). *. Correlation is significant at the 0.05 level (2-tailed). | |||||||||
4. Discussion
Our study employed spatial and temporal correlation analyses to explore the relationships between wind, temperature, pollution, population density, and COVID-19 cases. The findings suggest correlations between pollution and COVID-19 cases but caution against making direct causative conclusions. While many studies have shown a correlation between air pollution and the number of COVID-19 infections, it does not imply causality. During lockdown periods, we observed a decrease in pollution, and studies have shown that the disease itself caused a decrease in air pollution [33]. However, this correlation does not indicate causation but rather reflects the simultaneous occurrence of two phenomena. Observing similar patterns between the graphs of mortality and infection rates in Europe [34], researchers may be inclined to automatically assume that pollution has a strong effect on COVID-19. There are several reasons why caution is necessary in making such conclusions:
1-Correlation does not imply causation: Just because two variables (in this case, air pollution and COVID-19 outcomes) show similar patterns does not necessarily mean that one directly causes the other. There could be other factors at play that are responsible for the observed associations. To demonstrate the potential for such errors, you used the rate of infected people (the number of infected individuals divided by the population of the state) and found that its correlation with air pollution was close to zero. This finding suggests that there is no strong linear relationship between air pollution and the rate of COVID-19 infections.
2-Confounding factors: The observed patterns in covid-19 cases could be influenced by numerous confounding factors, such as population. These factors may influence both air pollution levels and the spread of COVID-19 independently [35]. Although the spatial correlation in Table 1 shows the effect of population on corona and pollution at a significant level (p-value<0.01). Population is one such confounding factor that can impact both air pollution levels and the spread of COVID-19 independently. A larger population in an area may lead to more reported COVID-19 cases due to the increased likelihood of encountering infected individuals. However, this correlation does not imply that population size directly causes the occurrence of COVID-19 cases. If population size were the primary determinant of COVID-19 cases, then population density would also have a similar effect on both COVID-19 cases and air pollution (But the correlation is close to zero).
3-Regional variations : Consistent with previous research [26,36] areas experiencing higher wind speeds tend to have lower levels of PM2.5 pollution. Interestingly, we also observed a temporal correlation between lower wind speeds and increased COVID-19 cases. This temporal correlation suggests that reduced wind speeds might contribute to higher COVID-19 case numbers. However, when examining the spatial correlation, we found a positive association. This suggests that factors beyond just wind speed and pollution may influence the spatial distribution of COVID-19 cases.
5. Conclusions
The Covid-19 pandemic, caused by a highly transmissible virus from the SARS family, has affected more than 692 million people worldwide, resulting in over 6.9 million deaths as of the time of writing. While exposure to air pollution has been associated with increased vulnerability in COVID-19 patients, it cannot be conclusively stated that pollution directly causes COVID-19 exacerbation. Various factors such as temperature, lifestyle, population density, and nutrition also contribute to the incidence of COVID-19. Although exposure to air pollution has been linked to increased vulnerability to COVID-19, it is still uncertain whether vehicle pollution directly leads to COVID-19 exacerbation. Therefore, researchers should be aware of this when working with time-related data. Collecting data from different states or cities is essential to obtain a more comprehensive understanding of the complex interactions between air pollution and COVID-19. To establish a strong causal relationship between air pollution and COVID-19 outcomes, rigorous scientific investigations are required. Longitudinal studies with appropriate control of confounding factors, as well as experimental studies and causal modeling, are necessary to determine if there is a direct cause-and-effect relationship. While there is growing evidence suggesting that air pollution may exacerbate respiratory conditions and increase vulnerability to infections, including COVID-19, it is essential to avoid jumping to definitive conclusions based solely on visual observations of graphs.
Data and Materials availability
All the code files necessary to reproduce the results of this study are available at https://doi.org/10.5281/zenodo.8197105.
Competing of interests
The authors declare that they have no competing interests.
References
- Van Doremalen, N.; Bushmaker, T.; Morris, D. H.; Holbrook, M. G.; Gamble, A.; Williamson, B. N.; Tamin, A.; Harcourt, J. L.; Thornburg, N. J.; Gerber, S. I. , Aerosol and surface stability of SARS-CoV-2 as compared with SARS-CoV-1. New England journal of medicine 2020, 382(16), 1564–1567. [Google Scholar] [CrossRef] [PubMed]
- Groulx, N.; Urch, B.; Duchaine, C.; Mubareka, S.; Scott, J. A. , The Pollution Particulate Concentrator (PoPCon): A platform to investigate the effects of particulate air pollutants on viral infectivity. Science of the Total Environment 2018, 628, 1101–1107. [Google Scholar] [CrossRef]
- Czwojdzińska, M.; Terpińska, M.; Kuźniarski, A.; Płaczkowska, S.; Piwowar, A. Exposure to PM2. 5 and PM10 and COVID-19 infection rates and mortality: a one-year observational study in Poland. Biomedical journal 2021. [Google Scholar] [CrossRef]
- Renard, J.-B.; Surcin, J.; Annesi-Maesano, I.; Delaunay, G.; Poincelet, E.; Dixsaut, G. Relation between PM2. 5 pollution and Covid-19 mortality in Western Europe for the 2020–2022 period. Science of the Total Environment 2022, 848, 157579. [Google Scholar] [CrossRef]
- Zoran, M. A.; Savastru, R. S.; Savastru, D. M.; Tautan, M. N. Assessing the relationship between surface levels of PM2. 5 and PM10 particulate matter impact on COVID-19 in Milan, Italy. Science of the total environment 2020, 738, 139825. [Google Scholar] [CrossRef] [PubMed]
- Halos, S. H.; Al-Dousari, A.; Anwer, G. R.; Anwer, A. R. Impact of PM2. 5 concentration, weather and population on COVID-19 morbidity and mortality in Baghdad and Kuwait cities. Modeling Earth Systems and Environment 2021, 1–10. [Google Scholar]
- Setti, L.; Passarini, F.; De Gennaro, G.; Barbieri, P.; Licen, S.; Perrone, M. G.; Piazzalunga, A.; Borelli, M.; Palmisani, J.; Di Gilio, A. , Potential role of particulate matter in the spreading of COVID-19 in Northern Italy: first observational study based on initial epidemic diffusion. BMJ open 2020, 10(9), e039338. [Google Scholar] [CrossRef]
- Czwojdzińska, M.; Terpińska, M.; Kuźniarski, A.; Płaczkowska, S.; Piwowar, A. Exposure to PM2. 5 and PM10 and COVID-19 infection rates and mortality: A one-year observational study in Poland. biomedical journal 2021, 44(6), S25–S36. [Google Scholar] [CrossRef]
- Renard, J.-B.; Surcin, J.; Annesi-Maesano, I.; Poincelet, E. Temporal Evolution of PM2. 5 Levels and COVID-19 Mortality in Europe for the 2020–2022 Period. Atmosphere 2023, 14(8), 1222. [Google Scholar] [CrossRef]
- Bontempi, E. , First data analysis about possible COVID-19 virus airborne diffusion due to air particulate matter (PM): the case of Lombardy (Italy). Environmental Research 2020, 186, 109639. [Google Scholar] [CrossRef]
- Chaudhary, V.; Bhadola, P.; Kaushik, A.; Khalid, M.; Furukawa, H.; Khosla, A. , Assessing temporal correlation in environmental risk factors to design efficient area-specific COVID-19 regulations: Delhi based case study. Scientific Reports 2022, 12(1), 12949. [Google Scholar] [CrossRef] [PubMed]
- McDuffie, E. E.; Martin, R. V.; Spadaro, J. V.; Burnett, R.; Smith, S. J.; O’Rourke, P.; Hammer, M. S.; van Donkelaar, A.; Bindle, L.; Shah, V. , Source sector and fuel contributions to ambient PM2. 5 and attributable mortality across multiple spatial scales. Nature communications 2021, 12(1), 3594. [Google Scholar] [CrossRef] [PubMed]
- Nava, S.; Calzolai, G.; Chiari, M.; Giannoni, M.; Giardi, F.; Becagli, S.; Severi, M.; Traversi, R.; Lucarelli, F. Source apportionment of PM2. 5 in Florence (Italy) by PMF analysis of aerosol composition records. Atmosphere 2020, 11(5), 484. [Google Scholar] [CrossRef]
- Aljoufie, M.; Zuidgeest, M.; Brussel, M.; Van Maarseveen, M. Urban growth and transport: understanding the spatial temporal relationship. Urban transport XVII: urban transport and the environment in the 21st Century. WIT press, Southampton 2011, 315–328. [Google Scholar]
- Maniat, M.; Abdoli, R.; Raufi, P.; Marous, P. Trip Distribution Modeling Using Neural Network and Direct Demand Model.
- Manjeet; Airon, A.; Kumar, R.; Saifi, R., Temporal and spatial impact of lockdown during COVID-19 on air quality index in Haryana, India. Scientific Reports 2022, 12(1), 20046. [CrossRef]
- Ahmed, J.; Jaman, M. H.; Saha, G.; Ghosh, P. Effect of environmental and socio-economic factors on the spreading of COVID-19 at 70 cities/provinces. Heliyon 2021, 7(5). [Google Scholar] [CrossRef] [PubMed]
- Wong, H. S.; Hasan, M. Z.; Sharif, O.; Rahman, A. , Effect of total population, population density and weighted population density on the spread of Covid-19 in Malaysia. Plos one 2023, 18(4), e0284157. [Google Scholar] [CrossRef]
- Aw, S. B.; Teh, B. T.; Ling, G. H. T.; Leng, P. C.; Chan, W. H.; Ahmad, M. H. , The covid-19 pandemic situation in malaysia: Lessons learned from the perspective of population density. International journal of environmental research and public health 2021, 18(12), 6566. [Google Scholar] [CrossRef]
- Sy, K. T. L.; White, L. F.; Nichols, B. E. , Population density and basic reproductive number of COVID-19 across United States counties. PloS one 2021, 16(4), e0249271. [Google Scholar] [CrossRef]
- Wong, D. W.; Li, Y. , Spreading of COVID-19: Density matters. Plos one 2020, 15(12), e0242398. [Google Scholar] [CrossRef]
- Rocklöv, J.; Sjödin, H. , High population densities catalyse the spread of COVID-19. Journal of travel medicine 2020, 27(3), taaa038. [Google Scholar] [CrossRef] [PubMed]
- Hamidi, S.; Sabouri, S.; Ewing, R. , Does density aggravate the COVID-19 pandemic? Early findings and lessons for planners. Journal of the American Planning Association 2020, 86(4), 495–509. [Google Scholar] [CrossRef]
- Abdel-Rahman, A. A. In On the atmospheric dispersion and Gaussian plume model, Proceedings of the 2nd International Conference on Waste Management, Water Pollution, Air Pollution, Indoor Climate, Corfu, Greece, 2008.
- Bashir, M. F.; Ma, B.; Komal, B.; Bashir, M. A.; Tan, D.; Bashir, M. , Correlation between climate indicators and COVID-19 pandemic in New York, USA. Science of the Total Environment 2020, 728, 138835. [Google Scholar] [CrossRef] [PubMed]
- Rendana, M. , Impact of the wind conditions on COVID-19 pandemic: a new insight for direction of the spread of the virus. Urban climate 2020, 34, 100680. [Google Scholar] [CrossRef]
- Shao, L.; Cao, Y.; Jones, T.; Santosh, M.; Silva, L. F.; Ge, S.; da Boit, K.; Feng, X.; Zhang, M.; BéruBé, K. COVID-19 mortality and exposure to airborne PM2. 5: A lag time correlation. Science of the Total Environment 2022, 806, 151286. [Google Scholar] [CrossRef]
- Agency, U. S. E. P., Pre-Generated Data Files. https://aqs.epa.gov/aqsweb/airdata/download_files.html#Annual 2020,2021.
- Information, N. C. f. E., https://www.ncei.noaa.gov/access/monitoring/climate-at-a-glance/statewide/time-series.
- Kanchan, K.; Gorai, A. K.; Goyal, P. , A review on air quality indexing system. Asian Journal of Atmospheric Environment 2015, 9(2), 101–113. [Google Scholar] [CrossRef]
- University, J. H. , time series covid19 confirmed US https://github.com/CSSEGISandData.
- Akoglu, H. User’s guide to correlation coefficients. Turkish journal of emergency medicine 2018, 18(3), 91–93. [Google Scholar] [CrossRef]
- Su, Z.; Lin, L.; Xu, Z.; Chen, Y.; Yang, L.; Hu, H.; Lin, Z.; Wei, S.; Luo, S. , Modeling the Effects of Drivers on PM2.5 in the Yangtze River Delta with Geographically Weighted Random Forest. Remote Sensing 2023, 15(15), 3826. [Google Scholar] [CrossRef]
- Renard, J.-B.; Surcin, J.; Annesi-Maesano, I.; Poincelet, E. Temporal Evolution of PM2.5 Levels and COVID-19 Mortality in Europe for the 2020–2022 Period. Atmosphere 2023, 14(8), 1222. [Google Scholar]
- Kelly, S. L.; Shattock, A. J.; Ragettli, M. S.; Vienneau, D.; Vicedo-Cabrera, A. M.; de Hoogh, K. , The Air and Viruses We Breathe: Assessing the Effect the PM2.5 Air Pollutant Has on the Burden of COVID-19. Atmosphere.
- Coşkun, H.; Yıldırım, N.; Gündüz, S. , The spread of COVID-19 virus through population density and wind in Turkey cities. Science of the Total Environment 2021, 751, 141663. [Google Scholar] [CrossRef]
Disclaimer/Publisher’s Note: The statements, opinions and data contained in all publications are solely those of the individual author(s) and contributor(s) and not of MDPI and/or the editor(s). MDPI and/or the editor(s) disclaim responsibility for any injury to people or property resulting from any ideas, methods, instructions or products referred to in the content. |
© 2023 by the authors. Licensee MDPI, Basel, Switzerland. This article is an open access article distributed under the terms and conditions of the Creative Commons Attribution (CC BY) license (http://creativecommons.org/licenses/by/4.0/).
Copyright: This open access article is published under a Creative Commons CC BY 4.0 license, which permit the free download, distribution, and reuse, provided that the author and preprint are cited in any reuse.


