

Submitted:
15 August 2023
Posted:
15 August 2023
You are already at the latest version
Abstract
Background: In this secondary analysis of the Supporting the Modification of Lifestyle In Lowered Emotional States (SMILES) randomised controlled trial, we investigated if the beneficial effects of a dietary intervention on clinical depression were driven, in part, by reducing the consumption of foods classified as ultra-processed.Methods: The SMILES trial enrolled 67 adults with major depressive disorder, randomly assigning them to either a 12-week modified Mediterranean dietary intervention or a social support control. Our analysis included 44 participants with non-missing dietary data and at least one valid Montgomery–Åsberg Depression Rating Scale (MADRS) assessment at 12 weeks of follow-up. The Nova food classification system was used to estimate the proportion of ultra-processed foods in the overall diet (percentage of grams) based on data from seven-day food diaries. We fitted linear regression models under blinded conditions to determine whether ultra-processed food intake-change from baseline to 12 weeks moderated the dietary intervention effects on depressive symptoms. We estimated mean differences in depressive symptoms along with ninety-five per cent confidence intervals (95%CIs).Results: For participants in the dietary intervention, there was an additional 2.5-point improvement in MADRS scores for each 10% reduction in the dietary share of ultra-processed foods compared to participants in the control group (between-group mean differences in depressive symptoms: −2.46, 95%CIs −4.71 to −0.20, p=0.039, η p 2 of 0.10).Conclusions: These preliminary findings suggest that the therapeutic benefit of a dietary intervention for depression may stem, at least in part, from reductions in the dietary share of ultra-processed foods.
Keywords:
ultra-processed food
; Nova food classification system
; major depressive disorder
; nutritional psychiatry
; secondary analysis
; randomised controlled trial
Introduction
Depression is a common mental disorder that can be difficult to treat. 1 Despite increases in the availability of treatments, a recent Global Burden of Disease Study reported there has been little reduction in the burden of mental disorders, including depression, since 1990. 2 Lifestyle treatments such as adjunctive dietary interventions may optimise the effects of current therapeutics. This notion is supported by four clinical trials involving human participants. 3-6 These trials have demonstrated the efficacy of adjunctive dietary interventions in reducing both depressive symptoms and clinical depression, especially among individuals with higher levels of depression at baseline. 3-6 One such trial was the Supporting the Modification of Lifestyle In Lowered Emotional States (SMILES) trial. This was the first experimental study to show that a dietary intervention comprising seven individual nutritional consulting sessions and delivered by a clinical dietitian was efficacious in reducing symptoms of clinical depression compared to a control condition (social support). 3 Over 12 weeks of follow-up, the reductions in depression observed in the dietary intervention group correlated strongly with the degree to which participants adhered to a modified Mediterranean diet. 3,7 Despite the novelty and compelling nature of the SMILES trial results overall, it remains uncertain as to whether the dietary intervention effects were partly driven by participants’ decreased consumption of highly refined, ultra-processed foods.
A contemporary food classification system that is widely used to help identify such foods is known as Nova. Nova was designed to classify foods according to the nature, extent, and purposes of industrial processing they have undergone. 8 This system includes four incrementally processed categories: minimally or un/processed foods (group 1); processed culinary ingredients (group 2); processed foods (group 3); and, ultra-processed foods (group 4). Nova defines the latter group, ultra-processed foods, as being manufactured through various industrial processes and predominantly comprised of high-yield and inexpensive ingredients. 8 These ingredients may include components extracted from foods and derived from further processing of foods, as well as compounds ‘never or rarely used in kitchens, or classes of additives whose function it is to make the final product palatable or more appealing’. 8 Despite the harms linked to the dietary share of ultra-processed foods, 9-11 recent country-specific purchase data show that for many food systems globally, an increasing trend in the variety and quantity of ultra-processed foods continues to grow. 12
Our recent systematic reviews and meta-analyses indicated that across 28 countries, ultra-processed foods accounted for between 17% to 56% of total daily energy intake. 9,10 We also showed through separate meta-analyses of cross-sectional and prospective cohort studies direct associations between greater consumption of ultra-processed foods and higher risks of both the prevalence and incidence of depressive outcomes, respectively. 10 However, the depression incidence meta-analysis was limited to just two prospective cohort studies that were available at the time of publication. 13,14 Since this meta-analysis, several other prospective cohort studies have been published. Two of these studies included adults from Australia and the United Kingdom and both reported that greater ultra-processed food consumption was associated with a higher risk of subsequent depressive outcomes. 15,16 One other study was conducted in a Brazilian sample of young adults and showed no association. 17 Although it remains important to further investigate associations across the lifespan, particularly in young adults, the existing evidence largely and directly links the consumption of ultra-processed foods to depressive outcomes. It thus stands to reason that the beneficial dietary intervention effects observed in the SMILES trial might have been driven, at least in part, by reductions in ultra-processed food intake. The aim of the study was to examine this using a secondary analysis approach.
Methods
Pre-registration and Ethics Approval
We prospectively registered this study with the Open Science Framework (OSF) registry (internet archive link: https://archive.org/details/osf-registrations-us5t7-v1), and we reported this study in concordance with the Consolidated Standards of Reporting Trials (CONSORT) guidelines. 18 The St Vincent’s Hospital, Barwon Health and Deakin University Human Research Ethics Committees provided approval for the original SMILES trial protocol, and written consent to participate was provided by the participants. 19 Approval for exemption from ethical review for the current study, in accordance with the National Statement on Ethical Conduct in Human Research (2007, updated 2018) Section 5.1.22, was provided by the Deakin University Human Research Ethics Committee (project number: 2022-050).
The study protocol for the original SMILES trial has been published elsewhere. 19 In brief, SMILES (2013-15) was a 12-week, parallel-group, single-blind, randomised controlled trial that tested the effect of an adjunctive dietary intervention in the treatment of moderate to severe depression (pre-registration via Australia and New Zealand Clinical Trials Register: ACTRN12612000251820). The inclusion criteria were assessed at the time of screening and included participants who: (1) had the capacity to give informed consent and were 18 years old or more; (2) met the criteria for a major depressive episode (MDE) diagnosis (as per the Diagnostic and Statistical Manual of Mental Disorders-4th edition [DSM-IV]); (3) had a Dietary Screening Tool score equal to or less than 75/104 (i.e., were considered to have scope for dietary improvement); and, (4) had a Montgomery–Åsberg Depression Rating Scale (MADRS) score equal to or more than 18/60. 3 The exclusion criteria included participants who: (1) within the two weeks prior to screening, had started treatment for depression (e.g., pharmacotherapy or psychotherapy); (2) had antidepressant therapy for the current MDE that had been unsuccessful at or above two times; (3) were involved in any dietary or physical activity intervention; (4) had serious aversions, allergies or intolerances to food; (5) had a substance use disorder and/or personality disorder as a primary clinical diagnosis; (6) had bipolar I or II disorder as a coexisting diagnosis; (7) had a systemic disease (known or suspected) that was not stable; and, (8) were pregnant. 3
In the original SMILES trial, a total of 67 individuals were enrolled (dietary intervention, n = 33; control, n = 34). 3 A clinical dietitian (Accredited Practising Dietitian) delivered the dietary intervention that was based on a modified Mediterranean diet model involving seven nutritional consulting sessions. 3 A research assistant delivered the control condition, which included a social support (‘befriending’) protocol that had the same visit schedule and length as the dietary intervention. 3 The primary outcome was depression symptom levels (MADRS scores) at 12 weeks. 3 To address our main aim of determining whether ultra-processed food intake-change from baseline to 12 weeks moderated the therapeutic benefit of the dietary intervention for depression compared to the control, participants who had food diary data and MADRS assessment across the trial duration were included (n = 44).
Dietary Assessment of Ultra-Processed Food
In the week leading up to the baseline and follow-up assessment, detailed information on foods and fluids consumed was collected for each participant using seven-day food diaries. 19 For this study, all food diary items were classified according to the Nova food classification system as unprocessed or minimally processed foods (Nova group 1), processed culinary ingredients (Nova group 2), processed foods (Nova group 3), and ultra-processed foods (Nova group 4). Examples of Nova’s classification of unprocessed or minimally processed foods (group 1) include fresh, squeezed, chilled, frozen or dried: fruits, grains, legumes, seeds, nuts, and vegetables, as well as milk (pasteurised or powdered) and natural yogurt (no artificial sweeteners or added sugar); 20 processed culinary ingredients (group 2) include butter, honey, lard, sugar, salt, and vegetable oils; 20 and, processed foods (group 3) are made from adding group 2 substances to group 1 foods, including bottled or canned: fruits, fish, legumes, and vegetables, as well as breads, cheeses, sugared or salted seeds and nuts, and smoked and salted meats. 20 Examples of Nova’s classification of ultra-processed foods (group 4) include carbonated drinks, confectionary (lollies or candy), biscuits (cookies), ‘instant’ noodles and soups, packaged buns, breads and snacks (savoury and sweet) and ready-to-eat or -heat and shelf-stable meals. 20 Further details regarding the Nova food classification system have been specified elsewhere. 8 We included all participants with food diary records (complete or incomplete), with the majority providing six- to seven-day records at baseline (89%) and follow-up (96%), respectively. Using the average of food diary records, the mean daily contribution of each Nova food group (listed above) to intake of total energy (kilojoules) and weight (grams) was calculated based on the AUStralian Food and NUTrient (AUSNUT) 2011-13 database that contains information for 5,740 foods and beverages. 21
Depressive Symptoms
The interviewer-rated MADRS was used to assess depressive symptoms at baseline and follow-up. MADRS assessment at 12 weeks follow-up was the primary outcome. The MADRS is the most widely used rating scale for depression, being a robust and psychometrically sound interviewer-rated instrument. 22 It consists of 10 items, each measured on a six-point scale and scores range from 0 to 60; greater symptom severity is reflected by higher MADRS scores. 22
Assessment of Covariates
An a priori approach to identifying covariates was undertaken by assessing previous relevant literature. 23-25 These covariates were measured at baseline via a structured interview and included: 1) sociodemographic characteristics: sex (men, women), age (continuous; years), highest level of education (pre-secondary education, post-secondary education), and household income (below $80,000 per year, at or above $80,000 per year); 2) lifestyle and health related behaviours: physical activity (continuous; a total Metabolic Equivalent of Task (MET) score was calculated for each participant as a summary of minutes per week of walking as well as moderate and vigorous physical activity), 26 smoking status (never smoked, current smoker, former smoker), alcohol intake (continuous; grams per day), and modified Mediterranean diet (ModiMedDiet) score (continuous; a total criterion-based score that comprised a maximum estimate of 120 and was calculated using prespecified absolute or normative goals for intakes of specific foods items, which were independent of individual-level characteristics); 7 and, 3) body mass index (continuous; calculated as kilograms divided by the square of participants’ height in metres). Sociodemographic characteristics and lifestyle and health-related behaviours were considered as potential confounders, whereas body mass index was hypothesised as an intermediate on the causal pathway (see below).
Statistical Analysis
Participant characteristics at baseline were described using frequency and percentage for categorical variables and mean and standard deviation (SD) for continuous variables. As per previous ultra-processed food studies, 27-30 we aimed to better represent intakes of ultra-processed foods that provided nil to minimal amounts of energy (e.g., non-sugar sweetened beverages). As such, we used the proportion of ultra-processed foods in weight (% grams per day) and adjusted for energy intake by using Willett’s residual method 31 to model our ultra-processed food intake variable in 10% increments. Analyses were performed according to modified intention-to-treat principles, 3 in which randomised participants were included if they had at least one valid follow-up MADRS assessment and non-missing food diary data.
Prior to running the main model, preliminary analyses via linear regression investigated a cross-sectional association between the consumption of ultra-processed food and MADRS scores at baseline (adjusted for sociodemographic characteristics and lifestyle and health-related behaviours as potential confounders), as well as whether baseline ultra-processed food intake moderated the dietary intervention effects on depressive symptoms at 12 weeks. For the main analysis, we examined via linear regression whether ultra-processed food intake-change from baseline to follow-up moderated the dietary intervention effects on depressive symptoms at 12 weeks. The outcome was follow-up MADRS scores, and the independent variables were randomly allocated treatment groups (dietary support, social support) and ultra-processed food intake-change from baseline to 12 weeks. A two-way interaction term between changes in ultra-processed food intake and treatment groups estimated the additional effects of the dietary intervention on improved MADRS scores arising from each 10% reduction in ultra-processed food consumption. The change from baseline to 12 weeks in ultra-processed food intake was included in the model as a continuous variable. As part of an exploratory post-hoc investigation aimed at enhancing interpretability and visual representation (not intended as a formal hypothesis test), we presented marginal mean estimates and graphical plots based on tertiles (categories) of changes in ultra-processed food intake. In this exploratory post-hoc analysis, the first tertile denotes the most substantial decrease in ultra-processed food intake, while the third tertile represents the least reduction. While the main analysis adjusted for baseline MADRS scores, further adjustment for potential confounders formed part of our additional sensitivity analyses (see below) given that we anticipated no or minimal baseline imbalances owing to randomisation. 32
Finally, sensitivity analyses were undertaken by i) controlling for relevant baseline confounding variables (i.e. sex, age, education, household income, smoking status, alcohol intake, physical activity and ModiMedDiet score), ii) excluding participants with a comorbid disorder(s) (n = 29/44) and, iii) imputing missing data for participants without food diary data at follow-up (n = 12/56) using multi-imputation methods; the results of these sensitivity analyses were compared with our main mediation analysis. Body mass index has been implicated as a potential intermediate in the ultra-processed food-depression relationship. 25,33 Given that 1) the total ‘effect’ of our ultra-processed food moderator variable on the relationship between treatment groups and MADRS scores at follow-up was of primary interest, and 2) body mass index did not qualify as a confounder, body mass index was thus not adjusted for as part of our sensitivity analyses. 34
Mean differences in depressive symptoms for each 10% reduction in ultra-processed food consumption were estimated along with ninety-five per cent confidence intervals (95%CIs). As strongly recommended in the literature, 35-38 and as per our pre-registered analysis plan, instead of relying on an arbitrary probability (p-)value threshold, we analysed the direction and magnitude of effect estimates and their corresponding 95%CIs, along with precise p-values, to evaluate the robustness of our findings. In addition, partial eta squared (η p 2) was estimated as an effect size measure. The effect sizes were interpreted using the following conventions: small (η p 2 ≥ 0.01), medium (η p 2 ≥ 0.06) and large (η p 2 ≥ 0.14). 39
All analyses were undertaken using R version 4.2.1 (2022-06-23) 40 and by the first (MML) and second (ML) authors who were blinded to group allocation.
Results
Of the 67 participants enrolled in the SMILES trial, 56 completed the MADRS assessment at baseline and 12 weeks follow-up, and of these, 44 participants with both baseline and follow-up food diary data were included. Table 1 details the participants’ characteristics by group allocation at baseline. Participants in the dietary intervention group were, on average, more likely to be female, younger, consume more alcohol and engage in less physical activity than participants in the control group. Participants in the dietary intervention group also had lower ModiMedDiet scores on average than the social support control group at baseline. This is similar to the results reported in the original SMILES trial results paper, 3 and is in line with the greater average consumption of ultra-processed food observed for participants in the dietary intervention group versus control group (calculated as the percentage contribution to the overall diet in weight [% grams] per day).

Table 1.
Descriptive Characteristics of the Study Population at Baseline.
| Variable | Dietary support intervention group | Social support control group | Total |
| n – Frequency | 31 | 28 | 59 |
| MADRS (0-60) – Mean (SD) | 26.3 (5.0) | 24.0 (4.2) | 25.2 (4.7) |
| Female – n (%) | 25 (80.6%) | 18 (64.3%) | 43 (72.9%) |
| Age – Mean (SD) | 37.6 (10.9) | 42.3 (15.1) | 39.8 (13.2) |
| Post-secondary school education – n (%) | 20 (64.5%) | 19 (67.9%) | 39 (66.1%) |
| Household income above $80,000/year – n (%) | 6 (19.4%) | 5 (17.9%) | 11 (18.6%) |
| Current smoker – n (%) | 2 (7.1%) | 6 (21.4%) | 8 (14.3%) |
| Alcohol (g/d) – Mean (SD) | 11.5 (22.4) | 5.8 (7.4) | 8.8 (17.2) |
| Physical activity (total MET score) – Mean (SD) | 2,270.3 (2682.7) | 2,852.1 (2767.9) | 2,550.0 (2,713.0) |
| Body mass index (kg/m2) – Mean (SD) | 30.3 (9.6) | 28.0 (6.1) | 29.2 (8.2) |
| ModiMedDiet Score (0-120) – Mean (SD) | 35.7 (13.0) | 46.6 (14.0) | 40.8 (14.4) |
| Total proportion of ultra-processed food (% g/d) – Mean (SD) | 31.3 (21.4) | 22.5 (10.2) | 27.1 (17.5) |
Note: MADRS (0-60), Montgomery-Åsberg Depression Rating Scale; kg/m2, kilograms/metres2; ModiMedDiet, modified Mediterranean diet; g/d, grams per day; kJ/d, kilojoules per day.
In our initial analyses, baseline ultra-processed food consumption was not associated with baseline MADRS scores (mean depressive symptoms: 0.59, 95%CIs −0.28 to 1.45, p=0.188, η p 2 = 0.04), nor did baseline ultra-processed food consumption moderate the dietary intervention effects at follow-up (between-group mean differences in depressive symptoms: −1.40; 95%CIs −3.94 to 1.14, p=0.287, η p 2 = 0.03). In our main analysis, and for participants in the dietary intervention, there was an additional 2.5-point improvement in MADRS scores for each 10% reduction in ultra-processed food consumption compared to participants in the control group (between-group mean differences in depressive symptoms: −2.46, 95%CIs −4.71 to −0.20, p=0.039). The effect size for this interaction was medium to large, with a η p 2 of 0.10. Table S1 shows the average within-group and between-group differences in MADRS scores and ultra-processed food consumption during the trial.
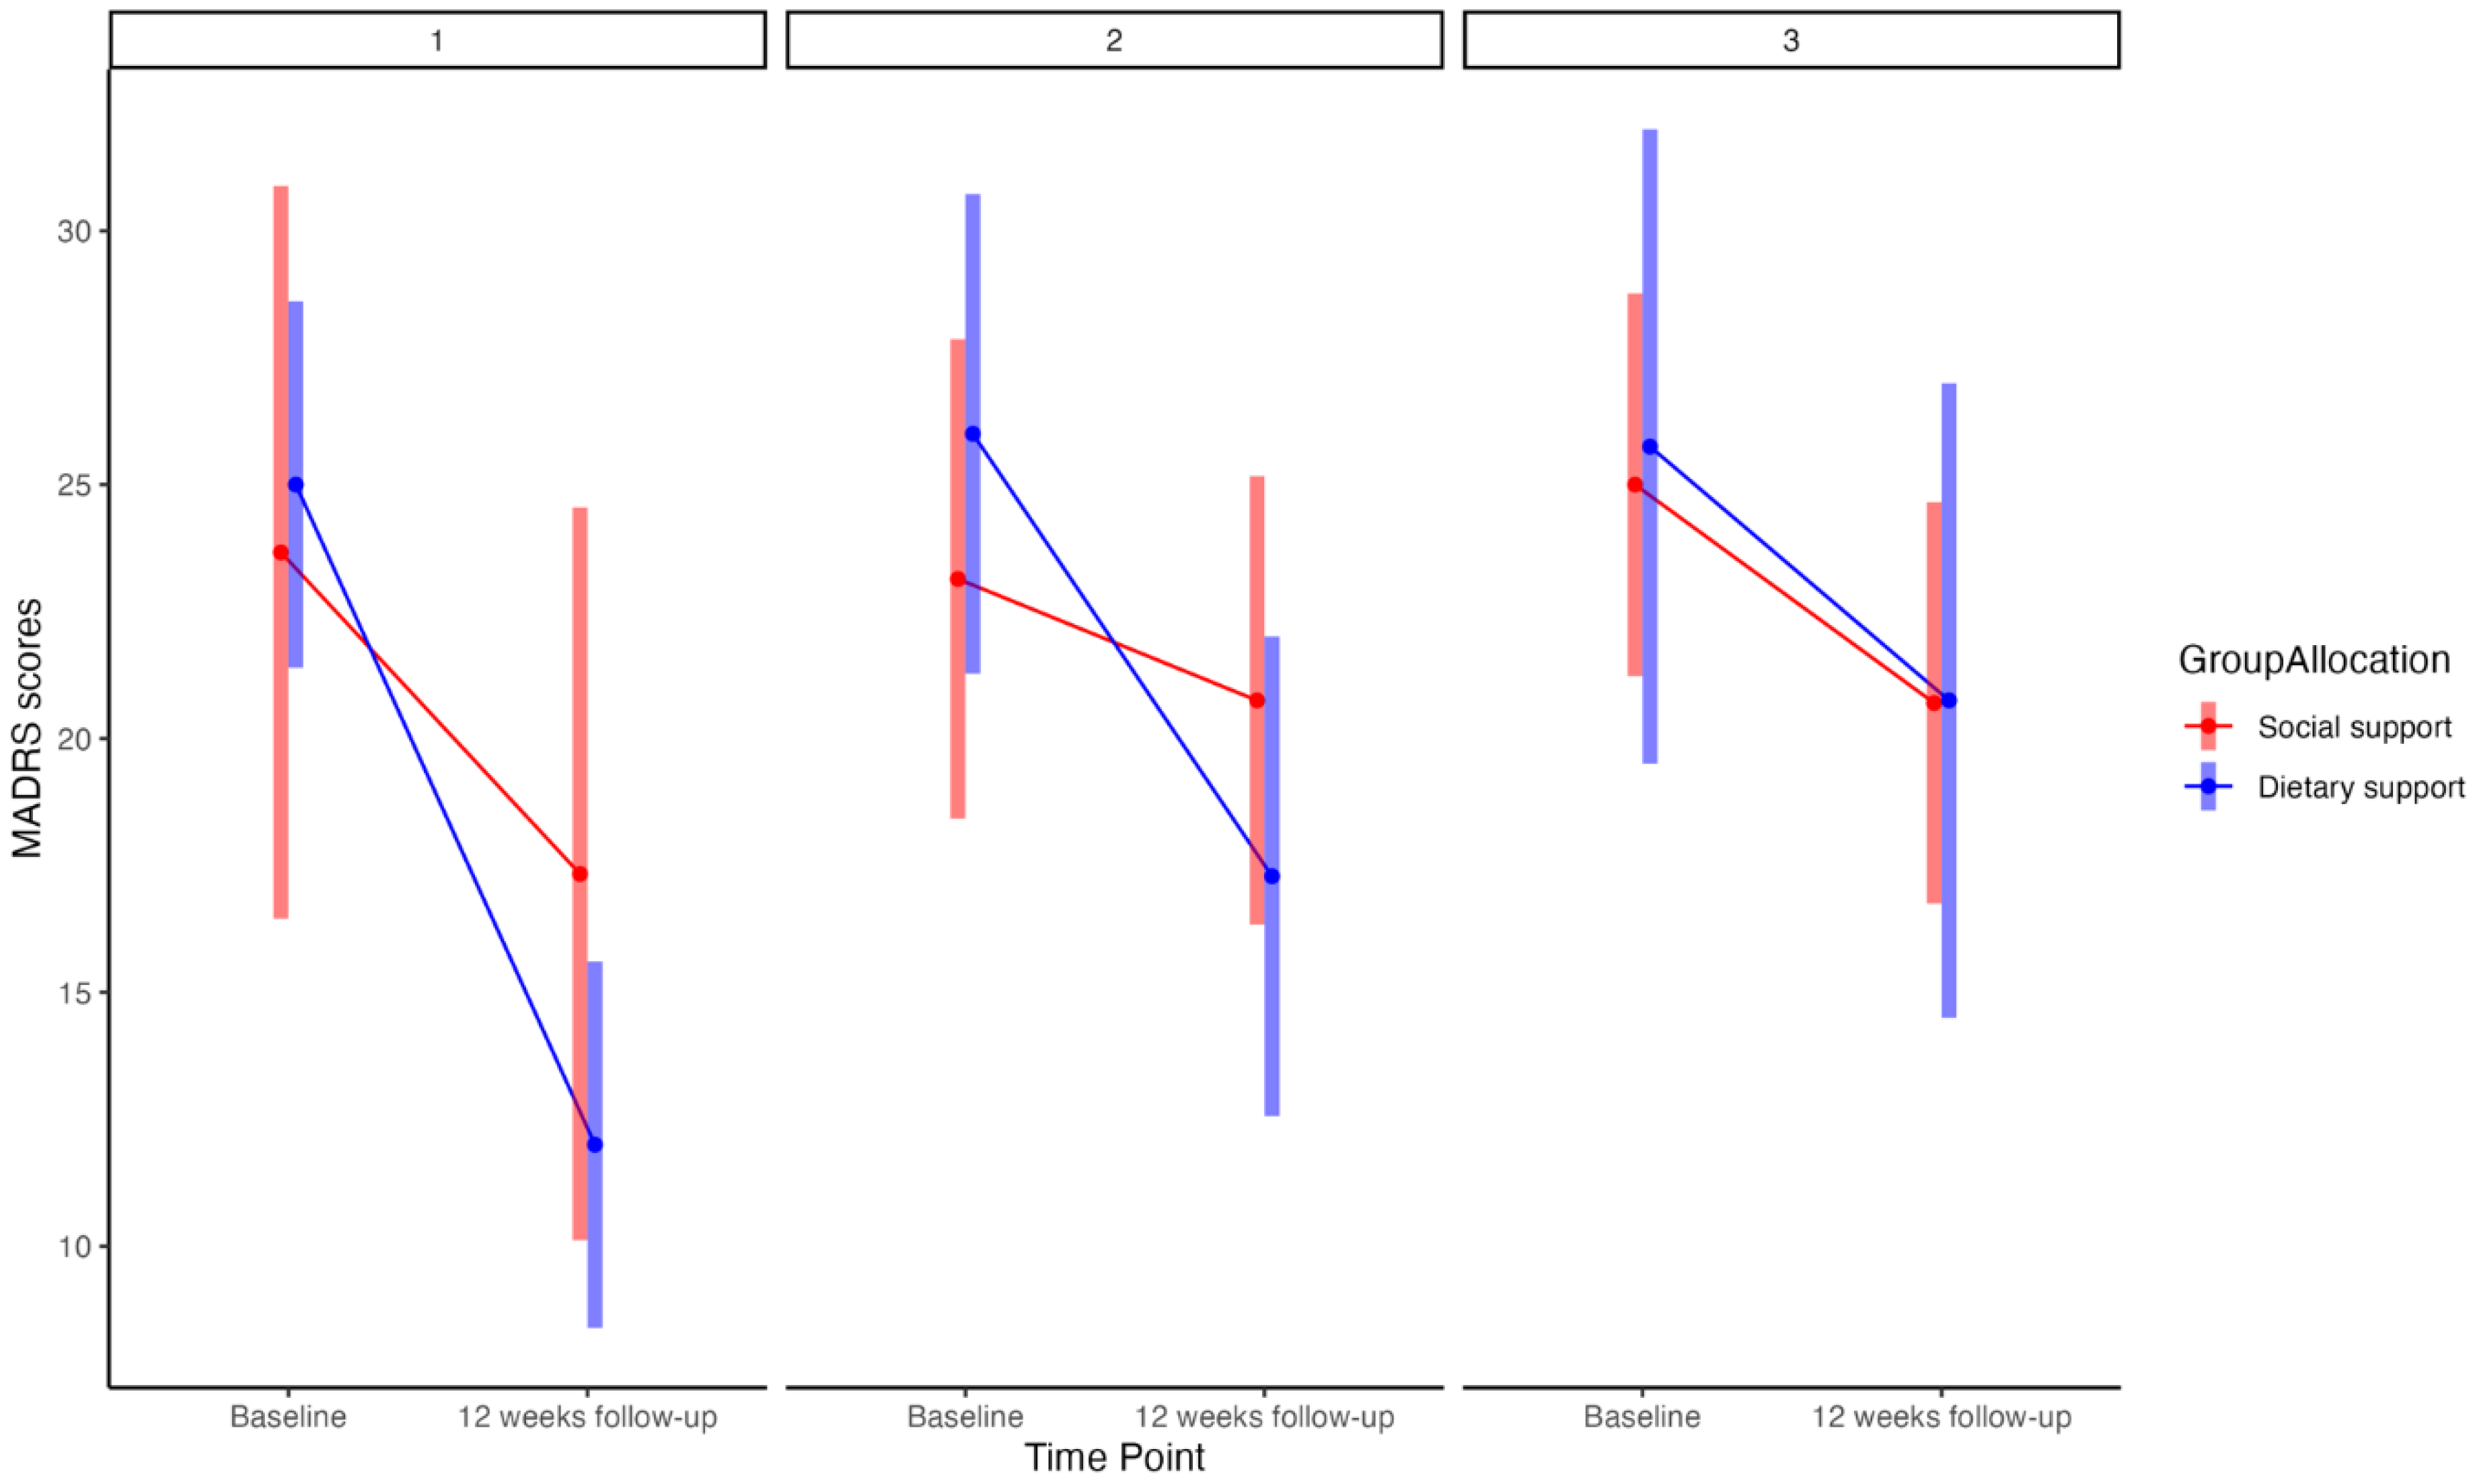
The exploratory post-hoc analysis, including estimates and graphical plots, supported our primary finding and highlighted a dose-response relationship (Figure 1). This relationship pertained to the tertiles of decreasing ultra-processed food consumption. Moving from the most substantial reduction in ultra-processed food to the least, there were between-group marginal mean differences in MADRS scores of: 6.67 (95%CIs −3.39 to 10.45), 6.59 (95%CIs −2.72 to 8.38), and 0.30 (95%CIs −3.11 to 9.59) for tertiles one through three, respectively.
Figure 1.
Note: MADRS (0-60)=Montgomery-Åsberg Depression Rating Scale; panels 1, 2, and 3=tertiles one, two and three (highest, middle range, and lowest reduction in ultra-processed food intake, respectively).
Figure 1.
Note: MADRS (0-60)=Montgomery-Åsberg Depression Rating Scale; panels 1, 2, and 3=tertiles one, two and three (highest, middle range, and lowest reduction in ultra-processed food intake, respectively).
Sensitivity Analyses
Our main finding that ultra-processed food intake-change from baseline to follow-up partly moderated the dietary intervention effects on MADRS scores at follow-up remained relatively stable across sensitivity analyses that controlled for relevant baseline confounding variables (i.e. sex, age, education, household income, smoking status, alcohol intake, physical activity and ModiMedDiet score) (between-group mean differences in depressive symptoms: −3.44, 95%CIs −6.09 to −0.79, p=0.018, η p 2 = 0.23). The direction and magnitude of our main result also remained stable after imputing missing data for participants without food diary data at follow-up (between-group mean differences in depressive symptoms: −2.26, 95%CIs −4.8 to 0.32, p=0.093). After excluding individuals with comorbid disorder(s) (n = 29/44), the effect size was reduced (between-group mean differences in depressive symptoms: −1.06, 95%CIs −4.74 to 2.61, p=0.583, η p 2 = 0.03). In both multiple imputation and exclusion sensitivity analyses, the confidence interval widened and included the null.
Discussion
We conducted a secondary analysis of the SMILES randomised controlled trial and primarily sought to assess whether the therapeutic benefits of a dietary intervention on clinical depression were at least partly driven by changes in ultra-processed food intake. We found that reductions in the dietary share of ultra-processed foods moderated the relationship between the dietary intervention and the improvement in depressive symptoms. This suggests that the beneficial effect of the dietary intervention on depressive symptoms was, in part, a result of the decrease in ultra-processed food intake.
The finding that changes in ultra-processed food intake moderated the dietary intervention effects on clinical depression over a reasonably brief period (12 weeks) highlights ultra-processed food consumption as a viable intervention target. It also suggests that recommendations for modifying dietary habits should include a specific focus on reducing the consumption of ultra-processed foods. This notion is further supported by compelling evidence from epidemiological studies and meta-analyses, which have demonstrated strong associations between greater ultra-processed food consumption and higher risks of both the prevalence and incidence of depressive outcomes. 9,10,13-16 It is also supported by the fact our results most notably held after controlling for relevant baseline confounding variables (i.e. sex, age, education, household income, smoking status, alcohol intake, physical activity and ModiMedDiet score). Although we did not further adjust for body mass index as part of our sensitivity analyses (as per the rationale outlined in our Methods section), it is worth highlighting that on average no between-group differences at baseline were observed (see Table 1), nor were there any changes to body mass index within or between-groups at follow-up (see Table S1 and 3). This is consistent with the SMILES’ ad libitum and weight-neutral dietary approach and findings, where dietary improvement without weight loss was the focus and where improvements in depressive disorders occurred independently of weight changes. 3
Participants in the dietary intervention achieved an additional 2.5-point improvement in MADRS with each 10% reduction in ultra-processed consumption across the trial duration compared to participants in the control group. This is on top of the average 7-point between-group difference in MADRS reported in the SMILES’ primary results paper. 3 When taking into account a previously established minimal clinically important difference threshold of 2 points in MADRS, 41 this finding underscores clinically meaningful decreases in depressive symptoms that arise from overall dietary improvement—and decreases in ultra-processed food consumption in particular.
There are several biological mechanisms of action by which a reduction in ultra-processed food consumption may influence depressive symptoms. The Nova system does not classify foods based on their respective nutritional composition. 8 However, numerous ultra-processed food items contain nutrient-poor profiles, in addition to non-nutritive components produced via or used during intensive food processing, that may elicit the prevalence, development and symptom severity of depression through various pathways, including oxidative stress, inflammation and the gut microbiota. 42-49 Indeed, ultra-processed food consumption has been implicated in altering the gut microbiota composition 50 and prospectively 51 and cross-sectionally 24,52-54 associated with inflammation and oxidative damage in Australian, Brazilian, Portuguese and Iranian populations. Both the nutritive and non-nutritive aspects of foods classified as ultra-processed and the proposed mechanisms of action they have been associated with will require further investigation in large-scale human trials.
Strengths and Limitations
One strength of our study is that we measured depressive symptoms using the interviewer-rated MADRS tool rather than relying on self-reported methods, which approximately 65% of other ultra-processed food-mental disorder studies have done 10 and where less precision in estimates remains possible. 55 The prospective nature of the data collection in the context of a rigorous clinical trial is a further strength. Another strength of our study includes the use of food diary data to calculate ultra-processed food consumption, which can provide greater precision over food frequency questionnaires, 56 as well as the application of a rigorous method to classify food diary data according to the Nova system following Machado et al (2019). 57 In addition to the benefit of food diary data measured at the start and end of the trial (which allowed us to assess change in ultra-processed food intake), these measurement-related factors may have increased the sensitivity of our models, while also permitting us to provide descriptive estimates in a confirmed clinical population.
A limitation of our study is that the SMILES trial originally recruited participants with major depression on the basis of existing poor-quality dietary intake. This means that the generalisability of the current secondary analysis may not translate to the broader population of people with a depression diagnosis. However, we observed that average ultra-processed food intake at the beginning of the trial contributed 27 per cent to total food intake in weight (% grams per day) (see Table 1). This estimate is comparable to our recent population-based cohort study assessing longitudinal associations between ultra-processed food and depression in Australian adults (25% grams per day), 15 as well as various general and diseased populations in other high-income countries such as the United Kingdom and the United States of America. 58 This suggests that (poor) dietary quality appears to be relatively concordant between the wider population and individuals with depressive illness and that our results may have reasonable external validity.
As discussed as a key limitation in the original results paper, 3 we also cannot rule out the possibility of expectation bias and that the inability to blind participants to their intervention may account for the associations between dietary intake, including ultra-processed food consumption, and depressive symptoms. However, this is a limitation of the field in general where it is difficult to blind participants in non-pharmacotherapeutic-based intervention studies involving nutrition, physical activity and psychotherapeutics. 59 Another limitation is that ultra-processed food consumption was not registered as a secondary outcome in the original trial registration. This is because its concept at the time of designing the SMILES trial in 2013 was relatively unknown, with details and principles of the Nova food classification system, along with its concept of ultra-processed food, first published in 2009. 60 Notably, however, we sought to protect against publication bias by prospectively pre-registering our analysis plan with the OSF registry (see Methods section).
Finally, our study was a secondary analysis of existing data from a trial with a small sample size and the observed results indicate associations that may not necessarily be causal. To assess the causal effects of ultra-processed food intake on depressive symptoms and understand how these effects may unfold over time, prospective randomised studies with mechanistic investigations are needed. Such studies will play a critical role in establishing causality and confirming whether the therapeutic benefit of dietary intervention for depression is driven, in part, by reductions in ultra-processed food consumption, as implied by our findings. However, while we acknowledge the preliminary nature of our secondary analysis findings, the insights gained can serve as valuable groundwork and justification for conducting future research on the causal effects of ultra-processed food on depressive symptoms, with a more targeted and controlled approach. Indeed, secondary analyses, in general, can provide insights that may be used to inform the development of research questions, study designs and sample size calculations for prospective randomised trials specifically focused on examining causality. 61 Relatedly, our relatively small sample size is another limitation, particularly for the preliminary analyses that showed point estimates in the expected direction but were not statistically significant, with further larger studies needed.
Conclusions
In a secondary analysis, we report that the degree of change in the dietary share of ultra-processed foods appeared to moderate the effect of the dietary intervention on mood improvements across the trial duration. Our secondary analysis suggests that measures of ultra-processed food consumption should be considered when analysing the outcomes of novel lifestyle treatments for depression. It also provides preliminary experimental evidence that the benefits of dietary improvement as an adjunctive treatment for major depressive disorder may be partly driven by reductions in the dietary share of ultra-processed foods. To support causal inference, future sufficiently powered prospective randomised controlled trials ought to focus on replicating our findings, as well as testing whether and how reducing ultra-processed foods may independently facilitate reductions in depressive symptoms.
Supplementary Materials
The following supporting information can be downloaded at the website of this paper posted on Preprints.org.
Funding
This research received no external funding.
Institutional Review Board Statement
The current study was approved for exemption from ethical review in accordance with the National Statement on Ethical Conduct in Human Research (2007, updated 2018) Section 5.1.22 by the Deakin University Human Research Ethics Committee (project number: 2022-050). The study protocol for the original SMILES trial was approved by St Vincent’s Hospital, Barwon Health and Deakin University Human Research Ethics Committees.
Informed Consent Statement
Participants provided written consent to participate.
Acknowledgements and Affiliations (including Conflicts of Interest)
We would like to thank Ms Sophie Mahoney and Xyris Pty Ltd for contributing their time and efforts to part of the data curation process for this study.
The Food & Mood Centre has received Grant/Research support from Fernwood Foundation, Wilson Foundation, the A2 Milk Company, and Be Fit Foods. M.M.L. has previously received a Deakin University Scholarship. M.L. and P.M. are currently funded by an Alfred Deakin Postdoctoral Research Fellowship. F.N.J. is currently supported by an NHMRC Investigator Grant L1 (#1194982) and has received Grant/Research support from the Brain and Behaviour Research Institute, the National Health and Medical Research Council (NHMRC), Australian Rotary Health, the Geelong Medical Research Foundation, the Ian Potter Foundation, Eli Lilly, Meat and Livestock Australia, Woolworths Limited, the Fernwood Foundation, Wilson Foundation, the A2 Milk Company, Be Fit Foods, and The University of Melbourne, and has received speakers honoraria from Sanofi-Synthelabo, Janssen Cilag, Servier, Pfizer, Health Ed, Network Nutrition, Angelini Farmaceutica, Eli Lilly and Metagenics. F.N.J. has written two books for commercial publication and has a personal belief that good diet quality is important for mental and brain health. A.O. is supported by a Future Leader Fellowship (#101160) from the Heart Foundation Australia and Wilson Foundation. She has received research funding from National Health & Medical Research Council, Australian Research Council, University of Melbourne, Deakin University, Sanofi, Meat and Livestock Australia and Woolworths Limited and Honoraria from Novartis. A.L. has received grants, fellowships and research support from the University of New South Wales, the University of Melbourne, RMIT University, Deakin University, the National Health and Medical Research Council (NHMRC), Australian Academy of Science, National Institutes of Health (NIH), and The Jack Brockhoff Foundation. A.O.W. is supported by the São Paulo Research Foundation (FAPESP) with a PhD scholarship (FAPESP process: 2019/24124-7). A.L. has received honoraria and travel funds from Sydney University, the University of Technology Sydney, American Epilepsy Society, Epilepsy Society of Australia, International Human Microbiome Congress, European Society of Neurogastroenterology, Australian and New Zealand College of Anaesthetists, Falk Foundation and Fonds de la Recherche Scientifique (FNRS). T.R. has received grants, fellowships and research support from University of the Sunshine Coast, Australian Postgraduate Awards, Fernwood Foundation, Roberts Family Foundation, Be Fit Food and Wilson Foundation. T.R. received consultancy, honoraria and travel funds from Oxford University Press, the University of Melbourne, the University of Sydney, Bond University, University of Southern Queensland, Dietitians Association of Australia, Nutrition Society of Australia, The Royal Australian and New Zealand College of Psychiatrists, Academy of Nutrition and Dietetics, Black Dog Institute, Australian Rotary Health, Australian Disease Management Association, Department of Health and Human Services, Primary Health Networks, Barwon Health, West Gippsland Healthcare Group, Central West Gippsland Primary Care Partnership, Parkdale College, City of Greater Geelong and Global Age. M.B. is supported by a NHMRC Senior Principal Research Fellowship (#1156072). W.M. is currently funded by an NHMRC Investigator Grant (#2008971) and a Multiple Sclerosis Research Australia early-career fellowship. W.M. has previously received funding from the Cancer Council Queensland and university grants/fellowships from La Trobe University, Deakin University, University of Queensland, and Bond University. W.M. has received industry funding and/or has attended events funded by Cobram Estate Pty. Ltd. and Bega Dairy and Drinks Pty Ltd. W.M. has received travel funding from Nutrition Society of Australia. W.M. has received consultancy funding from Nutrition Research Australia and ParachuteBH. W.M. has received speakers honoraria from The Cancer Council Queensland and the Princess Alexandra Research Foundation. This paper presents independent research. The views expressed in this publication are those of the authors and not necessarily those of the acknowledged institution.
References
- Rush, A. J., Aaronson, S. T. & Demyttenaere, K. Difficult-to-treat depression: A clinical and research roadmap for when remission is elusive. Aust N Z J Psychiatry 53, 109-118. https://doi.org/10.1177/0004867418808585 (2019). [CrossRef]
- Global, regional, and national burden of 12 mental disorders in 204 countries and territories, 1990-2019: a systematic analysis for the Global Burden of Disease Study 2019. The Lancet Psychiatry 9, 137-150. https://doi.org/10.1016/S2215-0366(21)00395-3 (2022). [CrossRef]
- Jacka, F. N. et al. A randomised controlled trial of dietary improvement for adults with major depression (the ‘SMILES’ trial). BMC Medicine 15, 23. https://doi.org/10.1186/s12916-017-0791-y (2017). [CrossRef]
- Parletta, N. et al. A Mediterranean-style dietary intervention supplemented with fish oil improves diet quality and mental health in people with depression: A randomized controlled trial (HELFIMED). Nutr Neurosci 22, 474-487. https://doi.org/10.1080/1028415x.2017.1411320 (2019). [CrossRef]
- Francis, H. M. et al. A brief diet intervention can reduce symptoms of depression in young adults – A randomised controlled trial. PLOS ONE 14, e0222768. https://doi.org/10.1371/journal.pone.0222768 (2019). [CrossRef]
- Bayes, J., Schloss, J. & Sibbritt, D. The effect of a Mediterranean diet on the symptoms of depression in young males (the "AMMEND" study): A Randomized Control Trial. Am J Clin Nutr. https://doi.org/10.1093/ajcn/nqac106 (2022). [CrossRef]
- Opie, R. S., O’Neil, A., Jacka, F. N., Pizzinga, J. & Itsiopoulos, C. A modified Mediterranean dietary intervention for adults with major depression: Dietary protocol and feasibility data from the SMILES trial. Nutr Neurosci 21, 487-501. https://doi.org/10.1080/1028415x.2017.1312841 (2018). [CrossRef]
- Monteiro, C. A. et al. Ultra-processed foods: what they are and how to identify them. Public Health Nutr 22, 936-941. https://doi.org/10.1017/s1368980018003762 (2019). [CrossRef]
- Lane, M. M. et al. Ultraprocessed food and chronic noncommunicable diseases: A systematic review and meta-analysis of 43 observational studies. Obes Rev 22, e13146. https://doi.org/10.1111/obr.13146 (2021). [CrossRef]
- Lane, M. M. et al. Ultra-Processed Food Consumption and Mental Health: A Systematic Review and Meta-Analysis of Observational Studies. Nutrients 14. https://doi.org/10.3390/nu14132568 (2022). [CrossRef]
- Moradi, S. et al. Ultra-Processed Food Consumption and Adult Diabetes Risk: A Systematic Review and Dose-Response Meta-Analysis. Nutrients 13, 4410 (2021).
- Baker, P. et al. Ultra-processed foods and the nutrition transition: Global, regional and national trends, food systems transformations and political economy drivers. Obesity Reviews 21, e13126. https://doi.org/ (2020).
- Gómez-Donoso, C. et al. Ultra-processed food consumption and the incidence of depression in a mediterranean cohort: The Seguimiento Universidad de Navarra Project. European Journal of Clinical Investigation 48, 169. https://doi.org/10.1111/eci.12926 (2018). [CrossRef]
- Adjibade, M. et al. Prospective association between ultra-processed food consumption and incident depressive symptoms in the French NutriNet-Santé cohort. BMC Med 17, 78. https://doi.org/10.1186/s12916-019-1312-y (2019). [CrossRef]
- Lane, M. M. et al. High ultra-processed food consumption is associated with elevated psychological distress as an indicator of depression in adults from the Melbourne Collaborative Cohort Study. Journal of Affective Disorders. https://doi.org/ (2023).
- Arshad, H. et al. Association between ultra-processed foods and recurrence of depressive symptoms: the Whitehall II cohort study. Nutritional Neuroscience, 1-13. https://doi.org/10.1080/1028415X.2022.2157927 (2023). [CrossRef]
- Werneck, A. O. et al. Prospective association between ultra-processed food consumption and incidence of elevated symptoms of common mental disorders. J Affect Disord. https://doi.org/10.1016/j.jad.2022.06.007 (2022). [CrossRef]
- Begg, C. et al. Improving the quality of reporting of randomized controlled trials. The CONSORT statement. Jama 276, 637-639. https://doi.org/10.1001/jama.276.8.637 (1996). [CrossRef]
- O’Neil, A. et al. A randomised, controlled trial of a dietary intervention for adults with major depression (the "SMILES" trial): study protocol. BMC Psychiatry 13, 114. https://doi.org/10.1186/1471-244x-13-114 (2013). [CrossRef]
- Monteiro, C. A. et al. NOVA. The star shines bright. World Nutrition 7, 28-38 (2016).
- Food Standards Australia New Zealand AUSNUT (2011-2013). Food Composition Database, <https://www.foodstandards.gov.au/science/monitoringnutrients/ausnut/pages/default.aspx> (2014).
- Montgomery, S. A. & Asberg, M. A new depression scale designed to be sensitive to change. Br J Psychiatry 134, 382-389. https://doi.org/10.1192/bjp.134.4.382 (1979). [CrossRef]
- Machado, P. P. et al. Ultra-processed food consumption and obesity in the Australian adult population. Nutrition & Diabetes 10, 39. https://doi.org/10.1038/s41387-020-00141-0 (2020). [CrossRef]
- Lopes, A., Araújo, L. F., Levy, R. B., Barreto, S. M. & Giatti, L. Association between consumption of ultra-processed foods and serum C-reactive protein levels: cross-sectional results from the ELSA-Brasil study. Sao Paulo Med J 137, 169-176. https://doi.org/10.1590/1516-3180.2018.0363070219 (2019). [CrossRef]
- Hall, K. D. et al. Ultra-Processed Diets Cause Excess Calorie Intake and Weight Gain: An Inpatient Randomized Controlled Trial of Ad Libitum Food Intake. Cell Metab 30, 67-77.e63. https://doi.org/10.1016/j.cmet.2019.05.008 (2019). [CrossRef]
- Craig, C. L. et al. International physical activity questionnaire: 12-country reliability and validity. Med Sci Sports Exerc 35, 1381-1395. https://doi.org/10.1249/01.Mss.0000078924.61453.Fb (2003). [CrossRef]
- Srour, B. et al. Ultraprocessed Food Consumption and Risk of Type 2 Diabetes Among Participants of the NutriNet-Santé Prospective Cohort. JAMA Intern Med 180, 283-291. https://doi.org/10.1001/jamainternmed.2019.5942 (2019). [CrossRef]
- Srour, B. et al. Ultra-processed food intake and risk of cardiovascular disease: prospective cohort study (NutriNet-Santé). Bmj 365, l1451. https://doi.org/10.1136/bmj.l1451 (2019). [CrossRef]
- Schnabel, L. et al. Association Between Ultraprocessed Food Consumption and Risk of Mortality Among Middle-aged Adults in France. JAMA Intern Med 179, 490-498. https://doi.org/10.1001/jamainternmed.2018.7289 (2019). [CrossRef]
- Julia, C. et al. Contribution of ultra-processed foods in the diet of adults from the French NutriNet-Santé study. Public Health Nutr 21, 27-37. https://doi.org/10.1017/s1368980017001367 (2018). [CrossRef]
- Willett, W. C., Howe, G. R. & Kushi, L. H. Adjustment for total energy intake in epidemiologic studies. Am J Clin Nutr 65, 1220S-1228S; discussion 1229S-1231S. https://doi.org/10.1093/ajcn/65.4.1220S (1997). [CrossRef]
- Kraemer, H. C., Wilson, G. T., Fairburn, C. G. & Agras, W. S. Mediators and moderators of treatment effects in randomized clinical trials. Arch Gen Psychiatry 59, 877-883. https://doi.org/10.1001/archpsyc.59.10.877 (2002). [CrossRef]
- Speed, M. S., Jefsen, O. H., Børglum, A. D., Speed, D. & Østergaard, S. D. Investigating the association between body fat and depression via Mendelian randomization. Translational Psychiatry 9, 184. https://doi.org/10.1038/s41398-019-0516-4 (2019). [CrossRef]
- Ananth, C. V. & Schisterman, E. F. Confounding, causality, and confusion: the role of intermediate variables in interpreting observational studies in obstetrics. Am J Obstet Gynecol 217, 167-175. https://doi.org/10.1016/j.ajog.2017.04.016 (2017). [CrossRef]
- Greenland, S. et al. Statistical tests, P values, confidence intervals, and power: a guide to misinterpretations. European Journal of Epidemiology 31, 337-350. https://doi.org/10.1007/s10654-016-0149-3 (2016). [CrossRef]
- Karpen, S. C. P value problems. American Journal of Pharmaceutical Education 81, 6570. https://doi.org/10.5688/ajpe6570 (2017). [CrossRef]
- Sullivan, G. M. & Feinn, R. Using effect size—or why the P value is not enough. Journal of Graduate Medical Education 4, 279-282. https://doi.org/10.4300/JGME-D-12-00156.1 (2012). [CrossRef]
- Wasserstein, R. L. & Lazar, N. A. The ASA statement on p-values: context, process, and purpose. The American Statistician 70, 129-133. https://doi.org/10.1080/00031305.2016.1154108 (2016). [CrossRef]
- Cohen, J. Statistical power analysis for the behavioral sciences. (Routledge, 2013).
- R, Core & Team. R: A language and environment for statistical computing <https://www.R-project.org/> (2017).
- Duru, G. & Fantino, B. The clinical relevance of changes in the Montgomery–Asberg Depression Rating Scale using the minimum clinically important difference approach. Current medical research and opinion 24, 1329-1335 (2008).
- Marx, W. et al. Diet and depression: exploring the biological mechanisms of action. Mol Psychiatry 26, 134-150. https://doi.org/10.1038/s41380-020-00925-x (2021). [CrossRef]
- Chassaing, B. et al. Dietary emulsifiers impact the mouse gut microbiota promoting colitis and metabolic syndrome. Nature 519, 92-96. https://doi.org/10.1038/nature14232 (2015). [CrossRef]
- Singh, R. K., Wheildon, N. & Ishikawa, S. Food Additive P-80 Impacts Mouse Gut Microbiota Promoting Intestinal Inflammation, Obesity and Liver Dysfunction. SOJ Microbiol Infect Dis 4, 1-10. https://doi.org/10.15226/sojmid/4/1/00148 (2016). [CrossRef]
- Swidsinski, A. et al. Bacterial overgrowth and inflammation of small intestine after carboxymethylcellulose ingestion in genetically susceptible mice. Inflamm Bowel Dis 15, 359-364. https://doi.org/10.1002/ibd.20763 (2009). [CrossRef]
- Zinöcker, M. K. & Lindseth, I. A. The Western Diet-Microbiome-Host Interaction and Its Role in Metabolic Disease. Nutrients 10. https://doi.org/10.3390/nu10030365 (2018). [CrossRef]
- Chassaing, B. et al. Randomized controlled-feeding study of dietary emulsifier carboxymethylcellulose reveals detrimental impacts on the gut microbiota and metabolome. Gastroenterology. https://doi.org/ (2021).
- Heidari, Z., Mohammadipour, A., Haeri, P. & Ebrahimzadeh-Bideskan, A. The effect of titanium dioxide nanoparticles on mice midbrain substantia nigra. Iran J Basic Med Sci 22, 745-751. https://doi.org/10.22038/ijbms.2019.33611.8018 (2019). [CrossRef]
- Grissa, I. et al. The effect of titanium dioxide nanoparticles on neuroinflammation response in rat brain. Environ Sci Pollut Res Int 23, 20205-20213. https://doi.org/10.1007/s11356-016-7234-8 (2016). [CrossRef]
- Lane, M. et al. The effect of ultra-processed very low-energy diets on gut microbiota and metabolic outcomes in individuals with obesity: A systematic literature review. Obesity Research & Clinical Practice 14, 197-204. https://doi.org/ (2020).
- Silva dos Santos, F. et al. Consumption of ultra-processed foods and interleukin-6 in two cohorts from high- and middle-income countries. British Journal of Nutrition, 1-28. https://doi.org/10.1017/S0007114522000551 (2022). [CrossRef]
- Martins, G. et al. Intake of ultra-processed foods is associated with inflammatory markers in Brazilian adolescents. Public Health Nutr 25, 591-599. https://doi.org/10.1017/s1368980021004523 (2022). [CrossRef]
- Edalati, S., Bagherzadeh, F., Asghari Jafarabadi, M. & Ebrahimi-Mamaghani, M. Higher ultra-processed food intake is associated with higher DNA damage in healthy adolescents. British Journal of Nutrition, 1-29. https://doi.org/10.1017/S0007114520001981 (2020). [CrossRef]
- Lane, M. M. et al. Higher Ultra-Processed Food Consumption Is Associated with Greater High-Sensitivity C-Reactive Protein Concentration in Adults: Cross-Sectional Results from the Melbourne Collaborative Cohort Study. Nutrients 14, 3309 (2022).
- Eaton, W. W., Neufeld, K., Chen, L. S. & Cai, G. A comparison of self-report and clinical diagnostic interviews for depression: diagnostic interview schedule and schedules for clinical assessment in neuropsychiatry in the Baltimore epidemiologic catchment area follow-up. Arch Gen Psychiatry 57, 217-222. https://doi.org/10.1001/archpsyc.57.3.217 (2000). [CrossRef]
- Day, N. E., McKeown, N., Wong, M. Y., Welch, A. & Bingham, S. Epidemiological assessment of diet: a comparison of a 7-day diary with a food frequency questionnaire using urinary markers of nitrogen, potassium and sodium. International Journal of Epidemiology 30, 309-317. https://doi.org/10.1093/ije/30.2.309 (2001). [CrossRef]
- Machado, P. P. et al. Ultra-processed foods and recommended intake levels of nutrients linked to non-communicable diseases in Australia: evidence from a nationally representative cross-sectional study. BMJ Open 9, e029544. https://doi.org/10.1136/bmjopen-2019-029544 (2019). [CrossRef]
- Marino, M. et al. A Systematic Review of Worldwide Consumption of Ultra-Processed Foods: Findings and Criticisms. Nutrients 13. https://doi.org/10.3390/nu13082778 (2021). [CrossRef]
- Jacka, F. N. et al. The SMILES trial: an important first step. BMC Medicine 16, 237. https://doi.org/10.1186/s12916-018-1228-y (2018). [CrossRef]
- Monteiro, C. A. Nutrition and health. The issue is not food, nor nutrients, so much as processing. Public Health Nutr 12, 729-731. https://doi.org/10.1017/s1368980009005291 (2009). [CrossRef]
- Wickham, R. J. Secondary Analysis Research. J Adv Pract Oncol 10, 395-400. https://doi.org/10.6004/jadpro.2019.10.4.7 (2019). [CrossRef]
Disclaimer/Publisher’s Note: The statements, opinions and data contained in all publications are solely those of the individual author(s) and contributor(s) and not of MDPI and/or the editor(s). MDPI and/or the editor(s) disclaim responsibility for any injury to people or property resulting from any ideas, methods, instructions or products referred to in the content. |
© 2023 by the authors. Licensee MDPI, Basel, Switzerland. This article is an open access article distributed under the terms and conditions of the Creative Commons Attribution (CC BY) license (http://creativecommons.org/licenses/by/4.0/).
Copyright: This open access article is published under a Creative Commons CC BY 4.0 license, which permit the free download, distribution, and reuse, provided that the author and preprint are cited in any reuse.