Submitted:
12 August 2023
Posted:
14 August 2023
You are already at the latest version
Abstract
This review describes and discusses unusual axonal structural details and evidence for unmasking of sulfhydryl groups (-SH) in axoplasmic membranes resulting from electrical stimulation or asphyxia. Crayfish axons contain fenestrated septa (FS) that in phase contrast micrographs appear as repeated striations. In the electron microscope each septum is made of two cross-sectioned membranes containing ~550 Å pores, each occupied by a microtubule. Thin filaments, likely to be made of kinesin, bridge the microtubule to the edge of the pore. FS are believed to play a role in axoplasmic flow. The axons also display areas in which axon and sheath-glial cell plasma membranes are sharply curved and project into the axoplasm. In freeze-fractures, the protoplasmic leaflet (P-face) of the projections appears as elongated indentations containing parallel chains of particles. The sheath-glial cell plasma membrane also contains particles, but they are irregularly aggregated. The axons also display areas where axonal and glial plasma membranes fuse, creating intercellular pores. In axons fixed during electrical stimulation the plasma membrane, the outer membrane of mitochondria, membranes of other cytoplasmic organelles and gap junctions increase in electron opacity and thickness, resulting from unmasking of sulfhydryl groups (-SH). Similar changes occur in asphyxiated nerve cords.
Keywords:
axons
; nerves
; plasma membrane
; endoplasmic reticulum
; Golgi apparatus
; mitochondria
; crayfish
; gap junctions
; sulfhydryl groups
; electrical stimulation
; asphyxia
1. Introduction
This review brings back to light unusual structural details of crayfish axons [1-4], some of which are present also in vertebrate axons, and describes changes in axoplasmic membranes resulting from electrical stimulation or asphyxia; these changes are characterized by drastic increase in electron opacity of certain axonal membranes resulting from the unmasking of sulfhydryl groups (-SH) in membrane proteins [2]. We feel that these data are important and need to be further studied, confirmed, and interpreted in detail.
2. Structural details of crayfish axons
2.1. Fenestrated septa
Axons sectioned longitudinally or slightly obliquely, and viewed by phase-contrast microscopy, display regularly spaced striations (Figure 1, A). In electron micrographs the striations correspond to parallel fenestrated septa (FS) that cross the axoplasm perpendicularly to the long axis of the axon (Figure 1, B-D) [1]. FS are cisternae whose membranes are separated by a narrow gap (Figure 1, B-D). The membranes of FS frequently join forming discontinuities (fenestrae) that are crossed by microtubules (Figure 1, C, arrows). Neighboring FS are joined by membranous tubules (Figure 1, D).
In cross-sectioned axons the FS’s discontinuities appear as 500–600 Å pores, each occupied by a microtubule (Figure 2, A-C). In some pores thin filaments ~100 Å long link the microtubule to the edge of the pore (Figure 2, C). Most likely, the filaments are kinesin molecules [5], which indeed are ~100 Å long. The heavy chain of the crayfish kinesin, a 120 kDa protein, was isolated in 1996 by Okada and coworkers [6] and named CF-kinesin. We have reported the presence of similar structures in mouse myelinated axons [1, 5], which indicates that they are likely to be present in all animals. We have proposed that FS are elements of the anterograde transport of cisternae of the Golgi apparatus mediated by motor proteins, likely to be kinesins [5].
2.2. Structural interaction between axons and sheath-glial cells
Cross-sectioned and cross-fractured crayfish axons display regions in which the plasma membranes of axon and sheath-glial cells are regularly curved and project into the axoplasm (Figure 3, A-C) [3]. At these regions (projections) the two plasma membranes run precisely parallel, separated by a 130-140 Ǻ gap (Figure 3, B). In longitudinal freeze-fracture replicas, the axons display the inner fractured faces of either the internal (protoplasmic, P face, APF) or the external (exoplasmic, E face, AEF) leaflet of both axonal and adjacent sheath-glial cell plasma membranes (Figure 3, D). In both axonal protoplasmic face (APF) and exoplasmic face (AEF) (Figure 3, D), the projections are seen as elongated structures oriented with their long axis parallel to the long axis of the axon (Figure 3, D). On the P-face of the axon’s plasma membrane (APF), the elongated indentations are 0.5-1.2 μm long and 0.12-0.15 μm wide (Figure 3, D, arrowheads). The E face (AEF) of the axon’s plasma membrane displays elongated protrusions, which are the complementary images of these structures (Figure 3, D, arrows).
The axonal indentations contain parallel chains of ~80 Å particles (Figure 4, A) that repeat every 120-125 Å and are obliquely oriented such that in the axonal P-face (APF) the chains’ axis (b in Figure 4, C) is skewed with respect to that of the indentation (a in Figure 4, C) by an angle of 550-60° (Figure 4, A, C and D). The particles repeat along the chain every 80-85 Å (Figure 4, A). The freeze-fracture E-face (AEF) shows complementary chains of pits (Figure 4, B). The particles of one chain are in register with those of the adjacent chain and are aligned along “axis c” (Figure 4, C), which forms an angle of 750-85° with “axis b” of the chains (Figure 4, C). This complex structure forms an array with a rhomboidal unit cell of 80-85 × 120-125 Å (Figure 4, A and C).
The projections of the sheath-glial cell’s plasma membrane also contain particle arrays (Figure 4, E and F), but these arrays differ from those in the axonal projections in size, pattern of aggregation, and fracture properties. Indeed, while in freeze-fracture replicas all of the axonal particles remain with the protoplasmic leaflet (Figure 4, A and B), in the sheath-glial cell some particles are with the protoplasmic leaflet (Figure 4, E) and others with the exoplasmic leaflet (Figure 4, F). It is hard to propose a functional meaning of these structures; they could be areas of cell-cell adhesion, regions of metabolic couplings, or other unknown types of cell-cell interaction [3].
2.3. Membranous pores joining axons to sheath-glial cells
In certain areas of contact between axons and sheath-glial cells, the two plasma membranes fuse forming membranous pores (Figure 5 and Figure 6) [4, 7]. Several pores are usually grouped in the same area (Figure 5). Often, in these areas one sees aggregates of endoplasmic reticulum (ER) or Golgi cisternae, mitochondria, and other membrane structures (Figure 6). Most pores are 15-20 nm in size (Figure 5), but larger pores are also occasionally seen (Figure 6).
Pores of this size would be expected to allow wide communication between axoplasm and sheath-glial cell cytoplasm. Indeed, the existence of pores between axons and sheath-glial cells seems reasonable because only passageways of this size would allow the exchange of molecules such as RNA and proteins as heavy as 200,000 Daltons [8-11]. Viancour et al. [12] reported that when crayfish median giant axons are intracellularly injected with Lucifer Yellow CH, this fluorescent dye rapidly diffuses from the axoplasm to the cytoplasm of the adjacent glial cells; the images they published were startling as they showed that the nuclei of the glial cells bordering the giant axon were all stained by the fluorescent dye [12]. The pores may form transiently, but are unlikely to be a preparation artifact because the radius of membrane fusion at the pores (Figure 5 and Figure 6) is consistent with the minimum curvature-radius of biological membranes, and the axons’ membranes and other cellular components were very well fixed by vascular perfusion with glutaraldehyde followed by osmium tetroxide [4].
3. Structural changes in electrically stimulated axons
3.1. Historical Background
Most data on changes in nerve fibers during electrical activity came from electrophysiological studies of axonal membrane channels published in the early-to-mid 20th century. The earliest, definitive evidence of the existence of membrane channels resulted from the work of Alan Lloyd Hodgkin (1914-1998) and coworkers [13-17]. This major finding was enabled by the discovery of the giant squid axon [18] and the inventions of both microelectrodes, by Ida Henrietta Hyde, and the voltage-clamp technique [19]; rev. in [20]. While most of the work of the last century has focused on the electrophysiology of axonal channels, relatively less interest has been devoted to structural changes in the axoplasm occurring during nerve activity. Nonetheless, over the years several reports on morphological changes, including our own [2], have been published.
In our study, published over a half-century ago [2], we reported ultrastructural changes in axonal membranes of crayfish nerve fibers resulting from electrical stimulation and asphyxia. The changes are characterized by drastic increase in osmiophilia and thickness of the axonal plasma membrane, and the membranes of cytoplasmic organelles such mitochondria (outer membrane only), ER and Golgi apparatus, and gap junctions; in contrast, the membranes of the sheath-glial cells and the mitochondrial inner membrane do not change (see in the following). To our knowledge our data have not yet been confirmed, although several studies have reported various axonal changes in electrically excited vertebrate and invertebrate axons.
Early in the 20th century, changes in neurofibril staining were reported in axons subjected to polarizing current [21]; these changes were later confirmed in live, unanesthetized nerves [22]. Almost two decades later, changes in light scattering were recorded in axons stimulated in vitro, and were believed to result from changes in axonal volume [23-27]. Changes occurring at the speed of the action potential were also recorded [28-30] by light scattering and birefringence measurements in stimulated axons; these changes occurred synchronously with the action potential [28]. An increase in fluorescence was also reported in axons treated with 8-anilinonaphthalene-1-sulfonic acid (ANS) [30]. ANS interacts with macromolecules’ hydrophobic groups [31] and changes in fluorescence properties due to conformational modifications in macromolecules [32]. Therefore, these changes were thought to result from excitation-induced conformational modifications in membrane macromolecules. Axons stained with various fluorochromes responded to electric stimulation with transient fluorescence changes, suggesting a drop in membrane viscosity [33].
Several studies have reported initial heat developing with a single impulse in mammalian unmyelinated nerves [34, 35], as well as nerve swelling during the action potential [36]. In crabs, nerve impulses produced an outward displacement of the nerve surface and an increase in swelling pressure - this was smaller in squid giant axons [35]. Other studies also reported that in crustacean nerves the electrical impulse is associated with a small and rapid movement of the nerve surface, which corresponds to increased swelling pressure; tetrodotoxin and procaine suppressed the rapid mechanical changes [37]. In squid axons, mechanical changes with the action potential were further studied by piezoelectric and optical methods; the peak of axonal swelling coincided with the peak of the action potential [38]. Repeatedly fired action potentials, caused by reducing external calcium concentration ([Ca2+]o), resulted in gradual axonal swelling [38]. Transient axonal shortening, followed by elongation, was also reported to occur during action potential [38]. With optical and mechano-electric detectors the squid giant axon swelled when an action potential was generated, the maximum swelling occurring at the peak of the action potential [39]. These mechanical changes were also seen in axons in which much of the axoplasm had been removed [40]. In garfish olfactory nerve, swelling of the nerve fibers were also reported to occur simultaneously with a shortening of the fibers as an impulse flowed along the fiber [41] - heat production also occurred simultaneously with the action potential. It was proposed that mechanical and thermal changes are related to release and re-binding of calcium ions during the action potential [41]. A rapid volume expansion fibers with an electrical impulse has also been reported in unmyelinated axons; this volume expansion resulted from lateral expansion of the excited portion of the axon [42]. In garfish olfactory nerve, the time-course of swelling and birefringence changes have been studied by applying various chemicals in the place where the electric current pulses were applied - this study demonstrated that a pulse causes a rapid increase, followed by a slow gradual increase, in axonal water-content [43].
3.2. Increased electron density (osmiophilia) in membranes of electrically stimulated axons
In control preparations, the membranes of crayfish axons are all the same thickness and electron density (Figure 7). In contrast, in crayfish axons fixed during electrical stimulation the membranes of stimulated axons display a drastic increase in electron density (osmiophilia) and thickness [2]. These changes affect the plasma membrane, the membranes of ER/Golgi cisternae, the outer membrane of mitochondria and those of gap junctions (Figure 8, Figure 9, Figure 10 and Figure 11), while the inner membrane of mitochondria and the membranes of the sheath-glial cells (Figure 8, Figure 9, Figure 10 and Figure 11) are not affected. The increase in electron density and thickness is seen in membranes of the median and lateral giant axons as well as in those of many medium- and small-sized axons, but not all axons are reactive. Indeed, several axons appear as in control samples (Figure 8, A and Figure 9, B), most likely because they were not electrically stimulated.
At higher magnification, the increase in thickness and density of the affected membranes is more pronounced at the cytosolic side (Figure 9, A and Figure 10). The overall thickness of the membranes increases from 80-85 Å to 120-150 Å (Figure 9, A and Figure 10). The electron density of the affected membranes is greater than that of any other cellular material even in unstained sections (Figure 10, B).
In some mitochondria, the outer membrane appears granular due to the presence of electron dense particles (Figure 11, A). In cross sections, the particles are ~150 Å in size and repeat every ~200 Å (Figure 11, B). Significantly, these particles are of the same size and spacing of gap junction channels (Figure 11, C, c), suggesting that they might be gap junction hemichannels.
During our 1960’s work on unstimulated crayfish axons fixed by conventional glutaraldehyde/osmium-tetroxide, the gap junction membranes did not display electron dense particles (Figure 11, C, a and b) [44]. It was a lucky coincidence, therefore, that the increase electron density of gap junction membranes caused by electrical stimulation allowed us to reveal for the first time images of gap junction channels (Figure 11, C and inset c) [2]. Eventually, we succeeded in revealing gap junction channel images even in unstimulated axons because of glutaraldehyde-H2O2 fixation [44, 45].
The increased osmiophilia is seen after prolonged stimulation as well as after stimulation as short as 30 seconds. The electron dense material is not seen in specimens fixed with glutaraldehyde alone and unstained [2], suggesting that it does not have intrinsic electron density in the absence of osmium tetroxide fixation.
3.3. Increased electron density (osmiophilia) in membranes of asphyxiated axons
In ganglia asphyxiated by immersion in saline solution through which CO2 or N2 is bubbled, the axonal plasma membrane, the membrane of the ER/Golgi cisternae, the outer mitochondrial membranes and gap junctions display the same increase in electron opacity and thickness as the membranes of electrically stimulated axons [2]. However, in asphyxiated ganglia all the axons display membranes with increased electron opacity. In asphyxiated axons, as in stimulated axons, the intensity of the reaction is more pronounced in the larger axons, and both the inner membrane of mitochondria and the membranes of sheath-glial cells are not affected [2].
3.4. Increased electron opacity (osmiophilia) in membranes of axons treated with sulfhydryl (-SH) reagents
As a hypothesis, we considered the possibility that the increased membrane osmiophilia of electrically stimulated or asphyxiated axons might have resulted from unmasking of sulfhydryl groups (-SH) in membrane proteins [2]. To test it we treated unstimulated axons with -SH reducing agents, such as 1 hour treatment with 0.4 M sodium thio glycolate (TG) or 5 mM dithioerythritol (DTE) in 0.1 M phosphate buffer (pH 7) at room temperature. Significantly, with these treatments the axonal membranes increase in electron opacity and thickness as in the electrically stimulated axons (Figure 12); as in asphyxiated nerve cords, all the axons are reactive. In specimens treated with -SH reducing agents followed by treatment with -SH blockers such 30 min to 1 hr exposures to 0.1 M solutions of maleimide or N-ethyl-maleimide (NEM) in 0.1 M phosphate buffer (pH 7.6) at room temperature, the rise in electron opacity and thickness is not observed, as all of the axonal membranes are as in control axons (Figure 13)[2].
4. Why does membrane’s osmiophilia increase in electrically stimulated axons?
Membrane osmiophilia results from the reaction of both lipids and proteins with osmium tetroxide. In membrane lipids, osmium tetroxide reacts with the double bonds of the hydrocarbon chains, forming cyclic osmic esters; reviewed in [46]. The reactions between proteins and osmium tetroxide are more complex. Several amino acids, including diamino acids, sulfur containing amino acids, and amino acids containing cyclic groups, have been reported to react with osmium [47], but, when incorporated into proteins, only a few react with osmium. Free -SH groups of different molecules such as cysteine and glutathione readily react with osmium and precipitate with it, while disulfide bonds (S-S) are much less reactive [47]. In this reaction the sulfhydryl groups reduce osmium tetroxide to insoluble compounds [47].
While most cellular components are weakly stained by osmium, in some cases very electron-opaque osmium precipitate known as "osmium black" is generated. Osmium black results from the reactions between osmium tetroxide and certain reagents containing -SH groups, such as thiocarbamoyl, diazo-thioether, and azo-groups (azo indoxyls) [48]. Studies on the chemical composition of osmium black have reported that it is made of osmium polymers representing coordination compounds of osmium with organic sulfur ligands [49]. Reagents containing -SH groups are the most reactive in the synthesis of osmium polymers, which are insoluble in solvents used for dehydration as well as in embedding chemicals such as acrylic and epoxy compounds. This property is what renders osmium black extremely electron dense in thin sectioned specimens.
The fact that osmium black can be synthetized by molecules containing -SH groups strongly suggested to us that the unmasking of -SH groups in membrane proteins could explain the observed increase in membrane osmiophilia. Indeed, our experiments with sulfhydryl reagents strongly support this hypothesis because with exposure to thioglycolate or DTE the axonal membranes increase in osmiophilia with the same characteristics and distribution of those in electrically stimulated axons. Moreover, the same membranes appear as in control axons, if the newly unmasked -SH groups are blocked by maleimide or NEM before osmium fixation.
Several cysteines are known to be present in ion channels of excitable membranes [50]. Four cysteines have been found to be expressed within the pore sequence of Na+ channels, and multiple others in different domains on these channels, and sulfhydryl modification have been shown to affect channel gating [50]. In invertebrate gap junctions, the channel protein innexin-1 contains four cysteines in the cytoplasmic loop and one in the C-terminus [51]; it is possible that some of these form disulfide bonds that are split into -SH groups by electrical stimulation, asphyxia of treatment with reducing agents.
Electrical stimulation has been reported to affect -SH groups in squid giant axons, as -SH and disulfide groups have been found to play a role in conformational changes induced by electrical stimulation [52]. The relevance of -SH groups in the function of excitable membranes is supported by several publications [53-60]. Exposure to -SH reagents has been reported to cause membrane depolarization [61], and the normally unexcitable ventro-abdominal flexor muscles of the crustacean Atya lanipes generated trains of calcium action potentials after treatments with sulfhydryl reagents [59].
All the above is consistent with the idea that that electrical stimulation causes the unmasking of -SH groups in the excitable plasma membranes, but it is quite puzzling why also cytoplasmic membranes such as the outer mitochondrial and those of the ER/Golgi cisternae, which are not directly linked to the plasma membrane, also react by increasing in osmiophilia. Puzzling as well is why treatments with reducing agents affect axonal membranes, while they do not affect membranes of sheath-glial cells.
In any event, our data prove that within, or very near, the two dense leaflets of the axonal plasma membrane, the outer mitochondrial membrane, the membranes the ER/Golgi cisternae and gap junctions of crayfish axons there are proteins rich in sulfur whose -SH groups that are unmasked by electrical stimulation. The fact that the leaflet facing the axoplasmic in each of the reactive membranes appears thicker than the other could mean that it contains a greater density of -SH groups available for reaction with osmium. In this respect it is noteworthy to remember that also in membranes of the sarcoplasmic reticulum -SH groups were found more numerous in the homologous membrane leaflet [62]. It has been suggested that these -SH groups may belong to ATPase molecules, since treatment with ATP proved to prevent the -SH blocking effect of NEM. In crayfish axons, the -SH-rich proteins could also represent ATPases. Indeed, a Mg-dependent ATPase sensitive to -SH reagents has been found in crustacean nerve microsomes [63]. Unmasking of -SH groups is likely to cause conformational changes in proteins, which may be relevant to ion transport and membrane electrical properties during excitation.
Our data show an increase in osmiophilia in the same membranes also because of asphyxia. This may suggest that asphyxia is associated with re duction of disulfide bonds due to changes in the oxidation-reduction potential. Whether changes in the oxidation-reduction potential sufficient to produce the phenomenon could also occur in electrically stimulated axons cannot be stated, but this possibility must be kept in mind.
5. Conclusion
The major goal of this review is to bring back to light unusual structural details of crayfish axons and changes in osmiophilia of axonal membranes, caused by electrical stimulation, asphyxia, or treatment with sulfhydryl reagents, for stimulating more research on the functional meaning these early findings. Some of the structural details, such as fenestrated septa (FS), are present also in mammalian axons and are likely to be involved in the mechanism of axoplasmic transport. Other details, such as axo-glial pores, are likely to be involved in the transfer of large molecules such as RNA and proteins as heavy as 200,000 Daltons [8-11], but these and structural interactions between axons and sheath-glial cells have not been described in other studies and may not be present in vertebrate axons. To our knowledge, the unmasking of -SH groups in axonal membranes resulting from stimulation or asphyxia has not been reported in other studies as well. In conclusion, we are fully aware that this small review provides more questions than answers. But, once again its major goal is to stimulate more advanced research for achieving a better understanding of the functional meaning of these structural findings.
Funding
This research received no external funding.
Conflicts of Interest
The author declares no conflict of interest.
References
- Peracchia:, C. , A system of parallel septa in crayfish nerve fibers. J. Cell Biol 1970, 44 (1), 125–133. [Google Scholar] [CrossRef] [PubMed]
- Peracchia, C.; Robertson, J. D. , Increase in osmiophilia of axonal membranes of crayfish as a result of electrical stimulation, asphyxia, or treatment with reducing agents. J. Cell Biol 1971, 51(1), 223–239. [Google Scholar] [CrossRef] [PubMed]
- Peracchia, C. , Excitable membrane ultrastructure. I. Freeze fracture of crayfish axons. J. Cell Biol 1974, 61(1), 107–122. [Google Scholar] [CrossRef] [PubMed]
- Peracchia, C. , Direct communication between axons and sheath glial cells in crayfish. Nature 1981, 290(5807), 597–598. [Google Scholar] [CrossRef]
- Peracchia, C., Potential Role of Fenestrated Septa in Axonal Transport of Golgi Cisternae and Gap Junction Formation/Function. Int J Mol Sci 2023, 24, (6).
- Okada, Y.; Sato-Yoshitake, R.; Hirokawa, N. , The activation of protein kinase A pathway selectively inhibits anterograde axonal transport of vesicles but not mitochondria transport or retrograde transport in vivo. J Neurosci 1995, 15(4), 3053–64. [Google Scholar] [CrossRef]
- Eugenin, E.; Camporesi, E.; Peracchia, C., Direct Cell-Cell Communication via Membrane Pores, Gap Junction Channels, and Tunneling Nanotubes: Medical Relevance of Mitochondrial Exchange. Int J Mol Sci 2022, 23, (11).
- Lasek, R. J.; Gainer, H.; Barker, J. L., Cell-to-cell transfer of glial proteins to the squid giant axon. The glia-neuron protein trnasfer hypothesis. J Cell Biol 1977, 74, (2), 501-23.
- Lasek, R. J.; Gainer, H.; Przybylski, R. J. , Transfer of newly synthesized proteins from Schwann cells to the squid giant axon. Proc Natl Acad Sci U S A 1974, 71(4), 1188–92. [Google Scholar] [CrossRef]
- Singer, M.; Green, M. R. , Autoradiographic studies of uridine incorporation in peripheral nerve of the newt, Triturus. J Morphol 1968, 124(3), 321–44. [Google Scholar] [CrossRef]
- Singer, M.; Salpeter, M. M. , The transport of 3H-l-histidine through the Schwann and myelin sheath into the axon, including a reevaluation of myelin function. J Morphol 1966, 120(3), 281–315. [Google Scholar] [CrossRef]
- Viancour, T. A.; Bittner, G. D.; Ballinger, M. L. , Selective transfer of Lucifer yellow CH from axoplasm to adaxonal glia. Nature 1981, 293(5827), 65–7. [Google Scholar] [CrossRef]
- Hodgkin, A. L.; Huxley, A. F. , Propagation of electrical signals along giant nerve fibers. Proc. R. Soc. Lond B Biol. Sci 1952, 140(899), 177–183. [Google Scholar]
- Hodgkin, A. L.; Huxley, A. F. , Currents carried by sodium and potassium ions through the membrane of the giant axon of Loligo. J. Physiol 1952, 116(4), 449–472. [Google Scholar] [CrossRef] [PubMed]
- Hodgkin, A. L.; Huxley, A. F.; Katz, B. , Measurement of current-voltage relations in the membrane of the giant axon of Loligo. J. Physiol 1952, 116(4), 424–448. [Google Scholar] [CrossRef] [PubMed]
- Hodgkin, A. L.; Huxley, A. F.; Katz, B. , Ionic currents underlying activity in the giant axon of the squid. Arch. Sci. Physiol 1949, 3, 129–150. [Google Scholar]
- Hodgkin, A. L.; Katz, B. , The effect of sodium ions on the electrical activity of giant axon of the squid. J. Physiol 1949, 108(1), 37–77. [Google Scholar] [CrossRef]
- Young, J. Z. , The functioning of the giant nerve fibres of the squid. J. Exp. Biol 1938, 15, 170–185. [Google Scholar] [CrossRef]
- Cole, K. S. , Dynamic electrical characteristics of the squid axon membrane. Arch. Sci. Physiol 1949, 3, 253–258. [Google Scholar]
- Hille, B. , Ion channels of excitable membranes., 2nd ed.; Sinauer Associates, Inc.: Sunderland, Mass. USA, 1992. [Google Scholar]
- Bethe, A. J. T. , Allgemeine Anatomie und Physiologie des Nervensystems. V. G. Thieme: Leipzig, Germany, 1903.
- Klinke, j., Über die Bedingungen für das Auftreten eines färberischen Polarisationsbildes am Nerven. Pflügers Arch. 1931, 227, 715-726.
- Hill, D. K.; Keynes, R. D. , Opacity changes in stimulated nerve. J Physiol 1949, 108(3), 278–81. [Google Scholar] [CrossRef]
- Hill, D. K., The volume change resulting from stimulation of a giant nerve fibre. J Physiol 1950, 111, (3-4), 304-27.
- Hill, D. K., The effect of stimulation on the opacity of a crustacean nerve trunk and its relation to fibre diameter. J Physiol 1950, 111, (3-4), 283-303.
- Tobias, J. M. , Qualitative observations on visible changes in single frog, squid and other axones subjected to electrical polarization; implications for excitation and conduction. J Cell Comp Physiol 1951, 37(1), 91–105. [Google Scholar] [CrossRef]
- Solomon, S., J. M. Tobias, J.M., Thixotropy of axoplasm and effect of activity on light emerging from an internally lighted giant axon J. Cell. Comp. Physiol. 1960, 55, 159–166. [Google Scholar]
- Cohen, L. B.; Keynes, R. D.; Hille, B. , Light scattering and birefringence changes during nerve activity. Nature 1968, 218(5140), 438–41. [Google Scholar] [CrossRef]
- Cohen, L. B.; Keynes, R. D. , Evidence for structural changes during the action potential in nerves from the walking legs of Maia squinado. J Physiol 1968, 194(2), 85–6P. [Google Scholar]
- Tasaki, I.; Watanabe, A.; Sandlin, R.; Carnay, L. , Changes in fluorescence, turbidity, and birefringence associated with nerve excitation. Proc Natl Acad Sci U S A 1968, 61(3), 883–8. [Google Scholar] [CrossRef] [PubMed]
- Weber, G.; Laurence, D. J. , Fluorescent indicators of adsorption in aqueous solution and on the solid phase. Biochem J 1954, 56(325th Meeting), xxxi. [Google Scholar]
- Duke, J. A.; McKay, R.; Botts, J. , Conformational change accompanying modification of myosin ATPase. Biochim Biophys Acta 1966, 126(3), 600–3. [Google Scholar] [CrossRef]
- Tasaki, II; Carnay, L.; Watanabe, A., Transient changes in extrinsic fluorescence of nerve produced by electric stimulation. Proc Natl Acad Sci U S A 1969, 64, (4), 1362-8.
- Howarth, J. V.; Keynes, R. D.; Ritchie, J. M. , The origin of the initial heat associated with a single impulse in mammalian non-myelinated nerve fibres. J Physiol 1968, 194(3), 745–93. [Google Scholar] [CrossRef] [PubMed]
- Iwasa, K.; Tasaki, I. , Mechanical changes in squid giant axons associated with production of action potentials. Biochem Biophys Res Commun 1980, 95(3), 1328–31. [Google Scholar] [CrossRef]
- Iwasa, K.; Tasaki, I.; Gibbons, R. C. , Swelling of nerve fibers associated with action potentials. Science 1980, 210(4467), 338–9. [Google Scholar] [CrossRef]
- Tasaki, I.; Iwasa, K.; Gibbons, R. C. , Mechanical changes in crab nerve fibers during action potentials. Jpn J Physiol 1980, 30(6), 897–905. [Google Scholar] [CrossRef]
- Tasaki, I.; Iwasa, K. , Rapid pressure changes and surface displacements in the squid giant axon associated with production of action potentials. Jpn J Physiol 1982, 32(1), 69–81. [Google Scholar] [CrossRef]
- Tasaki, I.; Iwasa, K. , Further studies of rapid mechanical changes in squid giant axon associated with action potential production. Jpn J Physiol 1982, 32(4), 505–18. [Google Scholar] [CrossRef]
- Tasaki, I.; Byrne, P. M. , Heat production associated with a propagated impulse in bullfrog myelinated nerve fibers. Jpn J Physiol 1992, 42(5), 805–13. [Google Scholar] [CrossRef] [PubMed]
- Tasaki, I.; Kusano, K.; Byrne, P. M. , Rapid mechanical and thermal changes in the garfish olfactory nerve associated with a propagated impulse. Biophys J 1989, 55(6), 1033–40. [Google Scholar] [CrossRef]
- Tasaki, I.; Byrne, P. M. , Volume expansion of nonmyelinated nerve fibers during impulse conduction. Biophys J 1990, 57(3), 633–5. [Google Scholar] [CrossRef]
- Tasaki, I.; Byrne, P. M. , Rapid structural changes in nerve fibers evoked by electric current pulses. Biochem Biophys Res Commun 1992, 188(2), 559–64. [Google Scholar] [CrossRef]
- Peracchia, C. , Low resistance junctions in crayfish. I. Two arrays of globules in junctional membranes. J. Cell Biol 1973, 57(1), 66–76. [Google Scholar] [CrossRef]
- Peracchia, C.; Mittler, B. S. , Fixation by means of glutaraldehyde-hydrogen peroxide reaction products. J. Cell Biol 1972, 53(1), 234–238. [Google Scholar] [CrossRef]
- Riemersma, J. C. , Osmium tetroxide fixation of lipids for electron microscopy. A possible reaction mechanism. Biochim Biophys Acta 1968, 152(4), 718–27. [Google Scholar] [CrossRef]
- Bahr, G. F. , Osmium tetroxide and ruthenium tetroxide and their reactions with biologically important substances. Electron stains. III. Exp Cell Res 1954, 7(2), 457–79. [Google Scholar] [CrossRef]
- Hanker, J. S.; Seaman, A. R.; Weiss, L. P.; Ueno, H.; Bergman, R. A.; Seligman, A. M. , Osmiophilic Reagents: New Cytochemical Principle for Light and Electron Microscopy. Science 1964, 146(3647), 1039–43. [Google Scholar] [CrossRef]
- Hanker, J. S.; Kasler, F.; Bloom, M. G.; Copeland, J. S.; Seligman, A. M. , Coordination polymers of osmium: the nature of osmium black. Science 1967, 156(3783), 1737–8. [Google Scholar] [CrossRef]
- Chiamvimonvat, N.; O'Rourke, B.; Kamp, T. J.; Kallen, R. G.; Hofmann, F.; Flockerzi, V.; Marban, E. , Functional consequences of sulfhydryl modification in the pore-forming subunits of cardiovascular Ca2+ and Na+ channels. Circ Res 1995, 76(3), 325–34. [Google Scholar] [CrossRef] [PubMed]
- Welzel, G.; Schuster, S. , Long-term potentiation in an innexin-based electrical synapse. Sci Rep 2018, 8(1), 12579. [Google Scholar] [CrossRef] [PubMed]
- Marquis, J. K.; Mautner, H. G. , The effect of electrical stimulation on the action of sulfhydryl reagents in the giant axon of squid: suggested mechanisms for the role of thiol and disulfide groups in electrically-induced conformational changes. J Membr Biol 1974, 15(3), 249–60. [Google Scholar] [CrossRef] [PubMed]
- Smith, H. M. , Effects of sulfhydryl blockade on axonal function. J Cell Comp Physiol 1958, 51(2), 161–71. [Google Scholar] [CrossRef] [PubMed]
- Huneeus-Cox, F.; Fernandez, H. L.; Smith, B. H. , Effects of redox and sulfhydryl reagents on the bioelectric properties of the giant axon of the squid. Biophys J 1966, 6(5), 675–89. [Google Scholar] [CrossRef]
- Abramson, J. J.; Salama, G. , Critical sulfhydryls regulate calcium release from sarcoplasmic reticulum. J Bioenerg Biomembr 1989, 21(2), 283–94. [Google Scholar] [CrossRef]
- Oba, T.; Hotta, K. , Silver ion-induced tension development and membrane depolarization in frog skeletal muscle fibres. Pflugers Arch 1985, 405(4), 354–9. [Google Scholar] [CrossRef]
- Palade, P., Drug-induced Ca2+ release from isolated sarcoplasmic reticulum. III. Block of Ca2+-induced Ca2+ release by organic polyamines. J Biol Chem 1987, 262, (13), 6149-54.
- Brunder, D. G.; Dettbarn, C.; Palade, P. , Heavy metal-induced Ca2+ release from sarcoplasmic reticulum. J Biol Chem 1988, 263(35), 18785–92. [Google Scholar] [CrossRef]
- Zuazaga, C.; del Castillo, J. , Generation of calcium action potentials in crustacean muscle fibers following exposure to sulfhydryl reagents. Comp Biochem Physiol C Comp Pharmacol Toxicol 1985, 82(2), 409–16. [Google Scholar] [CrossRef]
- Zuazaga, C. , Steinacker, A., del Castillo, J., The role of sulfhydryl and disulfide groups of membrane proteins in electrical conduction. Puerto Rico Health Sciences Journal 1984, 3(3), 125–139. [Google Scholar]
- Kirsten, E. B.; Kuperman, A. S. , Effects of sulphydryl inhibitors on frog sartorius muscle: N-ethylmaleimide. Br J Pharmacol 1970, 40(4), 827–35. [Google Scholar] [CrossRef] [PubMed]
- Hasselbach, W.; Elfvin, L. G. , Structural and chemical asymmetry of the calcium-transporting membranes of the sarcotubular system as revealed by electron microscopy. J Ultrastruct Res 1967, 17(5), 598–622. [Google Scholar] [CrossRef]
- Perkins, M. S.; Wright, E. B., The crustacean axon. I. Metabolic properties: ATPase activity, calcium binding, and bioelectric correlations. J Neurophysiol 1969, 32, (6), 930-47.
Figure 1.
A. Phase-contrast micrograph of mediun size axons, sectioned in peripheral areas (see inset), displaying parallel septa. Electron micrograps (B-D) show that each septum is made of two cross-sectioned membranes arranged perpendicularly to the long axis of the axon. The two membranes join togerther forming 0.1-0.2 μm pores each crossed by microtubules (C, arrows). Neighboring septa linked by membranous tubules (D). S, Septum; T, Tubule. Adapted from Ref. 1.
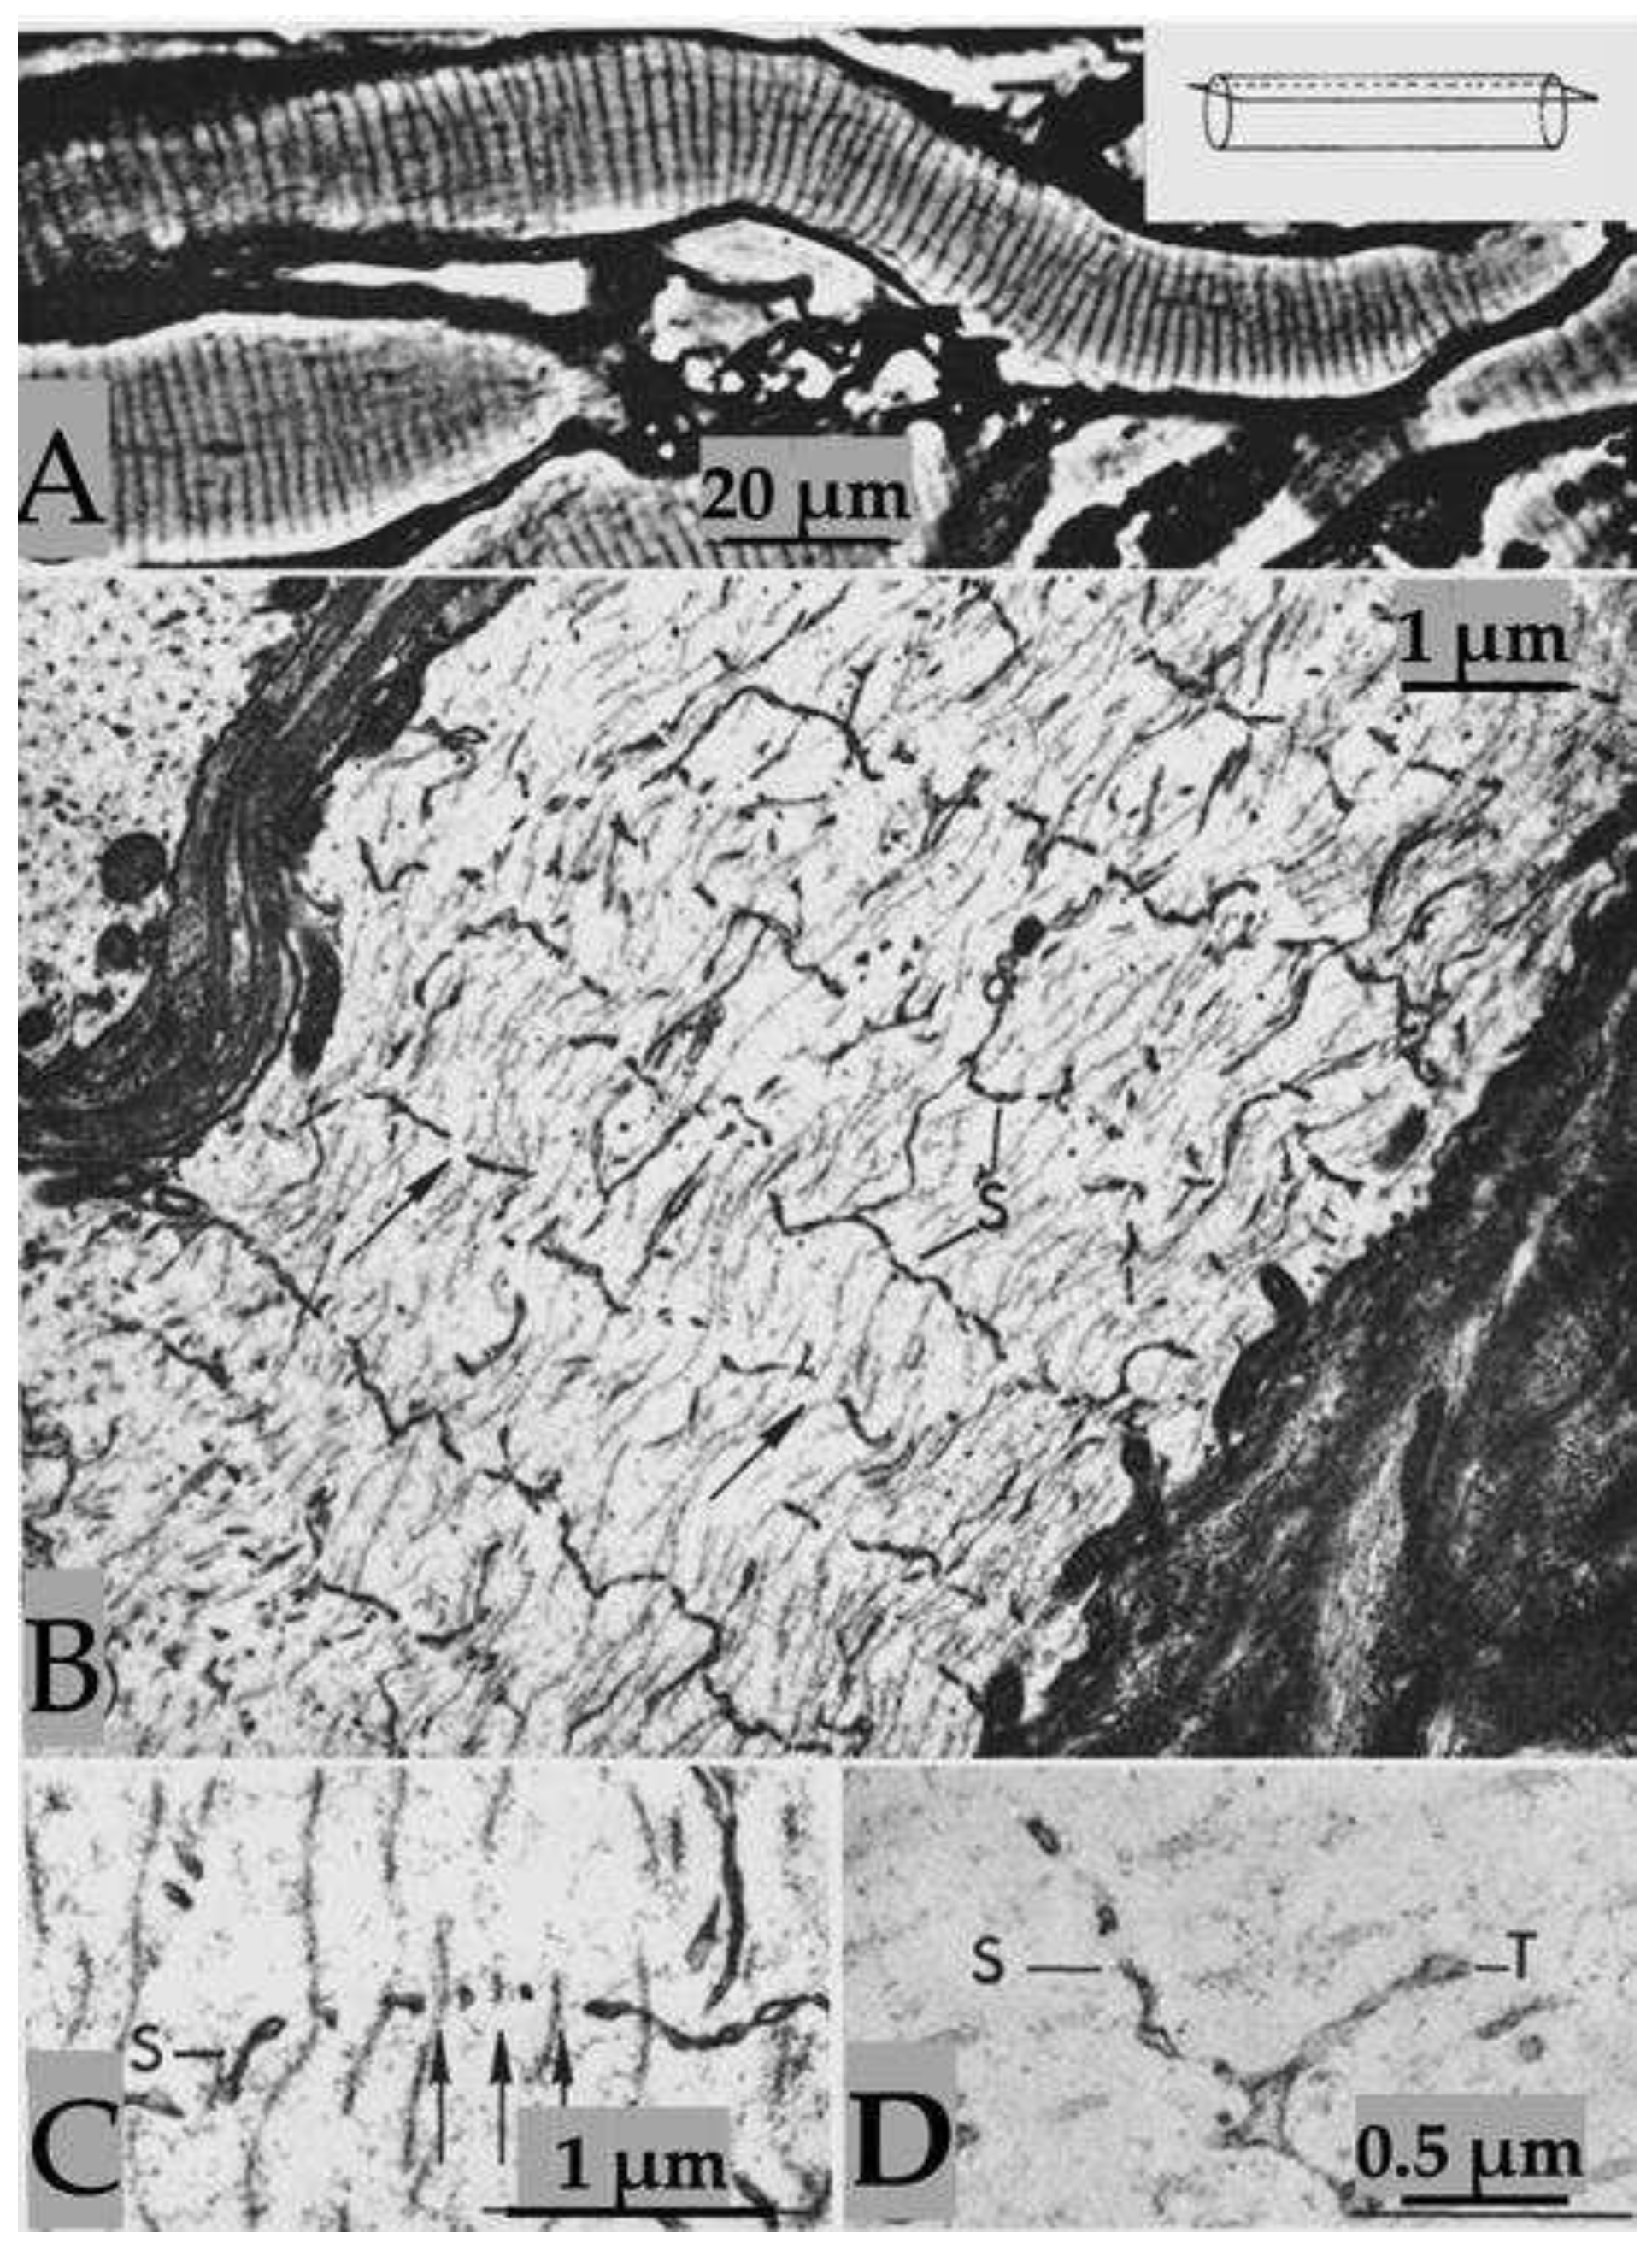
Figure 2.
A. Electron micrograph of cross-sectioned axons (see inset in A) display face view images of the septa shown in Figure 1. The septa, named fenestrated septa (FS), contain pores (A, arrows), each crossed by a microtubule. B. Detail of A showing two ~550 Å pores, each crossed by a microtubule; the gap between pore-edge and microtubule is 80–100 Å. Frequently, pores display thin filaments (C, red arrows) that link the microtubule to the edge of the pore. The filaments are likely to be kinesin molecules (D). Adapted from Ref. 1.
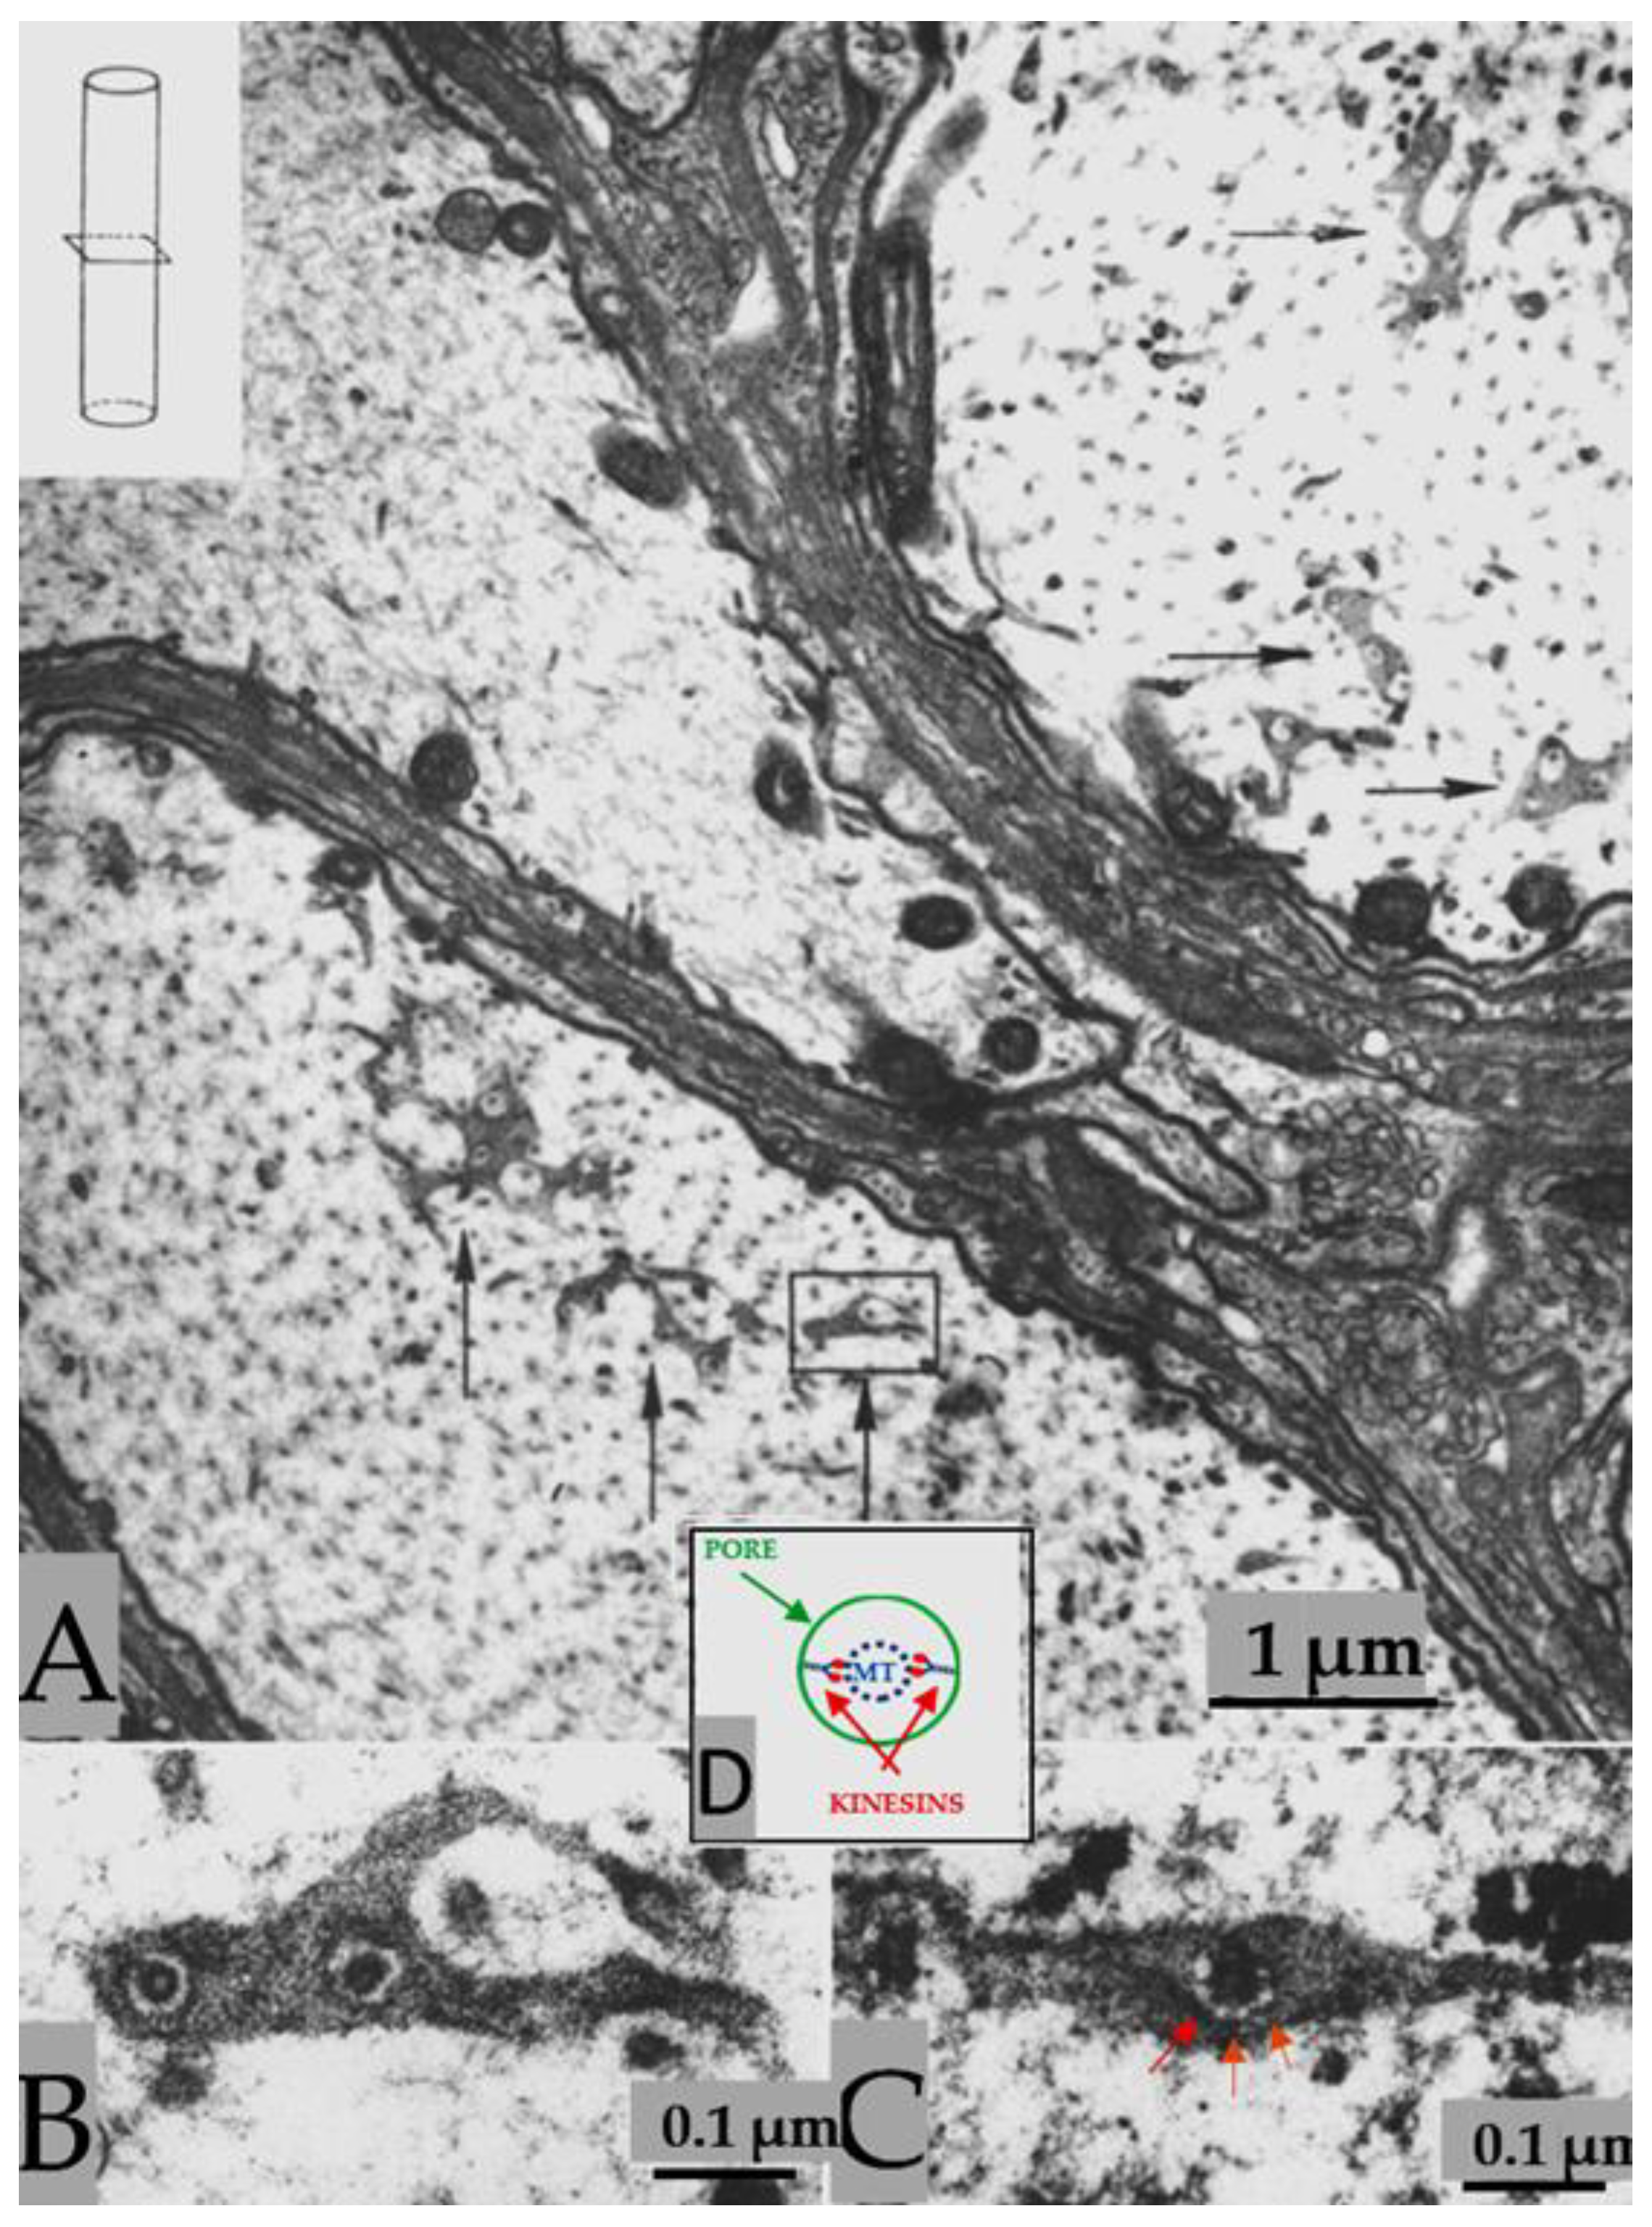
Figure 3.
Crayfish axons display specialized regions of interaction with sheath-glia cells, where the two plasma membranes project into the axoplasm (A-C, arrows), separated by a gap of 130-140 Å (B). In freeze-fracture replicas, the P-face of the axonal projections (D, APF) appears as an elongated indentation 0.5-1.2 µm long and 0.12-0.15 µm wide (D, arrowheads). The axonal E-face (D, AEF) shows complementary images of the indentations (D, AEF, arrows). Adapted from Ref. 3.
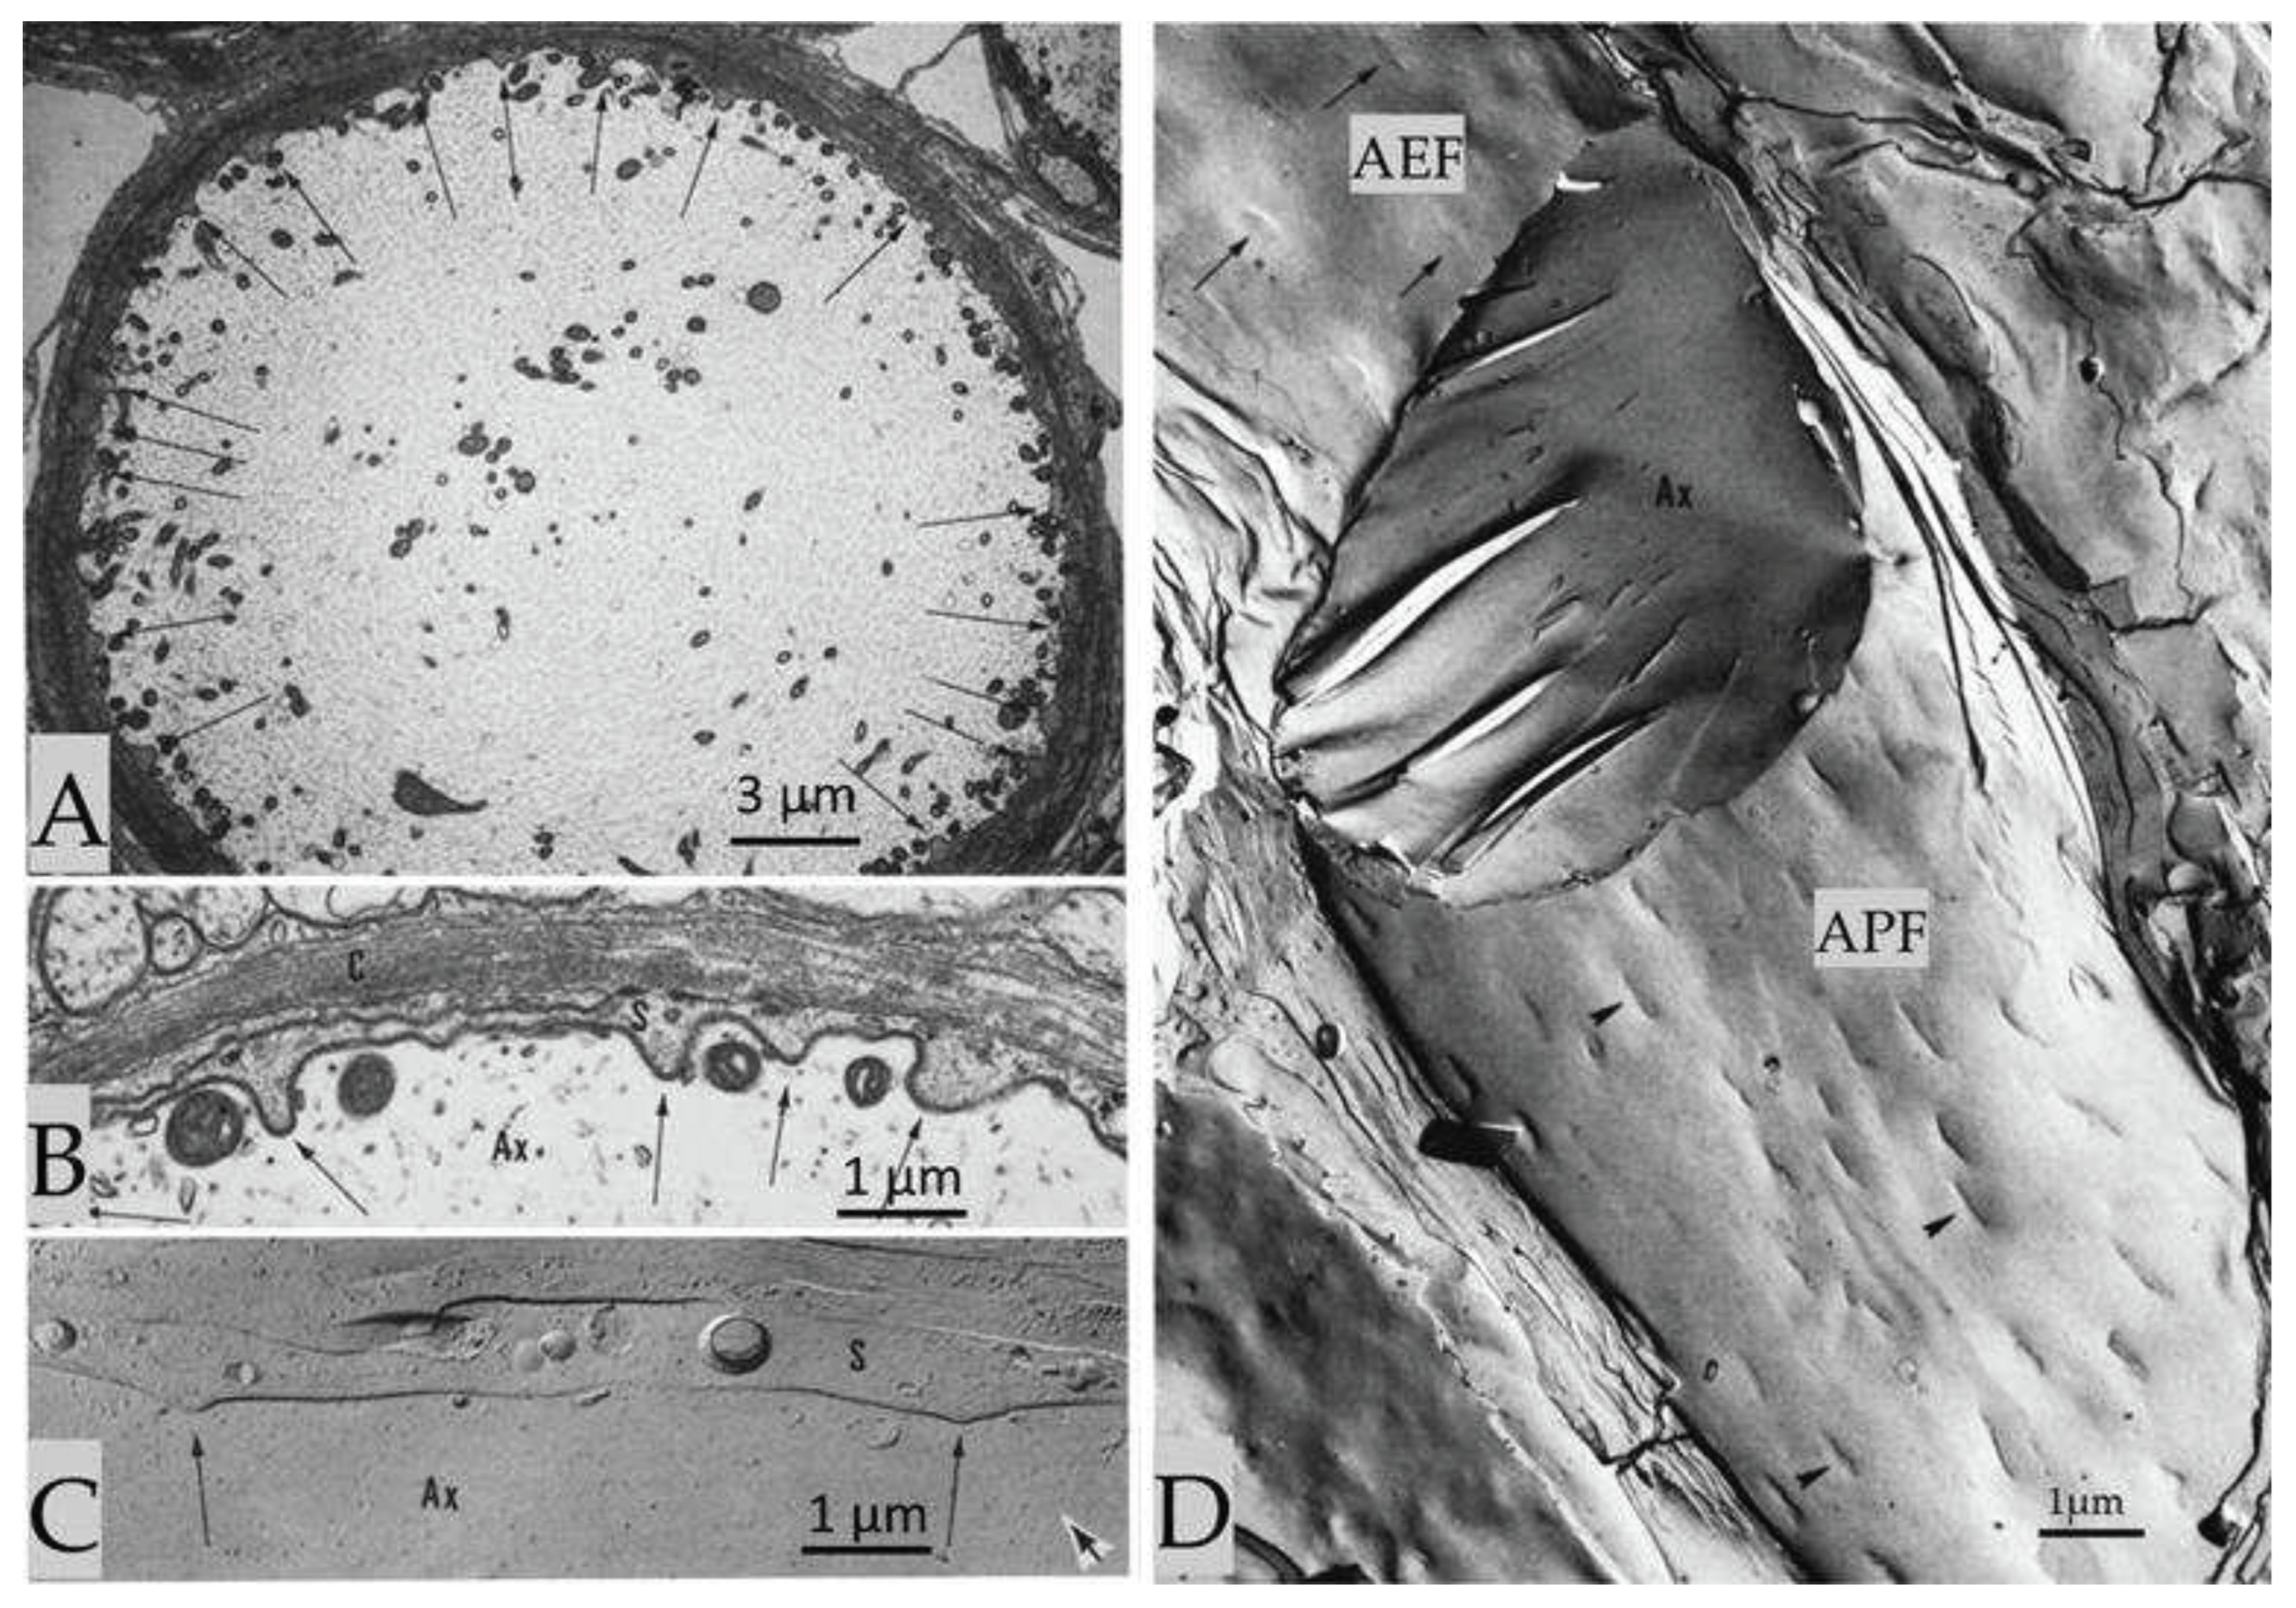
Figure 4.
The elongated indentation shown in Figure 3, contain parallel chains of ~80 Å particles that
repeat every 120-125 Å (A, APF). The particles repeat along the chain every 80-85 Å (A). Random
particles ~80Å in size (arrowheads) are seen in both APF (A) and AEF (B). Complementary arrays of
pits are seen in the E-face (B, AEF). This structure has a rhomboidal unit cell of 80-85 × 120-125 Å (C).
D, shows a histogram of the frequency of the angle between axes a and b (A and C). In sheath-glial
cells (E and F), the indentations display randomly arranged particles 100-120 Ǻ in size and rarely pits
(arrows). In E and F, the arrowheads point to dimples and complementary protrusions, ~400 Å in size,
representing the openings of the membranous lattice present in the cytoplasm sheath-glial cell cells
cytoplasm (see Figure 13, B). APF and AEF, Axonal P and E fracture faces, respectively. SPF and SEF,
Sheath-glial cells’ P and E fracture faces, respectively. Adapted from Ref. 3.
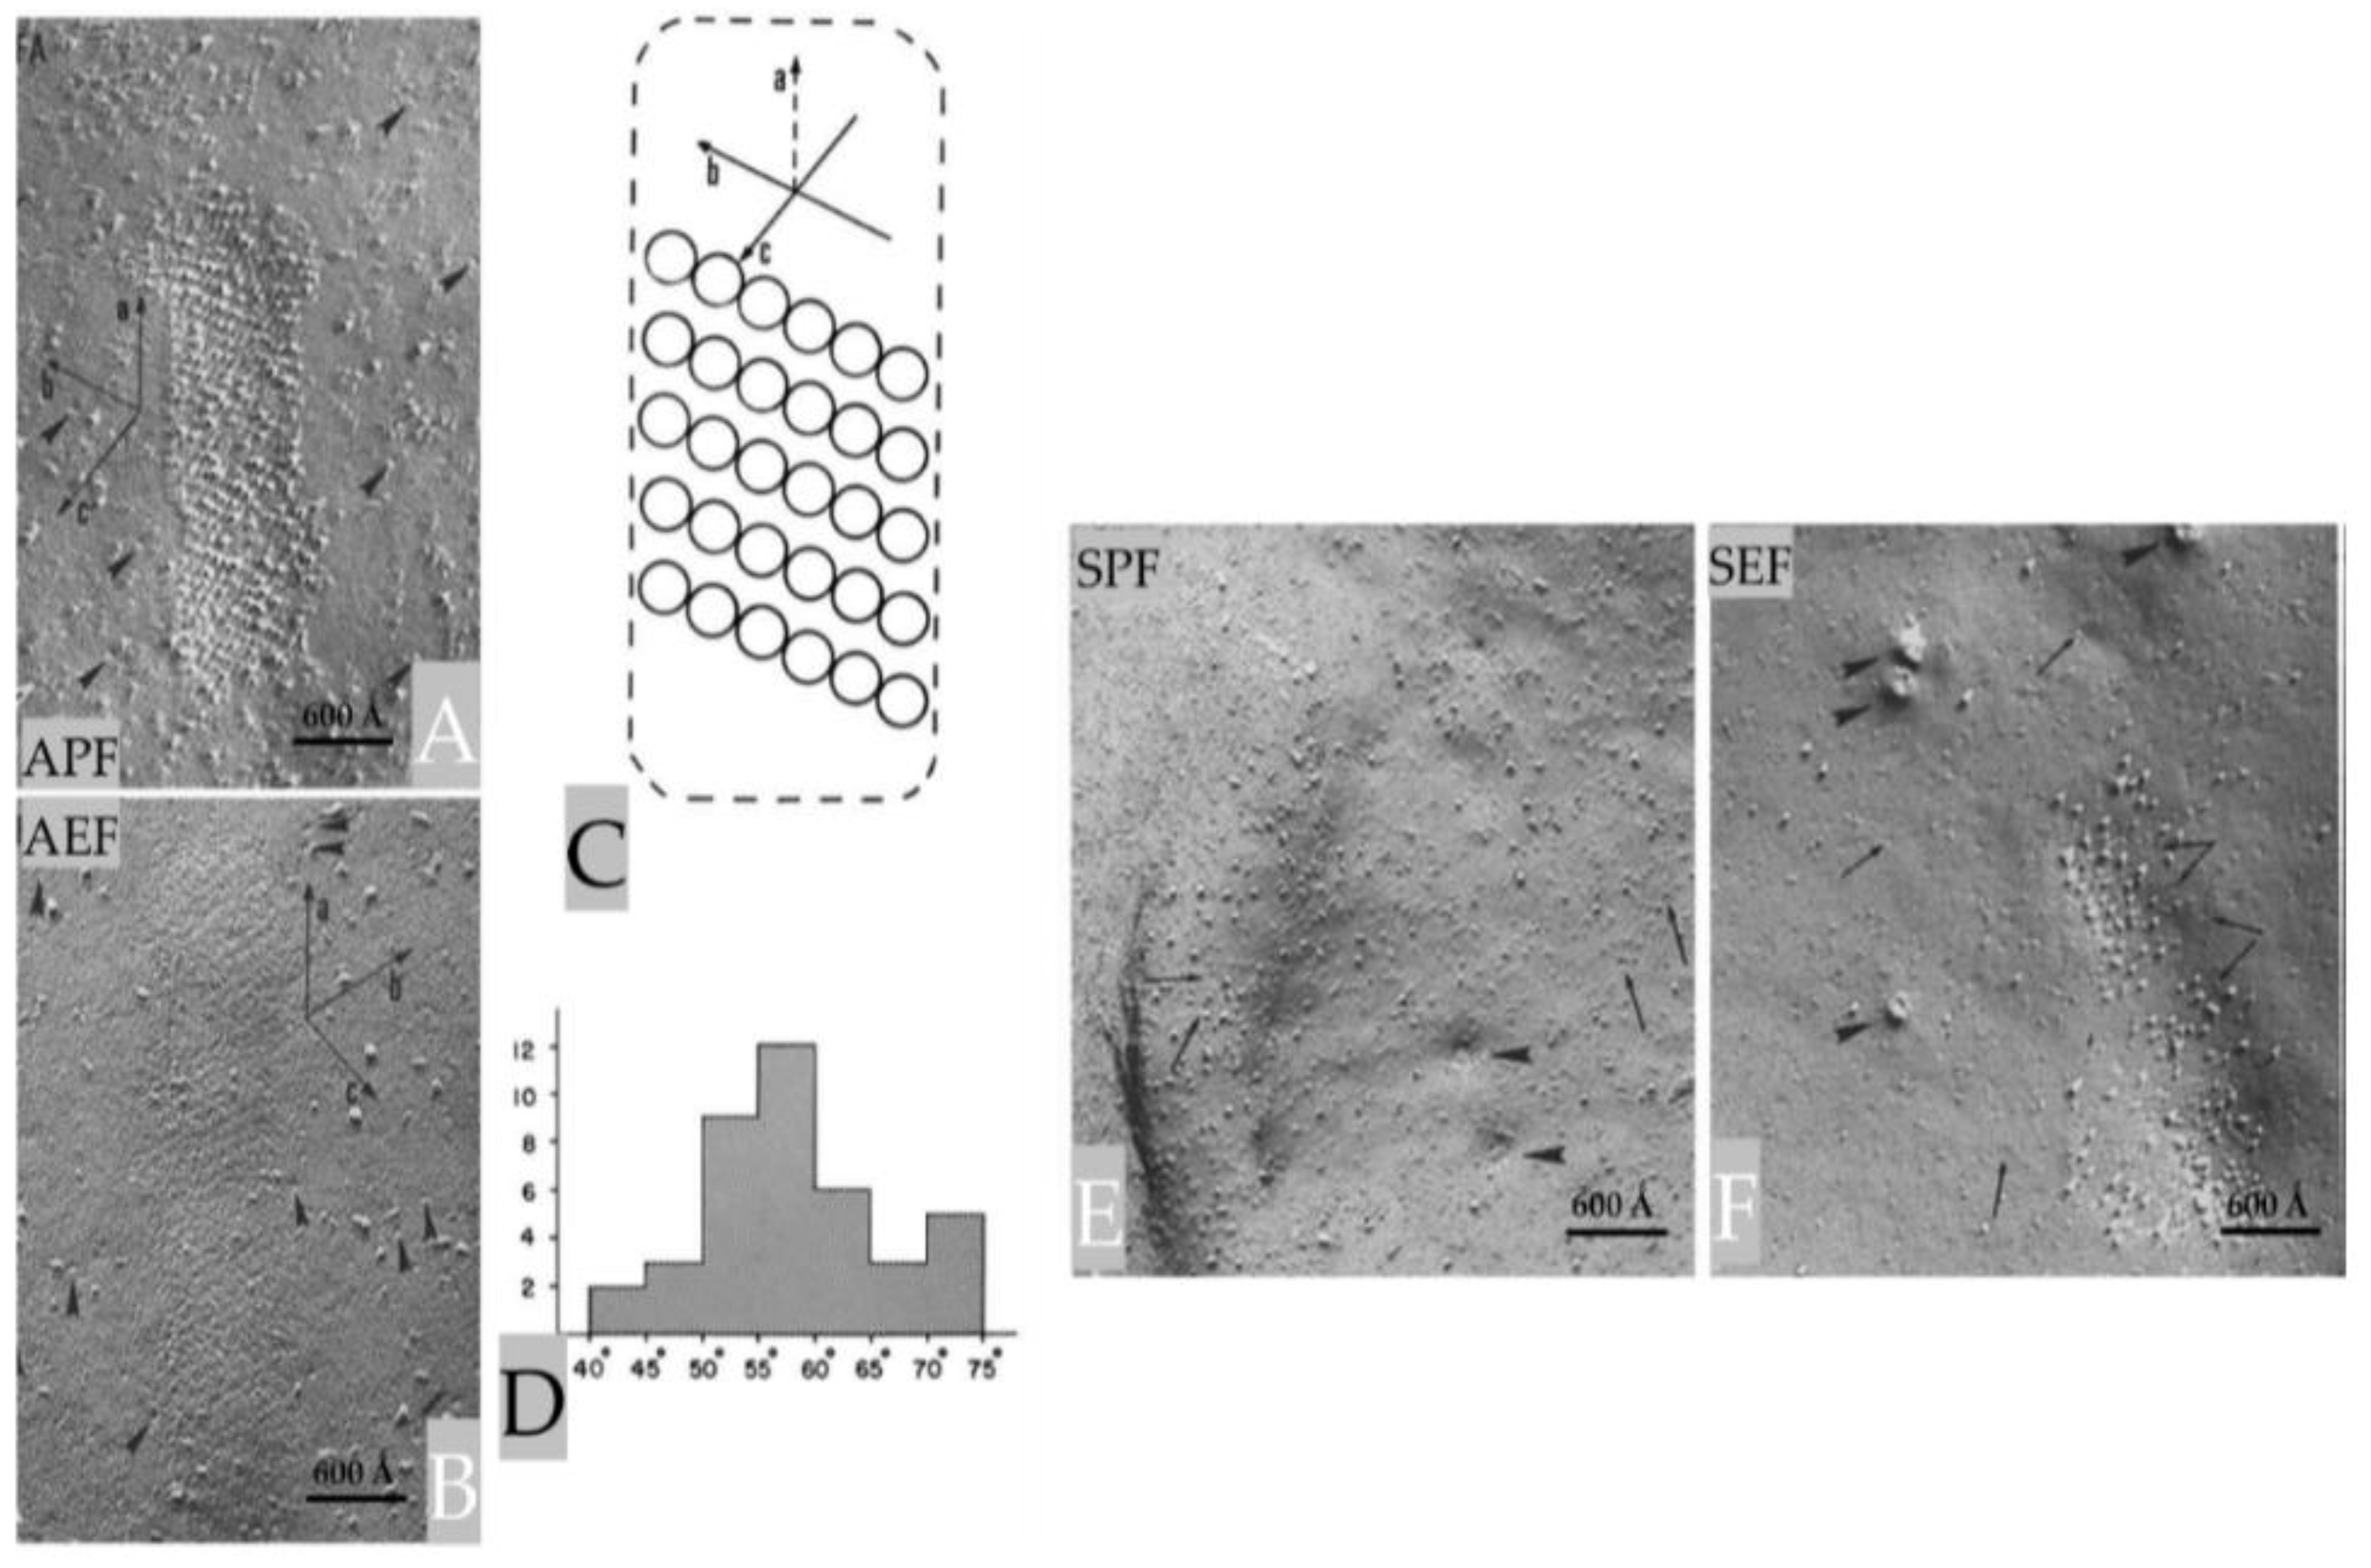
Figure 5.
Thin section of a crayfish axon. Axonal and glial cell plasma membranes fuse forming two pores. The inset is an enlargement of the pore region. A, axon; G, sheath-glial cell; C, connective tissue. Adapted from Ref. 7.
Figure 5.
Thin section of a crayfish axon. Axonal and glial cell plasma membranes fuse forming two pores. The inset is an enlargement of the pore region. A, axon; G, sheath-glial cell; C, connective tissue. Adapted from Ref. 7.
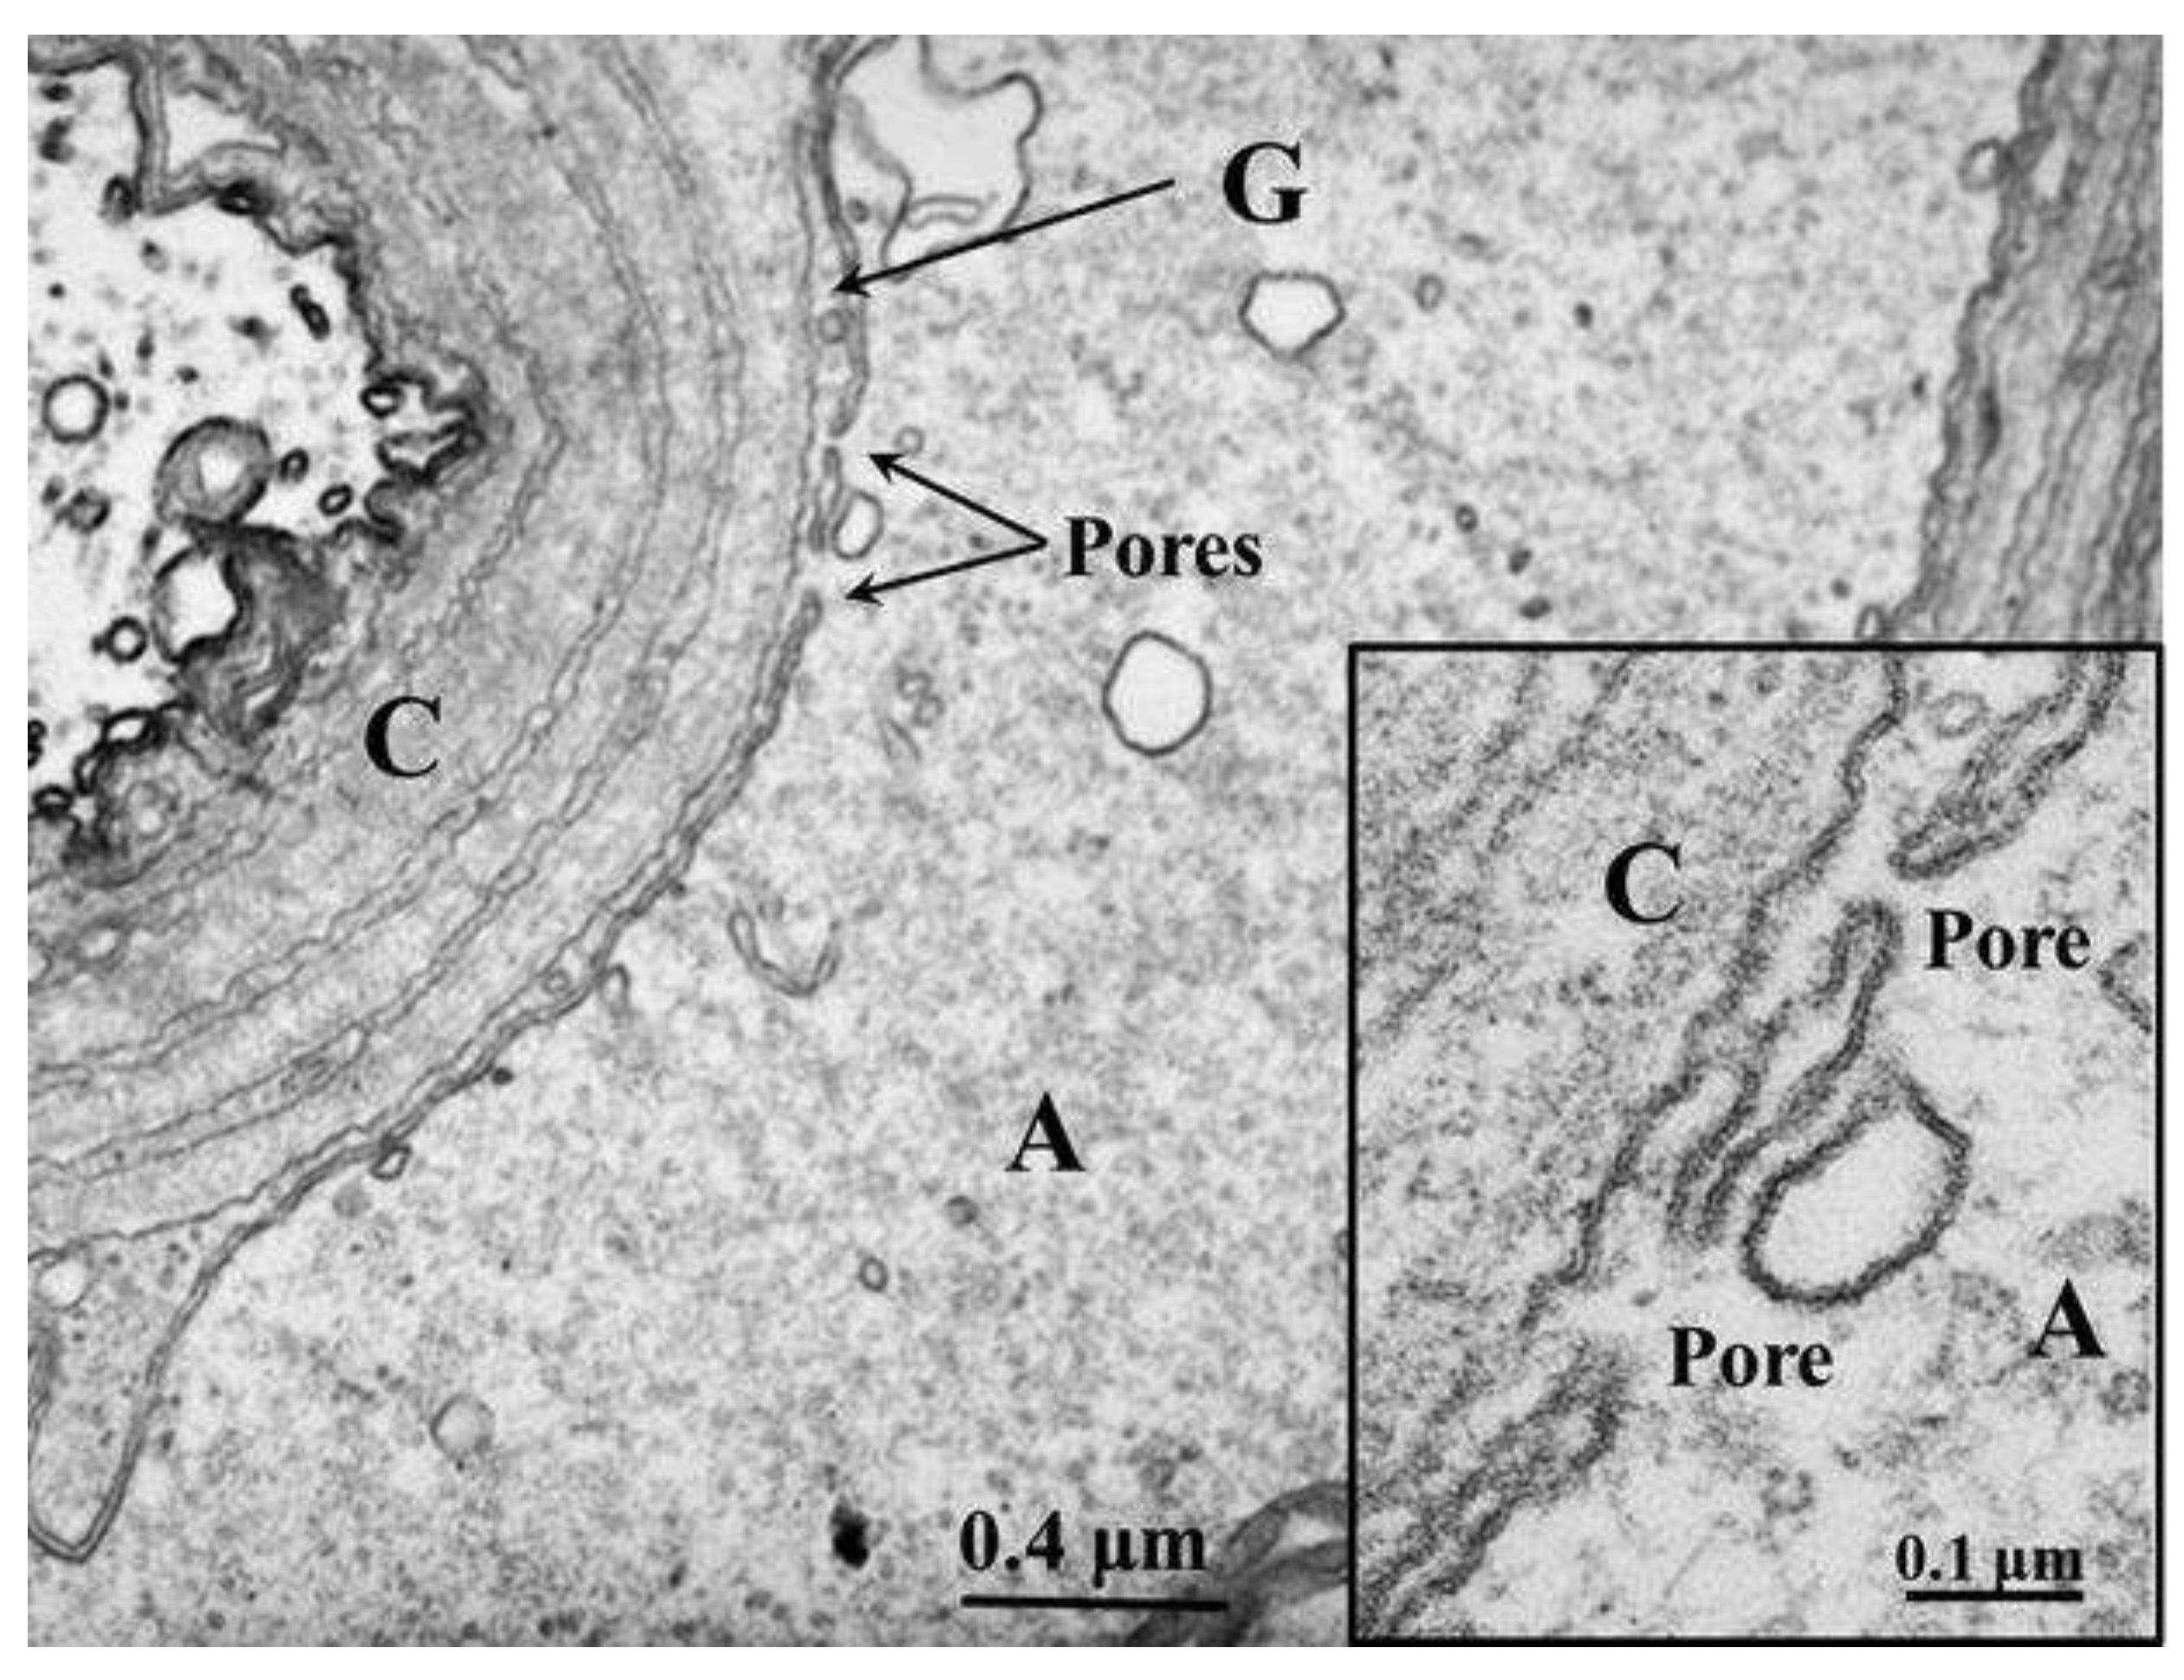
Figure 6.
Thin section of crayfish axon displaying a large pore opening. Cytoplasmic organelles are accumulated near the pore region. A, axon; G, sheath-glial cell; C, connective tissue. Adapted from Ref. 7.
Figure 6.
Thin section of crayfish axon displaying a large pore opening. Cytoplasmic organelles are accumulated near the pore region. A, axon; G, sheath-glial cell; C, connective tissue. Adapted from Ref. 7.
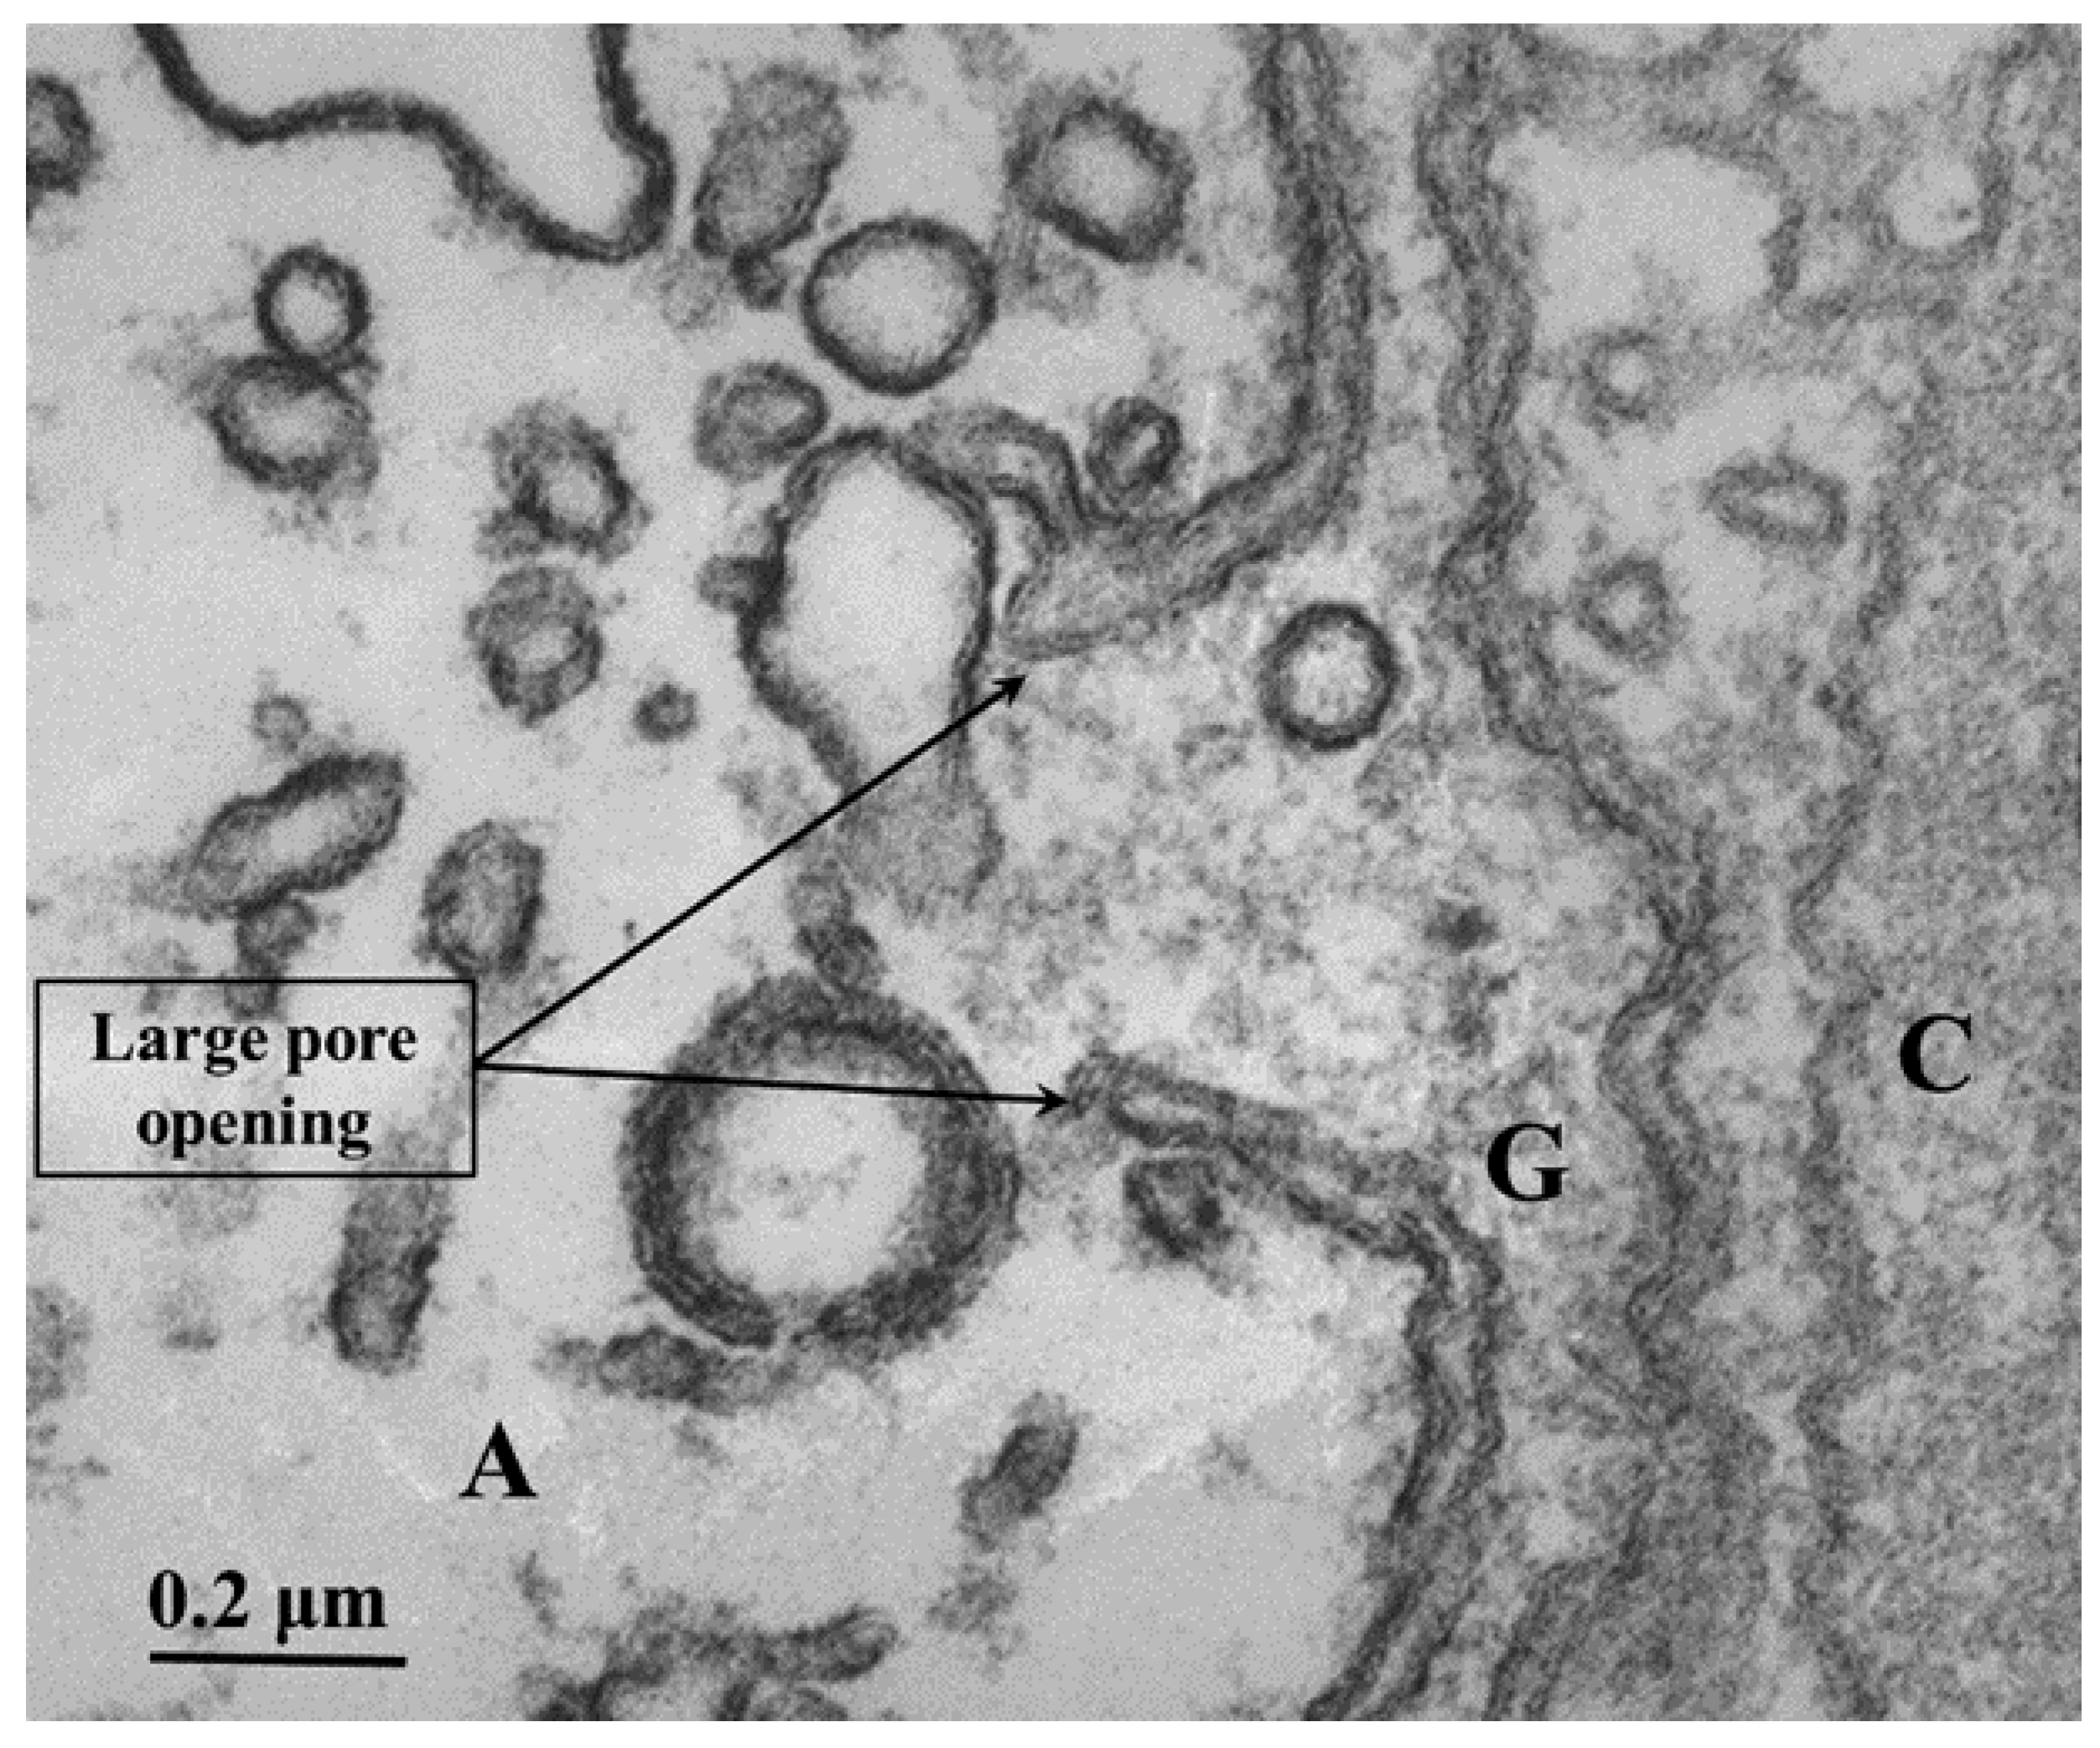
Figure 7.
Control axon. Small area of cross-sectioned medium-sized axon. All the axonal membranes display similar electron opacity. The inset shows a mitochondrion (M) at higher magnification; note that both inner and outer mitochondrial membranes display similar thickness and osmiophilia. Adapted from Ref. 2.
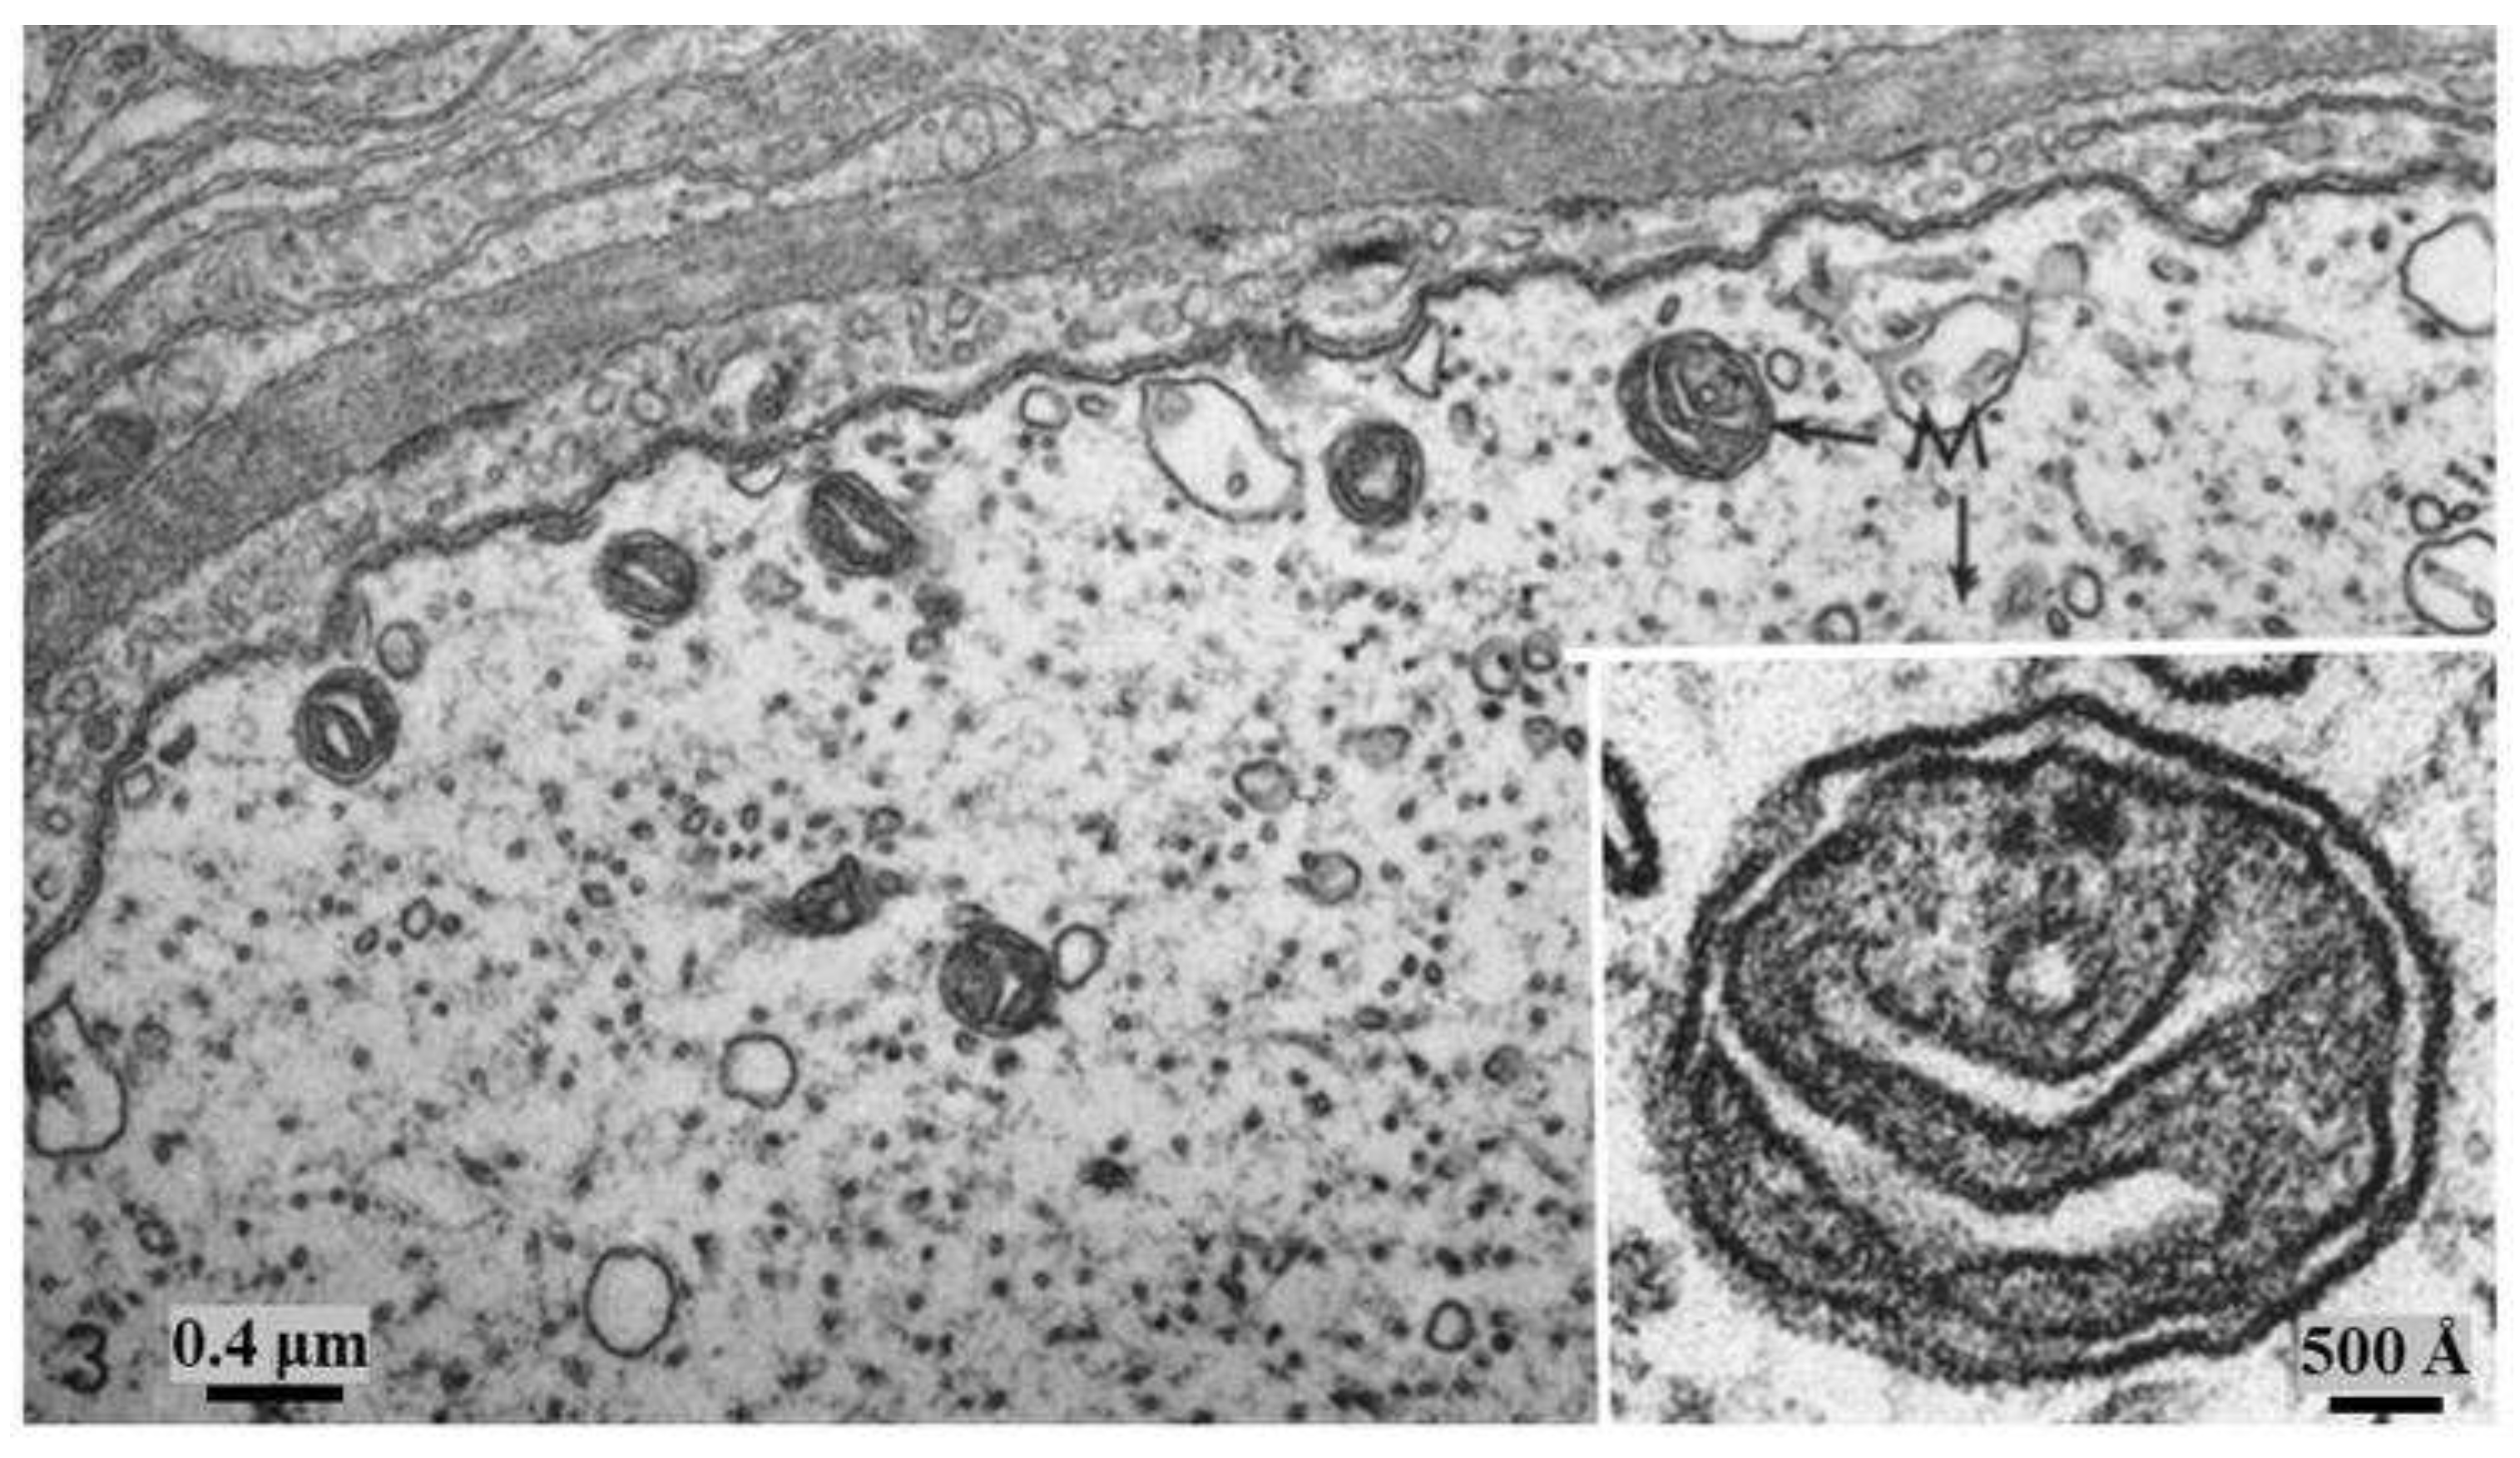
Figure 8.
The membranes of lateral giant axons fixed during electrical stimulation display drastic increase in osmiophilia (A, top axon, and B), while small neighboring axons show normal osmiophilia (A, left and bottom axons). Increased osmiophilia is seen in the plasma membrane, the outer membrane of the mitochondria, and the membrane of ER/Golgi cisternae. The lateral giant axon and the two small axons are separated by sheath-glial cells and connective tissue (A). B, shows an area of a lateral giant axon particularly rich in ER/Golgi cisternae. Note that the mitochondrial outer membranes display very pronounced electron opacity, while the inner mitochondrial membrane and the membranes of the sheath-glial cells are as in control axons (B). G, Golgi apparatus of the sheath-glial cell. Adapted from Ref. 2.
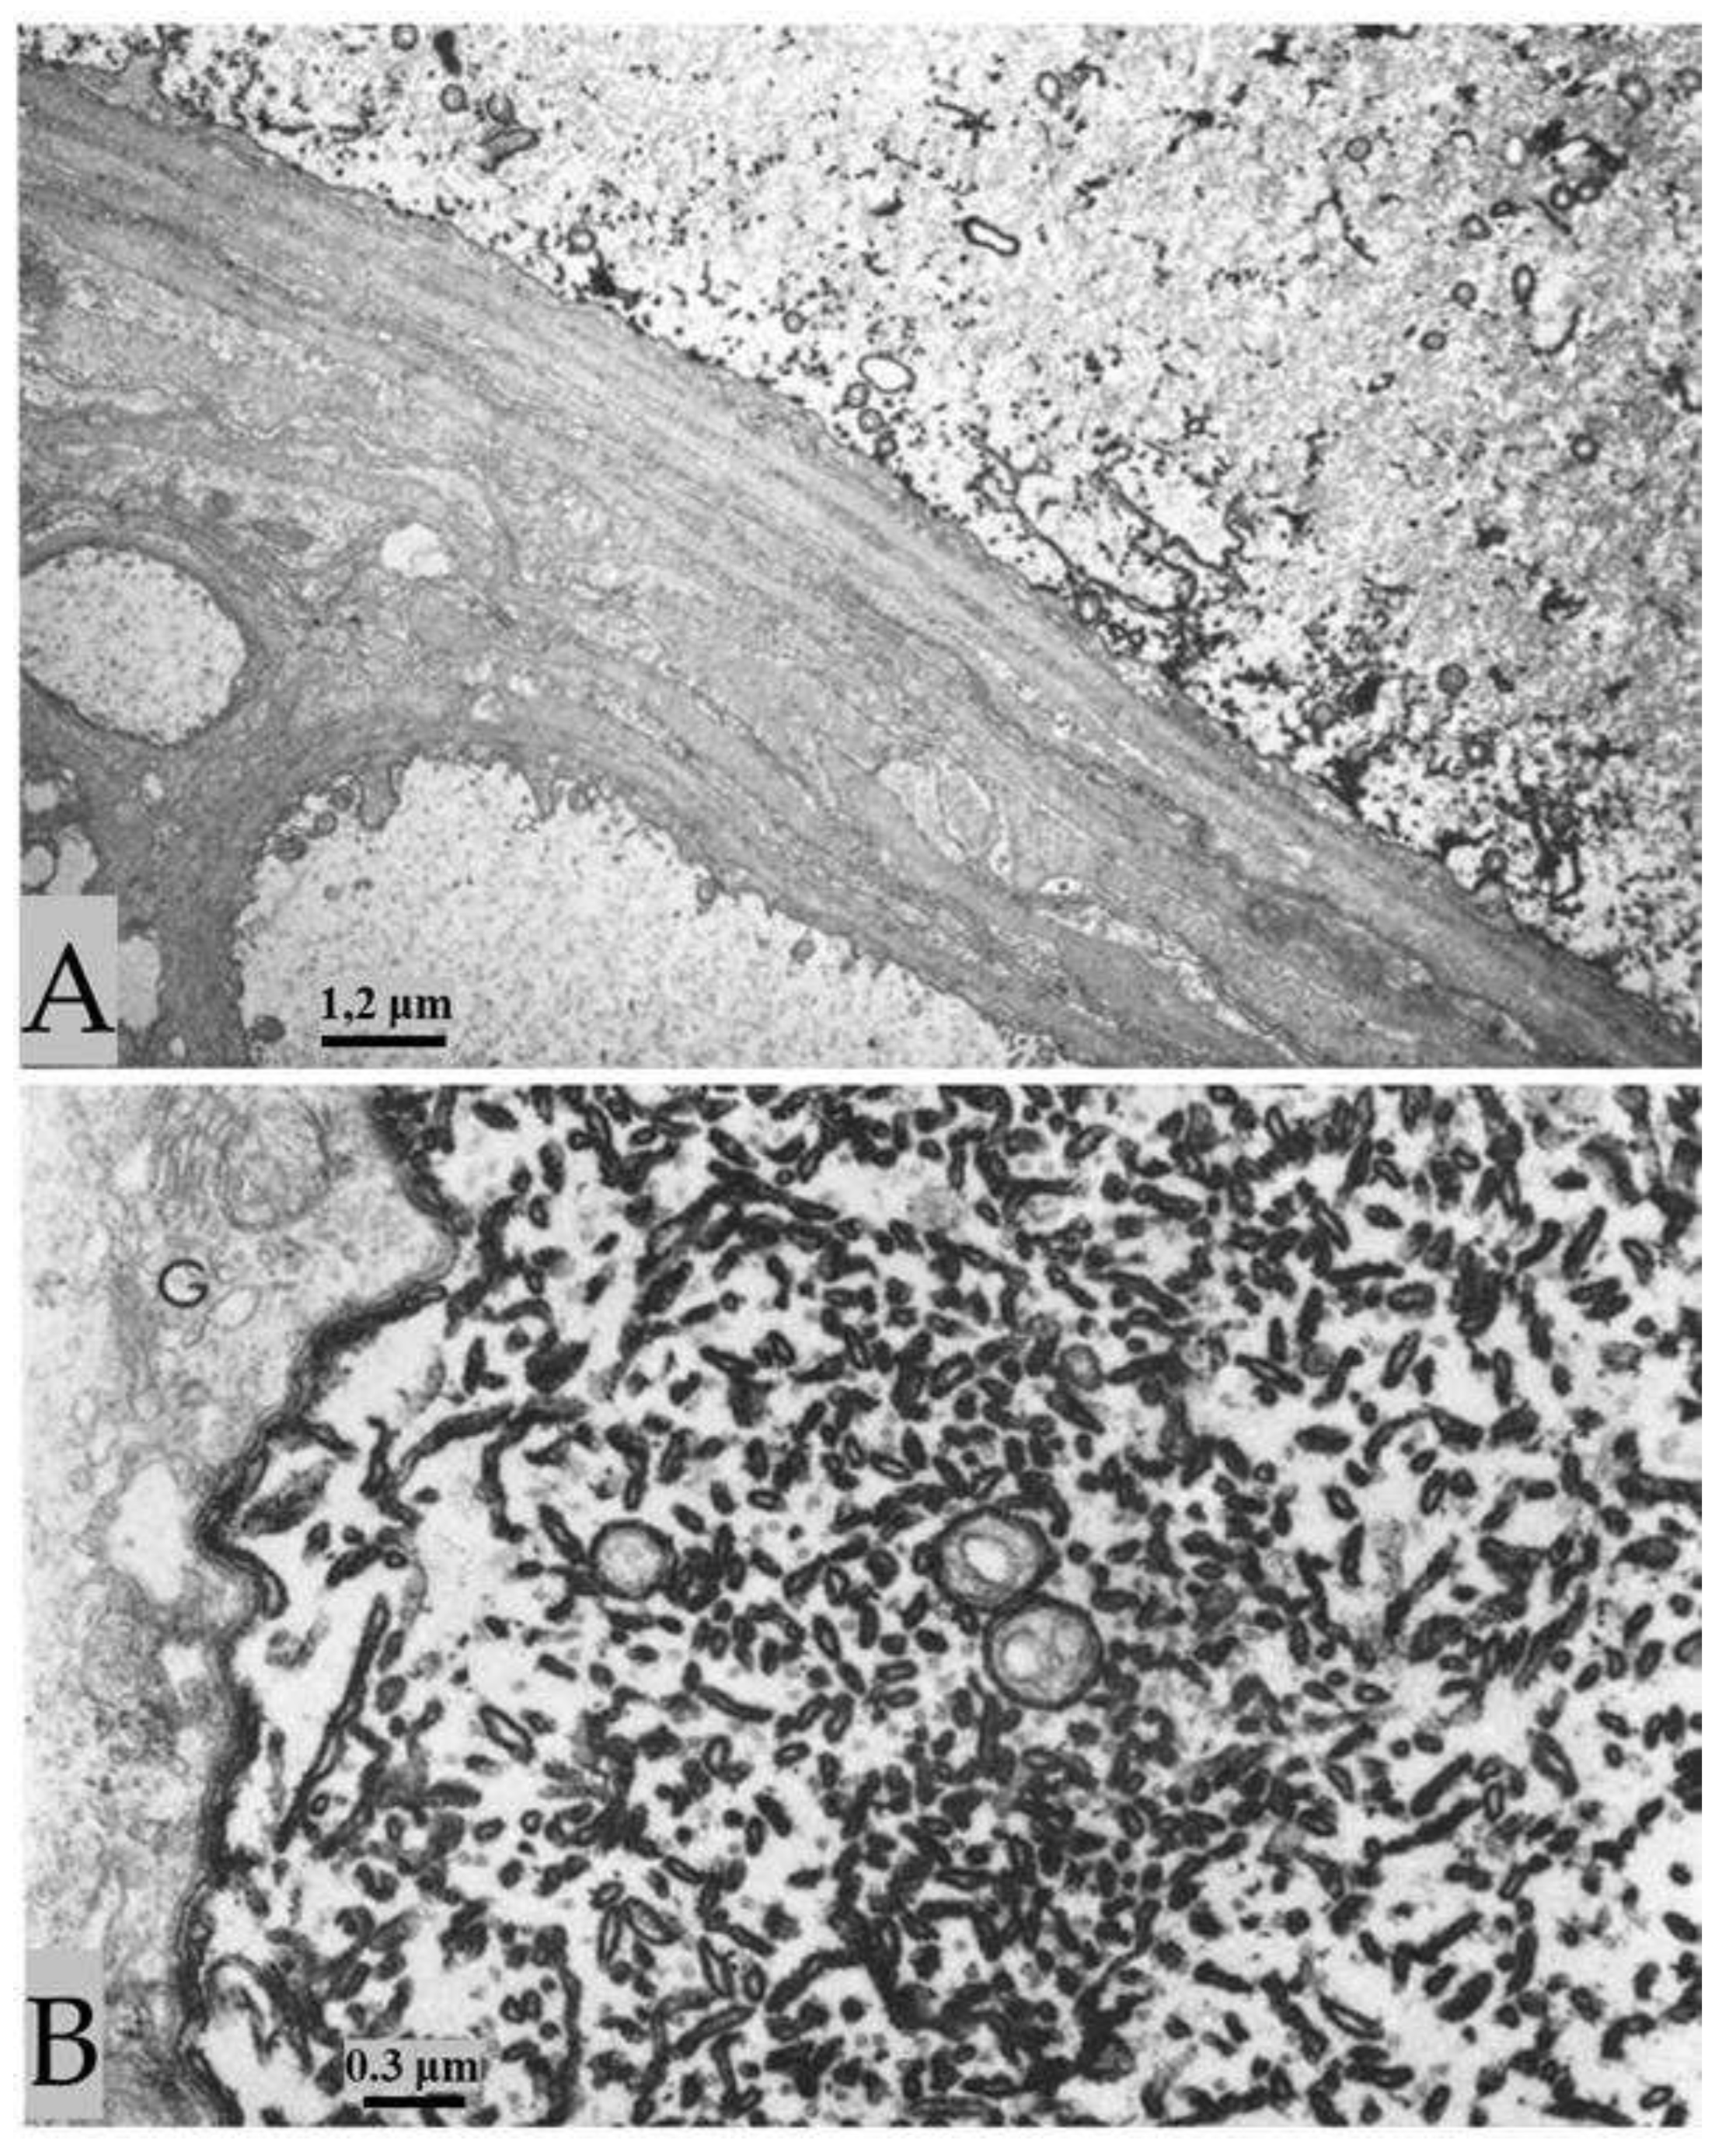
Figure 9.
A stimulated median giant axon (A) displays increased osmiophilia in the plasma membrane, the outer mitochondrial membrane, and the ER/Golgi membranes, while the inner mitochondrial membrane (A), and the membranes of the sheath-glial cells (A and inset) are as in controls. In B, only the top of these two medium-sized axons displays membranes of increased osmiophilia and thickness; this indicates that the reaction occurs only in certain axons (most likely the stimulated ones). Adapted from Ref. 2.
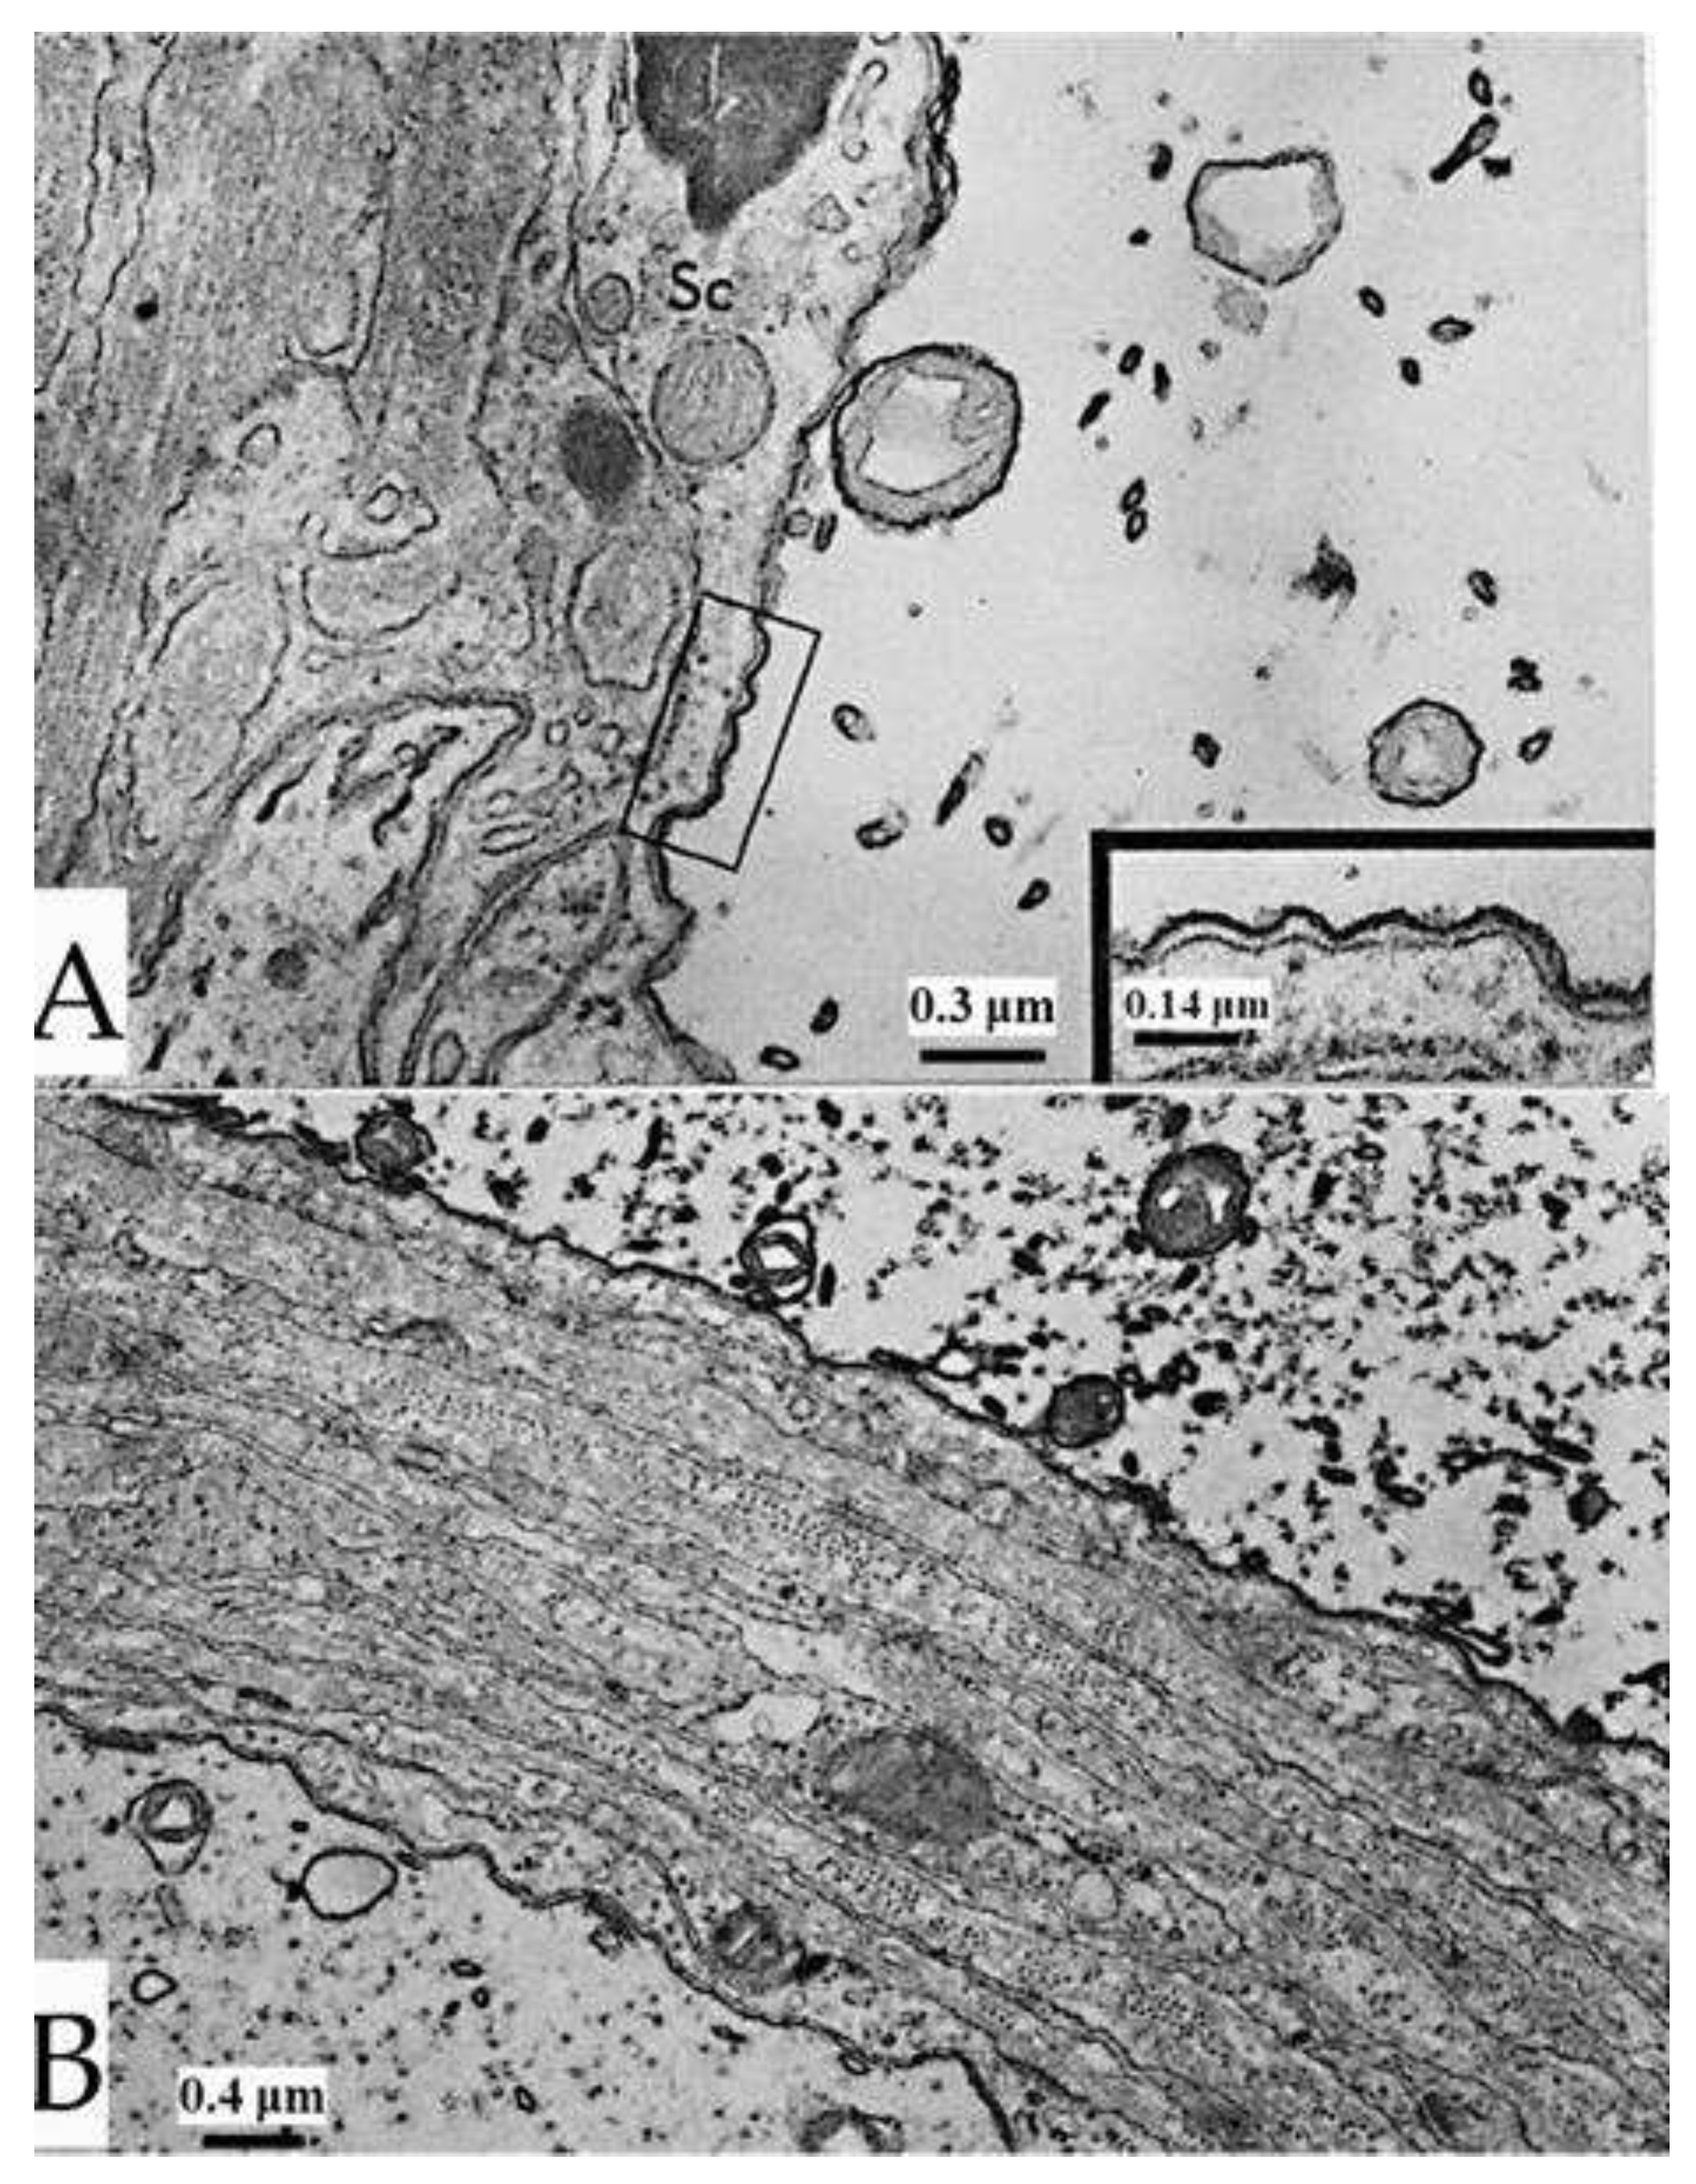
Figure 10.
Stimulated axons. In axonal mitochondria stained with uranyl acetate and lead citrate (A) the electron dense leaflets of the outer membrane display increased osmiophilia and thickness, which is more pronounced in the outer leaflet (A, inset). The thickness of the outer membrane is 120-150 Å (A, inset). The increased osmiophilia and thickness is also seen in unstained preparations (B). Here also, the axoplasmic leaflet of the membrane is thicker than the inner one (B, inset). Adapted from Ref. 2.
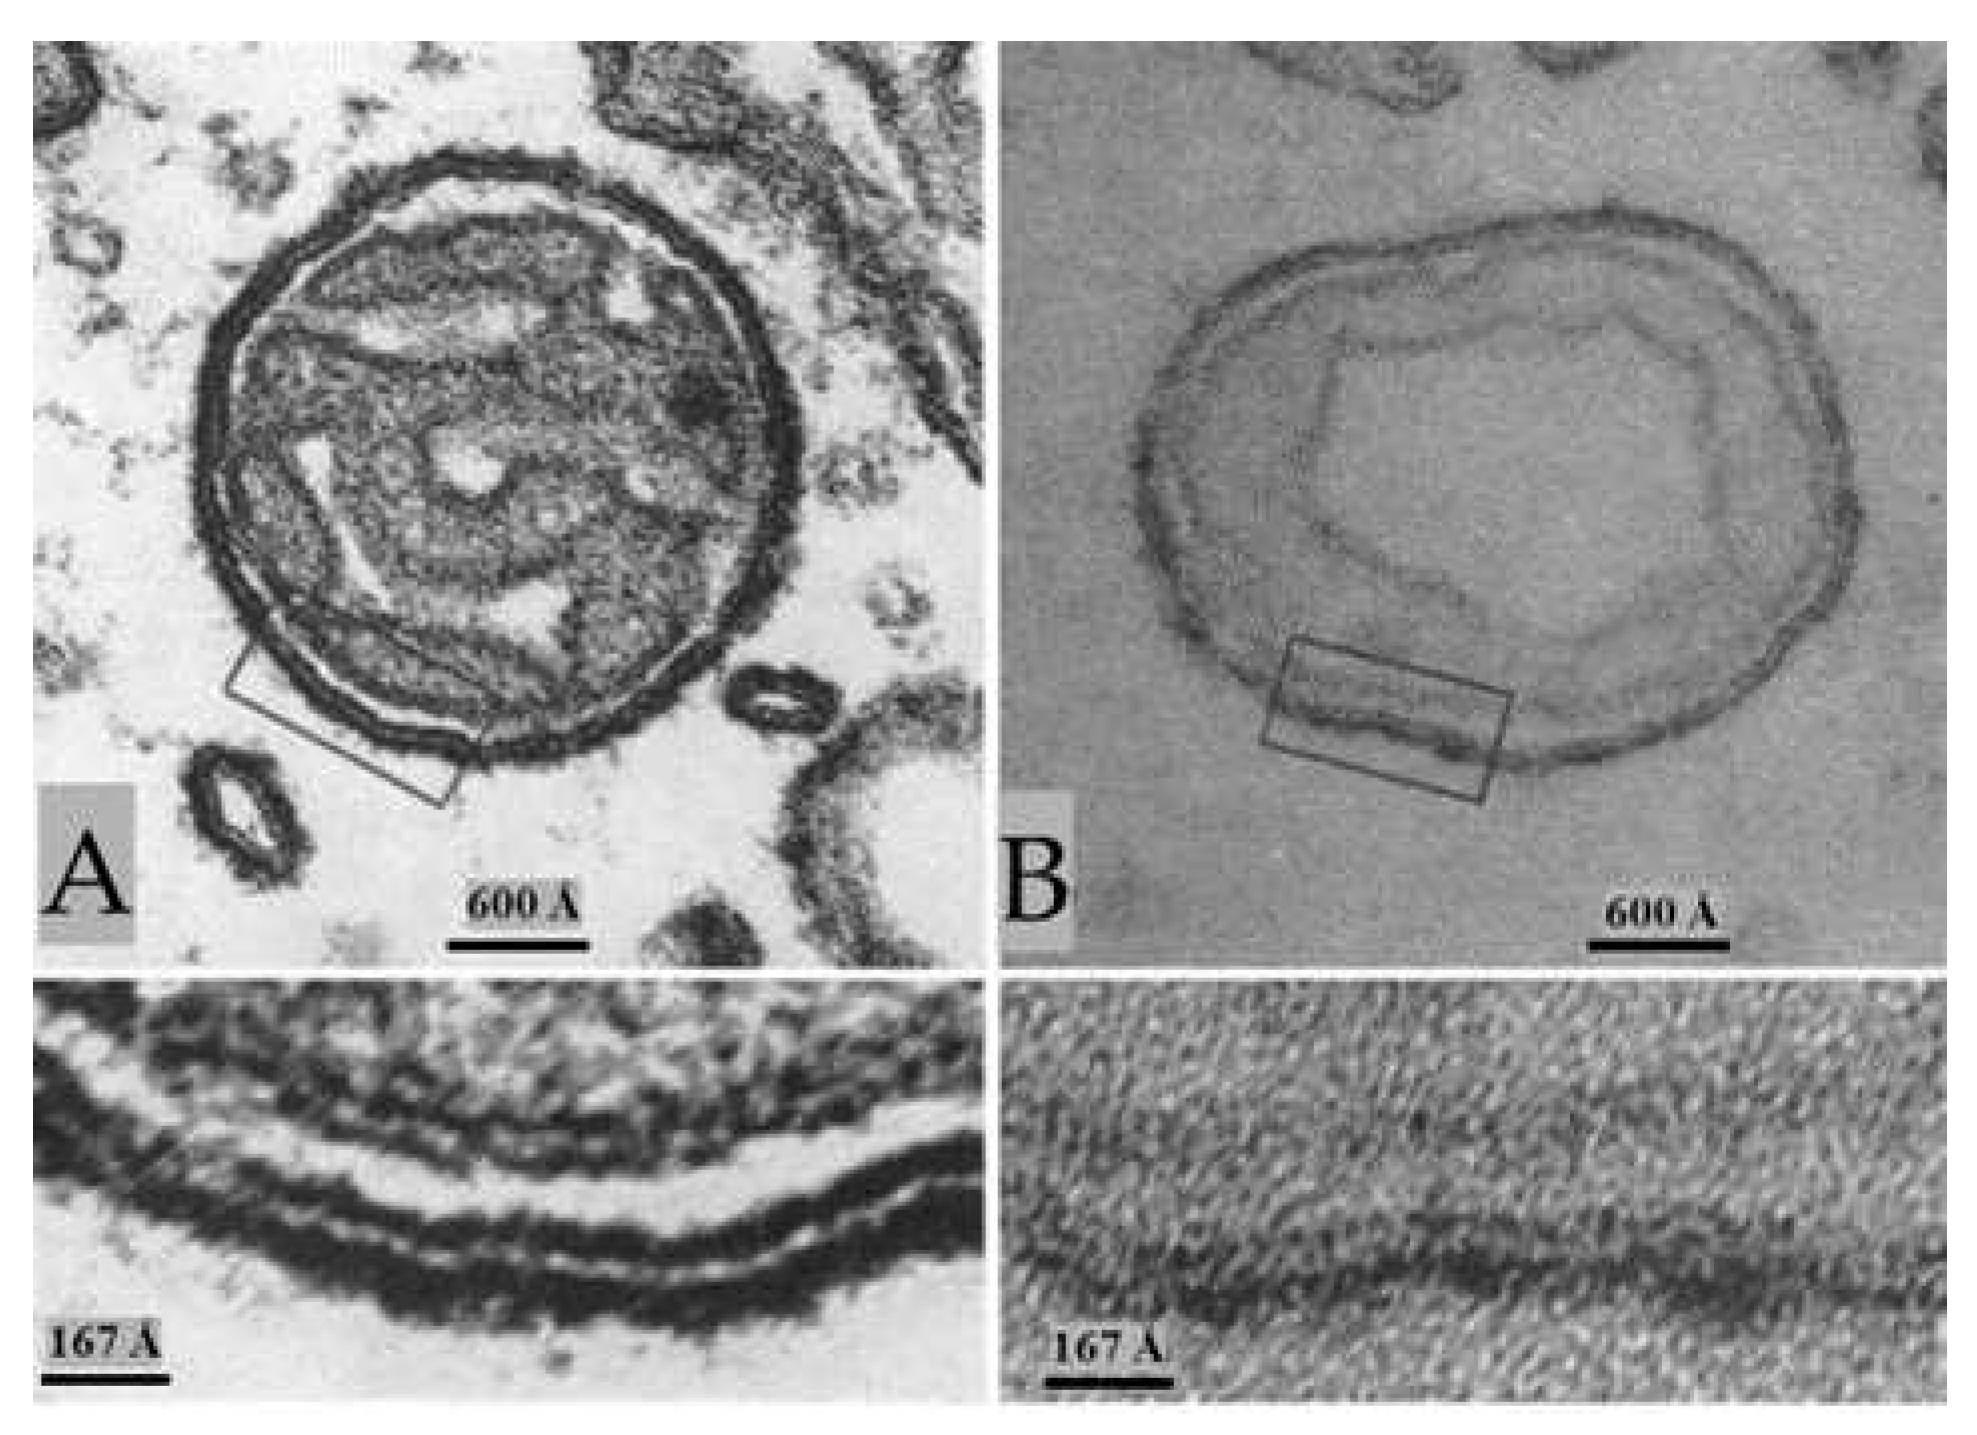
Figure 11.
Stimulated axons. In axonal mitochondria obliquely sectioned (A), the outer membrane displays granularity, suggesting that the electron opaque material is not a homogeneous continuous layer. Cross sectioned outer mitochondrial membranes (B) show that the granularity is due to thew presence of particles ~150 Å in size spaced every ~200 Å. In stimulated ganglia, gap junctions of lateral giant axons (C) also display increased electron opacity in their typical hexagonal array of cell-cell channels. The channels are spaced at ~200 Å (C and c). Note that the channels are not seen in unstimulated axons fixed with glutaraldehyde/osmium tetroxide (C, a, and b). Adapted from Ref. 2.
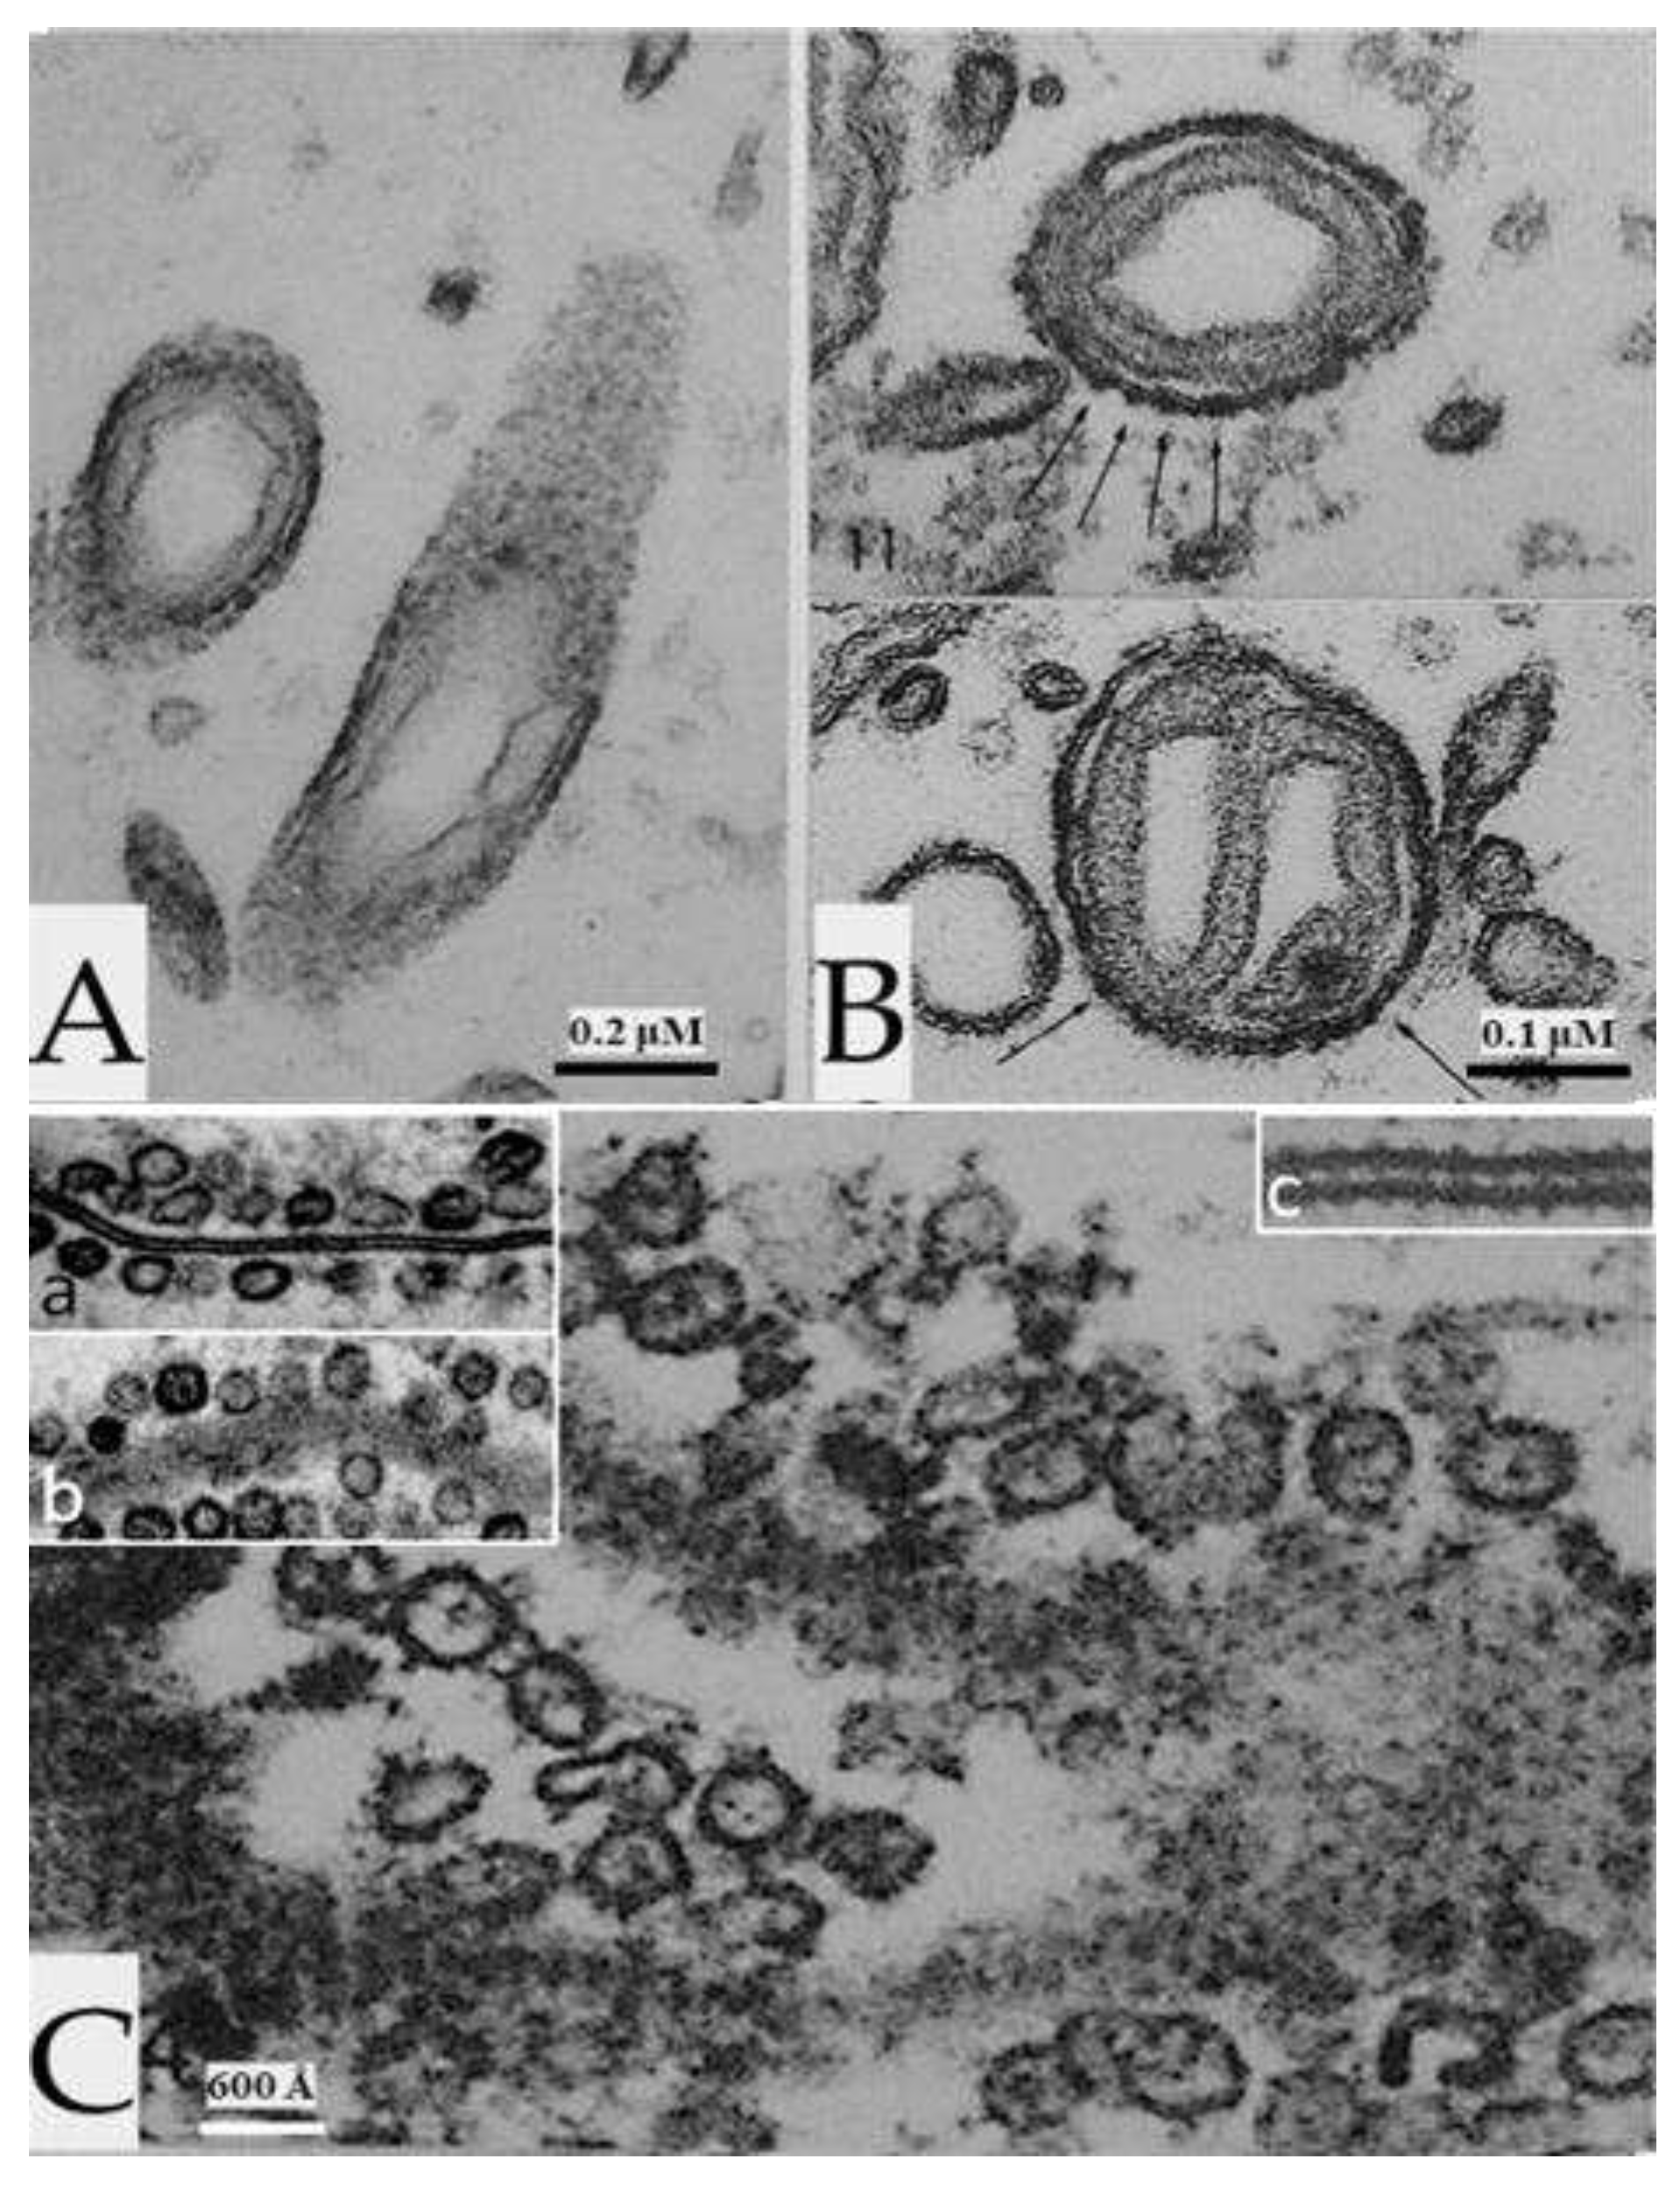
Figure 12.
In axons treated with thioglycolate (A-C) or DTE, all the axons display increased electron opacity in their plasma membranes, outer mitochondrial membranes, and ER/Golgi membranes, as in electrically stimulated (Figure 8, Figure 9, Figure 10 and Figure 11) or asphyxiated axons. In contrast, the inner mitochondrial membrane (B and C), and the membranes of the sheath-glial cells (B and C) do not show changes. The inset in B shows inner and outer mitochondrial membranes at higher magnification. Am, Axoplasmic membrane; M, mitochondrion; G, sheath-glial cell. Adapted from Ref. 2.
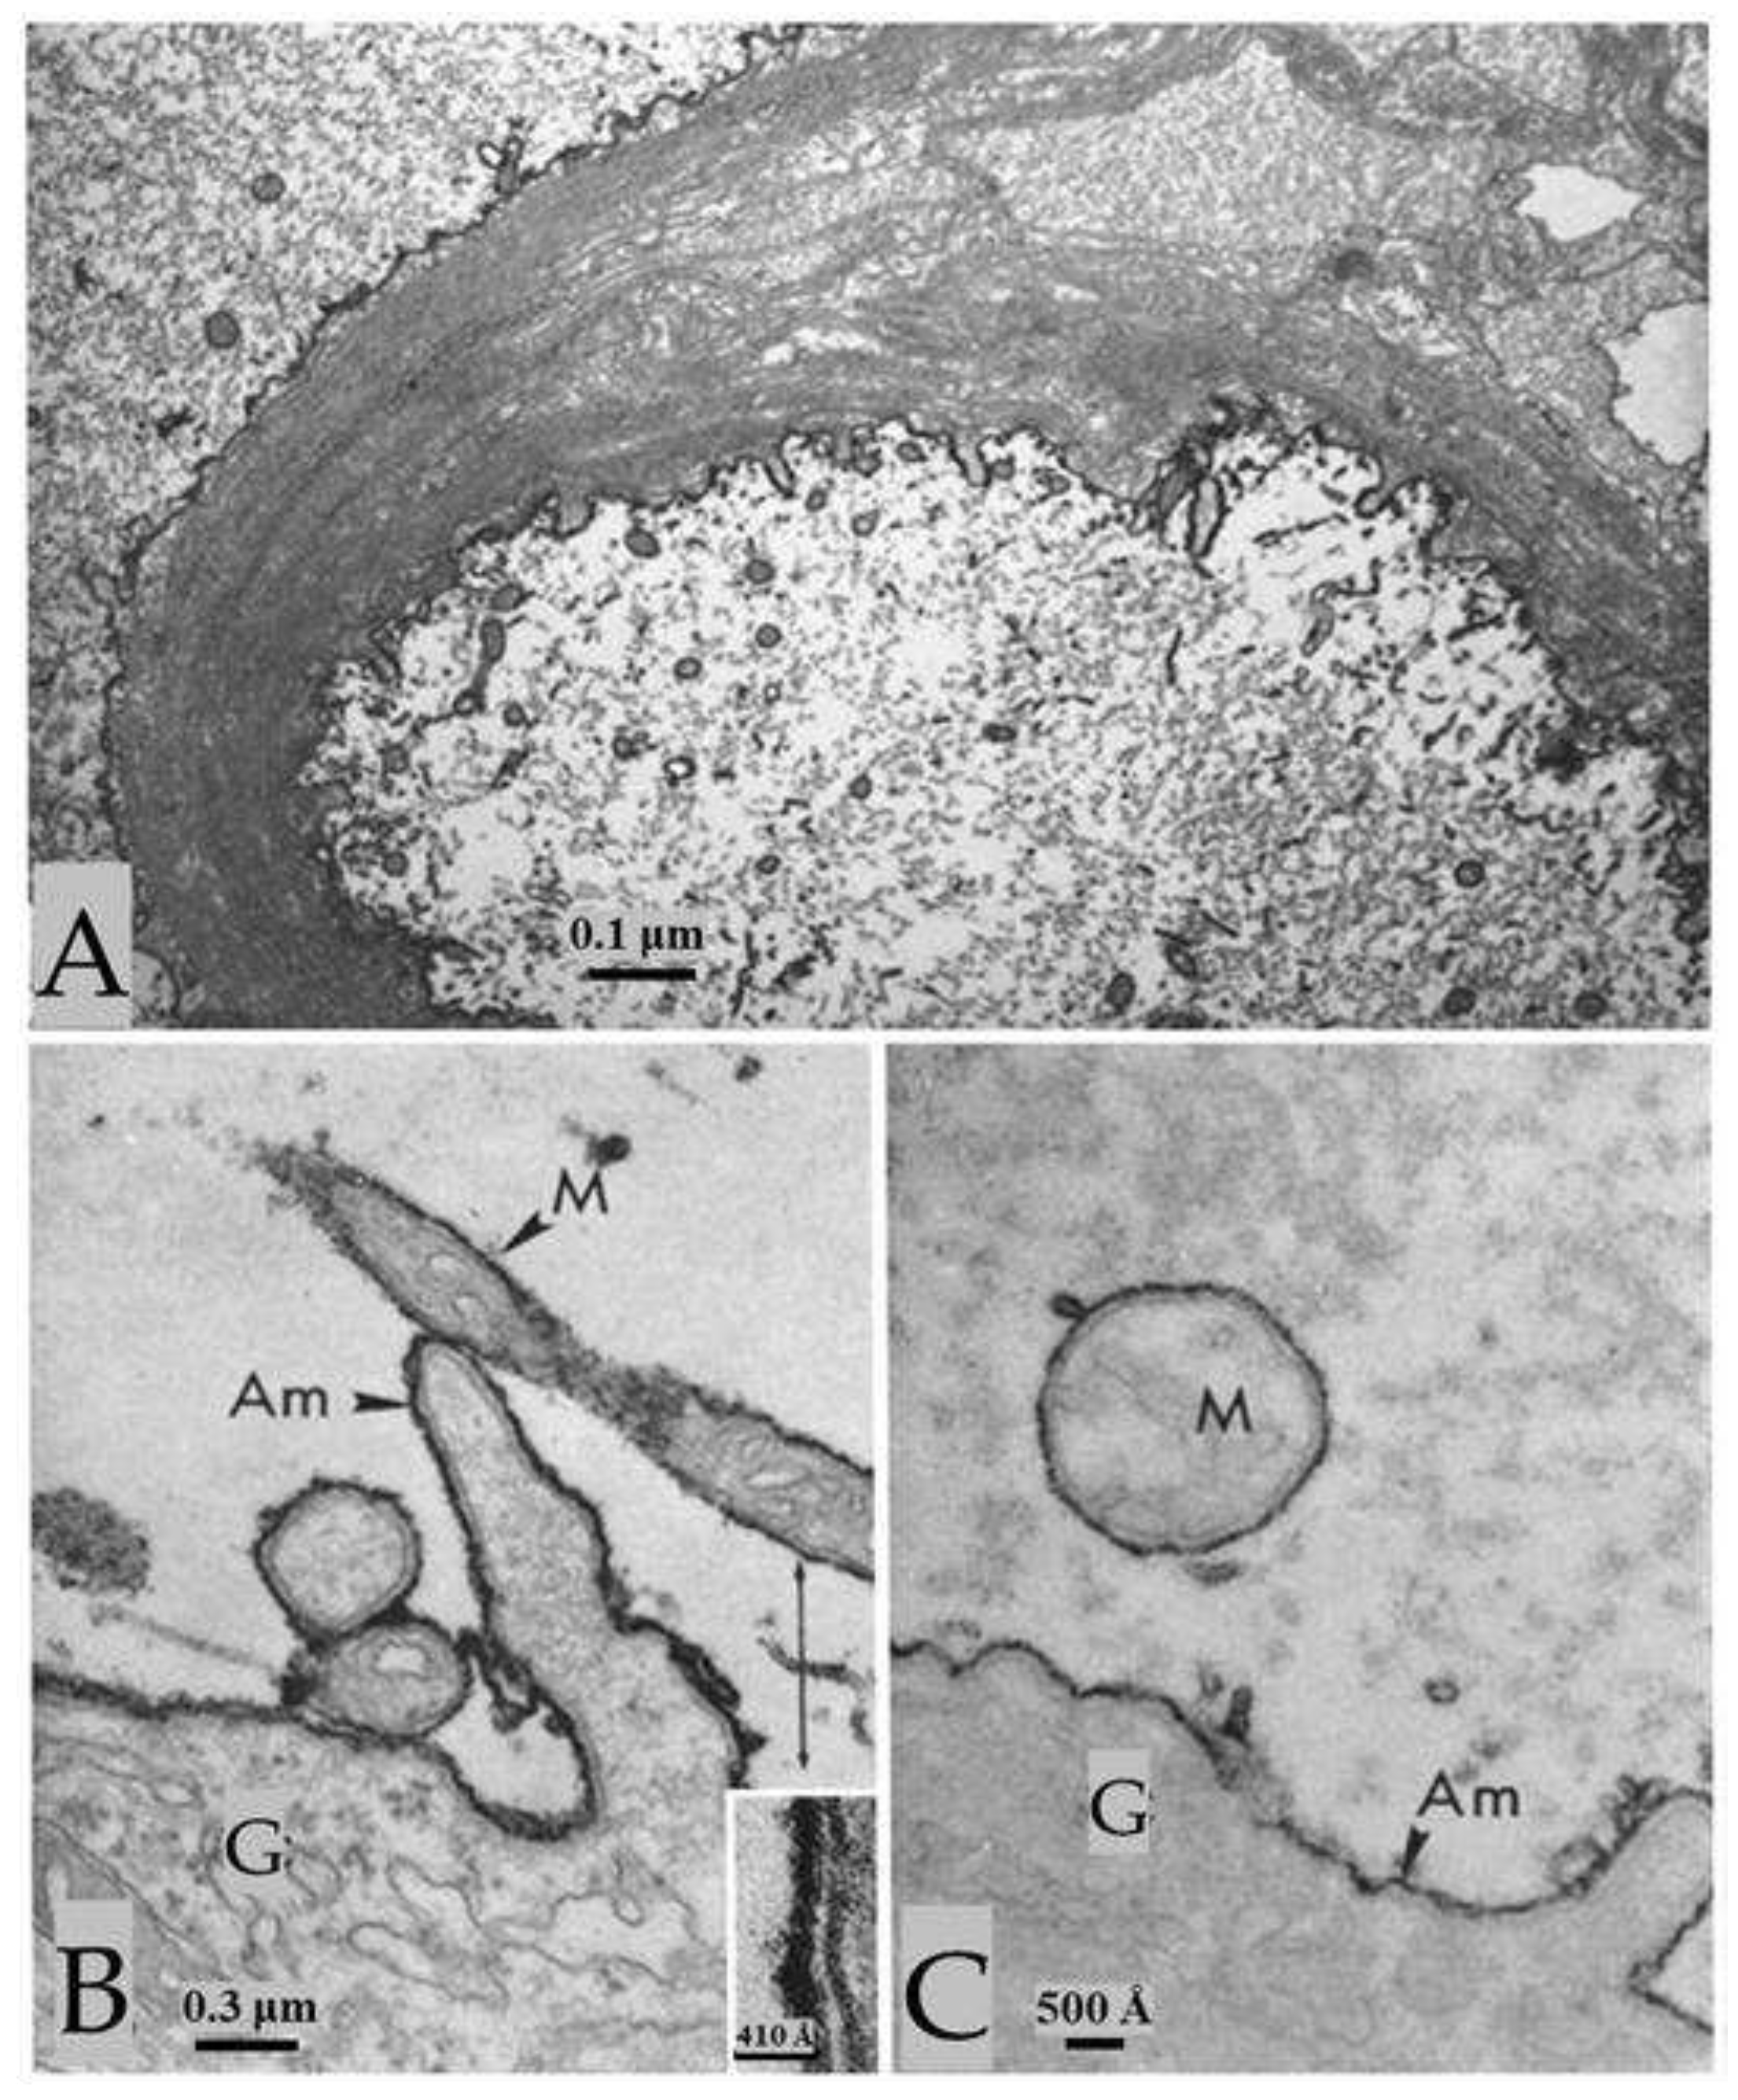
Figure 13.
Axons treated with thioglycolate (TG) followed by maleimide. Sulfhydryl groups (-SH), unmasked by TG, are blocked by maleimide (A and B) of NEM, such that all the membranes display the same electron opacity of control membranes. B, shows a median giant fiber at higher magnification. In the cytoplasm of the sheath-glial cell (B), one sees the tubular lattice (L), a structure that enabled rapid exchange of molecules between the axonal surface and the connective tissue. G, sheath-glial cell. Adapted from Ref. 2.

Disclaimer/Publisher’s Note: The statements, opinions and data contained in all publications are solely those of the individual author(s) and contributor(s) and not of MDPI and/or the editor(s). MDPI and/or the editor(s) disclaim responsibility for any injury to people or property resulting from any ideas, methods, instructions or products referred to in the content. |
© 2023 by the authors. Licensee MDPI, Basel, Switzerland. This article is an open access article distributed under the terms and conditions of the Creative Commons Attribution (CC BY) license (http://creativecommons.org/licenses/by/4.0/).
Copyright: This open access article is published under a Creative Commons CC BY 4.0 license, which permit the free download, distribution, and reuse, provided that the author and preprint are cited in any reuse.


