
Submitted:
11 August 2023
Posted:
11 August 2023
You are already at the latest version
Abstract
Bitumen is produced from non-renewable natural resources, continuously deplete and intrigues researchers to look for alternative binders. Annually, tons of waste engine oil (WEO) and crumb rubber (CR) are discarded unsustainably and pose a significant environmental threat. Adding these industrial waste products to asphalt provides a safe and cost-effective way for their disposal and improves the bitumen's performance in parallel. This study uses various combinations of waste engine oil and crumb rubber with 60/70 penetration grade bitumen to produce a partially synthetic bitumen. Adhesion being one of the critical characteristics of the bituminous binder has been assessed using the bitumen bond strength test along with physical and rheological properties. Results showed that waste engine oil with crumb rubber inclusion increases penetration and decreases the softening point, viscosity, complex modulus, and bonding strength. Additionally, polyphosphoric acid (PPA) in smaller dosages was also incorporated into the optimum percentage of CR + WEO to improve the properties of the binder. The results confirm that binder modification with waste engine oil and crumb rubber can be more effective with PPA. It is concluded that 35% of waste can replace the virgin binder giving a cost-effective and environmentally friendly solution.
Keywords:
Bitumen
; Synthetic Bitumen
; Adhesion
; Waste Engine Oil
; Crumb Rubber
; PPA
; High-Temperature Performance
1. Introduction
Bitumen is a binding agent customarily used in flexible pavements that are usually built with hot mix asphalt (HMA). The increased road transport volume and construction-phase failures with environmental and external factors reduce asphalt pavements' useful life and increase the probability of permanent faults like rutting and moisture damage (Fareed et al. 2020, Haroon et al. 2022). More than 90% of global pavements are flexible because they are strong, last a long time, and can be repaired easily. Bitumen, a highly viscous material, is used as the asphalt's binder. It exemplifies the transition between the solid and liquid phases at different temperatures. Bitumen consumption has reached an all-time high of 700 million barrels per year. It is an organic compound composed of hydrocarbons and typically contains 1% carbon, 80% oxygen, and trace amounts of oxygen, sulfur, nitrogen, and other metals (Abdul Hassan et al. 2019).
A renewable resource, bitumen, is created through the distillation process. The depletion of natural resources has far-reaching consequences for both price increases and pollution. Bitumen has been altered with a wide variety of additives to combat the issue of waste management and boost the efficiency of traditional binders. Binders are expensive and harmful to the environment. However, using modified or substitute binders can reduce costs and help the environment (Ahmad et al. 2022). Various techniques were used to enhance the performance by modifying the binder, and the final product is designated synthetic bitumen. The partially synthetic bitumen reported by using various additives, i.e., polymers (Zhu et al. 2014), i.e., waste engine oil (Liu et al. 2018), modification of aggregate gradation (Aodah et al. 2012), Styrene Butadiene Styrene (SBS) (Yildirim 2007, Zhang and Hu 2013), crumb rubber (Xiao et al. 2009, Cetin 2013), PPA (Domingos and Faxina 2015), polyethylene (Mohanty 2013) and costly Nanomaterials (Fang et al. 2013, Fini et al. 2015).
Waste engine oil is a by-product of the automotive industry collected yearly from various automobiles. Zinc, lead, potassium, and magnesium are the most common contaminants, such as firewood. Due to the increase in population globally, every year, approximately 11 billion tons of waste are produced, indicating that each person produces more than one ton on average, and this number is increasing. According to estimates, waste generation will double by 2025 compared to 2000. Modern societies are based on using cars, which cannot operate without lubricants. The quantity of waste oil has increased with the population and vehicles. As the population increases, waste increases which causes landfill space and health problems (Counts 2023). Massive volumes of garbage, such as blast furnace slag, glass, steel slag, scrap tires, plastics, waste engine oil, building and demolition wastes, etc., are being dumped in landfills and stockpiles around the world, posing environmental and economic dangers (Abukhettala 2016).
Bitumen can be revitalized by adding used motor oil, making for an eco-friendlier product (Int et al. 2014). Although some of WEO is recycled, most ends up in the trash. Despite its changing production resources, the chemical composition of WEO matches that of bitumen. Bitumen treated with waste engine oil (WEO) was shown to have improved penetration and a lower softening point than unmodified bitumen (Abdul Hassan et al. 2019). Feng et al. (Feng et al. 2020) reported that a high concentration of WEO had unfavorable effects on the binder's properties. The injection of waste engine oil alters the elastic properties of bitumen, i.e., a decrease in complex modulus and a rise in phase angle. Liu et al. (Liu et al. 2018) reported that fatigue performance was improved by WEO, although bitumen loses some resistance to rutting. Liu et al. (Liu et al. 2019) concluded that the high rutting strength and performance are degraded, as reported by an analysis of the bitumen's rheological behavior. It was presented no proof of hydrophobic interactions between bitumen and WEO in their studies. More than that, they advocated a WEO adjustment of 4-8%. Jia et al. (Jia et al. 2014) concluded that the integration of WEO in binder reduces its excellent productivity, i.e., rutting resistance, as documented in the literature and through extensive evaluations of waste engine oil-modified bitumen. As the binder content was decreased, the mixture's fatigue resistance improved, and the concentration of organic aldehyde compounds in bitumen was raised through modification with used motor oil. The increased carbonyl groups in bitumen made it more vulnerable to oxidation. Furthermore, oil incorporation lowered stiffness at cold pressures, whereas high temperatures hampered the binder's elastic recovery and have been demonstrated.
Shoukat and Yoo (Shoukat and Yoo 2018) concluded that engine oil was found to have an improved influence on thermal cracking in dynamic evaluations of changed binders at the expense of decreased resistance to rutting. Filtered used engine oil decreased binder flexibility by 35% compared to virgin asphalt after only a few months of aging. Still, 2.5% oil lowered the Performance Grade (PG) of the top end by 0.3 °C. Overall, the performance of unprocessed waste motor oil was below that of both new and filtered crude oil. DeDene (DeDene 2011) reported that waste engine oil might make bitumen combined with Reclaimed Bituminous (RAB) less rigid and improve low-temperature characteristics. It is possible to reduce the hardness of asphalt roads by utilizing engine oil without reducing the roads' ability to withstand wet conditions.
Like Waste engine oil, the amount of automobile waste tires has also substantially increased worldwide in the past few years due to the evaluation of the automobile industries. Proper disposal or recycling of crumb rubber (CR) produced from automobile tires becomes very important for the environment. This massive waste material harms the earth's natural environment and pollutes the water, air, and soil. Eventually raises concern for global warming, economic crisis, energy preservation, and others. Using waste conserves road construction materials may minimize landfill space, reducing environmental impact. Therefore, scientists focus on innovating the disposal technique of these waste tires and waste engine oil as bitumen modifiers (Formela 2021). The examination of the automobile sector has helped to similar growth in the amount of waste tire produced around the world as has occurred with waste engine oil. Crumb rubber (CR), a by-product of tire recycling, must be disposed of or recycled correctly to prevent environmental damage (Lo Presti 2013). Burning one ton of used tires produces 450 kg of harmful gases & 270 kg of soot is kept out of the atmosphere. The use of CR as a modifier in asphalt is an excellent example of its application (Rumyantseva et al. 2020). The optimal preparation process parameters for rubber-modified asphalt include shear temperatures of 180 °C, shear times of 45 minutes, and shear speeds of 5000 rpm (Liu et al. 2015).
The dosage of crumb rubber also imparts the properties of the modified asphalt. S. Mashaan et al. (S.Mashaan et al. 2011) concluded that the increased crumb rubber content significantly improves elasticity and ductility. Shafabakhsh et al. (Shafabakhsh et al. 2014) reported that asphalt mixtures containing 10% waste rubber powder improved their performance at higher temperatures, reduced asphalt mixtures' sensitivity to temperature, and increased their resistance to rutting. Further, it also reduced the binder's production costs; rubberized asphalt mixtures had superior performance at high temperatures compared to the control specimens. Similarly, (Gohar et al. 2022) reported that adding 15% crumb rubber increases the stiffness, viscosity, and high softening point and improves the rutting resistance of conventional bitumen. The crumb rubber size also played a vital role in altering the asphalt properties.
Ibrahim et al. (Ibrahim et al. 2013) concluded that lowering the crumb rubber size improves asphaltic mixtures' rutting resistance, resilience, and fatigue cracking resistance. Brasileiro (Brasileiro et al. 2019) reported that crumb rubber has lower complex modulus values at low temperatures, minimizing the likelihood of cracking and enhancing pavement performance and endurance. Wang et al. (Wang, Liu, Apostolidis, et al. 2020) concluded that the swelling of rubber dramatically modifies its characteristics, making it softer and more viscous.
Huang (Huang 2008) concluded that the rutting resistance improved with increased viscosity and flexibility at high temperatures. In addition, the low temperature increased fatigue resistance because of a decrease in viscosity. The studies (Attia and Abdelrahman 2009, Wang et al. 2012, Moreno et al. 2013) concluded that CR improves pavement performance and mechanical responsiveness of changed binders in asphalt binders. The studies (Yu et al. 2014, 2017, Guo et al. 2017, Sienkiewicz et al. 2017) confirmed that utilization of CR is known to significantly enhance pavement qualities such as resistance against fatigue & rutting, improvement overall durability, and reduce maintenance costs. The studies (Navarro et al. 2004, Kim and Lee 2013) established that the encapsulation efficiency of rubber-modified bitumen is not a significant issue. It becomes a problem at higher temperatures. That becomes more pronounced as a considerable percentage of CR is integrated into the asphalt. The mechanical behavior of hot-mixed asphalt and the mechanical/chemical qualities of bitumen were improved by using the WEO-CR rejuvenator, which was also found to raise the overall performance of the mixture (HMA) (ELTWATİ et al. 2022).
Recently, bitumen has become highly technical, with modifiers like polymers, acids, and mineral fillers controlling its performance properties (Masson 2008). PPA is a reactive reagent comprised of phosphoric acid oligomers. PPA is compatible with asphalt, which considerably improves the performance of binders at high temperatures. The penetration index and viscosity values of bitumen have been enhanced due to increased asphaltenes content and decreased saturate and resins (Varanda et al. 2016). PPA might also be regarded as a viable alternative to polymers. Numerous researchers have investigated the chemical reaction between PPA and asphalt (Polacco et al. 2005). It was observed that the rheological properties of CRB-modified binder were enhanced by adding up to 2% PPA. PPA also enhanced the storage stability by raising the viscosity of CR-modified asphalt. High asphaltenes content increases resilience to rutting but decreases fatigue resistance (Qian et al. 2019). PPA improves the bitumen performance significantly. In addition, it was concluded that a bitumen addition of up to 1% substantially improves high-temperature performance while having a negligible effect on fatigue characteristics (Hao et al. 2019).
According to the literature mentioned above, the WEO as a modifier into the bitumen compromised the performance properties of the asphalt binder (Liu et al. 2018, 2019, Shoukat and Yoo 2018, Feng et al. 2020, Abbas et al. 2022). However, Crumb rubber (Huang 2008, Mashaan and Karim 2014, Yu et al. 2014, 2017, Guo et al. 2017, Sienkiewicz et al. 2017) and Polyphosphoric acid (Polacco et al. 2005, Varanda et al. 2016, Hao et al. 2019, Qian et al. 2019) improves the performance of asphalt binders and mixtures. In this regard, the performance of WEO-modified binders can be improved by using these two additives, i.e., CR and PPA. Many previous studies are available where CR and PPA have been used separately for improvement of WEO-modified bitumen, however, very limited work is available on the combined behavior of CR and PPA on WEO-modified bitumen. So, an indepth analysis was required to evaluate the combined effect of these two additices in WEO-modified bitumen. They were used to scrutinize their impact on the performance of the virgin binder. The main aim behind this study is to use maximum industrial waste (WEO) in the original binder and enhance the performance of WEO-modified biunder.
2. Materials and Methodology
2.1. Bitumen
The bitumen used in this study was 60/70 pen-grade with a softening point of 50 °C was procured from a local refinery in Pakistan.
2.2. Waste Engine Oil
Waste engine oil was collected from local motor vehicle repair plants and markets. The waste engine oil used for this experiment was obtained from a local auto repair shop, as shown in Figure 1. Previous research has revealed that waste engine oil contains elements like zinc, lead, calcium, and calcium.
2.3. Filter paper
Due to engine wear and tear during vehicle operation, the engine oil became contaminated with metal traces and was continuously heated and oxidized (Rosado and Pichtel 2003). In aged motor oil, metallic components such as potassium, calcium, zinc, and iron were detected (Zając et al. 2015). After modification, these metal residues may have affected the rheological properties of the bitumen. Therefore, waste engine oil was filtered with a Whatman™ grade filter to maintain the rheological characteristics, as illustrated in Figure 2.
2.4. Crumb Rubber
Crumb Rubber (CR) was extracted from used tire scrape and grind them in shredder plants, as illustrated in Figure 3. After being crushed, the material passed through sieve No. 50/300 microns/0.2997mm (Kök et al. 2013, Kim and Lee 2015).
2.5. Polyphosphoric Acid
Polyphosphoric Acid (PPA) is a chemical most likely known as a liquid mineral polymer, as illustrated in Figure 4. It's been used since 1990 as a bitumen modifier. It is used to increase the stiffness and grades of binders. The right amount of PPA and proper utilization can bring significant results. It can drastically improve the performance of bitumen at high temperatures. PPA is an oligomer of H3PO4. PPA can be used as a straight modifier or in conjunction with other additives. Although PPA has many proven advantages and excellent outputs, some agencies have banned its use due to premature failures of pavements (Yadollahi and Sabbagh Mollahosseini 2011, Hao et al. 2019). The PPA used in this study is acquired from a local chemical supplier. PPA is a reactive reagent made up of phosphoric acid oligomers.
2.6. Preparation of Modified-Bitumen
The bitumen is heated on a hot plate before adding waste engine oil and CR into the bitumen, where the temperature is kept constant and mixed using a shear mixer. Waste engine oil was filtered out by using filter paper of grade Whatman 1002-150. Then, various proportions of used engine oil and crumb rubber were mixed with bitumen. The mixture was then heated and stirred using a high-speed mechanical stirrer at 3000 rpm for approximately 45 minutes at a temperature between 175 °C and 185 °C (Kamal et al. 2009, Jamal and Giustozzi 2020, Gohar et al. 2022). The mixing proportions are shown in Table 1.
3. Experimental Program
3.1. Physical tests
The penetration test was performed on a bituminous sample at 25 °C to determine its consistency and the degree of stiffness. This test was done according to (ASTM D 5 1997) under standard conditions on both modified and new binders. The penetration value of a bitumen sample is the total distance, in units of 1/10 mm, that a specific-sized needle penetrates the sample. The typical needle weighs 100 g and has a loading time of 5 seconds and a pull speed of 50mm/60 seconds. The sample was conditioned for 1.5 hours at 25 °C in a water bath.
The (ASTM D36/ D36M-14e1 2014) was executed using a ring and ball apparatus. In theory, the softening temperature is the point at which a binder (either the original or a modified version) can no longer hold a steel ball of the weight of 3.5 grams. The softening point is the temperature when the steel balls break the binder and extend about 1 inch.
A binder's mixing and compaction viscosity can be determined using Rotational Viscometer (RV) testing per the AASHTO TP48 standard to calculate the bitumen spinning viscometer values. Using a Brookfield rotating viscometer, bitumen's viscosity is tested. During the experiment, the temperature was maintained at 135 °C. The sample was sheared at a constant strain rate and temperature. Compared to other technologies, the 135°C (275°F) temperature used by rotational viscometers is more accurate and representative of asphalt laying field temperatures.
3.2. Fourier transform infrared spectroscopy
The FTIR test was performed according to ASTM E1252-98 to evaluate the chemical composition of virgin and (WEO+CR, WEO+CR+PPA) modified asphalt binder samples. One drop of a carbon disulfide (CS2) solution containing samples of virgin and (WEO+CR, WEO+CR+PPA) modified asphalt binder was placed on a KBr table. The scan range ranged from 400 to 4000 cm-1, and the analysis was performed at a resolution of four (4) cm-1. The absorption of infrared light as a function of wavelength is measured by Fourier transform infrared spectroscopy (FTIR) to determine the chemical composition of molecules.
3.3. Rheological Testing of Asphalt binder
The mechanical properties of bitumen were measured using a KINEXUS DSR in compliance with AASHTO T315-19. The shape of the DSR plates was optimized for each temperature and type of test. Plates measuring 25 millimeters thick with a 1-millimeter air gap were selected for use at temperatures above 46 °C, while plates measuring 8 millimeters thick with a 2-millimeter air gap opted for use at temperatures below 40 °C. Performance Level PG was calculated using 25 mm plates revolving at 10 Hz (Haroon et al. 2022). DSR measured the failure temperature at G*/sin 1 kPa. Frequency sweep tests were conducted at significant stress and frequencies ranging from 0.1 to 100 rad/s on virgin and modified binders at 22 °C, 34 °C, 58 °C, 64 °C, 70 °C, and 82 °C. The complex modulus |G*| was calculated using the time-temperature superposition approach at various frequencies and temperatures (Fareed et al. 2020, Wang, Liu, Zhang, et al. 2020).
3.4. Bitumen Bond Strength Test
Bitumen Bond Strength Test (BBS) was performed to assess the bonding strength of bitumen binder (virgin/modified). For determining the effect of moisture, both dry and wet Pull-out tensile testing strength (POTS) was determined. Metal stubs were isolated from aggregate foundation slabs to quantify pull strength accurately and evaluated the Pneumatic Adhesion Tensile Testing Instrument (PATTI). The adapted binders were produced for testing in conformity with ASTM D4541-17 under standard test conditions. Stubs pressed 0.4 grams of cement pastes against base slabs, and the wet and dry pull-off force was recorded.
4. Results & Discussion
4.1. Physical Testing Results
To a large extent, the inclusion of waste materials such as waste engine oil, crumb rubber, and PPA alters the original/control/virgin binder's penetration, softening point and viscosity. The effect of WEO and CRB on the binder is depicted in Figure 5 and Figure 6. The incorporation of WEO increased the penetration values of modified bitumen. It is due to the WEO that reduced the binder's consistency and softening point (El-Shorbagy et al. 2019). Used motor oil contains aromatic solvents that break down asphaltenes (Wang, Jia, et al. 2020).
Adding 5% WEO with 20%, 25%, and 30% CR by total binder content increases the penetration value by 28%, 23%, and 20%, respectively, while the softening point decreases by 14%, 10%, and 8%. In 10% WEO with 20%, 25%, and 30% CR, a 30%, 26%, and 22% increase in penetration value and an 8%, 14%, and 12% decrease in softening point value were observed. Similarly, the addition of 20%, 25%, and 30% CR with 15% WEO resulted in a 36%, 33%, and 31% increase in penetration value and a 16%, 15%, and 14% decrease in softening point, as presented in Figure 5 respectively. It indicates that increasing the dosage of WEO results in higher penetration values and a lower softening point, whereas increasing the dosage of CR results in lower penetration values and a higher softening point. The addition of WEO softens the binder, whereas the addition of crumb rubber hardens and stiffens it, thereby enhancing its conventional properties.
The control binder's viscosity is reduced when waste engine oil is added and increases when Crumb rubber is mixed, as illustrated in Figure 6.
Figure 7 and Figure 8 show that the combination of 5% WEO and 30% CR seems closest to virgin binder in terms of its properties. To improve it further, this combination has been further modified by adding 0.6%, 1.2%, and 1.8% PPA.
PPA being a cositly additive, the effect of PPA has only been studied on the best combination (5% WEO + 30% CR) for all the test techniques used in this study. The percentage of PPA was calculated based on studies conducted and recommendations from earlier research (Varanda et al. 2016).
The viscosity of partially synthetic bitumen was improved by adding PPA in the predetermined percentages determined by standard testing. There was an increase in viscosity values with lower PPA concentrations in a blend of 5% WEO + 30% CR. Viscosity values from WEO-modified bitumen after exposure to PPA are displayed in Figure 8. The results shows a clear improvement in viscosity and combinations with 1.2 and 1.8 %PPA looks very close to virgin bitumen.
The addition of PPA improved the binder's consistency, softening point, and penetration. The reactivity of PPA was boosted because of the polarity of the asphaltene component, which facilitated its dissociation into PPA and H+. PPA changes the asphaltene percentage distribution by disrupting the hydrogen bond network established within agglomerates of asphaltene micelles. It lowers asphaltene content and raises maltene solubility in the residue (Varanda et al. 2016).
4.2. FTIR Analysis
The analysis's stated goal is to learn more about how WEO + CR and WEO + CR + PPA change the chemical makeup of asphalt binder. Figure 9 shows that the FTIR investigation yielded spectra for all WEO + CR (5%, 10%, and 15%), and WEO + CR + PPA, respectively. The effect of PPA on FTIR peaks was also like the virgin binder shown in Figure 9. Furthermore, when WEO + CR and WEO + CR + PPA were combined in asphalt binder, no aging occurred, as shown by a quantitative examination of asphalt binder aging, which was investigated by determining the carbonyl index.
Figure 9 illustrates that two peaks are generated, with frequencies of 2860 cm-1 and 2920 cm-1, which are associated with the growing oscillation in C-H and its aliphatic chains. The absorption bands of C=C have a peak energy of 1600 cm-1, and this characteristic is found in aromatic compounds. Additionally, the C-H asymmetry within CH2 and CH3 is responsible for the peak at 1450 cm-1 and 1370 cm-1. The 1050 cm-1 peak is associated with S=O sulfoxide, and the C-H benzene ring's vibrations account for the last peak between 690 and 920 cm-1. This qualitative study is based on a review of the relevant literature (Yao et al. 2013, Jamal et al. 2020). The spectra and the observed peaks are consistent across all samples. In addition, the appearance and disappearance of peaks are not observed between functional groups, indicating any physical relationship between the samples (WEO+CR and WEO+CR+PPA) and the asphalt binder.
4.3. Performance Grading Test Results
The failure temperatures are evaluated using the Performance Grade (PG) experiments according to the Superpave criteria. It provides an idea of how the modification mechanism has changed PG. The estimated value of temperature failure is 67.3 °C for the base binder, which comes in PG 64, which fulfills the requirement. Figure 10 depicts the binder's failure before and after modification, respectively. The virgin control binder received a pen grade of 60/70 and was determined to be PG-64. A specific binder can be used in an area with a maximum average pavement temperature of 64 degrees Celsius over seven days. The addition of the WEO and CR softened the bitumen and deteriorated it to PG-58, PG-52, and PG-46.
Adding 0-10% recycled lubricating oil to bitumen raised the critical cracking temperature to around two °C at the expense of the high-temperature PG grade (Villanueva et al. 2008). Tire rubber powder added to bitumen has been found to enhance the qualities of the modified binder. A higher percentage of tire rubber powder was shown to boost resistance to rutting. The addition of tire rubber powder to bitumen is also being considered to increase the pavements' long-term economic and environmental viability (Hainin et al. 2015).
As previously explained, adding PPA causes the binder to become stiffer due to chemical reactions and network development, as illustrated in Figure 11. It resulted in a gradual improvement as high as PG70, which is relatively stiff and advantageous for regions with extremely high temperatures. In compliance with the existing environmental conditions in Pakistan, it is recommended that PG 70 be used in most regions (Mirza et al. 2011).
4.4. Frequency Sweep Test Results
The results of the frequency sweep can be used for the evaluation of temperature & time dependence of laboratory-created specimens of asphalt binder mixed with WEO + CRB, WEO + CRB + PPA, and base binder. At various values of temperature and a frequency range from 0.1 to 100 Hz, the frequency sweep is executed. The master curves are developed with the help of a sigmoidal function for all customized binder samples. Figure 12 (a) and (b) show the Master curves drawn between the rutting parameter, and the phase angle, respectively, against reduced frequency after the binder modification with WEO and CRB.
As illustrated in Figure 12 (a), phase angles are used to compare the viscoelasticity of the original binder to that of the modified one (Arabani and Tahami 2017). Additionally, the phase angle values made the material exceptionally elastic and softer. Waste engine oil reduces the asphaltenes percentage in bitumen, which is critical for the binder's stiffness for high-temperature performance. Combining 5% WEO with 20%, 25%, and 30% of Crumb rubber significantly degraded high-temperature performance, as illustrated in Figure 12 (b). Crumb Rubber's addition to bitumen helps restore the binder's natural viscoelastic equilibrium, making it more resistant to permanent deformation. The use of CRMB additionally lengthens the life of the roadway. Due to its greater adherence to a wide range of aggregates, CRMB mitigates the effects of deformations such as rutting and cracking. It provides exceptional resistance to any permanent deformation, improved aggregate-to-binder adhesion, enhanced performance in extreme climates, lengthened fatigue life of mixes, and is highly flexible and stable (Khan and Kamal 2008).
From Figure 13 (b), with the inclusion of 10% WEO with 20%, 25%, and 30% Crumb rubber in the dosage, the values of the G*/Sinδ decrease with the more content of WEO and low content of Crumb rubber at high temperatures relative to the base binder. Figure 13 (a) illustrates that including 10% WEO with 20%, 25%, and 30% Crumb rubber in the dosage increased the phase angle values making the material more elastic and softer, which shows increasing behavior in the elasticity of the asphalt binder (Abdalfattah et al. 2016). Figure 13 (b) illustrates that the increased content of WEO results in lowering bitumen binder stiffness and resistance against rutting within the range of high temperatures. But with the combined inclusion of WEO + CR, G*/Sinδ values decrease and are more prominent in the low-temperature range, which lowers the stiffness in a binder and rutting parameter values.
Figure 14 (a) illustrates that adding 15% WEO with 20%, 25%, and 30% Crumb rubber in the dosage increased the phase angle values making the material more elastic and softer, which shows increasing behavior in the elasticity of the asphalt binder. Figure 14(b) illustrates that G*/Sinδ is the factor for the rut plotted in opposition to a reduced frequency. The asphalt binder's durability against rut and fatigue can be calculated using the rut factors. There is a substantial decrease in rutting resistance compared to the virgin binder, which can be seen from the master curves of the rut factor. The values of the G*/Sinδ decrease with more content of WEO and low content of Crumb rubber at high temperatures relative to the base binder. It means that the increased content of WEO results in lowering bitumen binder stiffness and resistance against rutting within the range of high temperatures. But with the combined inclusion of WEO + CR, G*/Sinδ values decrease and are more prominent in the low-temperature range, which lowers the stiffness in a binder and rutting parameters.
The other objective of this experiment was to measure the effects of high temperatures on the phase angle, and the rutting parameter of asphalt binders, as illustrated in Figure 15 (a), and (b), that contained waste engine oil and crumb rubber with PPA. Figure 15 shows the addition of PPA improved the high-temperature performance of WEO with CRB-modified bitumen. It improved the high-temperature performance of the virgin binder shown in previous research (Abbas et al. 2022). The binder showed more elasticity as the phase angle decreased, as illustrated in Figure 15 (a), These values are desirable for rutting resistance by increasing the values of complex modulus and rutting parameters, as illustrated in Figure 15 (b). PPA greatly enhanced the high-temperature performance of WEO-modified bitumen, as proved in previous research (Sandeep et al. 2021).
4.5. Bitumen Bond Strength Test Results
Based on the aggregate material and the conditioning of the material with moisture, bitumen exhibits varying bond strengths. The adhesive power of the binder on the aggregate base was measured with a BBS test conducted in dry and wet conditions. Figure 16 below shows a graph of the POTS values derived using equation (1):
Here, POTS is the pull-off tensile strength, BP is burst pressure Ag is the contact area with a value of 2620 mm2, and C is the piston constant with a value of 0.286.
The tendency is the same for both dry and wet samples. The POTS values of the various wet-state samples were lower than those of the dry-conditioned specimen. It is because bitumen and aggregate bonds are weakened by high moisture content, reducing POTS values (Moraes et al. 2011). Also, an increase in the value of POTS authenticates a stronger association between aggregates and binder specimens due to the incorporation of different waste material forms.
The effect of WEO and CR on adhesion was experimentally evaluated using PATTI. A Bitumen Bond Strength (BBS) test was performed for dry and wet conditions to determine the bond strength of the binder to the aggregate surface. Figure 17 shows the effect of PPA on POTS values in dry conditions of WEO-modified bitumen. For dry conditioning, the addition of 5% WEO with the inclusion of 20%, 25%, and 30% CR by total binder content, after 24 hours of dry conditioning, POTS values decrease by 38 %, 27%, and 13%, In 10 % WEO with the inclusion of 20%, 25% and 30% CR, a decrease of 67%, 50% and 38% in value of POTS was observed at dry condition. Similarly, when 15% WEO was mixed with 20%, 25%, and 30% CR, the POTS value of the dry sample decreased by 72%, 58%, and 50%, respectively, when compared to the virgin binder Lower dosages of PPA in a combination of 5%WEO showed increased values of POTS.
Figure 18 illustrates that by adding 5% WEO with 20%, 25%, and 30% CR by the total binder content, POTS values decrease by 26 %, 11%, and 4% at wet conditions. In 10 % WEO with 20%, 25%, and 30% CR, a 36%, 19%, and 7% decrease in POTS values was observed. For that, in 15 % WEO with the inclusion of 20%, 25%, and 30% CR, a decrease of 47%, 36%, and 17% in the POTS value of the wet sample was observed.
Figure 19 show the effect of PPA on POTS in wet condition values of WEO-modified bitumen. Compared to dry conditions, the partially synthetic bitumen showed lower values after water conditioning because water permeates the bitumen-bitumen interface and the bitumen-aggregate interface, weakening the bond. It means that due to the incorporation of crumb rubber, an increase in the value of POTS authenticates a stronger association between aggregates and binder specimens. A decrease in POTS indicates a weaker bond between aggregates and binder specimens due to the incorporation of waste engine oil. Increased WEO dosage results in a lower POTS value, whereas increased CR dosage results in a higher POTS value, and vice versa. Lower dosages of PPA in a combination of 5% WEO showed increased POTS values.
5. Statistical Analysis
The statistical properties of tests for viscosity, moisture susceptibility, and Dynamic Shear Rheometer tests. Tukey's primary method was used for the statistical analysis. It takes one step to compare for various purposes. It is used to determine the considerable difference between means.
5.1. Viscosity Tests
The statistical analysis of viscosity results is shown in Table 1, in which only one dependent variable, i.e., test results and categorical independent variables of 13 categories. The interpretation of the output obtained from statistical analysis is based on the criteria that the mean values of categories lying in the same subset as that of the virgin category have a similar effect, while those in different subsets have a significantly different effect in contrast to the control category (Fareed et al. 2020). The statistical analysis deduced from SPSS software is explained as follows:
The addition of 5% WEO and 30% CRB with the addition of PPA affects the viscosity positively, and higher percentages of WEO negatively. It means by changing the dosages, the viscosity changes. All samples had different viscosity as their means lie in the same subset as the virgin binder.
5.2. Complex Modulus
The analysis of the complex fundamental value at 1 Hz is shown in Table 2. It has been observed that PPA significantly improved high-temperature performance. As indicated by statistical analysis, Polyphosphoric Acid has significantly increased the complex modulus values by making the binder stiff. According to prior studies, PPA significantly raises complex modulus values and stiffens the binder (Baldino et al. 2013, Hao et al. 2019). Therefore, lower dosages of PPA are recommended.
5.3. Moisture Susceptibility Tests
Statistical analysis of POTS values acquired through BBS under both dry and wet conditions is given in Table 3. Adding 5% WEO and 30% CRB with 0.6% PPA affects the strength positively and higher percentages negatively. A concentration of PPA greater than 0.6% does not affect POTS (dry and wet) values. It is noticed that Virgin Binder, B + 5% WEO + 30% CRB + 1.2% PPA, and B + 5%WEO + 30% CRB + 1.8% are in the same subset as compared to the original binder. Although values increase slightly, there is no significant improvement effect as per statistics. That's why they are lying in the same subset. The values less than 0.05 have a significant effect, which means different performance as their means lie in a different subset than the virgin binder.
6. Conclusions and Recommendations
The following conclusions have been deduced from this study:
- The conventional bitumen test results confirmed that WEO with crumb rubber in the binder increased the penetration and reduced the softening point and consistency because waste engine oil softened the bitumen. The best combination of 5% WEO and 30% CR seems closest to virgin binder in terms of its properties where an increase of 20% was observed in the penetration value, while an 8% decrease as found the softening point compared to a virgin binder. To improve it further, this combination has been further modified by adding 0.6%, 1.2%, and 1.8% PPA. Best results were observed at 1.8% PPA which improved the consistency of partially synthetic bitumen by decreasing its penetration up to 3% and increasing its softening point to 2%.
- The RV results revealed that incorporating CR and WEO into bitumen reduced viscosity. It was due to the dissolving of the asphaltene content of the binder, which is mainly responsible for its viscosity. Adding 5% WEO and 30% CR by total binder content reduced viscosity by 2 % The best combination of 5% WEO and 30% CR seems closest to virgin binder in terms of its viscosity. Further, the addition of 1.8% PPA increased the viscosity of the virgin binder by 2%.
- The frequency sweep test results concluded that combining WEO and CRB in the asphalt binder imparts high-temperature performance by decreasing the complex modulus. With the addition of 5% WEO and 30% CR by total binder content, the Complex modulus decreased by 21%, and the phase angle increased by 4%. The rut resistance and complex modulus improved by adding 1.8% PPA into the asphalt binder. Complex modulus increased by 20%, and the phase angle improved by 1%. Its mean PPA increased the complex modulus values by stiffening the binder.
- With the addition of 5% WEO and 30% CR by total binder content, after 24 hours of dry and wet conditioning, POTS values decrease by 13% and 9%. It is because the WEO softens the bitumen, which makes it more susceptible to moisture damage. But the higher dosage of WEO, more than 5% WEO, proved harmful against moisture resistivity. However, adding crumb rubber can improve the resistance against moisture for better adhesion but does not fulfill the binder requirement. PPA improved the bonding strength of asphalt binder with the addition of 1.8% PPA, and POTS values increased by 5% and 4% after 24 hours of dry and wet conditioning.
- Statistical analysis results are compatible with the present results and previous literature. In comparison, PPA improved high-temperature performance remarkably well. The statistical study determined that PPA analyzed its susceptibility to moisture remarkably well.
Overall conclusions state that 5% WEO with the 30% CR addition can be utilized as a bitumen additive to make it sustainable by effectively and adequately disposing of tons of WEO and scrap tires. The dosages of PPA (1.8%) should be added with the WEO and crumb rubber to meet the performance requirement. The optimum percentage of industrial waste used to produce partially synthetic bitumen is 35% to make it workable. It can be used as a partial replacement for bitumen and to save non-renewable resources, protect the environment, and make it cost-effective.
7. Recommendations
This study is only limited to evaluating moisture resistance, rutting, and fatigue at binder level. There is still a requirement for in-depth analysis at asphalt mixture level to reach authentic findings based on the results.
Acknowledgment
The authors thank the lab supervisor, Mr. Mumtaz Ahmad, Civil Engineering Department University of Engineering and Technology Taxila, for help and guidance during experimental work.
References
- Abbas, S., Zaidi, S.B.A., and Ahmed, I., 2022. Performance evaluation of asphalt binders modified with waste engine oil and various additives. International Journal of Pavement Engineering 1–13. [CrossRef]
- Abdalfattah, I.M.A., El-Badawy, S., Ibrahim, M., Amin, I., El-Badawy, S.M., Breakah, T., and Ibrahim, M.H.Z., 2016. Effect of Functionalization and Mixing Process on the Rheological Properties of Asphalt Modified with Carbon Nanotubes. American Journal of Civil Engineering and Architecture 4(3), 90–97.
- Abdul Hassan, N., Ruzi, N.A., Mohd Shukry, N.A., Putra Jaya, R., Hainin, M.R., Mohd Kamaruddin, N.H., and Abdullah, M.E., 2019. Physical properties of bitumen containing diatomite and waste engine oil. Malaysian Journal of Fundamental and Applied Sciences 15(4), 528–531. [CrossRef]
- Abukhettala, M., 2016. Use of recycled materials in road construction. In Proceedings of the 2nd International Conference on Civil, Structural and Transportation Engineering (ICCSTE’16); pp. 1–8.
- Ahmad, M.F., Ahmed Zaidi, S.B., Fareed, A., Ahmad, N., and Hafeez, I., 2022. Assessment of sugar cane bagasse bio-oil as an environmental friendly alternative for pavement engineering applications. International Journal of Pavement Engineering 23(8), 2761–2772. [CrossRef]
- Aodah, H.H., Kareem, Y.N.A., and Chandra, S., 2012. Performance of bituminous mixes with different aggregate gradations and binders. International Journal of Engineering and Technology 2(11), 2049–3444.
- Arabani, M. and Tahami, S.A., 2017. Assessment of mechanical properties of rice husk ash modified asphalt mixture. Construction and Building Materials 149, 350–358. [CrossRef]
- ASTM D 5, 1997. Standard Test Method for Penetration of Bituminous Materials. Annual Book of ASTM Standards. 04.03, 1–3.
- ASTM D36/ D36M-14e1, 2014. Standard Test Method for Softening Point of Bitumen (Ring-and-Ball Apparatus). ASTM International 1(D), 1–5.
- Attia, M. and Abdelrahman, M., 2009. Enhancing the performance of crumb rubber-modified binders through varying the interaction conditions. International Journal of Pavement Engineering 10(6), 423–434. [CrossRef]
- Baldino, N., Gabriele, D., Lupi, F.R., Oliviero Rossi, C., Caputo, P., and Falvo, T., 2013. Rheological effects on bitumen of polyphosphoric acid (PPA) addition. Construction and Building Materials 40, 397–404. [CrossRef]
- Brasileiro, L., Moreno-Navarro, F., Tauste-Martínez, R., Matos, J., and Rubio-Gámez, M. del C., 2019. Reclaimed polymers as asphalt binder modifiers for more sustainable roads: A review. Sustainability (Switzerland) 11(3), 1–20. [CrossRef]
- Cetin, A., 2013. Effects of Crumb Rubber Size and Concentration on Performance of Porous Asphalt Mixtures. International Journal of Polymer Science 2013, 1–10. [CrossRef]
- Counts, T.W., 2023. Tons of solid waste generated [online]. Available from: https://www.theworldcounts.com/challenges/planet-earth/state-of-the-planet/solid-waste.
- DeDene, C.D., 2011. Investigation of using waste engine oil blended with reclaimed asphalt materials to improve pavement recyclability. Michigan Technological University, Houghton, Michigan. [CrossRef]
- Domingos, M.D.I. and Faxina, A.L., 2015. Rheological analysis of asphalt binders modified with Elvaloy® terpolymer and polyphosphoric acid on the multiple stress creep and recovery test. Materials and Structures 48(5), 1405–1416. [CrossRef]
- El-Shorbagy, A.M., El-Badawy, S.M., and Gabr, A.R., 2019. Investigation of waste oils as rejuvenators of aged bitumen for sustainable pavement. Construction and Building Materials 220, 228–237. [CrossRef]
- ELTWATİ, A., ENIEB, M., AHMEED, S., AL-SAFFAR, Z., and MOHAMED, A., 2022. Effects of waste engine oil and crumb rubber rejuvenator on the performance of 100% RAP binder. Journal of Innovative Transportation 3(1), 8–15. [CrossRef]
- Fang, C., Yu, R., Liu, S., and Li, Y., 2013. Nanomaterials applied in asphalt modification: A review. Journal of Materials Science and Technology 29(7), 589–594. [CrossRef]
- Fareed, A., Zaidi, S.B.A., Ahmad, N., Hafeez, I., Ali, A., and Ahmad, M.F., 2020. Use of agricultural waste ashes in asphalt binder and mixture: A sustainable solution to waste management. Construction and Building Materials 259, 120575. [CrossRef]
- Feng, Z., Zhao, P., Yao, D., and Li, X., 2020. Performance Evaluation of Waste Engine Oil Regenerated SBS Modified Bitumen. In CICTP 2020; American Society of Civil Engineers: Reston, VA; pp. 1150–1162. [CrossRef]
- Fini, E.H., Hajikarimi, P., Mohammad, R., and Nejad, F.M., 2015. Physiochemical,Rheological, and Oxidative Aging Characteristics of Asphalt Binder in the Presence of Mesoporous Silica Nanoparticles. Journal of Materials in Civil Engineering 28, 04015133. [CrossRef]
- Formela, K., 2021. Sustainable development of waste tires recycling technologies – recent advances, challenges and future trends. Advanced Industrial and Engineering Polymer Research 4(3), 209–222. [CrossRef]
- Gohar, M., Ahmad, N., and Haroon, W., 2022. Effect of Addition of Crumb Rubber on Bitumen Performance Grade ( PG ) and Effect of Addition of Crumb Rubber on Bitumen Performance Grade ( PG ) and Rutting Resistance. In 1st International Conference on Advances in Civil & Environmental Engineering; University of Engineering & Technology Taxila: Pakistan; pp. 1–6.
- Guo, S., Dai, Q., Si, R., Sun, X., and Lu, C., 2017. Evaluation of properties and performance of rubber-modified concrete for recycling of waste scrap tire. Journal of Cleaner Production 148, 681–689. [CrossRef]
- Hainin, M.R., A. Aziz, M.M., Adnan, A.M., Abdul Hassan, N., Putra Jaya, R., and Y Liu, H., 2015. Performance of Modified Asphalt Binder with Tire Rubber Powder. Jurnal Teknologi 73(4), 55–60.
- Hao, P., Zhai, R., Zhang, Z., and Cao, X., 2019. Investigation on performance of polyphosphoric acid (PPA)/SBR compound-modified asphalt mixture at high and low temperatures. Road Materials and Pavement Design 20(6), 1376–1390.
- Haroon, W., Ahmad, N., and Mashaan, N., 2022. Effect of Quartz Nano-Particles on the Performance Characteristics of Asphalt Mixture. Infrastructures 7(5), 60. [CrossRef]
- Huang, S., 2008. Rubber concentrations on rheology of aged asphalt binders. Journal of Materials in Civil Engineering 20(3), 221–229. [CrossRef]
- Ibrahim, M.R., Katman, H.Y., Karim, M.R., Koting, S., and Mashaan, N.S., 2013. A review on the effect of crumb rubber addition to the rheology of crumb rubber modified bitumen. Advances in Materials Science and Engineering 2013. [CrossRef]
- Int, I., Res, J.P., Dedene, C.D., and You, Z., 2014. The Performance of Aged Asphalt Materials Rejuvenated with Waste Engine Oil. International journal of pavement research and technology 7(2), 145–152.
- Jamal, Hafeez, I., Yaseen, G., and Aziz, A., 2020. Influence of Cereclor on the performance of aged asphalt binder. International Journal of Pavement Engineering 21(11), 1309–1320. [CrossRef]
- Jamal, M. and Giustozzi, F., 2020. Low-content crumb rubber modified bitumen for improving Australian local roads condition. Journal of Cleaner Production 271, 122484. [CrossRef]
- Jia, X., Huang, B., Bowers, B.F., and Zhao, S., 2014. Infrared spectra and rheological properties of asphalt cement containing waste engine oil residues. Construction and Building Materials 50, 683–691. [CrossRef]
- Kamal, M., Khan, K., Hafeez, I., and Kumar, K., 2009. Comparison of CRMB Test Sections with Conventional Pavement Section Under the Same Trafficking and Environmental Conditions. Arabian Journal for Science and.
- Khan, K.M. and Kamal, M.A., 2008. Impact of superpave mix design method on rutting behavior of flexible pavements in Pakistan. University of Engineering and Technology Taxila.
- Kim, H. and Lee, S.-J., 2013. Laboratory Investigation of Different Standards of Phase Separation in Crumb Rubber Modified Asphalt Binders. Journal of Materials in Civil Engineering 25(12), 1975–1978. [CrossRef]
- Kim, H.H. and Lee, S.J., 2015. Effect of crumb rubber on viscosity of rubberized asphalt binders containing wax additives. Construction and Building Materials 95, 65–73. [CrossRef]
- Kök, B.V., Yilmaz, M., and Geçkil, A., 2013. Evaluation of Low-Temperature and Elastic Properties of Crumb Rubber– and SBS-Modified Bitumen and Mixtures. Journal of Materials in Civil Engineering 25(2), 257–265. [CrossRef]
- Liu, H., Luo, G., Wang, X., and Jiao, Y., 2015. Effects of preparation process on performance of rubber modified asphalt. IOP Conference Series: Materials.
- Liu, S., Meng, H., Xu, Y., and Zhou, S., 2018. Evaluation of rheological characteristics of asphalt modified with waste engine oil (WEO). Petroleum Science and Technology 36(6), 475–480. [CrossRef]
- Liu, S., Peng, A., Zhou, S., Wu, J., Xuan, W., and Liu, W., 2019. Evaluation of the ageing behaviour of waste engine oil-modified asphalt binders. Construction and Building Materials 223, 394–408. [CrossRef]
- Mashaan, N.S. and Karim, M.R., 2014. Waste tyre rubber in asphalt pavement modification. Materials Research Innovations 18, S6-6–S6-9. [CrossRef]
- Masson, J.F., 2008. Brief review of the chemistry of polyphosphoric acid (PPA) and bitumen. Energy and Fuels 22(4), 2637–2640. [CrossRef]
- Mirza, M.W., Abbas, Z., and Rizvi, M.A., 2011. Temperature Zoning of Pakistan for Asphalt Mix Design. Pakistan Journal of Engineering & Applied Science 8, 49–60.
- Mohanty, M., 2013. A Study on Use of Waste Polyethylene in Bituminous Paving Mixes. National Institute of Technology.
- Moraes, R., Velasquez, R., and Bahia, H.U., 2011. Measuring the Effect of Moisture on Asphalt–Aggregate Bond with the Bitumen Bond Strength Test. Transportation Research Record: Journal of the Transportation Research Board 2209(1), 70–81. [CrossRef]
- Moreno, F., Sol, M., Martín, J., Pérez, M., and Rubio, M.C., 2013. The effect of crumb rubber modifier on the resistance of asphalt mixes to plastic deformation. Materials and Design 47, 274–280. [CrossRef]
- Navarro, F.J., Partal, P., Martı́nez-Boza, F., and Gallegos, C., 2004. Thermo-rheological behaviour and storage stability of ground tire rubber-modified bitumens. Fuel 83(14–15), 2041–2049.
- Polacco, G., Berlincioni, S., Biondi, D., Stastna, J., and Zanzotto, L., 2005. Asphalt modification with different polyethylene-based polymers. European Polymer Journal 41(12), 2831–2844. [CrossRef]
- Lo Presti, D., 2013. Recycled Tyre Rubber Modified Bitumens for road asphalt mixtures: A literature review. Construction and Building Materials 49, 863–881. [CrossRef]
- Qian, C., Fan, W., Ren, F., Lv, X., and Xing, B., 2019. Influence of polyphosphoric acid (PPA) on properties of crumb rubber (CR) modified asphalt. Construction and Building Materials 227, 117094. [CrossRef]
- Rosado, E.D. and Pichtel, J., 2003. Chemical characterization of fresh, used and weathered motor oil via GC/MS, NMR and FTIR techniques. Proceedings of the Indiana Academy of Science.
- Rumyantseva, A., Rumyantseva, E., Berezyuk, M., and Plastinina, J., 2020. Waste recycling as an aspect of the transition to a circular economy. IOP Conference Series: Earth and Environmental Science 534(1), 012002. [CrossRef]
- S.Mashaan, N., Hassan Ali, A., Rehan Karim, M., and Abdelaziz, M., 2011. Effect of blending time and crumb rubber content on properties of crumb rubber modified asphalt binder. International Journal of the Physical Sciences 6((9) (May)), 2189–2193.
- Sandeep, R.G., Ramesh, A., Vijayapuri, V.R., and Ramu, P., 2021. Laboratory evaluation of hard grade bitumen produced with PPA addition. International Journal of Pavement Research and Technology 14(4), 505–512. [CrossRef]
- Shafabakhsh, G.H.G., Sadeghnejad, M., and Sajed, Y., 2014. Case study of rutting performance of HMA modified with waste rubber powder. Case Studies in Construction Materials 1, 69–76. [CrossRef]
- Shoukat, T. and Yoo, P.J., 2018. Rheology of Asphalt Binder Modified with 5W30 Viscosity Grade Waste Engine Oil. Applied Sciences 8(7), 1194. [CrossRef]
- Sienkiewicz, M., Janik, H., Borzędowska-Labuda, K., and Kucińska-Lipka, J., 2017. Environmentally friendly polymer-rubber composites obtained from waste tyres: A review. Journal of Cleaner Production 147, 560–571. [CrossRef]
- Varanda, C., Portugal, I., Ribeiro, J., Silva, A.M.S., and Silva, C.M., 2016. Influence of Polyphosphoric Acid on the Consistency and Composition of Formulated Bitumen: Standard Characterization and NMR Insights. Journal of Analytical Methods in Chemistry 2016. [CrossRef]
- Villanueva, A., Ho, S., and Zanzotto, L., 2008. Asphalt modification with used lubricating oil. Canadian Journal of Civil Engineering 35(2), 148–157. [CrossRef]
- Wang, H., Dang, Z., You, Z., and Cao, D., 2012. High-Temperature Viscosity Performance of Crumb-Rubber-Modified Binder With Warm Mix Asphalt Additives. Journal of Testing and Evaluation 40(5), 20120064. [CrossRef]
- Wang, H., Liu, X., Apostolidis, P., Erkens, S., and Skarpas, A., 2020. Experimental Investigation of Rubber Swelling in Bitumen. Transportation Research Record: Journal of the Transportation Research Board 2674(2), 203–212.
- Wang, H., Liu, X., Zhang, H., Apostolidis, P., Scarpas, T., and Erkens, S., 2020. Asphalt-rubber interaction and performance evaluation of rubberised asphalt binders containing non-foaming warm-mix additives. Road Materials and Pavement Design 21(6), 1612–1633. [CrossRef]
- Wang, W., Jia, M., Jiang, W., Lou, B., Jiao, W., Yuan, D., Li, X., and Liu, Z., 2020. High temperature property and modification mechanism of asphalt containing waste engine oil bottom. Construction and Building Materials 261, 119977. [CrossRef]
- Xiao, F., Wenbin Zhao, P.E., and Amirkhanian, S.N., 2009. Fatigue behavior of rubberized asphalt concrete mixtures containing warm asphalt additives. Construction and Building Materials 23(10), 3144–3151. [CrossRef]
- Yadollahi, G. and Sabbagh Mollahosseini, H., 2011. Improving the performance of Crumb Rubber bitumen by means of Poly Phosphoric Acid (PPA) and Vestenamer additives. Construction and Building Materials 25(7), 3108–3116. [CrossRef]
- Yao, H., You, Z., Li, L., Lee, C.H., Wingard, D., Yap, Y.K., Shi, X., and Goh, S.W., 2013. Rheological Properties and Chemical Bonding of Asphalt Modified with Nanosilica. Journal of Materials in Civil Engineering 25(11), 1619–1630. [CrossRef]
- Yildirim, Y., 2007. Polymer modified asphalt binders. Construction and Building Materials 21(1), 66–72.
- Yu, H., Leng, Z., Zhou, Z., Shih, K., Xiao, F., and Gao, Z., 2017. Optimization of preparation procedure of liquid warm mix additive modified asphalt rubber. Journal of Cleaner Production 141, 336–345. [CrossRef]
- Yu, X., Leng, Z., Wang, Y., and Lin, S., 2014. Characterization of the effect of foaming water content on the performance of foamed crumb rubber modified asphalt. Construction and Building Materials 67(PART B), 279–284. [CrossRef]
- Zając, G., Szyszlak-Bargłowicz, J., Słowik, T., Kuranc, A., and Kamińska, A., 2015. Designation of Chosen Heavy Metals in Used Engine Oils Using the XRF Method. Polish Journal of Environmental Studies 24(5), 2277–2283. [CrossRef]
- Zhang, F. and Hu, C., 2013. The research for SBS and SBR compound modified asphalts with polyphosphoric acid and sulfur. Construction and Building Materials 43, 461–468. [CrossRef]
- Zhu, J., Birgisson, B., and Kringos, N., 2014. Polymer modification of bitumen: Advances and challenges. European Polymer Journal 54(1), 18–38. [CrossRef]
Figure 1.
Waste Engine Oil.
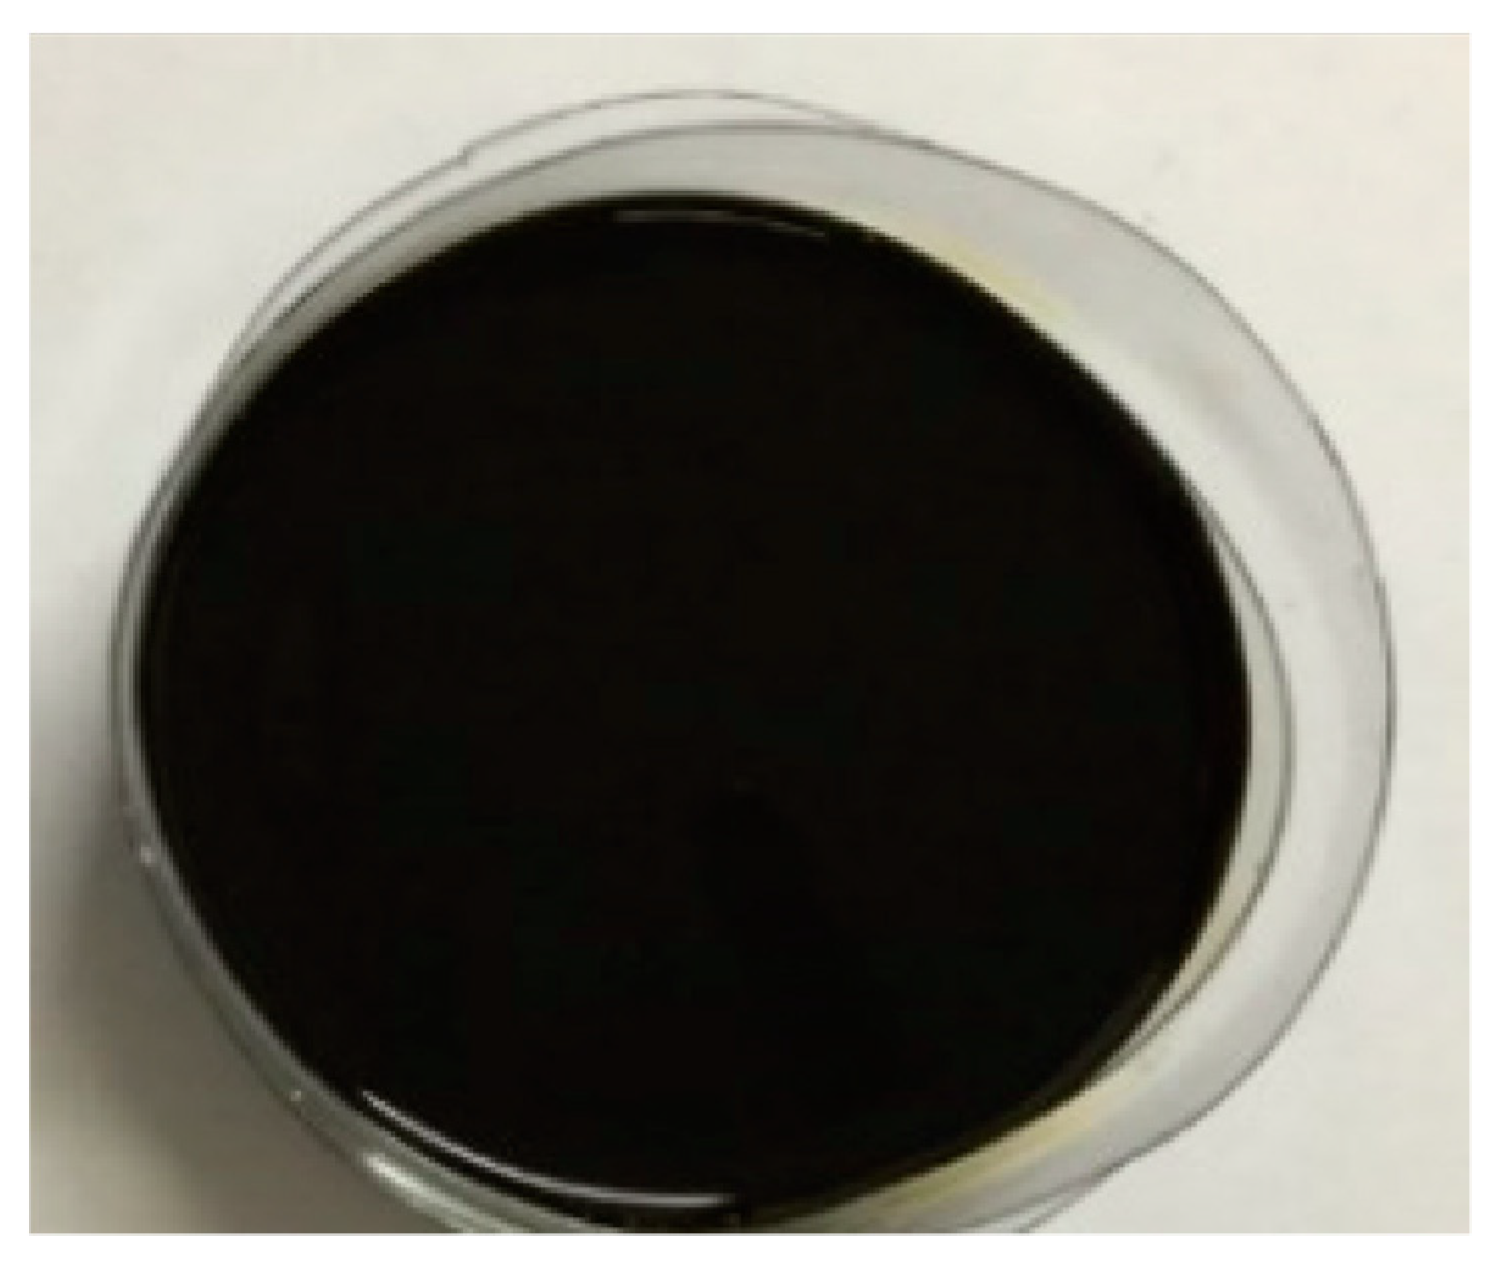
Figure 2.
Filter Paper.
Figure 3.
Sample of Crumb Rubber.
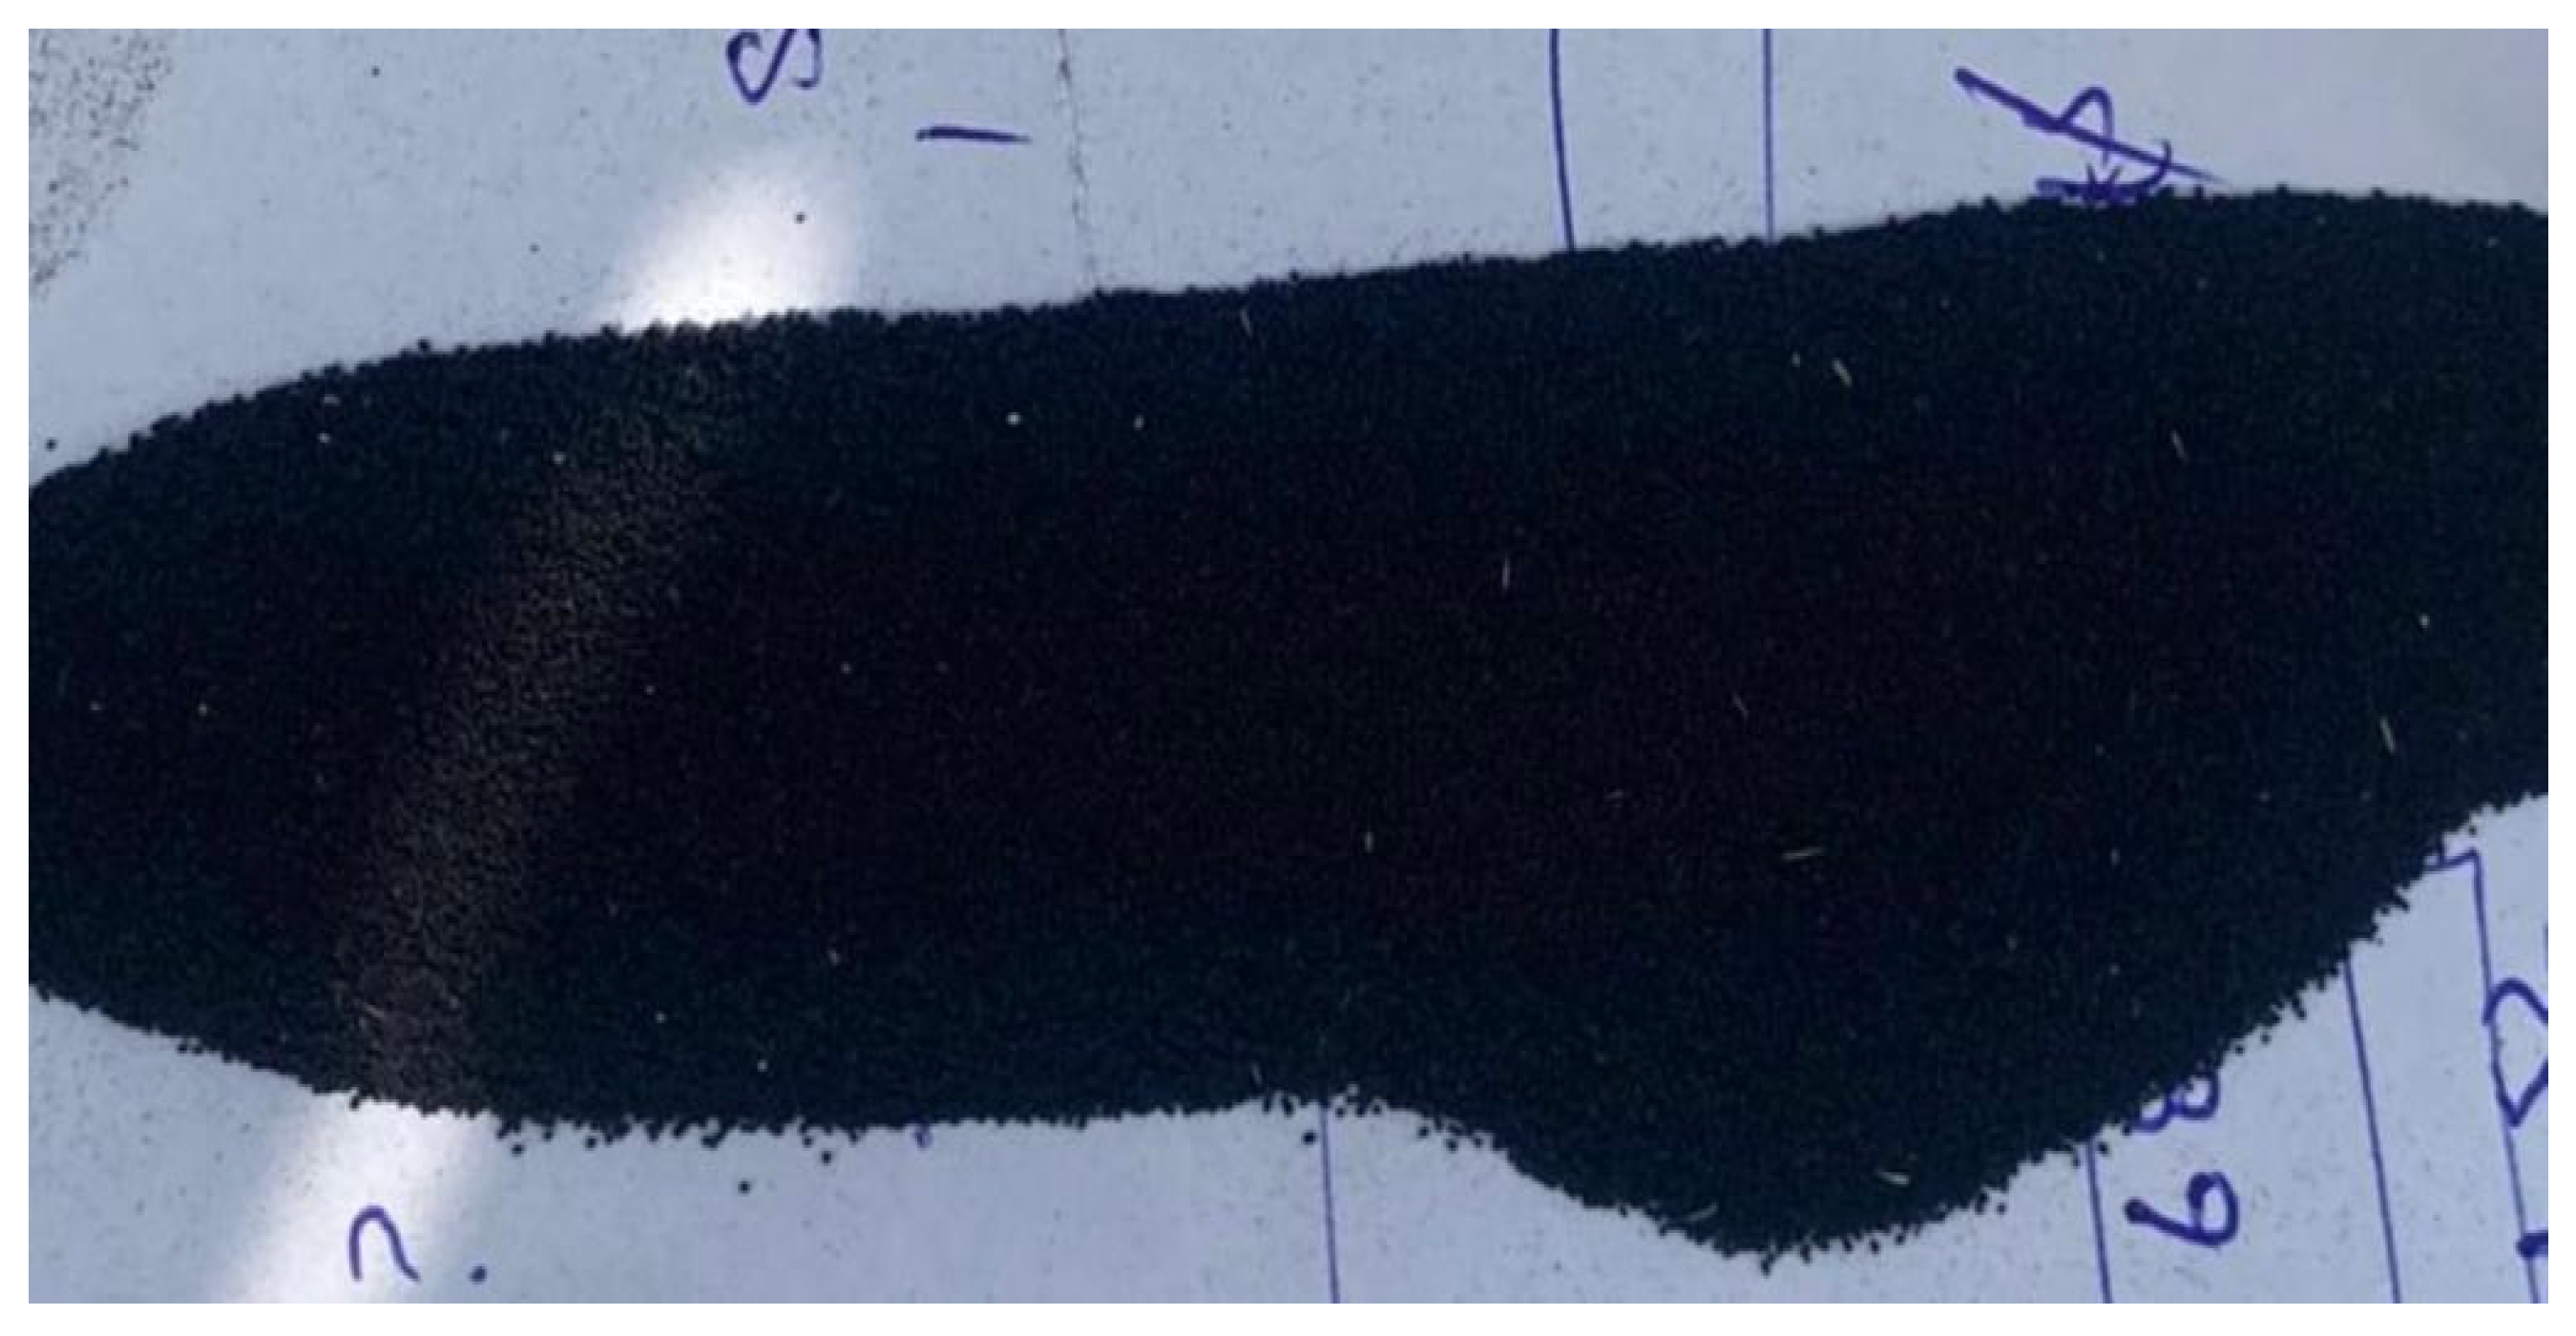
Figure 4.
Poly-phosphoric Acid (PPA).
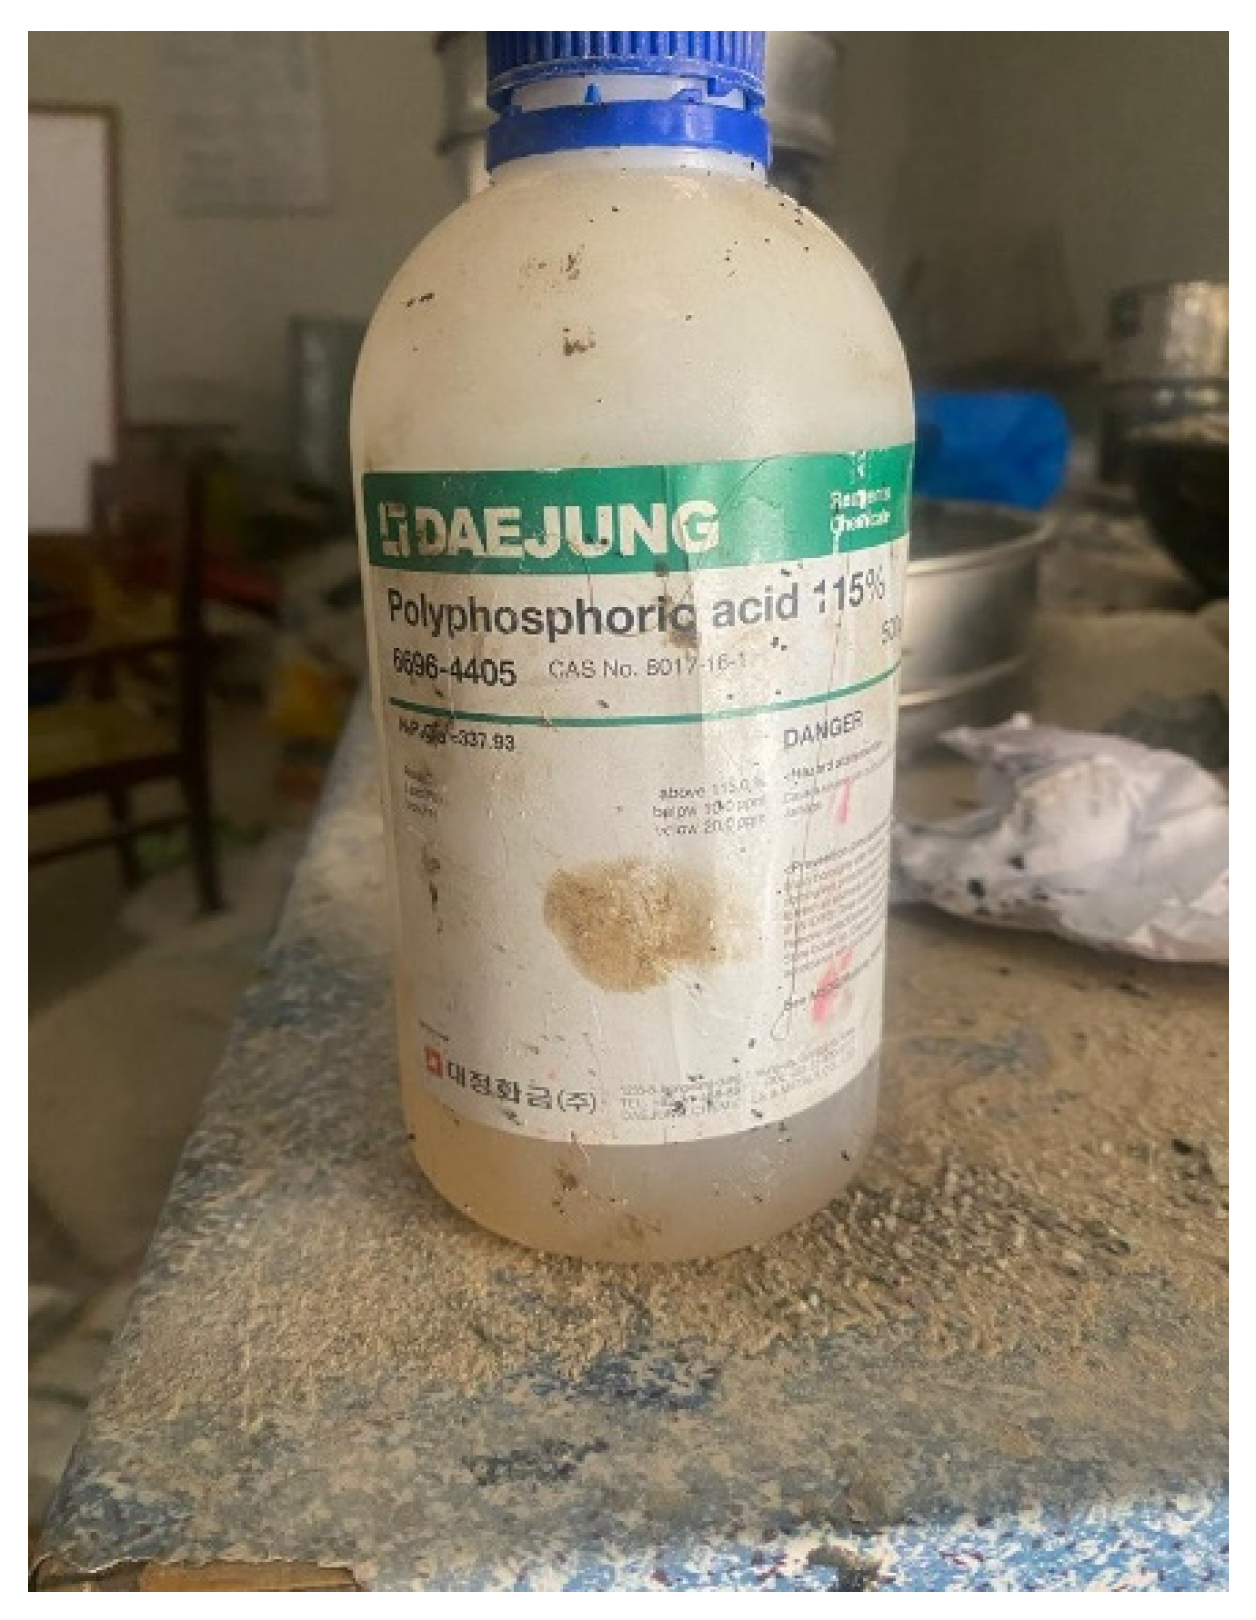
Figure 5.
Penetration and Softening Point of Virgin and WEO+CRB Modified Binder Results.
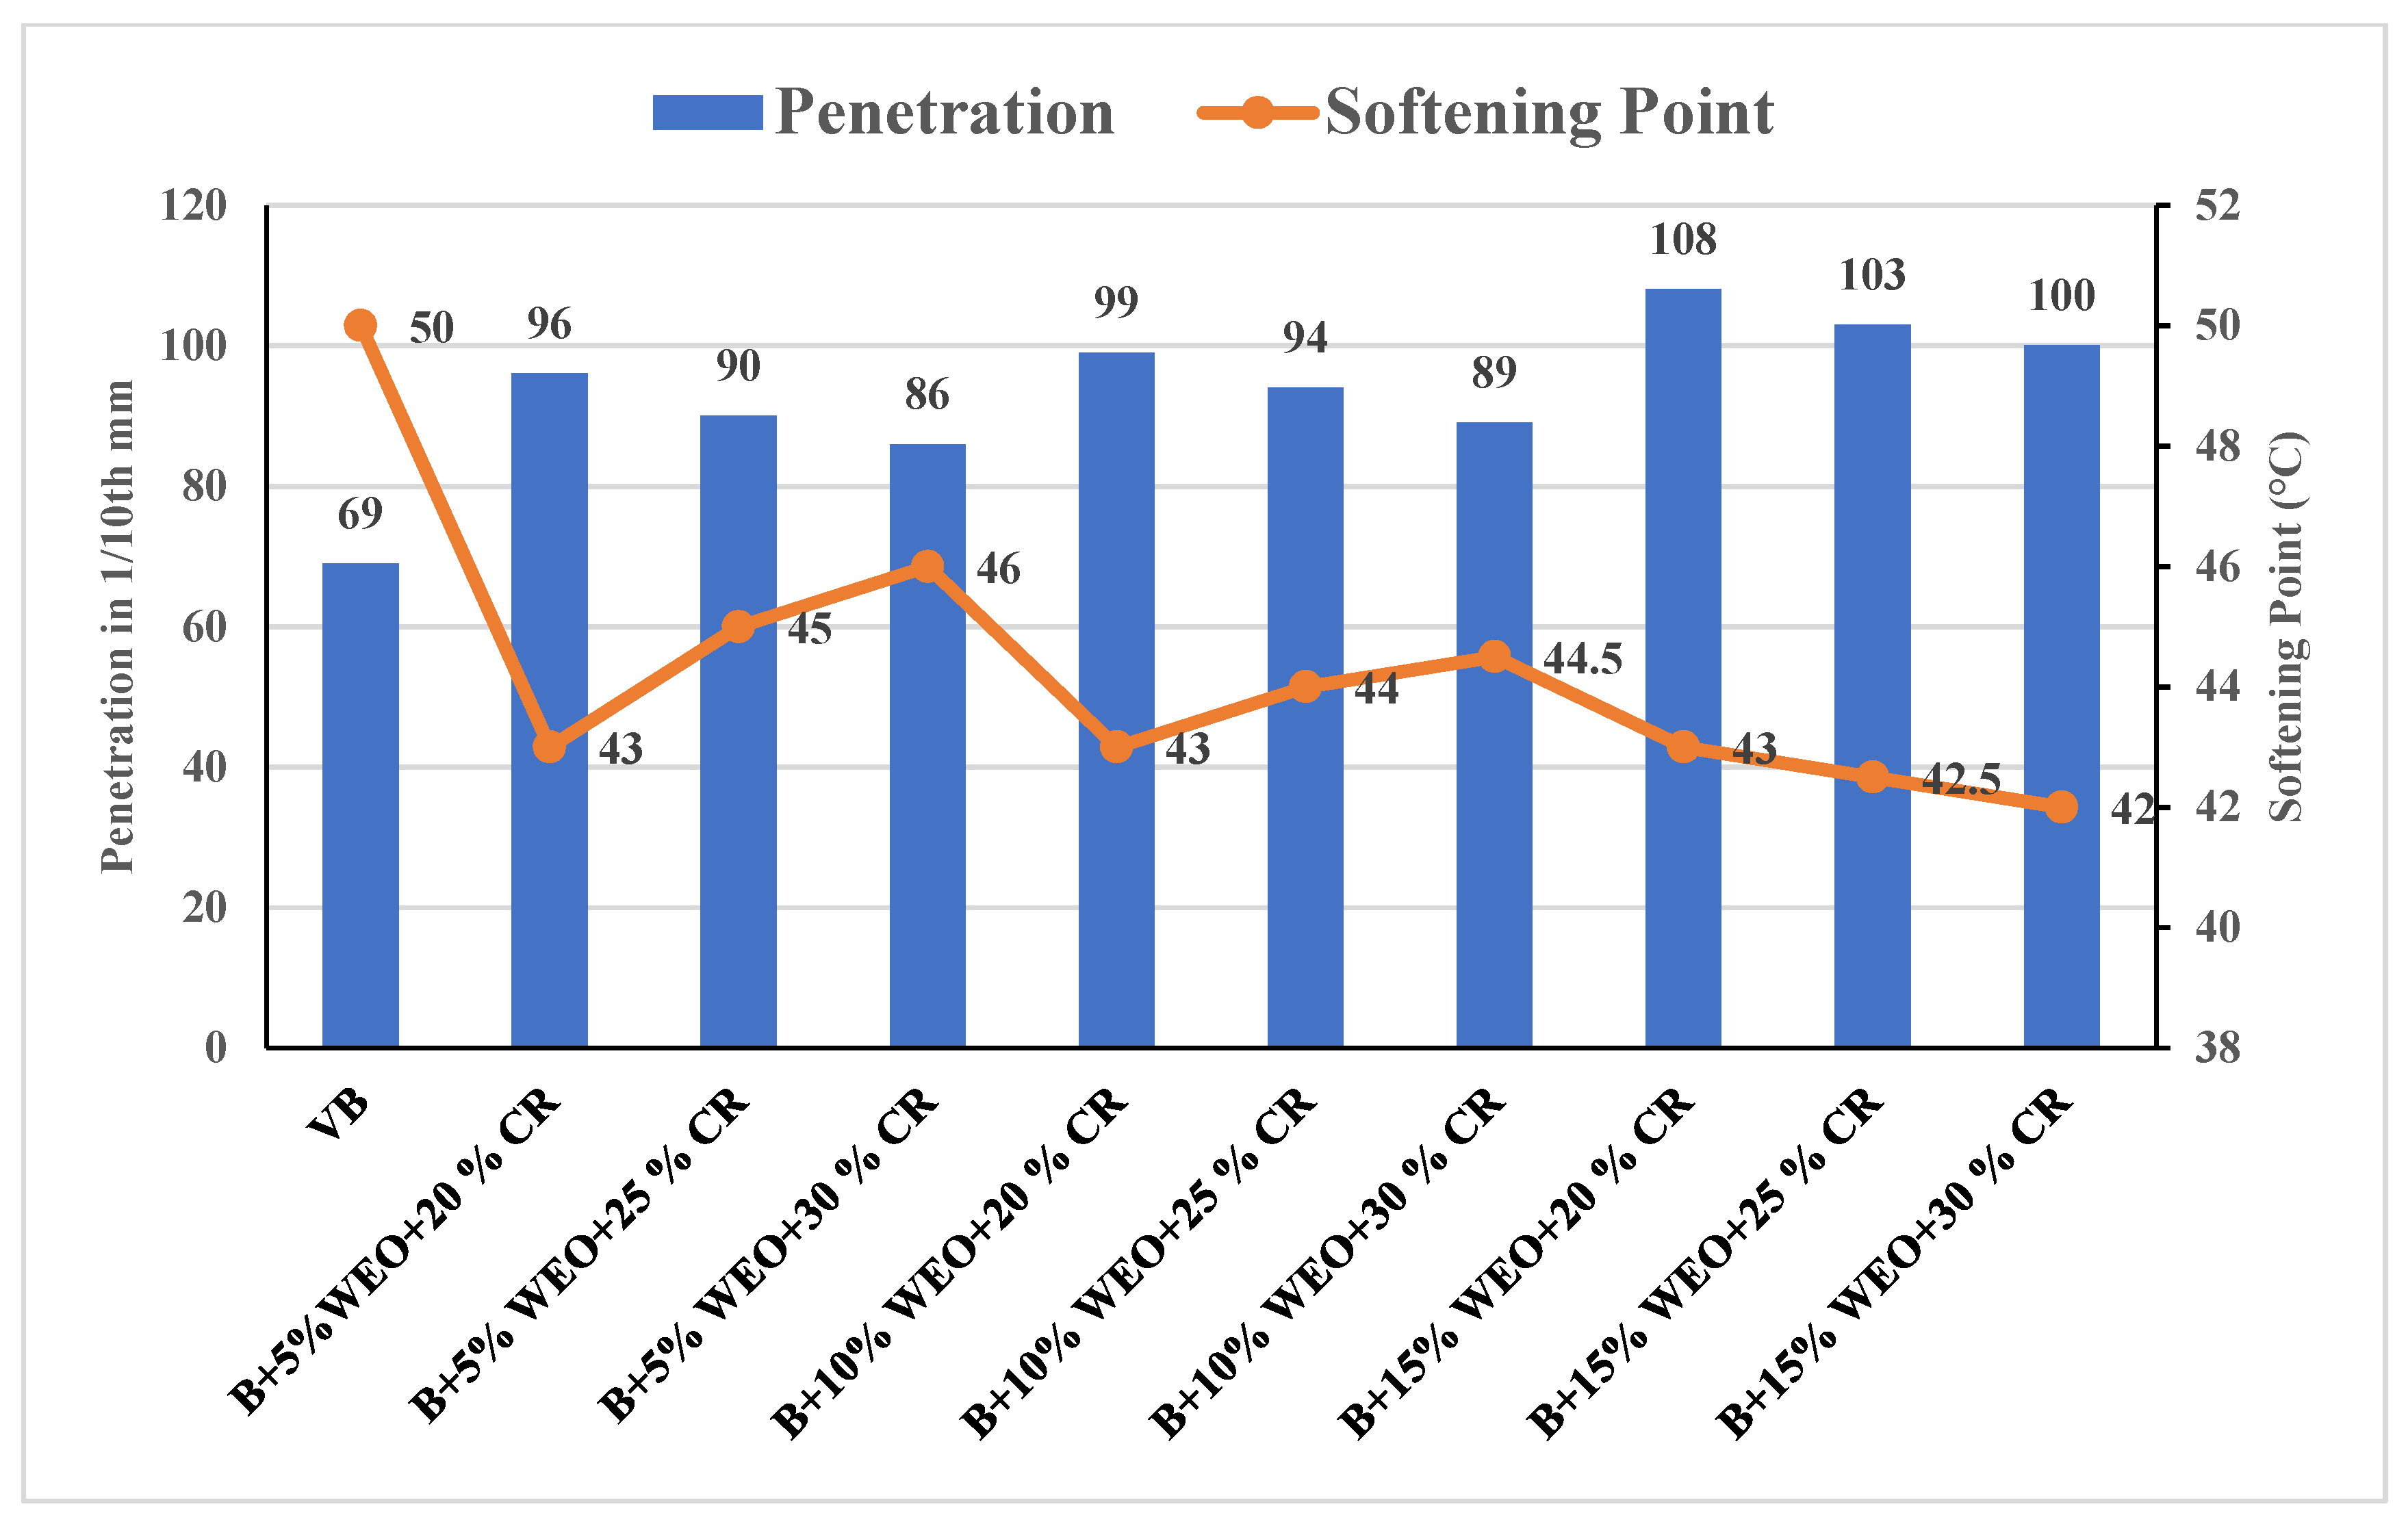
Figure 6.
Virgin and WEO + CRB Modified Binder Viscosity Results.
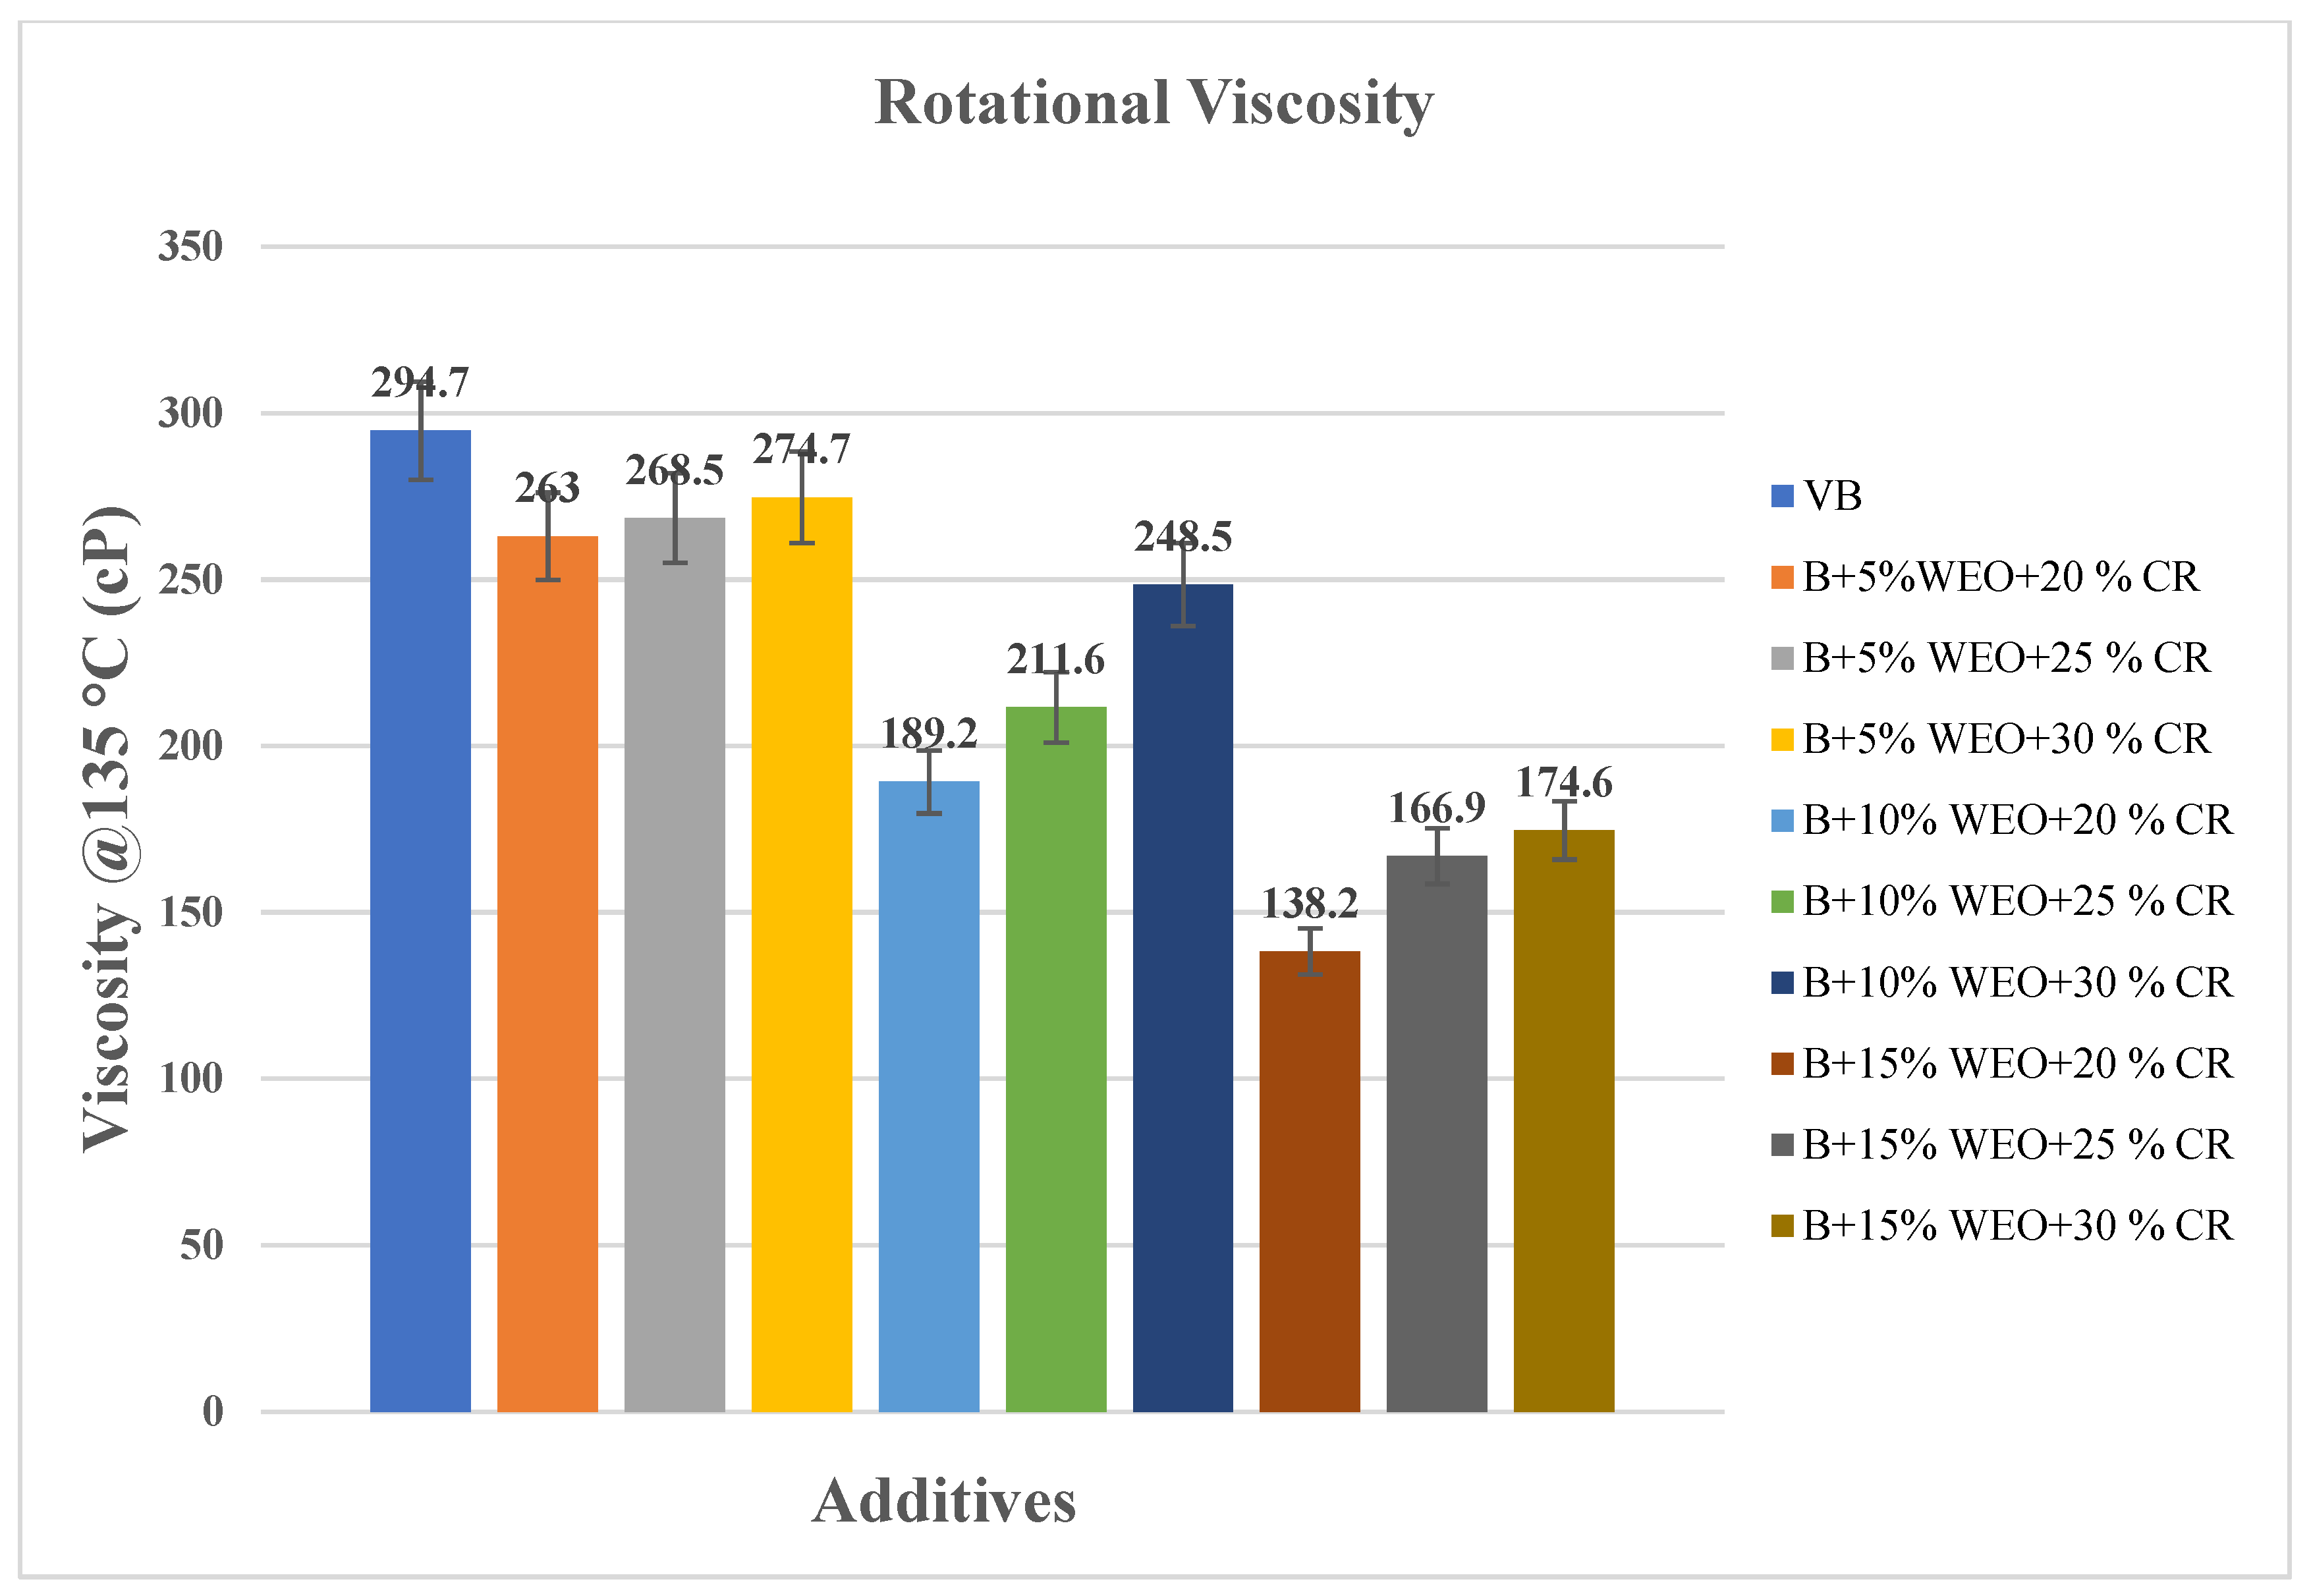
Figure 7.
Penetration and Softening Point of Virgin and PPA Modified Binder Results.
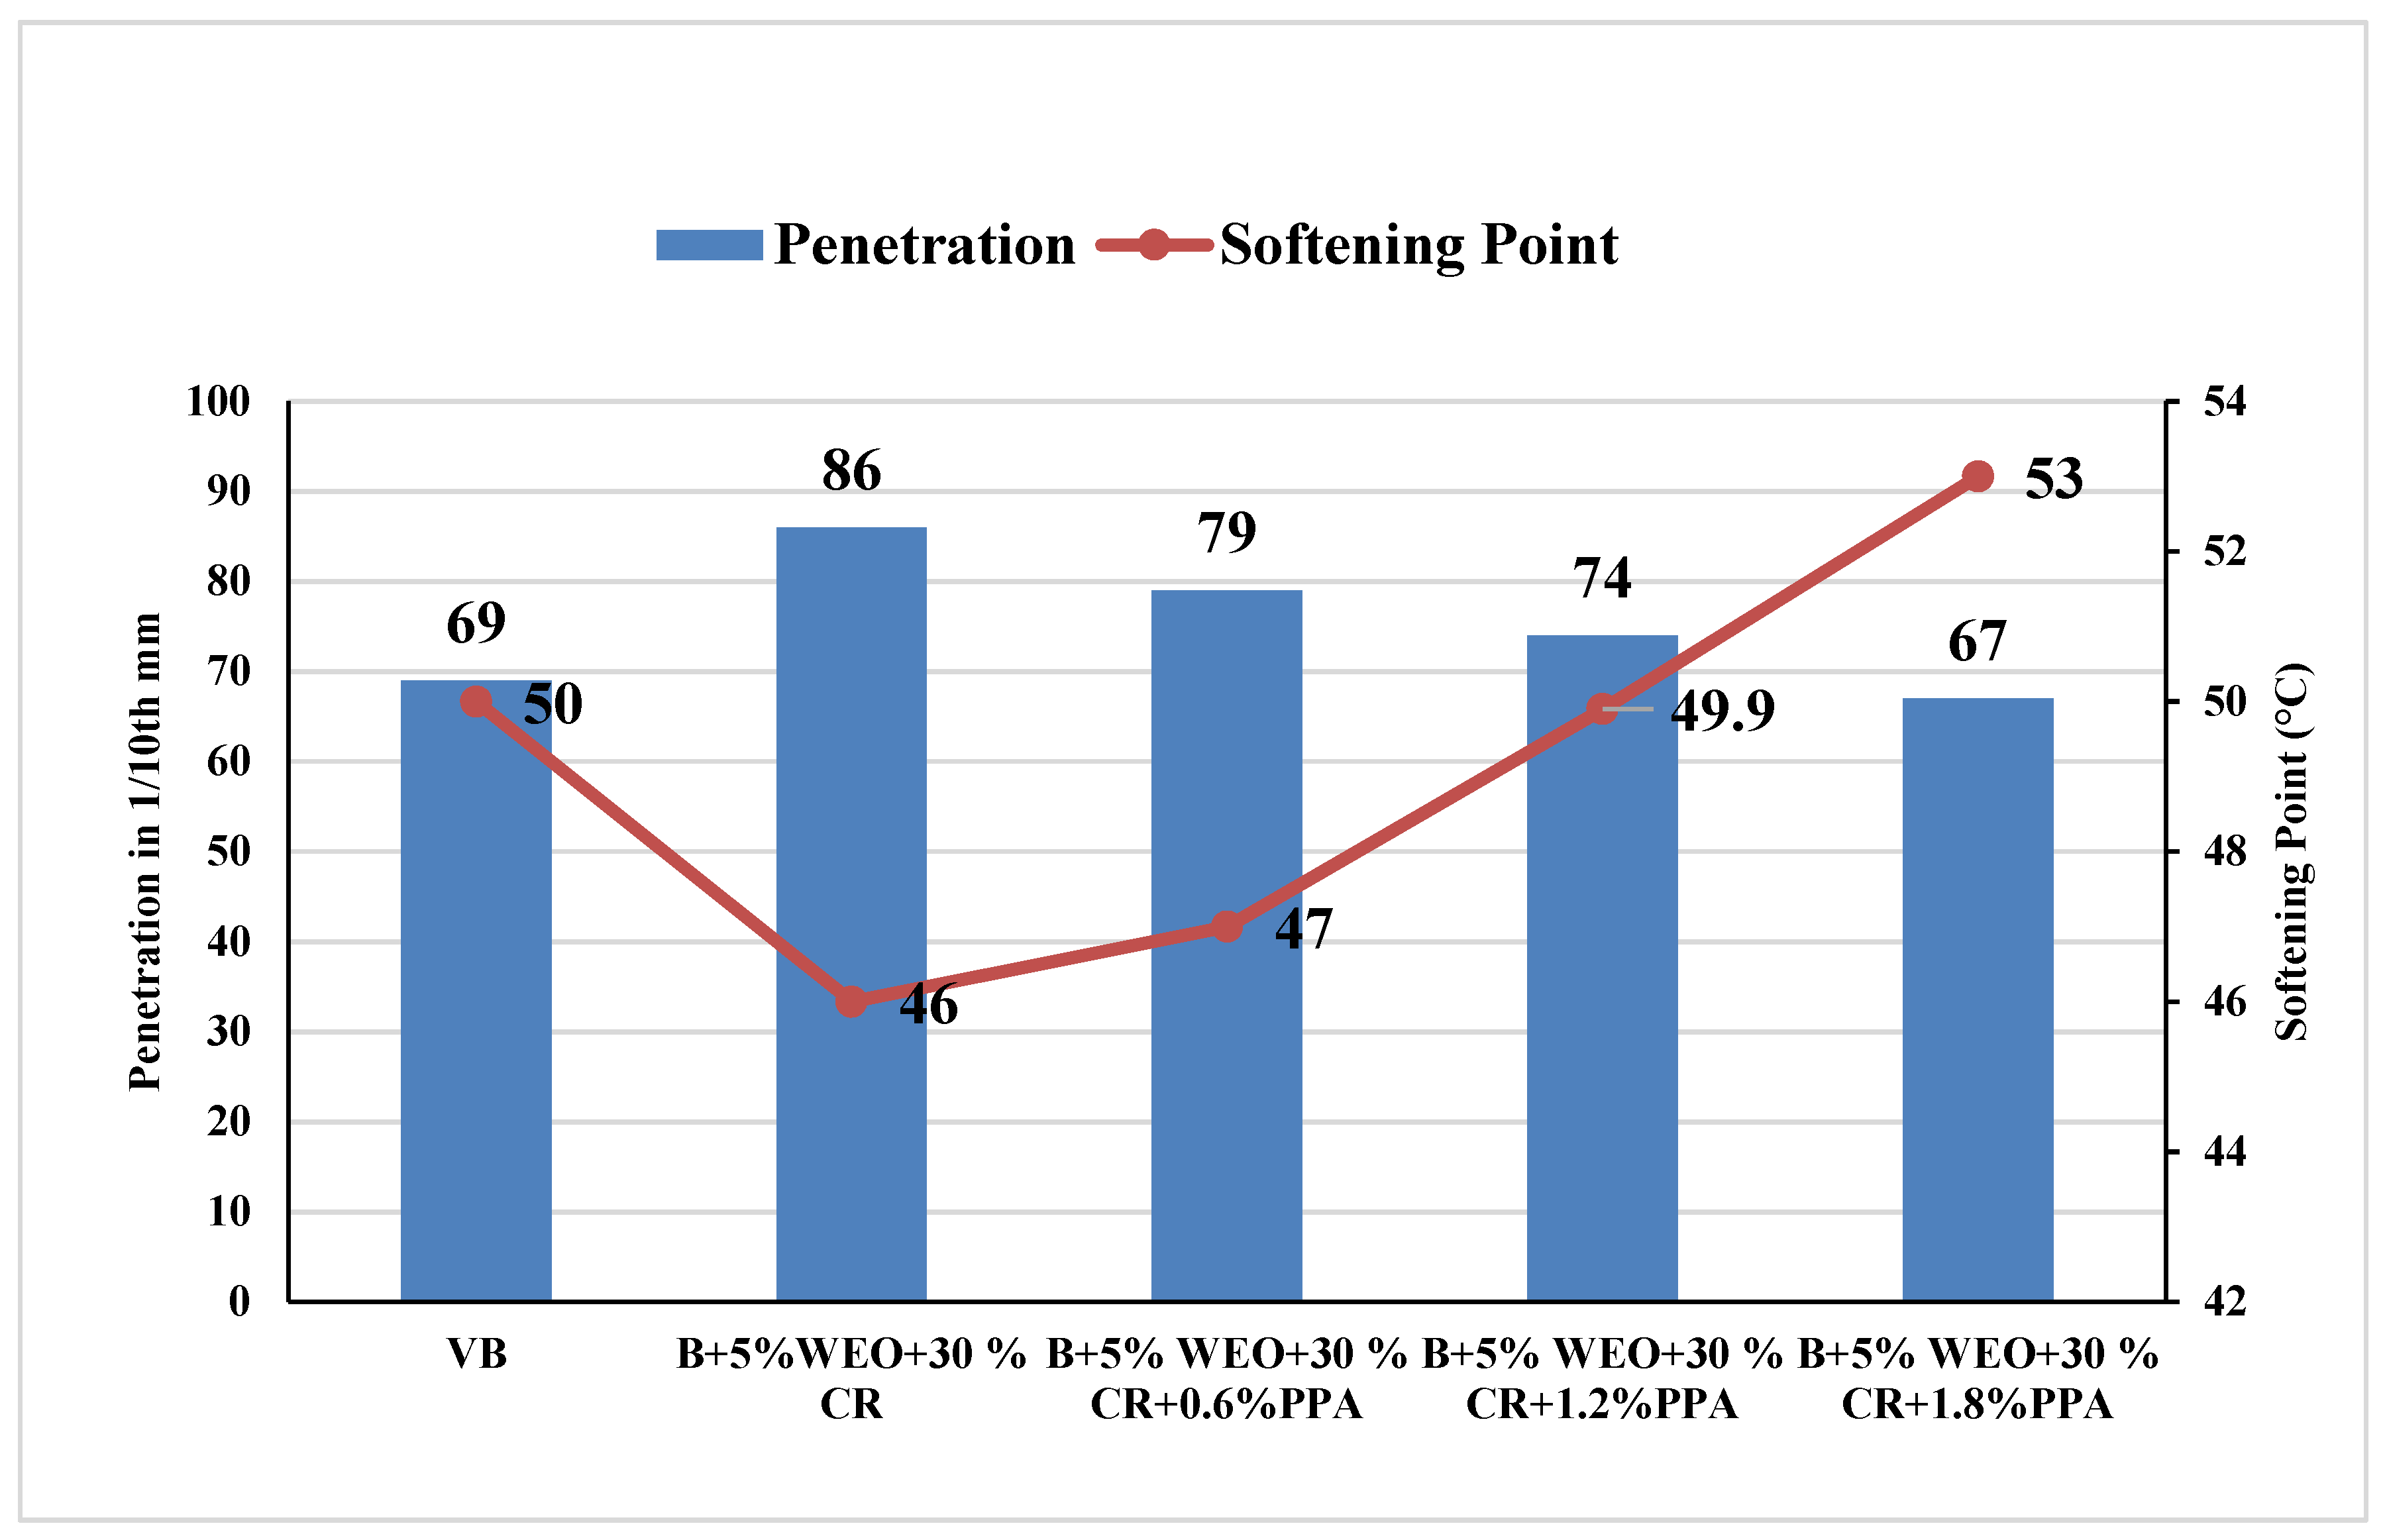
Figure 8.
Virgin and PPA Modified Binder Viscosity Results.
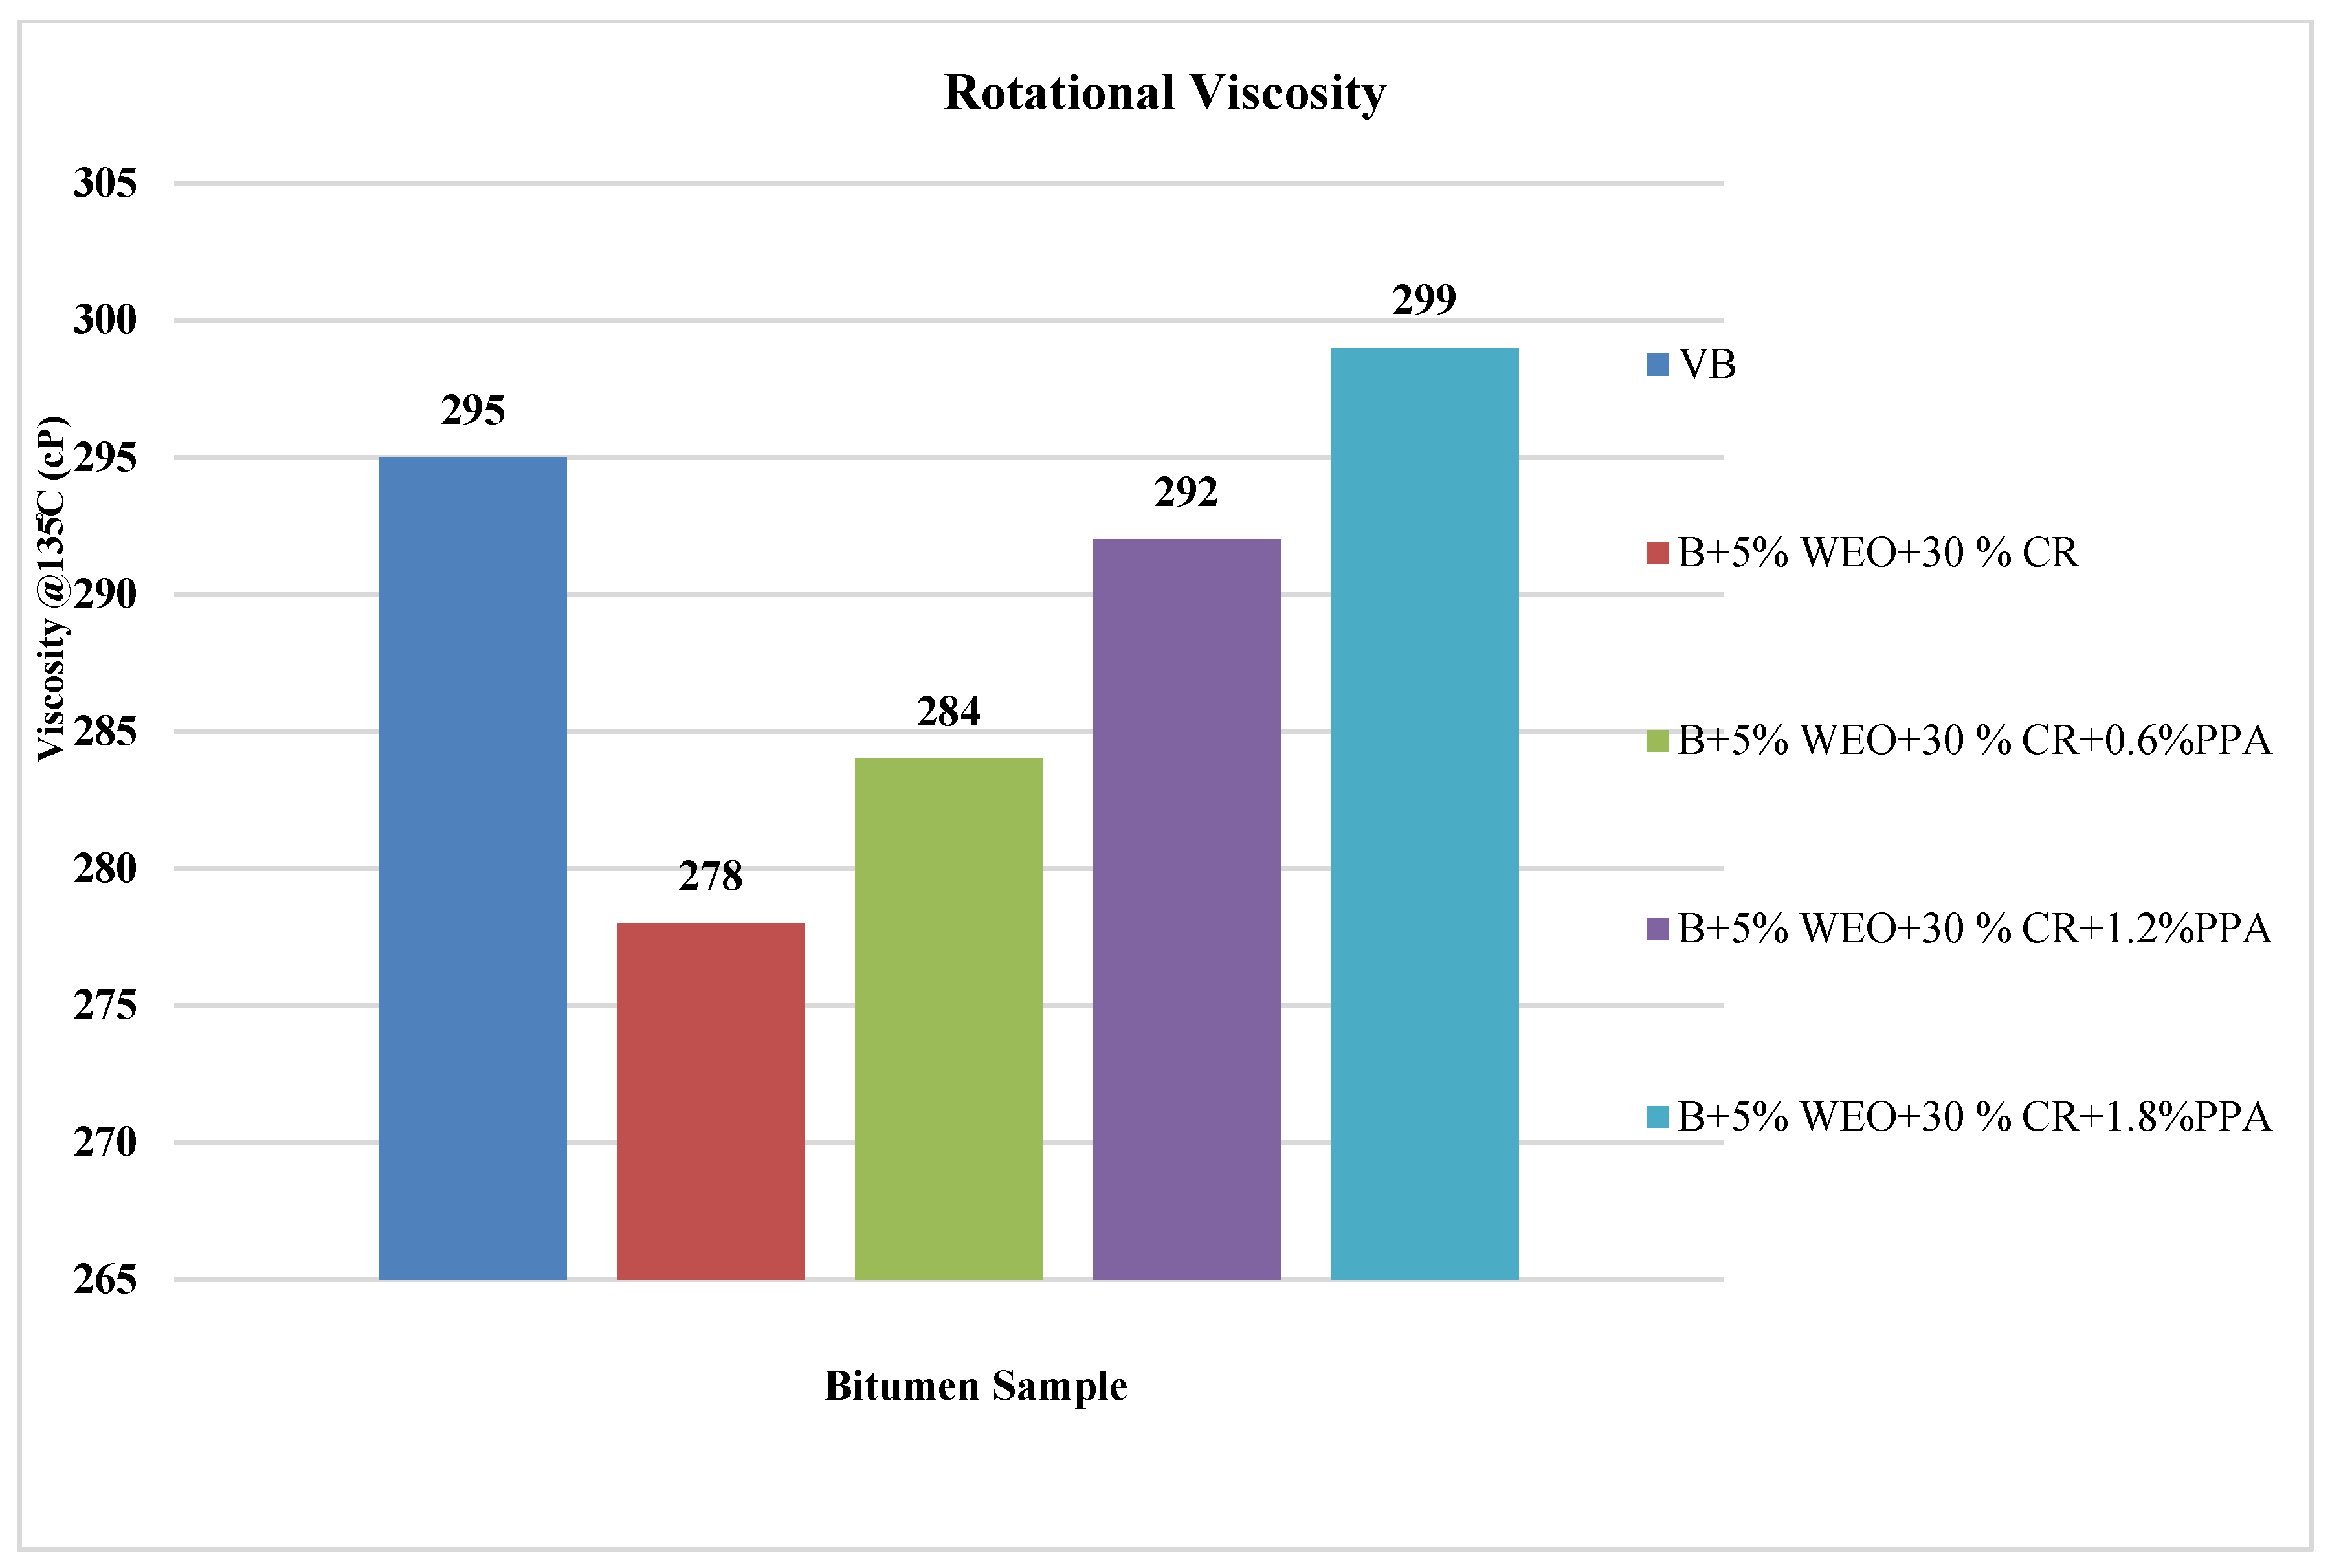
Figure 9.
FTIR Analysis of all the samples (WEO, CR, and PPA).
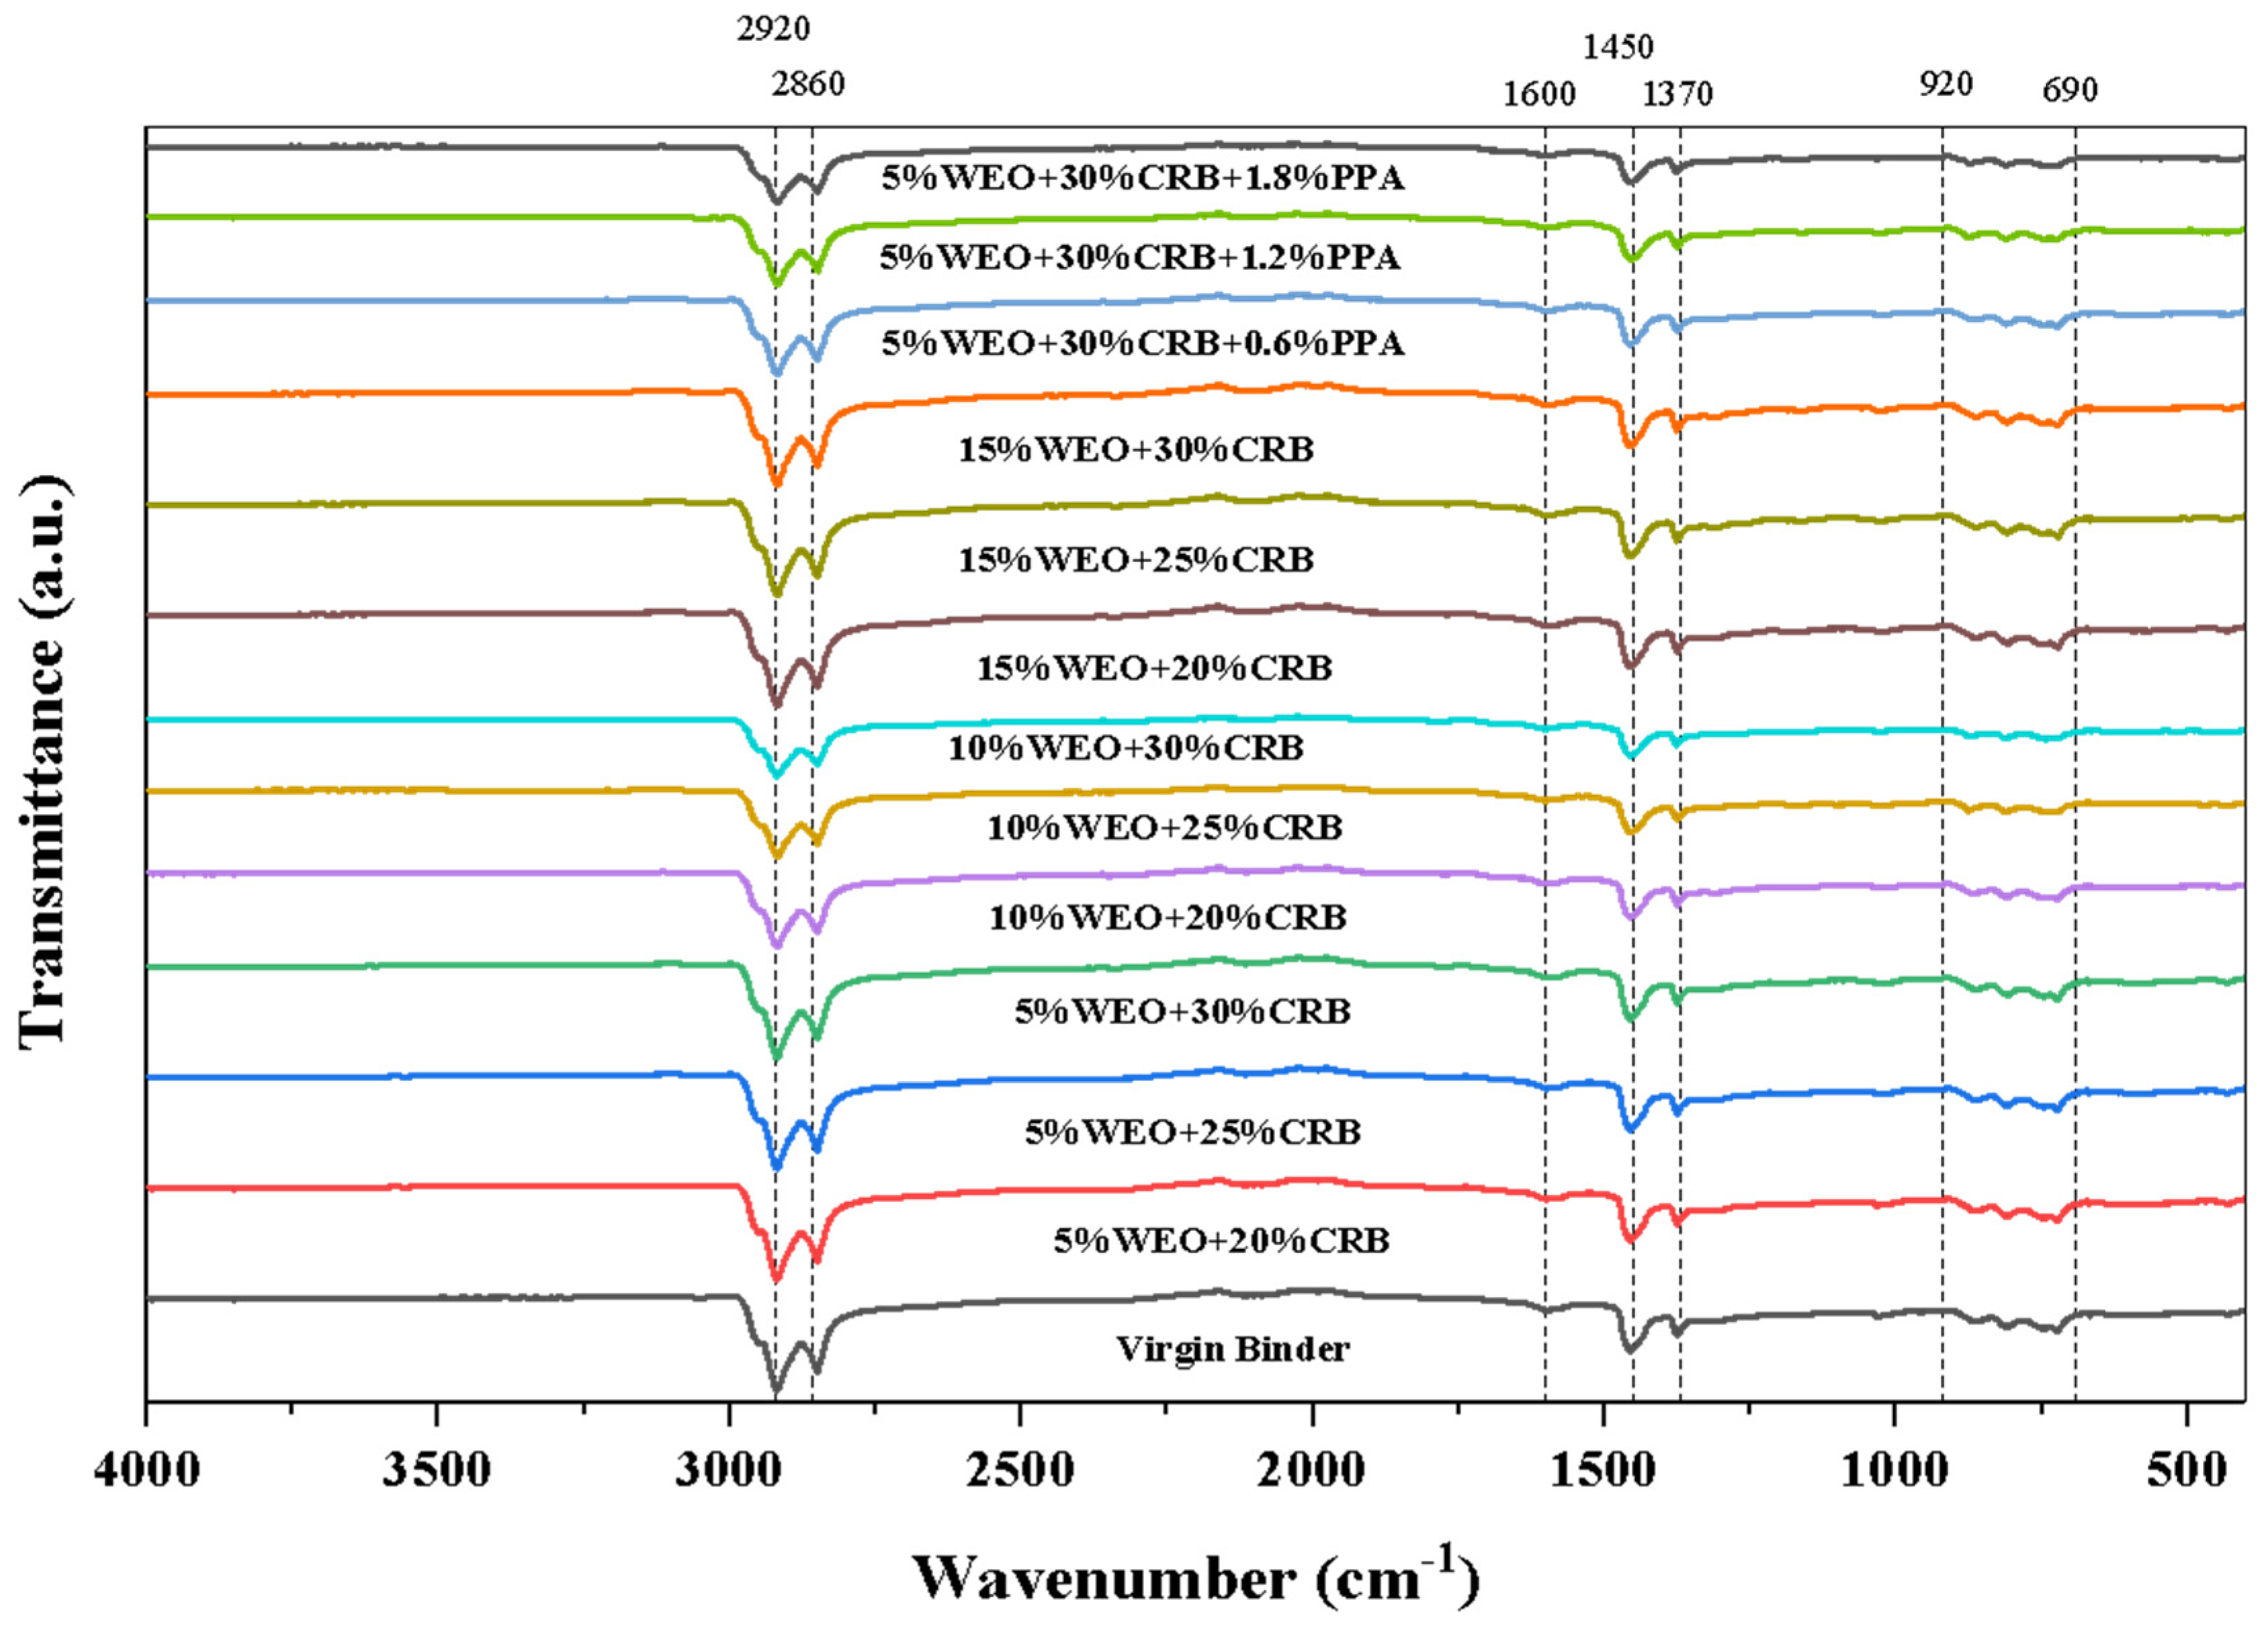
Figure 10.
The failing temperature of Virgin and WEO+CRB Modified Binder.
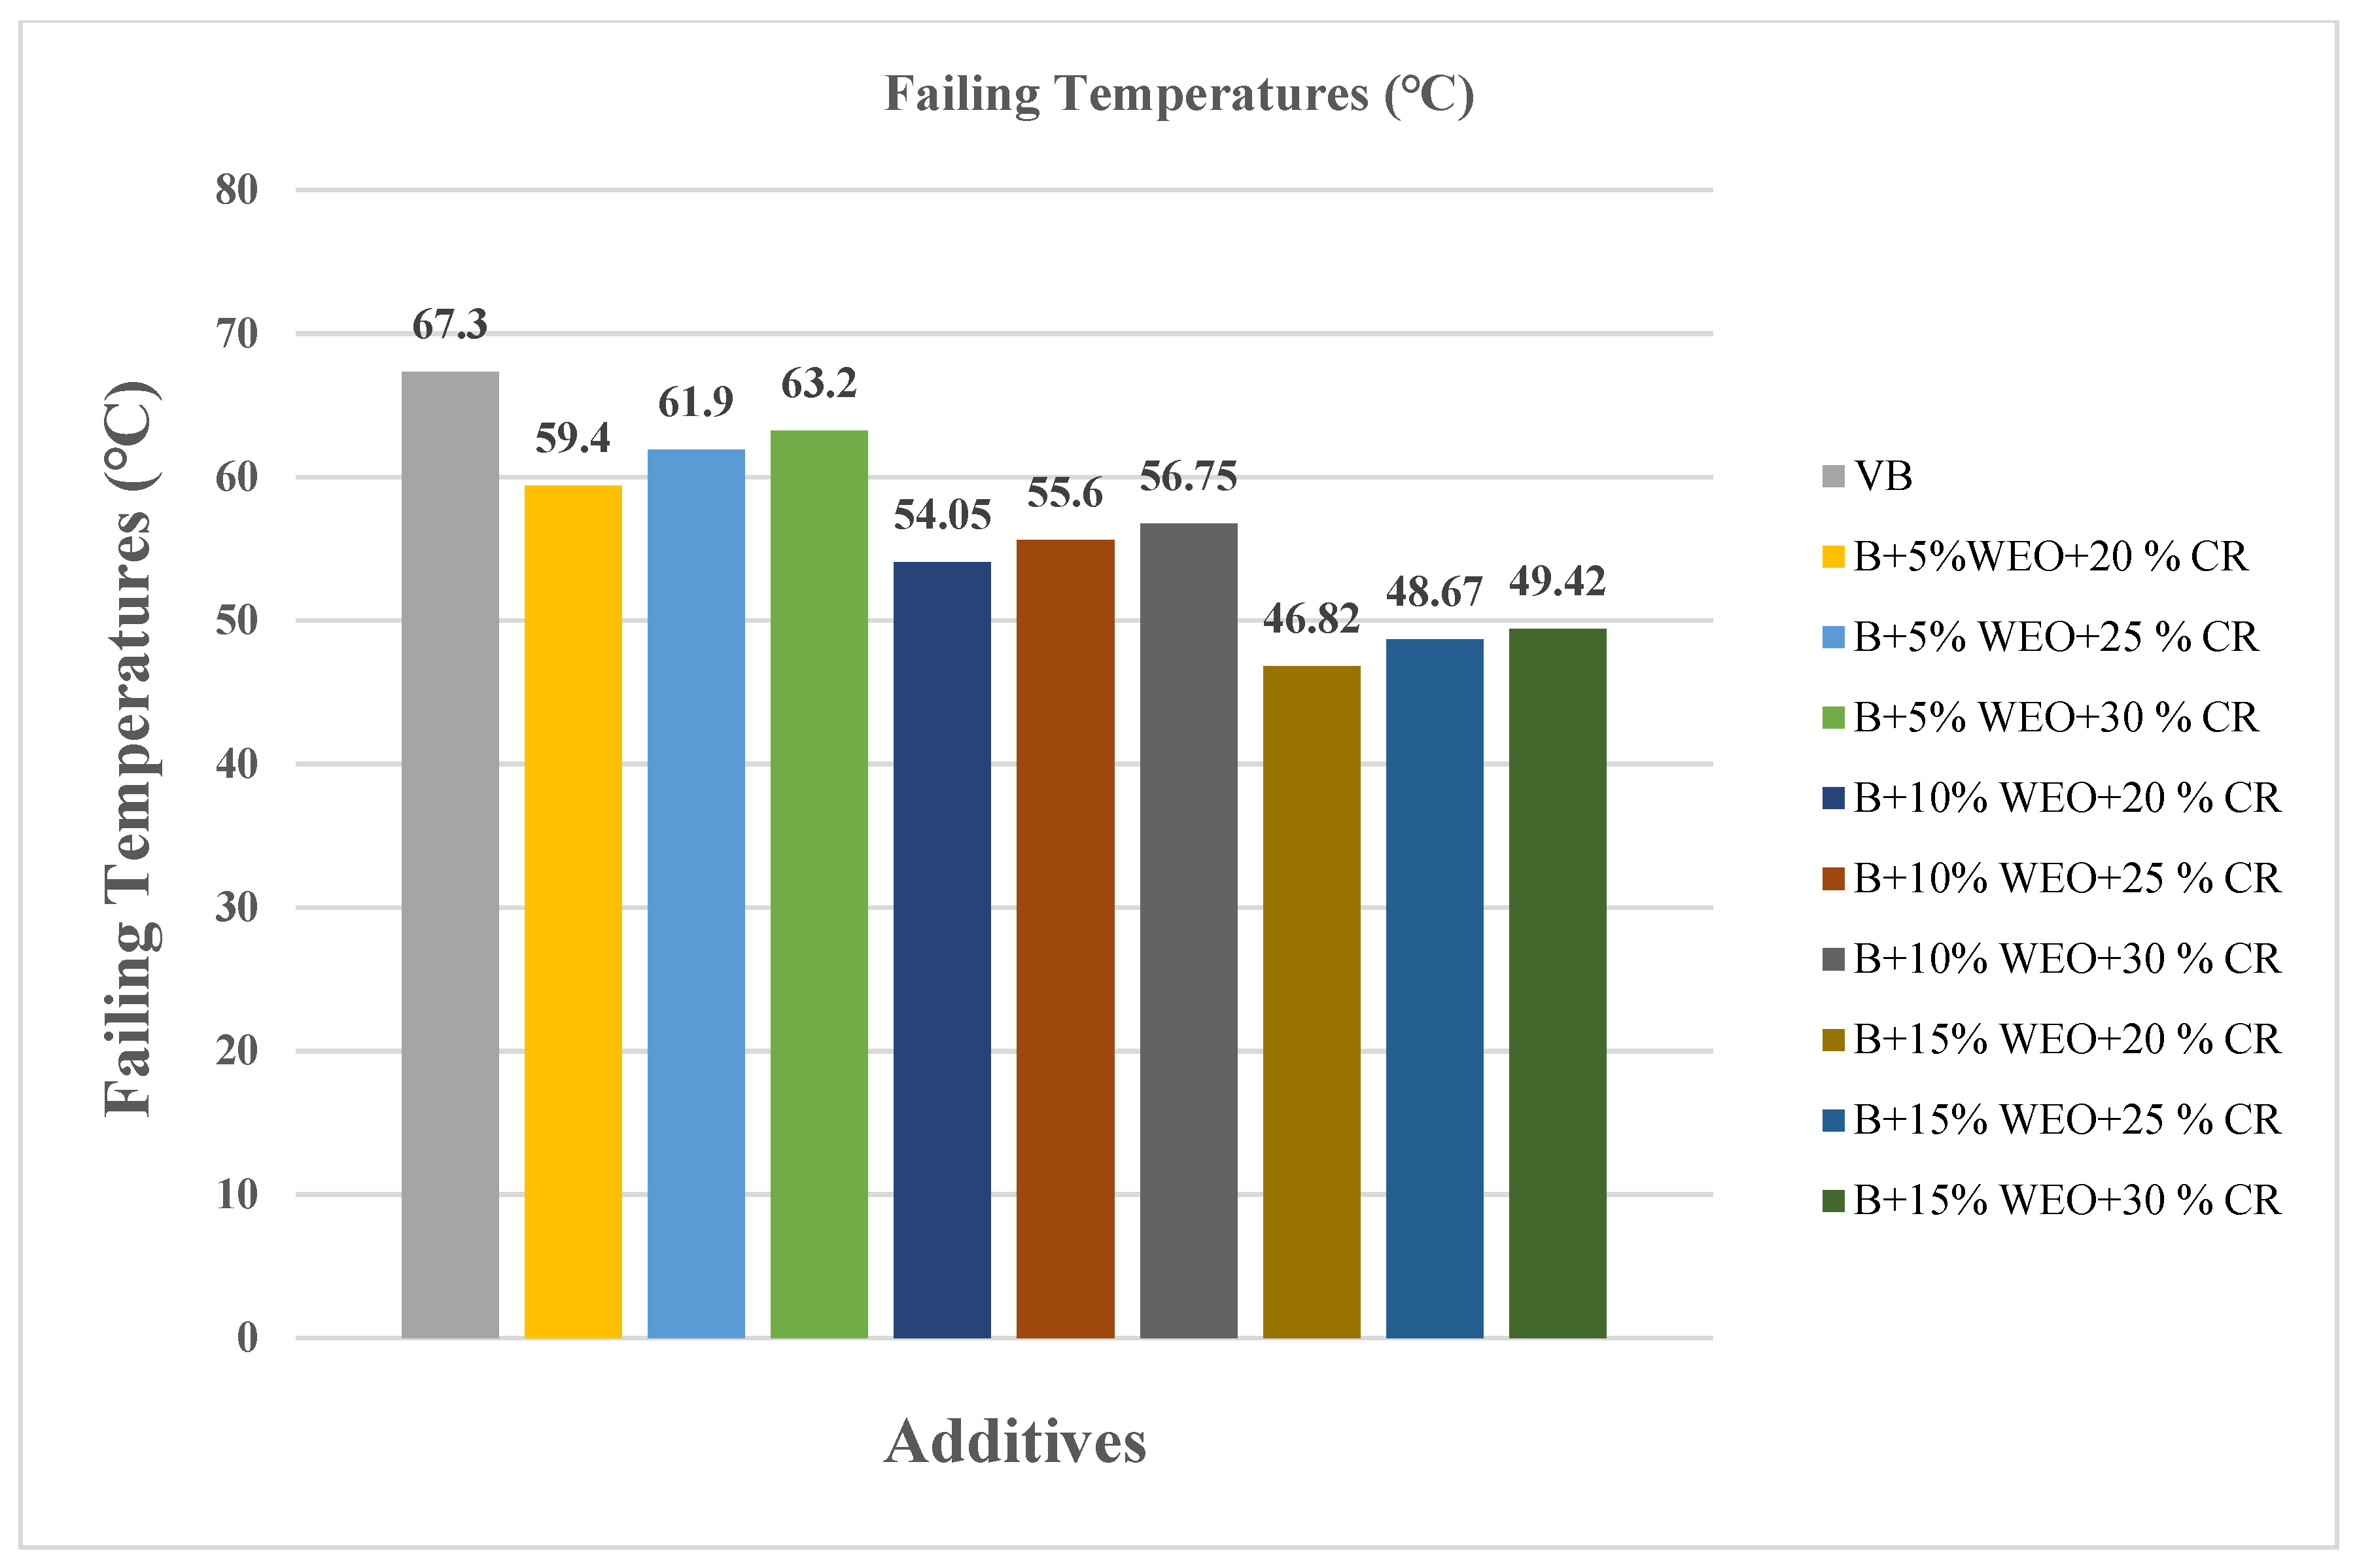
Figure 11.
The failing temperature of Virgin and PPA Modified Binder.
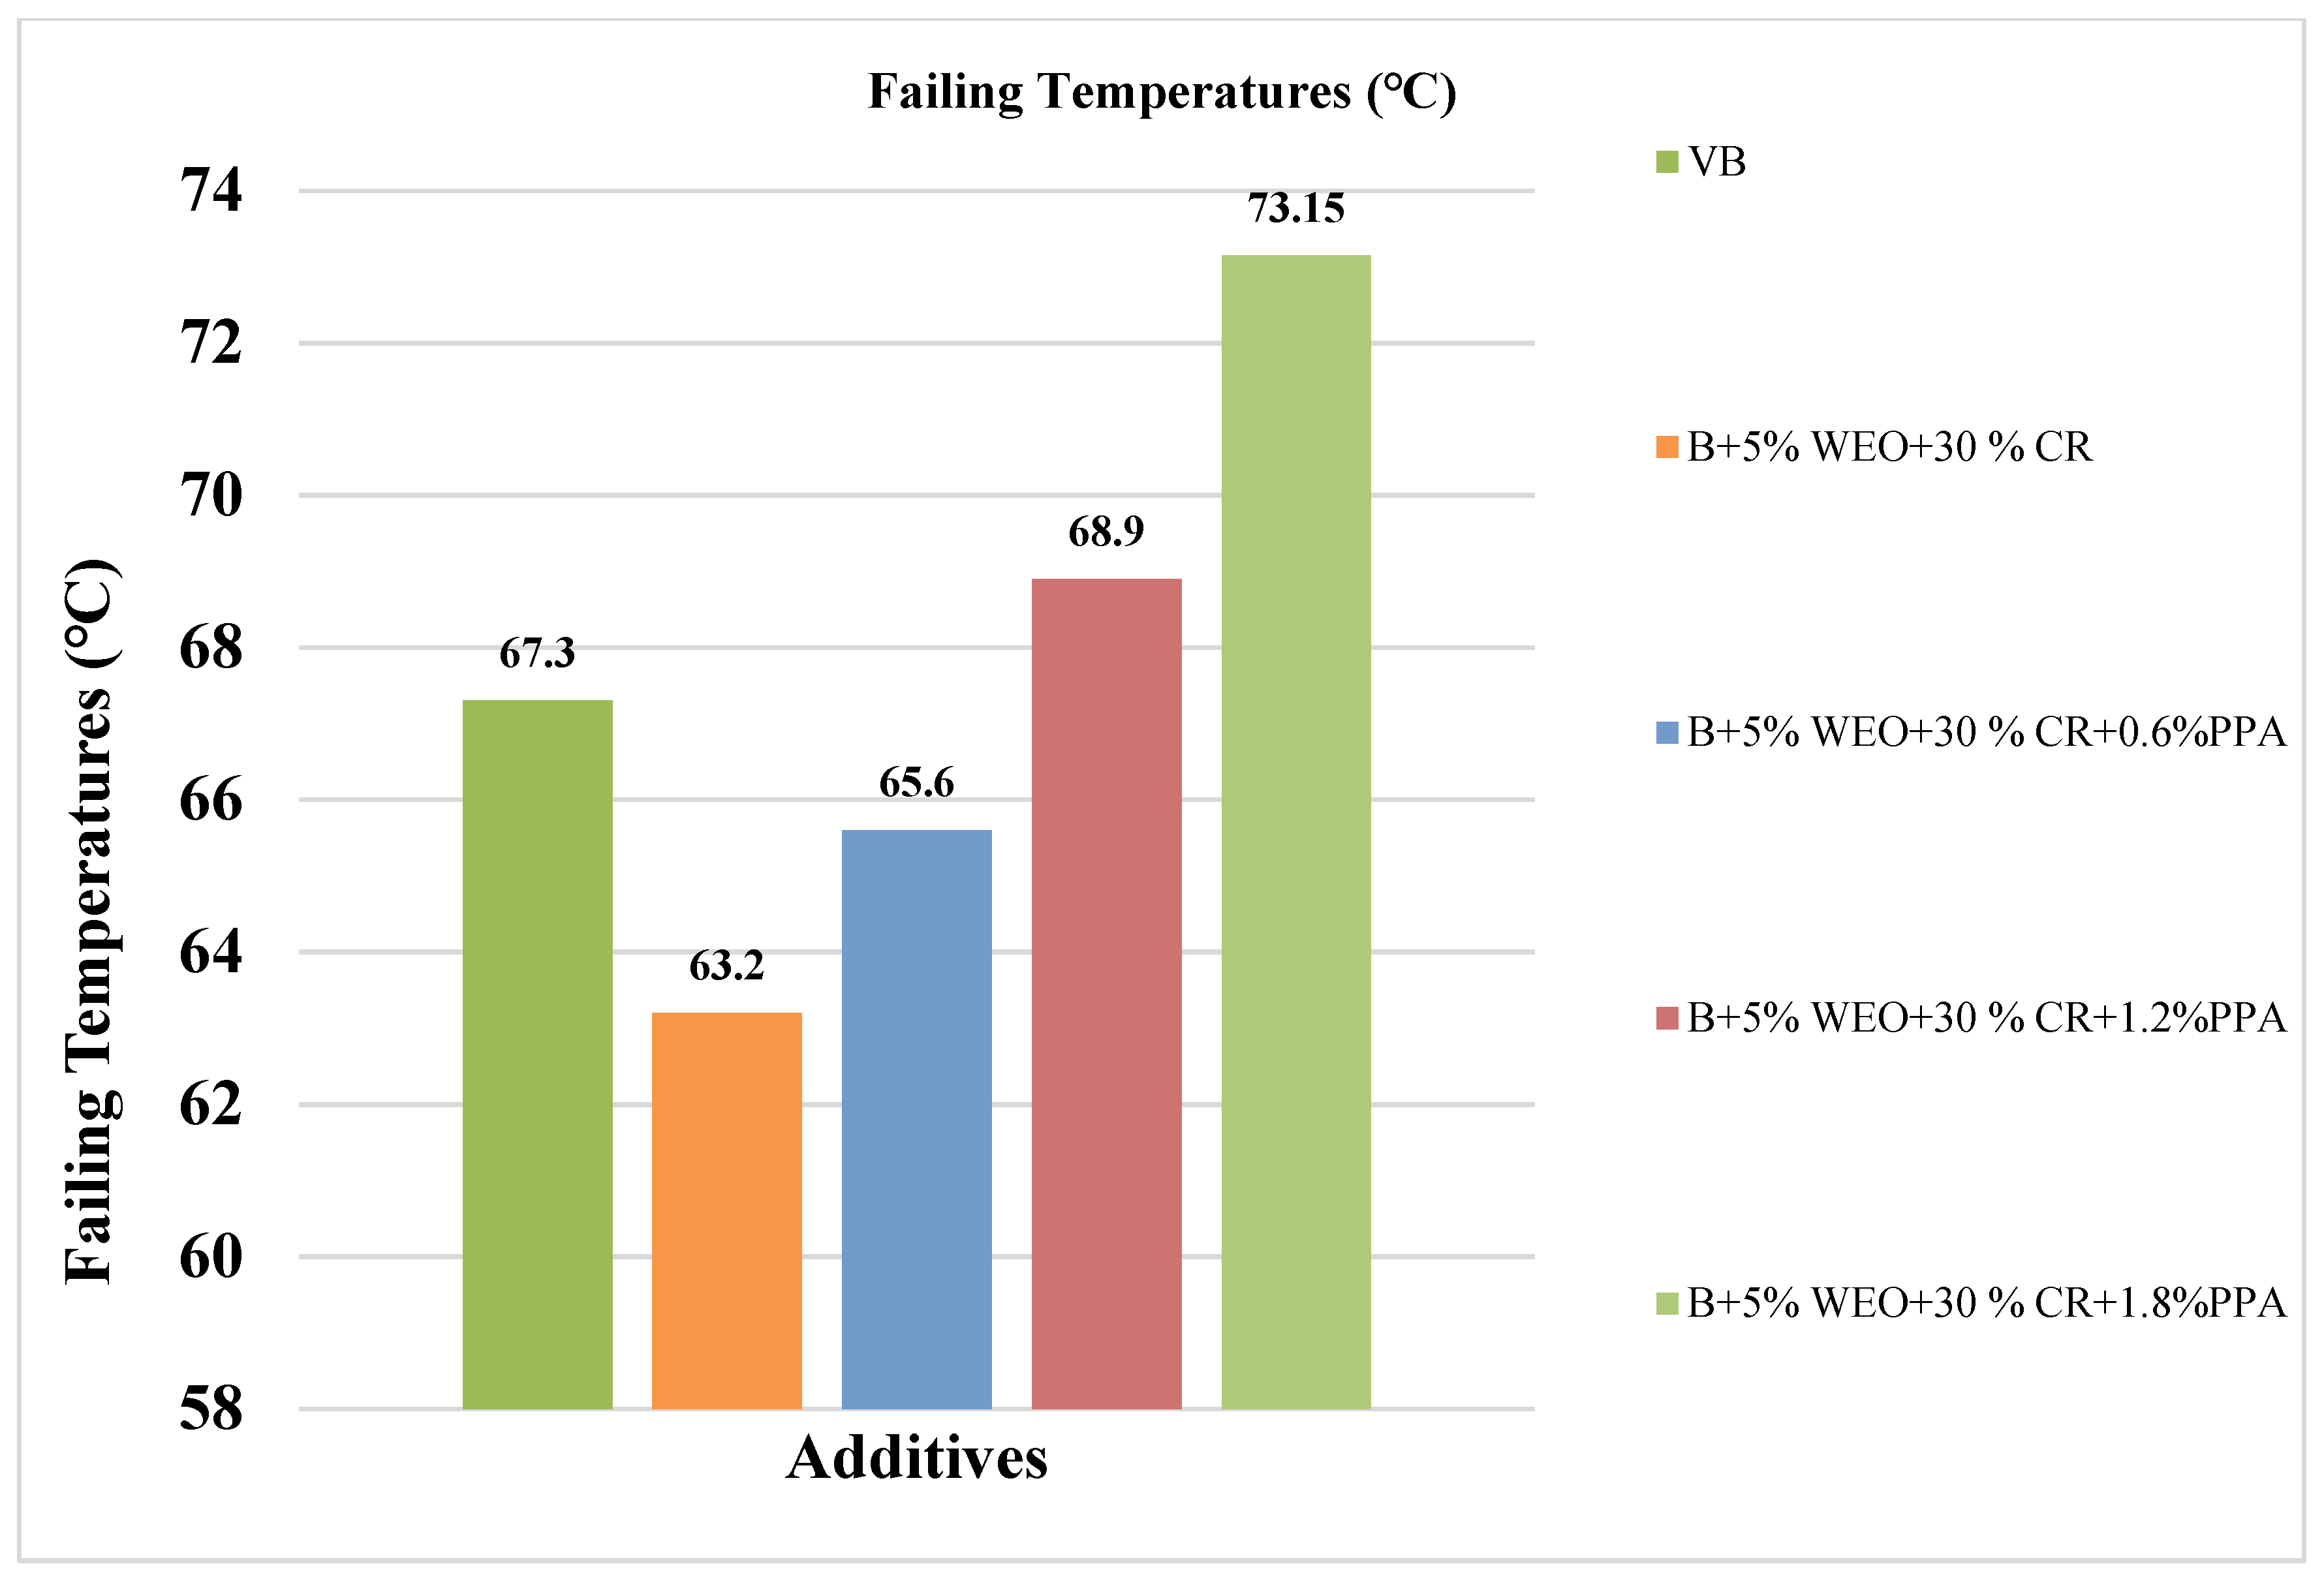
Figure 12.
Master Curve for Virgin and 5% WEO + CRB Modified Binder: (a) Phase Angle, (b) Rutting Resistance.
Figure 12.
Master Curve for Virgin and 5% WEO + CRB Modified Binder: (a) Phase Angle, (b) Rutting Resistance.
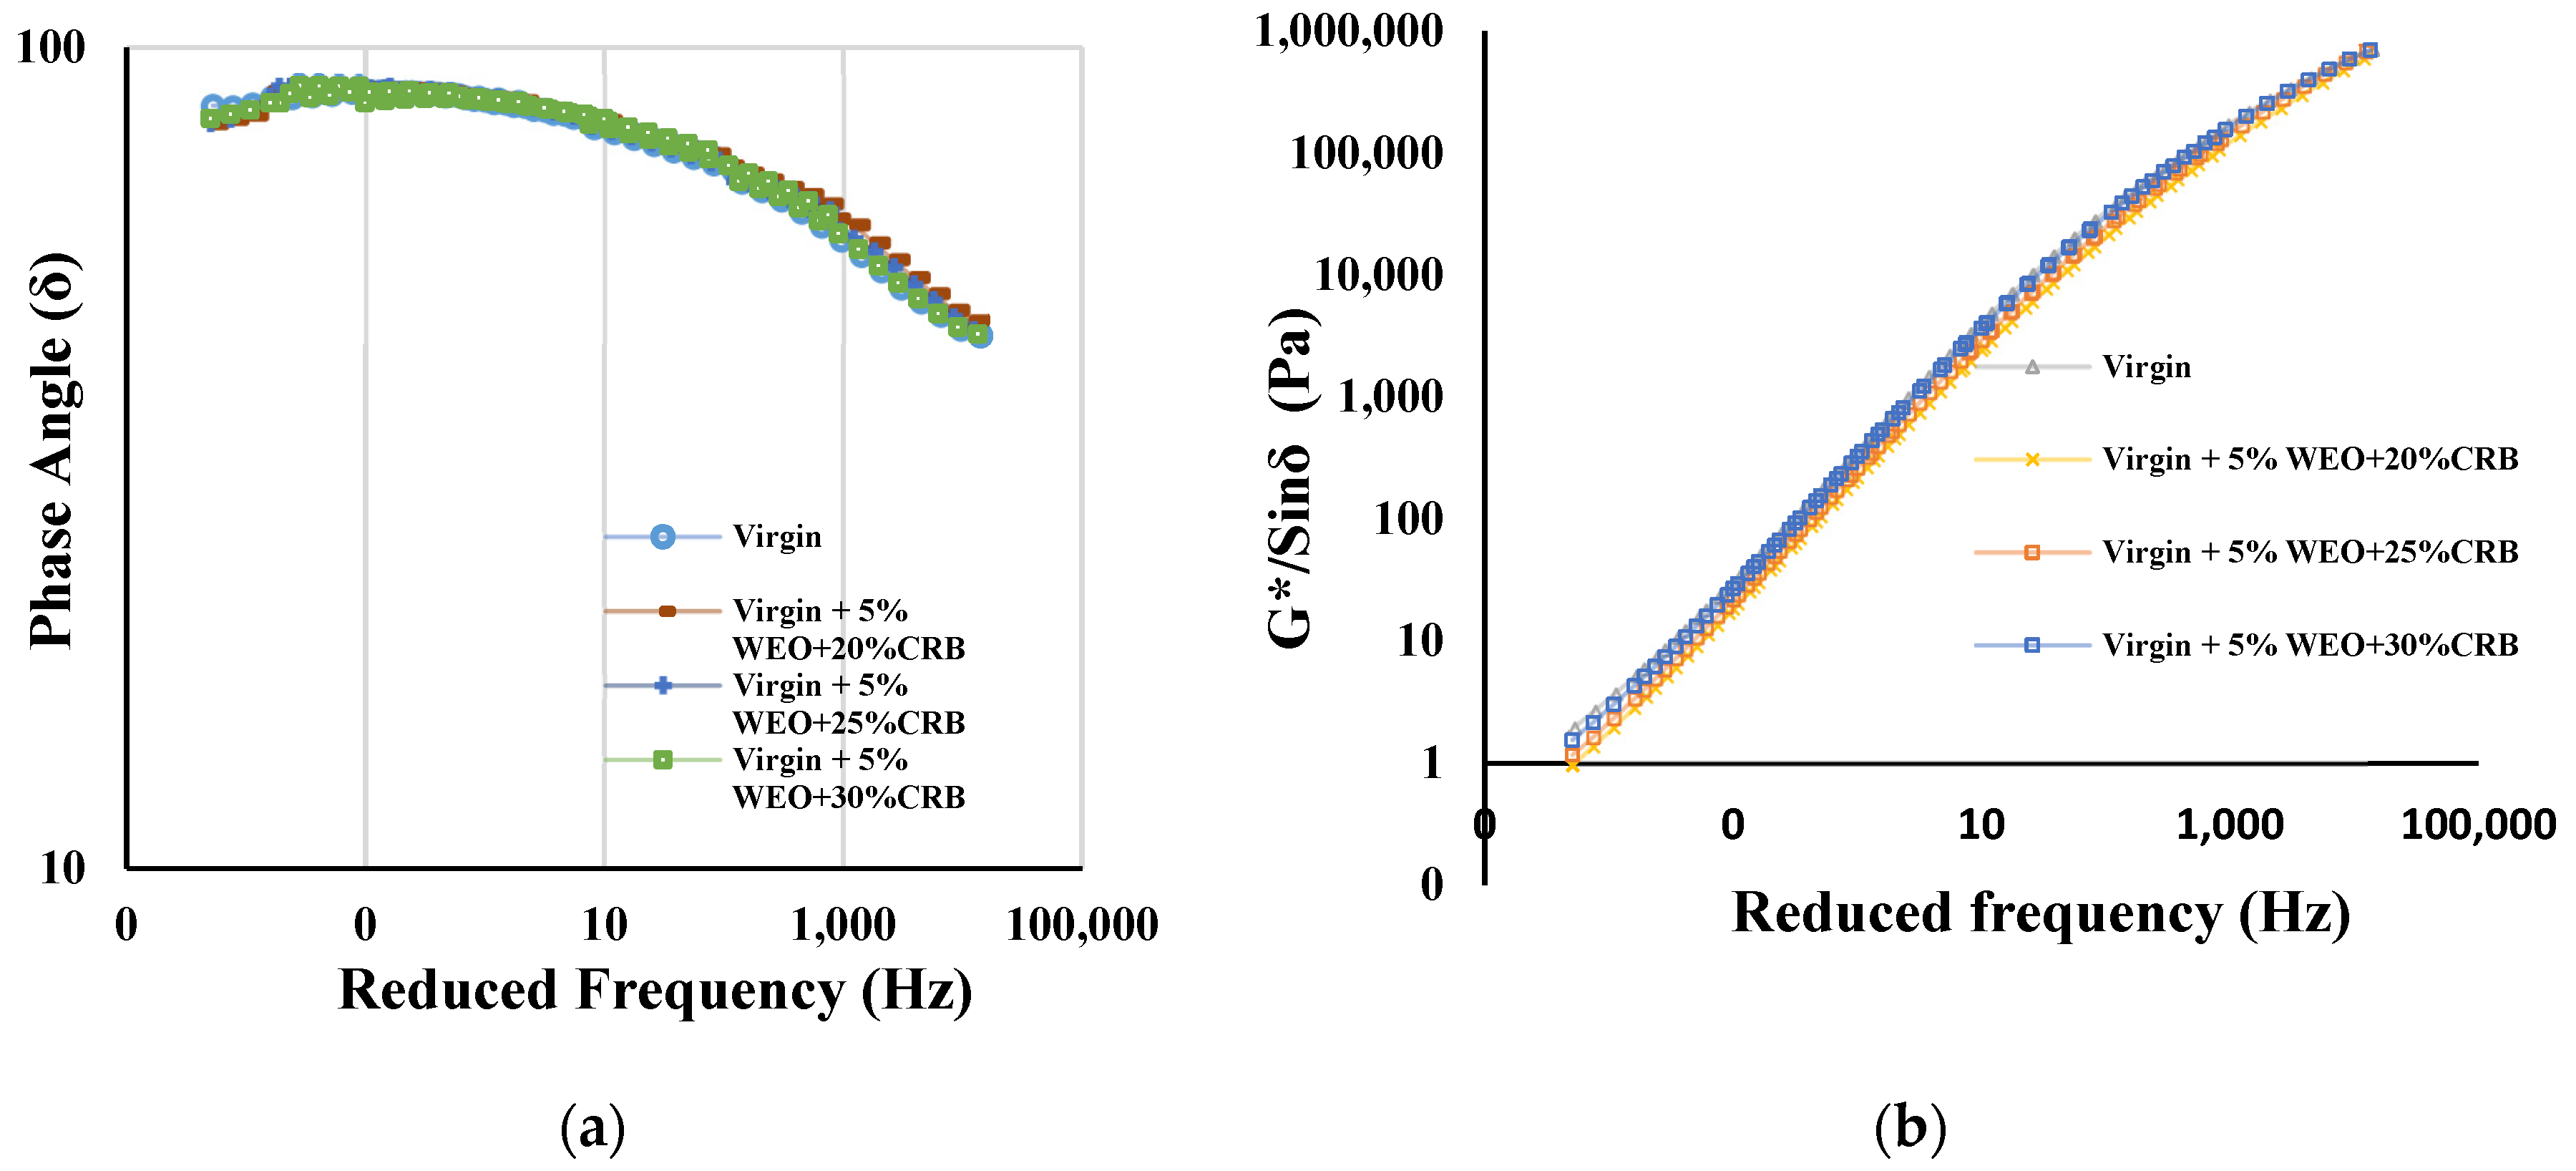
Figure 13.
Master Curve of for Virgin and 10% WEO + CRB Modified Binder: (a) Phase Angle, and (b) Rutting Resistance.
Figure 13.
Master Curve of for Virgin and 10% WEO + CRB Modified Binder: (a) Phase Angle, and (b) Rutting Resistance.
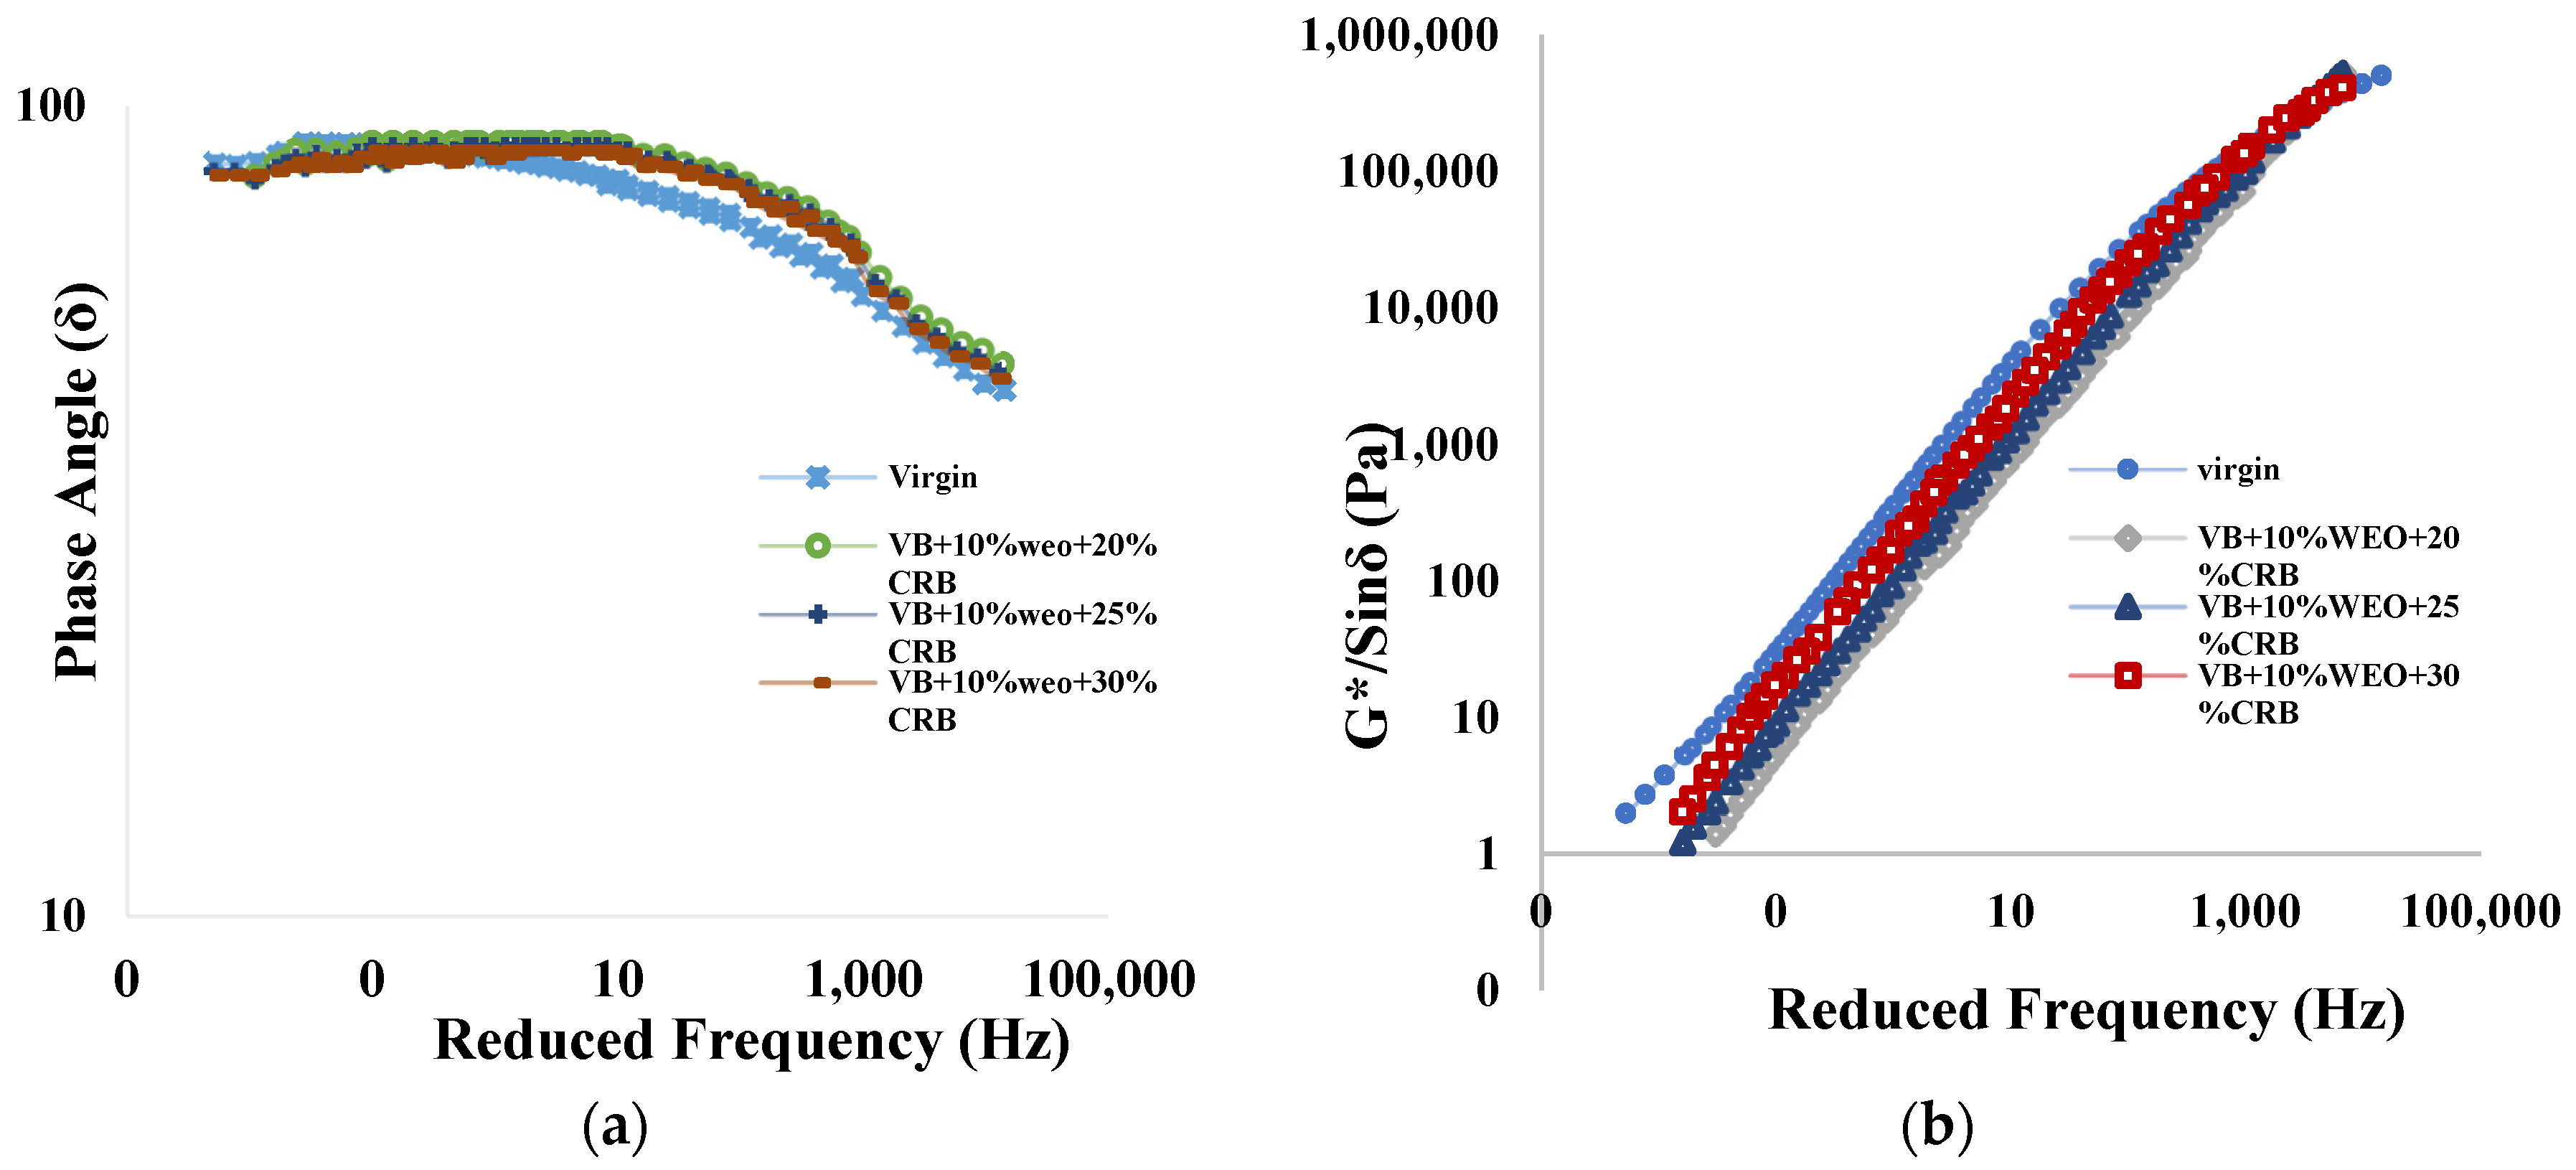
Figure 14.
Master Curve of for Virgin and 15% WEO + CRB Modified Binder: (a) Phase Angle, and (b) Rutting Resistance.
Figure 14.
Master Curve of for Virgin and 15% WEO + CRB Modified Binder: (a) Phase Angle, and (b) Rutting Resistance.

Figure 15.
Master Curve for the Virgin and WEO + CRB + PPA Modified Binder Master Curve of for Virgin (a) Phase Angle, and (b) Rutting Resistance.
Figure 15.
Master Curve for the Virgin and WEO + CRB + PPA Modified Binder Master Curve of for Virgin (a) Phase Angle, and (b) Rutting Resistance.
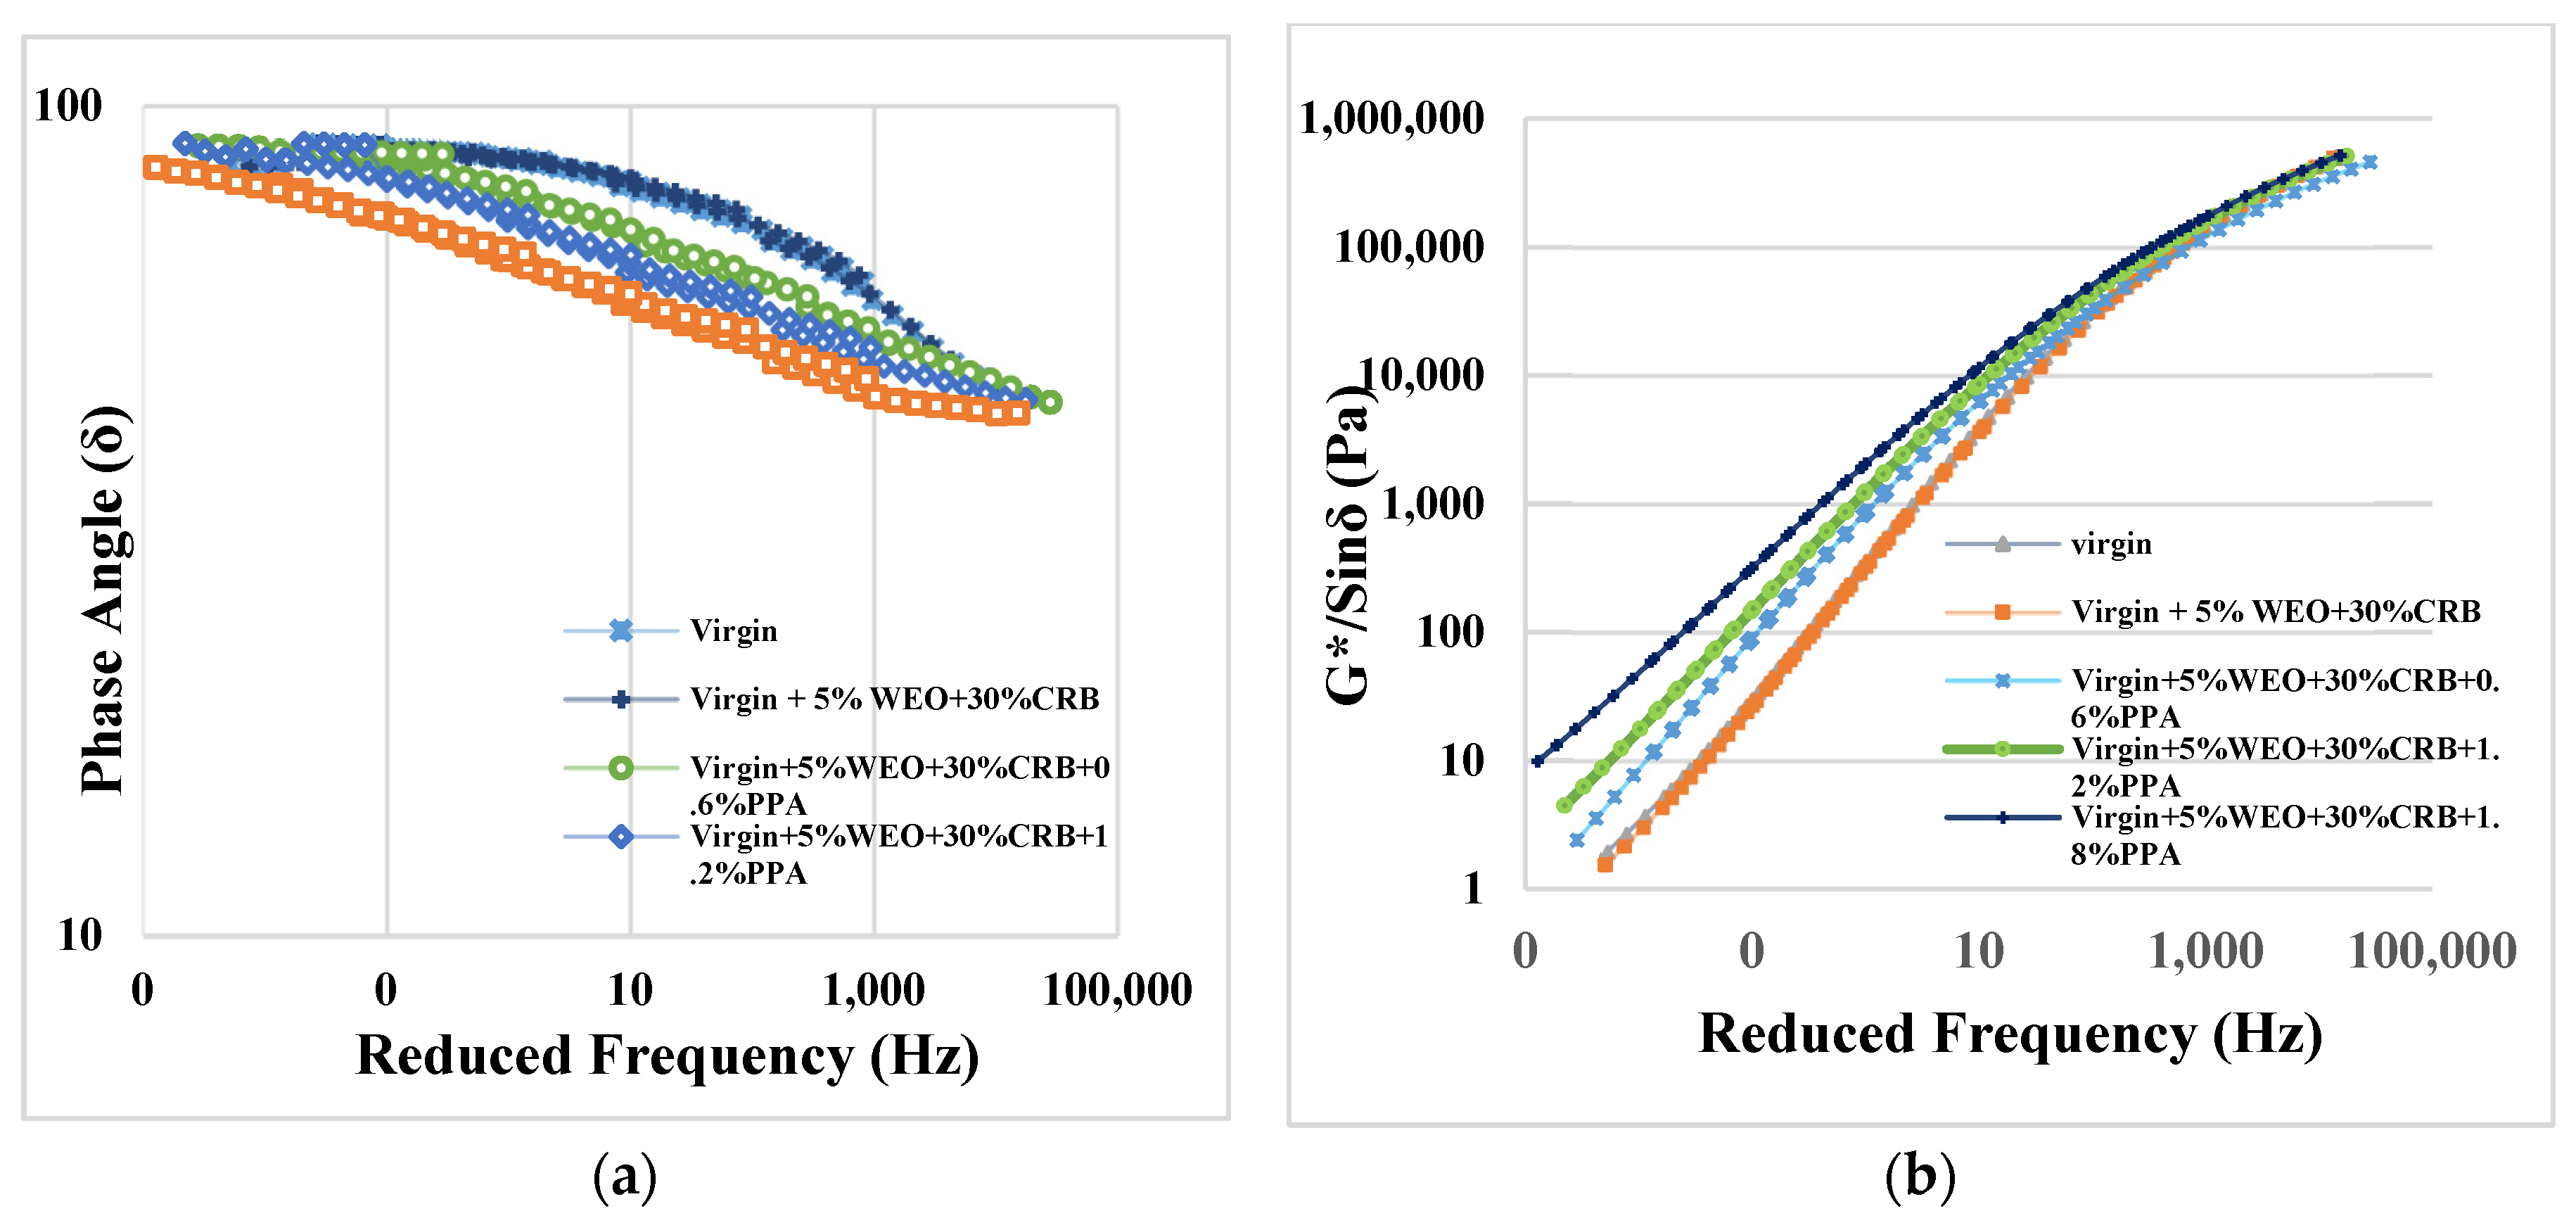
Figure 16.
POTS in Dry Condition of Virgin and WEO+CRB Modified Binder.
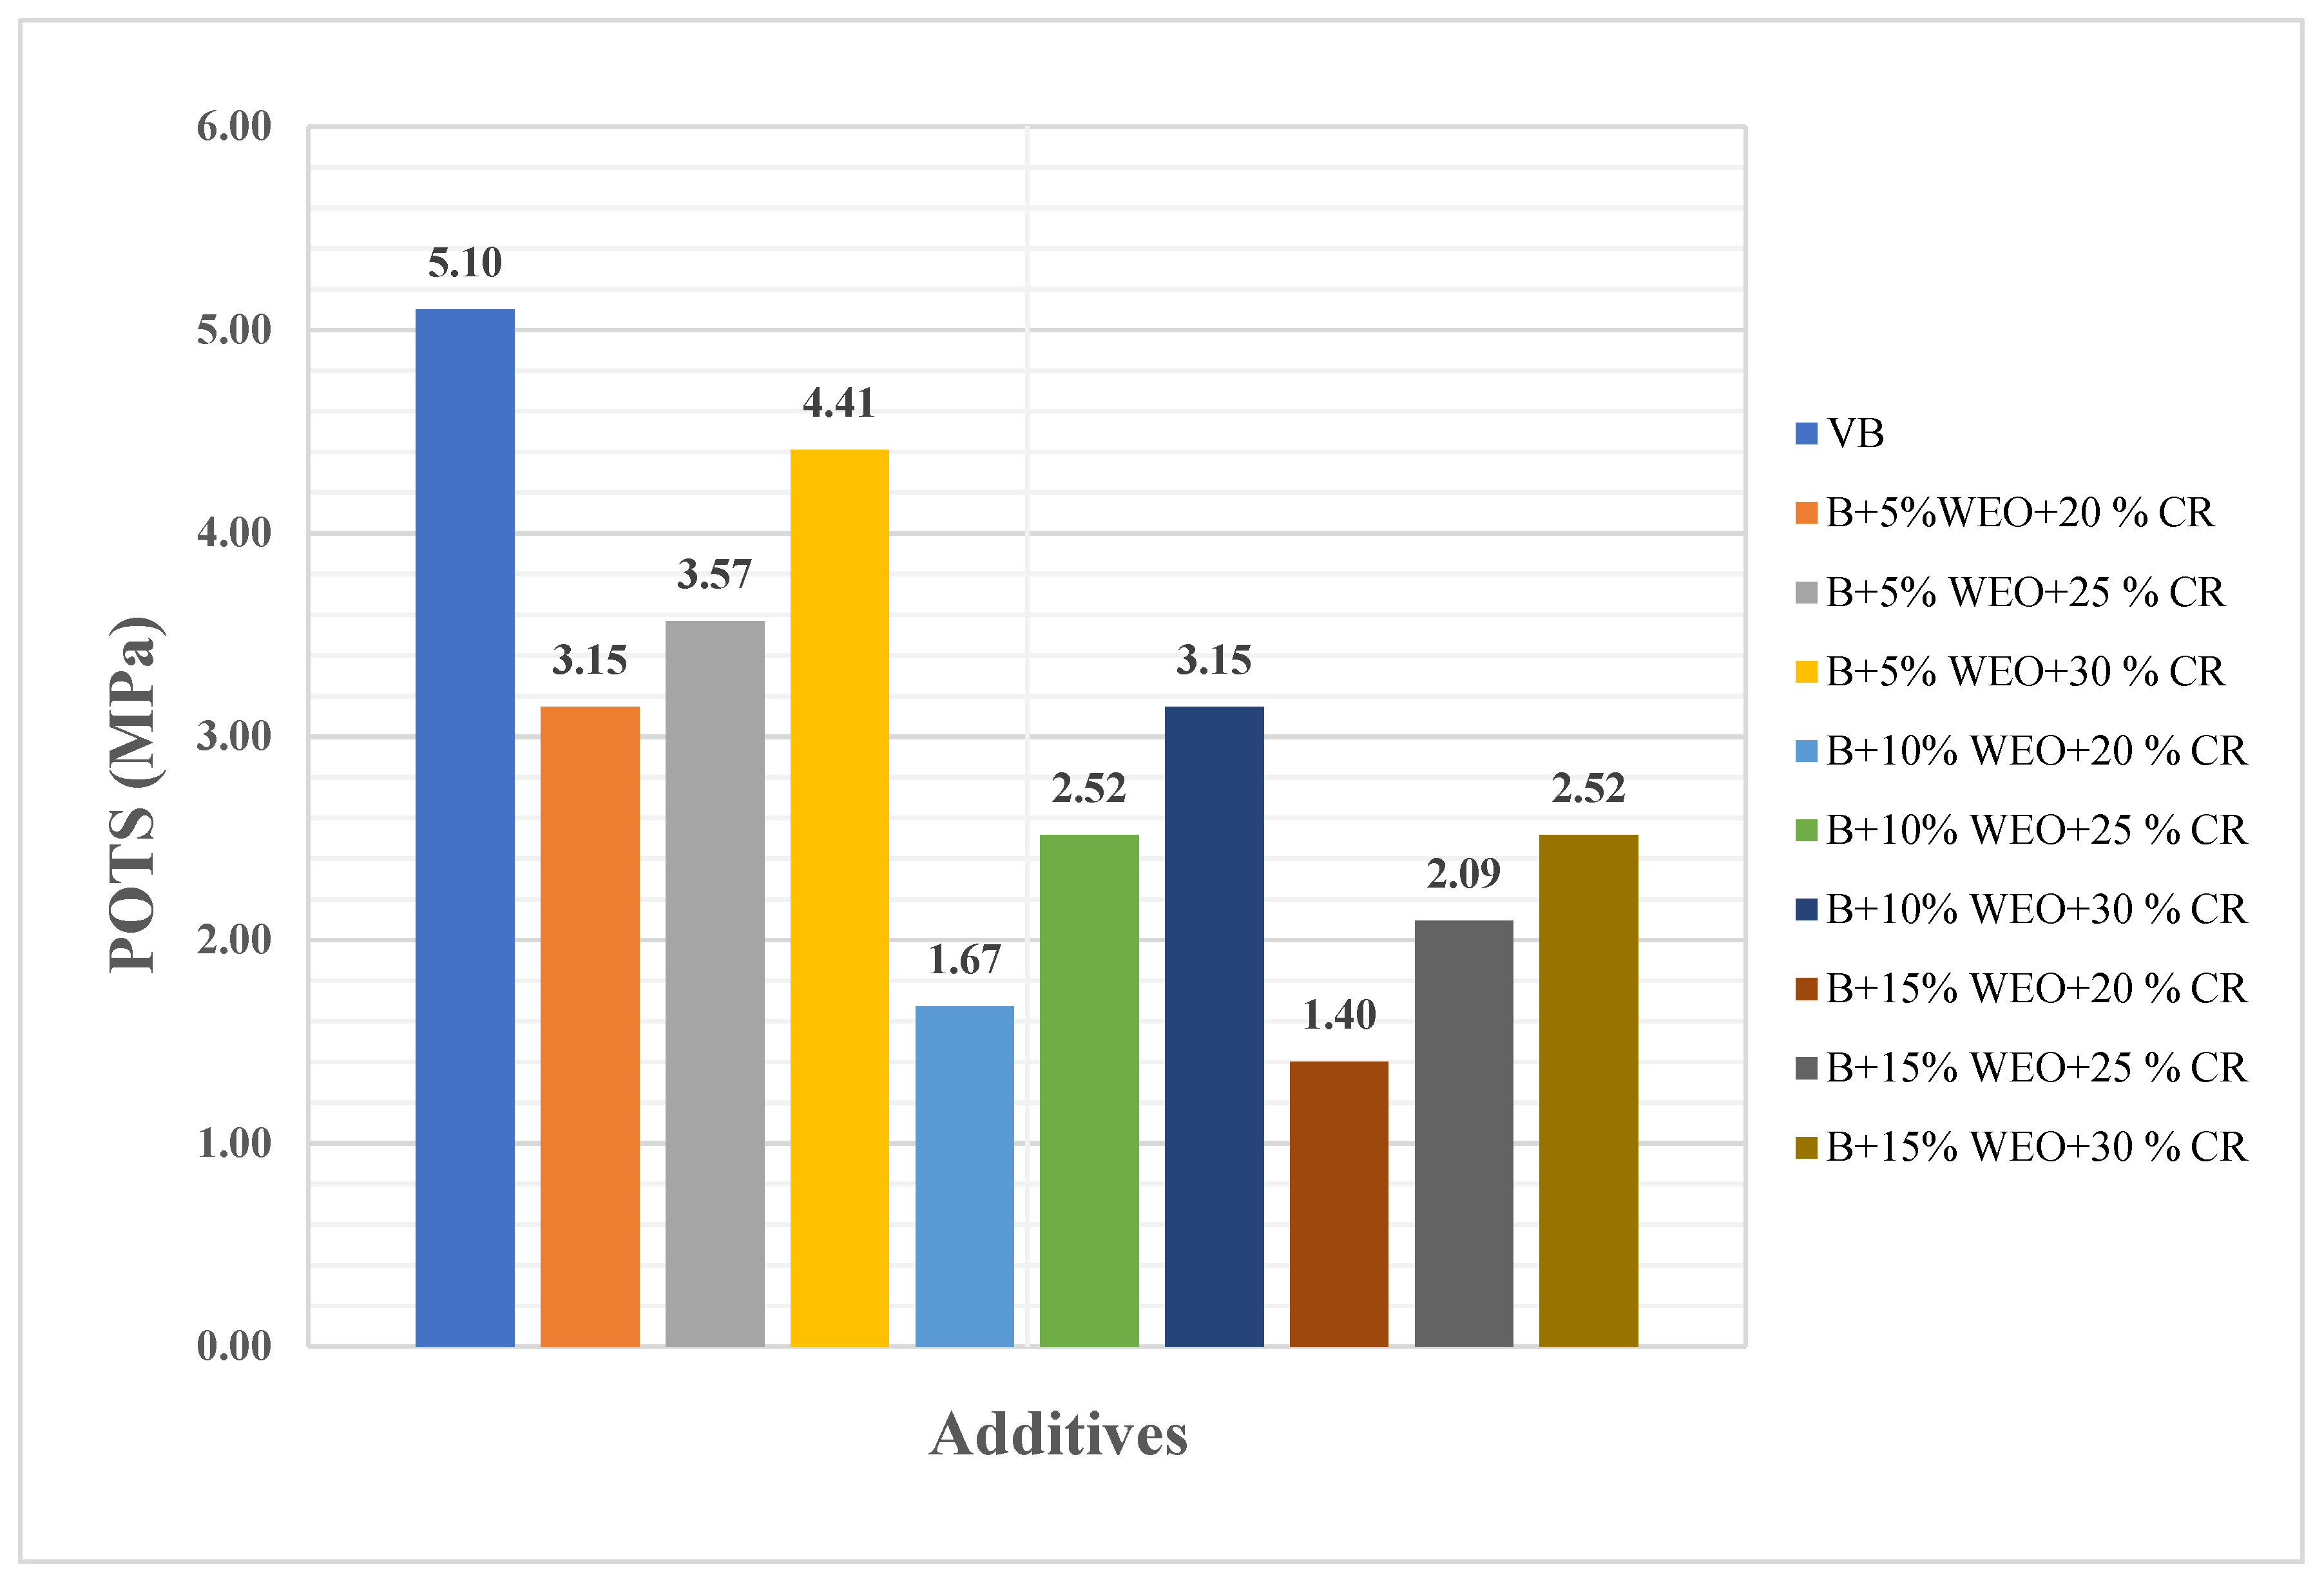
Figure 17.
POTS in Dry Condition of Virgin and WEO + CRB + PPA Modified Binder.
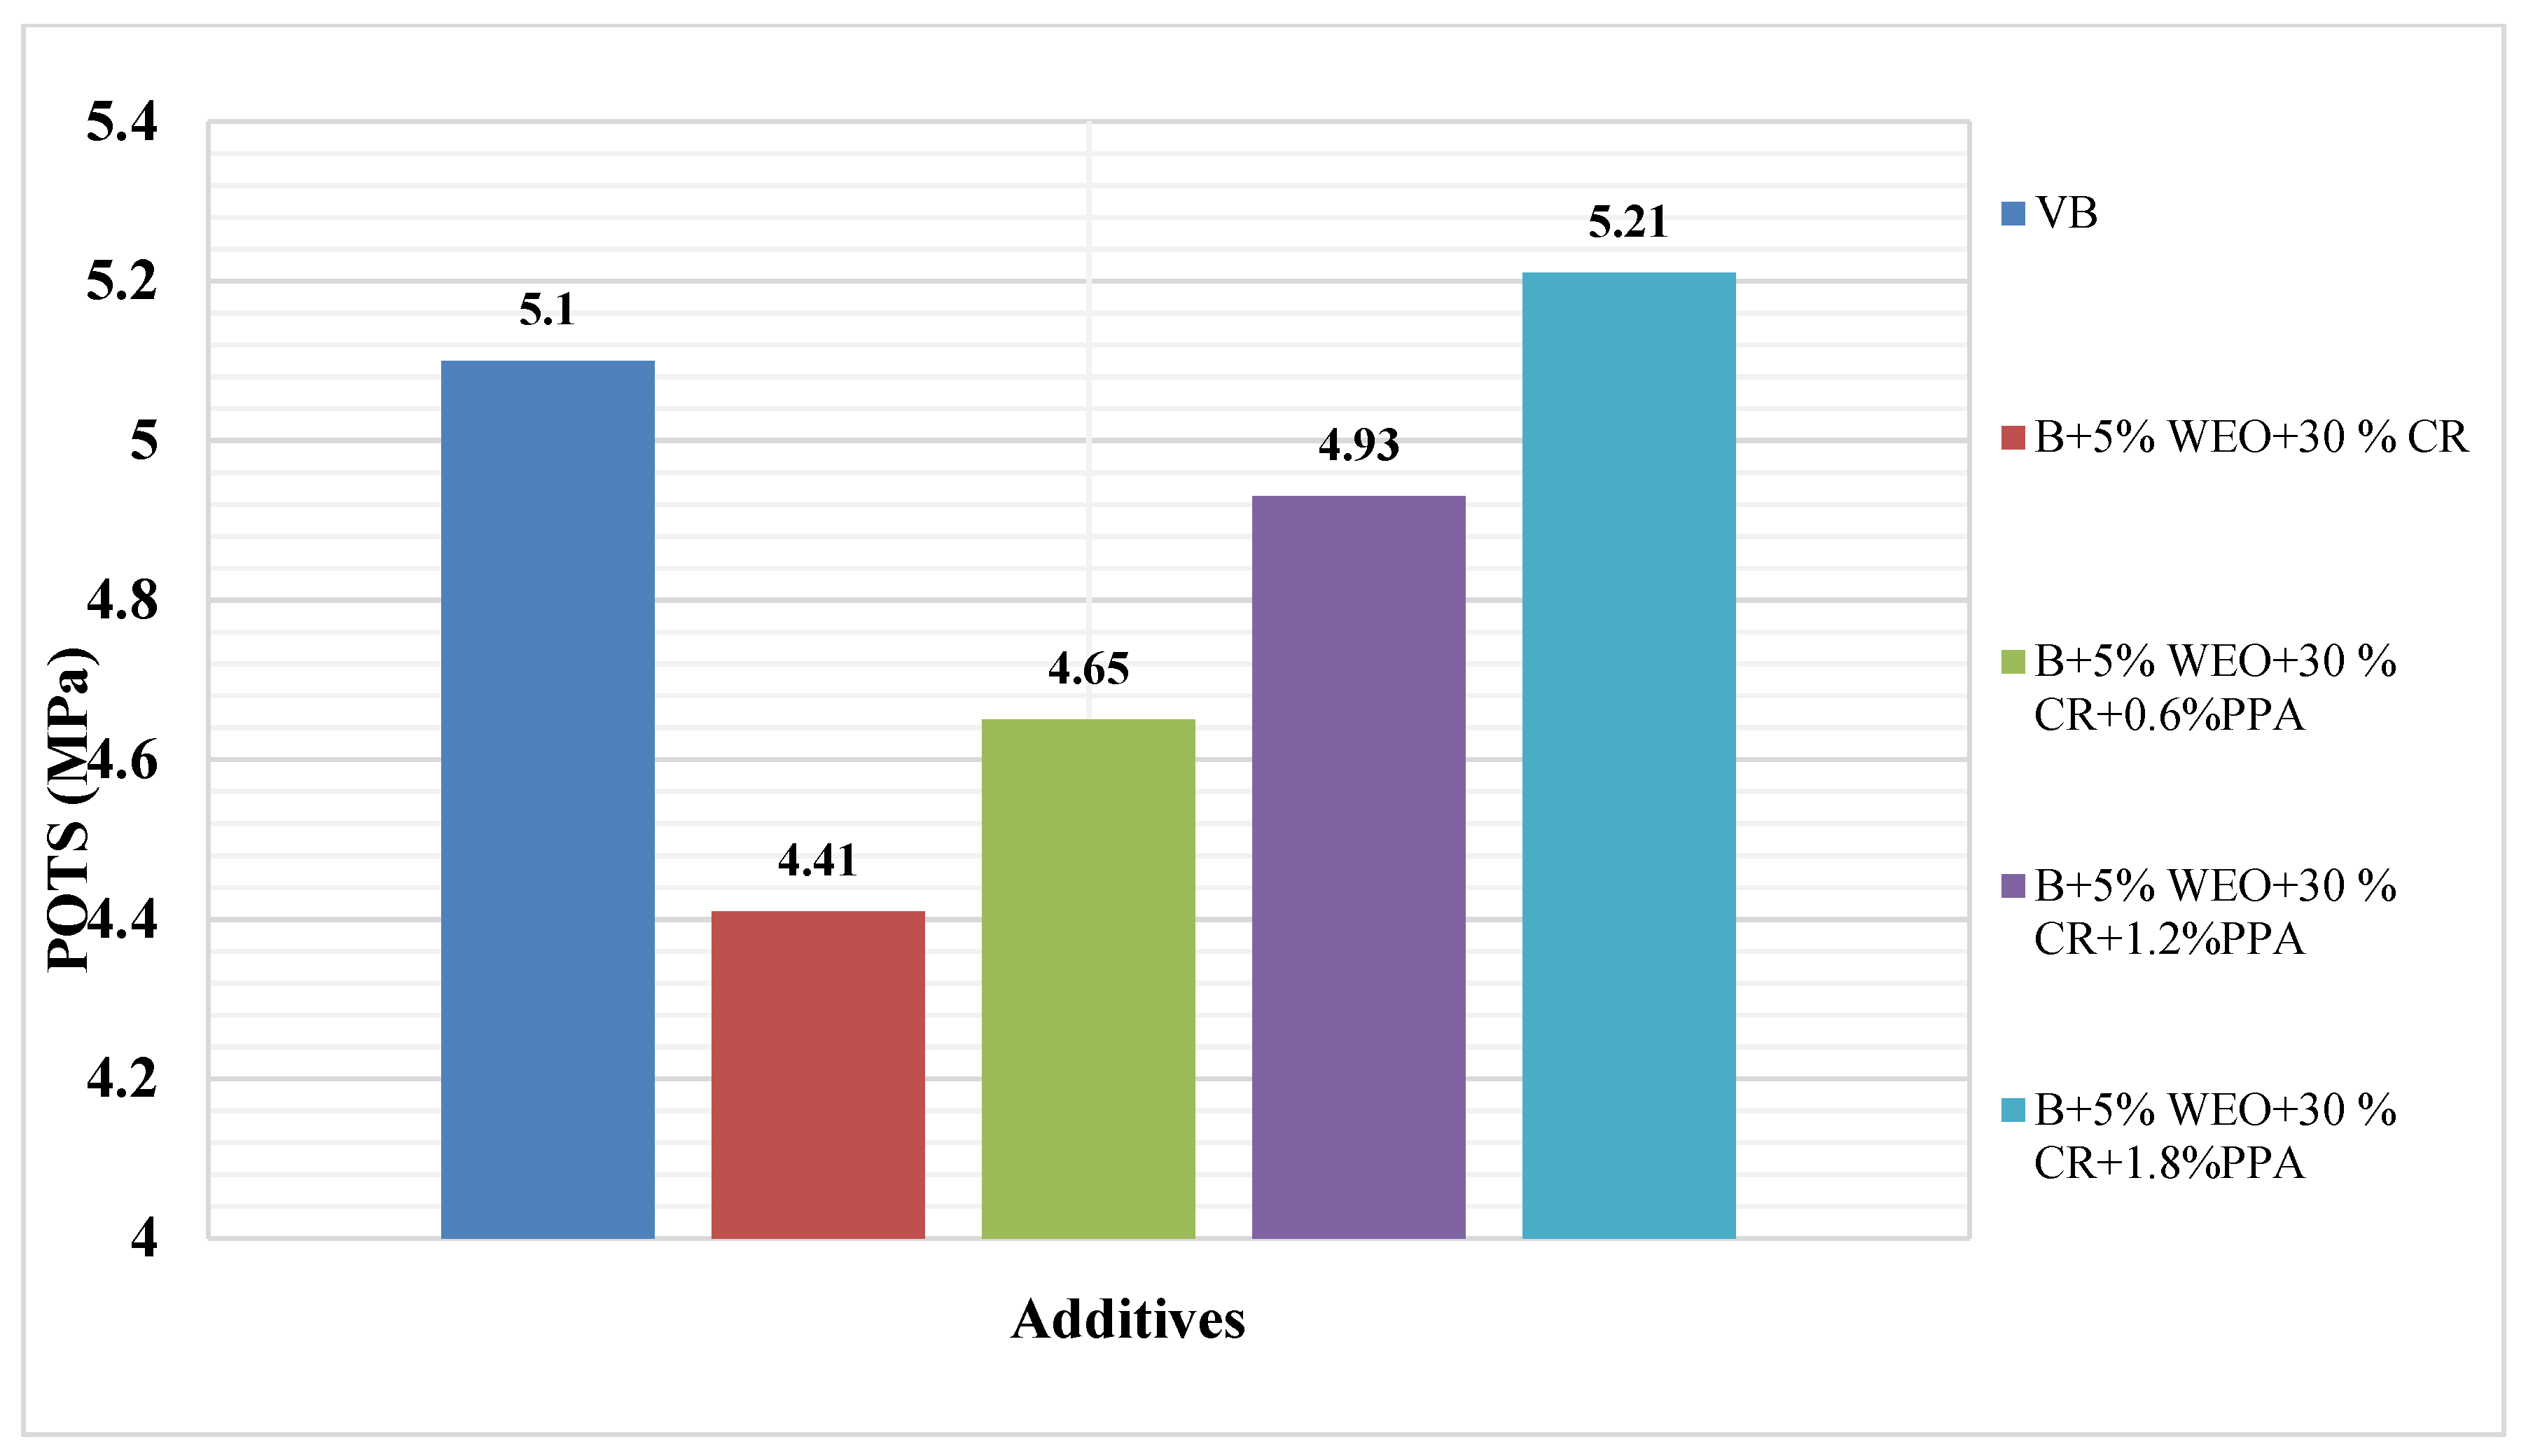
Figure 18.
POTS in Wet Condition of Virgin and WEO+CRB Modified Binder.
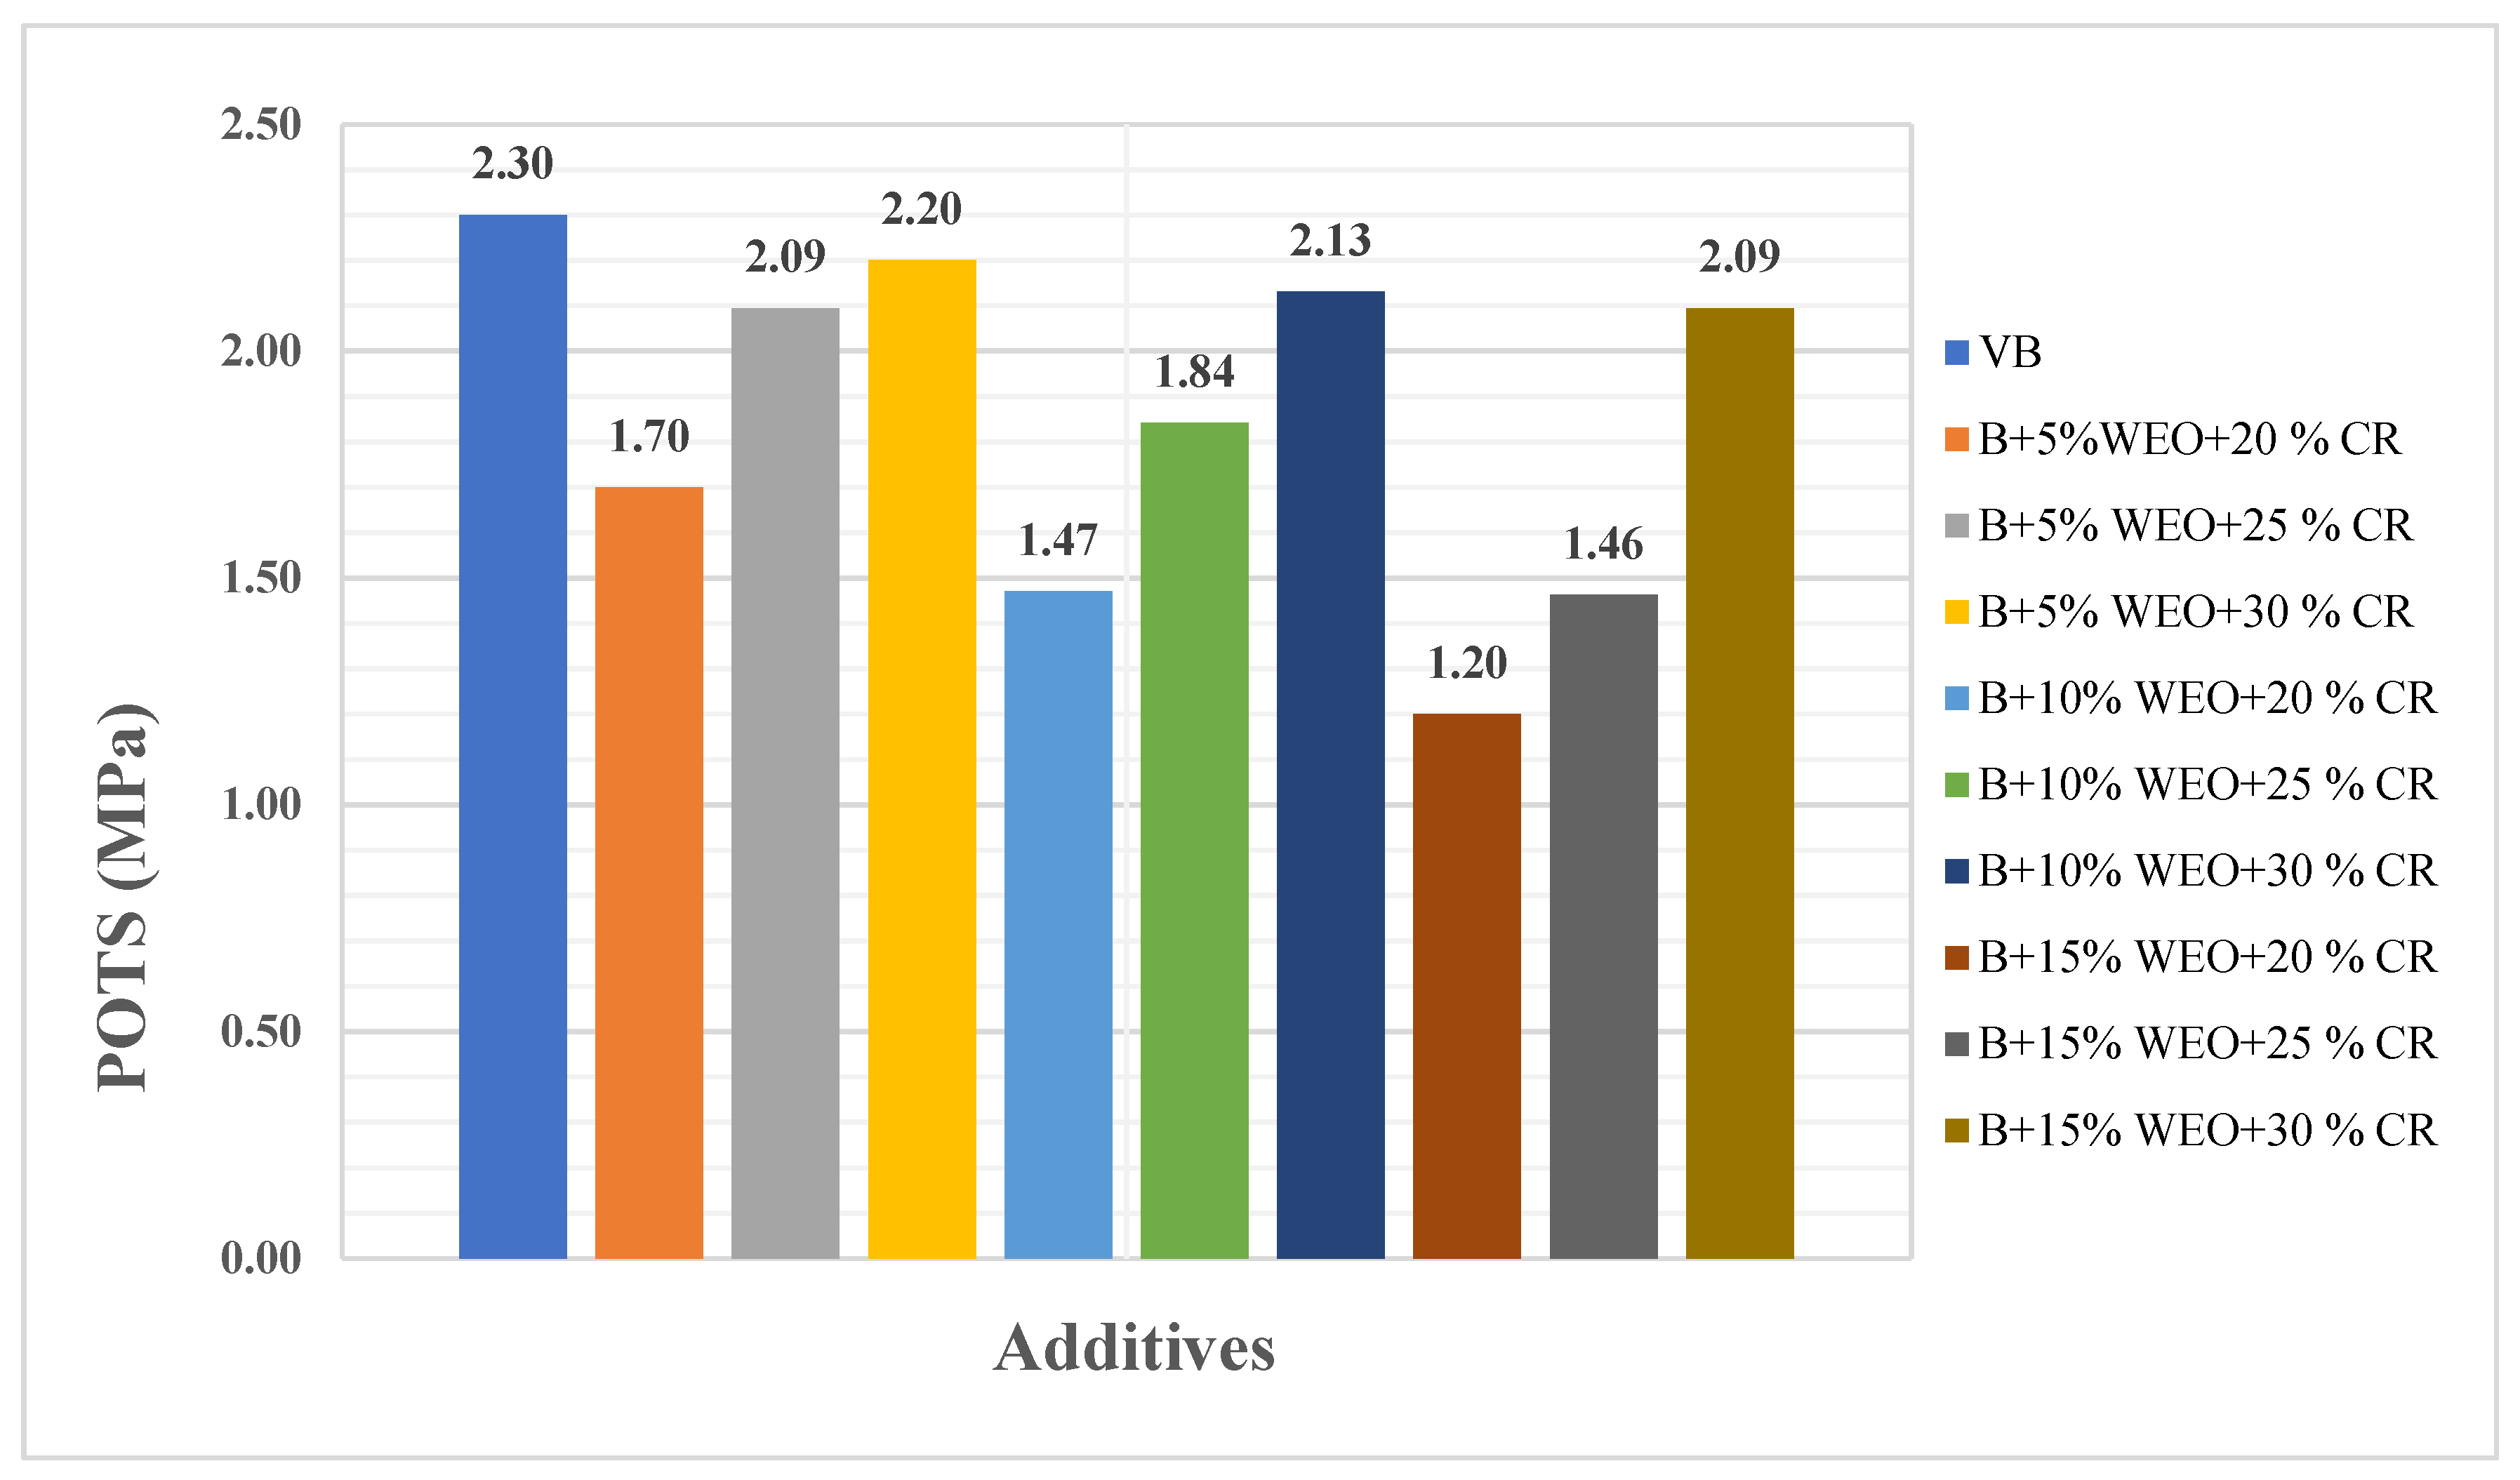
Figure 19.
POTS in Wet Condition of Virgin and PPA Modified Binder.
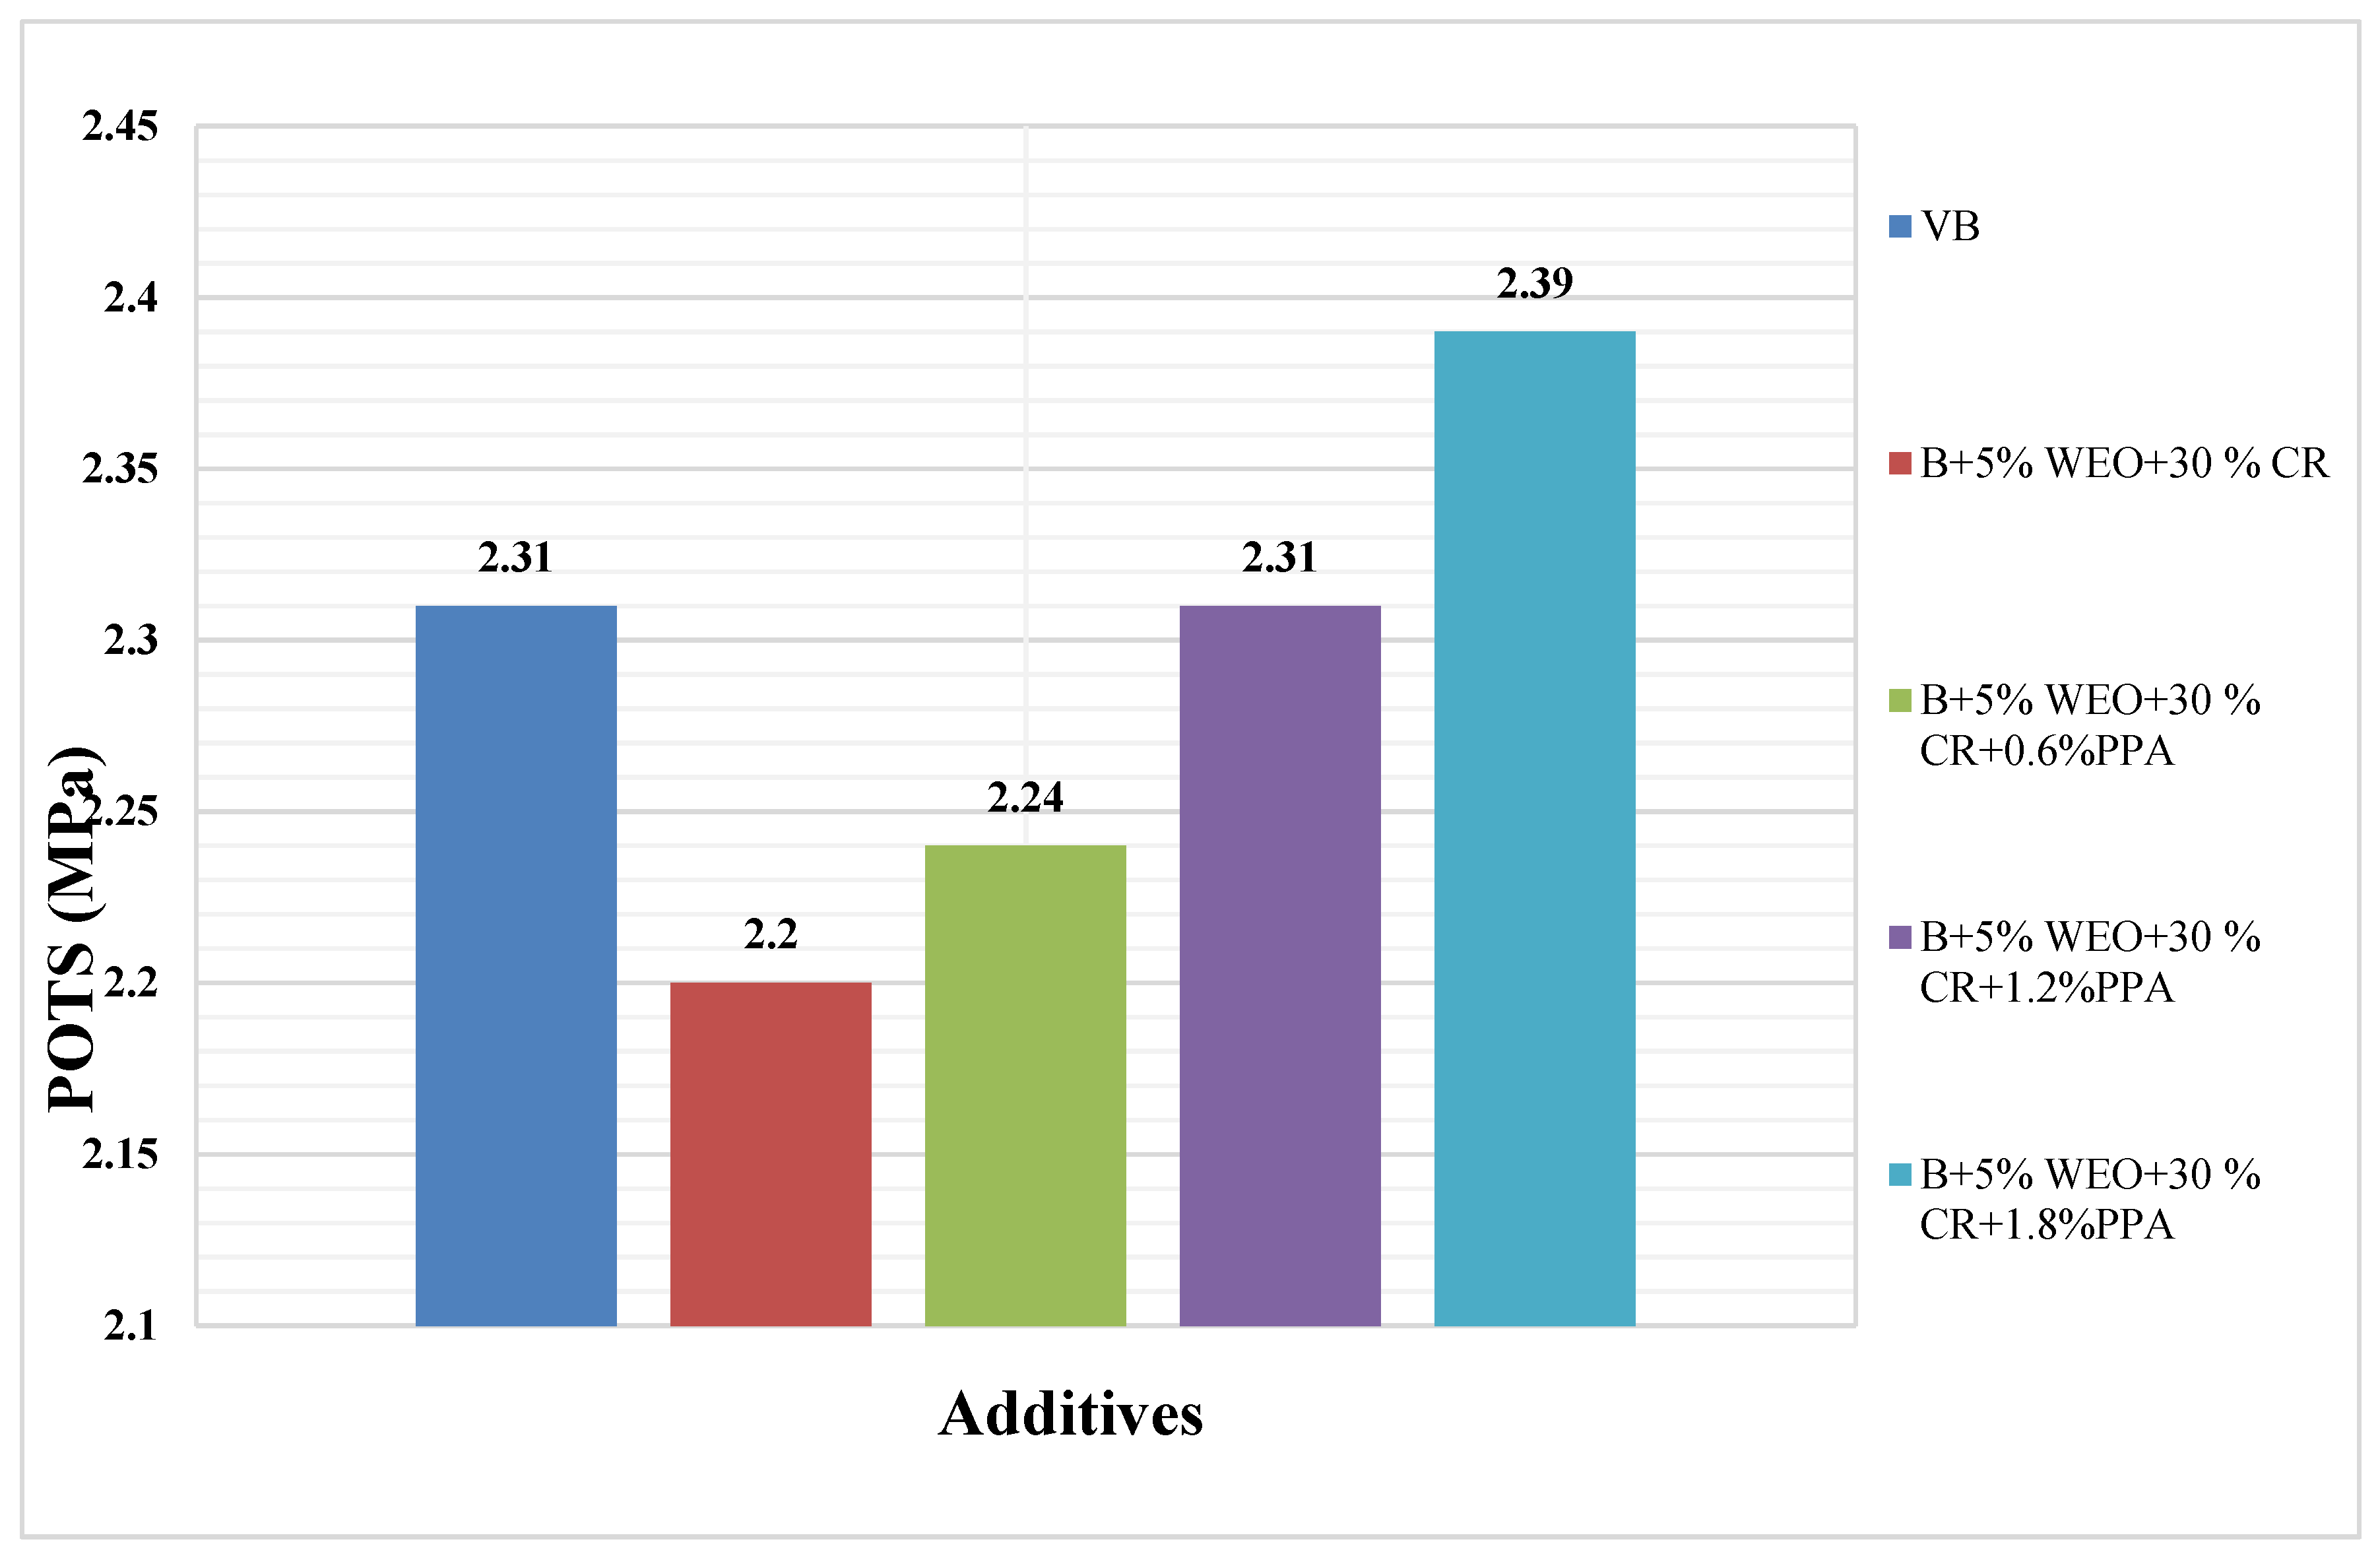

Table 1.
Mixing proportions.
| Sr. No | Dosage |
| 1 | Control blend (B) |
| 2 | B+5% WEO+20% CB |
| 3 | B+5% WEO+25% CB |
| 4 | B+5% WEO+30% CB |
| 5 | B+10% WEO+20% CB |
| 6 | B+10% WEO+25% CB |
| 7 | B+10% WEO+30% CB |
| 8 | B+15% WEO+20% CB |
| 9 | B+15% WEO+25% CB |
| 10 | B+15% WEO+30% CB |
| 11 | B+5% WEO+30% CB+0.6%PPA |
| 12 | B+5% WEO+30% CB+1.2%PPA |
| 13 | B+5% WEO+30% CB+1.8%PPA |
Table 1.
Statistical Analysis of Viscosity.
| Statistical Analysis of Viscosity | |||||||
|---|---|---|---|---|---|---|---|
| Additives | N | Subset at 95% confidence interval | |||||
| 1 | 2 | 3 | 4 | 5 | 6 | ||
| B+15%WEO+20%CR | 3 | 138.2 | |||||
| B+15%WEO+25%CR | 3 | 166.9 | |||||
| B+15%WEO+30%CR | 3 | 174.6 | |||||
| B+10%WEO+20%CR | 3 | 189.2 | |||||
| B+10%WEO+25%CR | 3 | 211.6 | |||||
| B+10%WEO+30%CR | 3 | 248.5 | |||||
| Sig. | 1.000 | 1.000 | 1.000 | 1.000 | 1.000 | 1.000 | |
| Additives | N | Subset at 95% confidence interval | |||||
| 7 | 8 | 9 | 10 | 11 | 12 | ||
| B+5%WEO+20%CR | 3 | 263 | |||||
| B+5%WEO+25%CR | 3 | 268.5 | |||||
| B+5%WEO+30%CR | 3 | 274.7 | |||||
| B+5% WEO+30 % CR+0.6%PPA | 3 | 284 | |||||
| B+5% WEO+30 % CR+1.2%PPA | 3 | 292 | |||||
| Virgin Binder | 3 | 294.7 | |||||
| B+5% WEO+30 % CR+1.8%PPA | 3 | 299 | |||||
| Sig. | 1.000 | 1.000 | 1.000 | 1.000 | 1.000 | 1.000 | |
Table 2.
Statistical Analysis of Complex Modulus.
| Statistical Analysis of Complex Modulus | |||||||
|---|---|---|---|---|---|---|---|
| Additives | N | Subset at 95% confidence interval | |||||
| 1 | 2 | 3 | 4 | 5 | 6 | ||
| B+15%WEO+20%CR | 3 | 147.65 | |||||
| B+15%WEO+25%CR | 3 | 167.34 | |||||
| B+10%WEO+20%CR | 3 | 189.47 | |||||
| B+15%WEO+30%CR | 3 | 191.95 | |||||
| B+5%WEO+20%CR | 3 | 207.96 | |||||
| B+10%WEO+25%CR | 3 | 218.87 | |||||
| B+5%WEO+25%CR | 3 | 246.41 | |||||
| Sig. | 1.00 | 1.00 | 1.00 | 1.00 | 1.00 | 1.00 | |
| Additives | N | Subset at 95% confidence interval | |||||
| 7 | 8 | 9 | 10 | 11 | 12 | ||
| B+10%WEO+30%CR | 3 | 283.65 | |||||
| B+5%WEO+30%CR | 3 | 317.76 | |||||
| Virgin Binder | 3 | 353.72 | |||||
| B+5% WEO+30 % CR+0.6%PPA | 3 | 787.36 | |||||
| B+5% WEO+30 % CR+1.2%PPA | 3 | 1130.91 | |||||
| B+5% WEO+30 % CR+1.8%PPA | 3 | 2170.85 | |||||
| Sig. | 1.00 | 1.00 | 1.00 | 1.00 | 1.00 | 1.00 | |
Table 3.
Statistical Analysis of Moisture Susceptibility.
| Statistical Analysis of Moisture Susceptibility | ||||||
|---|---|---|---|---|---|---|
| Additives | N | Subset at 95% confidence interval | ||||
| 1 | 2 | 3 | 4 | 5 | ||
| B+15%WEO+20%CR | 3 | 1.3 | ||||
| B+10%WEO+20%CR | 3 | 1.57 | ||||
| B+15%WEO+25%CR | 3 | 1.775 | ||||
| B+10%WEO+25%CR | 3 | 2.180 | ||||
| B+15%WEO+30%CR | 3 | 2.305 | 2.305 | |||
| B+5%WEO+20%CR | 3 | 2.423 | ||||
| Sig. | 1.000 | 1.000 | 1.000 | 1.000 | 1.000 | |
| Additives | N | Subset at 95% confidence interval | ||||
| 6 | 7 | 8 | 9 | |||
| B+10%WEO+30%CR | 3 | 2.64 | ||||
| B+5%WEO+25%CR | 3 | 2.83 | ||||
| B+5%WEO+30%CR | 3 | 3.305 | ||||
| B+5% WEO+30 % CR+0.6%PPA | 3 | 3.445 | 3.445 | |||
| B+5% WEO+30 % CR+1.2%PPA | 3 | 3.622 | 3.620 | |||
| Virgin Binder | 3 | 3.70 | ||||
| B+5% WEO+30 % CR+1.8%PPA | 3 | 3.80 | ||||
| Sig. | 0.079 | 0.444 | 0.144 | 0.119 | ||
Disclaimer/Publisher’s Note: The statements, opinions and data contained in all publications are solely those of the individual author(s) and contributor(s) and not of MDPI and/or the editor(s). MDPI and/or the editor(s) disclaim responsibility for any injury to people or property resulting from any ideas, methods, instructions or products referred to in the content. |
© 2023 by the authors. Licensee MDPI, Basel, Switzerland. This article is an open access article distributed under the terms and conditions of the Creative Commons Attribution (CC BY) license (http://creativecommons.org/licenses/by/4.0/).
Copyright: This open access article is published under a Creative Commons CC BY 4.0 license, which permit the free download, distribution, and reuse, provided that the author and preprint are cited in any reuse.


