Submitted:
10 August 2023
Posted:
11 August 2023
You are already at the latest version
Abstract
An empirical investigation was carried out to study the relationship between the soil characteristics, including the Nitrogen (N), Phosphorus (P), Potassium (K), potential of Hydrogen (pH), Electrical conductivity (EC), Sulfur (S,), Zinc (Zn), Iron (Fe), Copper (Cu), Manganese (Mn) and Boron (B) using principal component analysis (PCA), Factor Analysis (FA), and Canonical Correlation analysis (CCA) for data reduction multivariate techniques. The first five main components accounted for 24.22%, 18.52%, 16.1%, 9.97%, and 9.27% of sample variances, respectively. All five principal components (PCs) accounted for 78.07% of the sample variance. The soil characteristics viz., P and K have highly dominated the first PC; the soil characteristics N and pH have dominated the second PC; K, EC, and Cu have dominated the third PC; Fe, Mn, and pH have dominated in the fourth PC; whereas the parameter Cu dominated the fifth PC. The first factor showed a strong negative loading on S and a strong favorable loading on Cu; P, K, and EC have substantial positive loadings in the second factor. Significant positive loadings on Mn, Fe, Cu, pH, N, and K are present in the third component. The fourth factor had a significantly positive pH, Fe, N, P, K, and B loadings. Fe, P, and B have much weight in the fifth factor. The soil characteristics viz., N, Zn, pH, K, Fe, and Mn have dominated the first PC; the soil characteristics B, P, S, Zn, and Fe have dominated the second PC; B and P have dominated the third PC whereas the only character Cu dominated the fourth PC. Cu and OC have much weight in the fourth factor. The canonical redundancies for dependent and independent sets are 12% and 17%, respectively. The Stewart-Love canonical redundancy index is 70.58%, which means that the first linear combination of the X-set explains 70.58% of the total variance in the Y-set.
Keywords:
Kaiser-Meyer-Olkin Test
; Pearson correlation
; Eigenvalue
; Score plot
; PCA
; FA
; CCA
1. Introduction
Soil is the most essential part of farming. Therefore, one should know a lot about soil characteristics before agriculture. The crop needs nutrients in large amounts. Nitrogen (N), Phosphorus (P), and Potassium (K) are the three primary nutrients. They combine to form the group known as NPK. The nutrients calcium, magnesium, and sulfur are also essential. Additionally, plants require trace elements, including iron, manganese, zinc, copper, boron, and molybdenum, which are tiny quantities that the plant only needs in trace amounts. It is complicated how these minerals affect plant development. Therefore, selecting a particular crop for the existing soil is very important. Studying nutrient patterns in the soil is very important, and these studies involve more multivariate current variables. When more variables are involved in the study, variables may be correlated; hence, some information would be redundant. Hence data reduction techniques are essential to reduce the data dimensionality. Principal component analysis and factor analysis help to eliminate the less important variables that do not make a big difference [1]. According to [2,3], PCA may distinguish various agricultural plots and identify the essential soil factors that characterize them.
2. Review of literature
Factor analysis was employed by [4] to exploit the correlation structure in a data set containing 11 highly correlated soil variables to group the variables into three uncorrelated factors for assessing soil and shrub effects on nutrient distribution patterns in a chaparral ecosystem. Based on factor loadings and the analysis of factor scores, shrub live oak appeared to directly influence the distribution of organic C, total N, bicarbonate-extractable P, and soil pH. Shrub live oak indirectly influenced the distribution of exchangeable K by affecting the distribution of fine soil particles. The exchangeable Ca, Mg, and CEC distribution was not influenced by shrub live oak in these soils but by soil morphological characteristics. However, the cycling of different interchangeable bases is plant species-specific, and their distribution may be strongly influenced by the presence of shrubs in other ecosystems.
Factor analysis of soil nutrient distribution patterns under Chir, Teak, Eucalyptus, Shisham, and Khair in Mussoorie Forest Division (U.P) was studied. It was done to identify underlying factors responsible for the correlation among nutrients under five plantations. Eigenvalues for the first four factors were >0.90 and accounted for 77 percent of the total variation in the soil supporting the five plantations. The four models explained >90 percent of the variance in the phosphorus; 85 percent of the conflict in the organic matter and available nitrogen; and >70 percent of the variance in the total nitrogen, total potassium, and
In the Mussoorie forest division, [5]used factor analysis to determine how soil nutrients were distributed among the chir, Teak, Eucalyptus, Shisham, and Khair trees. Eigenvalues for the first four factors were >0.90, accounting for 77% of the total variation in the soil supporting the five plantations.
The Canonical Correlation study of three character sets containing 23 variables of Jinghai yellow chicken was carried out by [6]. Significant solid correlations were obtained between body weight and body measurement characters (0.9153), body measurement, and carcass characteristics (0.9618). The coefficients represented 98.46%, 98.96%, and 92.82% of the correlation between the two character sets.
Using the Principal Component Analysis technique, [7] applied factor analysis to soil test data to reduce and summarize soil variables. Principal component analysis was highly suggestive in analyzing soil test data on which a rational fertilizer nutrients recommendation can be made for sustainable soil fertility management.
Similarities and differences between exploratory factor analysis (EFA) and principal component analysis (PCA) were discussed by [8]. PCA retained accounts for a maximal amount of variance of observed variables, while factors account for common variance in the data. The author also explained that PCA decomposes the correlation matrix while EFA decomposes the adjusted correlation matrix.
The Haringhata Black chickens dataset was utilized in [9] investigation into principal component analysis to determine which component was most effective in describing the morphological structure. Four main features were extracted, explaining 77.17% of the total variation in the original variables. PC1 and PC2 have the most significant share of 47.15% and 13.54% of the total variance described.
A tool for doing PCA in the R environment was created by [10]; the example uses a simulated dataset with two PCs accounting for most of the variation. Additionally, the PCA visualization is emphasized.
Principal component analysis was carried out [11] on the body morphometric of three genetic stocks of Nigerian indigenous chickens reared intensively under the southern guinea savanna condition of Nigeria. For PCA, two main components are extracted (PC1 and PC2). PC1 and PC2 contribute 83.14% of the total variance while PC1 accounts for 65.44% of the total variance. The screen plot indicates that only the first two components have eigenvalues greater than 1.
A canonical Correlation tool was applied [12] to layer data to estimate the relationships of egg production with age at sexual maturity, body weight, and egg weight. The number of eggs produced during the different weeks is highly negatively correlated with age at sexual maturity; positively correlated with body weight at the 12th and 16th weeks. The canonical correlation between the first pair of canonical variates is found to be significant (p < 0.01), and the remaining canonical correlations are not statistically significant (p > 0.05). The proportion of the variance for Y-set and X-set variables accounted for by the first canonical variate is 73.58% and 33.06%, respectively. The redundancy coefficient for Y-set given X-set is 33.99%.
Canonical relationships between different commodities stock price indexes have been investigated [13] using the monthly nominal commodities of Canara Gold Futures, HDFC Gold Futures, Axis Gold Futures, and monthly values of Gold Futures and Crude Oil Futures prices for the period of April 2012 to August 2018. The first Canonical correlation is found to be highly significant. The proportion of the variance of Y set and X set variables accounted for the first canonical variate is 95.76%. The redundancy coefficient for the Y set given the X set is 65.78%.
Multivariate statistics, such as cluster analysis (CA), principal component analysis (PCA), correlation analysis (CA), and discriminant analysis (DA), was used [14] to analyze the physical-chemical properties of soil in the selected locations of the floodplain of River Kaduna In Niger State state.
3. Data Description
The data on eleven soil characteristics, including Nitrogen (N, Kg/Ha), Phosphorus (P, Kg/Ha), Potassium (K, Kg/Ha), potential of Hydrogen (pH, Acidity level), Electrical conductivity (EC, dS/m), Sulfur (S, %), Zinc (Zn, ppm), Iron (Fe, ppm), Copper (Cu, ppm), Manganese (Mn, ppm) and Boron (B, ppm) based on six crops, Mango, Grapes, Mulberry, Ragi, Potato. There are 620 soil samples from standardized information about the crop nutrient values in India.
4. Methods
Three different multivariate statistics, such as Canonical correlation analysis (CA), principal component analysis (PCA), and factor analysis, were performed in the soil nutrients dataset.
4.1. Variance Inflation factor
When the independent variables are correlated, the variance inflation factor calculates how much the predicted regression coefficient's variance is inflated. VIF is determined as
where the tolerance is simply the inverse of the VIF, with decreasing tolerance, the risk of multicollinearity among the variables rises. There is no association between the independent variables when VIF=1. A very high correlation between the variables is indicated if the value of VIF is 1 to 5. According to [15,16], there will be multicollinearity among the predictors in the regression model if the VIF value is above 5. Another one is the Pearson correlation matrix method, which signifies the linear relationship between pairs of independent variables. The correlation coefficient is calculated using the formula:
where X represents the first variable in the context, Y is the second variable in the context, n is the number of observations, and r is the correlation coefficient. Collinearity may be possible if the pair-wise variables have a higher correlation coefficient value [17].
4.2. Kaiser-Meyer-Olkin (KMO) Test for Sampling Adequacy
The Kaiser-Meyer-Olkin test for factor analysis was developed by [18] in the late 1950s. Then, in 1974, it was modified by [19] Kaiser and Rice. How well-suited the data are for factor or principal component analysis is determined by the KMO test. The test examines whether sampling is adequate for the entire model and individual variables.
The test statistic can be calculated using the values that the KMO criteria return, which range from 0 to 1.
KMO values of 0.00 to 0.49 are considered unacceptable, 0.50 to 0.59 are considered wretched, 0.60 to 0.69 are considered mediocre, 0.70 to 0.79 are considered moderate, 0.80 to 0.89 are considered meritorious (sufficient), and 0.90 to 1.00 are considered marvelous. KMO values close to zero indicate partial correlations significantly more significant than the sum of correlations.
4.3. Bartlett’s Test of Sphericity
Bartlett’s test of Sphericity statistic was established by [20] to assess the viability of a correlation matrix for a data reduction approach. The test's null hypothesis is the variables' orthogonality, or lack of correlation. The alternative view is that the variables are not orthogonal, i.e., sufficiently combined such that the identity matrix and correlation matrix considerably deviate from one another. The statistic will be given by and is roughly Chi-square distributed df.= p(p-1).
where N is the sample size, p is the number of variables, and det(R) is the correlation matrix's determinant.
The dataset is appropriate for a data reduction strategy if the p-value from Bartlett's Test of Sphericity is less than our chosen significance level (popular options are 0.10, 0.05, and 0.01). For this test, multivariate normality is necessary. The Kaiser-Meyer-Olkin criterion (KMO) can still be applied if this prerequisite is not satisfied.
4.4. Principal Component Analysis (PCA)
Pearson created PCA in 1901; Harold Hotelling later independently improved it and gave it its name in 1933 [21].
The PCA is frequently employed to minimize the dimensionality of the data and will reveal more information than element distribution; it was chosen as the investigating method. Because the study's variables were correlated, PCA is the best technique to show the data set's variability. The subsequent parts explain the various statistical methods used to analyze empirical data.
Principal component analysis (PCA) involves a mathematical procedure that transforms several (possibly) correlated variables X1, X2, X3, …, XP into a (smaller) number of uncorrelated variables (Y1, Y2, Y3, …, Yp) called principal components, which are uncorrelated with each other and account for decreasing proportions of the total variance of the original variables defined as :
with the coefficients being chosen so that Y1, Y2, Y3, …, Yp account for the maximum variance of the total variance of the original variables X1, X2, X3, …, XP
The first principal component accounts for as much of the variability in the data as possible, and each succeeding component accounts for as much of the remaining variability as possible. There are three standard criteria to select the number of principal components; the eigenvalue criterion, the proportion of variance explained criterion, and the Scree plot criterion. More details on PCA can be found in [22,23,24].
4.5. Scree plot
The Scree test is a method for utilizing a Scree plot to identify variables or components that are statistically significant [25]. A Scree Plot is a simple line segment plot that depicts each PC's eigenvalues. It displays the number of components on the x-axis and the eigenvalues on the y-axis. It consistently shows a declining slope. The majority of scree plots have a form that is essentially the same: they begin high to the left, drop swiftly, and then eventually flatten out. This is because the first component usually accounts for most of the variability, the following components describe a sizable fraction, and the final piece only accounts for a tiny amount of the overall variability. The scree plot criterion locates the "elbow" in the curve just before the line flattens out to select all components.
4.6. Factor Analysis
In that it is a method for analyzing the connections between a group of variables, factor analysis is comparable to principal component analysis [26]. In contrast to regression analysis, neither of these approaches has a dependent variable that a collection of independent factors can explain. However, there are other differences between PCA and FA. A group of variables X1, X2, ..., and Xp are used to start a factor analysis.
The software application will typically standardize these variables such that their variances equal one and their covariances are correlated coefficients. We assume that xi is a standardized variable, i.e., the xi's are the Original or response variables in factor analysis. Each variable is represented by factor analysis as a linear combination of a smaller set of common factors and a factor specific to each response variable. This representation expressed as
4.7. Canonical Correlation
A multivariate analytical technique called canonical correlation analysis (CCA) examines correlations between two or more variables. We constructed Ui and Vi linear combinations of canonical vectors for major and micronutrients.
Canonical correlation is the relationship between Ui and Vi (Ci). The squared canonical correlation (canonical roots or Eigenvalues) represents the variation in one canonical variate that is accounted for by the other variate [27].
5. Results and Discussion
The Pearson correlations between the study variables' soil characteristics have been calculated, as depicted in Figure 1. The result reveals that Mn is positively correlated with Cu and highly negatively correlated with P and K. pH is positively correlated with Fe, whereas OC is positively correlated with Zn. N is negatively correlated with K, Fe, and Mn, whereas P is entirely and highly associated with K and negatively correlated with Mn. N is negatively correlated with EC and B and positively correlated with pH, whereas K is positively correlated with pH and EC. B is positively correlated with Zn and P and negatively correlated with Cu, K, N, pH, EC, and Mn.
5.1. Variance inflation factor
Detecting multicollinearity is essential because while multicollinearity does not reduce the explanatory power of the model, it does reduce the statistical significance of the independent variables. The results presented in Table 1 reveal that as the Variance inflation factor is less than 5, The Linear regression of VIF proved that there is no strong correlation between the multiple soil parameters or that all the parameters are independent.
5.2. Principal Component Analysis
KMO and Bartlett's tests have been computed and provided in Table 2 to evaluate the suitability of PCA. 0.641 is the KMO test statistic value. Compared to the sum of correlations, partial correlations are hence tiny. 64% of the analysis's variables are combined. This demonstrates that the correlation pattern does not exhibit diffusion. The PCA is, therefore, appropriate in this situation. Because Bartlett's test p-value is significant and the approximate Chi-Square value obtained is 2067.48, it can be concluded that the correlation matrix is not an identity matrix. This shows that there is a strong correlation between the variables. Therefore, PCA is suitable for this type of data. Consequently, these two test statistics attest to relationships among the various soil parameters.
The number of eigenvalue values greater than one determines the number of significant components. The first five principal components have been taken into account because it is evident from the Scree plot (Figure 2) that there are five eigenvalues with values greater than one.
PCA was employed, and the outcomes are shown in Table 3. There are eleven primary components because the data included eleven soil properties: five principal components (Figure 3), each with Eigen values over one. The eigenvalue of the first principal component, 2.27, can explain 24.22% of the total variance, the eigenvalue of the second component, 2.04, can explain 18.52% of the total sample variance, the eigenvalue of the third component, 1.18, can explain 16.1% of the total sample variances, the eigenvalue of the fourth component, 1.10, can explain 9.97%, and the eigenvalue of the fifth component, 1.02, can explain 9.27%. Together, the five main features account for 78.02% of the variance in the entire sample.
The graphs (Figure 4a–e) describe the loadings of each soil attribute on five separate principal components. Cu and Mn have strong negative correlations with the first principal component; P, K, EC, and B have strong positive correlations. EC and B are adversely connected with the second main component; N, pH, and Fe are all positively correlated. EC, K, and Cu have a strong positive correlation to the third principal component; B, Zn, and Fe have a strong negative correlation. Zn is negatively connected with the fourth central component; Fe, Mn, pH, and Cu are positively correlated. Cu is significantly negatively associated with the fifth principal component, and S detected a very high negative correlation. Therefore, each of the five primary components positively relates to pH.
The five principal components, PC1, PC2, PC3, PC4, and PC5, collectively account for 78.07% of the variation in the entire sample. It is frequently recommended to standardize the scores to the variance of one. The standard scores are fresh variables that could be employed in further investigations. It has reduced this data complexity without sacrificing much information because the five new variables account for 78.07% of the sample variance across the original 11 soil attributes.
The score plot in Figure 5 shows the locations of the items in the multivariate space of the first two main component score vectors. The scores are mainly separated into two groups. However, these two groups exhibit a unique diversity. P, K, Zn, and B contributed more too positively influenced because their vector length in the score plot was longer in the PC1, and Mn contributed highly negatively. Each color represents the six different crops, and the outside dots of the circle represent the outliers.
5.3. Factor Analysis
The computed eigenvalues and corresponding factors were calculated and presented in Table 4 for the given soil data.
On the recommendation of [19], only the factors with eigenvalues greater than unity were retained. This implies that only the top five factors from Table 4 were considered. These five variables explained over 78.07% of the variation in the sample's overall variance. The five components were extracted and rotated using the Varimax technique to obtain a distinct and predictable pattern of variation. Loadings of each soil characteristic on five different factors were described using the graphs (Figure 6a–e). S and EC are highly positively correlated; Cu, Fe, and N parameters negatively connect with the first Factor. Mn, pH, Fe, and EC correlate positively, whereas P, K, and EC correlate positively with the second factor. Cu, Fe, Mn, pH, N, and K are highly positive with the third factor. In the fourth factor, pH, Fe, N, P, K, and B observed a positive correlation with the fourth factor. Finally, Fe, B, P, EC, Mn, and Cu are highly positively correlated; Zn, N, and pH negatively correlate with the fifth factor.
5.4. Canonical Correlation
The general fit of the model reporting Pillai's, Helling's, and Wilk's multivariate criteria are shown in Table 5. Wilk's lambda is a frequently used test, yet in the table below, all of these tests have significance levels of p> 0.05. A specific test statistic's F-value and p-value are shown in the table.
From Table 6, the first four canonical correlations are highly significant (p<0.01) from the likelihood ratio tests. The remaining canonical correlation is not statistically significant (p>0.05). The squared canonical correlation reveals that 43%, 40%, and 29% of the variation in U1, U2, and U3 is explained by V1, V2, and V3 variation.
The result presented in Table 7 reveals that the first canonical function represents 16.58% of the variance in independent variables and 13.45% in separate variables. The second function represents 22.59% of the conflict in the independent variables and 6.63% in the dependent variables.
Ri2=(Y/X) = 70.58%.
The standardized canonical weights and loadings estimated for Y-set and X-set associated with the first highly significant canonical correlation are given in Table 8.
The first pair of canonical variates is given by
V1 = 0.90S + 0.53Cu + 0.17Fe + 0.83Mn + 0.91Zn + 0.04B
U1 = 0.10N + 0.84P + 0.87K + 0.30pH + 0.20EC
The canonical variate for the criterion set is almost entirely determined by K (0.87) and P (0.84) as it has the highest canonical weights. Similarly, the enormous canonical consequences of Zn (0.91) and S (0.90) are more critical in determining the canonical variate for the predictor set. Inspection of Canonical loadings reveals that all the Major nutrients N, P, K, pH, and EC positively correlate with the canonical variate V1. Similarly, the micronutrients have a positive loading with the canonical loading U1.
The proportion of the variance for Y-set and X-set variables accounted for by the first canonical variate is 12% and 17%, respectively. The redundancy coefficient for Y-set given X-set is 70.58%. Thus, 70.58% of the total variance of the Y-set is explained by the first linear combination of the X-set, or the predictor variables explain 70.58% of the total variability in criterion variables. Figure 7 illustrates that comparing rotated and un-rotated structures and canonical coefficients implies that both solutions are equivalent. Equivalence between rotated and un-rotated solutions suggests that these data have a simple design and that the current canonical correlation has identified this structure. The canonical correlation of soil major and Micronutrient content is 90.57%.
6. Conclusion
The Pearson correlation matrix and variance inflation factors are identified all the soil parameters are independent. The first five principal components (PCs) accounted for 24.22%, 18.52%, 16.1%, 9.97%, and 9.27% of sample variances, respectively. All five PCs together accounted for 78.07 % of the total sample variance. The soil characteristics viz., P and K have highly dominated the first PC; the soil parameters N and pH have dominated the second PC; K, EC, and Cu have dominated the third PC; Fe, Mn, and pH have dominated in the fourth PC; whereas the parameter Cu dominated the fifth PC. The first factor in the factor analysis had a significant negative loading on S and a strong positive loading on Cu. P, K, and EC have substantial positive loadings in the second factor. The third component has significantly high positive Mn, Fe, Cu, pH, N, and K loadings. The fourth component had a very positive pH, Fe, N, P, K, and B loadings. The fifth component had Fe, P, and B have significant positive loadings, and N and Zn are negative loadings based on the overall results concerning different analyses. The canonical redundancies for dependent and independent sets are 12% and 17%, respectively. The Stewart-Love canonical redundancy index value is 70.58% indicating that the first linear combination of the X-set explains 70.58% of the total variance of the Y-set. PCA, FA, and CCA proved to be handy methods for identifying the most influential variables and quickly pointing out the relationships among them. This implies that soil nutrients are the most valuable factors or components considered in the collected dataset and control of crops.
Funding
This research received no external funding.
Institutional Review Board Statement
Not applicable.
Informed Consent Statement
Not applicable.
Data Availability Statement
The data presented in this study is openly available in Kaggle at. https://www.kaggle.com/datasets/manikantasanjayv/crop-recommender-dataset-with-soil-nutrients.
Conflicts of Interest
The authors declare no conflict of interest.
References
- Wilks, D. S. Statistical Methods in the Atmospheric Sciences, New York. International Geophysics Series 2006.
- Sena, M. M.; Frighetto, R. T. S.; Valarini, P. J.; Tokeshi, H.; Poppi, R. J. Discrimination of Management Effects on Soil Parameters by Using Principal Component Analysis: A Multivariate Analysis Case Study. Soil Tillage Res. 2002, 67 (2), 171–181. [CrossRef]
- Salehi, A.; Amiri, G. Z. Study of Physical and Chemical Soil Properties Variations Using Principal Component Analysis Method in the Forest, North of Iran. Caspian J. Env. Sci 2005, 3 (2), 131–137.
- Brejda, J. J. Factor Analysis of Nutrient Distribution Patterns under Shrub Live-Oak in Two Contrasting Soils. Soil Sci. Soc. Am. J. 1998, 62 (3), 805–809. [CrossRef]
- Jha, M. N.; Gupta, M. K.; Pandey, R. A. J. I. V. Factor Analysis of Soil Nutrient Distribution Pattern under Different Plantations. Indian Forester 2000, 126, 1270–1278.
- Yang, Y.; Mekki, D. M.; Lv, S. J.; Yu, J. H.; Wang, L. Y.; Wang, J. Y.; Dai. Canonical Correlation Analysis of Body Weight, Body Measurement and Carcass Characteristics of Jinghai Yellow Chicken. Journal of Animal and Veterinary Advances 2006.
- Dahal, H. Factor Analysis for Soil Test Data: A Methodological Approach in Environment Friendly Soil Fertility Management. J. Agric. Environ. 2007, 8 (0), 8–19. [CrossRef]
- Jain, P. M.; Shandliya, V. K. A Survey Paper on Comparative Study between Principal Component Analysis (PCA) and Exploratory Factor Analysis (EFA). International Journal of Management, IT, and Engineering 2013, 3 (6), 415–424.
- Saikhom, R.; Sahoo, A. K.; Taraphder, S.; Pan, S.; Sarkar, U.; Ghosh, P. R.; Baidya. Principal Component Analysis of Morphological Traits of Haringhata Black Chickens in an Organized Farm. Exploratory Animal and Medical Research 2018, 8 (1), 64–68.
- Zhang, Z.; Castelló, A. Principal Components Analysis in Clinical Studies. Ann. Transl. Med. 2017, 5 (17), 351. [CrossRef]
- Amao, S. R. Application of Principal Component Analysis on the Body Morphometric of Nigerian Indigenous Chickens Reared Intensively under Southern Guinea Savanna Condition of Nigeria. Journal of Environmental Issues and Agriculture in Developing Countries 2018, 10 (1), 1–12.
- Khokhar, A. N.; Rajarathinam, A. Canonical correlation modeling for egg production traits and body weight, egg weight and age at sexual maturity. Int. J. Agricult. Stat. Sci. 2018, 14 (1), 405-408.
- Manikandan, B.; Rajarathinam, A. Canonical Relationship between Different Commodities Stock Price Index in India. Int. J. Agricult. Stat. Sci 2019, 15 (2), 829–833.
- Onoyima, C. C.; Okibe, F. G. Multivariate Analysis of the Physico-Chemical Properties of Soils in Selected Locations of the Floodplain of River Kaduna in Niger State, Nigeria. Glob. J. Pure Appl. Sci. 2021, 27 (3), 279–288. [CrossRef]
- Goldstein, R. Conditioning Diagnostics: Collinearity and Weak Data in Regression. Technometrics 1993, 35 (1), 85–86. [CrossRef]
- Shrestha, N. Detecting Multicollinearity in Regression Analysis. Am. J. Appl. Math. Stat. 2020, 8 (2), 39–42. [CrossRef]
- Young, D. S. Handbook of Regression Methods; Chapman & Hall/CRC: Philadelphia, PA, 2018.
- Kaiser, H. F. A Second Generation Little Jiffy. Psychometrika 1970, 35 (4), 401–415. [CrossRef]
- Kaiser, H. F.; Rice, J. Little Jiffy, Mark Iv. Educ. Psychol. Meas. 1974, 34 (1), 111–117. [CrossRef]
- Bartlett, M. S. The Effect of Standardization on a χ 2 Approximation in Factor Analysis. Biometrika 1951, 38 (3/4), 337. [CrossRef]
- Hotelling, H. Analysis of a Complex of Statistical Variables into Principal Components. J. Educ. Psychol. 1933, 24 (6), 417–441. [CrossRef]
- Dunteman, G. H. Principal Components Analysis; SAGE Publications: Thousand Oaks, CA, 1989.
- Johnson, R. A.; Wichern, D. W. Applied Multivariate Statistical Analysis. Biometrics 1998, 54 (3), 1203. [CrossRef]
- Everitt, B.; Landau, S.; Leese, M. Cluster Analysis. A; Hodder Arnold Publication. Willey: London, 2001.
- Cattell, R. B. The Scree Test for the Number of Factors. Multivariate Behav. Res. 1966, 1 (2), 245–276. [CrossRef]
- Afifi, A.; May, S.; Clark, V. A. Practical Multivariate Analysis; Chapman and Hall/CRC, 2011.
- Hair, J. F.; Black, W. C.; Babin, B. J.; Anderson, R. E.; Tatham, R. L. Multivariate Data Analysis: Upper Saddle River, Multivariate Data Analysis. ) Upper Saddle River 1998, 5 (3), 207–219.
Figure 1.
Pearson Correlation matrix.
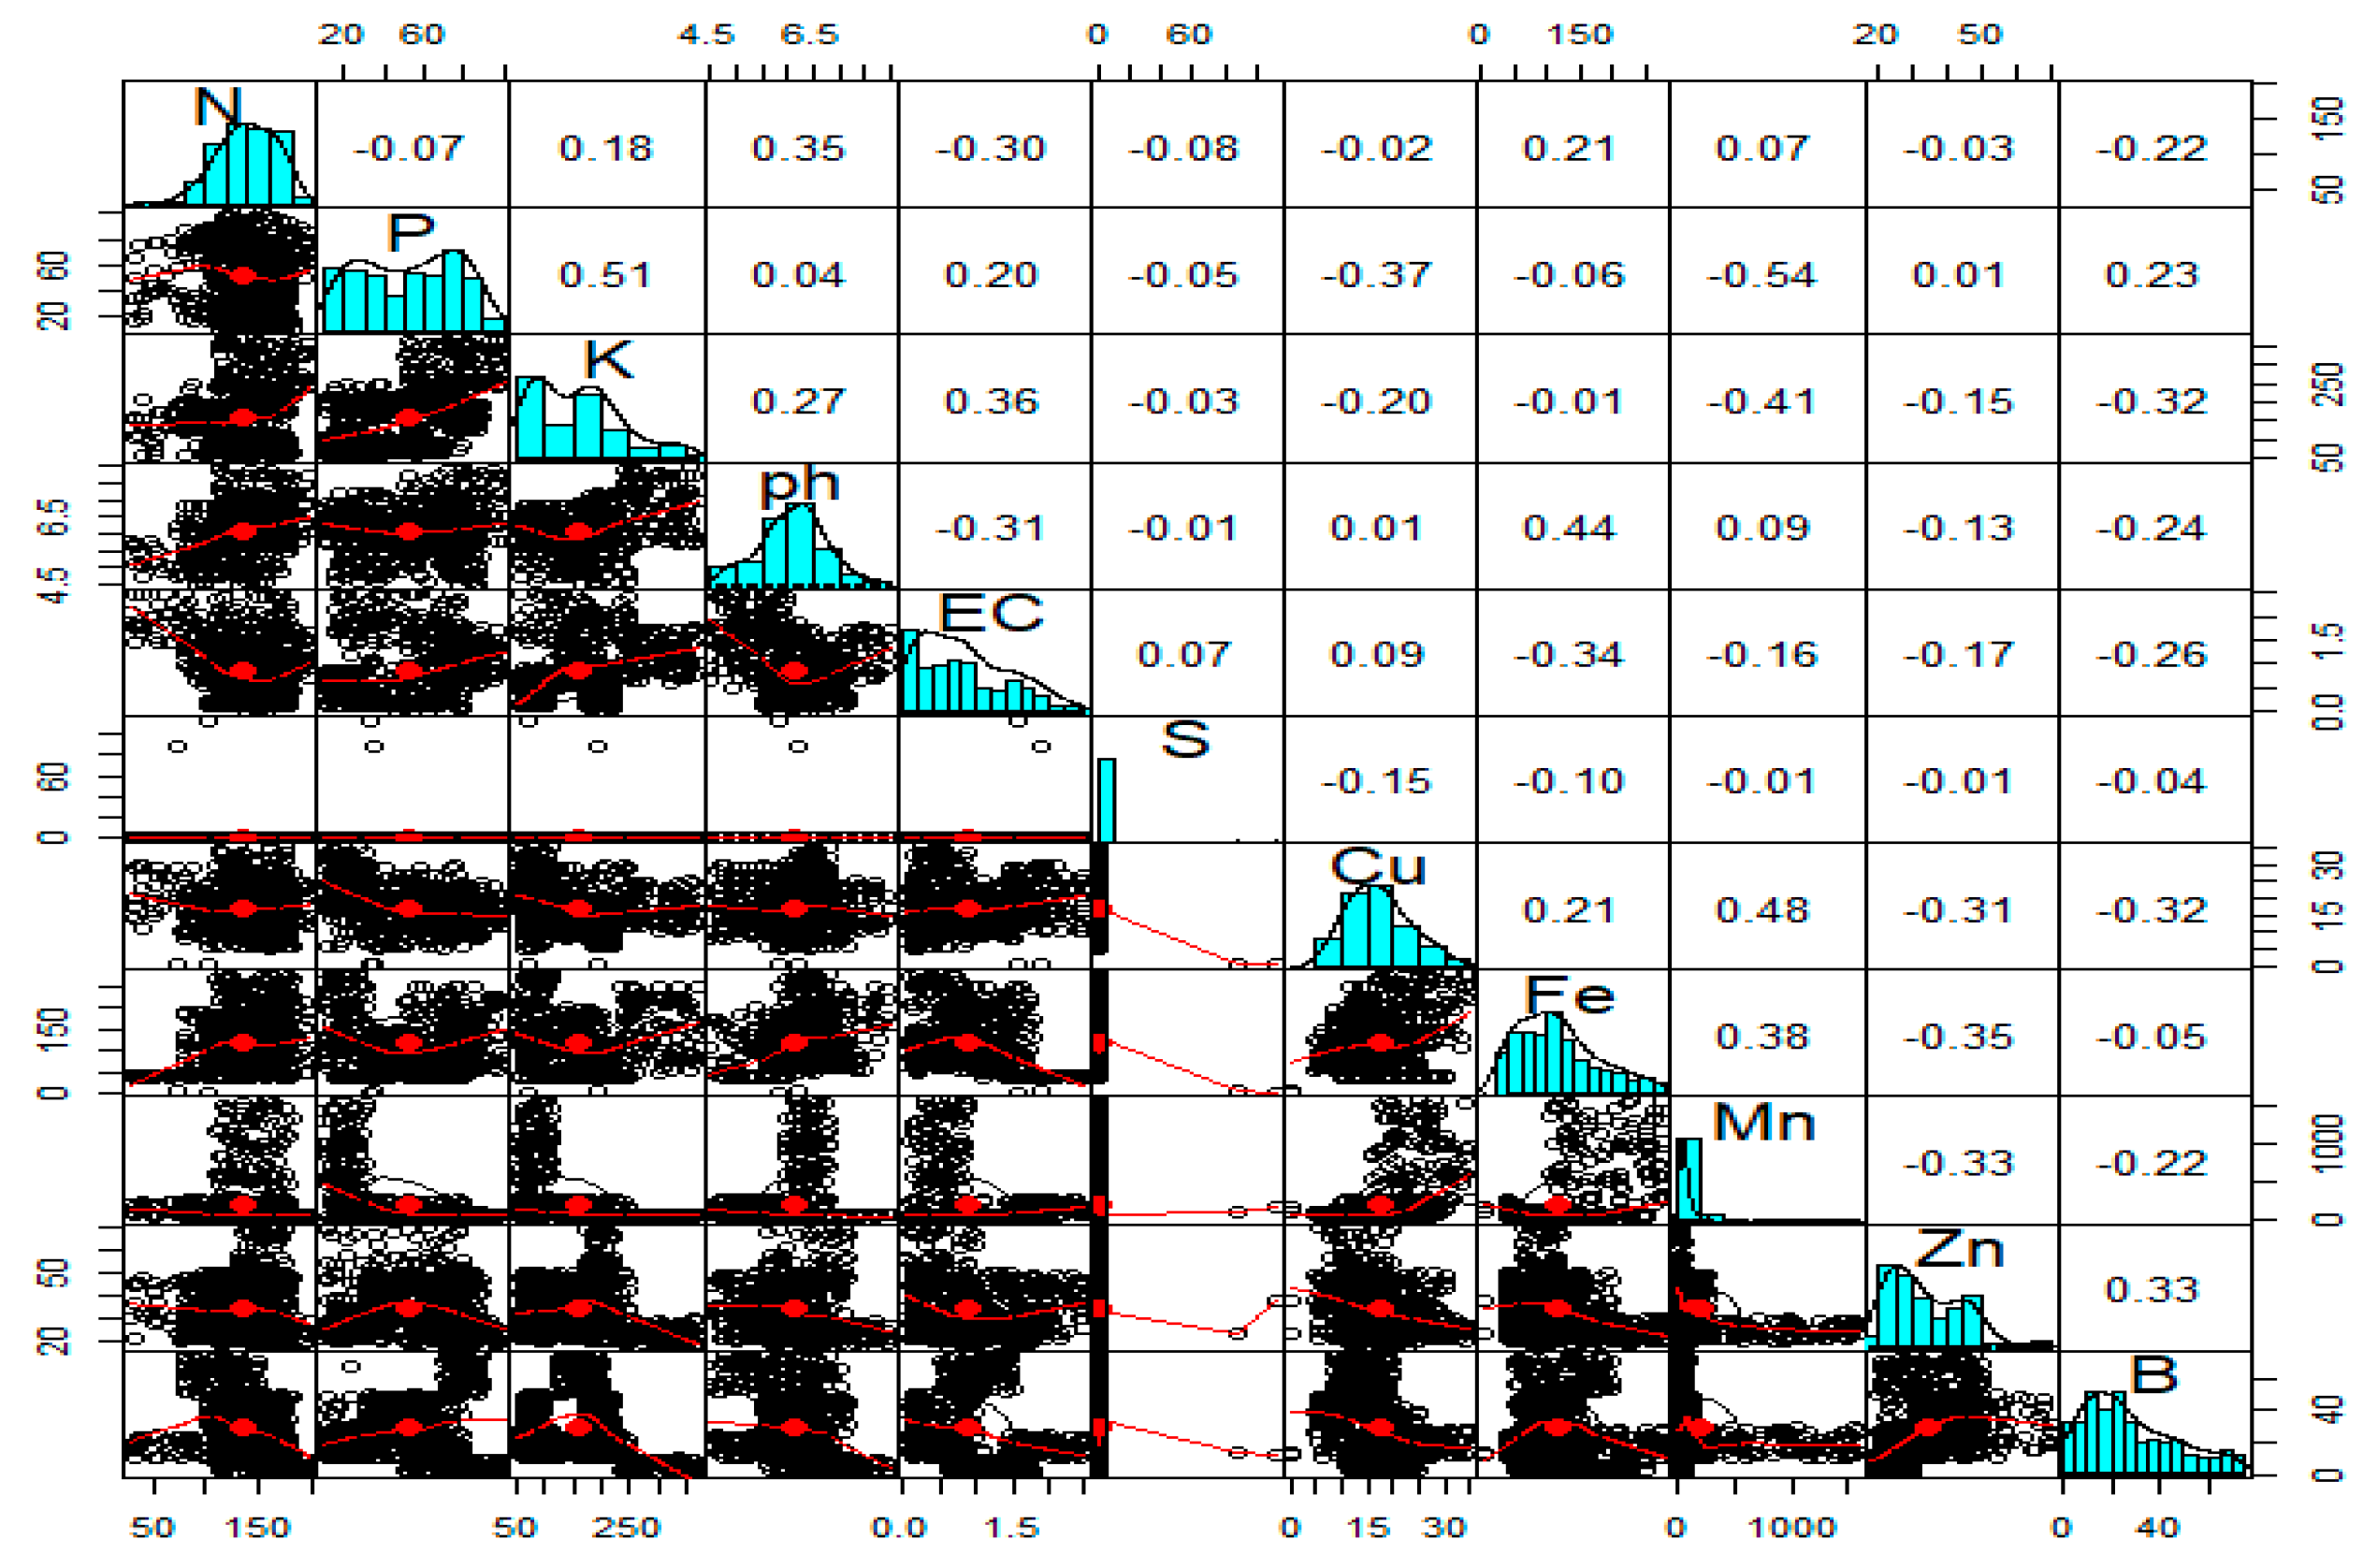
Figure 2.
Scree plot showing a component number with eigenvalues.
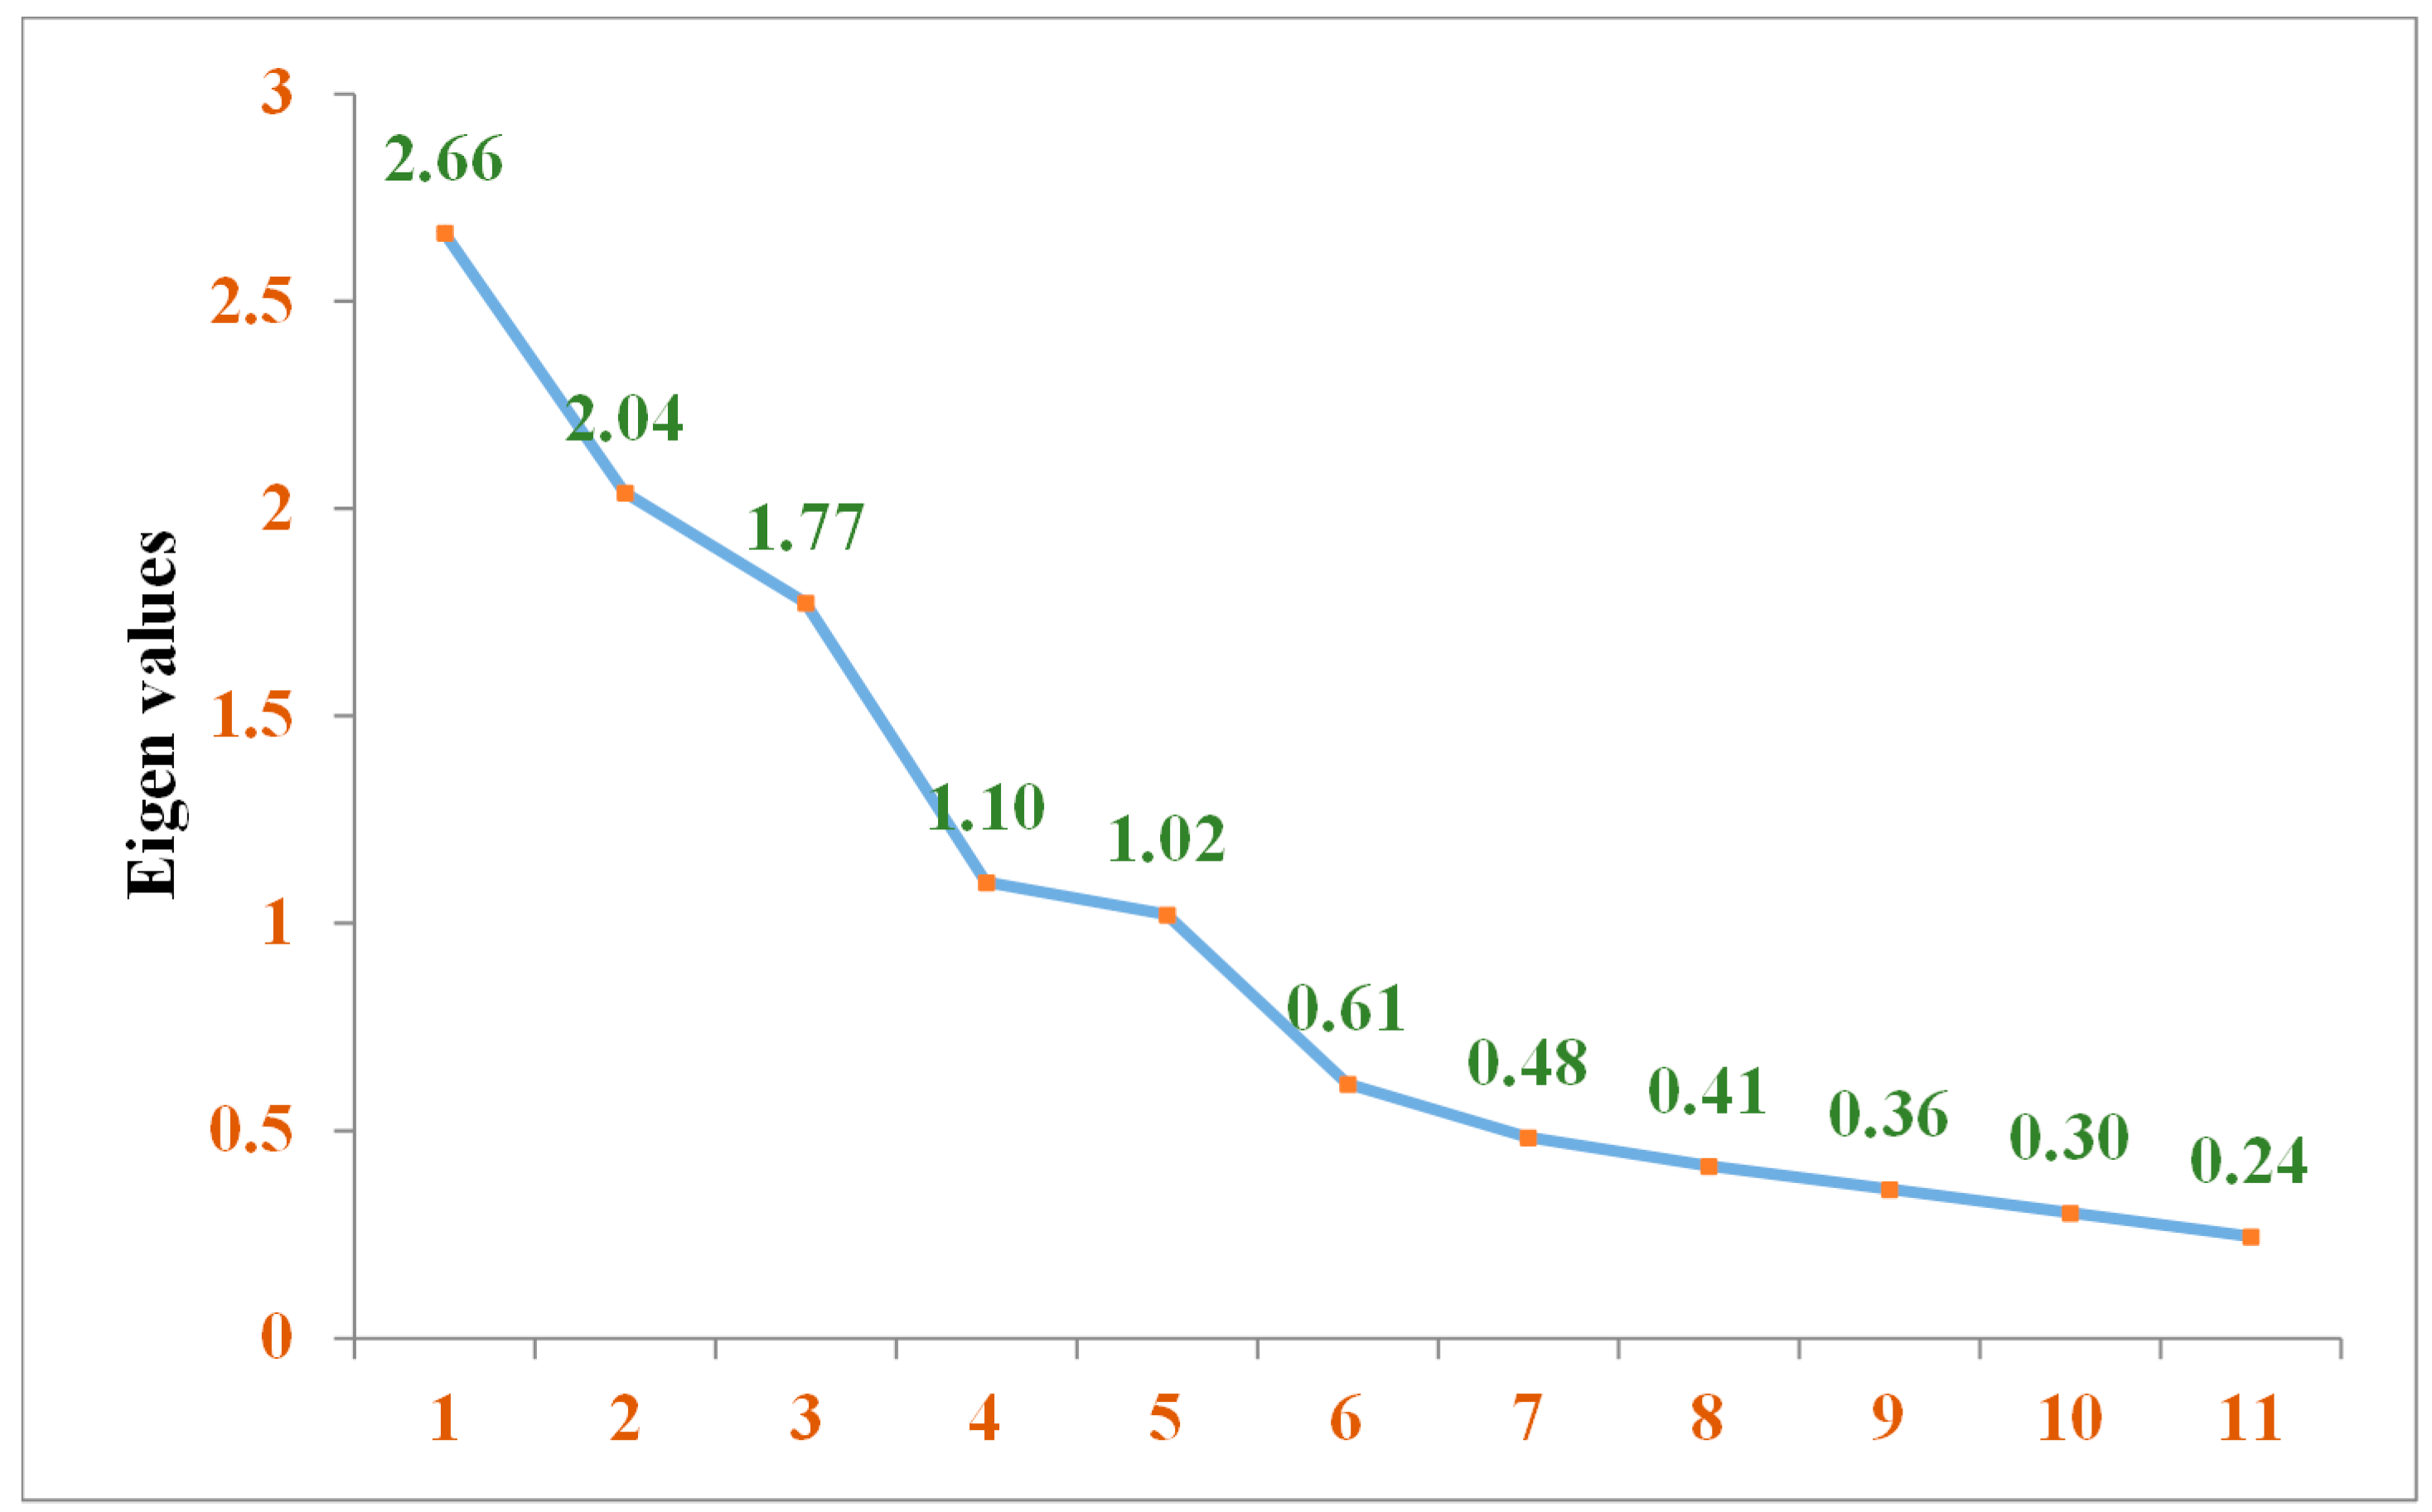
Figure 3.
Percentage of variance explained by the principal components.
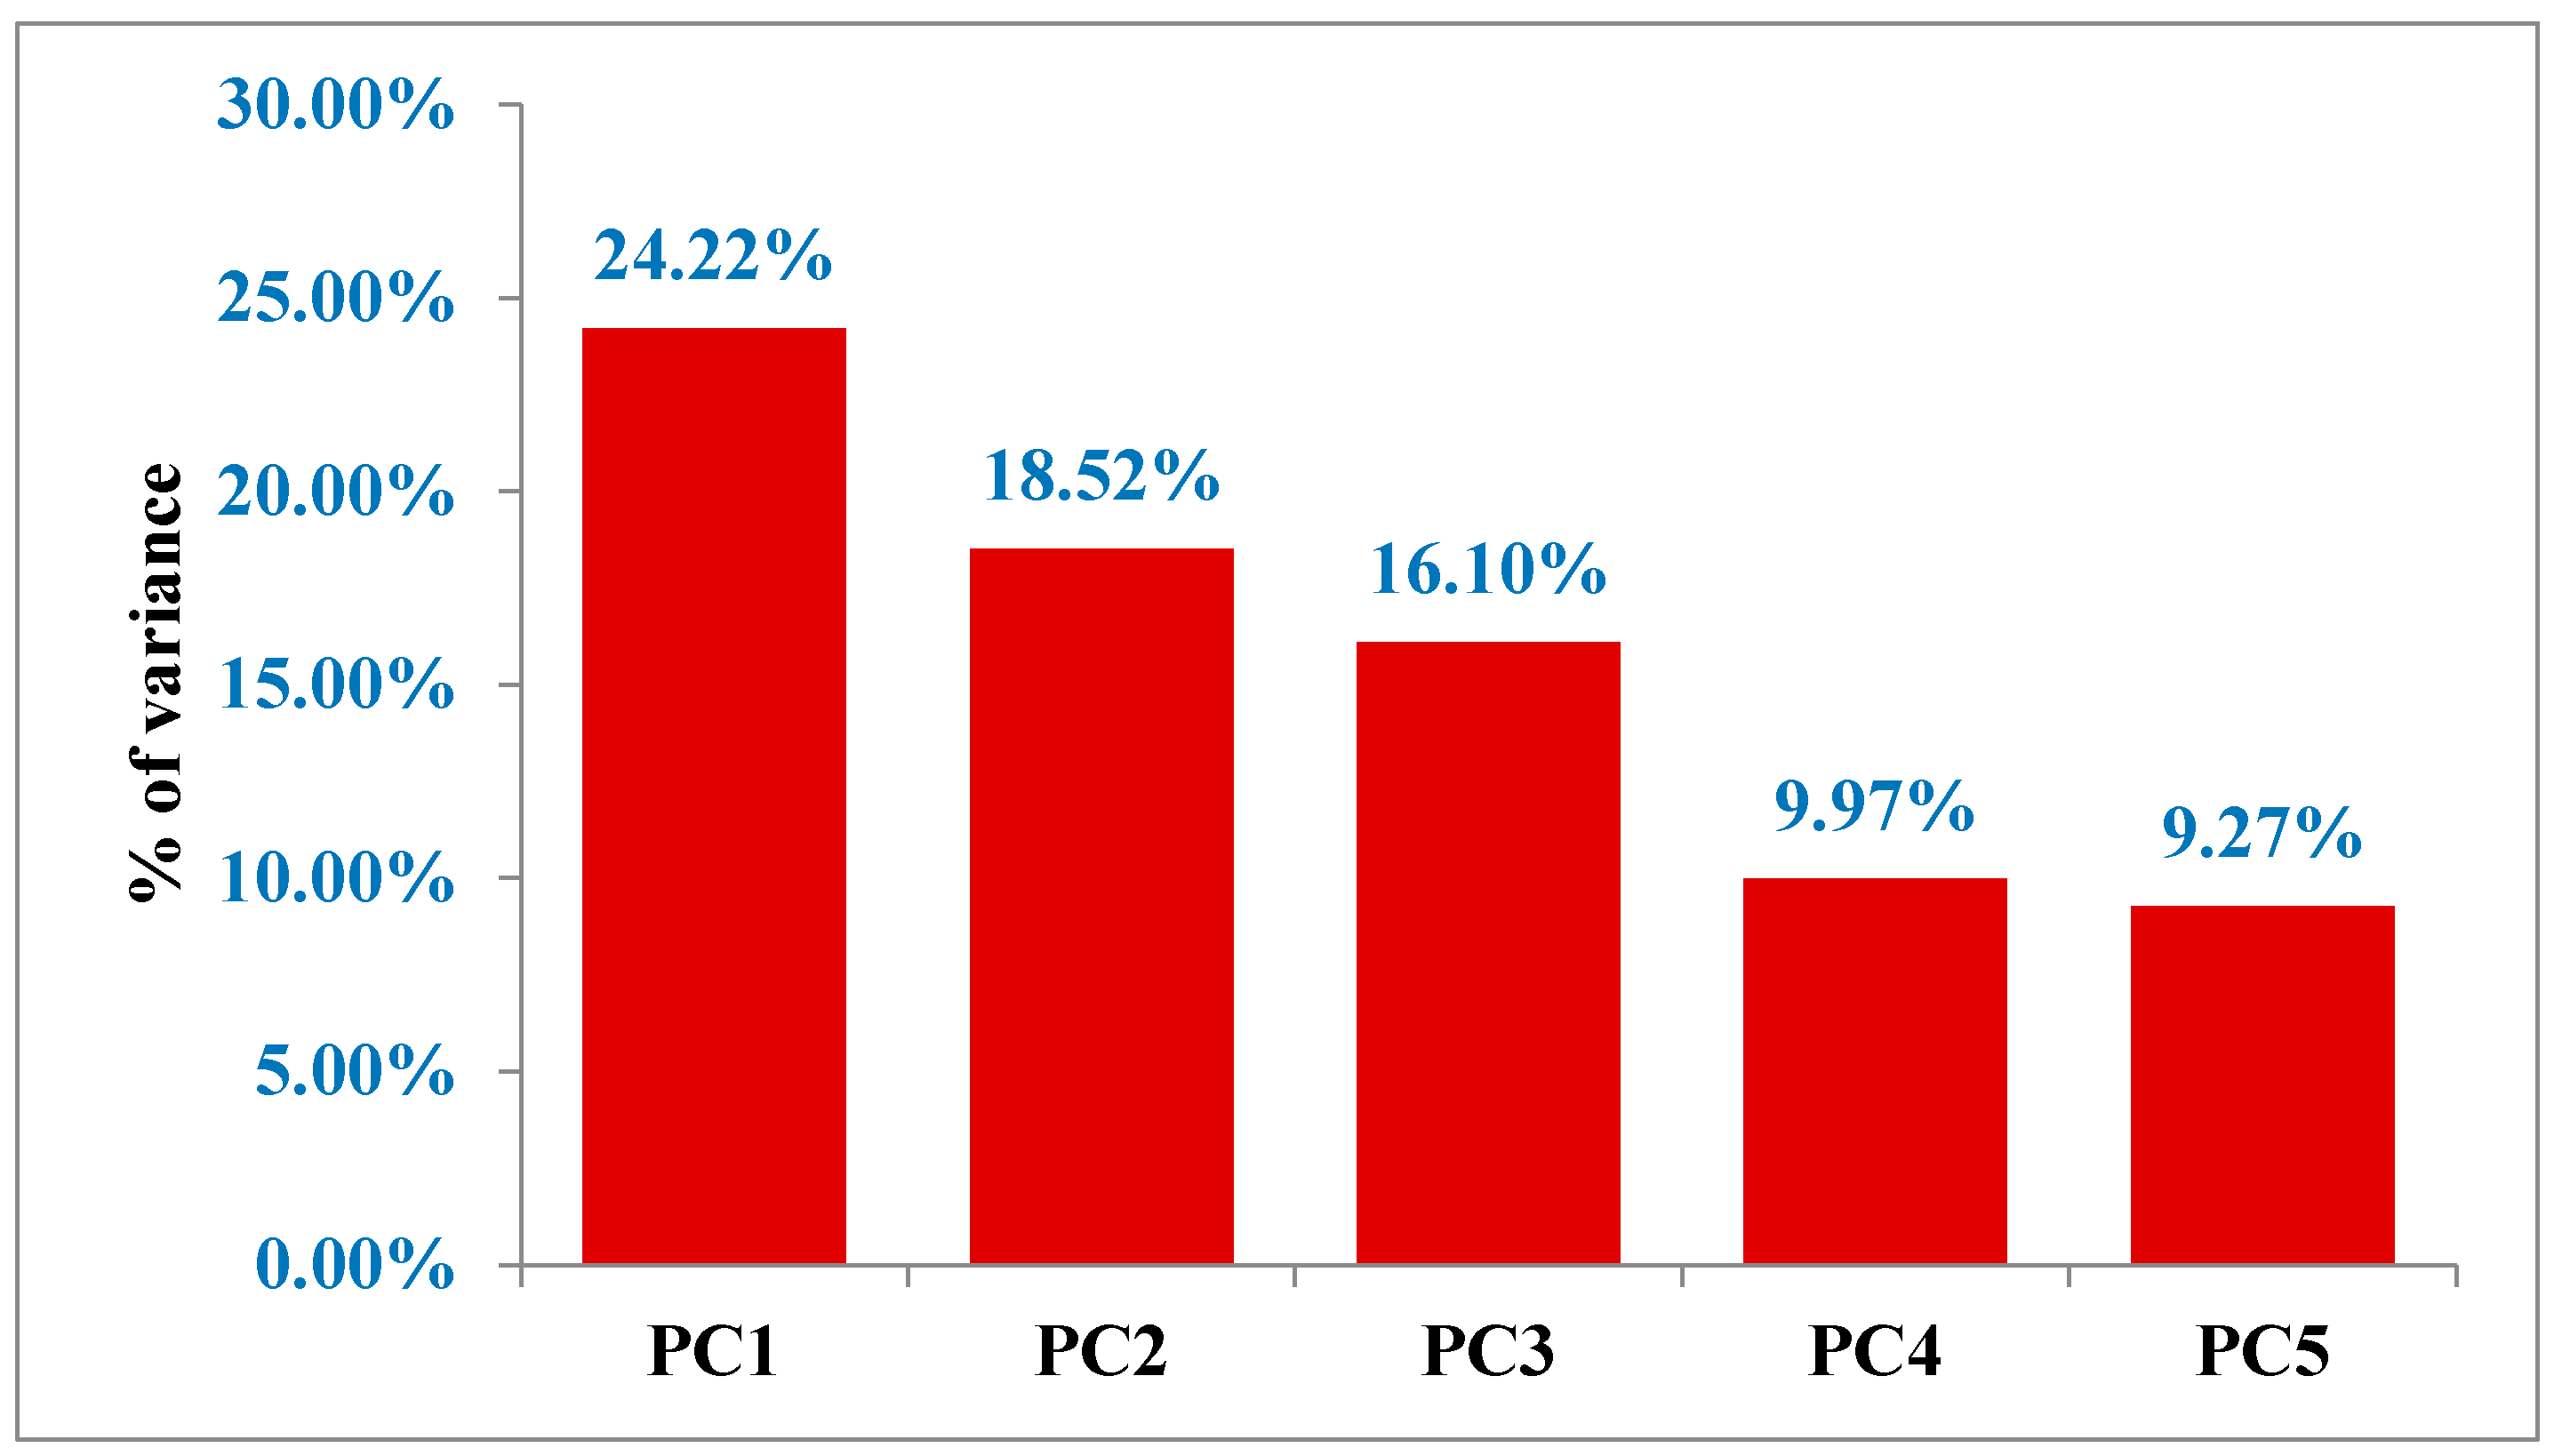
Figure 4.
(a–e) Association of different soil characters with the first five principal components.
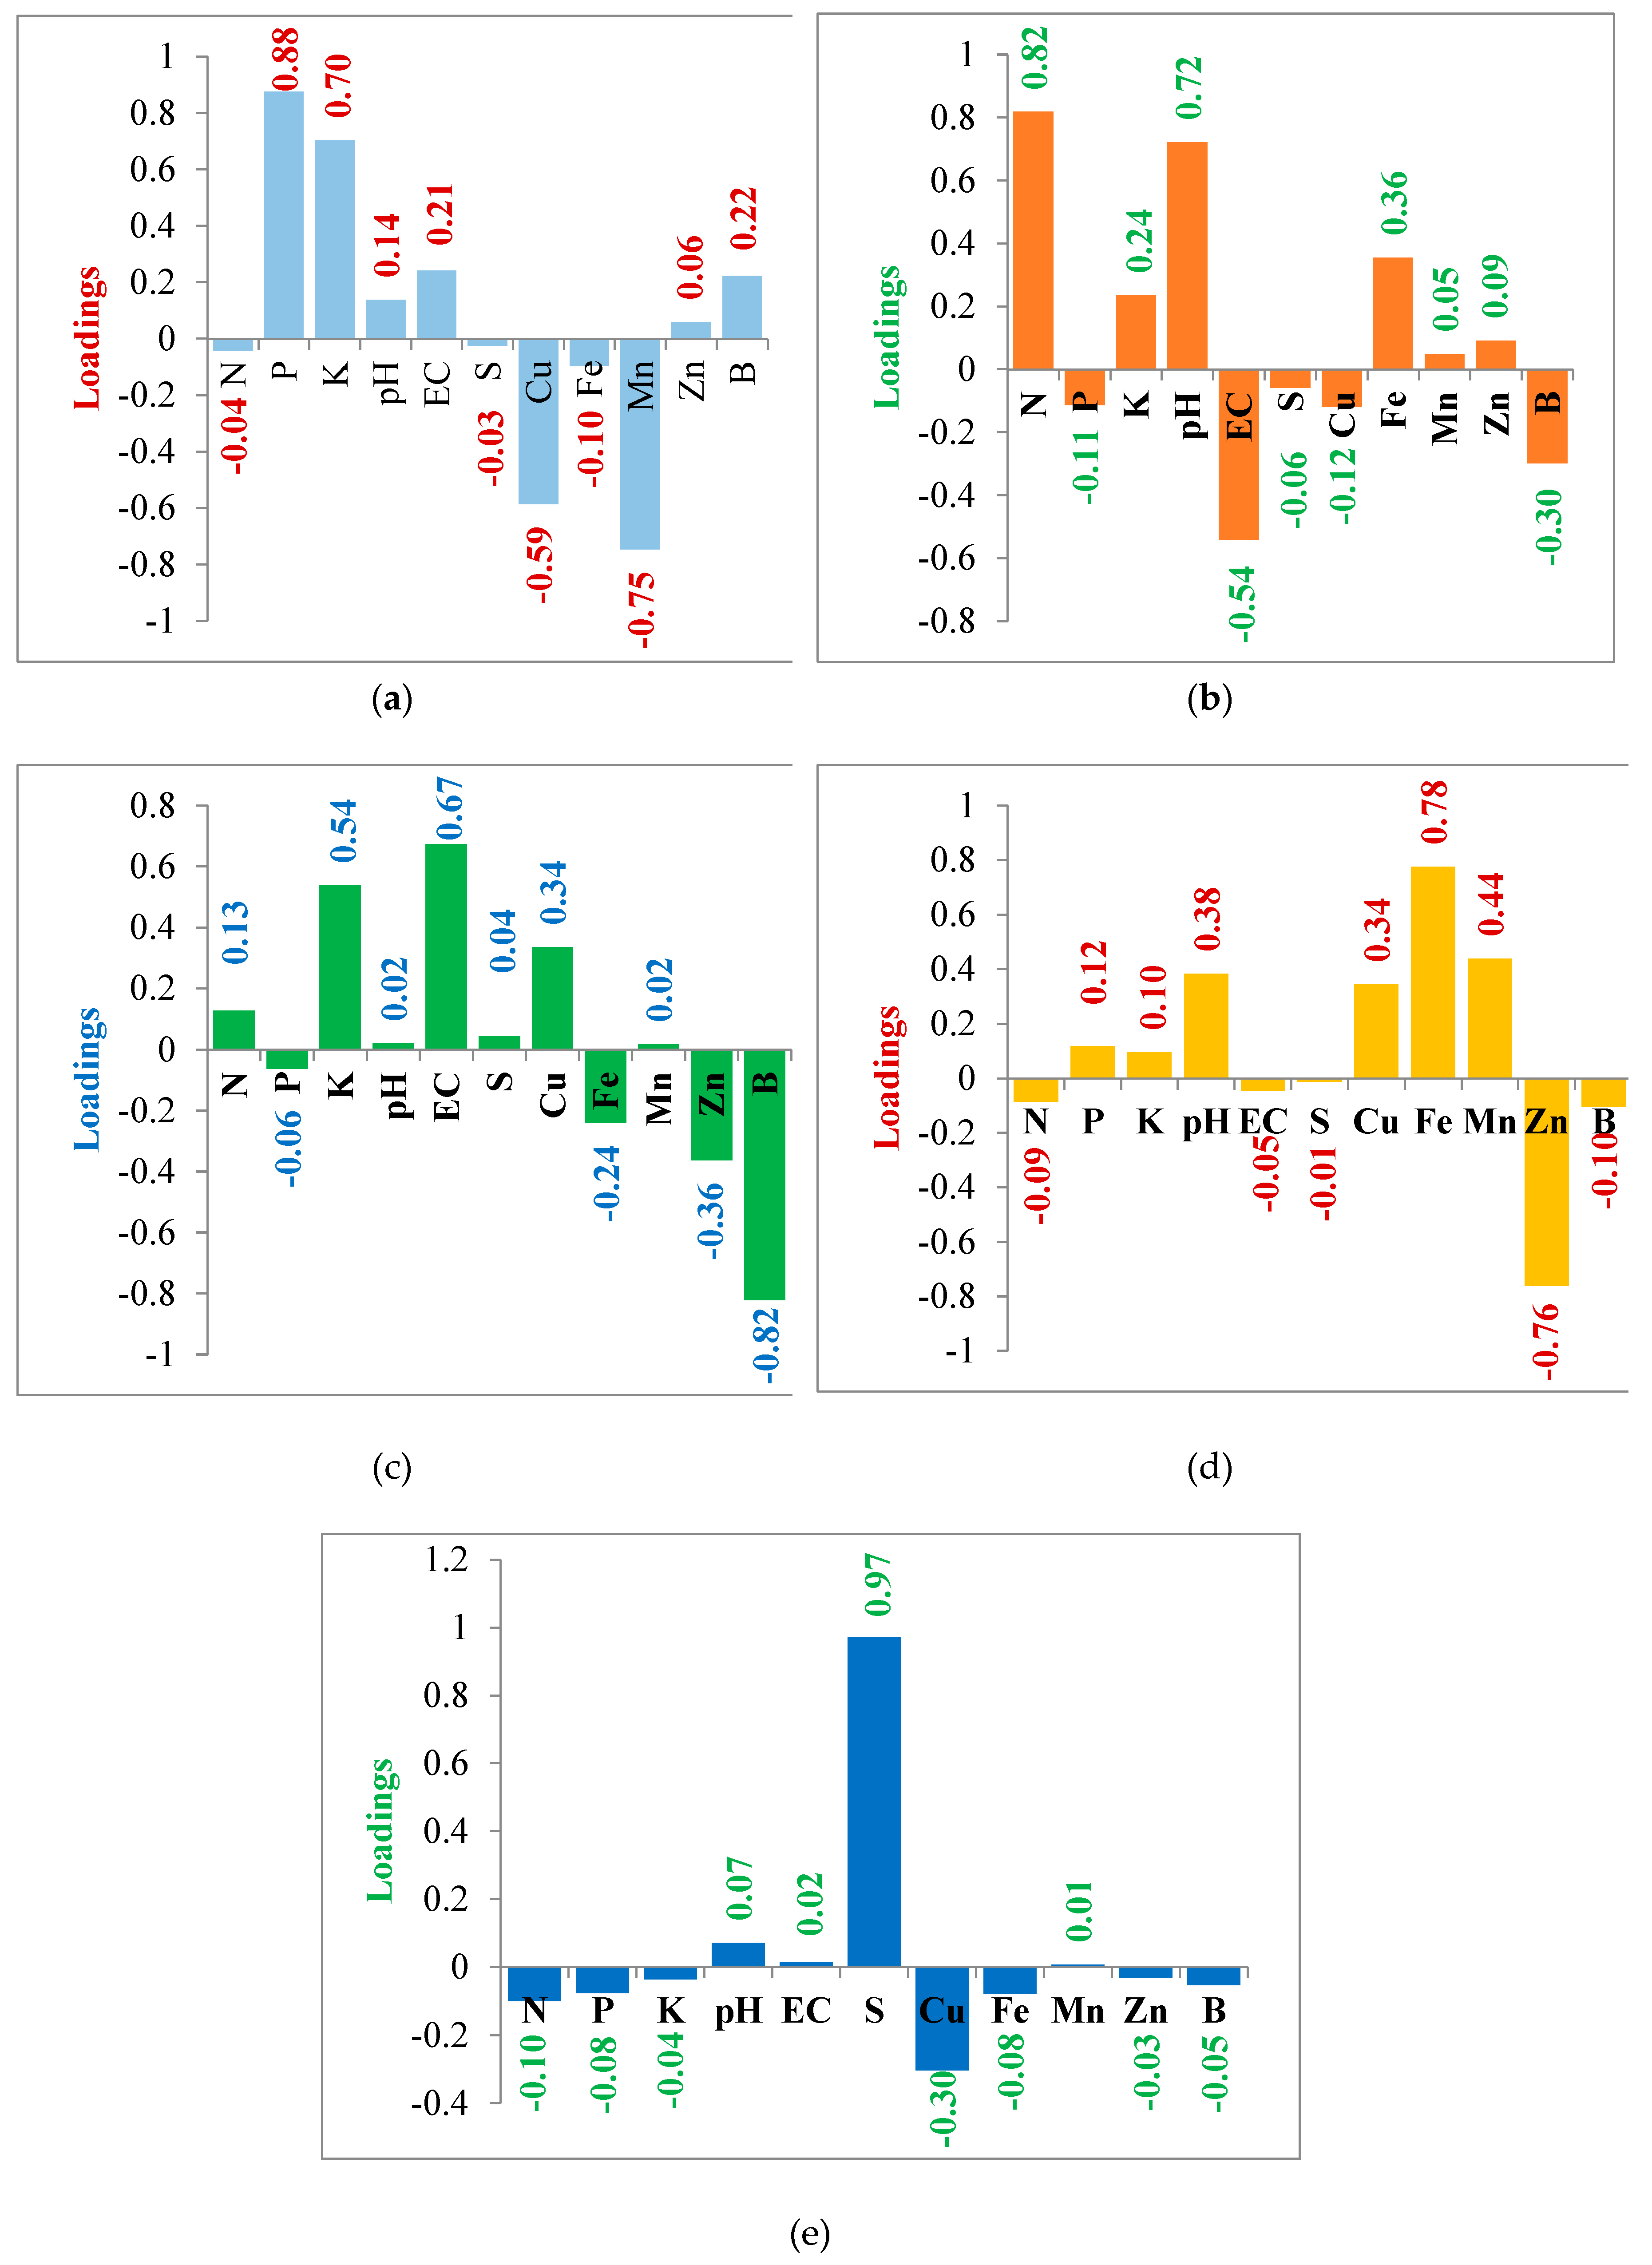
Figure 5.
Score plot of soil characteristics based on the first two principal components in different crops.
Figure 5.
Score plot of soil characteristics based on the first two principal components in different crops.
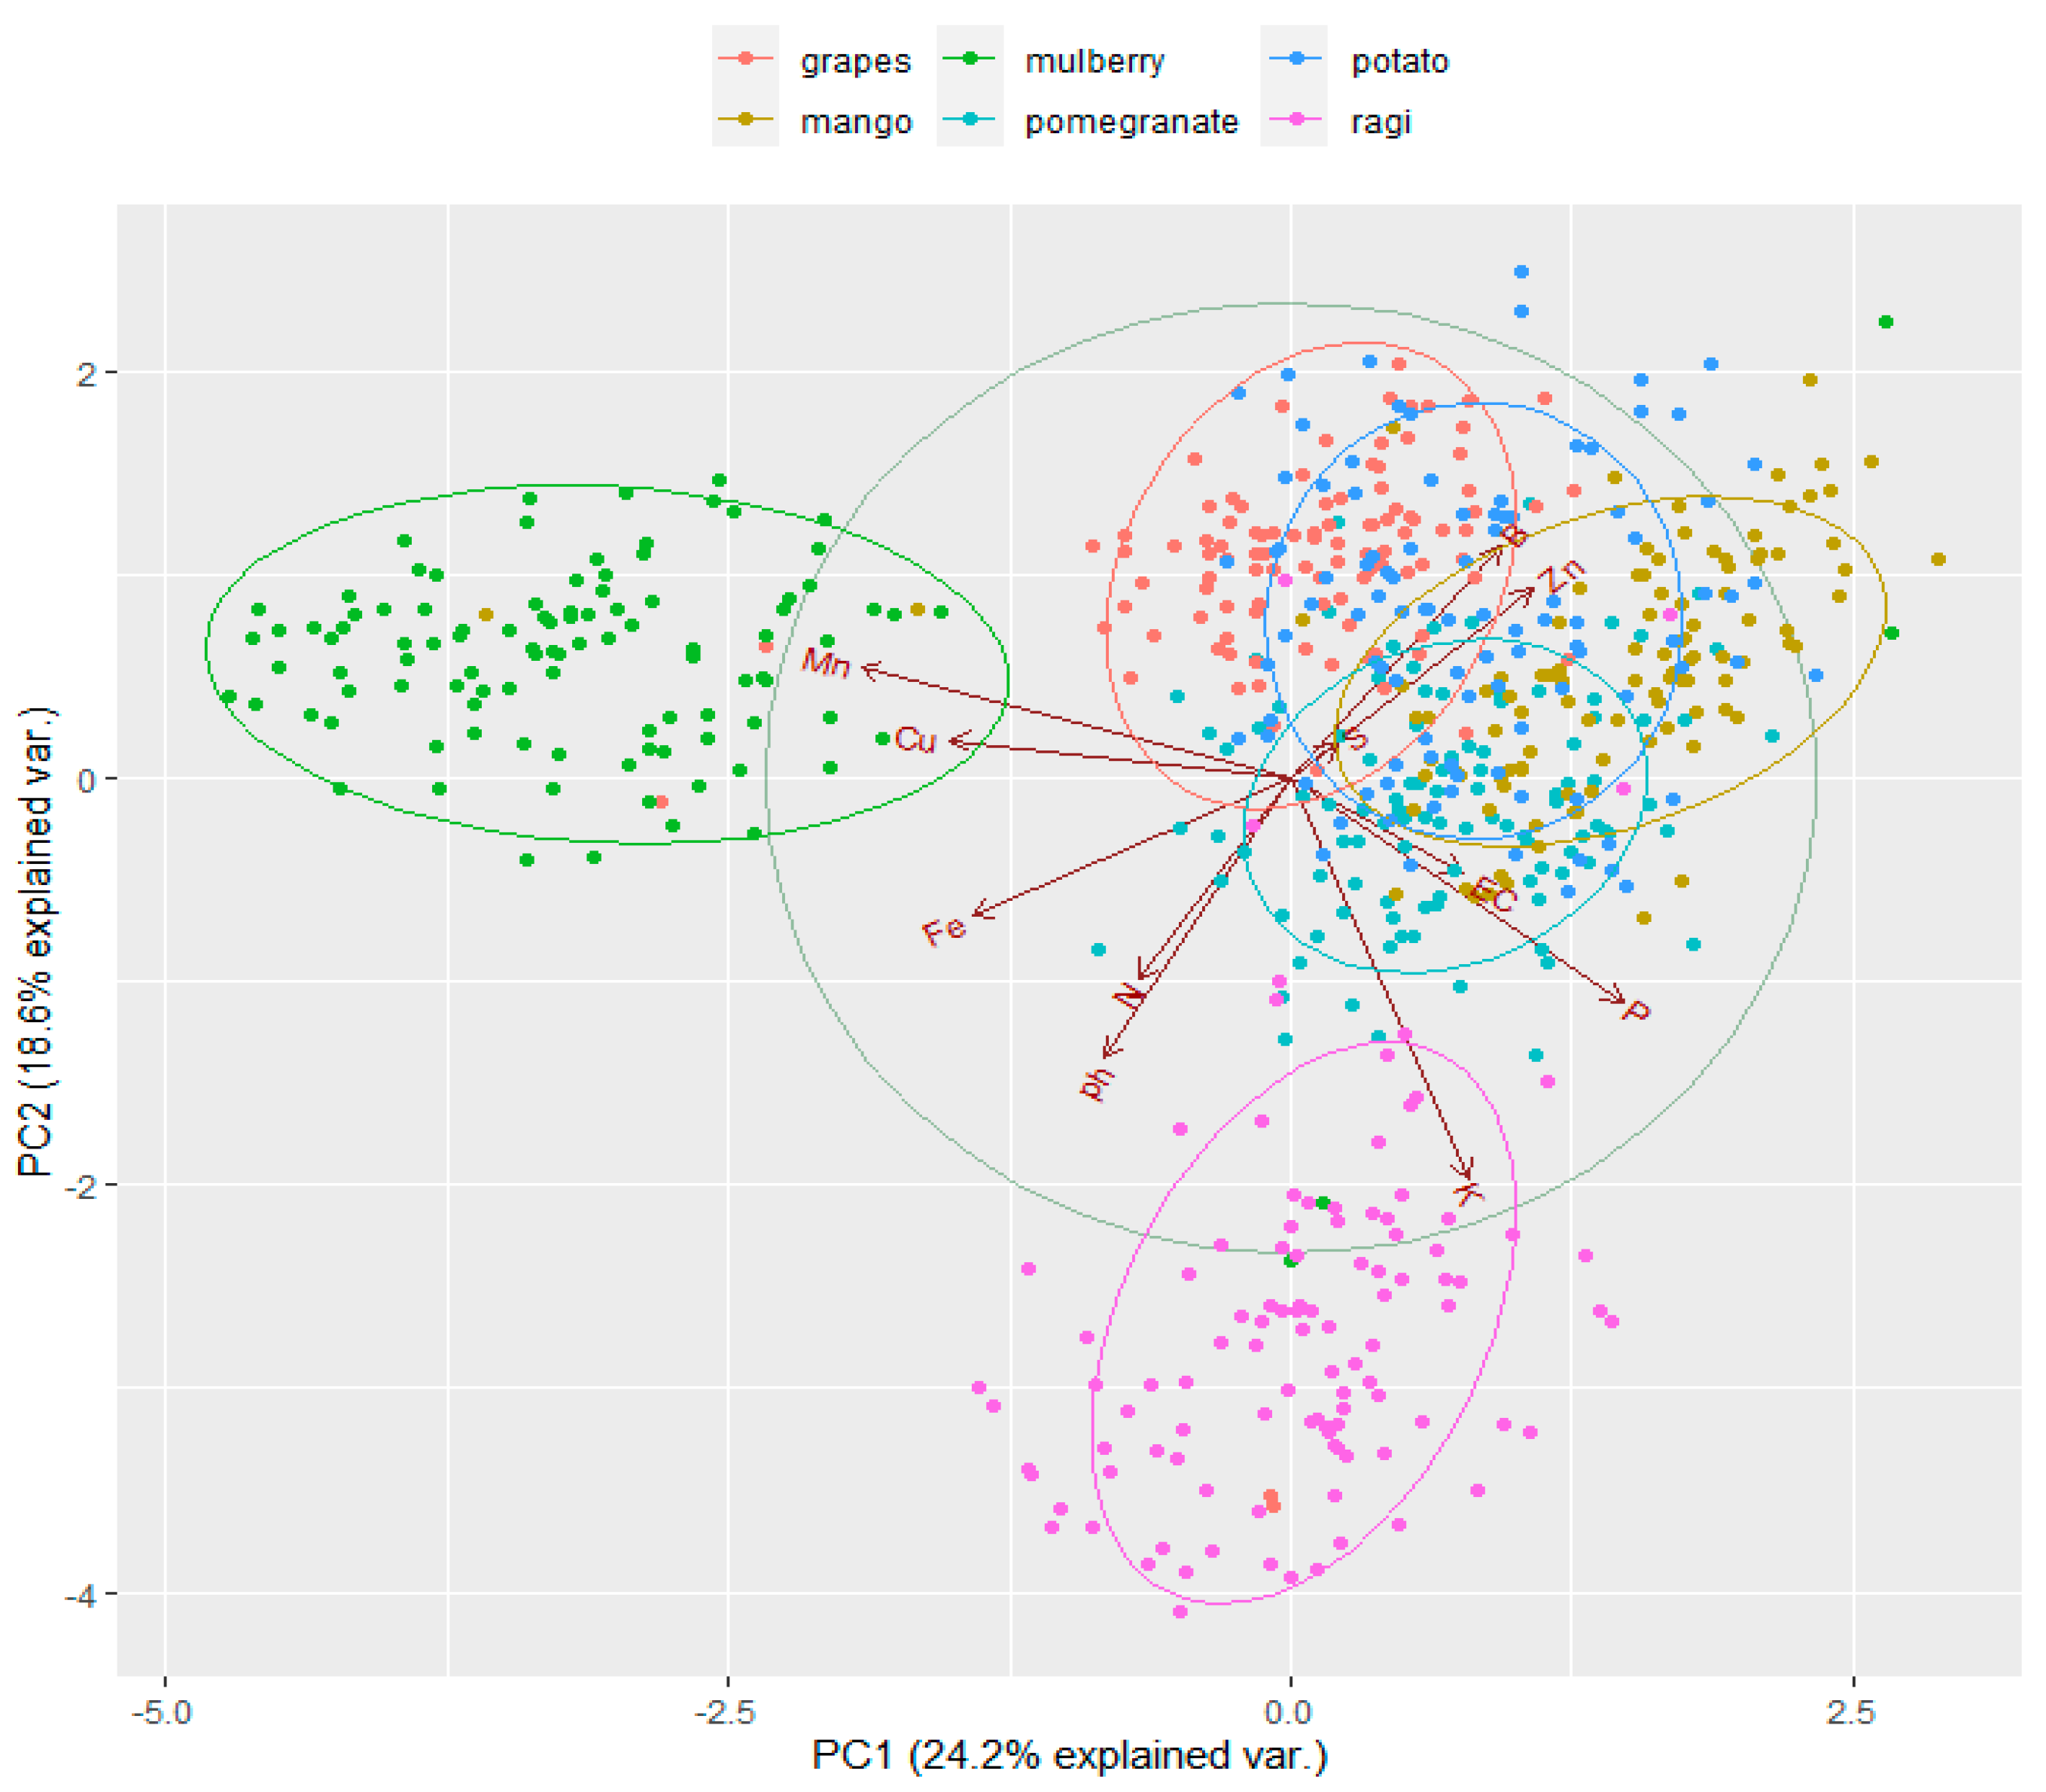
Figure 6.
(a–e) Association of different soil characters with the first five factors.
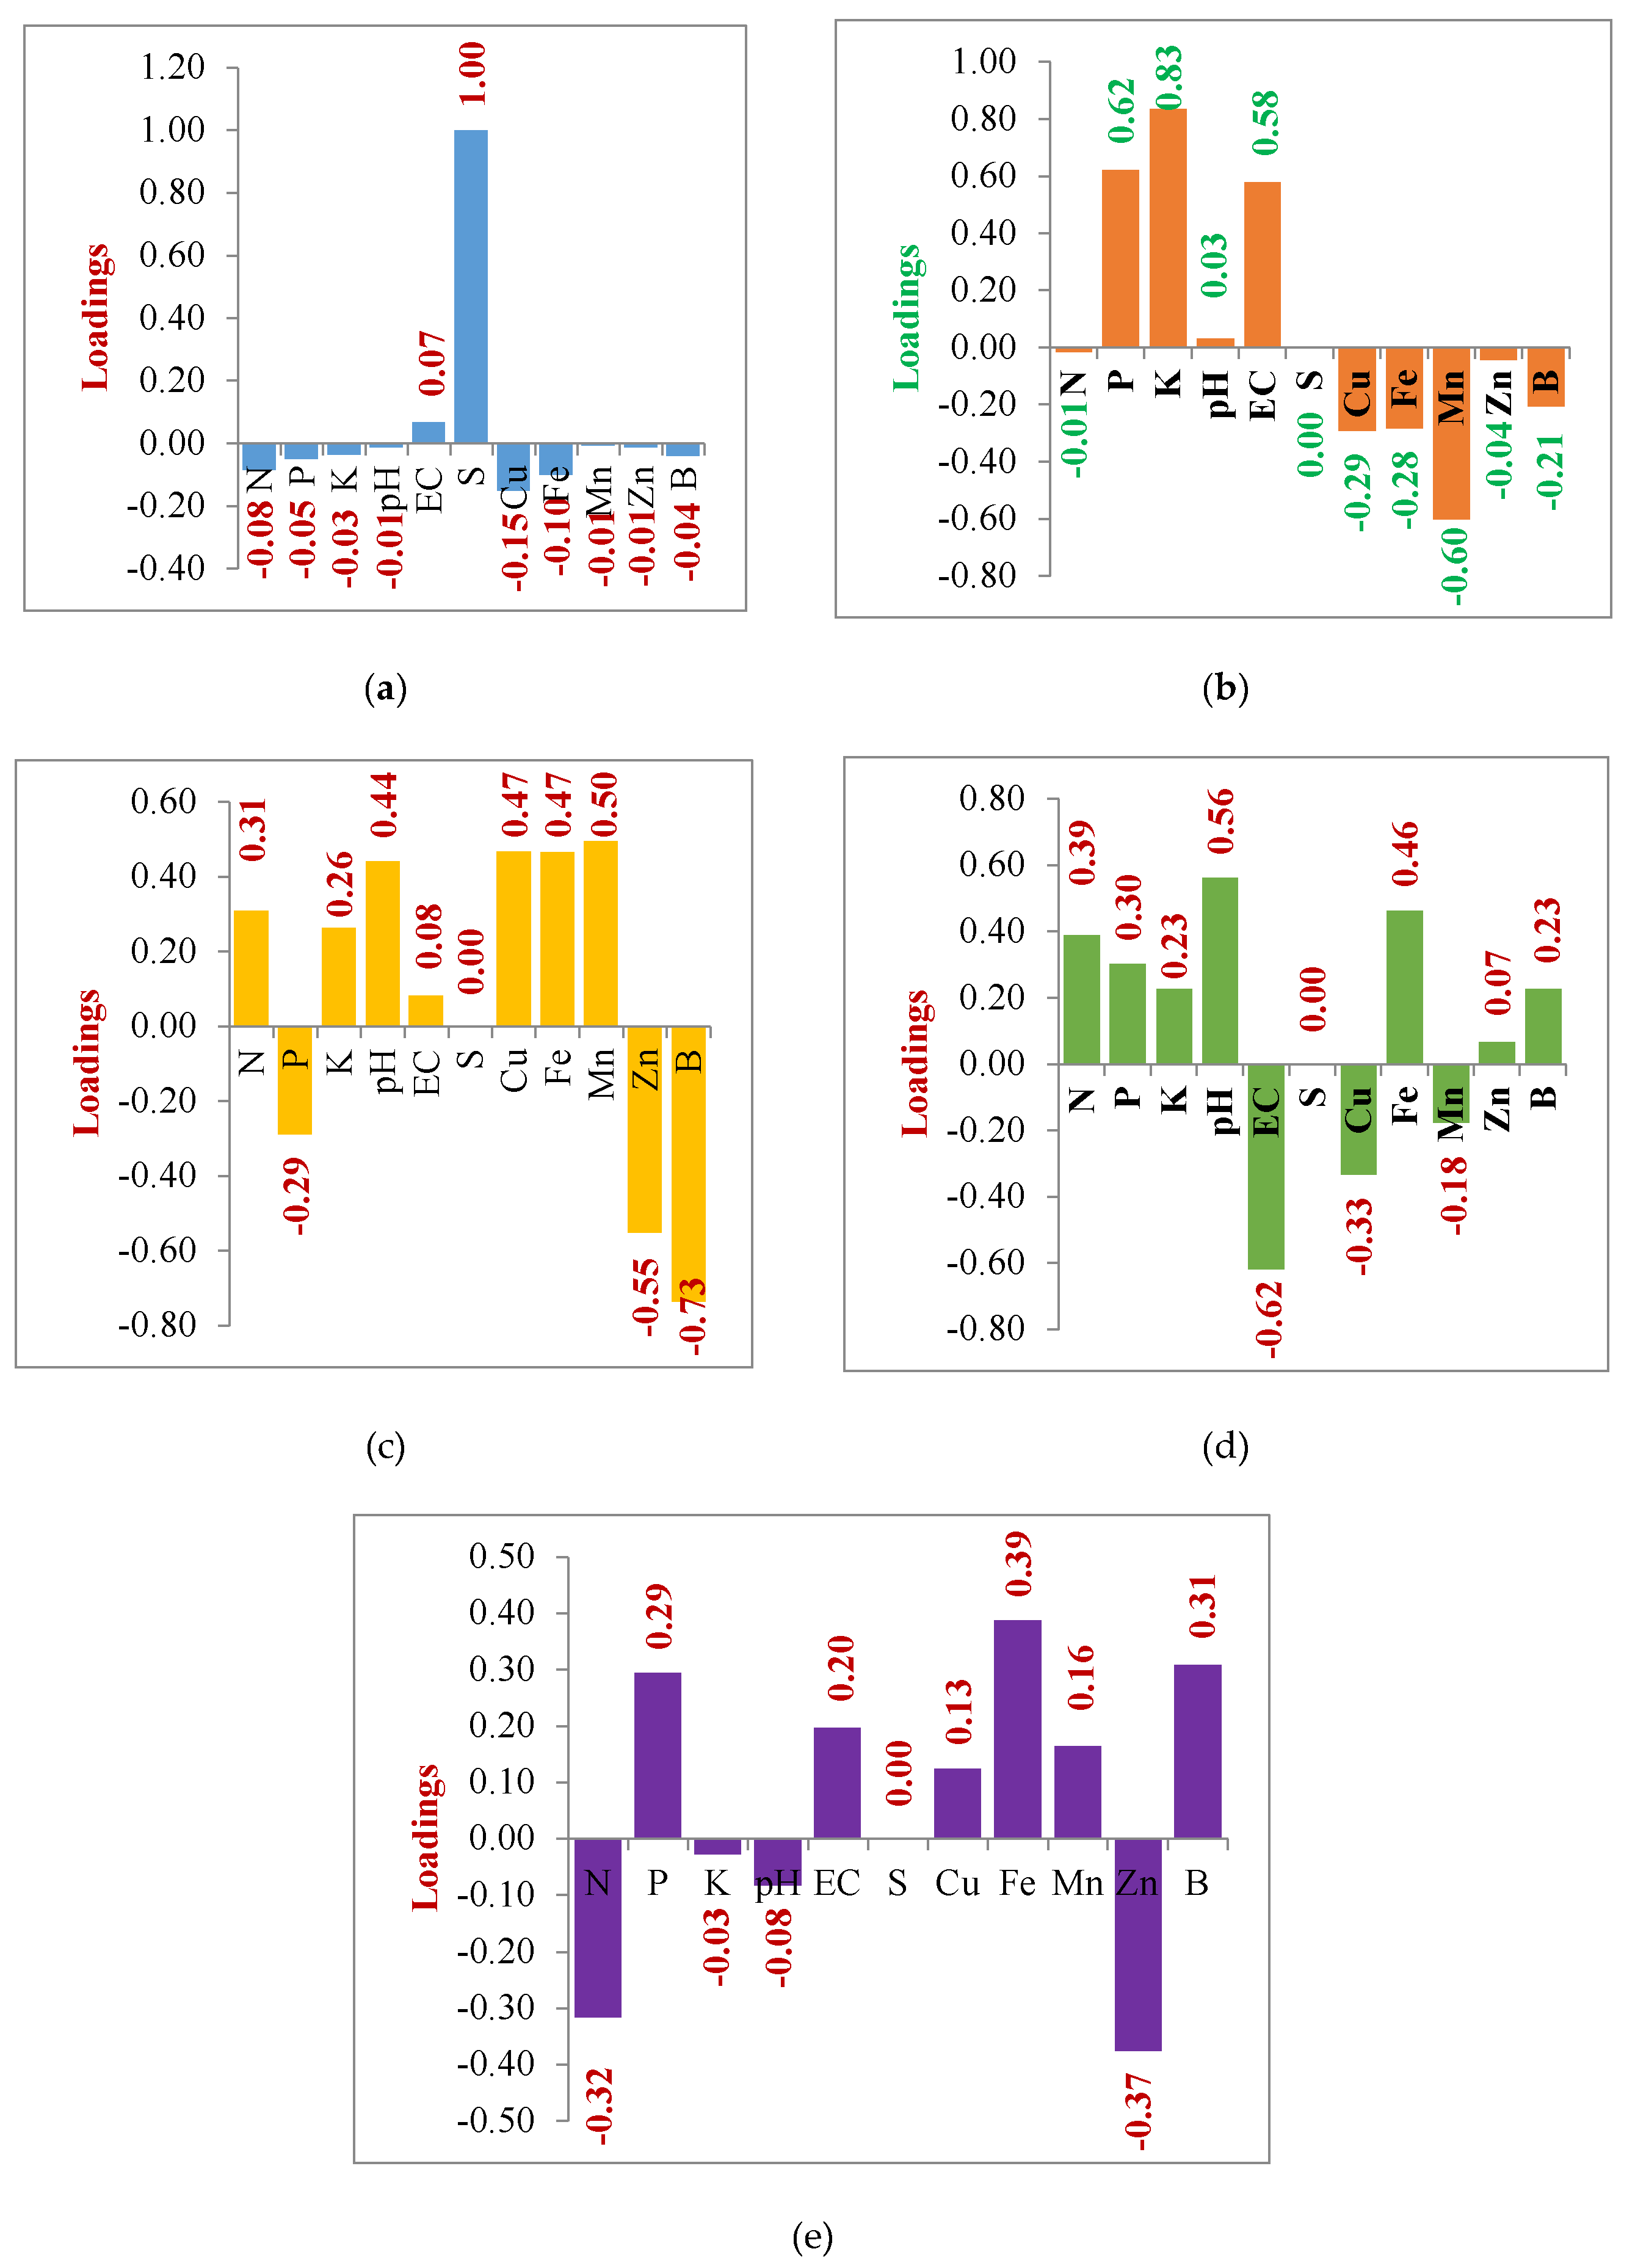
Figure 7.
Correlation between the pair of canonical variables U1 and V1 and their canonical variables and original variables.
Figure 7.
Correlation between the pair of canonical variables U1 and V1 and their canonical variables and original variables.
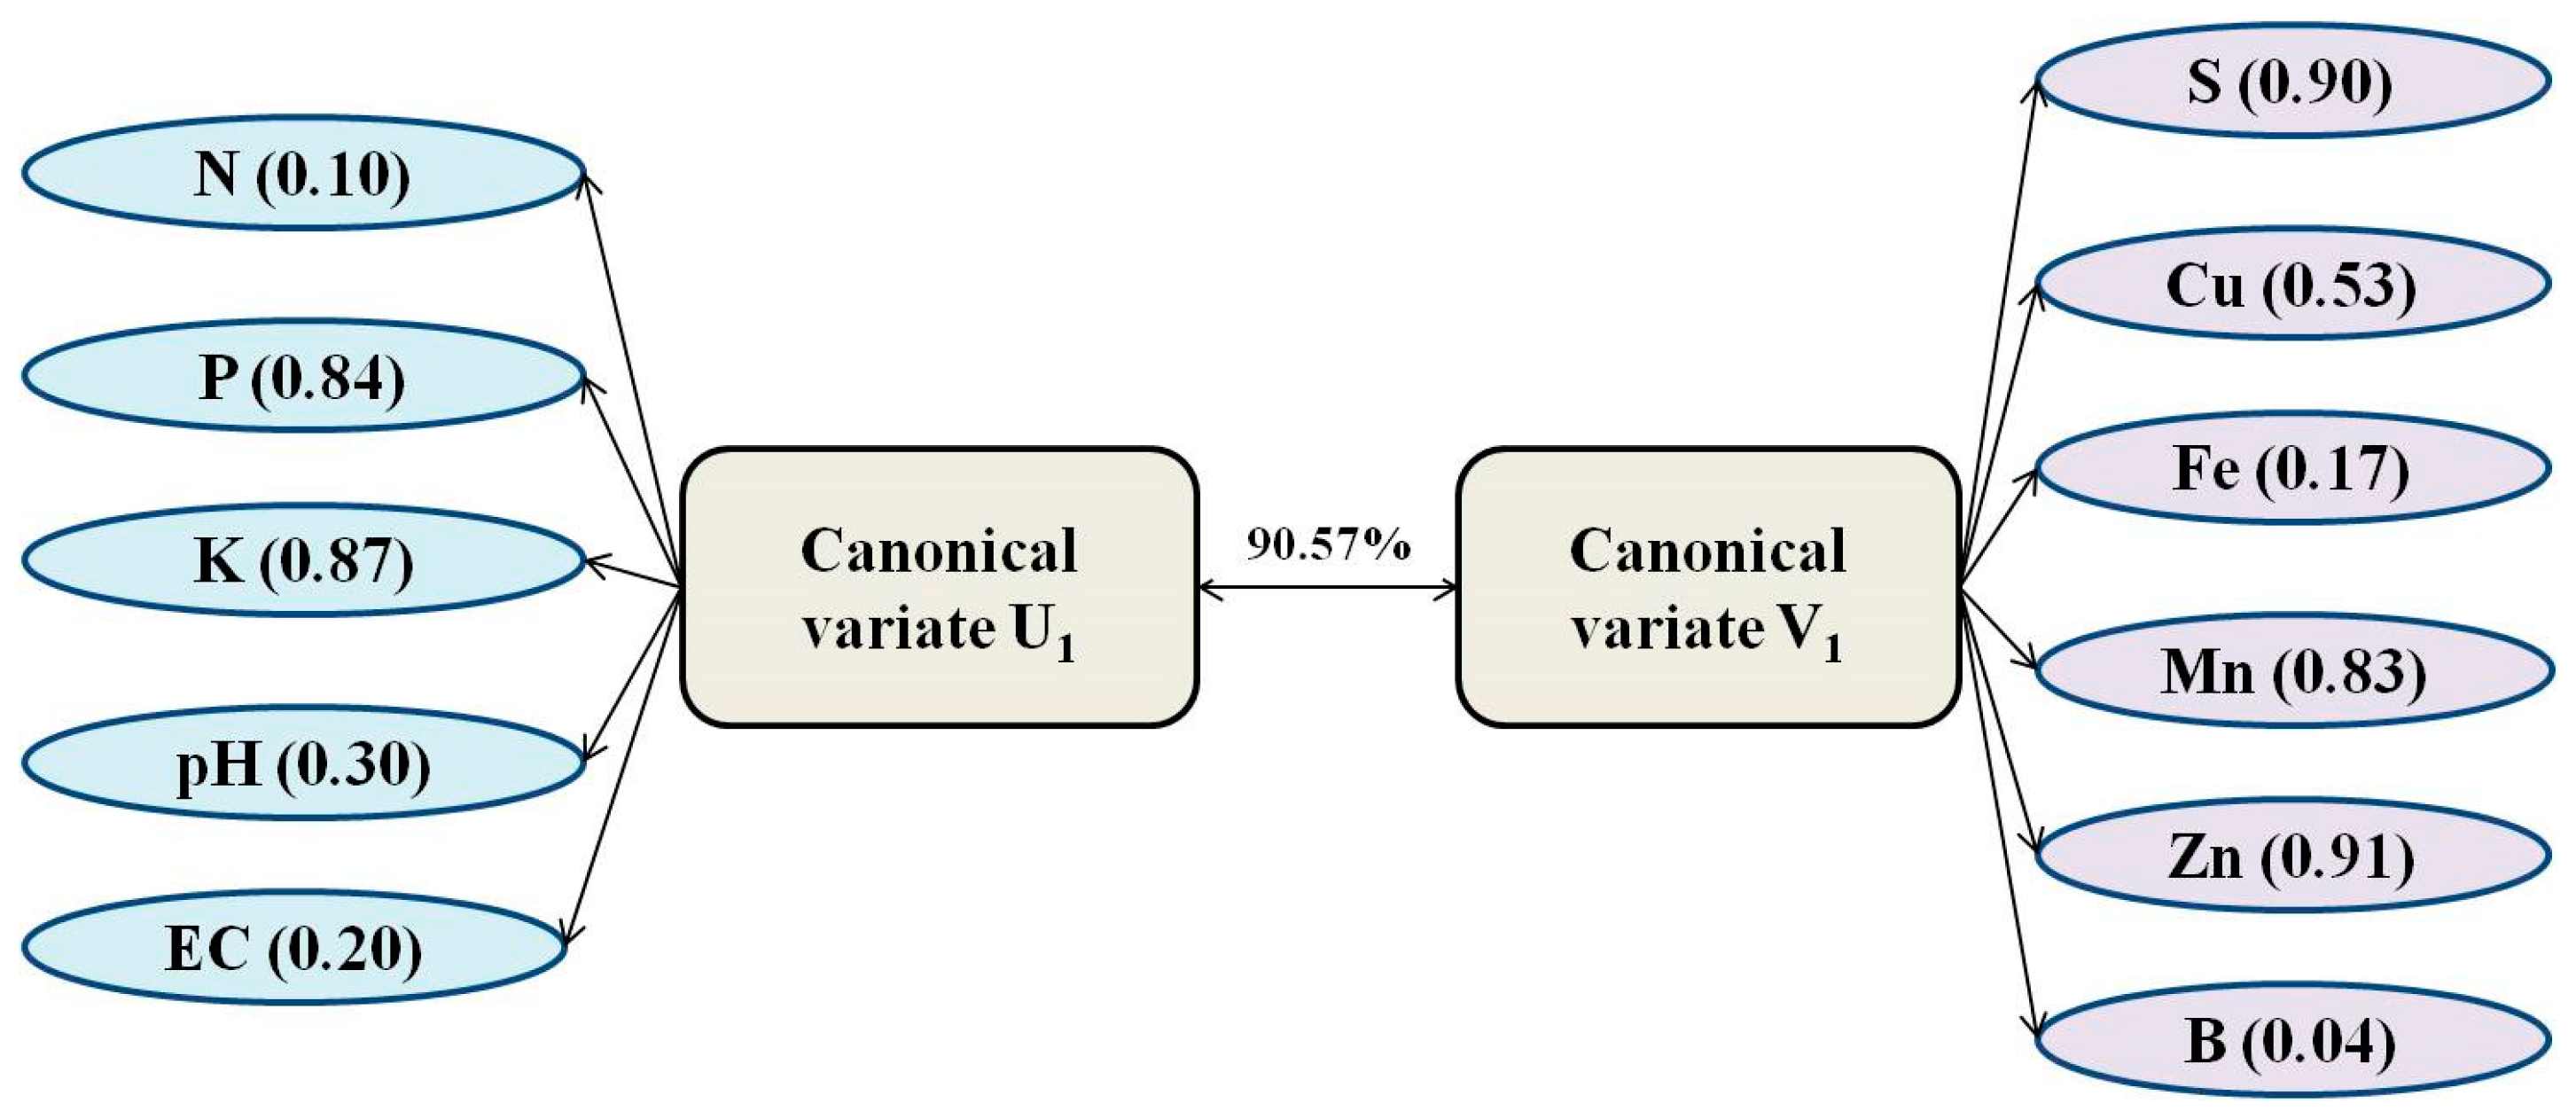

Table 1.
Characteristics of Multicollinearity.
| S. No | Response variable |
Regressors | R2 (%) | Adj. R2 (%) | VIF |
|---|---|---|---|---|---|
| 1 | N | P, K, pH, EC, S, Cu, Fe, Mn, Zn, B | 0.27 | 0.26 | 1.37 |
| 2 | P | N, K, pH, EC, S, Cu, Fe, Mn, Zn, B | 0.51 | 0.50 | 2.02 |
| 3 | K | N, P, pH, EC, S, Cu, Fe, Mn, Zn, B | 0.61 | 0.60 | 2.56 |
| 4 | pH | N, P, K, EC, S, Cu, Fe, Mn, Zn, B | 0.41 | 0.40 | 1.69 |
| 5 | EC | N, P, K, pH, S, Cu, Fe, Mn, Zn, B | 0.50 | 0.49 | 1.98 |
| 6 | S | N, P, K, pH, EC, Cu, Fe, Mn, Zn, B | 0.07 | 0.06 | 1.07 |
| 7 | Cu | N, P, K, pH, EC, S, Fe, Mn, Zn, B | 0.38 | 0.37 | 1.60 |
| 8 | Fe | N, P, K, pH, EC, S, Cu, Mn, Zn, B | 0.44 | 0.43 | 1.78 |
| 9 | Mn | N, P, K, pH, EC, S, Cu, Fe, Zn, B | 0.54 | 0.53 | 2.17 |
| 10 | Zn | N, P, K, pH, EC, S, Cu, Fe, Mn, B | 0.34 | 0.34 | 1.51 |
| 11 | B | N, P, K, pH, EC, S, Cu, Fe, Mn, Zn | 0.48 | 0.47 | 1.96 |
Table 2.
Characteristics of KMO and Bartlett's Test.
| KMO and Bartlett's Test | ||
|---|---|---|
| Kaiser-Meyer-Olkin Measure of Sampling Adequacy. | 0.64 | |
| Bartlett's Test of Sphericity | Approx. Chi-Square | 2067.48 |
| df | 55 | |
| Sig. | 0.00 | |
Table 3.
Characteristics of computed five principal components and Eigenvalues.
| Soil Parameters | PC1 | PC2 | PC3 | PC4 | PC5 |
|---|---|---|---|---|---|
| N | -0.04 | 0.82 | 0.13 | -0.09 | -0.10 |
| P | 0.88 | -0.11 | -0.06 | 0.12 | -0.08 |
| K | 0.70 | 0.24 | 0.54 | 0.10 | -0.04 |
| pH | 0.14 | 0.72 | 0.02 | 0.38 | 0.07 |
| EC | 0.24 | -0.54 | 0.67 | -0.05 | 0.02 |
| S | -0.03 | -0.06 | 0.04 | -0.01 | 0.97 |
| Cu | -0.59 | -0.12 | 0.34 | 0.34 | -0.30 |
| Fe | -0.10 | 0.36 | -0.24 | 0.78 | -0.08 |
| Mn | -0.75 | 0.05 | 0.02 | 0.44 | 0.01 |
| Zn | 0.06 | 0.09 | -0.36 | -0.76 | -0.03 |
| B | 0.22 | -0.30 | -0.82 | -0.10 | -0.05 |
| Eigenvalues | 2.27 | 2.04 | 1.18 | 1.10 | 1.02 |
| % of variance | 24.22 | 18.52 | 16.10 | 9.97 | 9.27 |
| Cumulative % of the variance | 24.22 | 42.74 | 58.83 | 68.804 | 78.072 |
Table 4.
Characteristics of computed five factors and eigenvalue.
| Soil parameters | FA1 | FA2 | FA3 | FA4 | FA5 |
|---|---|---|---|---|---|
| N | -0.08 | -0.01 | 0.31 | 0.39 | -0.32 |
| P | -0.05 | 0.62 | -0.29 | 0.30 | 0.29 |
| K | -0.03 | 0.83 | 0.26 | 0.23 | -0.03 |
| ph | -0.01 | 0.03 | 0.44 | 0.56 | -0.08 |
| EC | 0.07 | 0.58 | 0.08 | -0.62 | 0.20 |
| S | 1.00 | 0.00 | 0.00 | 0.00 | 0.00 |
| Cu | -0.15 | -0.29 | 0.47 | -0.33 | 0.13 |
| Fe | -0.10 | -0.28 | 0.47 | 0.46 | 0.39 |
| Mn | -0.01 | -0.60 | 0.50 | -0.18 | 0.16 |
| Zn | -0.01 | -0.04 | -0.55 | 0.07 | -0.37 |
| B | -0.04 | -0.21 | -0.73 | 0.23 | 0.31 |
| Eigenvalues | 2.27 | 2.04 | 1.18 | 1.10 | 1.10 |
| % of variance | 24.22 | 18.52 | 16.10 | 9.97 | 9.27 |
| Cumulative % of the variance | 24.22 | 42.74 | 58.83 | 68.80 | 78.07 |
Table 5.
Multivariate tests of significance.
| Test Name | Value | Approx. F | Hypoth. DF | Error DF | Sig. |
|---|---|---|---|---|---|
| Pillai’s | 1.16 | 30.88 | 30 | 3065 | 0.00 |
| Hotellings | 1.88 | 38.12 | 30 | 3037 | 0.00 |
| Wilks | 0.23 | 35.83 | 30 | 2438 | 0.00 |
Table 6.
Canonical Correlation between two sets of variables, Eigenvalues, likelihood ratios, and their probabilities.
Table 6.
Canonical Correlation between two sets of variables, Eigenvalues, likelihood ratios, and their probabilities.
| S. No | Canonical Correlation | Squared Canonical Correlation | Pct. | Eigenvalues | Wilks L. | Prob. Pr>F |
|---|---|---|---|---|---|---|
| 1 | 0.66 | 0.43 | 40.59 | 0.76 | 0.23 | 0.00 |
| 2 | 0.63 | 0.40 | 35.76 | 0.67 | 0.41 | 0.00 |
| 3 | 0.54 | 0.29 | 21.78 | 0.41 | 0.68 | 0.00 |
| 4 | 0.18 | 0.03 | 1.78 | 0.34 | 0.97 | 0.00 |
| 5 | 0.04 | 0.00 | 0.09 | 0.00 | 0.98 | 0.61 |
Table 7.
Variance in covariates and dependent variables explained by canonical variables.
| Can Var. | Covariates | Dependent variables | ||||||
|---|---|---|---|---|---|---|---|---|
| Pct. Var. Dep. | Cum. Pct. Dep. | Pct. Var. Cov. | Cum. Pct. Cov. | Pct. Var. Dep. | Cum. Pct. Dep. | Pct. Var. Cov. | Cum. Pct. Cov. | |
| 1 | 7.18 | 7.18 | 16.58 | 16.58 | 31.05 | 31.05 | 13.45 | 12.45 |
| 2 | 0.09 | 16.27 | 22.59 | 39.17 | 16.49 | 47.54 | 6.63 | 20.09 |
| 3 | 4.32 | 20.59 | 14.86 | 54.03 | 30.19 | 77.73 | 8.78 | 28.87 |
| 4 | 0.52 | 21.12 | 16.08 | 70.11 | 13.14 | 90.86 | 0.43 | 29.30 |
| 5 | 0.03 | 21.15 | 17.44 | 87.55 | 9.14 | 100.00 | 0.15 | 29.31 |
Table 8.
Estimated Canonical weight (CW), canonical loadings (CL), the proportion of variance (PV) extracted, and Redundancy co-efficient R12 (Y/X).
Table 8.
Estimated Canonical weight (CW), canonical loadings (CL), the proportion of variance (PV) extracted, and Redundancy co-efficient R12 (Y/X).
| Y set variables | Canonical variate 1 | X set variables | Canonical variate 1 | ||
|---|---|---|---|---|---|
| Canonical weights | Canonical loadings | Canonical weights | Canonical loadings | ||
| S | 0.90 | 0.13 | N | 0.10 | 0.03 |
| Cu | 0.53 | 0.34 | P | 0.84 | 0.53 |
| Fe | 0.17 | -0.27 | K | 0.87 | 0.70 |
| Mn | 0.83 | 0.93 | pH | 0.30 | 0.70 |
| Zn | 0.91 | 0.33 | EC | 0.20 | 0.19 |
| B | 0.04 | 0.23 | |||
| PV (%) | 12 | PV (%) | 17 | ||
Disclaimer/Publisher’s Note: The statements, opinions and data contained in all publications are solely those of the individual author(s) and contributor(s) and not of MDPI and/or the editor(s). MDPI and/or the editor(s) disclaim responsibility for any injury to people or property resulting from any ideas, methods, instructions or products referred to in the content. |
© 2023 by the authors. Licensee MDPI, Basel, Switzerland. This article is an open access article distributed under the terms and conditions of the Creative Commons Attribution (CC BY) license (http://creativecommons.org/licenses/by/4.0/).
Copyright: This open access article is published under a Creative Commons CC BY 4.0 license, which permit the free download, distribution, and reuse, provided that the author and preprint are cited in any reuse.


