
Submitted:
09 August 2023
Posted:
11 August 2023
You are already at the latest version
Abstract
Flue gas desulfurization gypsum (FGD gypsum) is obtained from the desulphurization of combustion gases in fossil fuel power plants. FGD gypsum can be used to produce anhydrite binder. The effect of three independent variables such as the calcination temperature of FGD gypsum (500-800 oC), the hydration time (3-28 days) and the amount of activator (0-2 %) on the compressive strength of anhydrite binder were studied. K2SO4 and Na2SO4 were used as activators. The compressive strength of anhydrite binder was evaluated using a full factorial design. The multiple linear regression models were developed to correlate the significant variables to the compressive strength of anhydrite binder. The experimental results and statistical analysis showed that the hydration time had the biggest impact on the compressive strength of anhydrite binder using K2SO4 and Na2SO4. K2SO4 made a greater influence on the compressive strength than Na2SO4. The results of modeling indicated that the individual variables had a larger effect on the compressive strength of anhydrite binder than their interaction. The mean absolute percentage error between experimental and calculated values of compressive strength was less than 10 %.
Keywords:
factorial design
; FGD gypsum
; anhydrite binder
; compressive strength
; activators
1. Introduction
Synthetic gypsum is produced as a by-product of an industrial process. Flue gas desulfurization (FGD) gypsum is one of the synthetic gypsum. In 2020, global FGD gypsum production reached an estimated 255 million tons, primarily in Asia (55%), followed by Europe (22%), North America (18%), and the rest of the world (5%) [1]. FGD gypsum is obtained from the desulphurization of combustion gases in fossil fuel power plants. The combustion of sulphureous fossil fuels, such as anthracite, bituminous coal, lignite, and oil produces sulphur dioxide (SO2) which, if it is not removed in a flue gas desulphurization plant, escapes into the atmosphere with the flue gases [2]. Sulphur dioxide is one of the causes of atmosphere and environment pollution. Acid rain results when sulphur dioxide is emitted into the atmosphere. Sulphur dioxide contacts with water and oxygen in the atmosphere to form sulphuric acid [3]. Acid rain has negative impact on soil, aquatic ecosystem, forests trees, crop plants, lower plants, physiological activities of animals and human health. Uncontrolled emission of SO2 within SOx causes a wide range of diseases including destabilization of the heartbeat, skin cancer, asthma, cough, headache, throat and nose irritations [4]. It also effects on materials and buildings [5].
The most popular method to remove sulphur dioxide from flue gas is wet scrubbing method. The flue gas is countercurrent washed with aqueous suspensions of limestone (CaCO3) or lime (Ca(OH)2) producing calcium sulphite (CaSO3) in aqueous suspension. Finally, calcium sulphite is further oxidized with atmospheric oxygen to calcium sulphate dihydrate (CaSO4∙2H2O) or gypsum – so called flue gas desulfurization gypsum (FGD gypsum) [2]. Usually, FGD gypsum has a higher purity (96-99 %) [6] and lower level of impurities than most natural gypsum (80-96 %) [7]. Because FGD gypsum is mainly composed of calcium sulphate dihydrate (CaSO4·2H2O), it can replace natural gypsum without further processing [8]. Therefore, manufacturing FGD gypsum has positive environmental and economic benefits.
FGD gypsum can be a product, which has many applications in different industries. It is used in agriculture [9,10], civil engineering [11,12], water treatment [13], sorption of phosphorus ions [14] and glass industry [2]. Also FGD gypsum can be used in construction industry. It is used as setting retarder in Portland cement [8,15,16,17], calcium sulphoaluminate cement [18], as high-strength building materials [19], as a component of gypsum plaster [20]. By adding Q phase (Quaternary phase (Q phase, Ca20Al13Si3Mg3O68) [21] or cement and mineral powder [22] to FGD gypsum, it is possible to reduce the water solubility of FGD gypsum, softening coefficient, water absorption, increase comprehensive considerations of strength, speed-up hydration, and to improve microstructure.
FGD gypsum can be calcined to produce α-calcium sulphate hemihydrate (α-CaSO4∙0.5H2O), β-calcium sulphate hemihydrate (β-CaSO4∙0.5H2O) or calcium sulphate (anhydrite, CaSO4). Manufacturing and utilization of α-CaSO4∙0.5H2O is widely investigated [23,24,25,26]. However, little works are focused on β-CaSO4∙0.5H2O [27] and CaSO4 production. FGD gypsum was calcined at temperature range of 500-750 oC and soluble activators were used for the production of anhydrite binder with suitable physical-mechanical properties [28,29]. The FGD was calcined at 650 °C for 4 h and used in the mixture to produce self-leveling floors [30]. Anhydrite cement was obtained from FGD gypsum which was burnt together with activators such as glass and cupola dust at 800 and 900 oC [31].
The aim of this research is to investigate the impact of the factors, calcination temperature of FGD gypsum (500-800 oC), hydration time (3-28 days) and amount (0-2 %) of activators (K2SO4 and Na2SO4), on the compressive strength of anhydrite binder produced from FGD gypsum using a 23 full factorial (DOE) design and develop a mathematical model using multiple linear regression to predict the compressive strength of anhydrite binder within the defined limits.
2. Materials and methods
2.1. Materials
The results of chemical composition (Table 1) showed that FGD gypsum was very purity, CaSO4∙2H2O was 96.22 %. The pH was 6.45. The specific surface area Sspec was less than 100 m2/kg.
The X-ray diffraction (XRD) analysis (Figure 1a) confirmed that gypsum CaSO4∙2H2O dominates in FGD gypsum. The results of simultaneous thermal analysis (STA) (Figure 1b) showed that gypsum dehydrated and water evaporated in temperature range of 105-190 oC. Insoluble anhydrite formed at temperatures between 340 oC to 370 oC.
K2SO4 and Na2SO4 were used as activators to accelerate the hydration and hardening of anhydrite binder. Either 1 % or 2 % of activator by the weight of anhydrite was added together with the gauging water.
2.2. Methods
X-ray fluorescence spectroscopy (XRF) was carried out with a Bruker X-ray S8 Tiger WD (Germany) spectrometer equipped with a Rh tube with the energy of up to 60 kV. The powder was passed through an 80 μm sieve and pressed to 5×40 mm cylindrical tablets. The samples were measured in He atmosphere. SPECTRAplus QUANT EXPRESS software was used to analyze the data.
X-ray diffraction analysis (XRD) was performed on a D8 Advance difractometer (Bruker AXS, Karlsruhe, Germany) with Bragg-Brentano geometry using Ni-filtered CuKα radiation and graphite monochromator, operating at 40 kV and 45 mA. The measurement range was 3–70 °(2θ) in steps of 2θ = 0.02°.
Simultaneous thermal analysis (STA) was carried out on a LINSEIS STA PT 1000 (Germany) thermal analyzer with ceramic sample handlers and crucibles of Pt-Rh. The heating rate was set to 10 °C/min, the range of temperature was from 25 °C up to 945 °C under N atmosphere.
Scanning electron microscopy (SEM) was performed with OXSFORD ISIS LEO 440i using an accelerating voltage of 20 kV at working distance of 10 mm.
FGD gypsum was calcined at temperature range of 500-900 oC for 1 hour in a muffle furnace.
Density was measured with automatic gas pycnometer Quantachrome Instruments Ultrapyc 1200e (USA). The Blaine method was used to determine the specific surface area Sspec in accordance with the European Standard EN 196-6 [32].
Physical-mechanical properties of anhydrite binder were determined according to the European Standard EN 196-3, EN 196-1 [33,34]. Samples were hardened in 90 % relative humidity environment for 28 days and compressed by press ELE AutoTest.
Full factorial (DOE) design for three independent factors at two levels (23) was used to study the effect of factors on a response. Calcination temperature of FGD gypsum, hydration time and amount of activators were chosen as independent factors. Compressive strength of anhydrite binder was chosen as response. Each factor had two levels, low and high, coded as (-1) and (+1). 8 experimental runs were performed with three independent factors [35].
Multiple linear regression as the statistical method was used in DOE data analysis [36]. It shows the relationship between multiple independent factors and a response. A general multiple linear regression model is [35,37]:
where:
Y – a response,
xi, xj – an independent factor,
b0 – an intercept,
bi – a linear coefficient,
bij – an interaction coefficient.
The Student‘s t-test was used to evaluate the significance of coefficients in multiple regression. The sign of coefficient indicate whether the response increases (+) or decreases (-) as independent factor increases. The value of coefficient shows how much the mean of response changes when one independent factor increases by one unit while other factors are held constant [35]. Fisher’s test was used to evaluate the adequacy of model [38]. The calculations were done at 95 % confidence interval and a significance level α less than 0.05 [38]. The quality (suitability) of the multiple linear regression model fitness was expressed by the coefficients of determination (R2) and the mean absolute percentage error (MAPE). The model is a good fit for the data if R2 value is in the range 0.8-1. The model is highly accurate if MAPE is less than 10 % [39].
3. Results and discussion
3.1. Calcination temperature
FGD gypsum was calcined at temperature range of 500-900 oC. The hydration, physical and mechanical properties of anhydrite binder was investigated. The size and surface of anhydrite particles have influence on the properties of anhydrite. To determine the impact of calcination temperature on the particles of anhydrite, the density was measured and SEM was performed. The results showed that the density of anhydrite calcined at different temperatures increases gradually (Figure 2). The relationship of density and calcination temperature can be described by a linear regression function. The coefficient of determination R2 indicated perfect correlation (R2=1).
SEM analysis (Figure 3) confirmed that increased calcination temperature enabled to form the denser particles. Similar results were obtained by Kersten Elert et. Al [40].
In order to determine the effect of calcination temperature on the mechanical properties, the water (W) and anhydrite (A) ratio (W/A) and compressive strength were measured. The results showed that the water and anhydrite ratio (W/A) decreased from 0.47 to 0.35 as the calcination temperature increased (Figure 4). The Pearson’s correlation coefficient r (-0.96) indicated a very high negative linear relationship between W/A and calcination temperature. The coefficient of determination R2 showed very high correlation (R2=0.927).
As the calcination temperature increased, the compressive strength of anhydrite binder decreased at its early age (up to 3 days) and increased after 28 days (Table 2). After 28 days, the compressive strength of anhydrite binder produced at 900 oC and 500 oC differed more than 6 times.
In summary, as the calcination temperature of FGD gypsum increased, the anhydrite particles became smaller and denser, for anhydrite binder needed smaller amount of gauging water and binder became stronger. The obtained results were similar to the results of Ludwig et. al. [28].
3.2. Activators and amount of activator
The influence of the activators (K2SO4 and Na2SO4) and amount of activator (1 % or 2 %) on the hydration of anhydrite binder produced at 500 oC and 800 oC was examined. The degree of hydration at different times of hydration was calculated and XRD analysis was performed.
The obtained results showed that anhydrite obtained at 500 oC (Figure 5a) hydrates faster than anhydrite obtained at 800 oC (Figure 5b).
Anhydrite obtained at a temperature of 500 oC was fully hydrated after 28 days (degree of hydration was 0.99), while the degree of hydration of anhydrite obtained at a temperature of 800 oC was only 0.73. Hydration of the anhydrite binder was influenced by the structure of the material. At a temperature of 500 oC, the water dispersed the gypsum crystals. Their surface was crannied (Figure 3b). Such material had a higher internal porosity and needed more gauging water (W/A=0.47, Figure 4). Anhydrite binded and hardened very quickly (Initial setting time was 2 minutes, Final setting time was 3 minutes), but gypsum stone was not very strong (compression strength after 3 days was 2.04 MPa, Table 2). At the temperature of 800 oC, the crystal lattice of the material became denser, less water was needed (W/A=0.37, Figure 4). Anhydrite set and hardened slowly (Initial setting time was 100 minutes, Final setting time was 135 minutes), and the compressive strength after 3 days of hydration was 0.51 MPa, Table 2). Activators were needed to accelerate hydration.
When using both K2SO4 (Figure 5a,b) and Na2SO4 (Figure 5c,d) as activators, hydration was significantly activated. After burning the smoke gypsum at a temperature of 500 oC and using K2SO4, after 1 day the degree of hydration already reached 0.95 (Figure 5a), which was more than two times faster than without using the additive (the degree of hydration was 0.42). When using Na2SO4, hydration was slower (Figure 5c) than when using K2SO4 (Figure 5a). However, using both one and the other additive, the degree of hydration reached 0.99 after 28 days.
Anhydrite obtained at the temperature of 800 oC and with the use of activators hydrated much faster compared to anhydrite without additives. After 3 days, the degree of hydration changed 8 times (Figure 5b,d).
When using K2SO4 and Na2SO4, complex salts were formed during hydration: syngenite K2Ca(SO4)2·H2O and glauberite Na2Ca(SO4)2. Anhydrite hydrated according to reaction equations (2) – (5).
XRD analysis confirmed the formation of syngenite and glauberite. During hydration of anhydrite obtained at a temperature of 500 oC and using both 1 % and 2 % activator K2SO4, syngenite was recorded after 10 min (Figure 6a,b). Meanwhile, during hydration of the obtained anhydrite at 800 oC, syngenite was recorded after 1 day. Similar XRD results were obtained using Na2SO4, when glauberite was formed during hydration (Figure 7).
Thus, it is possible to state that K2SO4 and Na2SO4 made a large effect on the hydration of anhydrite binder at its early age (up to 3 day). After 28 days the amount (1 % or 2 %) of either K2SO4 or Na2SO4 almost no influence on the compressive strength was noticed.
3.3. Full factorial design and Statistical methods
The purpose of this part was to use full factorial design and statistical methods to investigate the impact of independent factors on the response and develop a mathematical model for predicting response values within the defined limits.
Three independent factors, calcination temperature of FGD gypsum (x1), hydration time (x2) and amount of activator (x3), were chosen. The impact of these factors on the compressive strength of anhydrite binder using K2SO4 (Y1) and Na2SO4 (Y2) was investigated using a 23 full factorial design. Three factors, two levels and the range were shown in Table 3.
The design matrix for three independent factors was presented in Table 4 for the 8 experimental runs using K2SO4 and Na2SO4.
The regression equation based on the first-order model with three factors and their interaction terms was given by the following expression [41]:
where:
– the response, the measured compressive strength of anhydrite binder using different activators,
x1, x2, x3 – the independent factors, calcination temperature, hydration time and amount of activator,
x12, x13, x23 – the interaction between independent factors,
b0 – the intercept term,
b1, b2, b3 – the linear coefficients for the main factors,
b12, b13, b23 – the interaction coefficients for the interaction between corresponding factors.
The regression coefficients b0-b23 in Equation (6) were calculated and the significance of coefficients (Student‘s t-test) was determined. All coefficients were significant at 95 % confidence interval.
The regression equations describing relationship between the significant factors and the compressive strength of anhydrite binder using K2SO4 and Na2SO4 were presented in Equation (7) and Equation (8), respectively:
where:
– the response, the calculated compressive strength of anhydrite binder, MPa;
The results indicated that the calcination temperature (x1), the hydration time (x2), amount of activator (x3) and the interaction between calcination temperature and hydration time (x12) had a significant strong positive impact on the compressive strength of anhydrite binder using K2SO4 and Na2SO4. The positive impact means that as the mentioned factors and their interaction increase, the compressive strength also increases. The highest value of all coefficients in Equation (7) and Equation (8) had the coefficient for hydration time (b2). The value of mentioned coefficient was +7.32 and +7.29, respectively. This coefficient (b2) was bigger more than 2 times than the coefficient b1 (+3.16 and +3.06, respectively) and more than 1.5 time than the coefficients b3 (+4.63 and +4.14, respectively) and b12 (+4.96 and +4.93, respectively). Thus, the hydration time (x2) was the most significant factor than the mentioned main factors and their interaction.
The values of the coefficient for the amount of activator (b3) also were similar in Equation (7) and Equation (8). It means that the effect of amount of activator to the compressive strength using above-mentioned activators was similar. However when K2SO4 was used, the influence of this variable was bigger compared with Na2SO4. This may be influenced by the higher activity of the potassium salt [42]. The coefficient for the calcination temperature (b1) was similar in Equation (7) and Equation (8). It means that the impact of calcination temperature to the compressive strength using above-mentioned activators was similar, too. The values of the coefficient for interaction between calcination temperature and hydration time (b12) were also positive and effect on the compressive strength was very strong when K2SO4 and Na2SO4 were used.
The coefficient for interaction between calcination temperature and amount of activator (b13) was negative (-0.71 and -0.81). It indicated a negative and weak effect on the compressive strength using K2SO4 and Na2SO4.
According to regression analysis, it can be concluded that the hydration time (x2) made the strongest influence on the compressive strength using K2SO4 and Na2SO4. The interaction between calcination temperature and hydration time (x12) and the amount of activator (x3) made less impact on the response but it was very significant compared with hydration time (x2). Meanwhile, when K2SO4 was used, the amount of activator (x3) indicated stronger effect on the compressive strength compared with Na2SO4.
The coefficients of determination (R2) and the mean absolute (MAPE) between experimental and calculated values of compressive strength were used to evaluate the obtained models suitability.
The coefficient of determination (R2) for Equation (7) and Equation (8) was found to be 0.9995 and 0.9996, respectively, and the mean absolute percentage error (MAPE) was calculated as 9.53 % and 8.48 %, respectively. Since the R2 value was close to 1 and MAPE was less than 10 %, it is possible to state that regression Equation (7) and Equation (8) were reliable to forecast the relation between the significant factors, their interaction and the compressive strength of anhydrite binder.
3.4. Model Verification
The purpose of this part was to verify the obtained models. The compressive strength was calculated using the obtained Equation (7) and Equations (8) and measured under the same working conditions, using the anhydrite produced at 700 oC temperature and using 2 % of activator. The results were obtained after 3, 7 and 28 days. The experimental and calculated values of the compressive strength were presented in Figure 8. MAPE for the compressive strength of anhydrite binder using K2SO4 and Na2SO4 were 7.46 % and 9.39 %, respectively. It showed a good agreement between the experimental data and the calculation using obtained equations.
In summary, the mathematical models using multiple linear regression could be used to predict the compressive strength of anhydrite binder within the defined limits.
4. Conclusions
FGD gypsum was high purity and could be used to produce anhydrite binder. A 23 full factorial design and statistical methods were used to investigate the impact of the main factors, calcination temperature of FGD gypsum (500-800 oC), hydration time (3-28 days) and amount (0-2 %) of activators (K2SO4 and Na2SO4), and their interactions on the compressive strength of anhydrite binder.
The statistical analysis showed that calcination temperature, hydration time, amount of activator and interaction between calcination temperature and hydration time had a significant strong positive impact on the compressive strength of anhydrite binder using K2SO4 and Na2SO4. The results indicated that the hydration time had the strongest positive effect on the response. K2SO4 made a greater influence on the compressive strength than Na2SO4.
The mathematical models using multiple linear regression were developed. The coefficients of determination (R2 is close to 1) and the mean absolute percentage error (MAPE is less than 10 %) indicated that the obtained models were suitable to predict the compressive strength of anhydrite binder produced from FGD gypsum within the defined limits.
Author Contributions
Validation, writing—original draft, visualization, writing – review & editing, statistical analysis, N. K.; Conceptualization, methodology, investigation, formal analysis, data curation, writing – review & editing, D. N.; Validation, writing – review & editing, funding acquisition, V. J. All authors have read and agreed to the published version of the manuscript.
Funding
This research received no external funding.
Institutional Review Board Statement
Not applicable.
Informed Consent Statement
Not applicable.
Data Availability Statement
Not applicable.
Conflicts of Interest
The authors declare no conflict of interest.
References
- Maiti, S., Jain, N., & Malik, J. A comprehensive review of flue gas desulphurized gypsum: Production, properties, and applications. Constr. Build Mater. 2023, 393, 131918. [CrossRef]
- Elvers, B., Hawkins, S., Schuz, G. Ullmann‘s Encyclopedia of Industrial Chemistry, VCH Weinheim 2001.
- EPA United States Environmental Protection agency. Acid rain program: Acid rain. Available online: https://www.epa.gov/airmarkets/acid-rain-program (accessed on 10 July 2023).
- Munawer, M. E. Human health and environmental impacts of coal combustion and post-combustion wastes. J. Sustain. Min. 2018, 17, 87–96. [Google Scholar] [CrossRef]
- Singh, A.; Agrawal, M. Acid rain and its ecological consequences. J. Environ. Biolog. 2008, 29, 15–24. [Google Scholar]
- Ramme-Tharaniyil. We Energies Coal Combustion Products Utilization Handbook, 3rd Edition, Wisconsin Electric Power Company, 2013.
- Jimenez-Rivero, A., Garcia-Navarro, J. Characterization of quality recycled gypsum and plasterboard with maximized recycled content. Materiales de Construccion, 2017, 328, 137. [CrossRef]
- Koukouza, N., Vasilatos, C. Mineralogical and chemical properties of FGD gypsum from Florina, Greece. J. Chem. Technol. Biotechnol. 2008, 83, 20–26. [CrossRef]
- Wang, J., Yang, P. Potential flue gas desulfurization gypsum utilization in agriculture: A comprehensive review. Renew. Sustain. Energy Rev. 2018, 82, 1969–1978. [CrossRef]
- Kaur, H.; Williard, K. W.; Schoonover, J. E.; Singh, G. Impact of Flue Gas Desulfurization Gypsum Applications to Corn-Soybean Plots on Surface Runoff Water Quality. Water, Air, & Soil Pollution. 2022, 233, 72. [Google Scholar]
- Zhong, S., Ni, K., Li, J. Properties of mortars made by uncalcined FGD gypsum-fly ash-ground granulated blast furnace slag composite binder. Waste Manag. 2012, 32, 1468–1472. [CrossRef]
- Zhang, C., Hu, Z., Cheng, G., Wu, C., Li, J., Jiang, W., ... & Wang, W. Collaborative recycling of red mud and FGD-gypsum into multi-shell cold bonded lightweight aggregates: Synergistic effect, structure design and application in sustainable concrete. Constr. Build. Mater. 2023, 379, 131134. [CrossRef]
- Cheng, P., Chen, D., Liu, H., Zou X., Zhang, Y., Xie, J., Qing, C., Chen, T. Enhanced adsorption capacity for phosphate in wastewater from thermally activated flue gas desulfurization gypsum. J. Chem. Technol. Biotechnol. 2018, 93, 1733–1741. [CrossRef]
- Hamid, A., Wilson, A. E., Torbert, H. A., & Wang, D. (2023). Sorptive removal of phosphorus by flue gas desulfurization gypsum in batch and column systems. Chemosphere. 2023, 320, 138062. [CrossRef]
- Papageorgiou, G.; Tzouvalas, S.; Tsimas, S. Use of inorganic setting retarders in cement industry. Cem. Concr. Comp. 2005, 27, 183–189. [Google Scholar] [CrossRef]
- Cailahua, M. C.; Moura, F. J. Technical feasibility for use of FGD gypsum as an additive setting time retarder for Portland cement. J. Mater. Res. Technol. 2018, 7, 190–197. [Google Scholar] [CrossRef]
- Xu, Z., Hu, D., An, R., Lin, L., Xiang, Y., Han, L., ... & Wu, J. Preparation of superfine and semi-hydrated flue gas desulfurization gypsum powder by a superheated steam powdered jet mill and its application to produce cement pastes. Case Studies in Constr. Mater. 2022, 17, e01549. [CrossRef]
- Xu, L.; Wu, K.; Li, N.; Zhou, X.; Wang, P. Utilization of flue gas desulfurization gypsum for producing calcium sulfoaluminate cement. J. Clean. Product. 2017, 161, 803–811. [Google Scholar] [CrossRef]
- Lei, D.-Y., Guo, L.-P., Sun, W., Lui, J.-P. Miao, C.-W. Study on properties of untreated FGD gypsum-based high-strength building materials. Constr.Build. Mater. 2017, 153, 765–773. [CrossRef]
- Pedreño-Rojas, M. A., De Brito, J., Flores-Colen, I., Pereira, M. F. C., & Rubio-de-Hita, P. Influence of gypsum wastes on the workability of plasters: Heating process and microstructural analysis. J. Build. Eng. 2020, 29, 101143. [CrossRef]
- Wu, C., He, J., Wang, K., Yang, L., & Wang, F. Enhance the mechanical and water resistance performance of flue gas desulfurization gypsum by quaternary phase. Constr. Build. Mater. 2023, 387, 131565. [CrossRef]
- Gou, M., Zhao, M., Zhou, L., Zhao, J., Hou, W., Ma, W., & Hou, Z. Hydration and mechanical properties of FGD gypsum-cement-mineral powder composites. J.Build. Eng. 2023, 69, 106288. [CrossRef]
- Miao, M., Feng, X., Wang, G., Cao, S., Shi, W., Shi, L. Direct transformation of FGD gypsum to calcium sulfate hemihydrate whiskers: Preparation, simulations, and process analysis. Particuology. 2015, 19, 53–59. [CrossRef]
- iu, C.; Zhao, Q.; Wang, Y.; Shi, P.; Jiang, M. Hydrothermal synthesis of calcium sulfate whisker from flue gas desulfurization gypsum. Chinese J. Chem. Eng. 2016, 24, 1552–1560. [Google Scholar] [CrossRef]
- Yang, L.C., Guan, B.H., Wu, Z.B. Characterization and precipitation mechanism of α-calcium sulfate hemihydrate growing out of FGD gypsum in salt solution. Science in China Series E: Technolgical Sciences. 2009, 52, 2688–2694.
- Kostic-Pulek, A.; Marinkovic, S.; Popov, S.; Djuricic, M.; Djinovic, J. The treatment of gypsum as a product of flue gas desulphurization process. Ceram.-Silik. 2005, 49, 115–119. [Google Scholar]
- Maiti, S.; Jain, N.; Malik, J.; Baliyan, A. Light Weight Plasters Containing Vermiculite and FGD Gypsum for Sustainable and Energy Efficient Building Construction Materials. J. Institut. Eng. (India): Series A, 2023; 1–12. [Google Scholar]
- Ludwig, U. Khan, N. Y., Hubner, G. High performance anhydrite and hemihydrate binders from flue gas desulphurization and chemical gypsum. 4th International Conference on FGD and Other Synthetic Gypsum, 1995, 19-1–19-23.
- Fridrichova, M., Kulisek, K., Novak, J., Dvarakova, V. Some aspects of FGD-gypsum utilization. 14. Internationale Baustofftagung, Ibausil, Weimar, 2000, 1-0241-0246.
- Carvalho, H. D. S., Rocha, J. C., & Cheriaf, M. Influence of bottom ash and red mud additions on self-leveling underlayment properties. Cerâmica. 2022, 68, 199–210.
- Leškevičienė, V.; Nizevičienė, D.; Kybartienė, N.; Valančius, Z. Investigation of anhydrite cement production from flue gas desulphurization gypsum with the addition of bottle glass or cupola dust. Cement Wapno Beton 2018, 1, 30–39. [Google Scholar]
- BSI British Standard, Methods of testing cement, Determination of fineness, BS EN 196-6:2005.
- BSI British Standard, Methods of testing cement, Determination of setting times and soundness BS EN 196-3:2005.
- BSI British Standard, Methods of testing cement, Determination of strength BS EN 196-1:2005.
- Montgomery, D. C. Design and analysis of experiments. 8th Edition, Hoboken, New Jersey, 2013.
- Guo, H. , Mettas, A. Design of Experiments and Data Analysis, 2012. [Google Scholar]
- Reliasoft Corporation, Experimental design & Analysis Reference, USA.
- Wackerly, D., Mendenhall, W., Scheaffer, R.L. Mathematical Statistics with Applications, 7th Edition, Thomson Brooks/Cole, 2008.
- Lewis, C. D. Industrial and business forecasting methods: A Radical guide to exponential smoothing and curve fitting. London, Boston, Butterworth Scientific, 1982.
- Elert, K., Bel-Anzué, P., & Burgos-Ruiz, M. (2023). Influence of calcination temperature on hydration behavior, strength, and weathering resistance of traditional gypsum plaster. Constr. Build. Mater. 2023, 367, 130361. [CrossRef]
- Seki, Y., Seyhan, S., Yurdakoc, M. Removal of boron from aqueous solution by adsorption on Al2O3 based materials using full factorial design. Journal of Hazardous Materials. 2006, B138, 60-66. [CrossRef]
- Leškevičienė, V.; Nizevičienė, D. Influence of the setting activators on the physical mechanical properties of phosphoanhydrite. Chem. Ind. and Chem. Eng. Quarterly. 2014, 20, 233–240. [Google Scholar] [CrossRef]
Figure 1.
XRD pattern (a) and STA curves (b) (1 – TG, 2 – DSC) of FGD gypsum. Indexes: G – gypsum (PDF No. 00-033-0311), Q – quartz (PDF No. 00-046-1045).
Figure 1.
XRD pattern (a) and STA curves (b) (1 – TG, 2 – DSC) of FGD gypsum. Indexes: G – gypsum (PDF No. 00-033-0311), Q – quartz (PDF No. 00-046-1045).
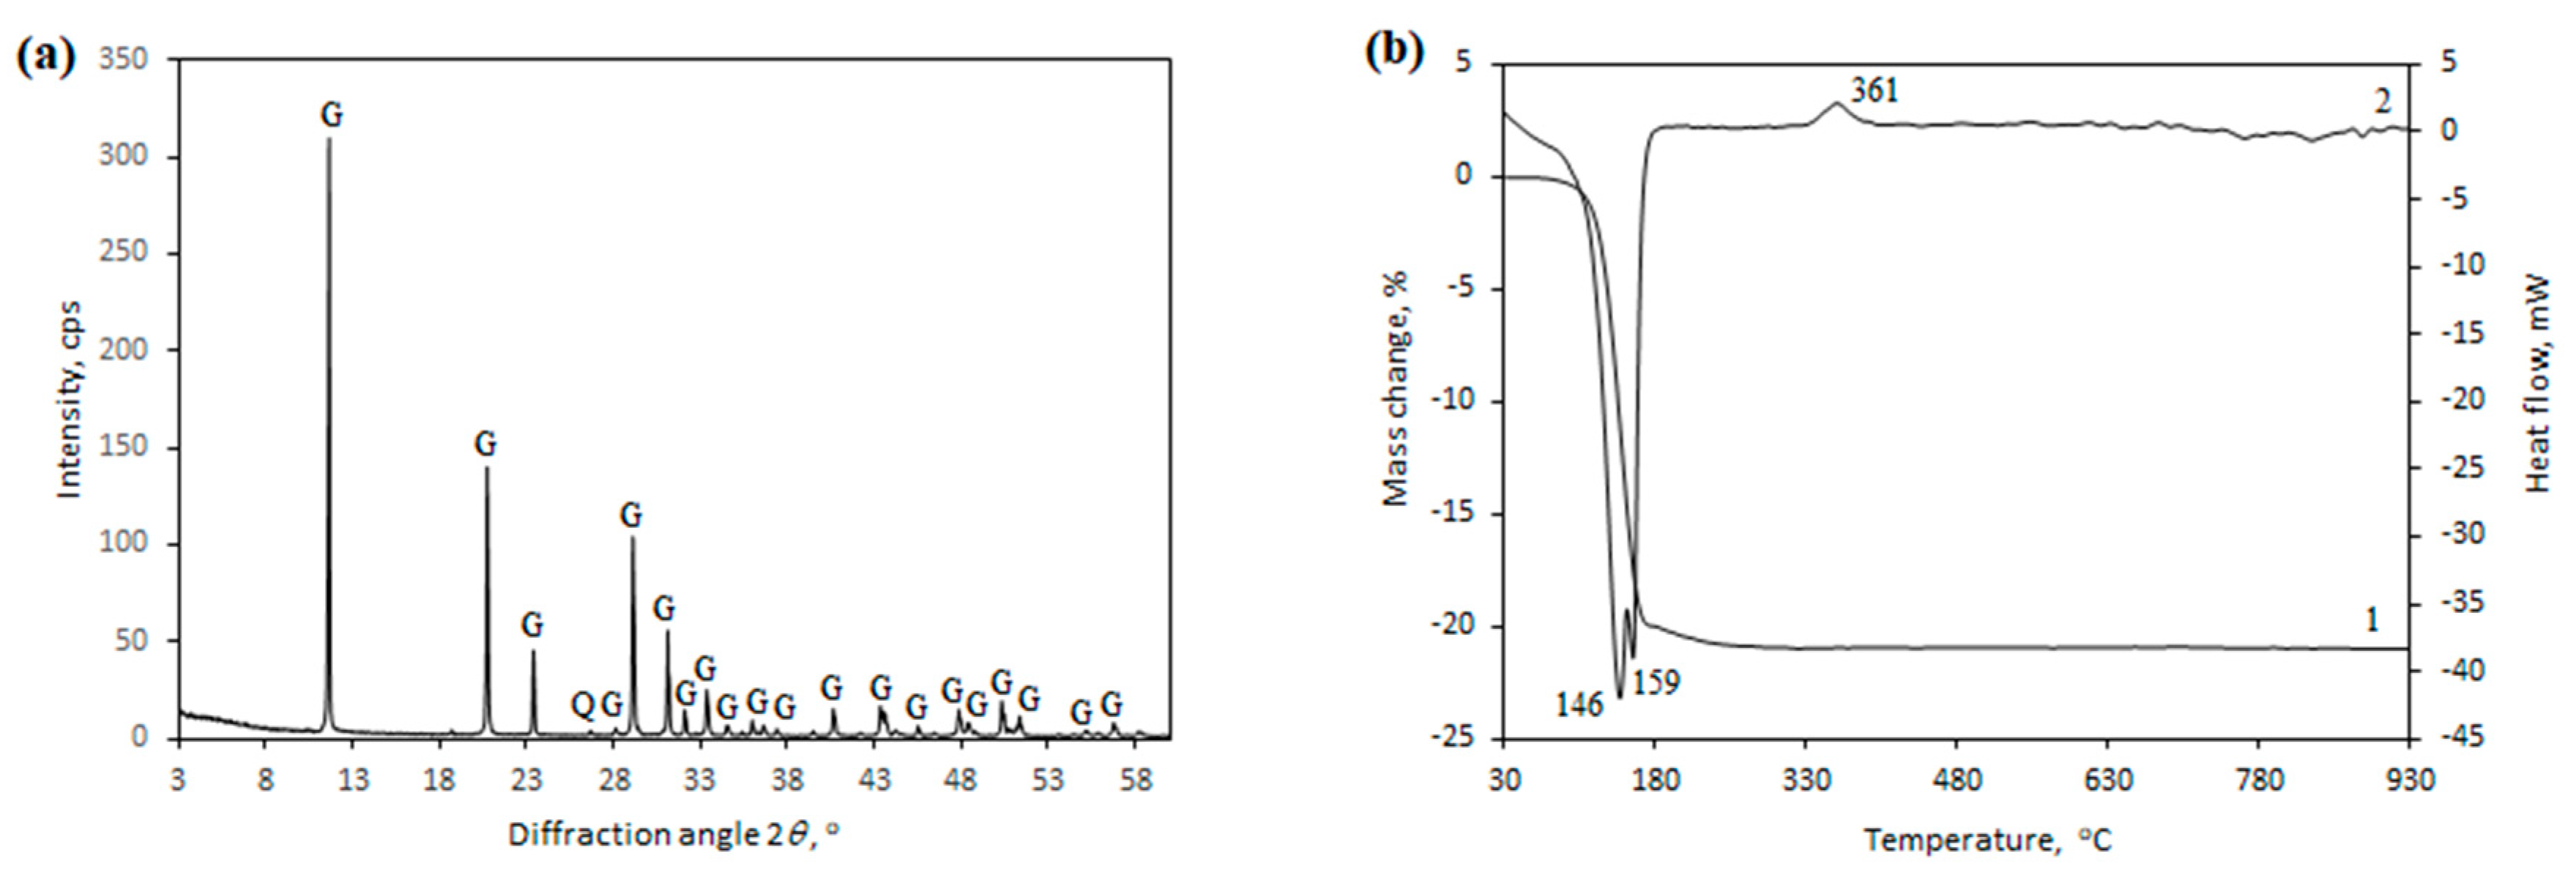
Figure 2.
Effect of calcination temperature of anhydrite on density.
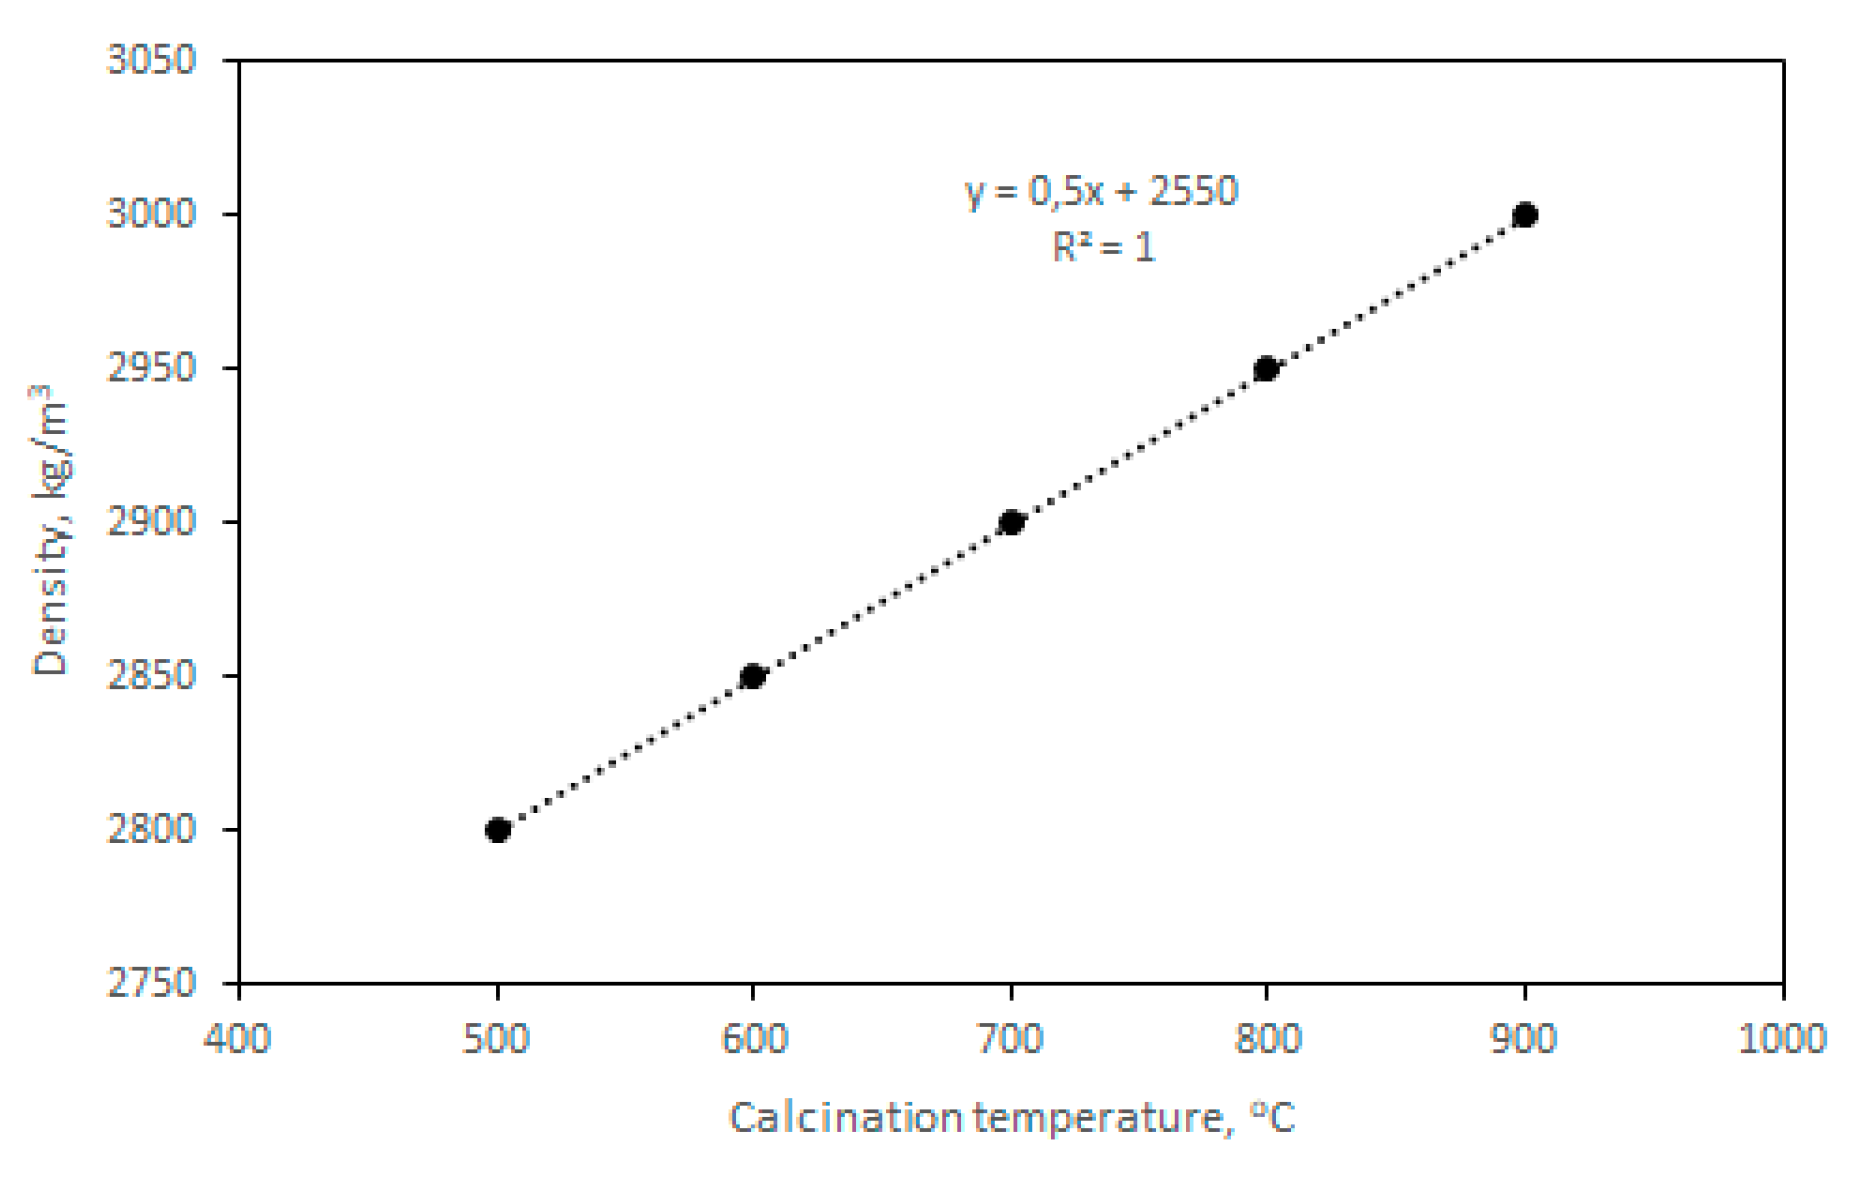
Figure 3.
SEM of FGD gypsum (a) and anhydrite produced at 500oC (b), 700oC (c) and 900oC (d).
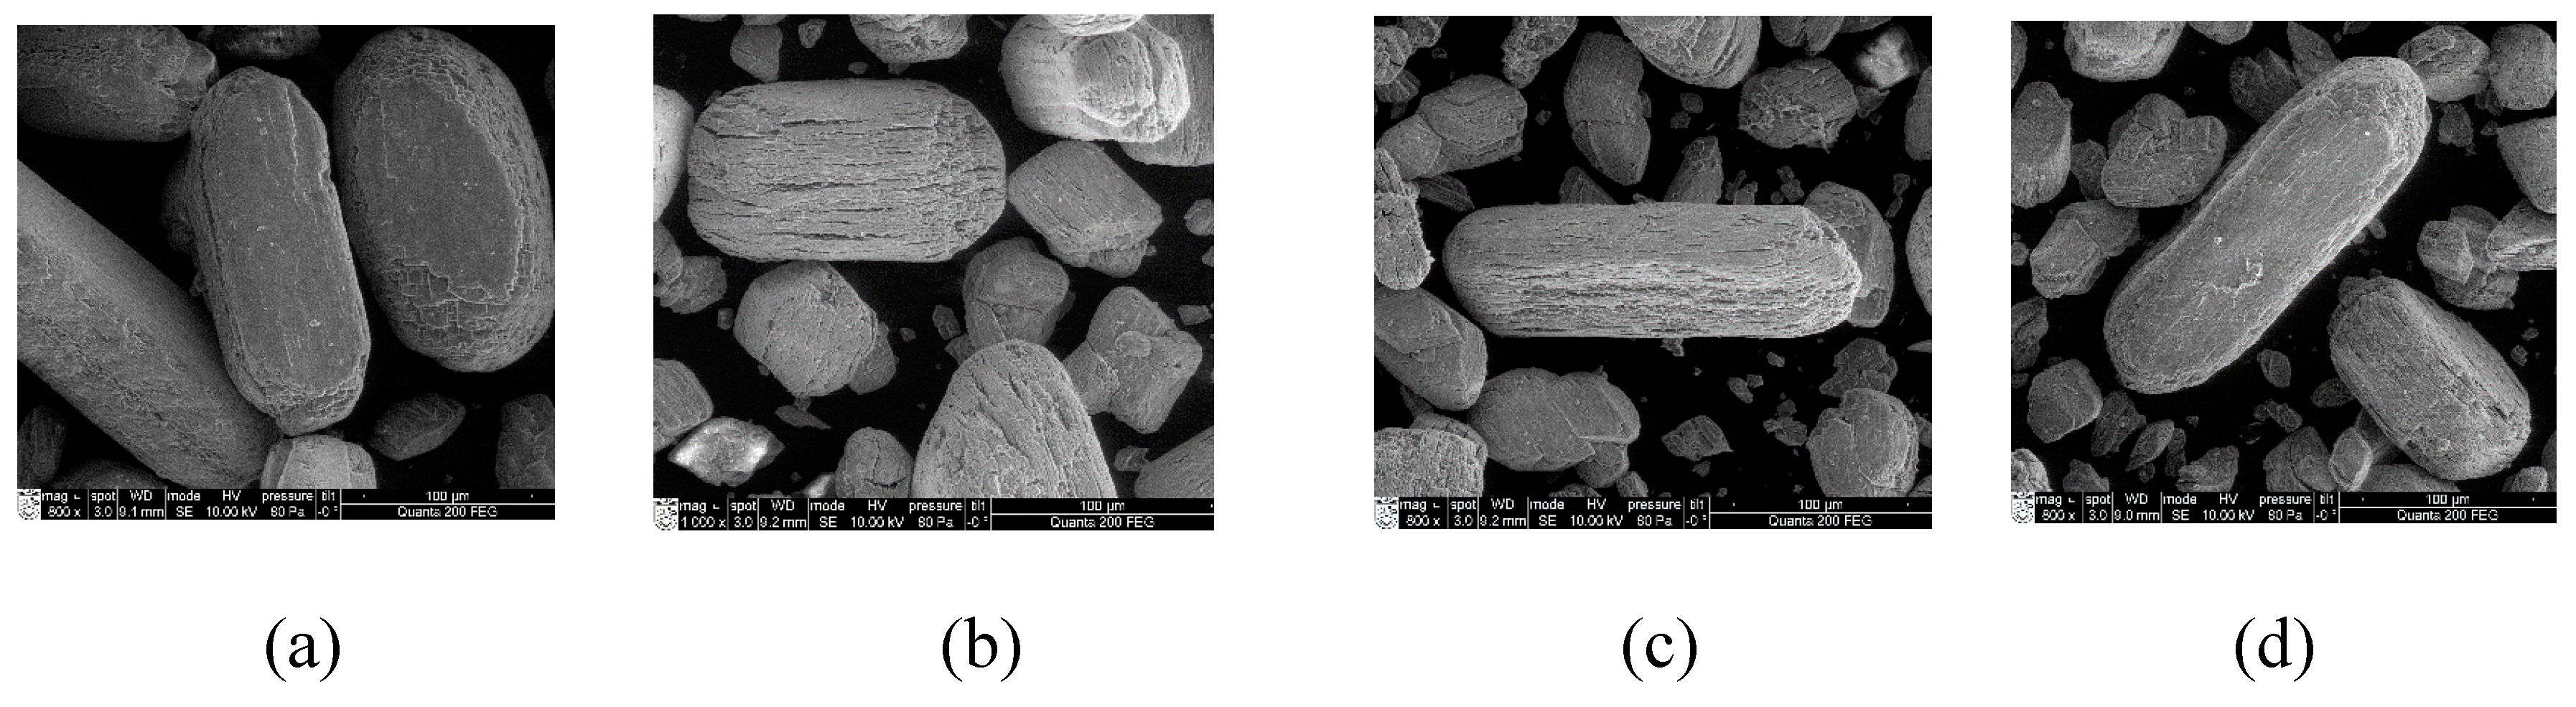
Figure 4.
Effect of calcination temperature of anhydrite on water and anhydrite ratio.
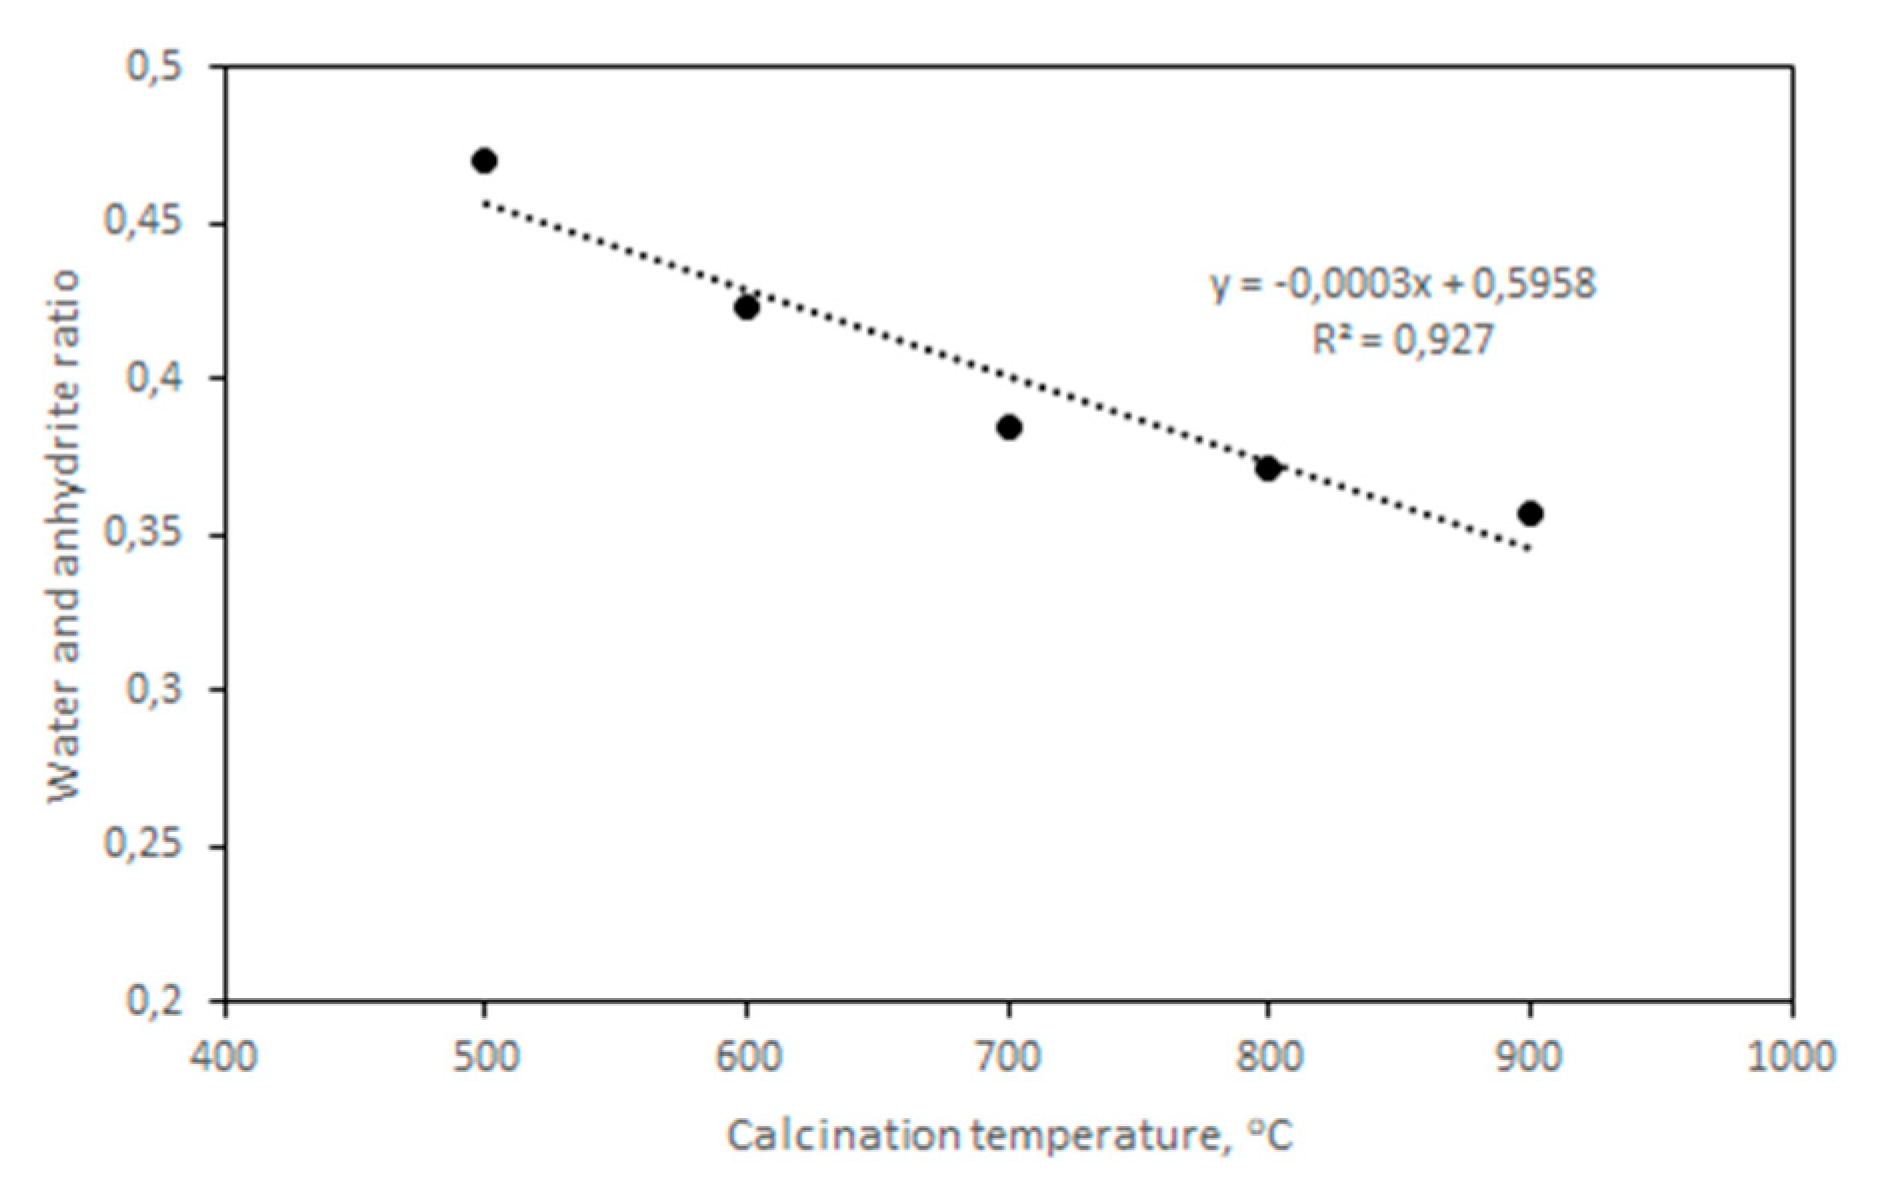
Figure 5.
Degree of hydration of anhydrite produced at 500 oC and 800 oC temperature using K2SO4 (a, b) and Na2SO4 (c, d).
Figure 5.
Degree of hydration of anhydrite produced at 500 oC and 800 oC temperature using K2SO4 (a, b) and Na2SO4 (c, d).
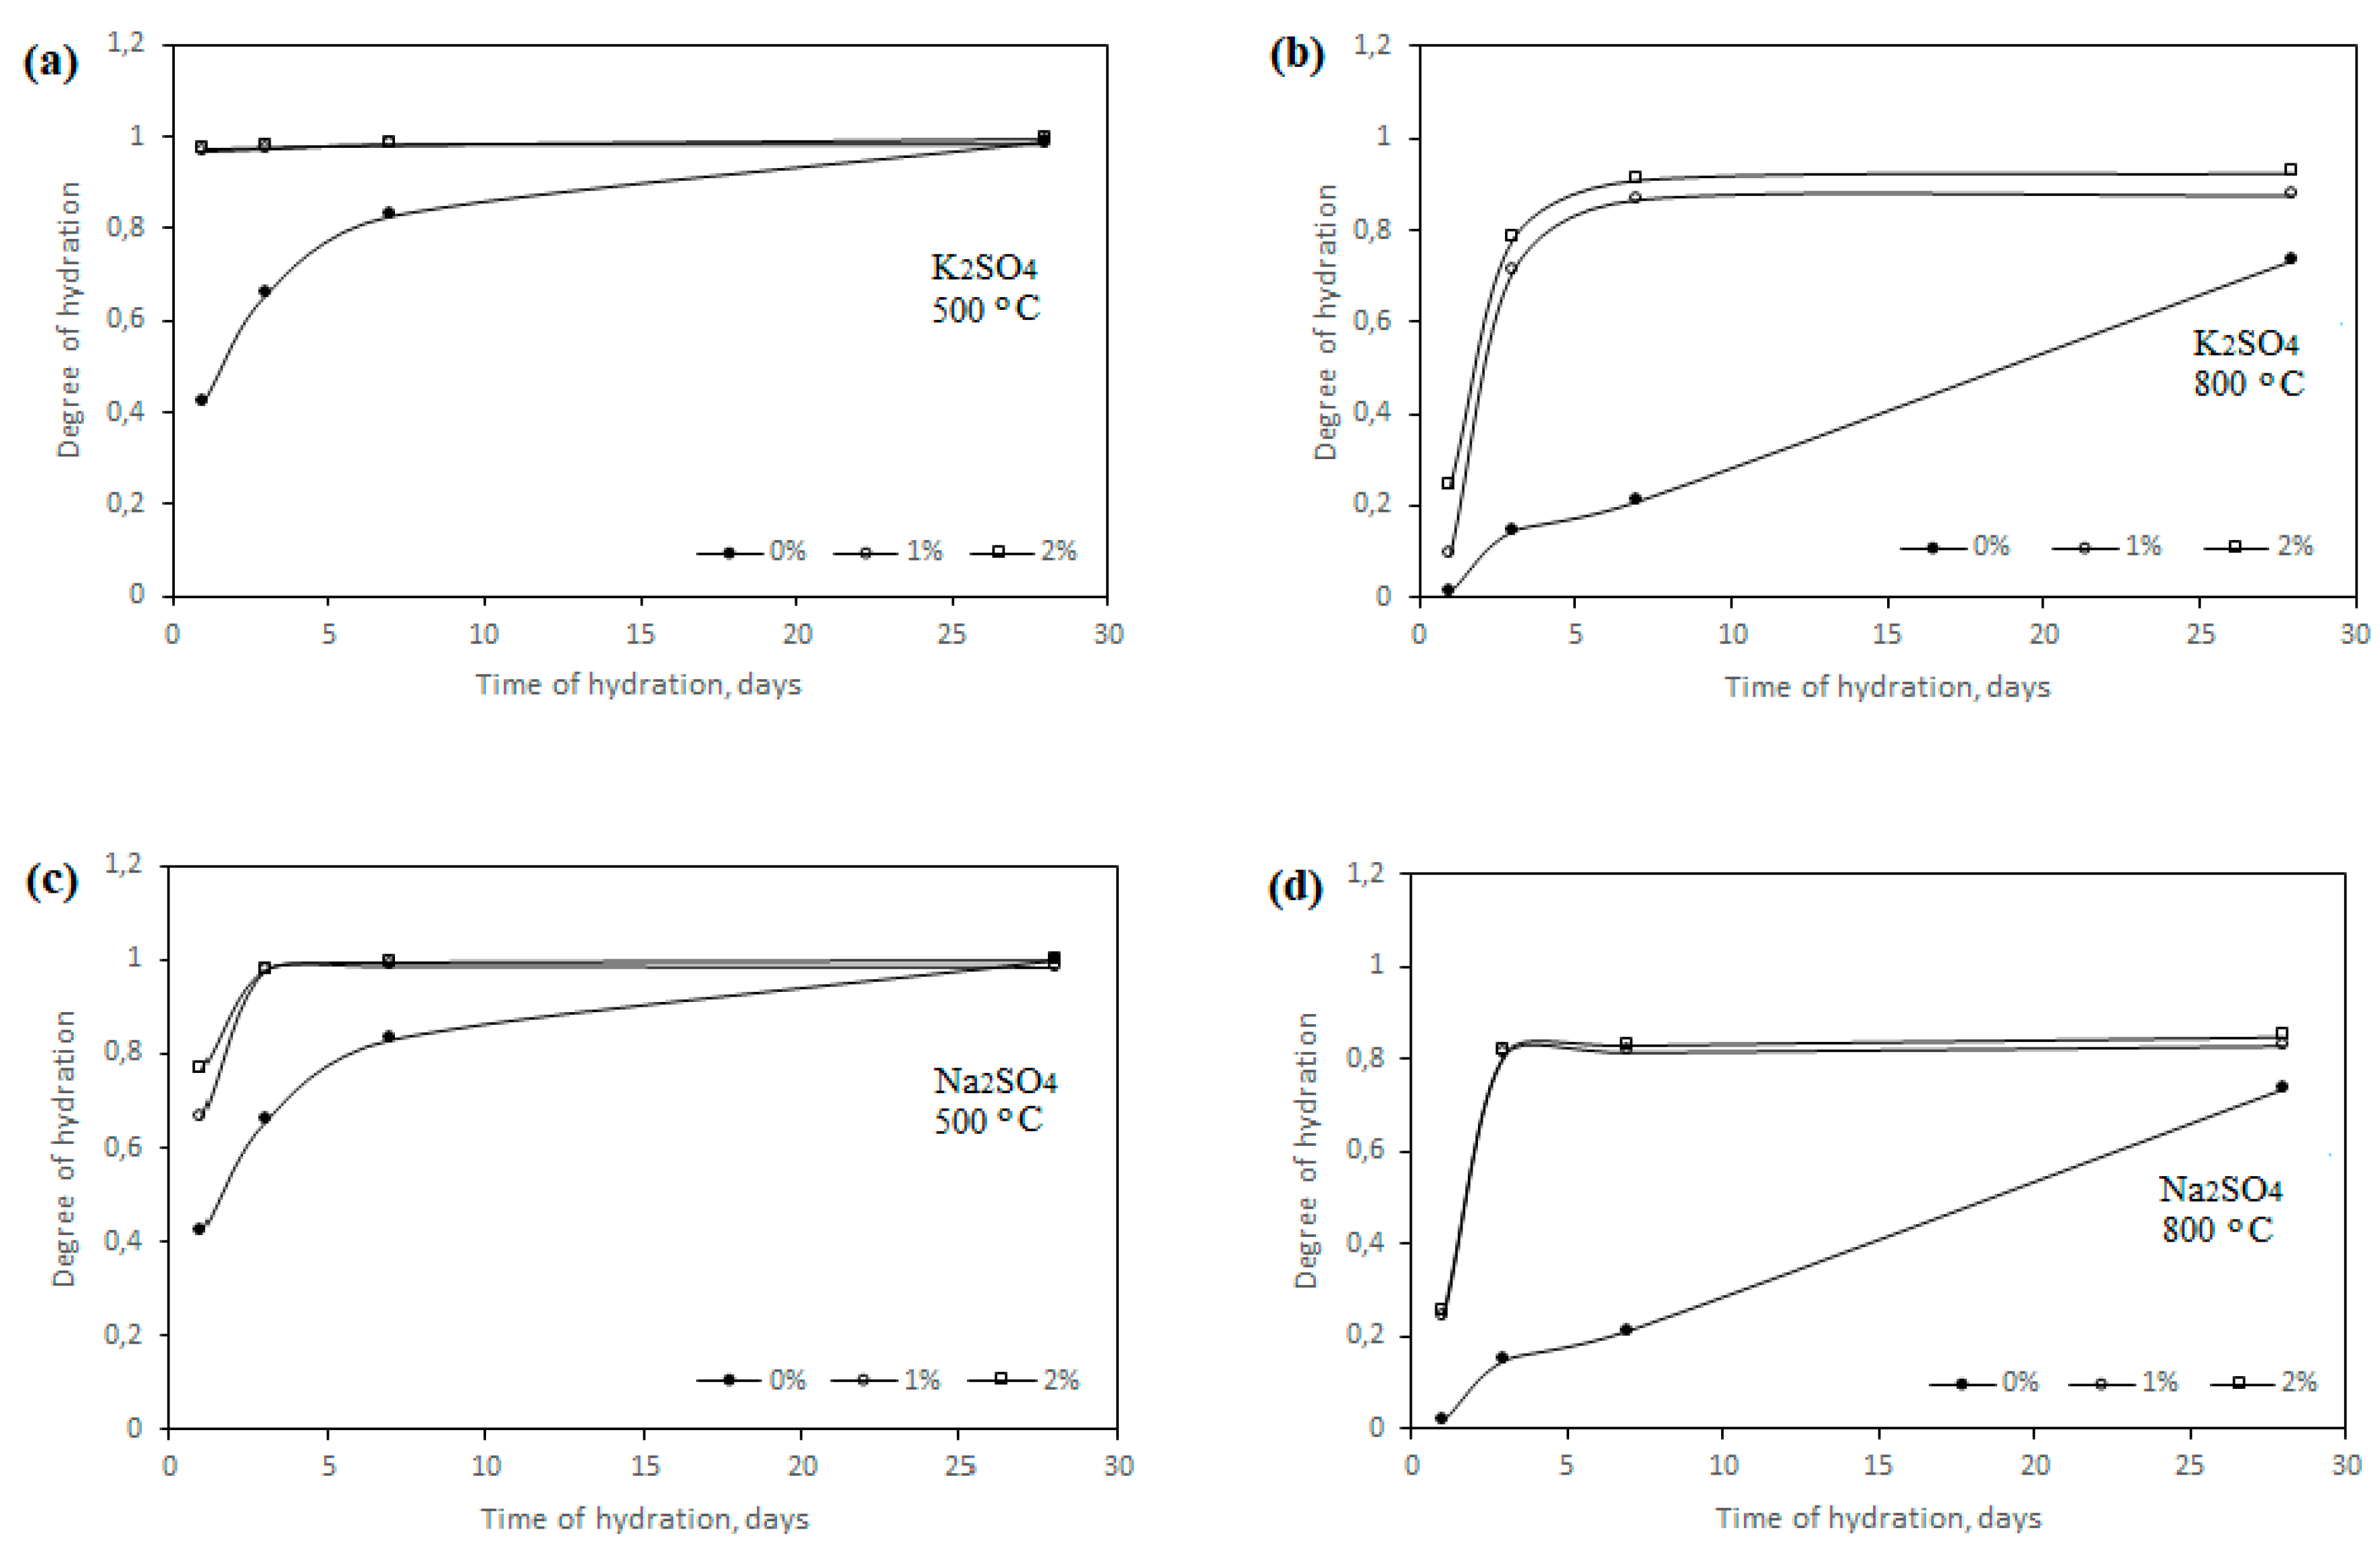
Figure 6.
XRD patterns of anhydrite produced at 500 oC using 1 % (a) and 2 % (b) K2SO4 and anhydrite produced at 800 oC using 1 % (c) and 2 % (d) K2SO4. Indexes: A – anhydrite CaSO4 (PDF 00-037-1496), Q – quartz SiO2 (PDF 00-046-1045), S – syngenite K2Ca(SO4)2·H2O (PDF 04-011-9876), G – gypsum (PDF 00-033-0311). 1 – anhydrite, 2 – anhydrite binder after 10 minutes hydration, 3 – anhydrite binder after 20 minutes hydration, 4 – anhydrite binder after 60 minutes hydration, 5 – anhydrite binder after 1 day hydration.
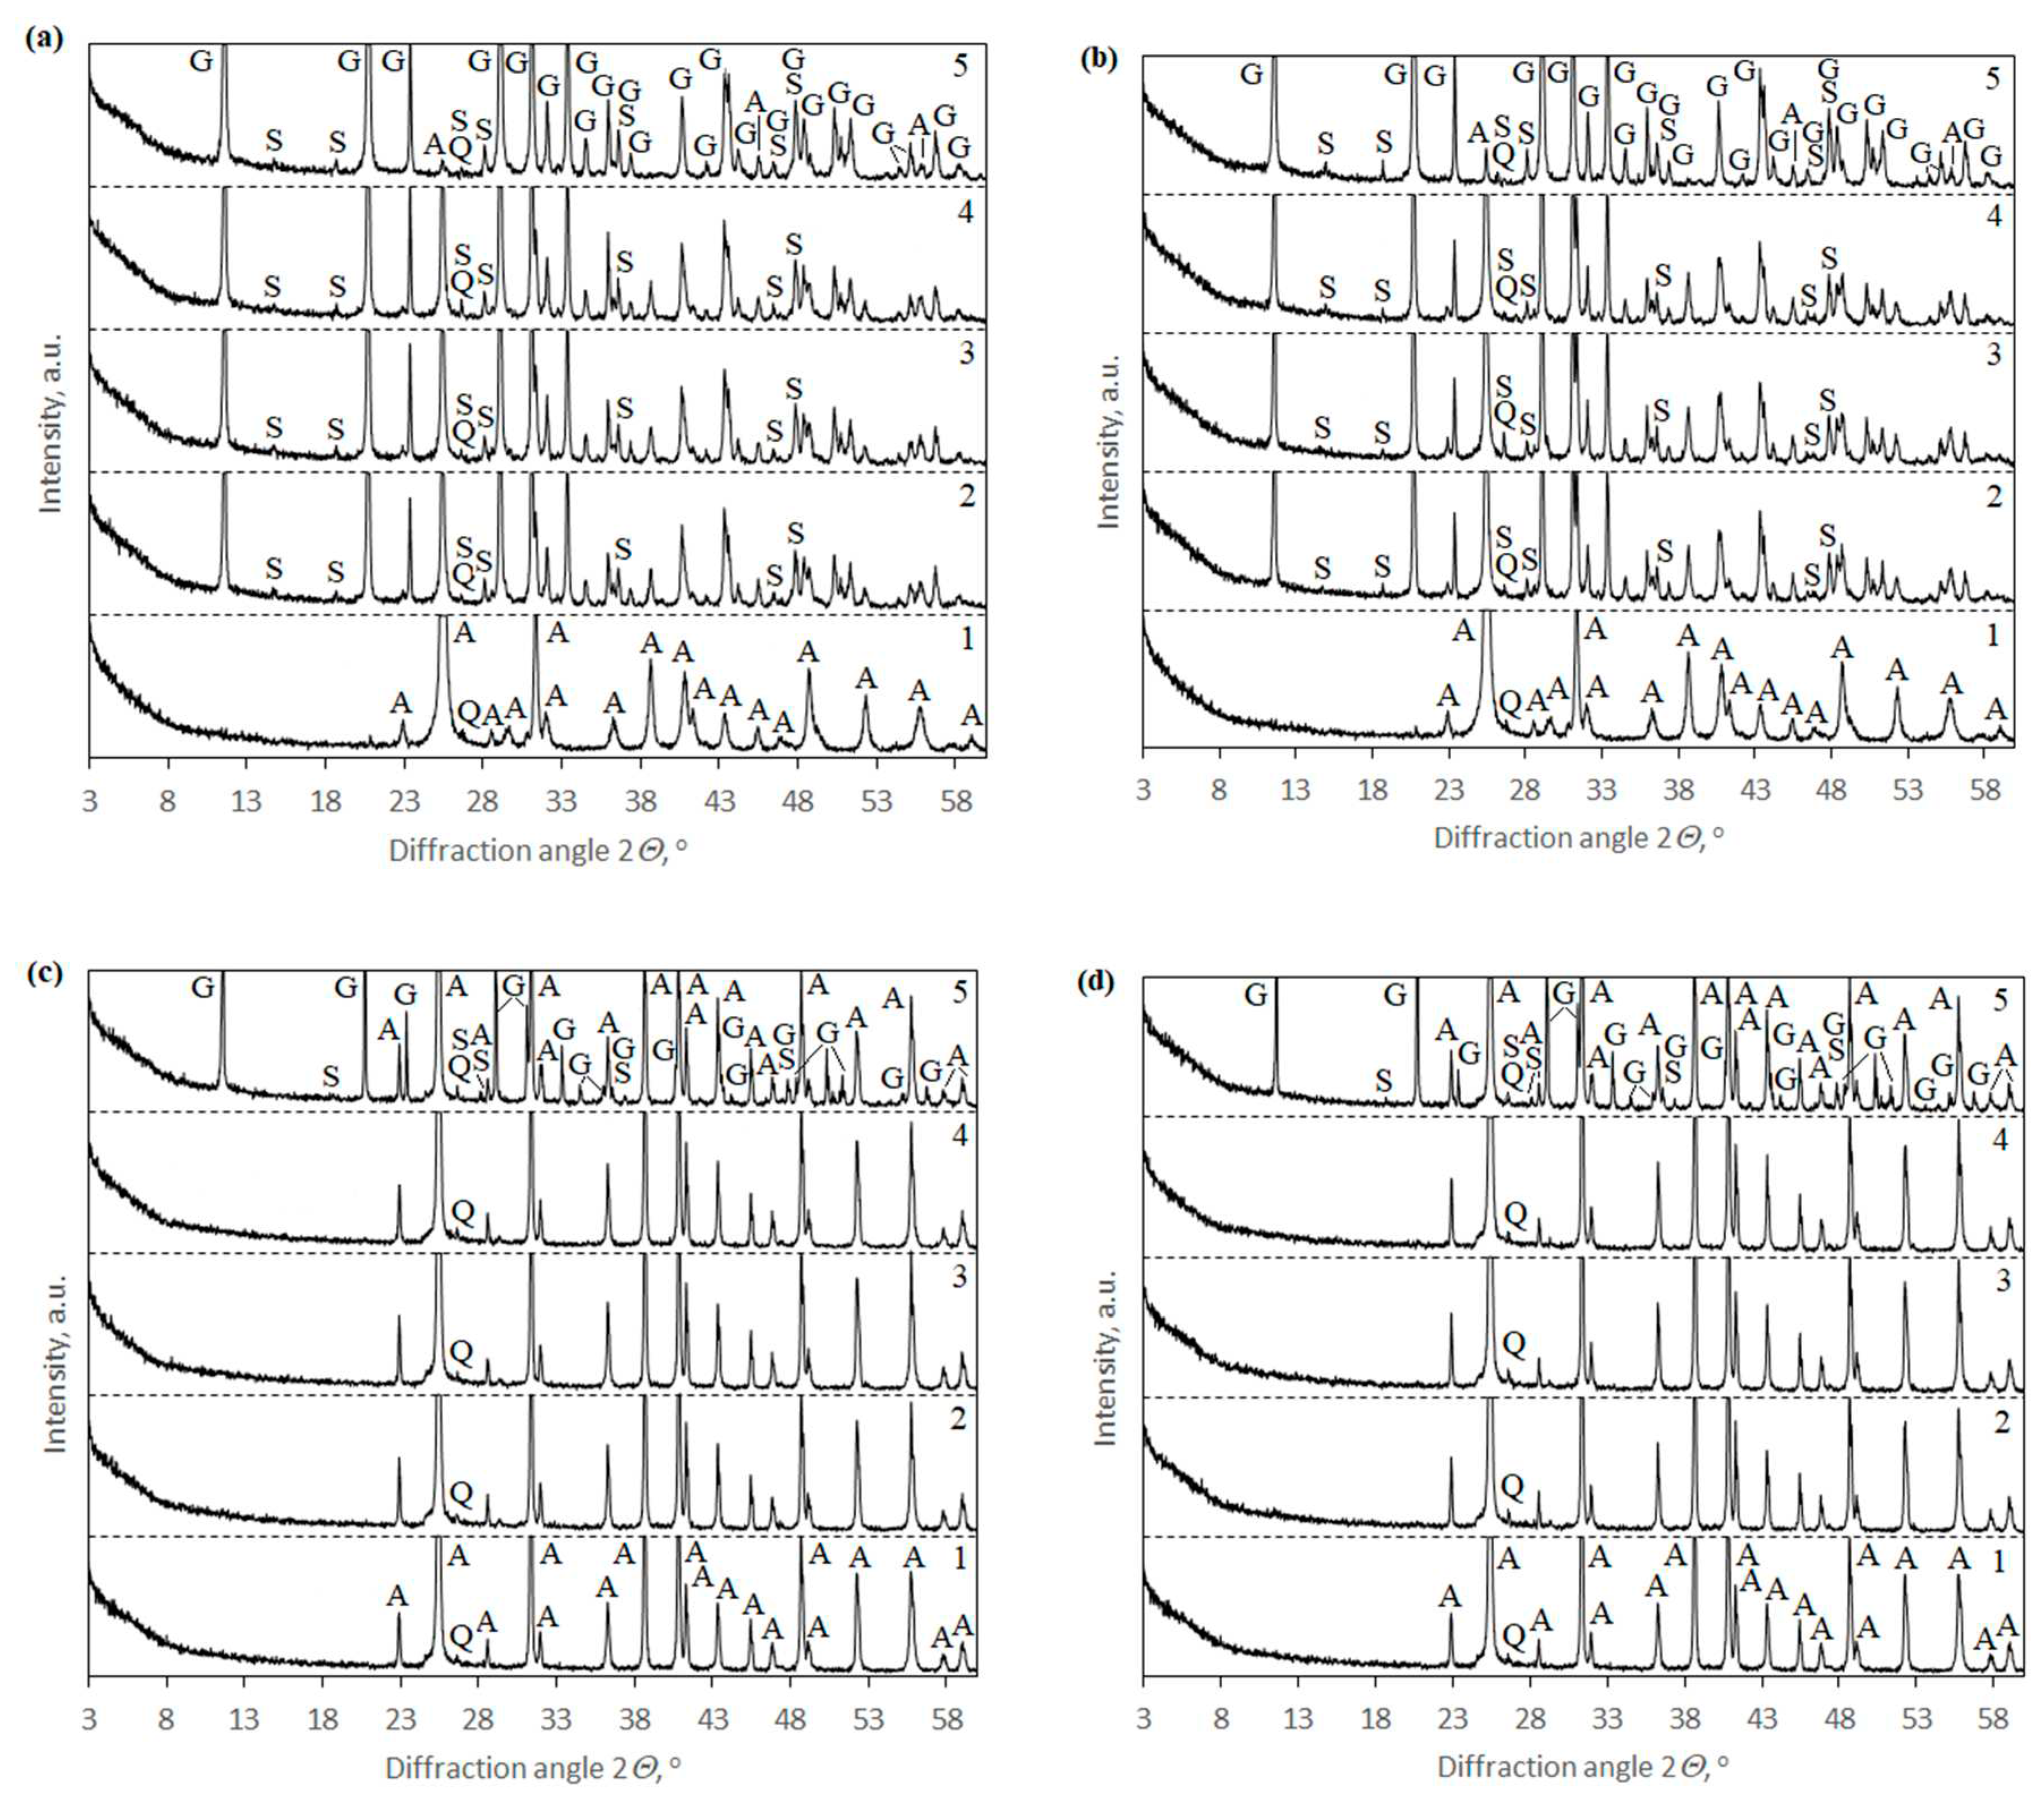
Figure 7.
XRD patterns of anhydrite produced at 500 oC using 1 % (a) and 2 % (b) Na2SO4 and anhydrite produced at 800 oC using 1 % (c) and 2 % (d) Na2SO4. Indexes: A – anhydrite CaSO4 (PDF 00-037-1496), Q – quartz SiO2 (PDF 00-046-1045), Gl – glauberite Na2Ca(SO4)2 (PDF 00-019-1187), G – gypsum (PDF 00-033-0311). 1 – anhydrite, 2 – anhydrite binder after 10 minutes hydration, 3 – anhydrite binder after 20 minutes hydration, 4 – anhydrite binder after 60 minutes hydration, 5 – anhydrite binder after 1 day hydration.
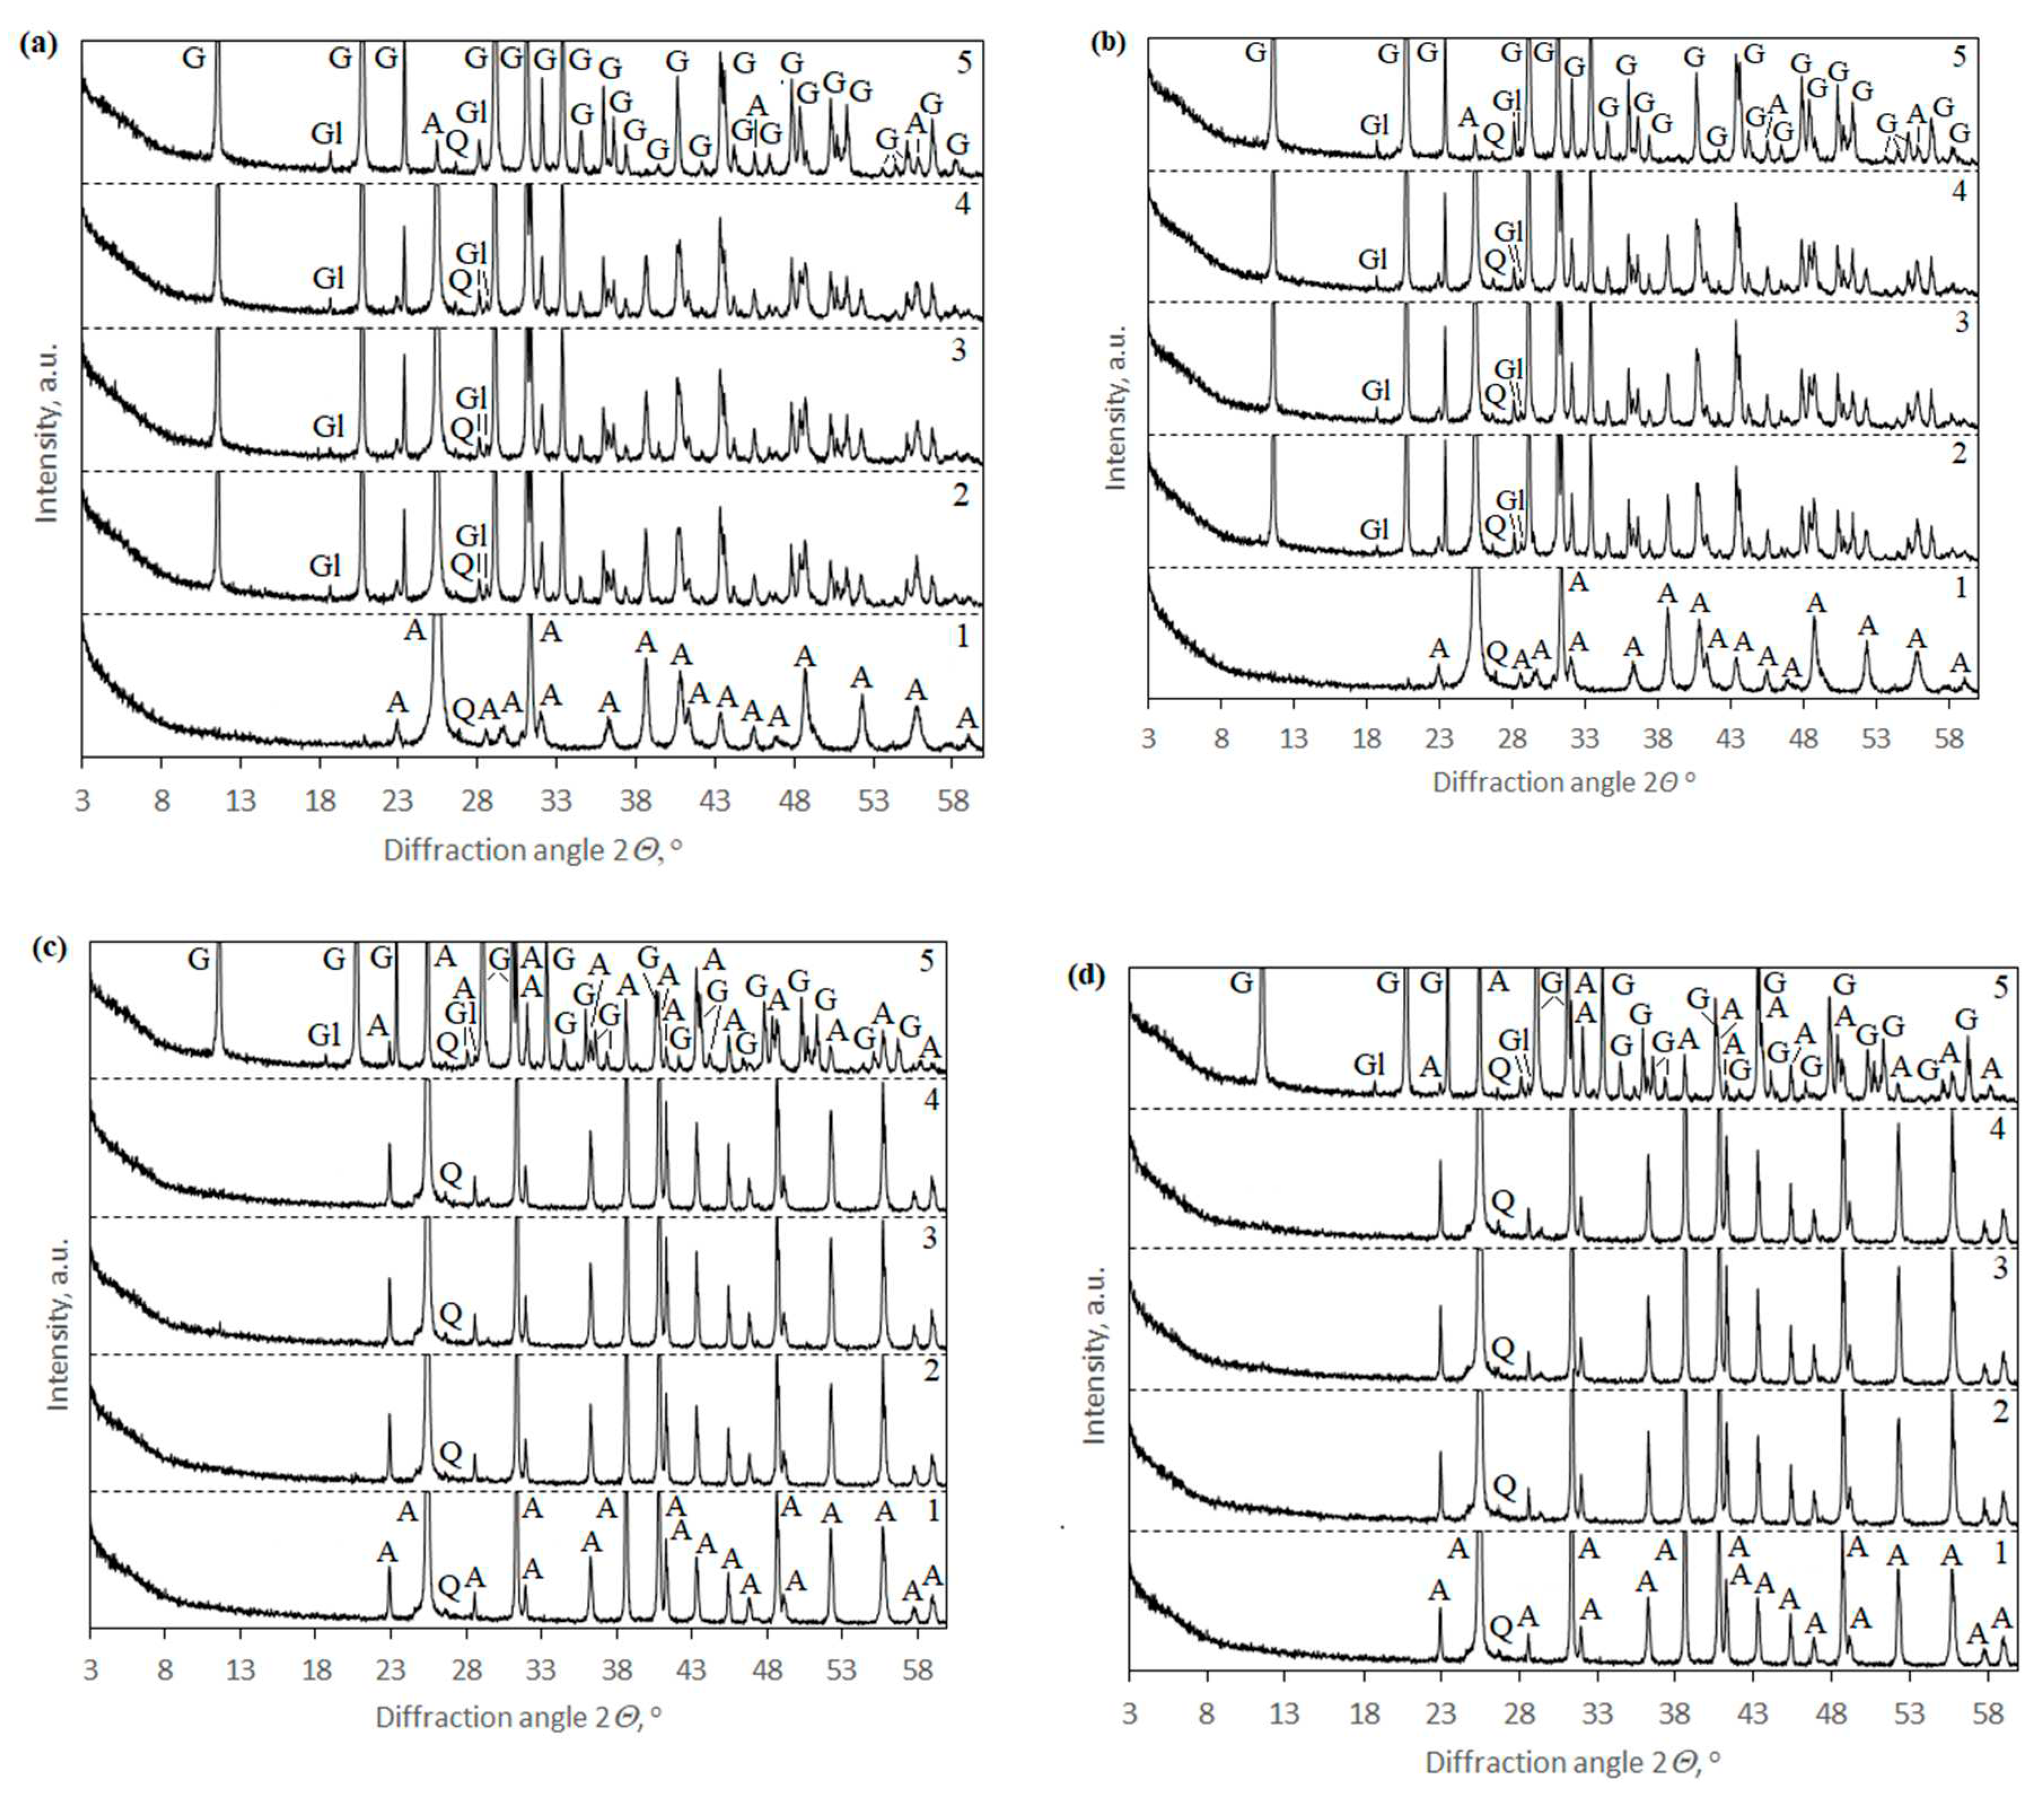
Figure 8.
Experimental and calculated values of compressive strength of anhydrite binder using K2SO4 (a) and Na2SO4 (b).
Figure 8.
Experimental and calculated values of compressive strength of anhydrite binder using K2SO4 (a) and Na2SO4 (b).
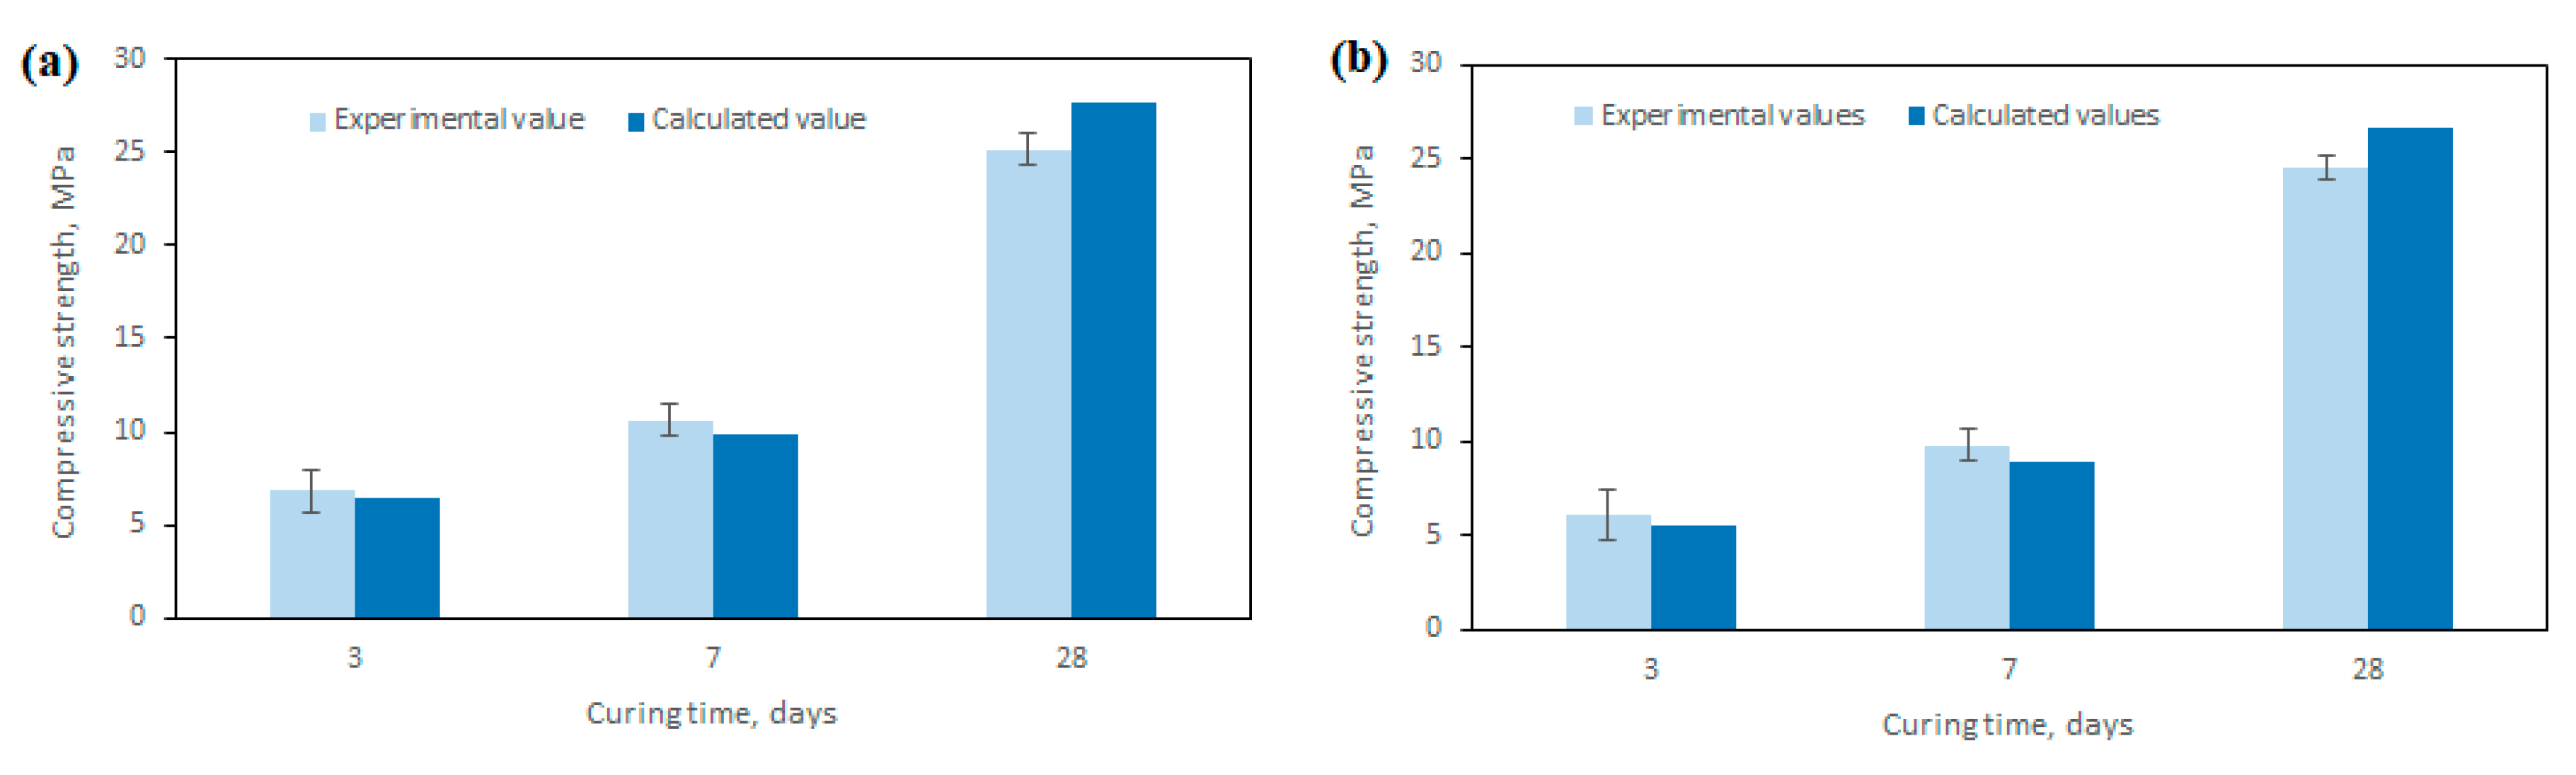

Table 1.
Chemical composition of FGD gypsum.
| Constituents, wt. % | |||||
|---|---|---|---|---|---|
| CaO | SO3 | Al2O3 | Fe2O3 | SiO2 | Ign. Loss |
| 33.50 | 46.0 | 0.31 | 0.15 | 1.25 | 20.14 |
Table 2.
Compressive strength of anhydrite binder produced at different calcination temperatures.
| Hydration time, days | Compression strength, MPa | ||||
|---|---|---|---|---|---|
| Calcination temperature, oC | |||||
| 500 | 600 | 700 | 800 | 900 | |
| 3 days | 2.04 | 2.00 | 1.02 | 0.51 | - |
| 28 days | 4.10 | 8.68 | 10.40 | 21.27 | 26.5 |
| 28 days (dry samples) | 10.81 | 14.32 | 17.97 | 27.63 | 34.6 |
Table 3.
Factors and levels.
| Independent factor | Units | Coding | Range | |
|---|---|---|---|---|
| High level (+1) | Low level (-1) | |||
| Calcination temperature | oC | x1 | 800 | 500 |
| Hydration time | days | x2 | 28 | 3 |
| Amount of activator | % | x3 | 2 | 0 |
Table 4.
Experimental design matrix and results.
| Run | Independent factor | Compressive strength, MPa | ||||||
|---|---|---|---|---|---|---|---|---|
| Actual values | Coded values | |||||||
| Calcination temperature, oC |
Hydration time, days |
Amount of activator, % |
x1 |
x2 |
x3 |
Y1 using K2SO |
Y2 using Na2SO4 |
|
| 1 | 800 | 28 | 2 | 1 | 1 | 1 | 32.92 | 31.60 |
| 2 | 500 | 28 | 2 | -1 | 1 | 1 | 17.60 | 16.83 |
| 3 | 800 | 3 | 2 | 1 | -1 | 1 | 4.55 | 3.48 |
| 4 | 500 | 3 | 2 | -1 | -1 | 1 | 10.05 | 9.27 |
| 5 | 800 | 28 | 0 | 1 | 1 | -1 | 21.27 | 21.27 |
| 6 | 500 | 28 | 0 | -1 | 1 | -1 | 4.10 | 4.10 |
| 7 | 800 | 3 | 0 | 1 | -1 | -1 | 0.51 | 0.21 |
| 8 | 500 | 3 | 0 | -1 | -1 | -1 | 2.20 | 2.20 |
Disclaimer/Publisher’s Note: The statements, opinions and data contained in all publications are solely those of the individual author(s) and contributor(s) and not of MDPI and/or the editor(s). MDPI and/or the editor(s) disclaim responsibility for any injury to people or property resulting from any ideas, methods, instructions or products referred to in the content. |
© 2023 by the authors. Licensee MDPI, Basel, Switzerland. This article is an open access article distributed under the terms and conditions of the Creative Commons Attribution (CC BY) license (http://creativecommons.org/licenses/by/4.0/).
Copyright: This open access article is published under a Creative Commons CC BY 4.0 license, which permit the free download, distribution, and reuse, provided that the author and preprint are cited in any reuse.


