
Submitted:
07 August 2023
Posted:
09 August 2023
You are already at the latest version
Abstract
Considering the concerns for emissions reduction in the maritime sector, the present paper evaluates, through modeling and simulation, the oxy-fuel combustion in a two-stroke ship engine (2SE) and the best production system configuration to obtain the required oxygen (O2). An initial model of a ship engine is calibrated with the engine manufacturer’s data, and then adapted to work with O2 as the oxidant to eliminate nitrogen oxides (NOx) emissions and with exhaust gas recirculation (EGR) to control the in-cylinder combustion temperature. Mixed Ionic-Electronic Conducting (MIEC) membranes produce the necessary O2 from the ambient air, which is heated up and pressurized by a heat exchanger and turbocharging coupled system to provide the air conditions required for the proper operation of the MIEC. Several layouts of this system are evaluated for the full load engine operating point to find the optimum O2 production system configuration. Results reveal that the engine operating under oxy-fuel combustion conditions avoids NOx emissions at the expense of higher brake specific fuel consumption (BSFC) to obtain the original brake torque, and also expels a stream composed exclusively of CO2 and H2O, what facilitates the separation of CO2 from exhaust gases.
Keywords:
Internal combustion engine
; maritime transport
; oxy-fuel combustion
; MIEC
; turbocharging
1. Introduction
Shipping is the main freight transport mode around the world, transporting about 90% of global trade. Although it is the least atmospheric damaging mean of transport, its cumulative effect contributes to the overall air quality problem [1]. The International Maritime Organization (IMO) is the United Nations regulatory agency for safety, security, and environmental performance of the shipping industry. IMO controls the reduction of major ship exhaust emissions (SO, NO, VOCs, and ODS) through the Annex Vl of the International Convention for the Prevention of Pollution from Ships (MARPOL) [2]. This normative reduces the global SO limit to 0.50% m/m outside an Emission Control Area (ECA), and to 0.10% m/m inside; and regulates the NO emissions through three tiers based on the ship construction date and the engine speed as indicates the Table 1[3]. Concerning to CO emissions from ships IMO adopted an Initial Strategy, still pending review in 2023, whose main goal is cut annual GHG emissions by at least half by 2050 compared with their level in 2008 [4].
Currently there are three reduction strategies for marine engines in order to meet the SO and NO emission standards on ships: fuel optimization, pre-combustion control, and exhaust after-treatment systems. Fuel optimization consists of replacing heavy ship fuels, such as HFO and MDO, with clean alternative fuels to mitigate SO and PM emissions due to low sulfur content; pre-combustion control techniques, such as water addition and EGR, are adopted for controlling NO emissions by preventing its formation conditions during combustion; and the exhaust after-treatment systems, among them SCR to decrease NO and DPF to remove PM, are technologies that effectively reduce NO and PM emissions without significant penalty in the engine power and fuel economy [5].
Intending to reduce the environmental footprint, the shipping industry is switching to cleaner fuels either by replacing fossil fuels with low-carbon and carbon-negative fuels, or by using carbon neutral fuels [6]. However, a technology to decrease CO emissions is still necessary to meet the global objective of the Paris Agreement; Carbon Capture and Storage is one of the key technologies for this purpose. In CCS, the CO is captured in three ways: post-combustion capture, pre-combustion capture, and oxy-combustion, and then transported to permanent offshore storage via pipeline, ship, or both [7]. As an alternative to storing the captured CO, it is also used during the processing of synthetic and low-carbon fuels together with green H [8].
Alternative to NO emission-reducing technologies and complementary to CCS, oxy-fuel combustion appears as a novel option. In this combustion process air is replaced by high-purity oxygen to eliminate NO emissions by the absence of N, obtaining as exhaust gases mainly CO and HO which are used to control the high combustion temperature [9]. Oxy-fuel combustion facilitates the separation of CO from HO after condensation, so this concept was initially implemented in power plants, both coal-fired [10] and biomass-fired [11], as an alternative to the Carbon Capture and Storage (CCS) methods of post-combustion and pre-combustion [12]. Environmental concerns about CO emissions to the atmosphere from energy-intensive industries have promoted the study and implementation of oxy-fuel combustion in sectors such as oil refining [13], IGCC systems [14], and cement production [15]. In addition to CO sequestration, oxy-fuel combustion is used by its high combustion temperature for processes like High Velocity Oxy-Fuel (HVOF) coating [16] and Basic Oxygen Furnace (BOF) for steel production [17].
The oxygen supply is the biggest challenge for oxy-fuel combustion in engines since it is not available in the environment as well as air and must be obtained in some other way. Offboard acquisition is a challenging option as it entails additional storage and transport costs, and mainly because of the weight and space limitation in vehicles, which reduces the autonomy essential for means of transport such as airplanes and ships. On the other hand, the O in situ production is still in progress but it is foreseen to be the solution, currently the most developed technology is the cryogenic air separation unit (C-ASU) that provides high quantity and purity, but involves high investments and energy requirement [18], complicating its implementation in oxy-combustion process [19]. As an alternative, the Oxygen Transport Membranes (OTM), also known as Mixed Ionic-Electronic Conducting membranes (MIEC), present an energy and economic saving compared to C-ASU [20].
MIEC membranes consist of O diffusion through the crystal lattice of the membrane material [21] caused by the O partial pressure difference between feed and permeate sides of the membrane (see Figure 1) [22]; for this reason the selectivity of the membranes is superior to other technologies and it is possible to obtain high oxygen purity [23]. The driving force that moves O through the membrane can be achieved by two different ways: the 3-end design generating a vacuum in the permeate side, and the 4-end design reducing the partial pressure of O on the permeate side with a sweep stream of recirculated flue gas. Although the second option increases the energy efficiency of the process, the membrane is exposed to components as CO, SO, HO than can deteriorate it. Regarding the membrane material, perovskites are the most commonly used for membrane manufacturing because they provide high oxygen flux, however, they are prone to poisoning when they come in contact with CO and SO[20]. BSCF is one of the perovskite materials which presents higher O permeability [24], it is important to consider that below 850ºC the perovskite does not present the same permeation capability [20].
The study of the oxy-fuel combustion technology in ship engines is still very new, the only research project in progress is RIVER, led by the education group YNCREA Hauts de France and co-financed by the Europe Union within the Interreg North-West Europe program. The objective is the reduction of NO and CO emissions from inland waterway vessels applying oxy-fuel combustion and CCS technology for diesel engines [25]. The oxygen production is planned by compressed oxygen cylinders produced by an oxygen generator manufacturer and fitted into a safety lifting cage in the narrowboat. This system has the capacity to supply O for about one hour depending on the load and speed of the vessel, so refueling of the cylinders must be done by a mobile crane located on the dock [26]. The ultimate goal of the RIVER project is the installation and integration of the oxy-fuel combustion system with CO capture and storage on a narrowboat operating on UK inland waterways in real conditions [27]. As part of this project, a CFD study was carried out to evaluate the influence of different diluent strategies for the oxy-fuel combustion process in a High Speed Direct Injection (HSDI) diesel engine under Homogenous Charge Compression Ignition (HCCI) mode [28].
Oxy-fuel combustion in large marine vessels engines is not comparable to the case mentioned above since the environmental and operating characteristics between river and marine ships are different. Furthermore, an on-site oxygen supply is necessary for maritime transport due to the large quantities of oxygen required by the engine and the remoteness from land during navigation, unlike river transport. Thus, the present study explores these issues by modeling an oxy-fueled ship engine and designing the most optimal system for providing the oxygen in-situ.
2. Method
This research was carried out following the next work sequence:
- In the first instance, the baseline engine model was configured in the software to be used during the study;
- The second step was the implementation of the oxy-fuel combustion in the model, aiming to achieve an engine performance close to the original;
- Finally, the in-situ oxygen production system was designed separately from the main engine model.
2.1. Configuration of the Baseline Model
The marine engine evaluated in this study is a two-stroke, 8-cylinder CI engine. The engine manufacturer provided a reference model of the ship propulsion system which, in addition to the engine, includes a turbocharger, a water CAC, and an electric auxiliary blower for each four cylinders as shown in Figure 2a. To obtain the base engine behavior for this study, the simulations were run at the engine CMCR power for different operating points (presented in Table 2) and controlling the injection fuel to reach the BMEP target.
This model was replicated in the simulation software 0D-1D Virtual Engine Model (VEMOD) [29] developed by the research institute CMT - Motores Térmicos since it contains sub-models to simulate the oxygen production module and because of access to the program developers who can modify it according to the needs of the project. The VEMOD engine model was calibrated with the ship manufacturer’s virtual model to obtain similar results, for this purpose, the turbocharger speed was fixed to facilitate the tuning, then the corresponding multipliers and coefficients were modified to adjust the engine operative curves, afterward the exhaust pressure was fine-tuned by controlling the pressure at the turbine outlet and finally, the turbocharger speed was again released to rotate according to the engine operating point.
Figure 3 shows the comparison between the manufacturer’s and VEMOD models after the calibration according to the main engine performance curves and the turbocharger maps; because the engine data are confidential information from the company, the values were modified with respect to the maximum value of the corresponding parameter. Power and Torque charts in Figure 3.a. are superimposed since the values are objectives imposed to the VEMOD equal to those of the engine manufacturer model. The fitting shown in Figure 3.b and Figure 3.c, corresponding to turbine and compressor maps respectively, is also very good between the manufacturer and VEMOD model. The objective of having a VEMOD baseline for the oxyfuel combustion study is fulfilled with this level of fitting. One can even see that better results are shown with VEMOD in the case of Figure 3.b, since VEMOD results fits better the turbine supplier map than manufacturer results for low engine speeds, showing a better turbine modeling practice. Same can be said with the compressor map in Figure 3.c. since point at 50 rpm from VEMOD is well within the map operative area, but from the manufacturer it is a bit beyond surge limit, what is not realistic. So it can be concluded the VEMOD model baseline is a robust one to go ahead with the oxyfuel combustion study.
2.2. Implementation of the Oxy-Fuel Combustion
Initially keeping the baseline model layout and the same BMEP target, the air was replaced by a mixture of O and EGR, the first to incorporate the oxy-fuel combustion idea and the second to control the combustion temperature. The proportion of O and EGR (CO + HO) in the mixture was imposed in such a way to imitate the oxygen concentration of atmospheric air in the intake charge mixture, in order to maintain the stabilization of oxyfuel combustion flames. This criteria has been adopted as a previous study of partially premixed CH/oxyfuel flames in a swirl stabilized burner has demonstrated [30].
After achieving a suitable engine behavior with the imposed oxidant composition, the O inlet and EGR line were configured in the model. For the first, an O deposit at atmospheric conditions was included at the turbocharger inlet to represent the O produced by the system to be designed later; for the EGR, the exhaust gases coming out of the turbine were divided into two lines, one leading part of the gases to the environment (according to the scope of this study but a CCS is foreseen as the next stage), and the other leading the rest to the engine intake. The EGR flow is controlled through a valve to reach the established O/EGR ratio, and it is refreshed by a cooler before entering the mixer, where O and EGR converge before entering the compressor (see Figure 2.b).
2.3. Design of the O Production System
Once the engine model worked correctly with the O inlet and EGR line, the O production system was designed separately from the main engine scheme to facilitate the simulations, whereby the boundary conditions of the system were imposed from the engine model at full load operating point.
2.3.1. Reference Layout
The design of the O production system consists of conditioning the atmospheric air to reach the operating parameters of the MIEC since it requires feeding air at high temperature and sufficient O partial pressure gradient between the feed and permeate side; for this purpose, heat exchange and turbocharging systems are necessary to heat and pressurize the inlet air.
As the design starting point, the layout for a direct injection CI engine developed by J.R. Serrano et al. [31] was implemented and then adapted to the needs of the ship engine model. Their proposed system uses a 4-end design membrane to improve the driving force by diluting the permeated O with the engine EGR. In terms of obtaining the air conditions for the MIEC correct operation, on one side, the required feed air pressure is achieved by means of a regenerative Brayton cycle with two stages of compression and expansion, in which the MIEC fulfilling the role of the combustion chamber in a conventional cycle, whereby the turbines are driven by the N leaving the MIEC. On the other side, the required temperature is obtained through a Heat Exchanger Network distributed to recover the energy from the exhaust gases coming out the engine, and from the N and O leaving the MIEC at very high temperatures. A membrane area study is carried out to determine the minimum area capable of supplying the required oxygen, depending on the air conditions achievable by the O production system. The referred article [31] shows and explains in detail this oxy-fuel engine proposal with in-situ O production.
2.3.2. Layout Conception
An initial O production model was designed considering the main elements of the reference layout and the marine engine conditions. For this case, a 3-end design membrane was used to produce the O because the sulfur content in ship engine fuels is too high and the EGR could poison the membrane, which means that the sweep stream was eliminated and another way to increase the driven force in the MIEC is needed. To obtain this force, the Brayton cycle was modified, instead of two stages of compression and expansion one turbocharger compresses the inlet air and the other extracts the outlet O from the membrane to generate a vacuum in the O line, and thus obtain the partial pressure gradient required in the MIEC. The turbochargers were placed in parallel arrangement to simplify control in this initial conception, and their size is the same as those of the engine model.
As for the Heat Exchanger system, it still recovers the residual energy of the N and O from the MIEC, but unlike the reference model, the exhaust gases energy is not enough to further heat up the air since the marine engines expel the post-combustion gases at temperatures around 400ºC and with excess O. The solution strategy for this energy shortage was adding a combustion chamber in the exhaust gases and EGR lines to take advantage of the remaining O in the gases and thus increase the heat transferred to the air; fuel injection of the combustion chambers is controlled in order to produce in the MIEC the oxygen required by the engine at full load. Besides, the EGR line is split with a dual purpose: harnessing the energy of the O and exhaust gas flow lines to warm the air and cooling both to facilitate future processes involving them, i.e. O compression in the engine model and CO capture, which will be incorporated in a future study.
The membrane selection was based on the study performed during the design of the reference layout, first by scaling the membrane areas evaluated as a function of the O required in this case, and then locating the minimum required to the most achievable conditions in the MIEC estimated for this study. Since there is not sweep current this time, it is more difficult to obtain a high O partial pressure ratio, so the membrane area selected as a first approximation was 6000 m, which is the minimum area needed to produce the required O at the minimum O partial pressure ratio in the MIEC. This first attempt at configuring the O production system is depicted in Figure 4.
2.3.3. Layout Optimization
To achieve the most energy-efficient model, the O production system was optimized to meet the next condition: the lowest possible burners fuel consumption to produce the O required for the oxy-fuel combustion engine. This optimization process was carried out on the turbocharging system and MIEC membrane.
2.3.3.1 Turbocharging system:
Different turbocharging setups were analyzed to find the configuration that best meets the established optimization parameter. The study conducted for each arrangement was carried out as follows: Maintaining the size of the turbocharger receiving air from the atmosphere, i.e. TCH-1NA in Figure 4, Figure 5 and Figure 6; a sweep of the size scale factor of the second turbocharger is performed, i.e. TCH-2ON in Figure 4 to Figure 5, and TCH-2NA in Figure 6. Simultaneously with the previous point, the corrected mass flow factor of the compressor, corresponding to each scale factor, is adjusted to operate in the most efficient island of the map. Finally, the fuel consumption of the burners obtained along the sweep is used as the objective function to find the best size ratio between the turbochargers.
At the end of this stage, the best turbocharging configuration for the final O production model is selected. Each of the layouts studied will be explained below.
- Parallel configuration: The first turbocharging proposal consists of connecting two units in parallel with a common N line at the inlet of the turbines. The TCH-1NA turbocharger is placed at the beginning of the air flow line and the TCH-2ON turbo at the end of the O line to achieve the required O partial pressure gradient in the MIEC. This parallel configuration is shown in the light blue box in Figure 4.
- Serial configuration: Maintaining the location of the turbochargers in the scheme, the second turbocharging attempt was a series turbine configuration in which the N line is regulated by a by-pass valve to first drive the TCH-2ON turbine and then, when the N flow confluences again, drive the TCH-2ON turbine. The by-pass valve lift was swept to determine the best possible value. This serial configuration is shown in the light blue box in Figure 5.
- Two stage air compression: The third configuration analyzed was another serial arrangement but in this case for both turbines and compressors. The air is compressed twice for further increase the partial pressure gradient in the MIEC without the need to generate vacuum. This configuration is shown in the light blue box in Figure 6; the heat exchanger system is different from that shown in the previous figures because, as it will be demonstrated in the Results section, the EGR line burner is not necessary for this setup at full engine load.
Once as the latter option was shown to be the best of the three turbocharging systems (justification in the Results section), it was adapted to work at the rest of engine operating points. In this case was only necessary incorporating the EGR line burner to reach the required air conditions at the two lowest engine load points; this addition appears represented in Figure 6.
2.3.3.1 MIEC Membrane:
As indicated in the description of the layout conception, the membrane area selected was 6000 m as an initial approximation for the design of the O production system, but this is not the definitive one. After the turbocharging system optimization and the selection of the final model, a sweep of the membrane area was performed to find the most efficient one for O production.
3. Results and Discussion
This section describes and discusses the ship engine behavior under oxy-fuel combustion conditions and the outcome of the O production system design process. As explained in the method section, the values of the parameters are shown as the ratio to the maximum value since the engine data are confidential information of the manufacturer; for this reason, the results are analyzed considering the tendency and the rate of change of the variable, not its magnitude. Several parameters are plotted on the same graph to directly analyze their relationship with each other, and a standard color code is used for each property to simplify the Figures reading.
3.1. Engine Behavior under Oxy-Fuel Combustion
Replacing N with EGR (CO and HO) as the inert concentration of the oxidant in the engine combustion process implies a considerable change in the in-cylinder thermodynamic behavior, as it is shown in Figure 7. Due to the higher constant volume heat capacity of EGR vs N a lower specific heat ratio (gamma) is obtained in the intake charge gas. As a consequence lower peaks of pressure and temperature are obtained at the TDC and at peak of combustion in the oxy-fuel combustion case. Also, as consequence of lower gamma the indicated efficiency of the compression ignition cycle is less, therefore more fuel have to be injected to recover the same torque and power for a given engine speed. Consequently, more oxygen and more EGR must be trapped inside the cylinder and this is also shown in Figure 7, i.e. that the trapped mass for the same power is higher in the oxy-fuel combustion mode. It is worth noting that the effect of lower gamma of the EGR vs the N is so strong that even with higher trapped mass the in-cylinder pressure peak in the oxy-fuel combustion is lower. Also the effect of the lower gamma is evident in the gas temperature evolution during the expansion stroke (from TDC - 0 angle - to IPO) due to the lower temperature decrease from the temperature peak.
As a consequence of the changes produced in-chamber, the behavior of the intake and exhaust gases varies with respect to that obtained when the engine operates with air. The exhaust mass flow in the engine increases due to the in-cylinder mass rise, generating more flow that drives the turbines (of TCH-1AG and TCH-2AG at Figure 2.b.), and therefore sucking in and compressing more intake charge gas at the corresponding compressors; it is reflected in Figure 8. As for the temperatures, the inlet temperature is the same since it is controlled by the coolers located after compressors to obtain a target value; on the other hand, the exhaust temperature is slightly lower as a result of the combustion temperature reduction. Due to even the peak temperature is lower (see Figure 7) the lower gamma generates lower expansion and the resulting exhaust temperature is quite similar when comparing conventional combustion with oxy-fuel combustion.
Finally as a result of all this, the engine performance at oxy-fuel combustion is affected; this can be seen in the curves plotted in Figure 9. The effect of lower specific heats ratio (gamma) during the engine cycle is to generate less work per cycle and, therefore, lower indicated thermal efficiency for the same torque and power at each engine speed. Since the model control seeks to get the same reference model BMEP, the engine has to inject more fuel to compensate for the lack of work produced and for this reason, the Brake Specific Fuel Consumption (BSFC) increases.
3.2. O Production System Design Process Results
Following the layout optimization procedure explained in the method section: the results of each turbocharging configuration are examined to select the most energy efficient one according to the established criteria, then the selected system is adapted to operate at all engine operating points to finally evaluate the heat exchanger network and analyze the membrane area sweep on the conclusive layout.
3.2.1. Turbocharging System
To perform a detailed analysis of the turbochargers size ratio effect on the optimization parameter, Figure 10 presents its influence on the turbochargers behavior (summarized in Table 3), and Figure 11 shows the resulting air conditions at the MIEC membrane and the mass fuel consumption in burners, both for each turbocharging configuration. The graphs must be read from right to left as the sweep was done by downsizing the second turbocharger, as explained in the method section of this document. The bottom axis of the graphs is the turbine scale factor, which is the same as that of the full turbocharger, since no further correction is required as for the compressor. The upper axis is the corresponding scale factor of the compressor with respect to the original size, after adjusting its corrected mass flow factor. Scale factors are in percentage, therefore 100% means that turbomachinery has equal size than the original engine turbochargers, while lower values means that the turbomachinery size -maximum diameters- has been reduced. Finally, to facilitate the analysis of Figure 11 a blue vertical dash-dot line points out the turbochargers size ratio that consumes the least fuel.
Figure 10.
Influence of turbochargers size ratio on turbochargers behavior in the configurations studied at full load engine operating point: (a) Parallel. (b) Serial. (c) Two stages compression.
Figure 10.
Influence of turbochargers size ratio on turbochargers behavior in the configurations studied at full load engine operating point: (a) Parallel. (b) Serial. (c) Two stages compression.
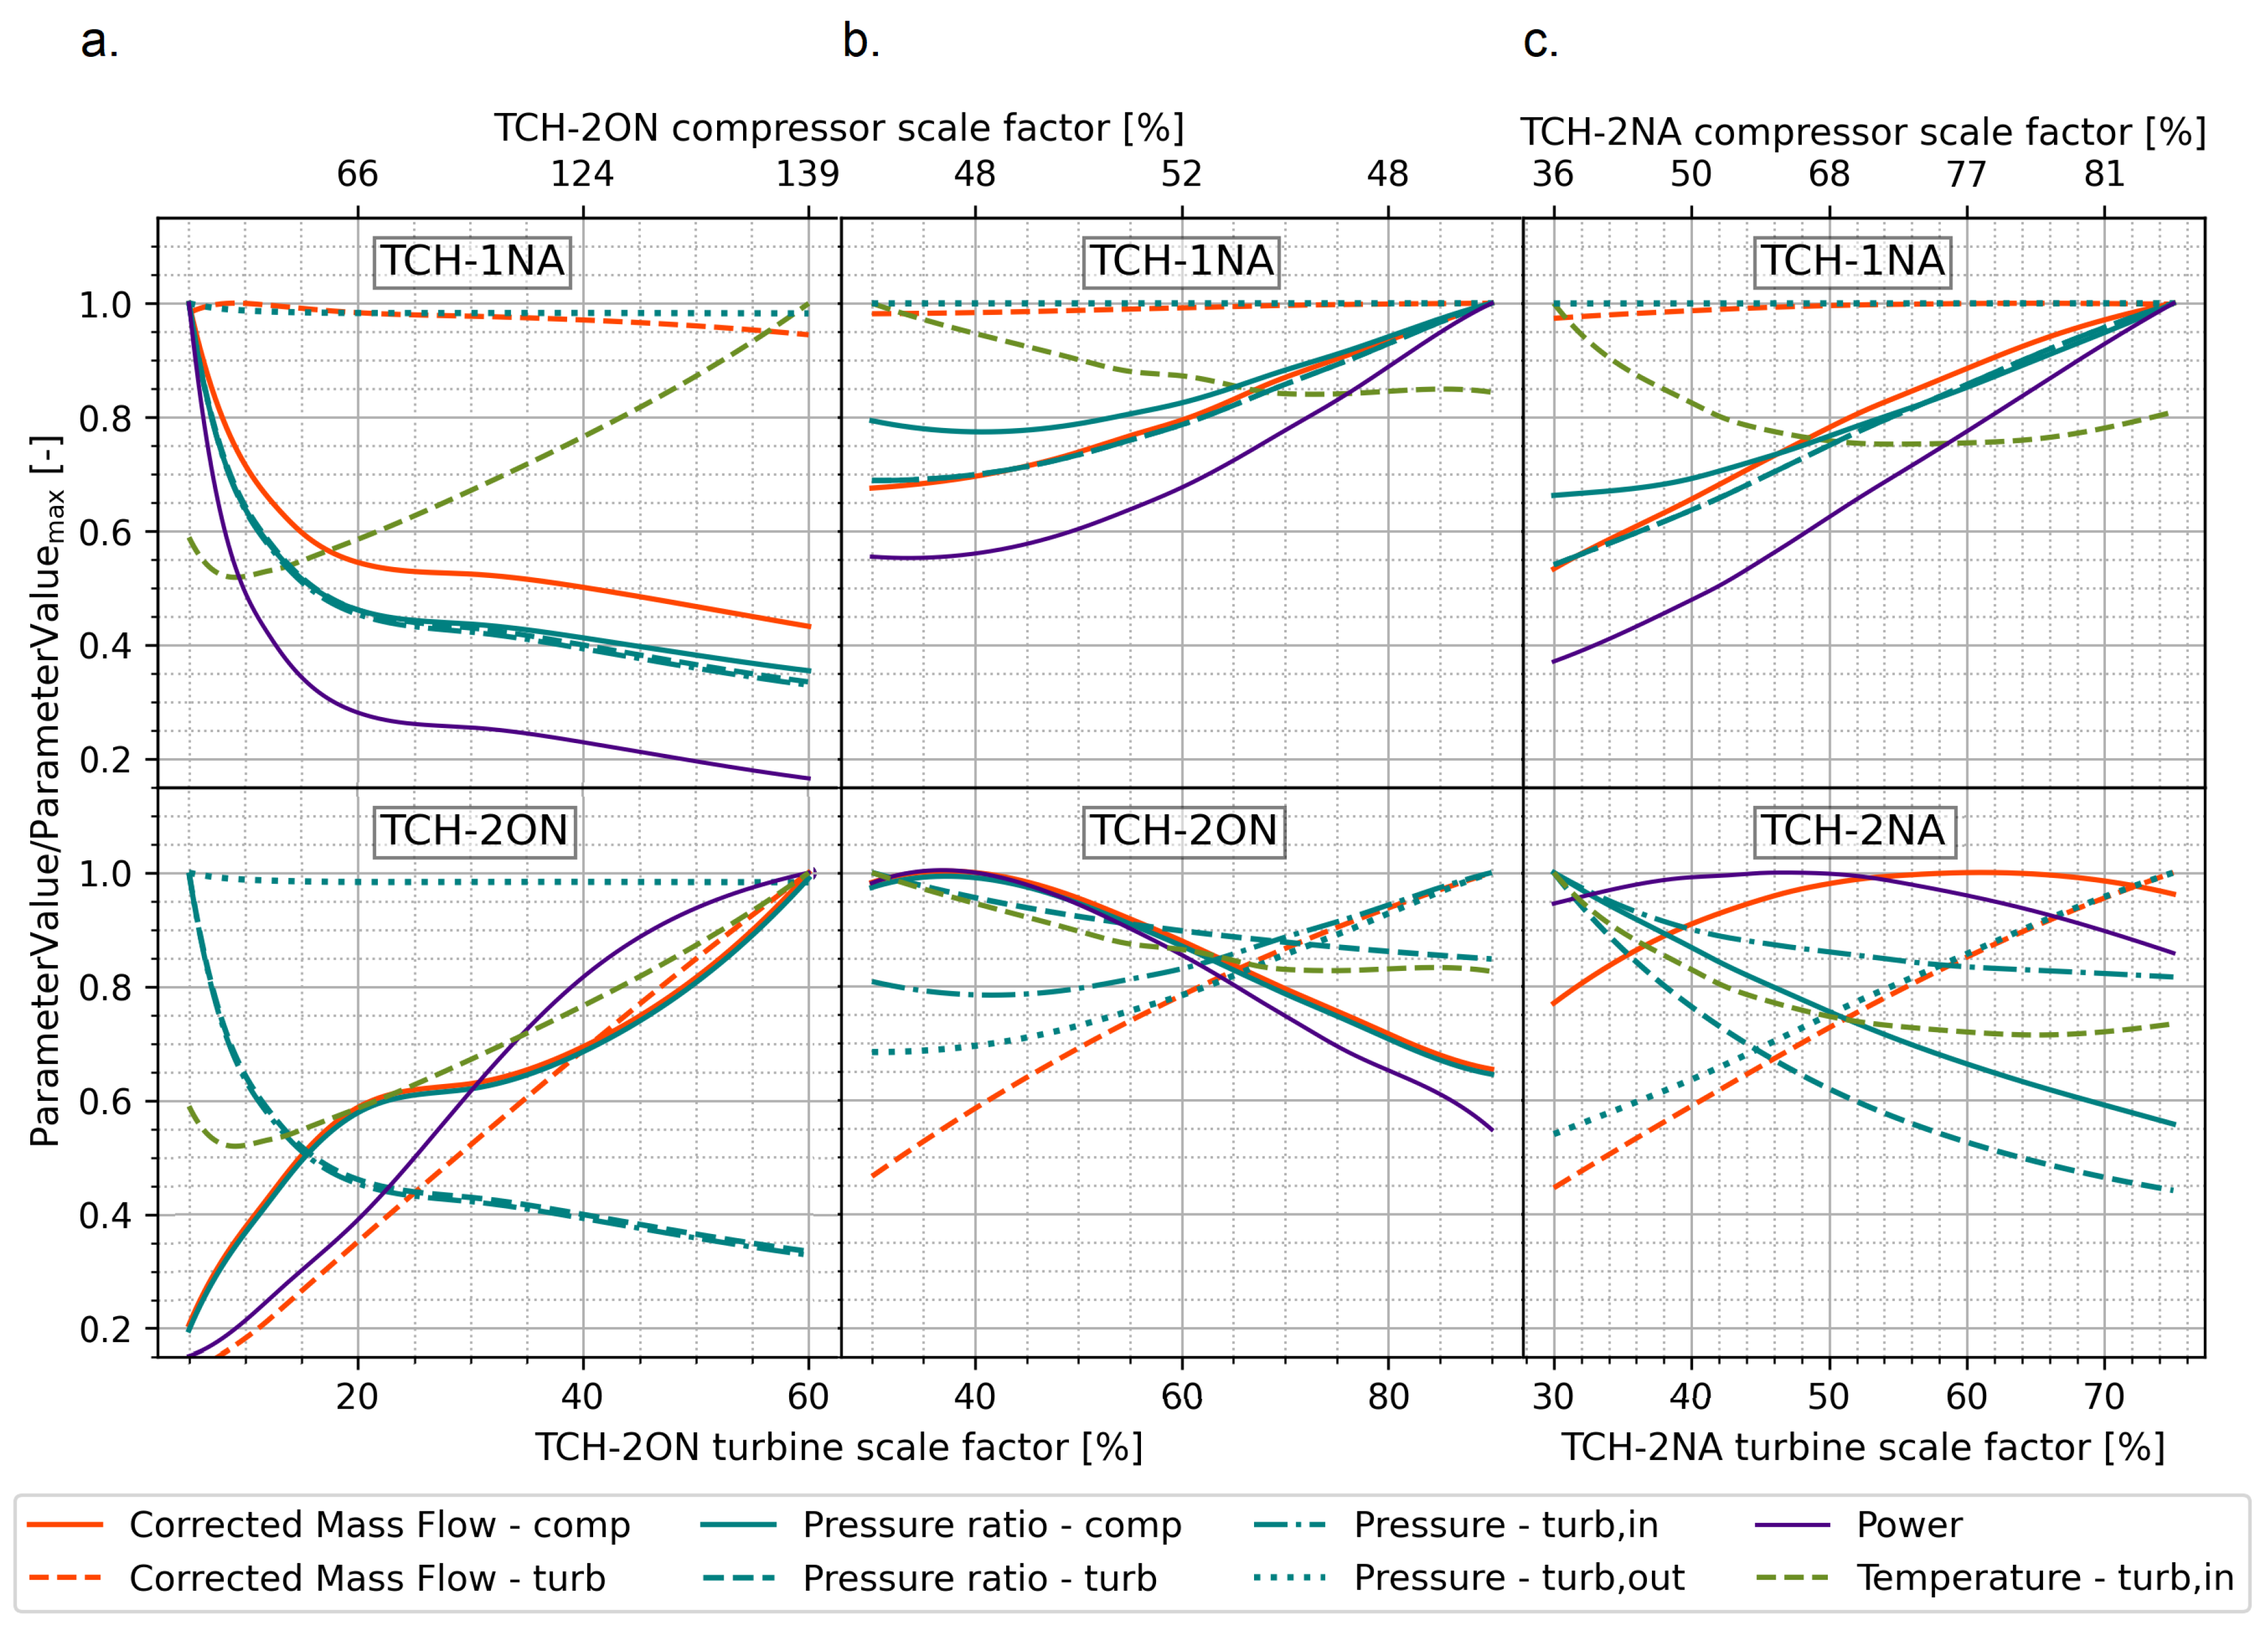
Figure 11.
Influence of turbochargers size ratio on MIEC operating conditions and burners fuel consumption in the configurations studied at full load engine operating point: (a) Parallel. (b) Serial. (c) Two stages compression.
Figure 11.
Influence of turbochargers size ratio on MIEC operating conditions and burners fuel consumption in the configurations studied at full load engine operating point: (a) Parallel. (b) Serial. (c) Two stages compression.
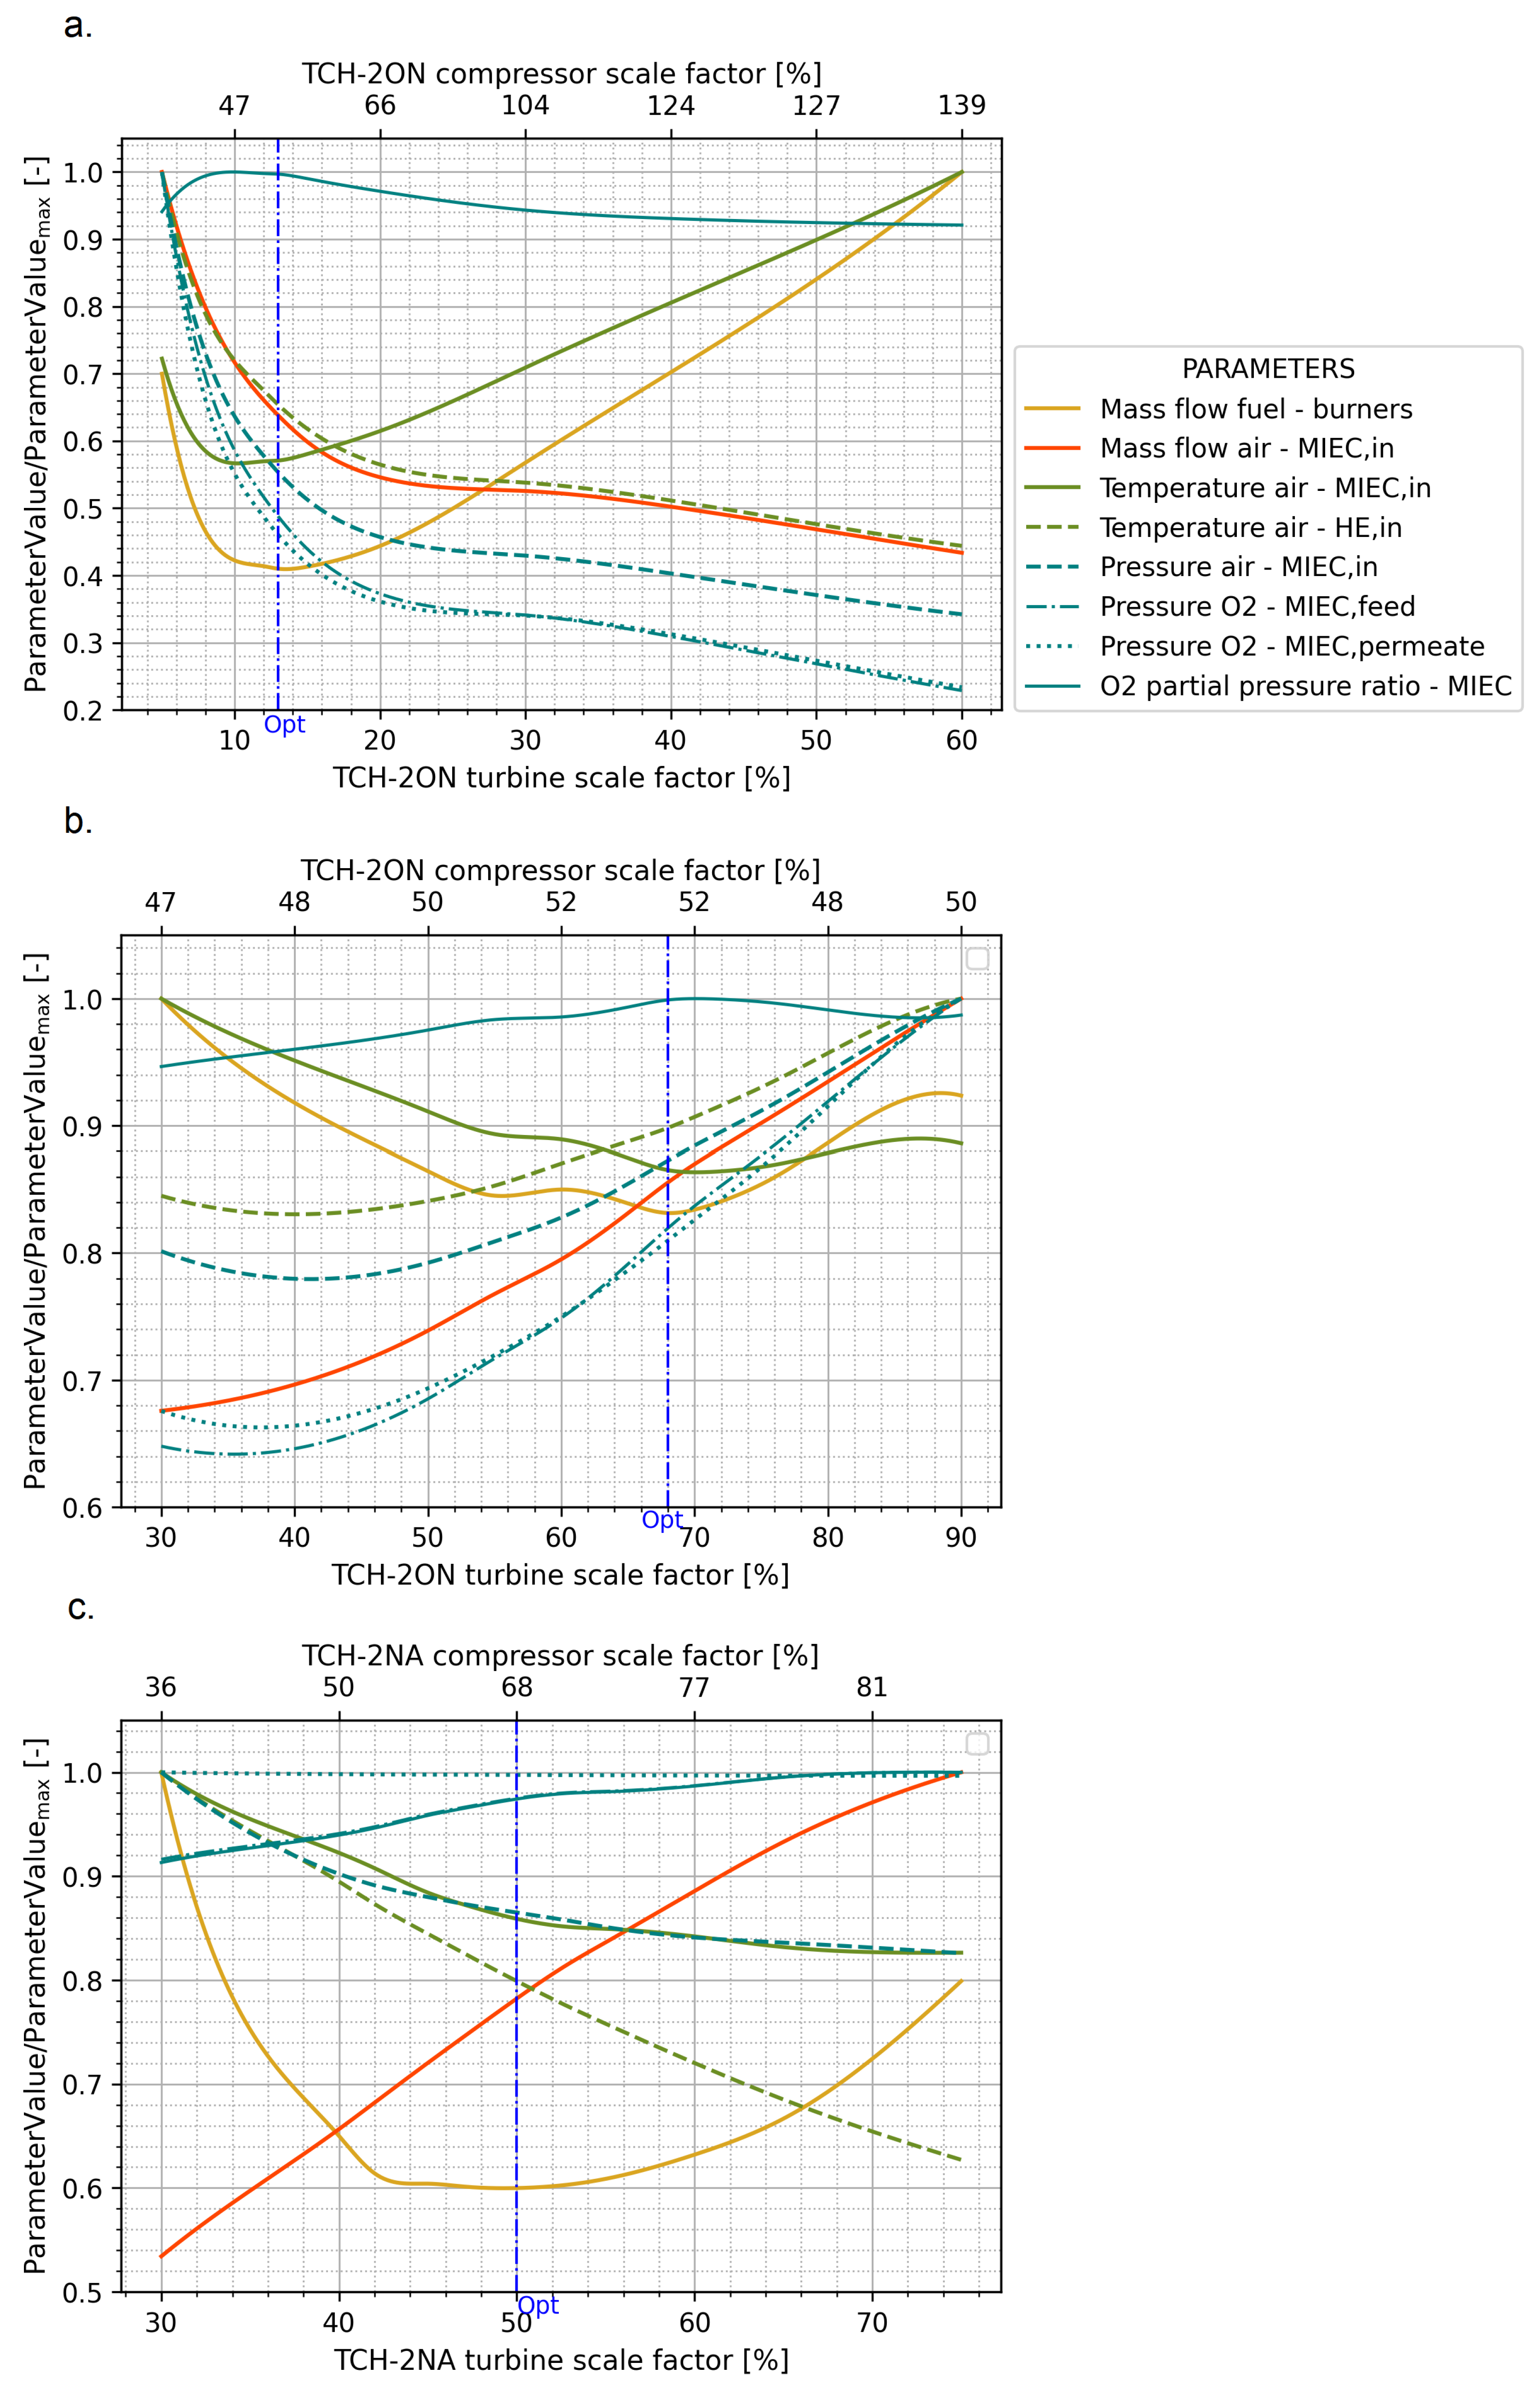
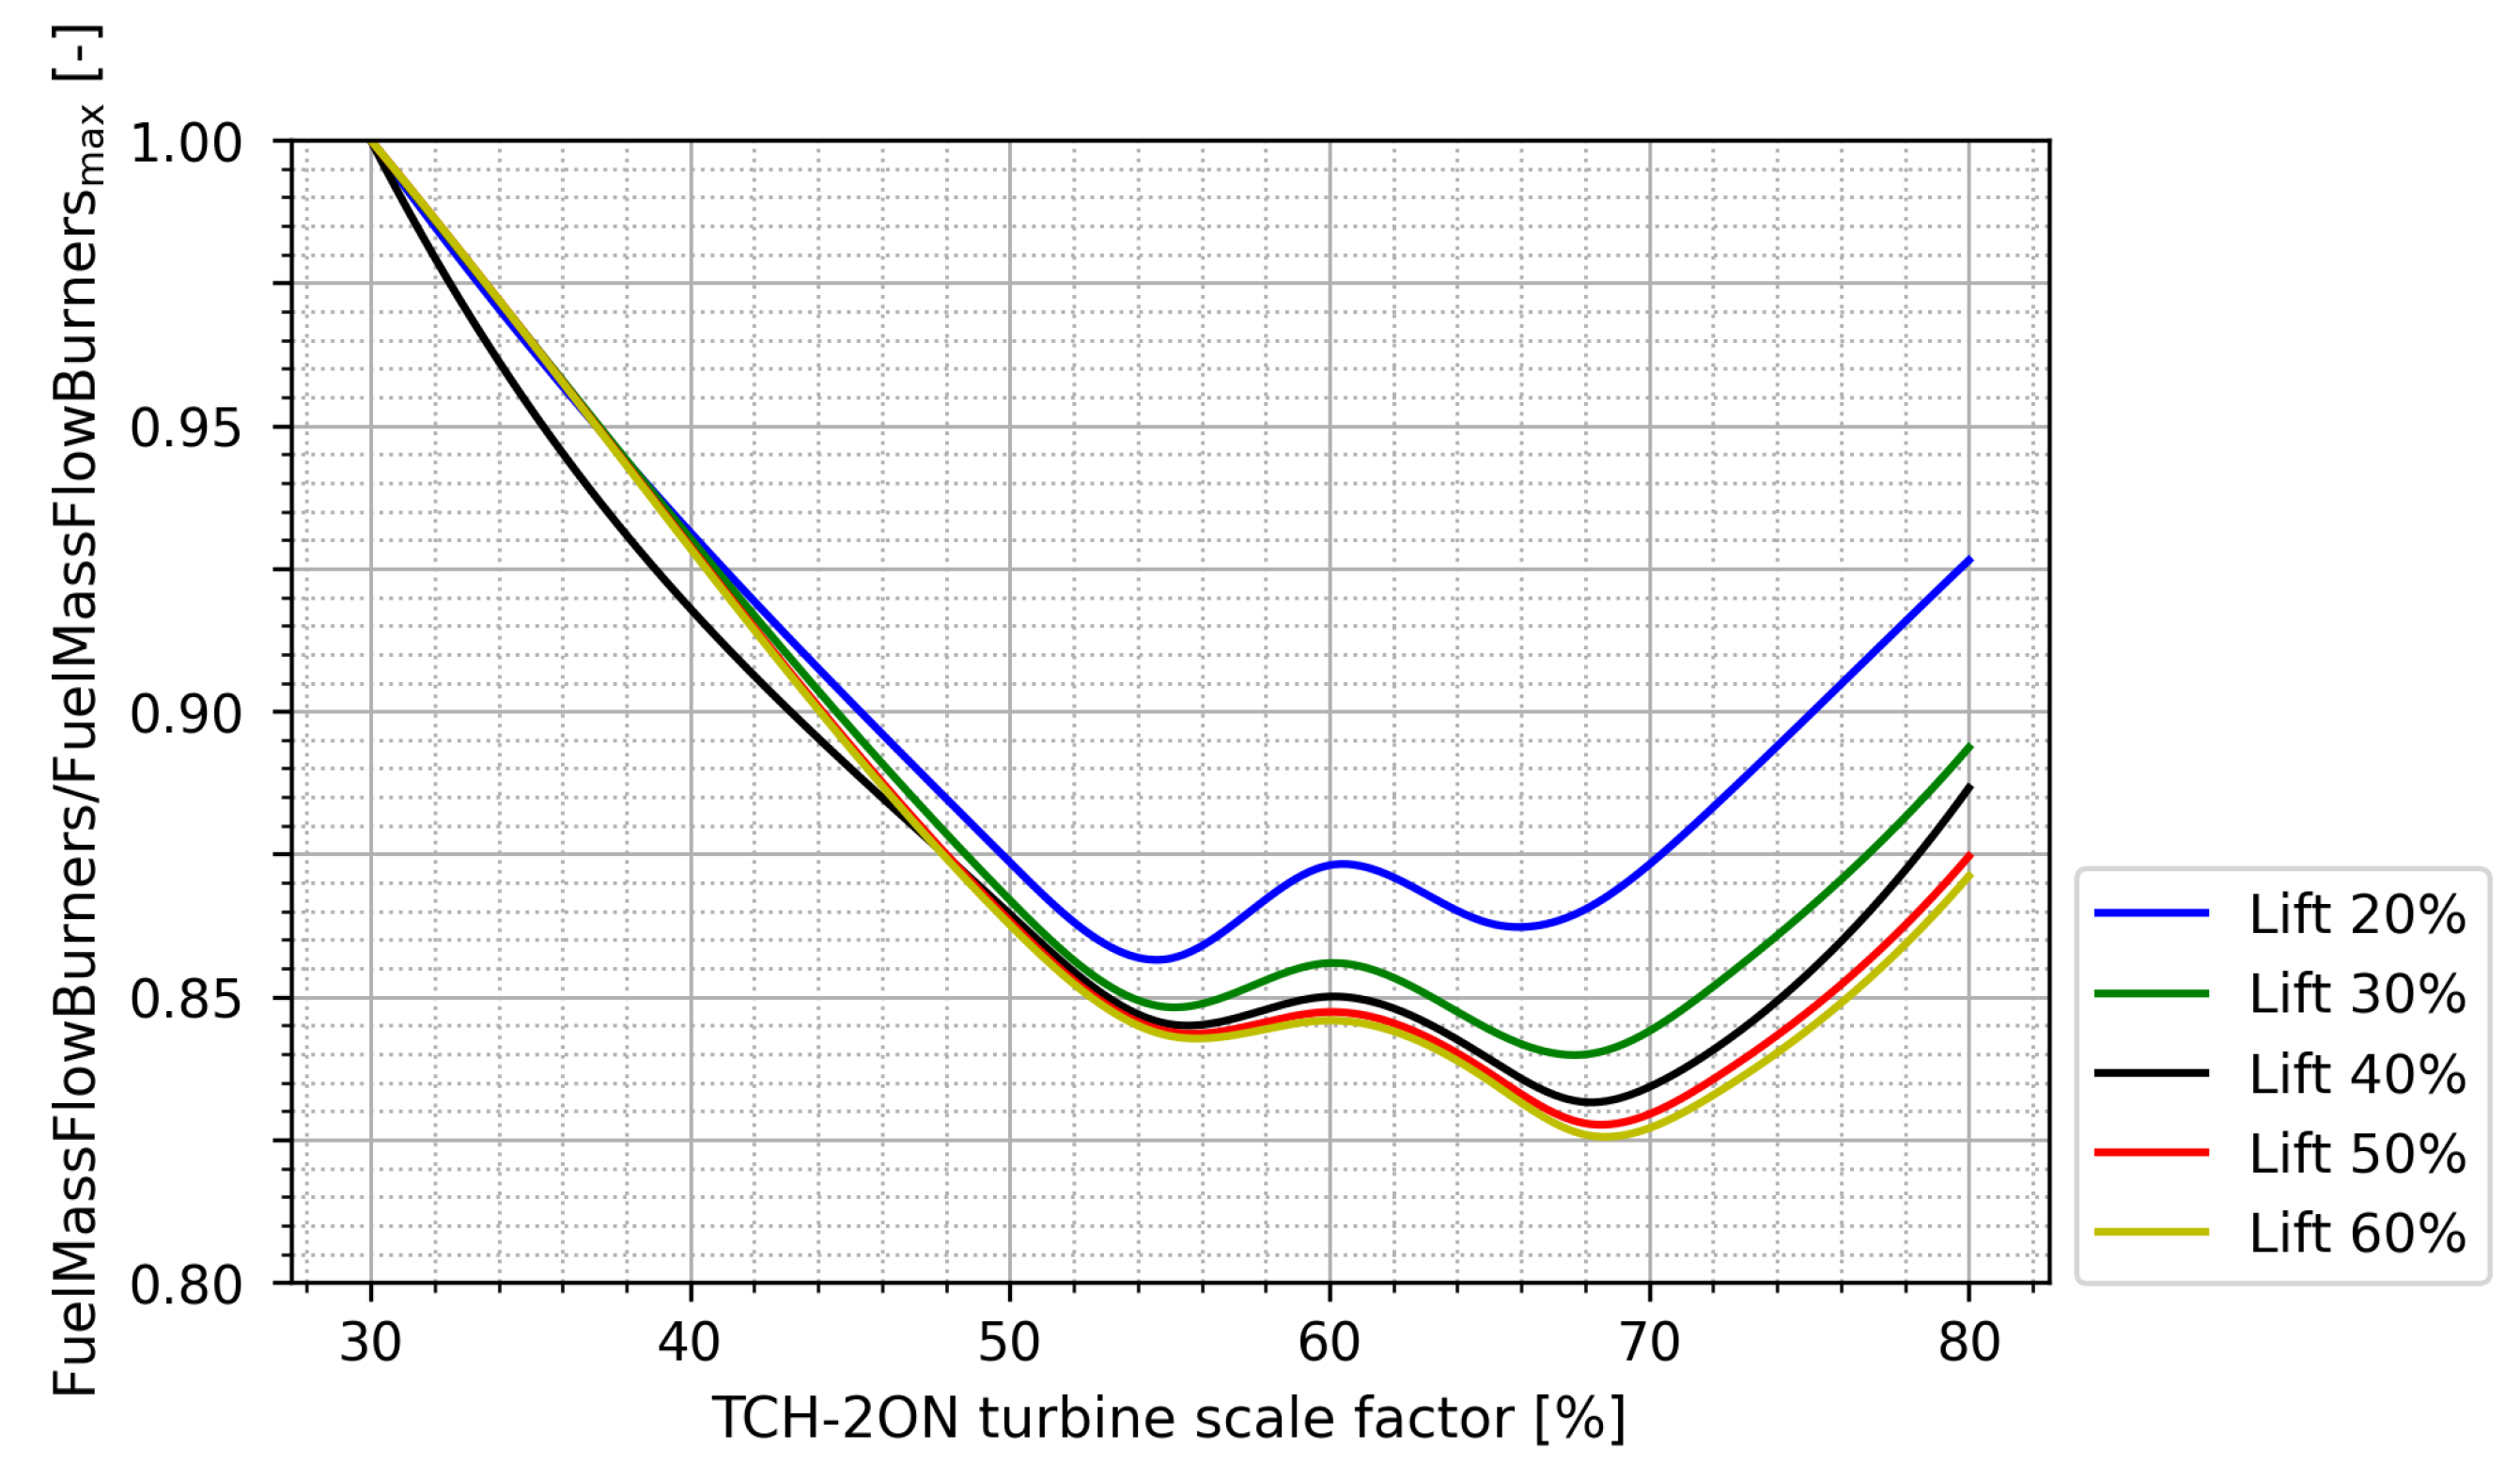
Figure 12.
Sweep of the by-pass valve lift of the serial turbocharging system.
-
Parallel configuration (Figure 4): When the turbochargers are connected in parallel, the turbines share the N inlet line, so it must be divided so that each receives a part of the flow. If the turbines are of the same size, both suck in equal amounts of N, but if one of them is smaller it receives less. This characteristic in parallel arrangement explains the evolution of the behavior in the turbochargers when performing the size sweep of the TCH-2NA turbo (see Figure 10.a). The TCH-1NA turbocharger has a predictable tendency, as more N corrected mass flow through the turbine, the more speed, power and, therefore, pressure ratio the turbine and compressor have; however, the same is not true for the TCH-2ON turbocharger because, besides the N flowing through, there are other factors affecting its performance. As Table 3 presents, the pressure ratio in TCH-2ON turbine increases because the rise of the pressure ratio in TCH-1NA compressor leads to a higher pressure of N flowing out of the MIEC, however, its temperature is lower due to the drop in fuel consumption (see Figure 11.a); as a result of these conditions in the N coming out of the MIEC, the THC-2ON turbocharger power decreases.After this analysis of turbocharging variation, it is possible to explain the effect on MIEC operation and fuel burner expenditure in parallel configuration (Figure 11.a). The increase in power and pressure ratio of TCH-1NA turbocharger entails an increase in the air mass flow coming in the system and in the air pressure after compression, thus contributing to the increment in the O partial pressure on the feed side. On the other hand, the decrease in THC-2ON turbocharger power causes a lower suction in the O flow line and thus to a higher O partial pressure on the permeate side. Despite the latter, the ratio of O partial pressures in the MIEC increases because the growth rate of the partial pressure on the feed side is higher than on the permeate side until it reaches 10 % of the turbine scale factor beyond which the tendency is opposite. The lowest fuel consumption is around 12.5% of the TCH-2NA turbine scale factor, in the range where the ratio of O partial pressures is maximum, and within this, where the temperature of the air entering the MIEC is higher.
-
Serial configuration (Figure 5): When the turbochargers are placed in series, the larger one (low pressure turbine) always receives all the N flow entering the turbocharging system, while the smaller one (high pressure turbine) could be by-passed to regulate the flow boosting the turbine and thus to avoid working out of range. In this case the TCH-2ON turbocharger is by-passed, for which a sweep of the valve lift with respect to the turbine scale factor was performed to establish the lift that implies the lowest fuel consumption. Figure 12 displays this sweep for openings between 20% and 60%, since in this interval the turbocharger works properly. As can be seen the lifts from 40% to 60% are very close and present the lowest fuel consumption, independently of the turbine scale factor, so the selected one is 50% to avoid being at the limit of the range.Continuing with the analysis of the serial turbocharging system, as the N mass flow through TCH-2ON turbine decreases by its size reduction, there is less suction in the N line leaving the MIEC, thus slightly decreasing the mass flow passing through the TCH-1NA turbine; for this reason the behavior of the TCH-1NA turbocharger is opposite to the manifested by the parallel arrangement. As for the TCH-2ON turbocharger, examining Figure 10.b and Table 3, it is evident that the pressure ratio in the turbine increases even though the inlet pressure decreases, which occurs because the outlet pressure also drops, but at a higher rate. This increment in the pressure ratio and temperature of the flow entering TCH2-ON turbine results in an increase in the power output of the TCH-2ON turbocharger.Regarding the MIEC operating conditions and fuel consumption, the declined performance of TCH-1NA turbocharger implies a decrease in the air mass flow drawn from the atmosphere and in the air pressure after compression, leading to a lower O partial pressure on the membrane feed side. The improved power of TCH-2ON generates a higher vacuum in the O flow line and, consequently, a decrease in the O partial pressure on the permeate side. Despite the decrease in O2 partial pressures on both membrane sides, the ratio between them depends on the rate of decrease of one with respect to the other. As evidenced in Figure 11.b, from 72% to 68% of turbine scale factor, the slopes of both curves are almost equal, and from the last point the slope of the partial pressure on the feed side is greater than on the permeate; for this reason the O partial pressure ratio increases up to this range and then decreases. The lowest fuel consumption is found at 68% of the TCH-2NA turbine scale factor, in the range where the ratio of O partial pressures is maximum, and within this, where the temperature of the air entering the MIEC is higher, as concluded in the previous parallel configuration.
-
Two stage air compression (Figure 6): The third turbocharging configuration studied is another serial arrangement but, in this case, the two turbochargers work in full serial mode (i.e. no by-pass valve) and both are located in the air flow line to obtain the O partial pressure gradient in the MIEC by compressing only the fluid going to the feed side. Since this configuration has the operating principle of the previous one, the TCH-1NA turbo has the same tendency in performance variation (Figure 10.c). Nevertheless, the TCH-2NA turbocharger power first improves due to the increase in the pressure ratio and temperature of N entering TCH-2NA turbine, but later decreases due to the corrected mass flow decrease. It is worth noting that, this time, the pressure ratio increases due to the rise in the inlet pressure of TCH-2NA turbine caused by the conditions produced in the MIEC; in addition to the significant decrease in the inlet pressure of TCH-1NA turbine (outlet of TCH-2NA turbine).Although the turbochargers behavior in this case is very similar to the past one, the MIEC and fuel consumption are different. The reason is that the cooler between the compression stages leads to a lower air temperature after the turbocharging system compared to the other designs studied (it can be seen in Figure 13), so now the main purpose of the burners is to heat the air up to the MIEC requirement instead of increasing the O partial pressure ratio, because the two stage air compression is high enough to reach a very good outlet air pressure. This change in the burners operating objective explains why the EGR line burner is not needed for this configuration at full engine load and the exhaust gases line burner is sufficient to heat the air to the required value at the MIEC. The lowest fuel consumption is obtained when the TCH-2NA turbine scale factor is around 50% where the temperature of air entering the MIEC is high enough without further reduction of O partial pressure ratio in the MIEC.
From this study about the optimal turbochargers size ratio, it is important to highlight that it relies around two main parameters related with the MIEC correct operation: the ratio of O partial pressures between the feed and permeate side, and the temperature of air coming in the membrane. These parameters have a proportional and opposite tendency during the sweep of the scale factors, as shown in Figure 11.a to Figure 11c. As well as the temperature of air reaching the MIEC, the fuel consumption follows somehow the opposite trend to the O partial pressure ratio achieved by the turbocharging system, as long as the air temperature entering the heat exchanger network is not too far from that the system requires, in which case consumption will depend on this latter.
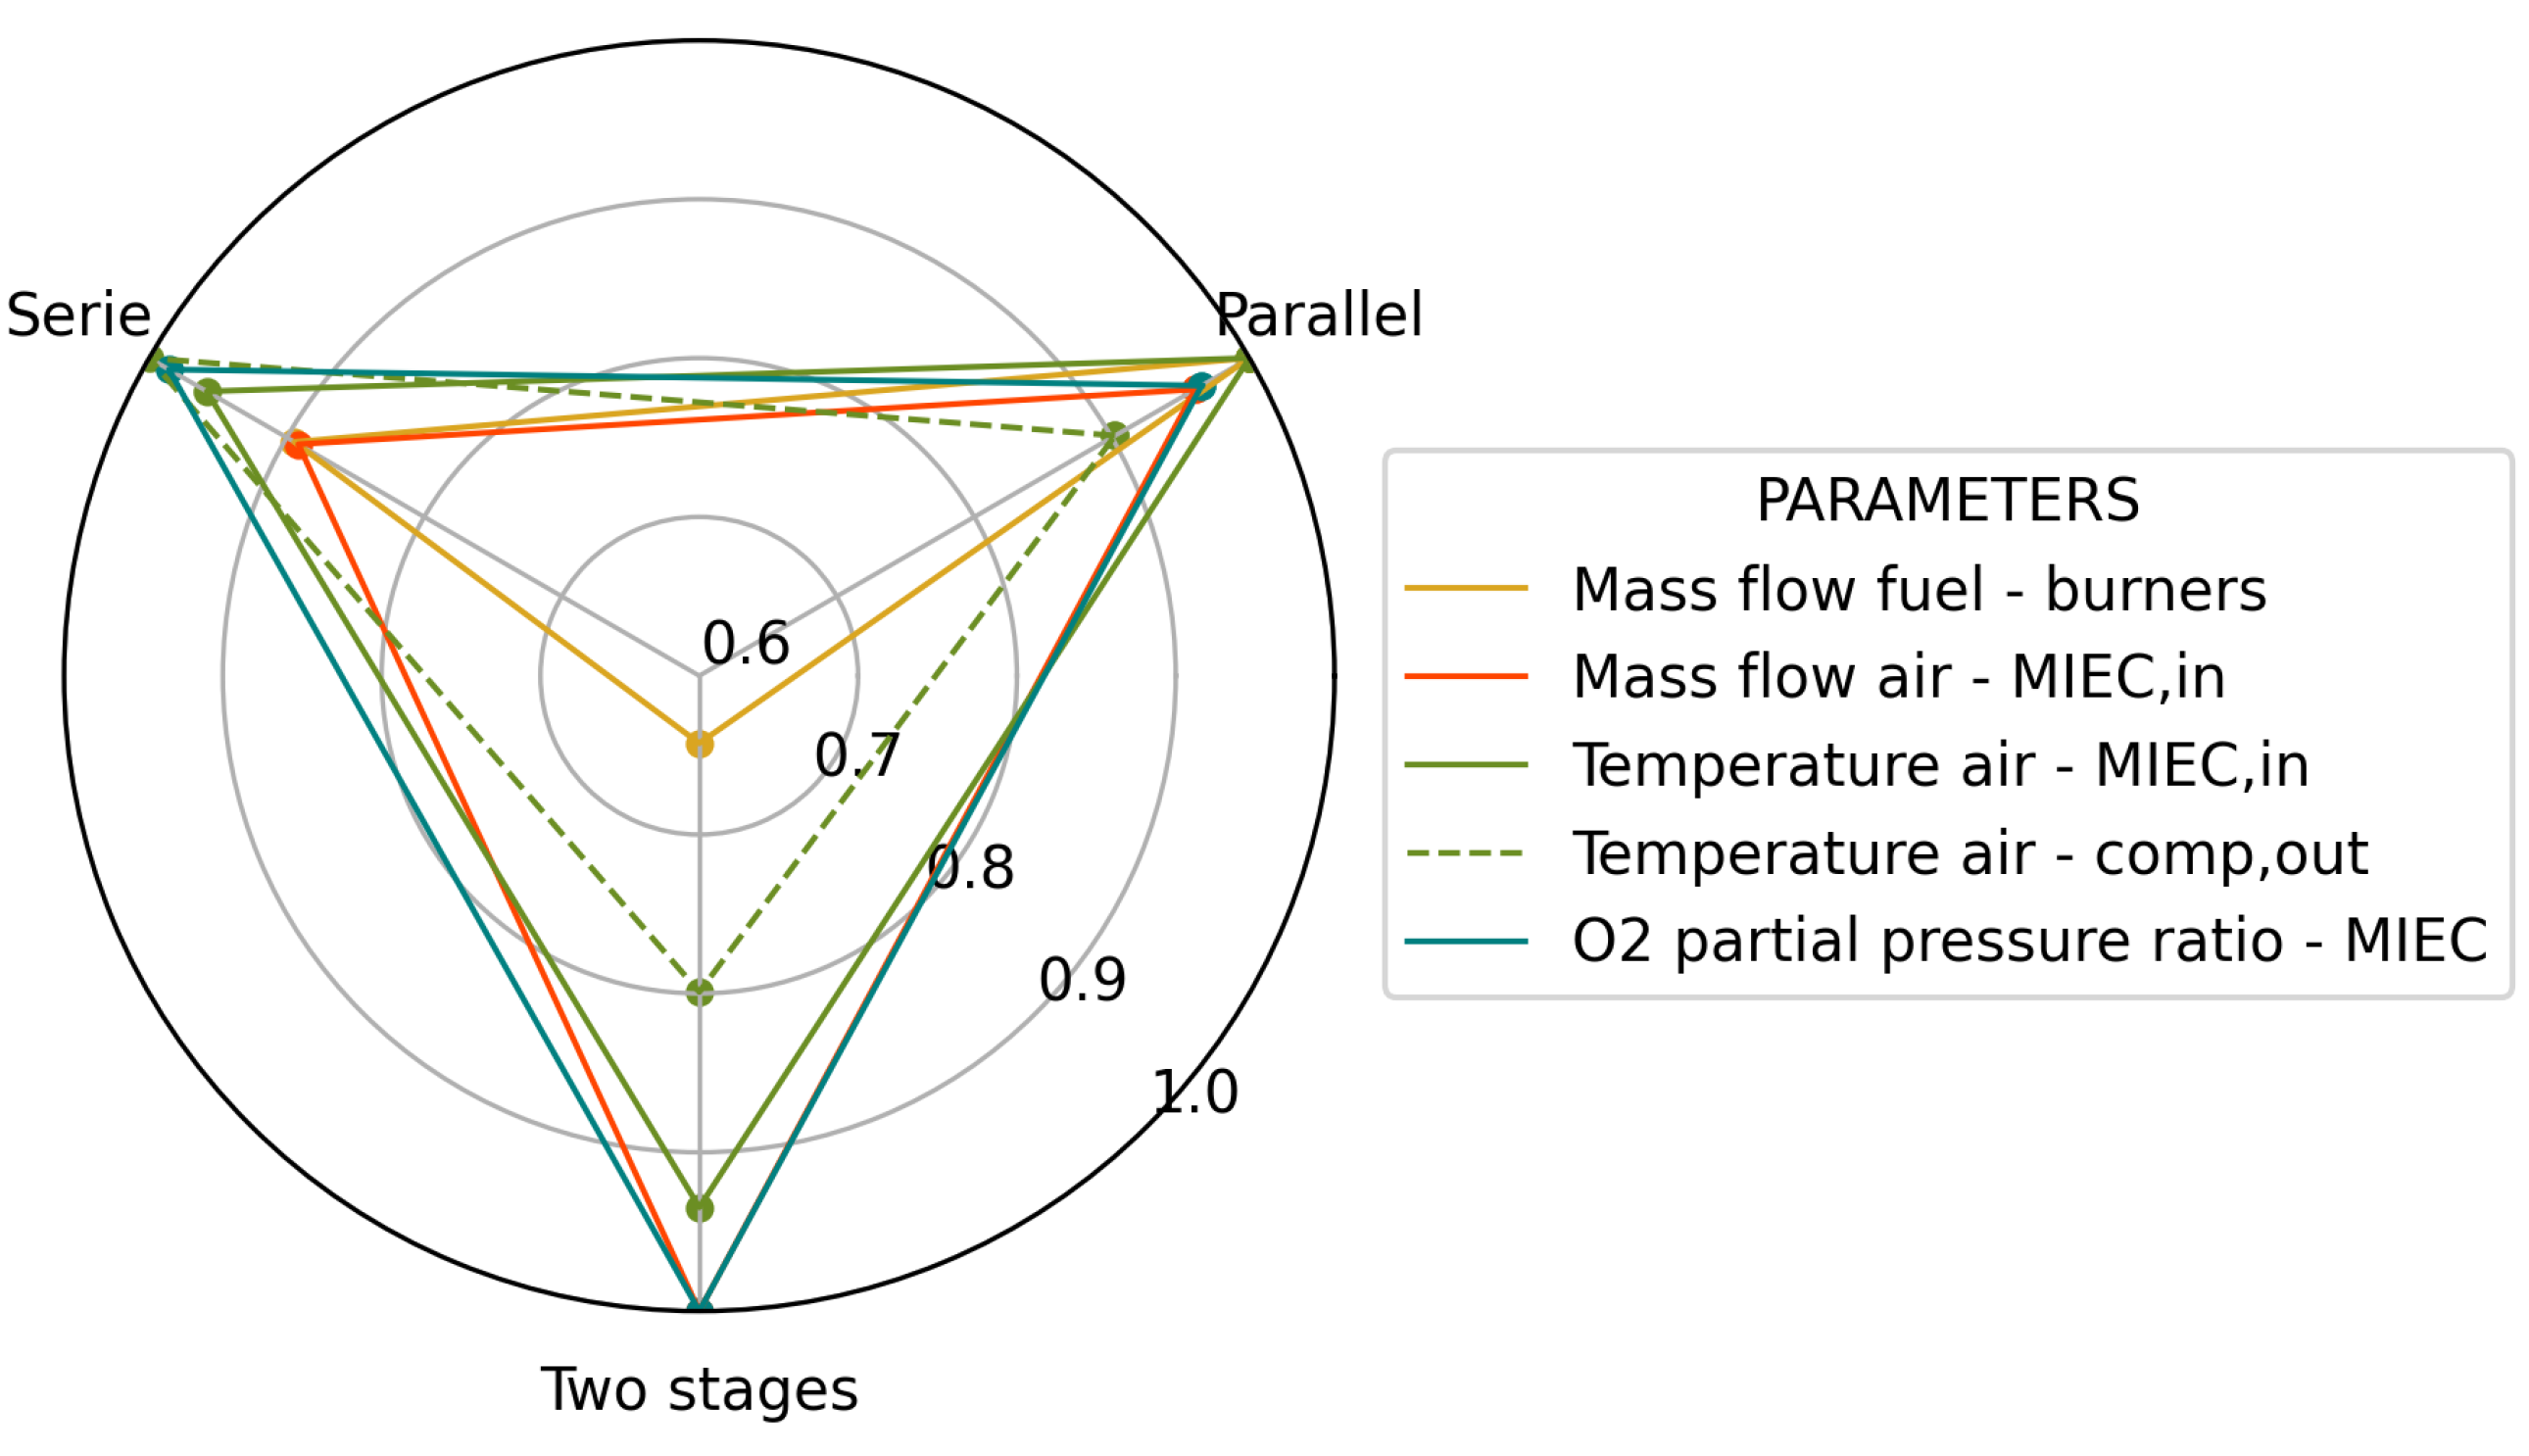
Once each turbocharging configuration has been examined, the arrangements are compared using Figure 13 which shows the main variables that define the system efficiency, in order to subsequently select the most energy-efficient one. As can be seen in the graph, the two stage air compression configuration achieves the highest ratio of O partial pressures and the highest air mass flow despite the lower temperature of the air entering the MIEC. This turbocharging layout achieves the best possible conditions for the membrane operation which results in the lowest fuel consumption in the burners.
Figure 13.
Comparison of turbocharging configurations studied at full load engine operating point.
Before continuing with the heat exchanger network evaluation and the membrane area sweep, the selected turbocharging configuration is evaluated for all engine speeds. As can be seen in Figure 14a., the intake air charge entering the MIEC is almost constant for the first three operating points, regardless of the O target for each of them. In this range the trends of the air temperature and O partial pressure ratio are opposite as in Figure 11.c, but this time the fuel consumption in the burners is proportional to the latter because the size of the turbochargers is the same, and therefore the decisive parameter is the temperature. At full load the air mass flow increases because the growth of the air temperature with respect to the preceding point is not significant, and the other parameters must compensate the MIEC requirements to generate the O.
Figure 14.b to Figure 14.e show the compressor and turbine maps for the optimum size found of turbochargers TCH-1NA and TCH-2NA for all engine operating points. In these, confirming the previous explanation, the first three engine speeds are very close (indeed 72.7 rpm points overlaps 63.5 point in the turbochargers maps) and the full load point presents more pressure ratio and reduced mass flow.
3.2.2. Heat Exchanger System
The heat exchanger network was conceived on the basis of previous studies and adapted to the marine engine conditions, as explained in the method section. Its optimization process was oriented to take advantage, as much as possible, of the residual energy from the fluids circulating in the O production system by using as few regenerators as viable. In this way, the heat exchanged by each regenerator is the most important variable to discard the less necessary ones and obtain the most simplified heat exchanger network.
Figure 15.a first shows a bar chart of the heat exchanged in each regenerator as the ratio over the total heat exchanged in the network, for the most optimal turbocharging system selected and for the full engine operating point; this chart also represents the hot and cold fluids passing through each regenerator. Secondly, Figure 15.b shows the same as the previous one but for all engine operating point, so a typical line graph is used instead of a bar chart. Both are in logarithmic scale due to the different orders of magnitude in heat exchange are interesting to be compared in a visible way.
As reflected in the first graph, N (RG-4) is the fluid that contributes the most to air warming followed by engine exhaust gases (RG-7), both account for almost three-quarters of the total energy transferred to the air. On the other hand, the O line (RG-14) provides the least energy to the air, however, its heat input helps more to reduce the fuel consumption necessary to warm the EGR at low loads, and thus add the missing energy to the air in order to meet the MIEC requirements. Although the regenerators that heat the EGR before it transfers energy to the air (RG-13 and RG-14) present much less heat transferred than the other regenerators, they contribute more at low loads to the reduction of fuel consumption in the burners, in addition to cooling the O and exhaust gases to facilitate the following processes involving these fluids, as explained in the method section.
When evaluating the heat exchanger network at the other engine operating points (Figure 15.b), it is observed that as it decreases the heat transferred to the air by the exhaust gases also decreases because the mass flow and the energy available in this fluid is proportional to the engine load. Since the O required by the engine also decreases with the operating point, the conditions during the MIEC operation are lower so the heat transferred by the fluids leaving the MIEC to the air declines. As a result of the loss of energy available in these flow lines, the EGR has to supply the missing energy to the air to meet the MIEC requirements, because of this the heat transferred by the EGR (RG-12) must increase for the two lowest points of engine operation. What means burning fuel using the excess of O from the EGR and therefore increasing fuel consumption.
3.2.3. MIEC Membrane
Once the final O production system is established and evaluated for all engine operating points, the membrane area sweep is performed to select the most suitable one for the final design. Figure 16 shows the ratio of fuel used in the burners to engine fuel consumption for each area evaluated. Modifying the membrane surface area leads to a better permeability since it favors the adsorption and dissociation of oxygen molecules by reducing the resistance of their transport through the membrane; for this reason, larger membranes require less pressure and temperature to operate [25]. The tendency of curves is asymptotic, which means that from a specific membrane area its increase does not represent further improvement in fuel consumption; this happens because regardless of area, the membrane requires minimum air conditions to operate.
Regarding the differences in fuel consumption between engine operating points, the lower speed points present more relative fuel consumption, but not because the engine requires more O but because the flow lines of the O production system coming from the engine have much less energy to transfer to the air. Based on this analysis, the membrane area selected considering all engine operating points is 14000 m.
3.3. Conclusive Oxy-Fuel Marine Engine Layout
Figure 17 shows the complete final configuration of the marine engine working with oxy-fuel combustion and connected to the in-situ O production system obtained from the optimization process. The actual values from the simulations correspond to full load conditions (78 rpm) are shown in the schematic since the analysis of the ongoing study results was performed with relative values to protect the manufacturer’s engine data. In the diagram this information is still secured because it only shows flow data for the engine operating under oxy-combustion conditions, except those related to the engine fuel consumption.
As main takeovers in Figure 17 it is important to comment that, the exhaust gases leaving the engine configuration, i.e. the TCH-1AG turbocharger, present a very low temperature of 276.8 °C compared to an automotive engine. After the CC-2 burner this temperature rises to 1212.3 °C, but since the mass flow after flow splitting is low 5.8 kg/s, the heat transferred to the air is not sufficient; as discussed in the heat exhanger system analysis. At the end of the exhaust gases path the temperature achieved is 280.1 °C for the subsequent CO capture process. On the other hand, the EGR mass flow is 48.3 kg/s, which is much higher than the exhaust gases mass flow due to the EGR to O ratio established at the beginning of this study. For the exposed engine operating point (78 rpm) the CC-3 burner is not used, as explained in the turbocharging system selection, for this reason the EGR temperature before transferring the energy to the air is 282.7 °C, almost the same than the initial 274.5 °C. Finally, with respect to O production, since combustion in four cylinders (half of the engine) requires 4.5 kg/s of O, the air conditions reached at the MIEC for this purpose are: air temperature of 802.1 °C, air mass flow of 39.7 kg/s, air feed pressure of 7.2 bar, and therefore an O partial pressure ratio of 1.06.
4. Conclusions
To the best knowledge of the authors, this is the first detailed study available in the literature about oxy-fuel combustion for a 2S multi-cylinder cargo-ship engine; moreover considering turbocharging, oxygen generation and exhaust gases post-combustion conditioning sub-systems for further CO capture.
The oxy-fuel combustion technology is a novel option for exhaust gas treatment in maritime transport, as it avoids NO emissions and facilitates the separation of CO from exhaust gases for subsequent capture. However, these improvements in emissions levels come at the expense of increased engine BSFC to obtain the original brake power and torque. This is because EGR, by replacing N in the intake charge, has a lower specific heat ratio, which decreases the indicated efficiency per cycle and thus increases fuel injection.
In-situ O production in a marine engine is quite convenient due to the huge difficulties in the logistics of supplying large amounts of O continuously from an external source. The O production system, based in MIEC membranes, involves two main subsystems that work together to condition the air for its separation process in the membrane: heat exchanger system and turbocharging system.
The heat exchanger system requires the implementation of combustion chambers in the exhaust gas and EGR flow lines to increase the heat transfer to the air, because the energy obtained from the flow lines coming from the engine is not sufficient due to the thermo-mechanical limits for exhaust gas temperature in 2S ship engines. In any case, the remaining O in the exhaust gas must be burned since, in addition to providing energy to the air, it is mandatory for the effective CO separation. While only for the two lowest engine loads, the combustion chamber in the EGR flow line is necessary, because the heat achieved in the exhaust gases is even less than in full load conditions.
In relation with the turbocharging configuration selection, it is worth mentioning that, because a 3-end design membrane was used for O generation in the ship engine, it was initially assumed that the driving force to compensate for the missing sweep current in the MIEC, would be a vacuum suction force on the permeate side. Nevertheless, in evaluating various types of turbocharging configurations it was concluded that the two stage air compression system remains the best due to the high O partial pressure achieved on the feed side; confirming the preference for it in previous related studies available in the literature.
Along with the selection of the turbocharging arrangement, it is essential to optimize the performance of the configuration itself in order to find the most optimal turbochargers size ratio aim to obtain the lowest fuel consumption in burners. To this end, the present work proposes a methodology that consist of maintaining the size of the turbocharger that receives the air directly from the atmosphere equal to those of the air engine design; while sweeping the second turbocharger size with respect to this reference one. This is carried out in this way since increasing the first turbocharger dimensions it is not feasible because it is already a very large turbomachine; and on the other hand, decreasing it implies having less air mass flow entering the complete system. Instead, downsizing the second turbocharger improves the air conditions for the MIEC membrane operation as long as it does not exceed the reduction limit from which the tendency is not favorable. The size scale factor sweep is in turn a 2 step methodology. First step is using similarity of turbo-machinery to downsize the whole turbocharger, even the scale factor used affects all turbocharger parameters (i.e. reduced speed, and flow in both compressor and turbine) the main focus is in turbine mass flow parameter optimization. Second step is fixing turbine size modifying only compressor size until optimizing engine operative conditions in the compressor map. What provides as output both a different size and a different compressor to turbine matching than the original turbocharger.
In order to complement the present suggested technology for emissions reduction in a marine engine, a further research is proposed to study the concept of CO capture in the model presented.
Author Contributions
Conceptualization, José R. Serrano, Francisco J. Arnau and Alejandro Calvo; methodology, José R. Serrano, Francisco J. Arnau and Alejandro Calvo; software, Francisco J. Arnau; validation, Rossana Burgos and Alejandro Calvo; formal analysis, Rossana Burgos and Alejandro Calvo; investigation, Rossana Burgos; resources, José R. Serrano, Alejandro Calvo; data curation, Francisco J. Arnau, Rossana Burgos and Alejandro Calvo; writing—original draft preparation, Rossana Burgos; writing—review and editing, José R. Serrano, Francisco J. Arnau and Alejandro Calvo; visualization, Francisco J. Arnau; supervision, José R. Serrano and Francisco J. Arnau; project administration, José R. Serrano; funding acquisition, José R. Serrano, Francisco J. Arnau and Alejandro Calvo. All authors have read and agreed to the published version of the manuscript.
Funding
This research has been partially supported by Grant CIPROM/2021/061 funded by Generalitat Valenciana. Also partially supported by Grant PID2021-123351OB-I00 funded by MCIN/AEI/ 10.13039/501100011033 and, as appropriate, by “ERDF A way of making Europe”. And also partially funded by Programa de Ayudas de Investigación y Desarrollo PAID-01-22, from Universitat Politècnica de València (UPV) which granted the Rossana’s pre-doctoral contract.
Informed Consent Statement
Informed consent was obtained from all subjects involved in the study.
Data Availability Statement
Data available on request from the authors.
Conflicts of Interest
The authors declare no conflict of interest.
Abbreviations
| 2SE | Two Stroke Engine |
| BMEP | Break Mean Effective Pressure |
| BOF | Basic Oxygen Furnace |
| BSCF | BaSrCoFeO membrane |
| BSFC | Break Specific Fuel Consumption |
| CAC | Compressed Air Cooler |
| C-ASU | Cryogenic Air Separation Unit |
| CCS | Carbon Capture and Storage |
| CI | Compression Ignition |
| CMCR | Contracted Maximum Continuous Rated |
| CO | Carbon Dioxide |
| DPF | Diesel Particulate Filter |
| ECA | Emission Control Areas |
| EGR | Exhaust Gas Recirculation |
| GHG | Greenhouse Gas |
| HFO | Heavy Fuel Oil |
| HVOF | High Velocity Oxy-Fuel |
| IMO | International Maritime Organization |
| m/m | mass by mass |
| MARPOL | Marine and Pollution |
| MDO | Marine Diesel Oil |
| MIEC | Mixed Ionic-Electronic Conducting Membrane |
| N | Nitrogen |
| NOx | Nitrous Oxides |
| O | Oxygen |
| ODS | Ozone Depleting Substances |
| PM | Particulate Matter |
| SCR | Selective Catalytic Reduction |
| SOx | Sulphur Oxides |
| VGT | Variable Geometry Turbine |
| VEMOD | Virtual Engine Model |
References
- International Maritime Organization. Marine Environment. Available online: https://www.imo.org/en/OurWork/Environment/Pages/Default.aspx (accessed on 15 March 2023).
- International Maritime Organization. Introduction to IMO. Available online: https://www.imo.org/en/About/Pages/Default.aspx (accessed on 15 March 2023).
- International Maritime Organization. Nitrogen Oxides (NOx) – Regulation 13. Available online: https://www.imo.org/en/OurWork/Environment/Pages/Nitrogen-oxides-(NOx)-Regulation-13.aspx.
- International Maritime Organization. Initial IMO GHG Strategy. Available online: https://www.imo.org/en/MediaCentre/HotTopics/pages/reducing-greenhouse-gas-.
- Deng, J.; Wang, X.; Wei, Z.; Wang, L.; Wang, C.; Chen, Z. A review of NOx and SOx emission reduction technologies for marine diesel engines and the potential evaluation of liquefied natural gas fuelled vessels. Science of the Total Environment 2021, 766. [Google Scholar] [CrossRef] [PubMed]
- Aakko-Saksa, P.T.; Lehtoranta, K.; Kuittinen, N.; Järvinen, A.; Jalkanen, J.-P.; Johnson, K.; Jung, H.; Ntziachristos, L.; Gagné, S.; Takahashi, C.; Karjalainen, P.; Rönkkö, T.; Timonen, H. Reduction in greenhouse gas and other emissions from ship engines: Current trends and future options. Progress in Energy and Combustion Science 2023, 94. [Google Scholar] [CrossRef]
- Einbu, A.; Pettersen, T.; Morud, J.; Tobiesen, F.; Jayarathna, C.; Skagestad, R.; Nysæter, G. Onboard CO2 Capture From Ship Engines. SSRN Electronic Journal 2021. [Google Scholar] [CrossRef]
- Mignard, D.; Pritchard, C. Processes for the Synthesis of Liquid Fuels from CO2 and Marine Energy. Chemical Engineering Research and Design 2006, 84, 828–836. [Google Scholar] [CrossRef]
- Li, X.; Peng, Z.; Pei, Y.; Ajmal, T.; Rana, K. J.; Aitouche, A.; & Mobasheri, R. Oxy-fuel combustion for carbon capture and storage in internal combustion engines – A review. International Journal of Energy Research 2022, 46, 505–522. [Google Scholar] [CrossRef]
- Buhre, B. J. P.; Elliott, L. K.; Sheng, C. D.; Gupta, R. P.; Wall, T. F. Oxy-fuel combustion technology for coal-fired power generation. Progress in Energy and Combustion Science 2005, 31, 283–307. [Google Scholar] [CrossRef]
- Wei, X.; Manovic, V.; & Hanak, D. P. Techno-economic assessment of coal- or biomass-fired oxy-combustion power plants with supercritical carbon dioxide cycle. Energy Conversion and Management 2020, 221. [Google Scholar] [CrossRef]
- Blomen, E.; Hendriksa, C.; Neele, F. Capture technologies: improvements and promising developments. Energy Procedia 2009, 1, 1505–1512. [Google Scholar] [CrossRef]
- Escudero, A. I.; Espatolero, S.; Romeo, L. M. Oxy-combustion power plant integration in an oil refinery to reduce CO2 emissions. International Journal of Greenhouse Gas Control 2016, 45, 118–129. [Google Scholar] [CrossRef]
- Carpenter, S. M.; Long, H. A. Integration of carbon capture in IGCC systems. Integrated Gasification Combined Cycle (IGCC) Technologies 2017, 445–463. [Google Scholar] [CrossRef]
- Carrasco-Maldonado, F.; Spörl, R.; Fleiger, K.; Hoenig, V.; Maier, J.; Scheffknecht, G. Oxy-fuel combustion technology for cement production - State of the art research and technology development. International Journal of Greenhouse Gas Control 2016, 45, 189–199. [Google Scholar] [CrossRef]
- Biyiklioğlu, O.; Tat, M. E. Tribological assessment of NiCr, Al2O3/TiO2, and Cr3C2/NiCr coatings applied on a cylinder liner of a heavy-duty diesel engine. International Journal of Engine Research 2021, 22, 2267–2280. [Google Scholar] [CrossRef]
- Quader, M. A.; Ahmed, S.; Ghazilla, R. A. R.; Ahmed, S.; Dahari, M. A comprehensive review on energy efficient CO2 breakthrough technologies for sustainable green iron and steel manufacturing. Renewable and Sustainable Energy Reviews 2015, 50, 594–614. [Google Scholar] [CrossRef]
- Wu, F.; Argyle, M. D.; Dellenback, P. A.; Fan, M. Progress in O2 separation for oxy-fuel combustion - A promising way for cost-effective CO2 capture: A review. Progress in Energy and Combustion Science 2018, 67, 188–205. [Google Scholar] [CrossRef]
- Panesar, R; Lord., M; Simpson., S; White., V; Gibbins., J; Reddy., S. Coal-Fired Advanced Supercritical Boiler/ Turbine Retrofit with CO2 capture. 8th International Conference on Greenhouse Gas Control Technologies, Trondheim, Norway, 19-22 June 2006. [Google Scholar]
- Portillo, E.; Alonso-Fariñas, B.; Vega, F.; Cano, M.; Navarrete, B. Alternatives for oxygen-selective membrane systems and their integration into the oxy-fuel combustion process: A review. Separation and Purification Technology 2019, 229. [Google Scholar] [CrossRef]
- Baumann, S.; Serra, J. M.; Lobera, M. P.; Escolástico, S.; Schulze-Küppers, F.; Meulenberg, W.A. Ultrahigh oxygen permeation flux through supported Ba0.5Sr0.5Co0.8Fe0.2O3-δ membranes. Journal of Membrane Science 2011, 377, 198–205. [Google Scholar] [CrossRef]
- Bouwmeester, H.J.M.; Burggraaf, A.J. Chapter 10 Dense ceramic membranes for oxygen separation. Membrane Science and Technology 1996, 4, 435–528. [Google Scholar] [CrossRef]
- Plazaola, A. A.; Labella, A. C.; Liu, Y.; Porras, N. B.; Tanaka, D. A. P.; Annaland, M. V. S.; Gallucci, F. Mixed ionic-electronic conducting membranes (MIEC) for their application in membrane reactors: A review. Processes 2019, 7, 128. [Google Scholar] [CrossRef]
- Shao, Z.; Yang, W.; Cong, Y.; Dong, H.; Tong, J.; Xiong, G. Investigation of the permeation behavior and stability of a Ba0.5Sr0.5Co0.8Fe0.2O3-δ oxygen membrane. Journal of Membrane Science 2000, 172, 177–188. [Google Scholar] [CrossRef]
- Interreg North-West Europe. RIVER - Non-Carbon River Boat Powered by Combustion Engines. Available online: https://vb.nweurope.eu/projects/project-search/river-non-carbon-river-boat-powered-by-combustion-engines/ (accessed on 30 March 2023).
- Interreg North-West Europe. Oxygen production on the CRT narrowboat in river. Available online: https://www.opteam-network.com/critt/river0220/ (accessed on 12 July 2023).
- Interreg North-West Europe. Installation and Integration of an Oxyfuel Combustion Engine System with CO2 Capture and Storage Facilities on a Ship. Available online: https://opteam-network.com/critt/river0920/ (accessed on 12 July 2023).
- Mobasheri, R.; Izza, N.; Aitouche, A.; Peng, J.; Bakir, B. Investigation of Oxyfuel Combustion on Engine Performance and Emissions in a DI Diesel HCCI Engine. 8th International Conference on Systems and Control, Marrakech, Morocco, 23-25 October 2019. [Google Scholar]
- Martin, J.; Arnau, F.; Piqueras, P.; Auñon, A. Development of an Integrated Virtual Engine Model to Simulate New Standard Testing Cycles. WCX World Congress Experience, Detroit, USA, 10-12 April 2018. [Google Scholar]
- Ditaranto, M.; Hals, J. Combustion instabilities in sudden expansion oxy–fuel flames. Combustion and Flame 2006, 146, 493–512. [Google Scholar] [CrossRef]
- Serrano, J. R.; Arnau, F. J.; García-Cuevas, L. M.; Farias, V. H. Oxy-fuel combustion feasibility of compression ignition engines using oxygen separation membranes for enabling carbon dioxide capture. Energy Conversion and Management 2021, 247. [Google Scholar] [CrossRef]
Figure 1.
Schematic representation of MIEC oxygen permeation [23].
Figure 1.
Schematic representation of MIEC oxygen permeation [23].
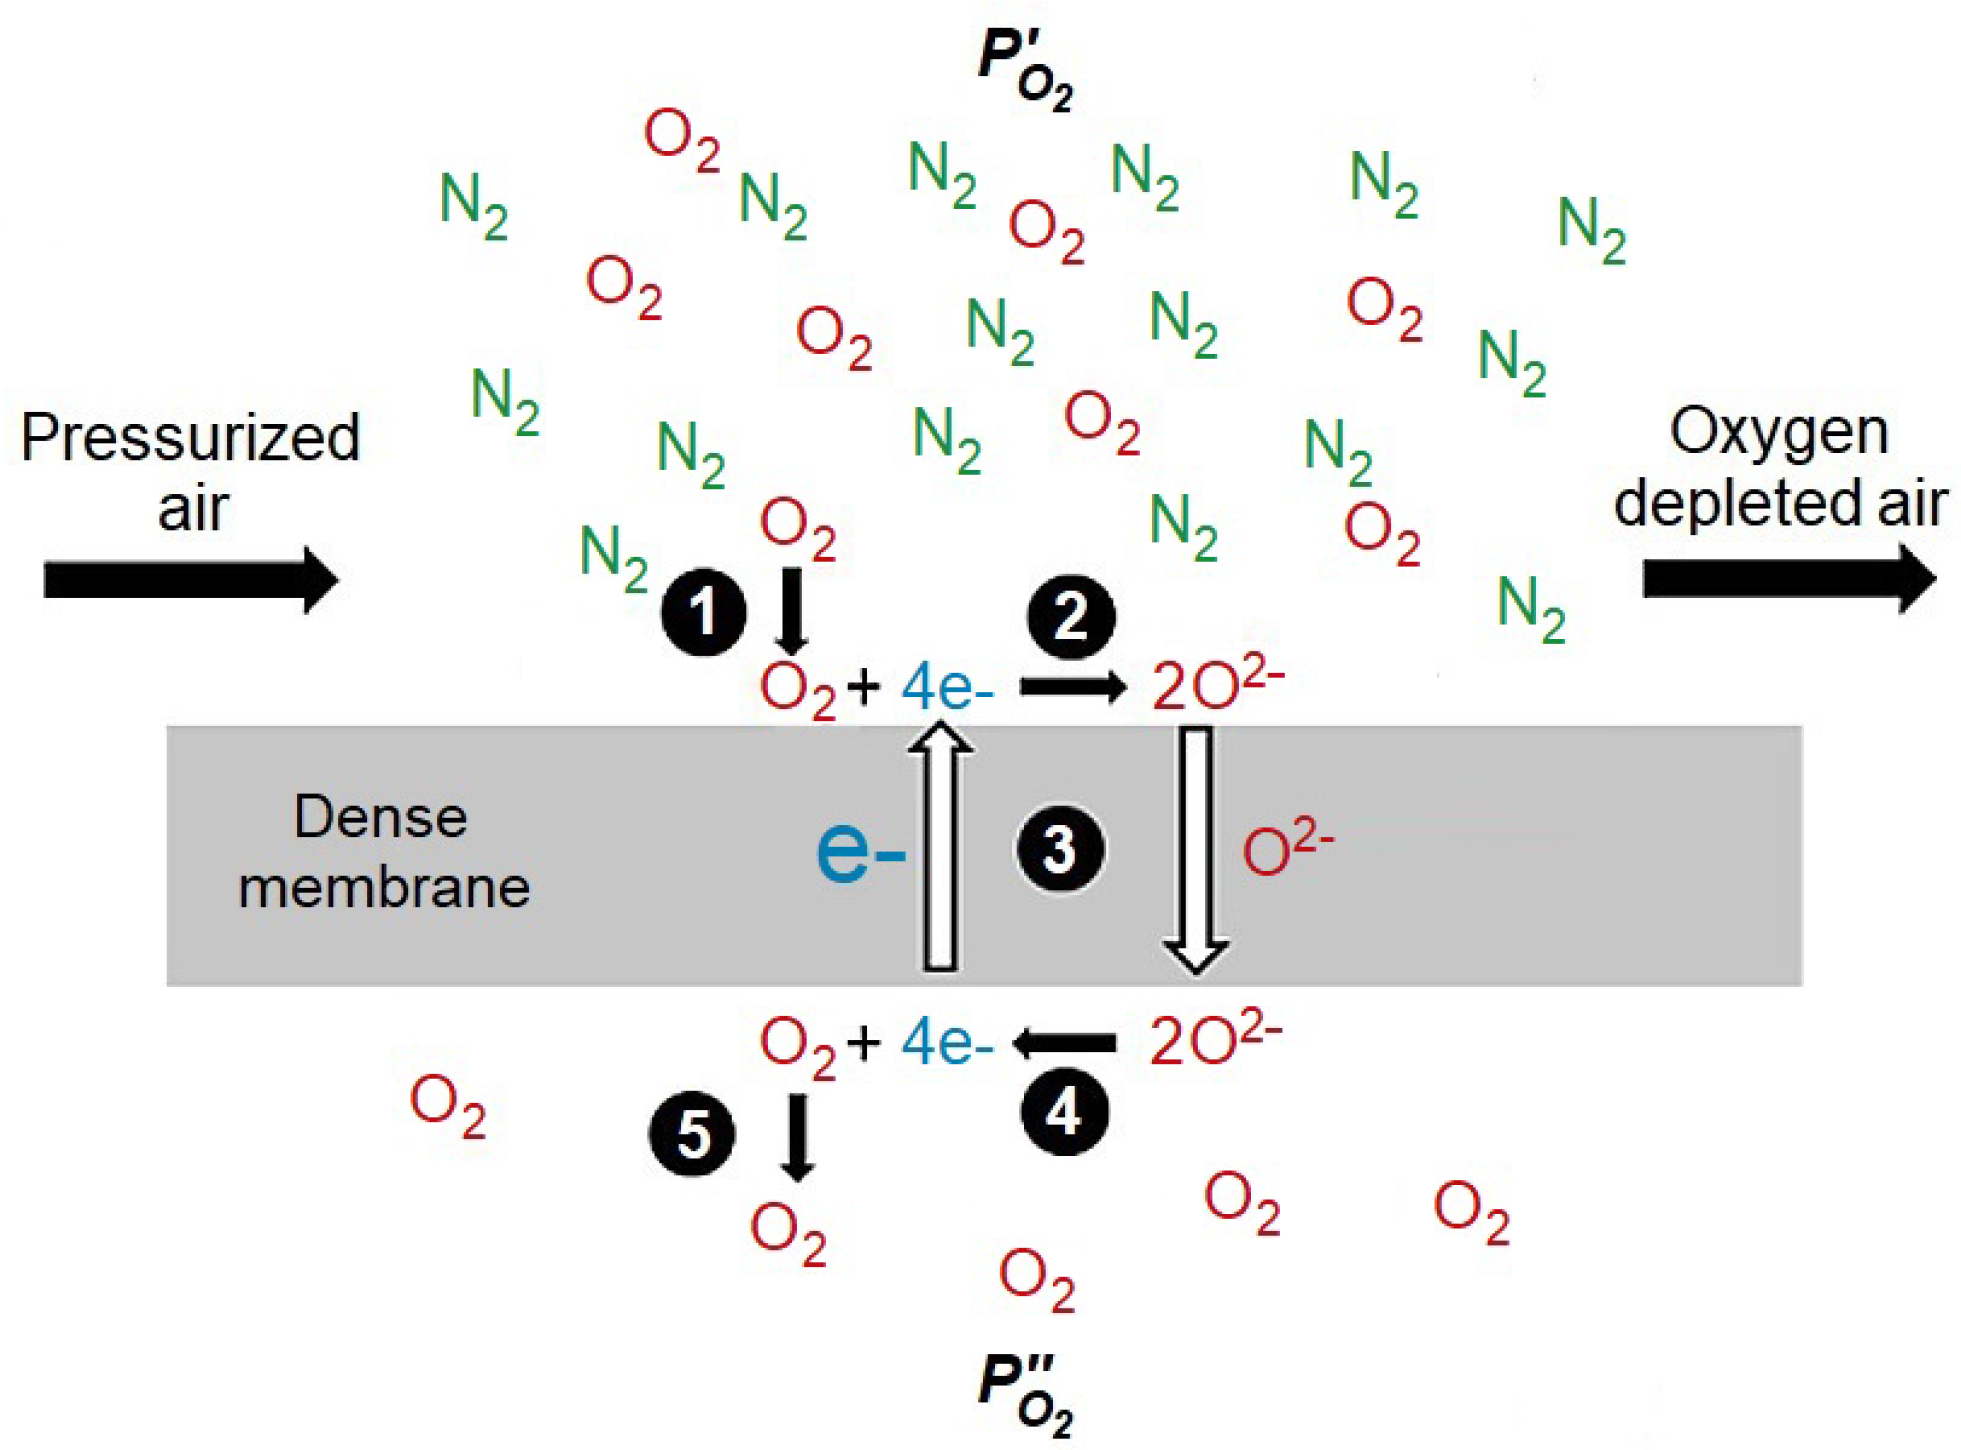
Figure 2.
Marine engine models: (a) Baseline model. (b) Oxy-fuel combustion model.
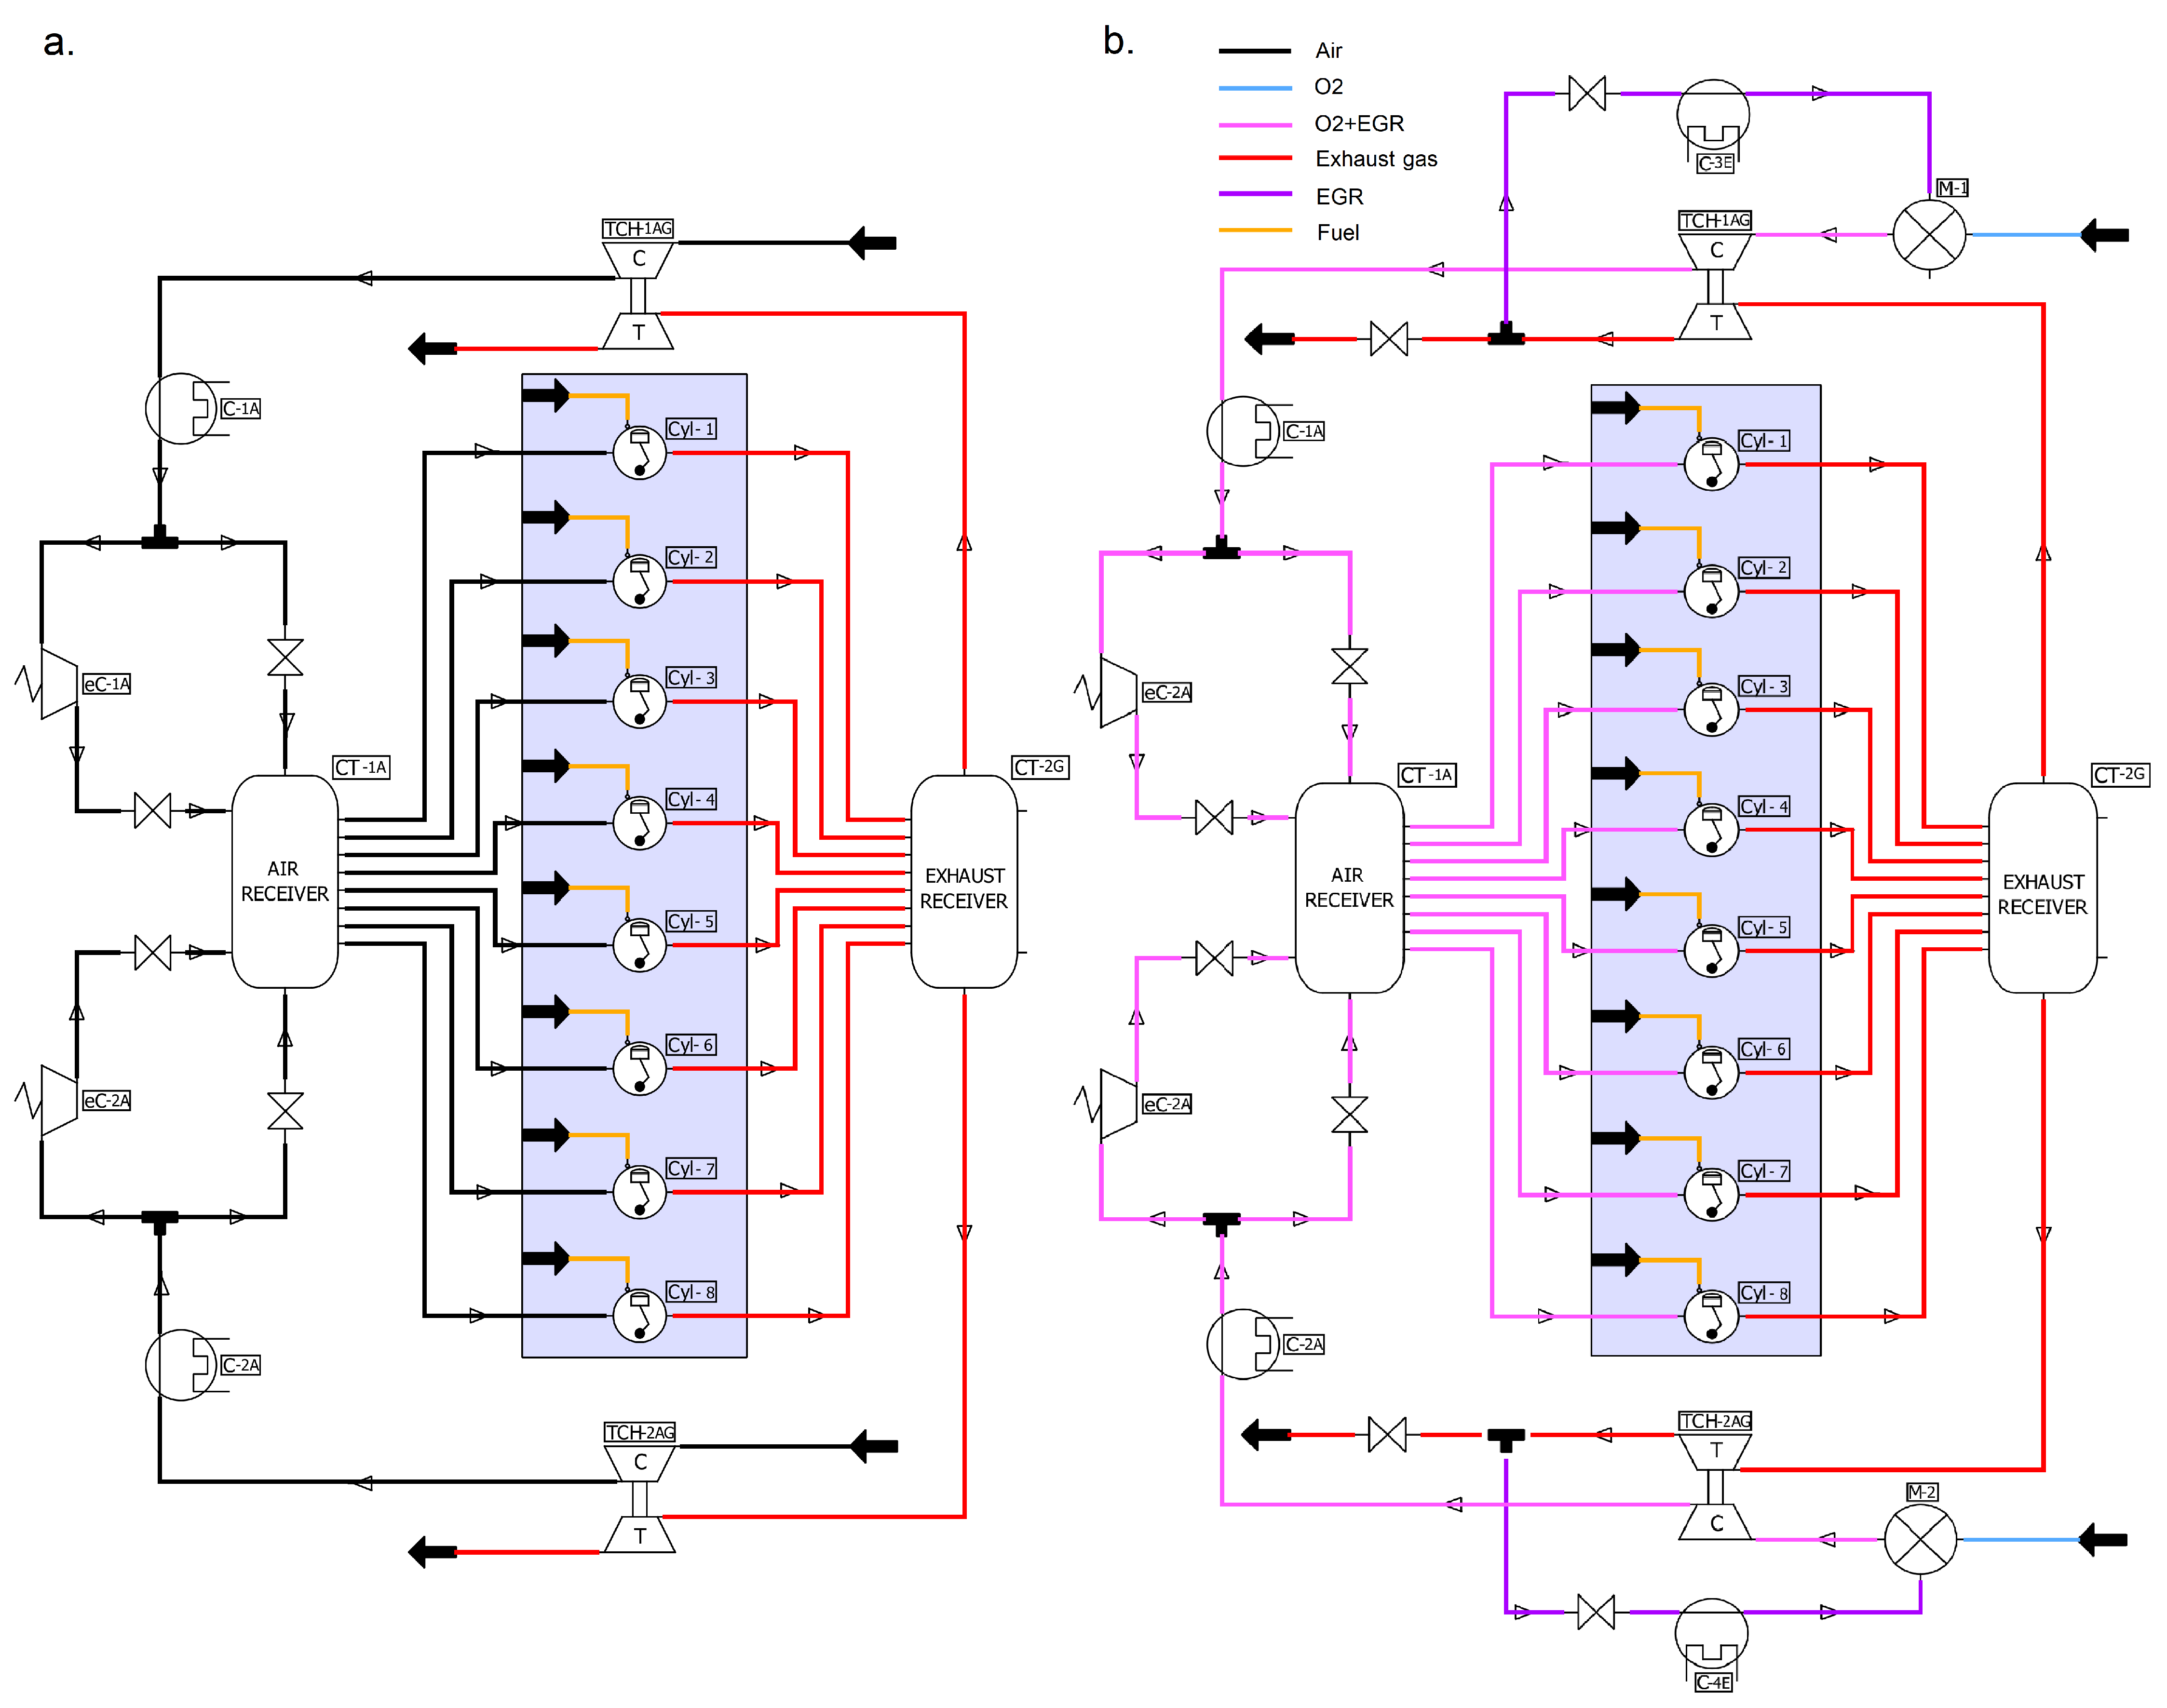
Figure 3.
Comparison between manufacturer’s reference model and VEMOD calibrated model: (a) Engine performance. (b) Turbine map. (c) Compressor map.
Figure 3.
Comparison between manufacturer’s reference model and VEMOD calibrated model: (a) Engine performance. (b) Turbine map. (c) Compressor map.
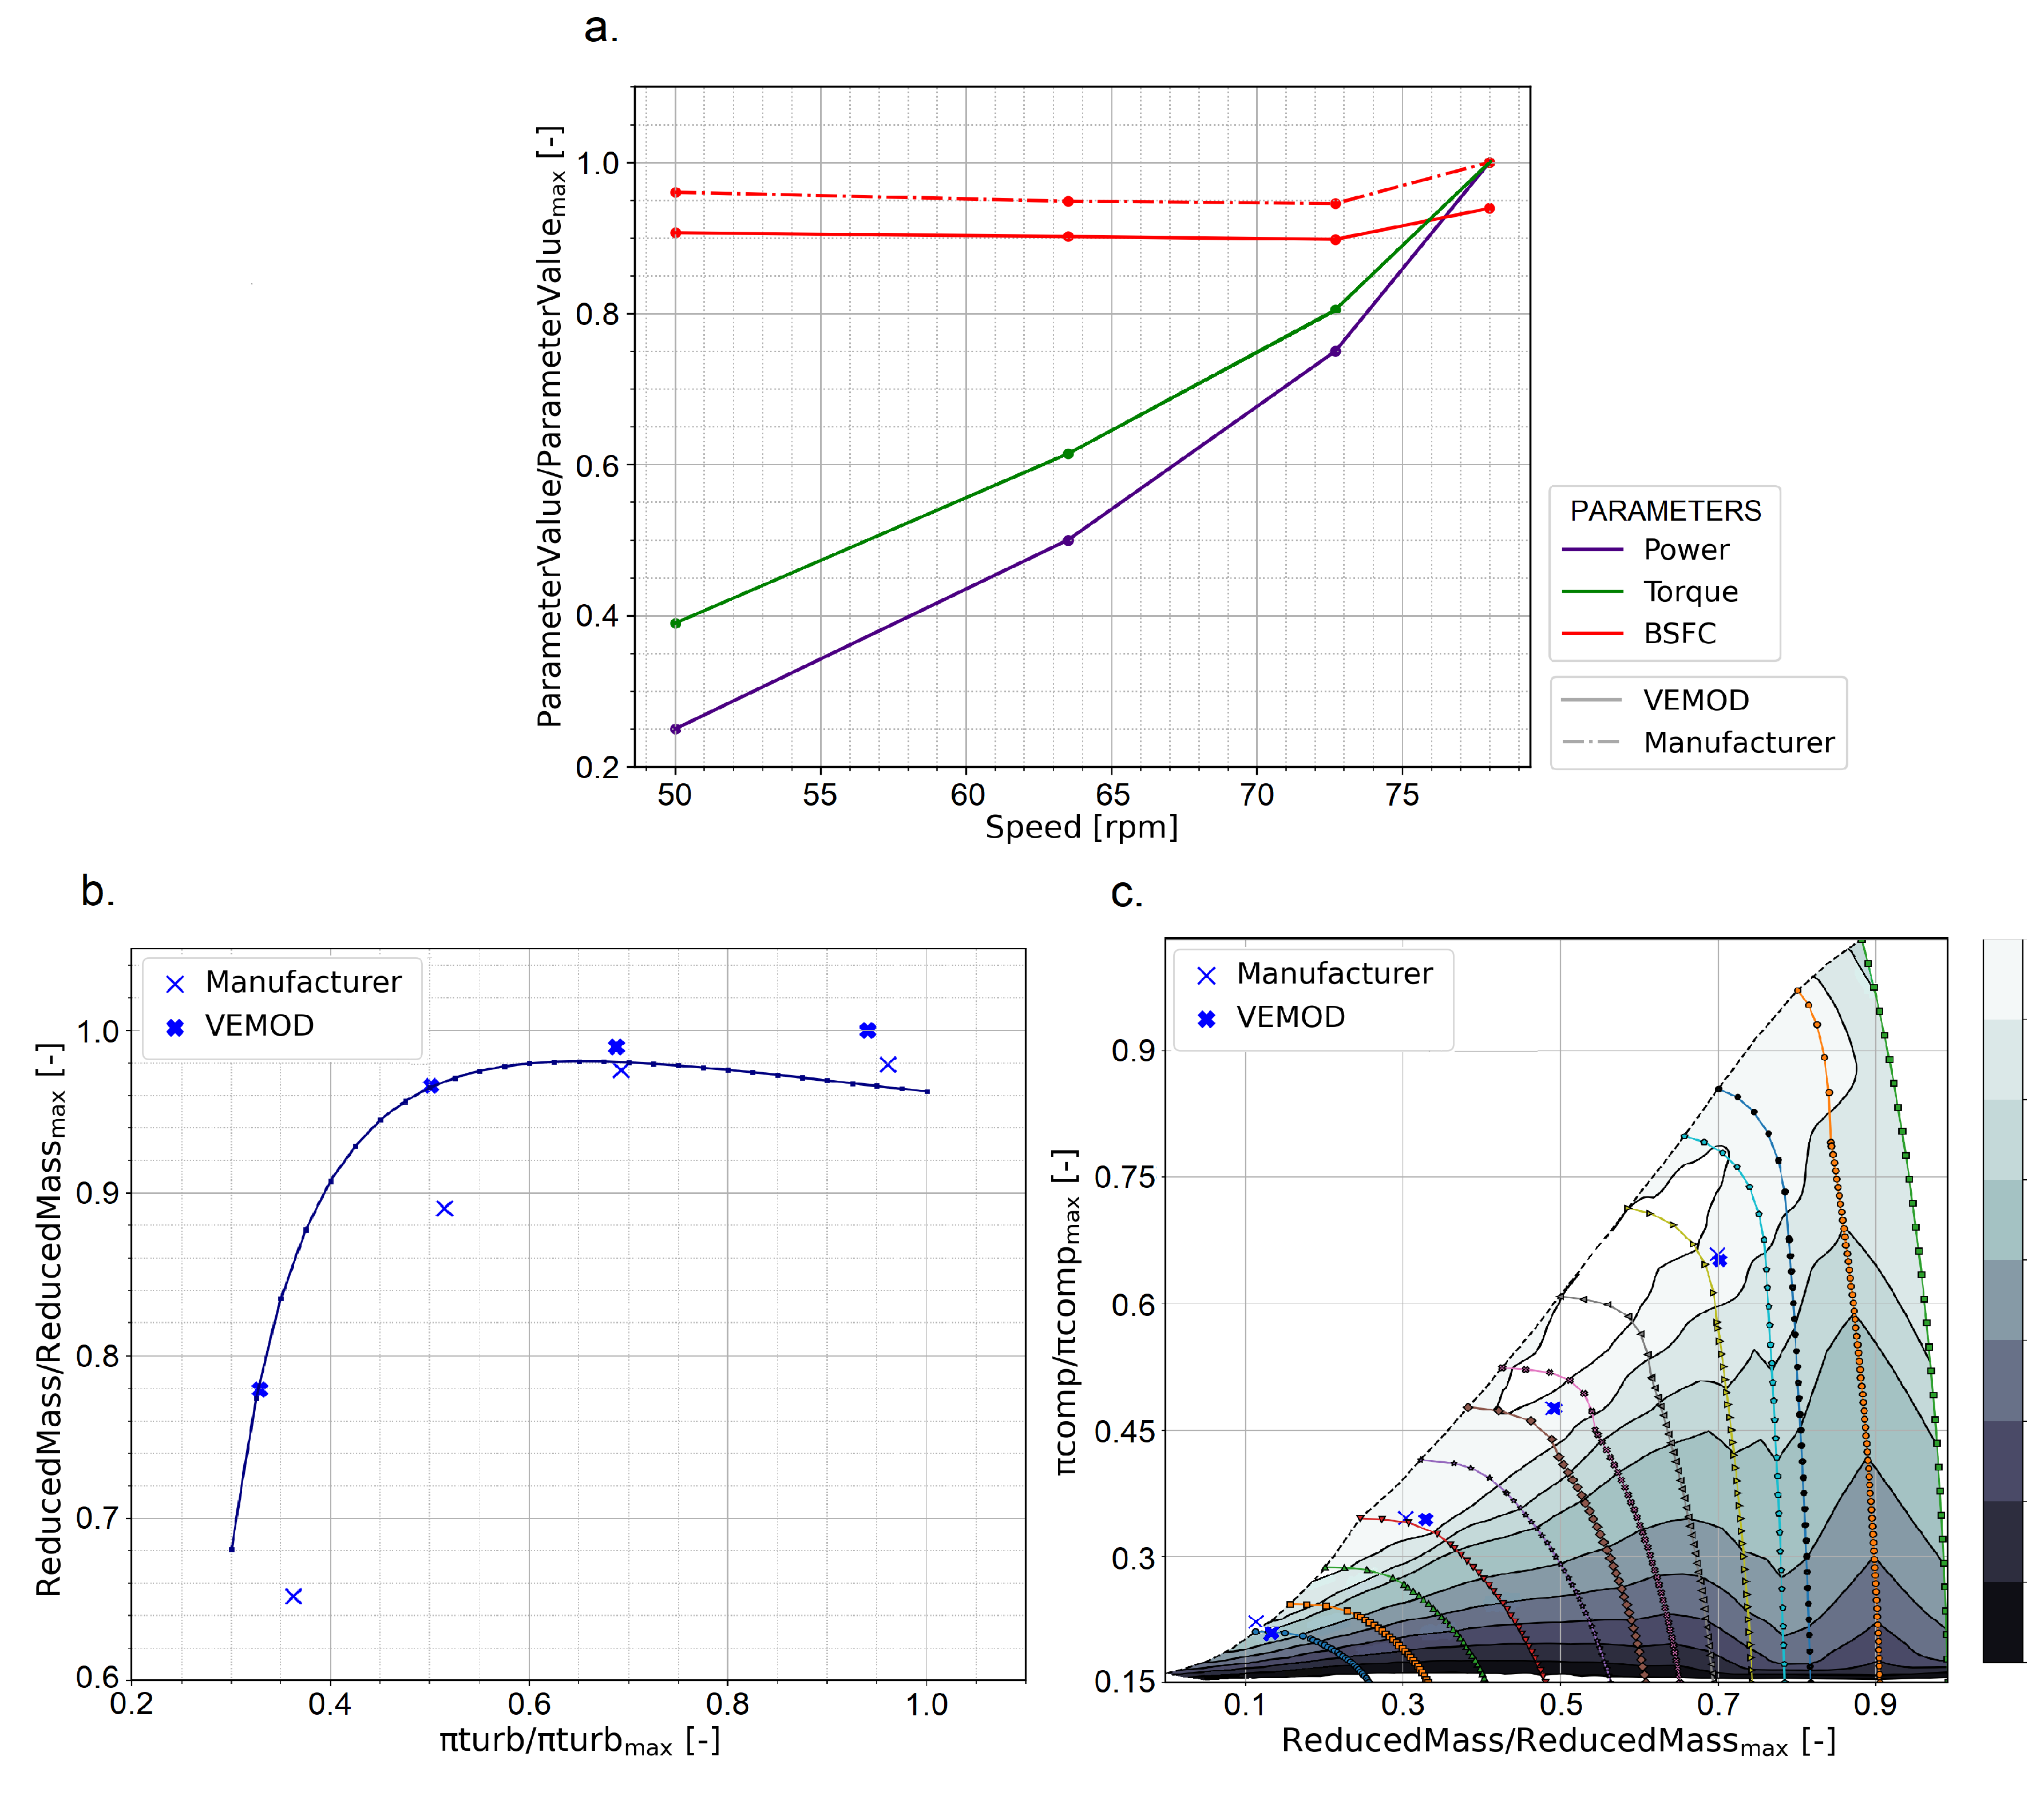
Figure 4.
O production system with parallel turbocharging system.

Figure 5.
O production system with serial turbocharging system.
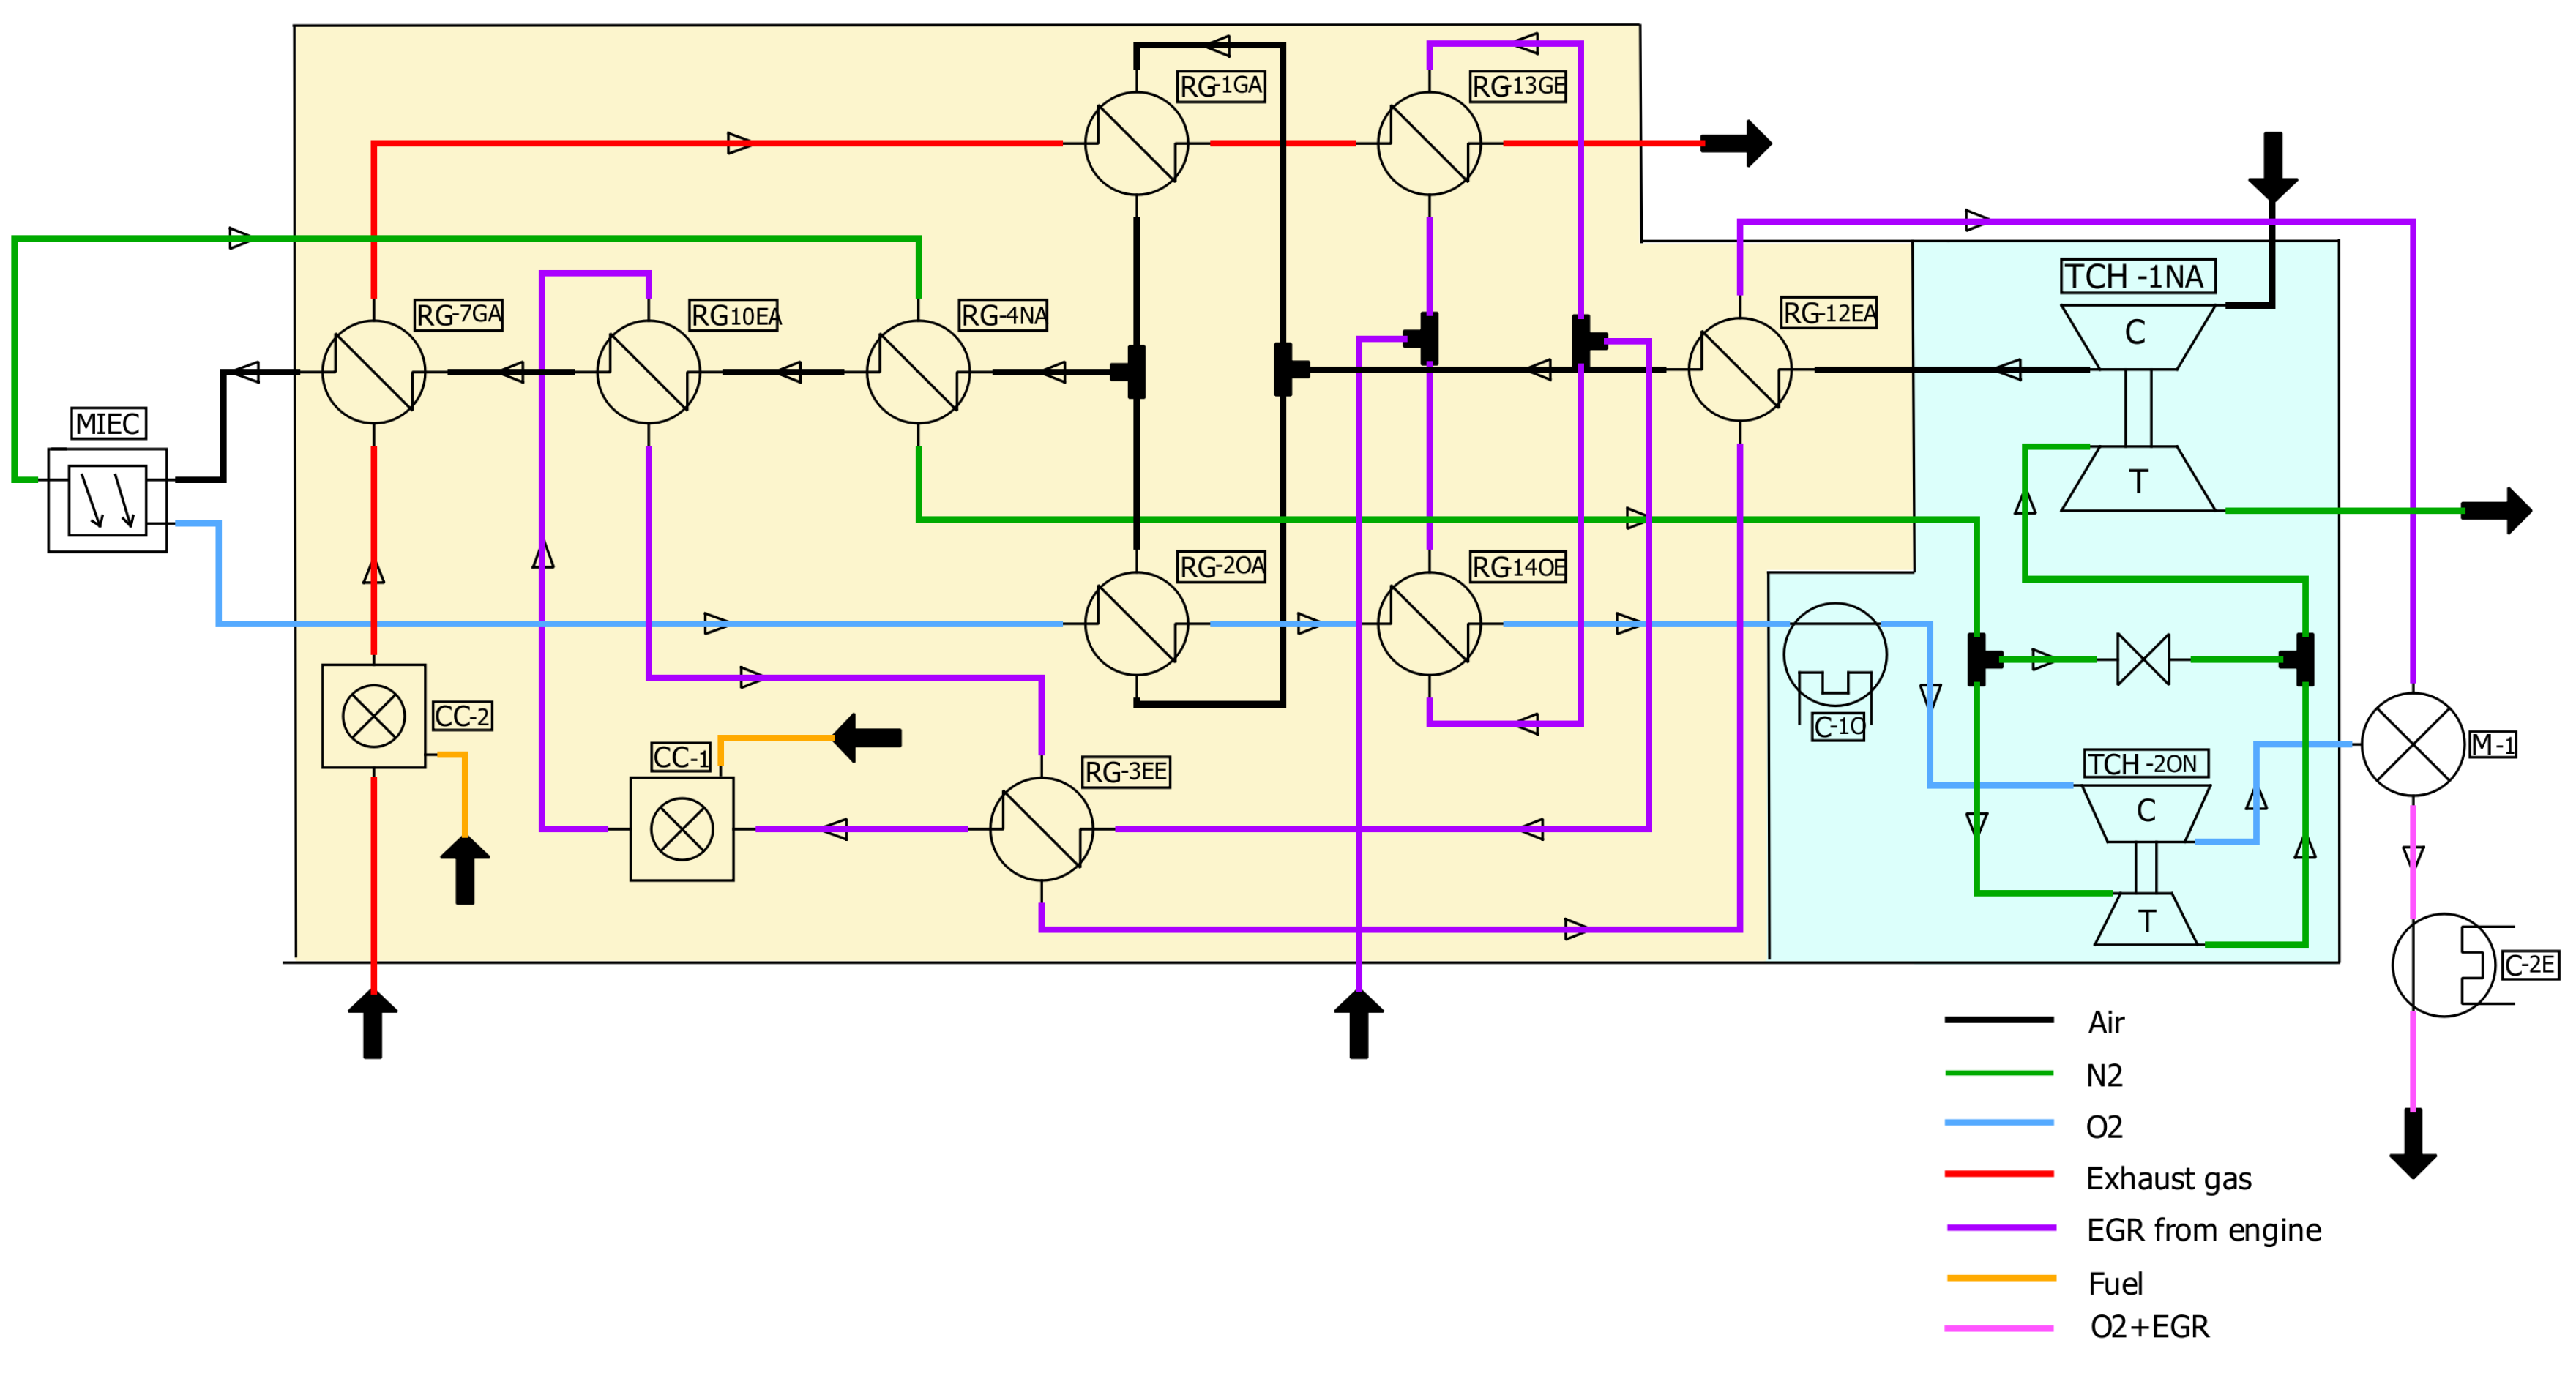
Figure 6.
O production system with two stages air compression system for all engine operating points.
Figure 6.
O production system with two stages air compression system for all engine operating points.
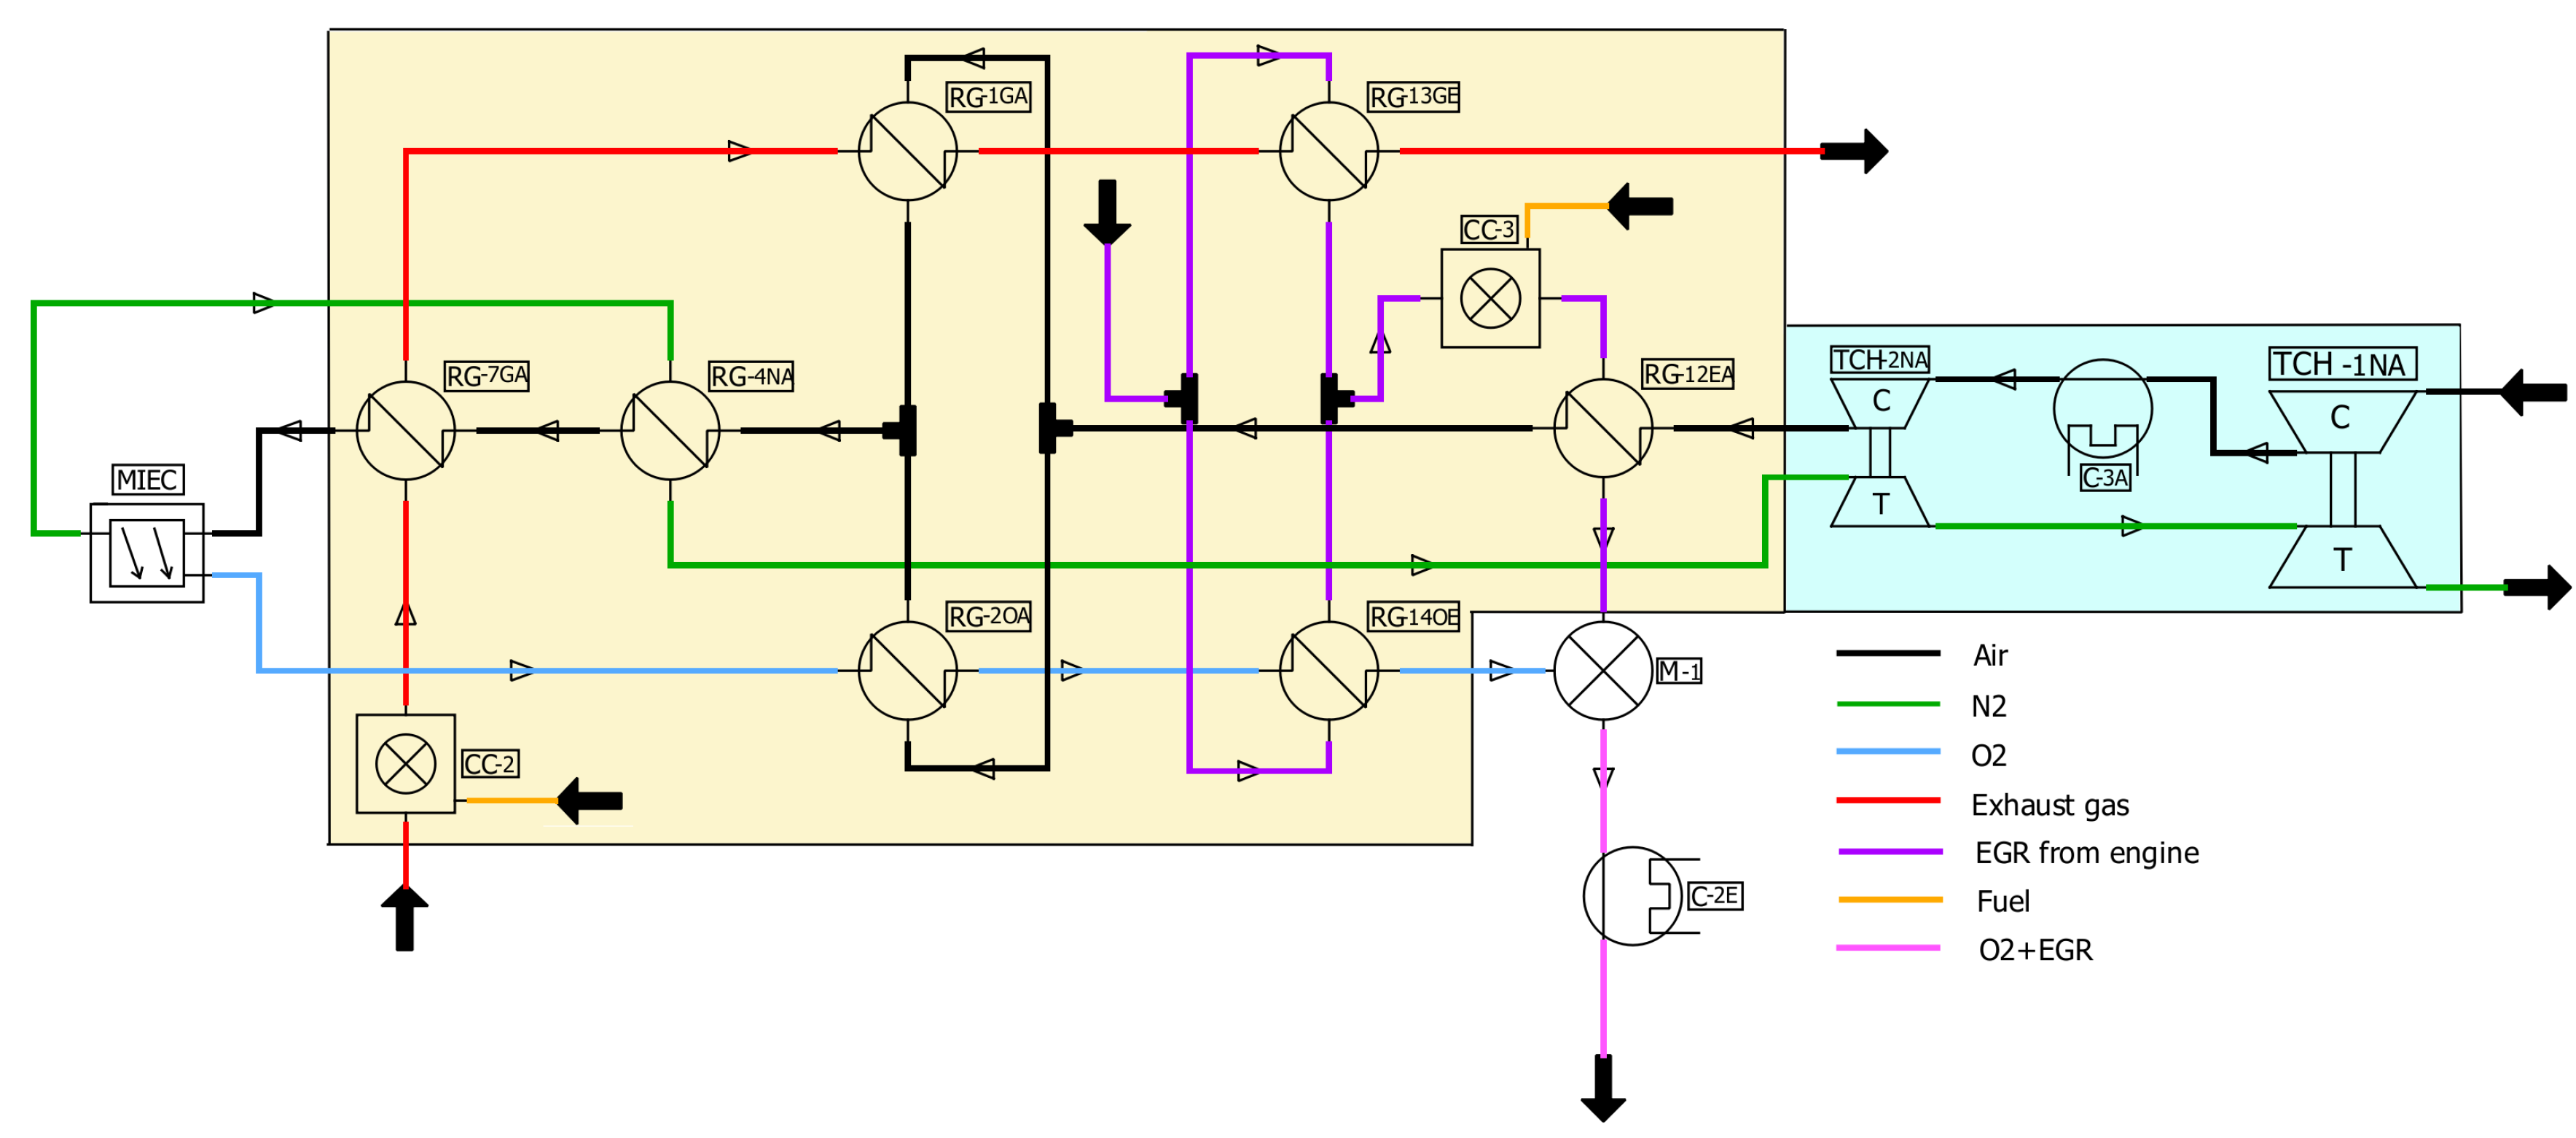
Figure 7.
In-cylinder thermodynamic behavior of engine in oxy-fuel combustion compared to conventional combustion at full load engine operating point.
Figure 7.
In-cylinder thermodynamic behavior of engine in oxy-fuel combustion compared to conventional combustion at full load engine operating point.
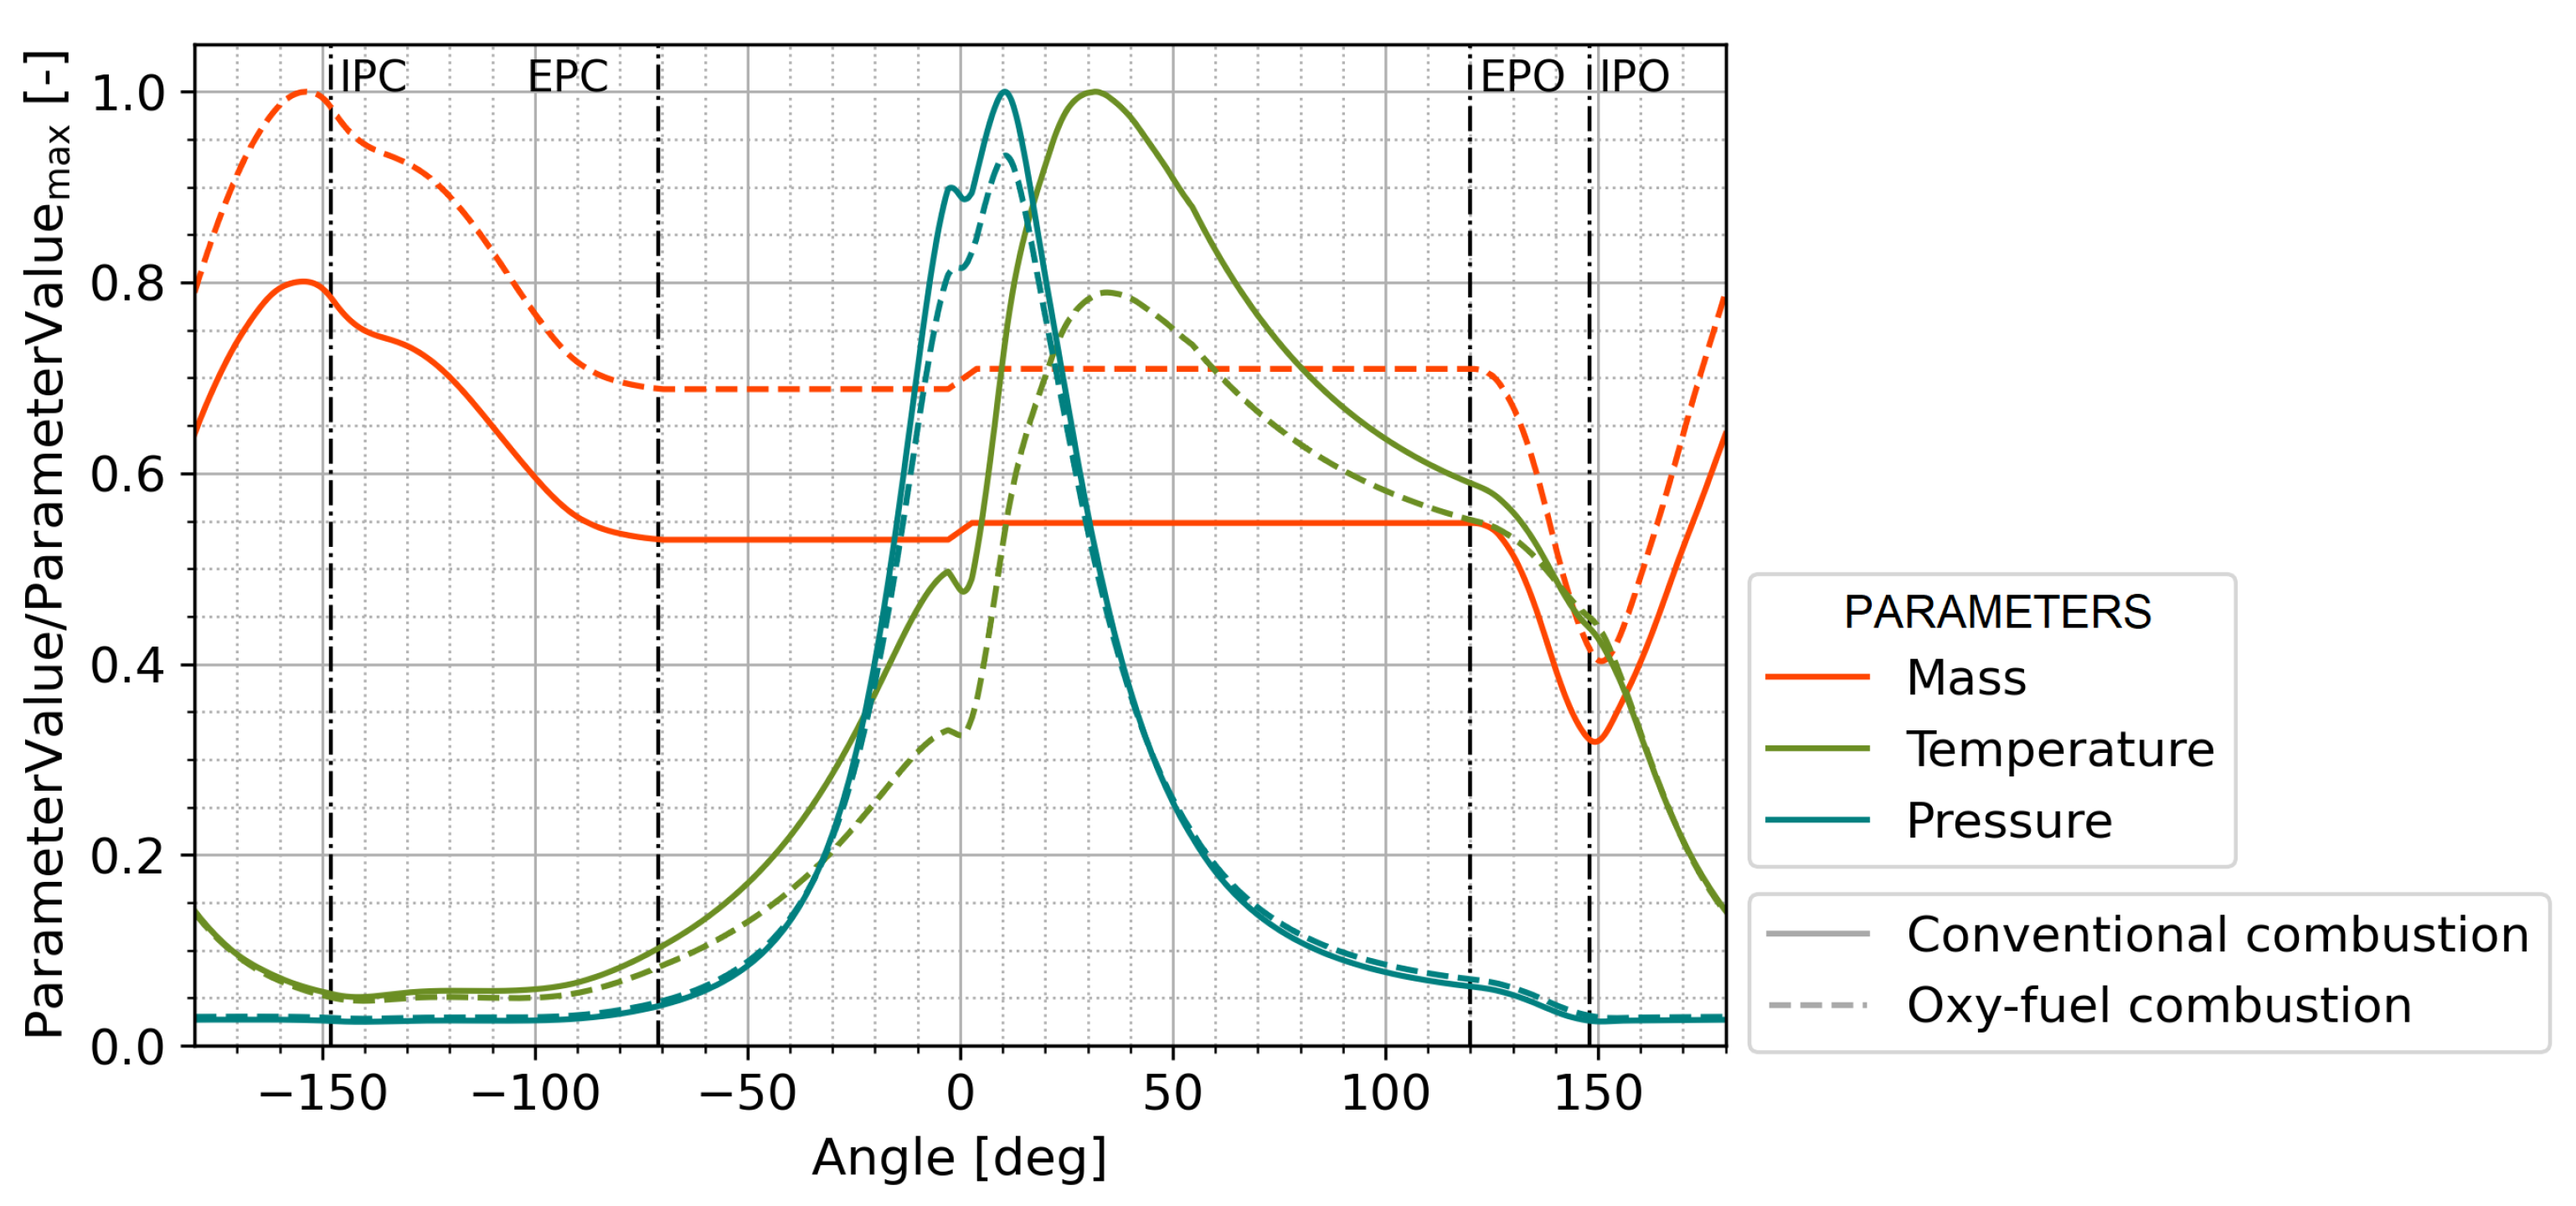
Figure 8.
Engine intake and exhaust gas behavior in oxy-fuel combustion compared to conventional combustion: (a) Intake. (b) Exhaust.
Figure 8.
Engine intake and exhaust gas behavior in oxy-fuel combustion compared to conventional combustion: (a) Intake. (b) Exhaust.
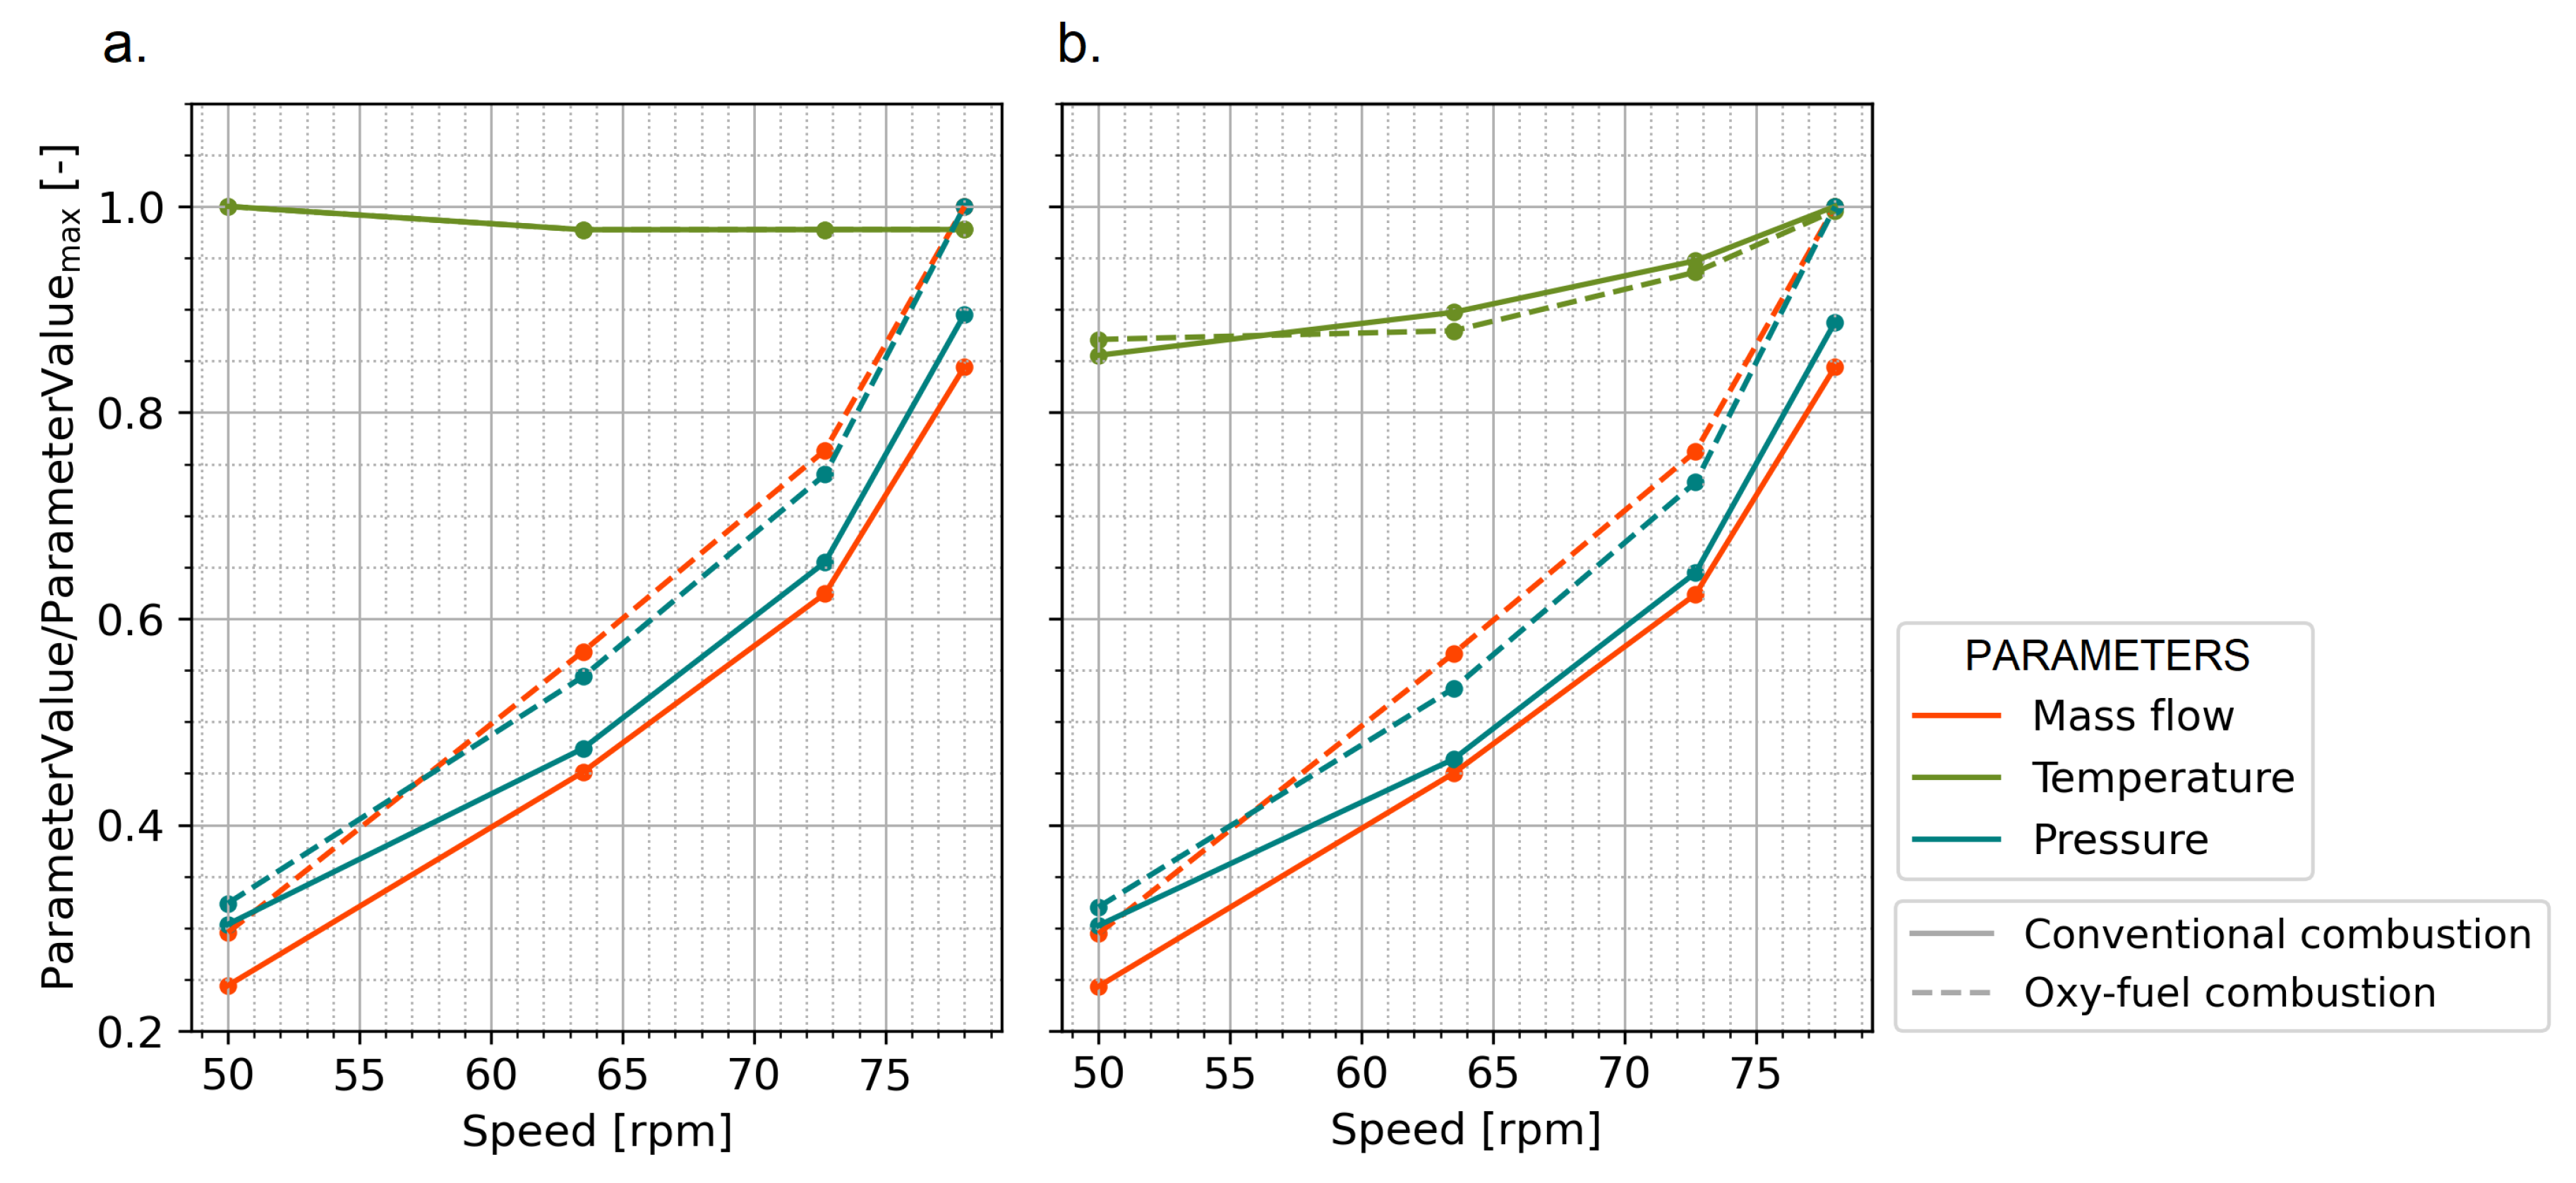
Figure 9.
Engine performance curves in oxy-fuel combustion compared to conventional combustion.
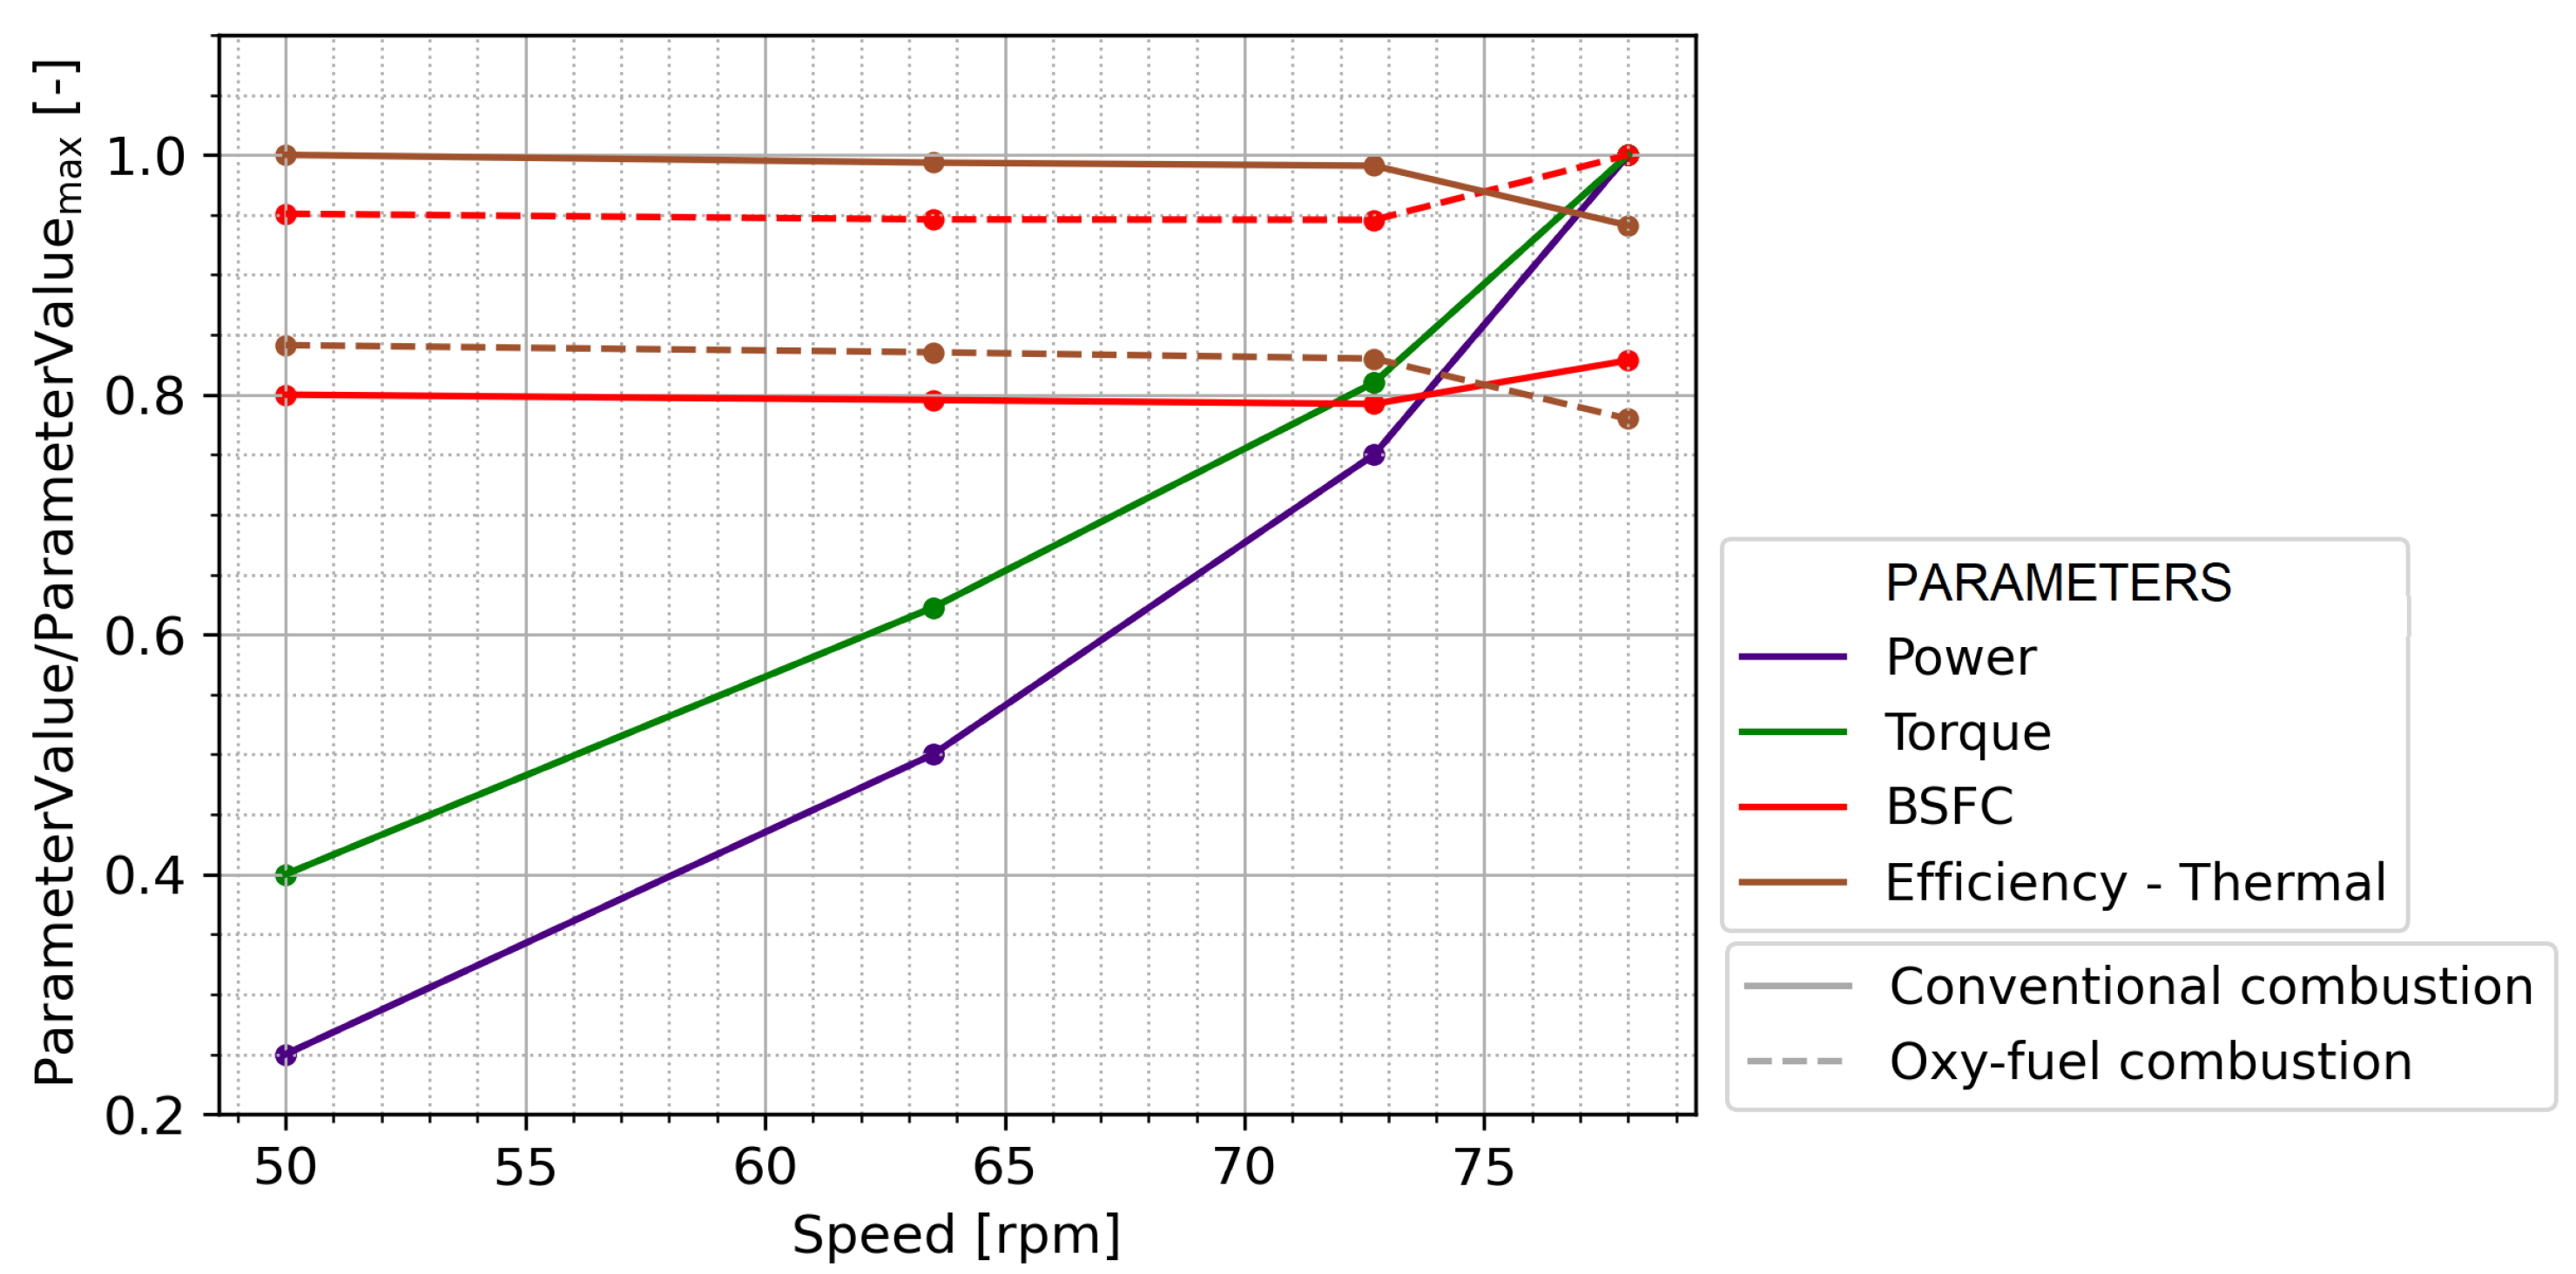
Figure 14.
Two-stage air compression configuration evaluated at all engine operating points: (a) MIEC operating conditions and burners fuel consumption. (b) Turbine map of TCH-1NA. (c) Compressor map of TCH-1NA. (d) Turbine map of TCH-2NA. (e) Compressor map of TCH-2NA.
Figure 14.
Two-stage air compression configuration evaluated at all engine operating points: (a) MIEC operating conditions and burners fuel consumption. (b) Turbine map of TCH-1NA. (c) Compressor map of TCH-1NA. (d) Turbine map of TCH-2NA. (e) Compressor map of TCH-2NA.

Figure 15.
Heat exchanged in the regenerators of the two stage air compression configuration, the bars are arranged following the heat transfer order of the flows: (a) For full load engine operating point. The color coding of the fluids is the same as in the O production system diagram of Figure 6. b) For all engine operating points.
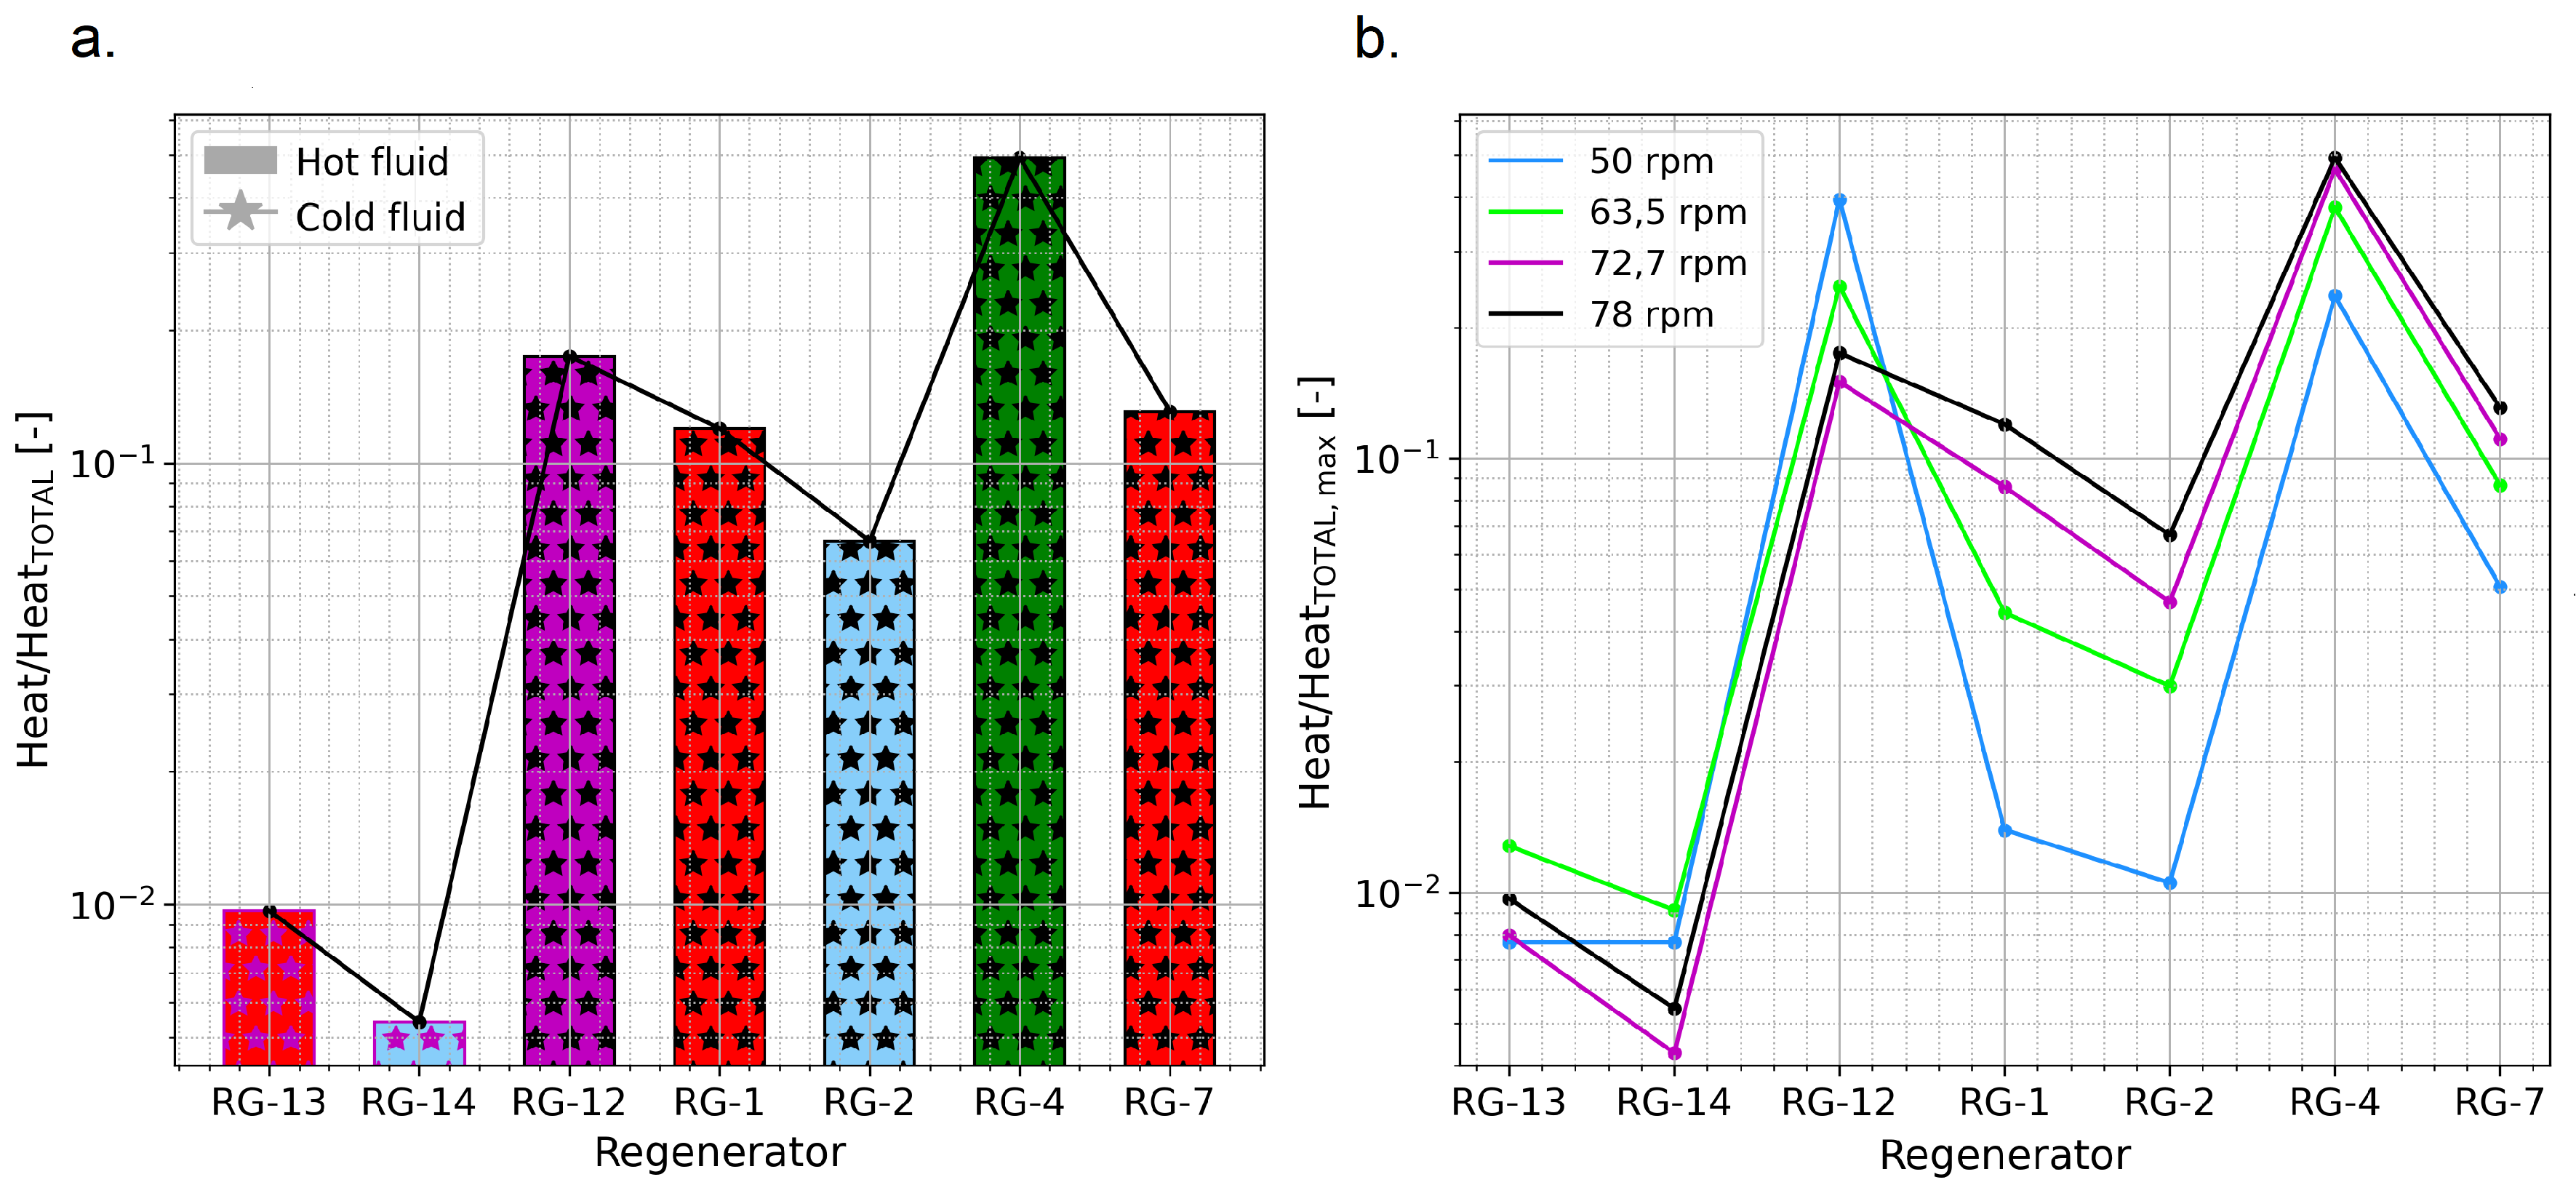
Figure 16.
Membrane area sweep of the two stage air compression configuration.
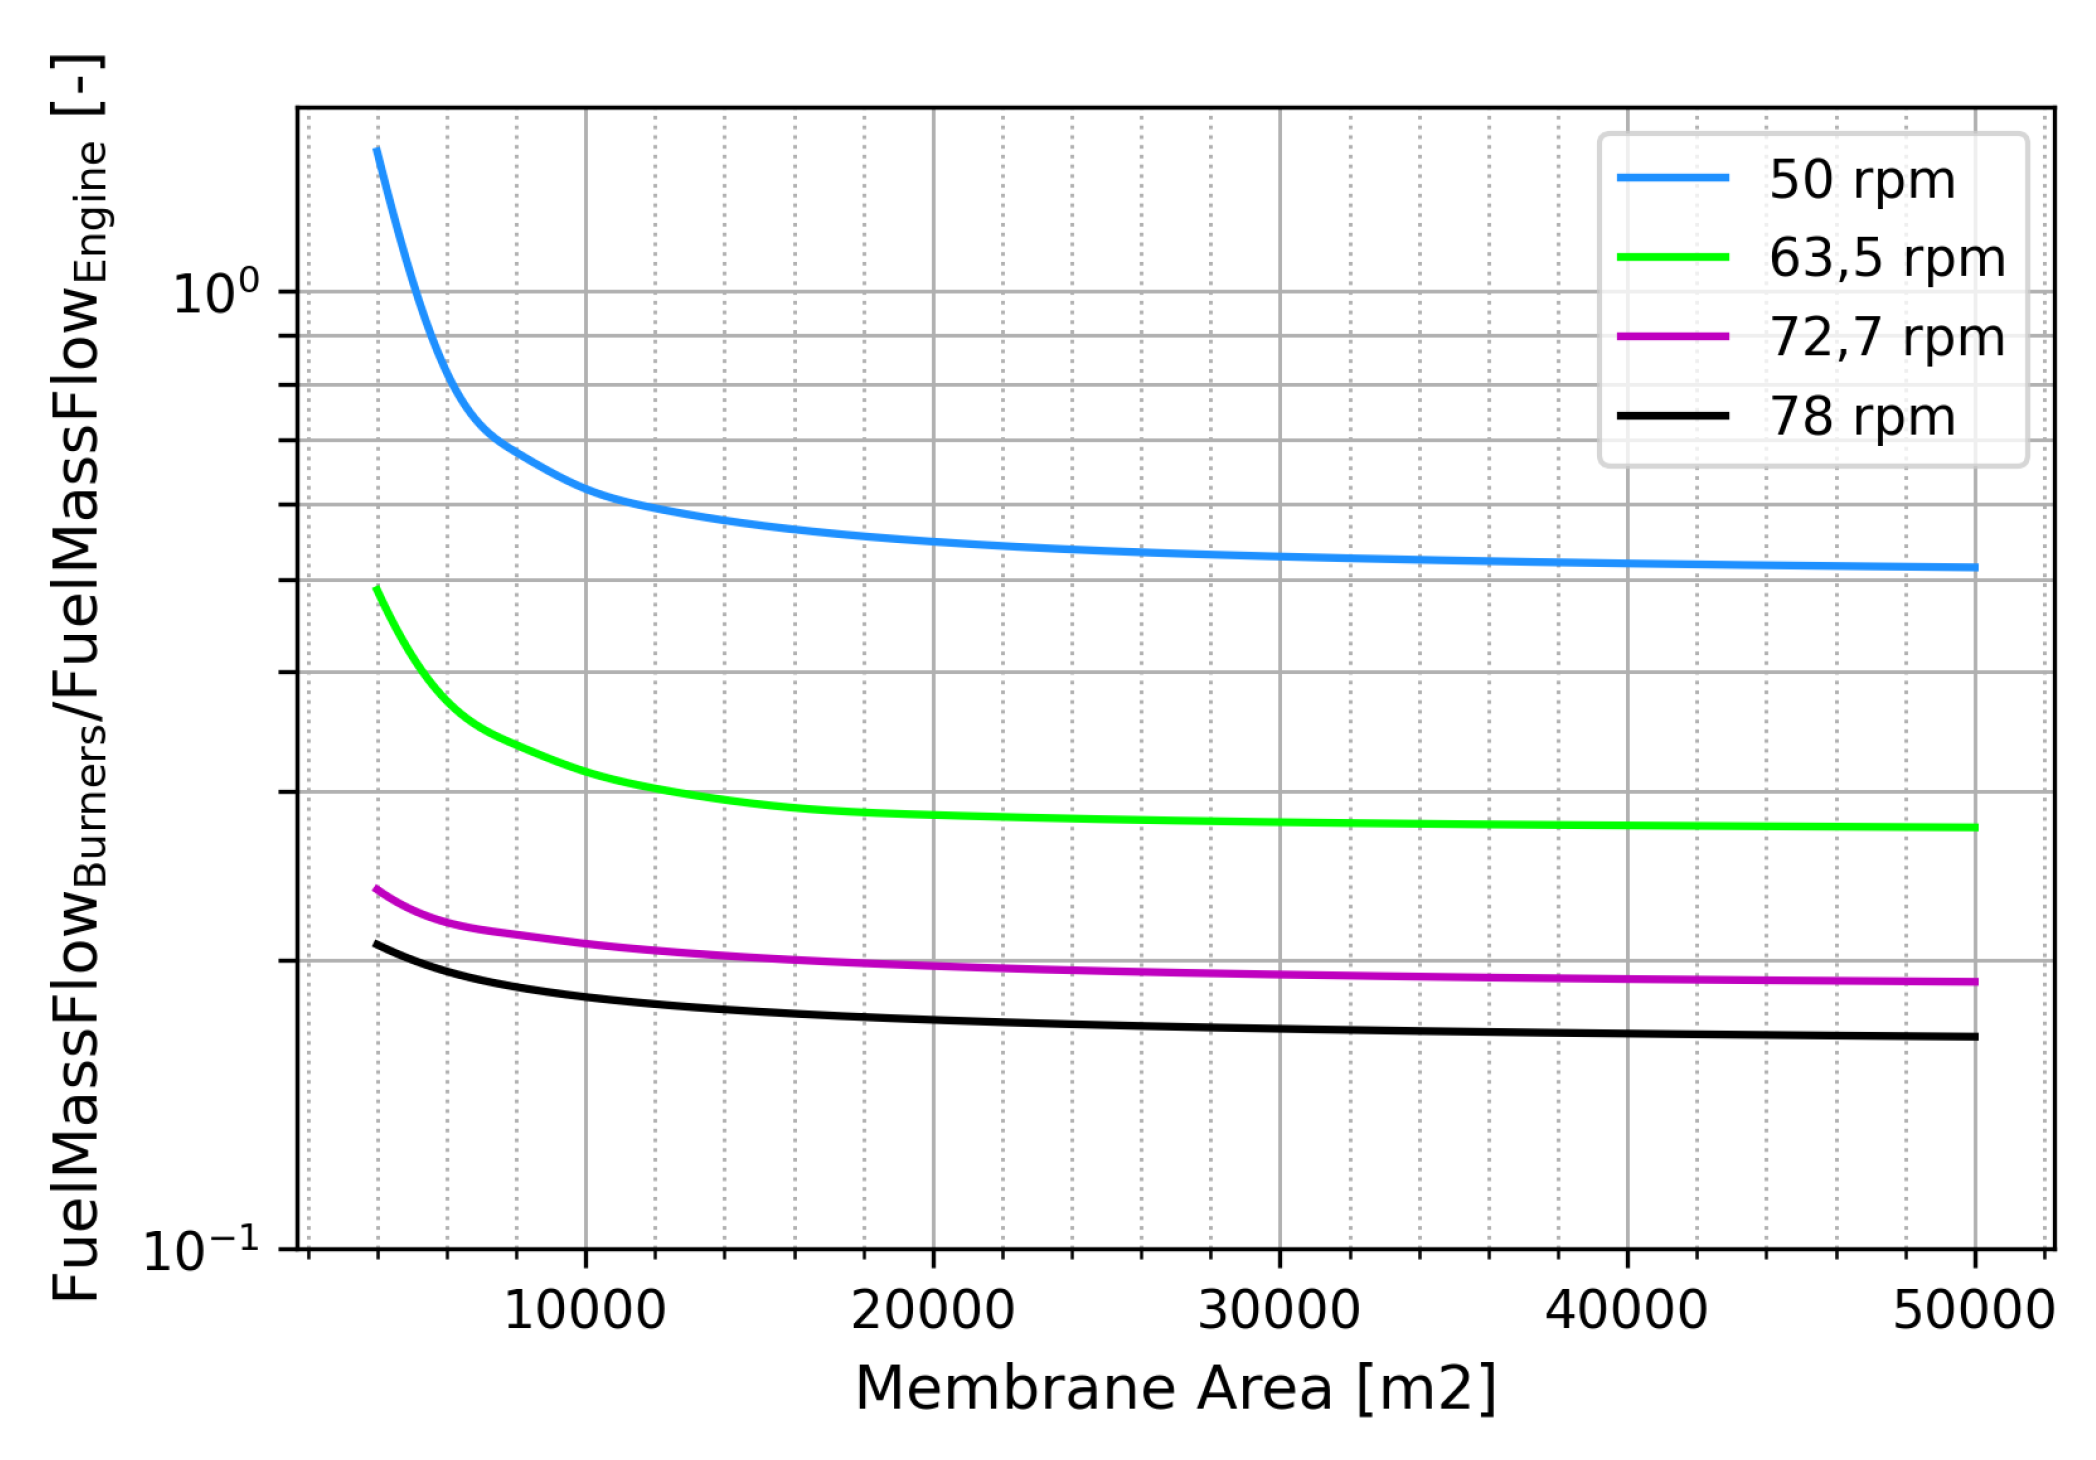
Figure 17.
Conclusive and complete schematic of the oxy-fuel marine engine showing the actual values from simulations at full load engine operating point (78 rpm): (Top) Temperature [ºC]. (Medium) Pressure [bar]. (Bottom) Mass flow [kg/s]. (Inside and bold) Power [MW].
Figure 17.
Conclusive and complete schematic of the oxy-fuel marine engine showing the actual values from simulations at full load engine operating point (78 rpm): (Top) Temperature [ºC]. (Medium) Pressure [bar]. (Bottom) Mass flow [kg/s]. (Inside and bold) Power [MW].
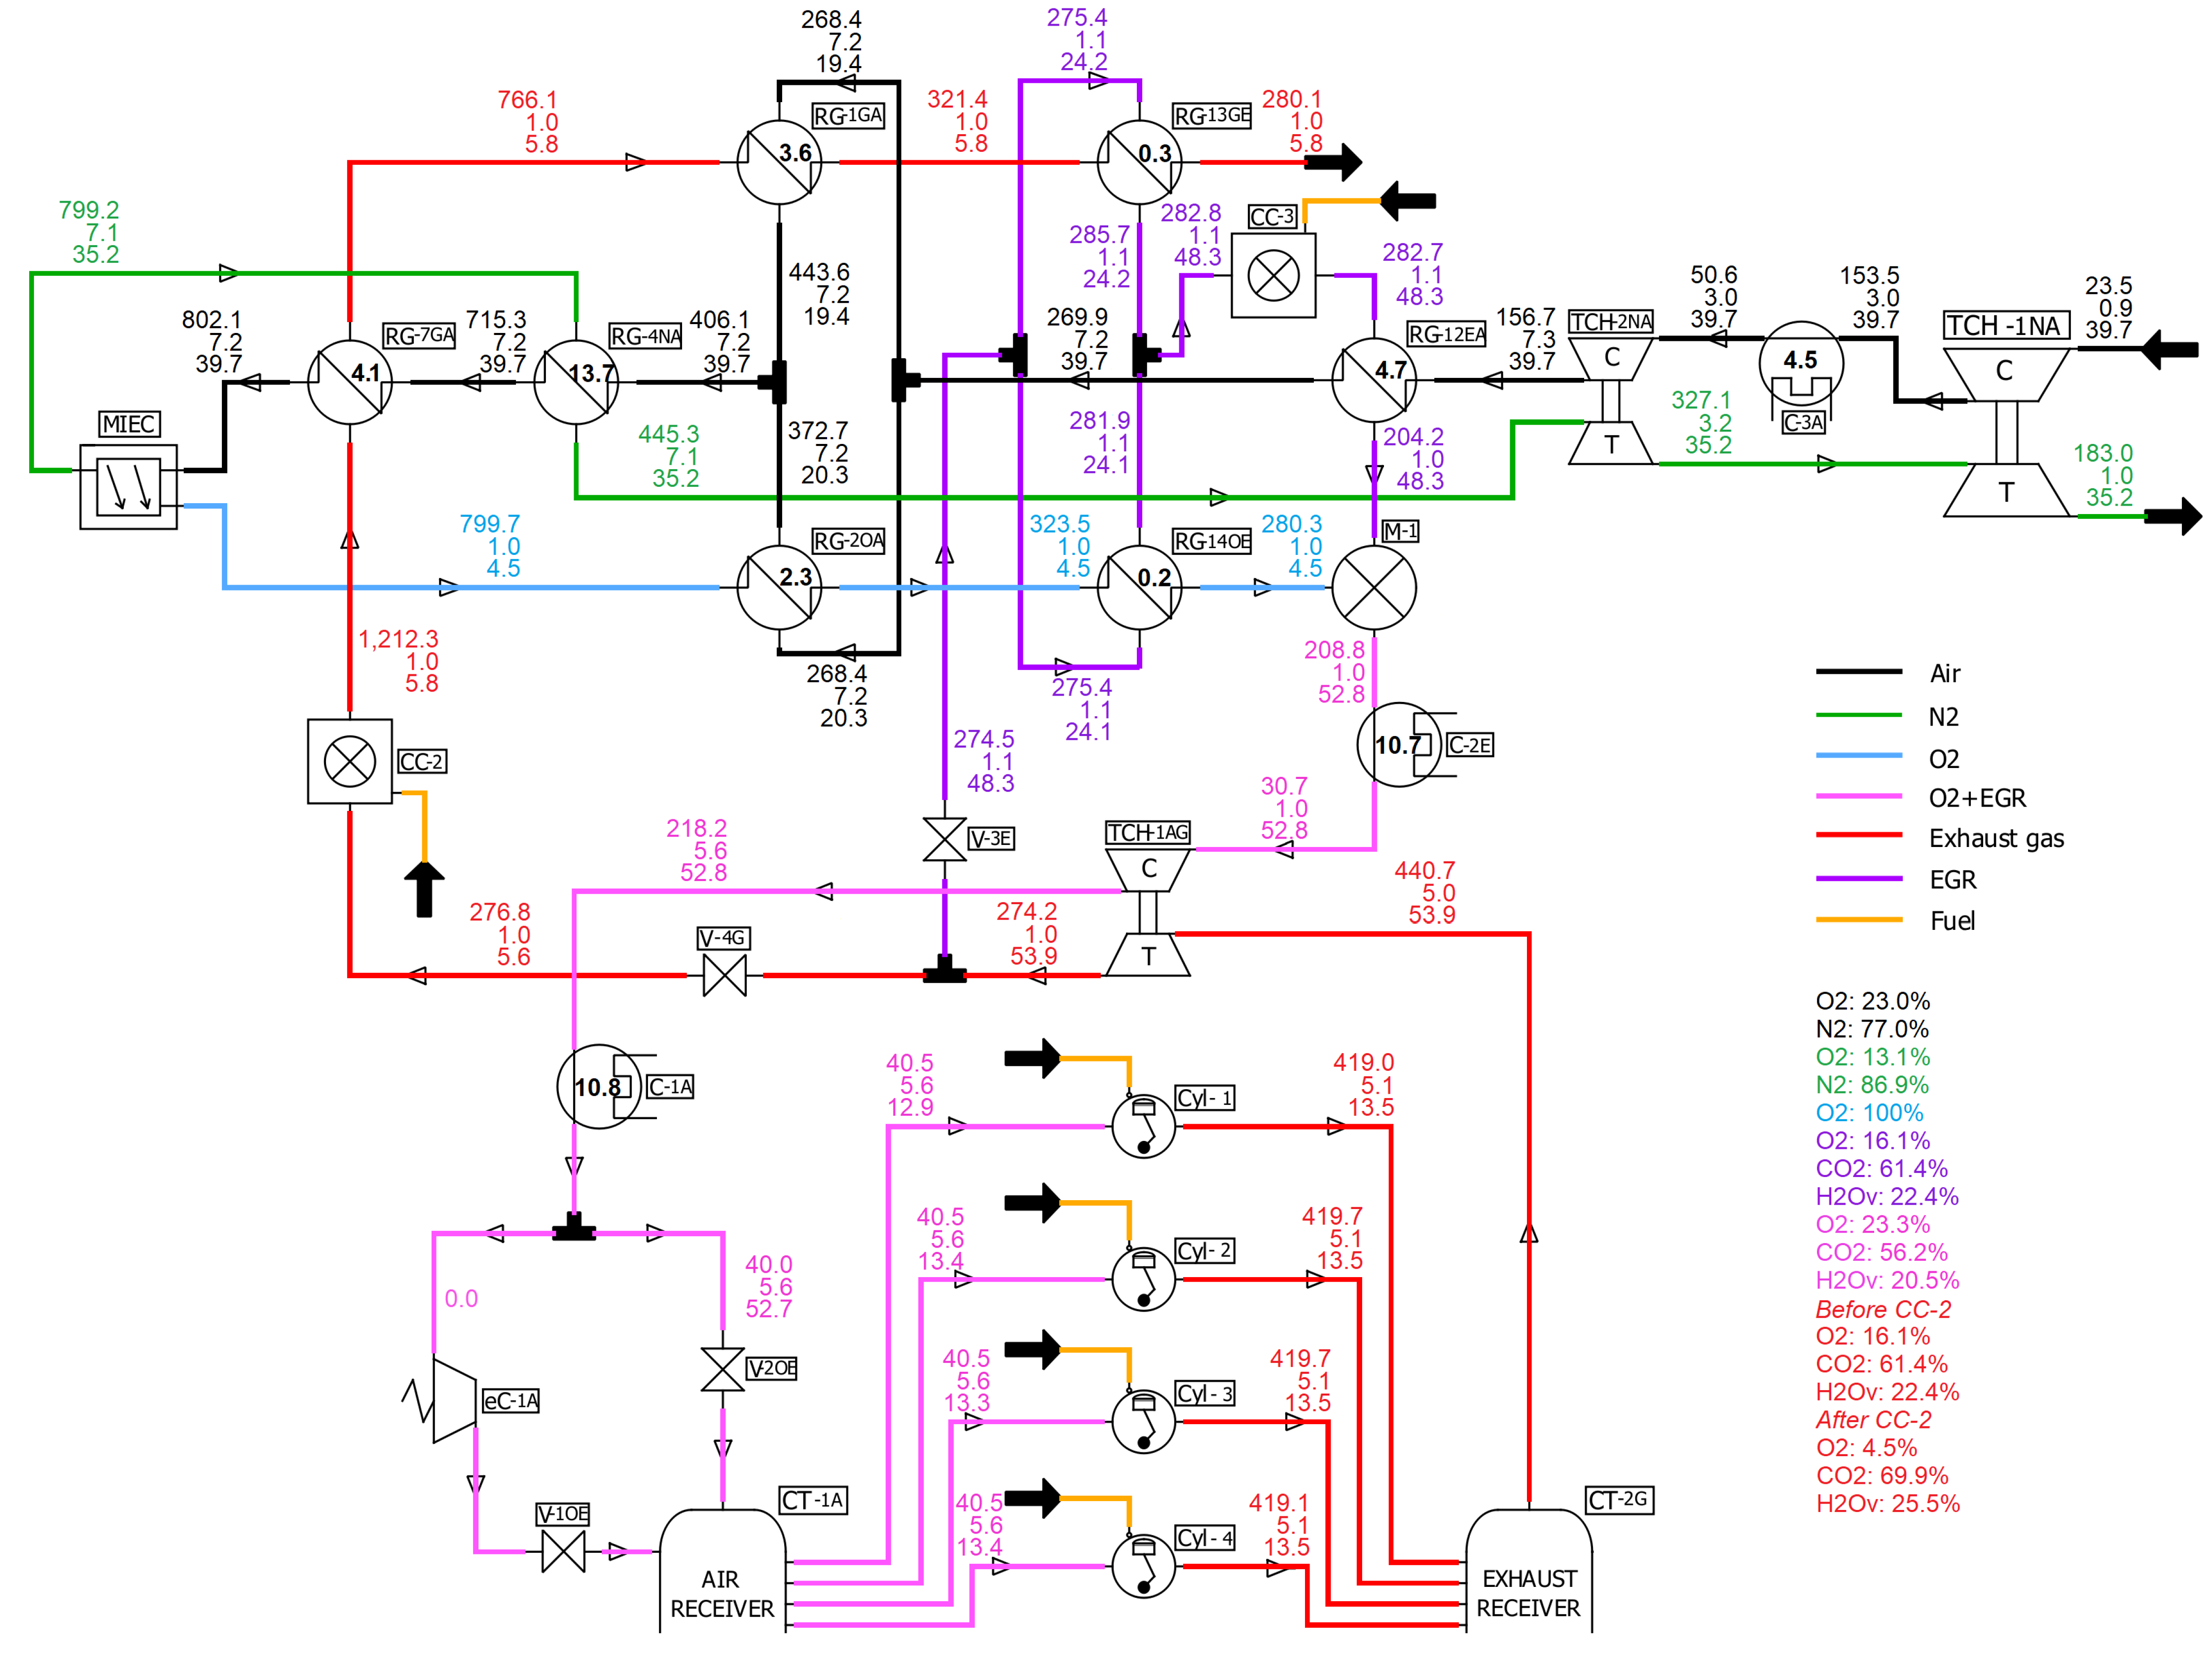

Table 1.
Total weighted cycle NO emission limit [g/kWh] for ship engines [3].
| TIER | CONSTRUCTION DATE | n < 130 | n = 130-1999 | n ≥ 2000 |
|---|---|---|---|---|
| I | 1 January 2000 | 17.0 | 9.8 | |
| II | 1 January 2011 | 14.4 | 7.7 | |
| III | 1 January 2016 | 3.4 | 2.0 |
Table 2.
Operating points of the studied marine engine.
| Engine speed [rpm] | Load [%] |
|---|---|
| 50 | 25 |
| 63.5 | 50 |
| 72.7 | 75 |
| 78 | 100 |
Table 3.
Summary of curve trends in Figure 10 as scale size factors of TCH-2NA turbine decrease.
Table 3.
Summary of curve trends in Figure 10 as scale size factors of TCH-2NA turbine decrease.
| ELEMENT | PARAMETER | PARALLEL | SERIAL | TWO STAGES |
|---|---|---|---|---|
| TCH-1 | All except | ↖ | ↙ | ↙ |
| Turbocharger | Temperature IN | |||
| TCH-2 | Corr. mass flow | ↙ | ↖ | ↙ |
| Compressor | Pressure ratio | ↙ | ↖ | ↖ |
| Power | ↙ | ↖ | ↖ | |
| TCH-2 | Corr. mass flow | ↙ | ↙ | ↙ |
| Turbine | Pressure ratio | ↖ | ↖ | ↖ |
| Pressure IN | ↖ | ↙ | ↖ | |
| Pressure OUT | = | ↙ | ↙ | |
| Temperature IN | ↙ | ↖ | ↖ | |
| Power | ↙ | ↖ | ↖ |
Disclaimer/Publisher’s Note: The statements, opinions and data contained in all publications are solely those of the individual author(s) and contributor(s) and not of MDPI and/or the editor(s). MDPI and/or the editor(s) disclaim responsibility for any injury to people or property resulting from any ideas, methods, instructions or products referred to in the content. |
© 2023 by the authors. Licensee MDPI, Basel, Switzerland. This article is an open access article distributed under the terms and conditions of the Creative Commons Attribution (CC BY) license (http://creativecommons.org/licenses/by/4.0/).
Copyright: This open access article is published under a Creative Commons CC BY 4.0 license, which permit the free download, distribution, and reuse, provided that the author and preprint are cited in any reuse.


