Submitted:
07 August 2023
Posted:
08 August 2023
Read the latest preprint version here
Abstract
Present work investigates, in photon energy domains of specific interest for medical imaging, the effect of the escape of X-ray fluorescence from the scintillator materials on the energy resolution of scintillation detector itself. Monolithic as well as pixelated crystals differently sized are considered, in the case of the NaI because it is the gold standard in the field. The volumetric ratio is introduced, as a figure of merit, taking into account, alongside the surface-to-volume ratio, the geometric shape, the elemental composition and also the mean-free-path for the given scintillator and energy. The inter-crystal XRF escape is finally suggested to be considered among the effects producing image blurring in segmented scintillatros due to the spread of events between the primary pixel and the first neighbors ones.
Keywords:
gamma-ray scintillation detector
; XRF escape
; SPECT
; PET
; charge spread spectroscopy
; inter-crystal scatter
; inter-crystal XRF escape
1. Introduction
Robert Hofstadter presented in 1948 the NaI:Tl, a scintillator showing the highest light-output up to this time by initiating the technique of pulse-height scintillation spectroscopy for gamma-rays [1]. A “clear” single-crystal, coupled to a Photo-Multiplier Tube (PMT), gave much higher signals with respect to plastic scintillators, that, in turn, were sometimes used in the early practice. Due to the large preponderance of scattering events, compared to photo-electric ones, a pulse-height spectrum from plastics did not show a real photo-peak, rather a Compton continuum. Consequently the spectrum unfolding resulted in some laboriousness in order to obtain the energy value of primary gamma-rays.
Before 1948, gamma-ray spectroscopy was performed by using experimental methods related to the range of gamma-rays energy.
Above around 500 keV, the value of photon-energy needed to be inferred from the distribution of secondary electrons emitted by atoms during the process of internal conversion, where the energy of the excited nucleus is transferred to the secondary particle to be emitted.
In 1932, Taylor and Mott published their theory of internal conversion of gamma-rays on the atomic orbitals, predicting the dependence of the value of conversion coefficient on both energy and multipolarity of the incident gamma-radiation for different atomic shells [2].
Three years later, Jaeger and Hulme published their theory of internal conversion for gamma-rays above 1.022 MeV with production of pairs electron-positron for certain nuclei and found the dependence of the conversion coefficient on both energy and multipolarity of the radiation [3].
According to these theories an experimental technique was developed for charged particles detection, needing electrons focused by a transverse magnetic field and two Geiger-Müller counters operated in coincidence. The method showed the major limitations of accurate beam focusing which, in tour, needed huge-activity radio-isotopic source (up to 20 GBq) and, therefore, large and heavy shielding [4].
The Reviews of Modern Physics published from 1940 to 1958 five issues of the Tables of (the) Isotopes, under the supervision of G.T. Seaborg, collecting experimental quantities regarding both natural and artificial radio-isotopes [5,6,7,8,9]. After 1948 the amount of contents in the issues has undergone strong growth due to worldwide dissemination of low-cost and portable NaI:Tl instrumentations, well suitable for measurements of low-activity samples.
Edward U. Condon, editor of the last issue, in his preface wrote: “This table is the fifth in a series of compilations which have appeared at approximately equal time intervals whose increasing length supplies a beautiful example of the exponential way in which knowledge grows.” The trend has been reported in Figure 1.
This Introduction ends with an invitation to researchers in this field to investigate the real reasons why NaI still remains widely the most popular scintillator. This work attempts to provide some elements to approach these reasons.
2. Background
In principle, the process of X-ray escape does not occur in the case of a scintillation crystal with infinite size and with the gamma-ray source located inside it, because all the secondary radiation, resulting from the interactions, are absorbed in its volume. This contributes to collect the entire energy of the incoming event, provided that all the scintillation light-photons reach the photocathode (see Ref. [10], Chapter 10).
In real scale, certain cases, in which the atoms emitting the fluorescence X-rays are located in close proximity of an outermost wall of the scintillator, can not contribute to the total event-energy due to the escape of the X-ray itself.
Such events tend to form other peaks on the left of the full-energy one at distances equal to the X-ray energies, being these X-rays characteristic of the scintillator components.
In principle, multiple escape-peaks are created in the spectrum, depending on the number of components of the scintillator, and on the atomic shells (K, L, M, …) involved in the processes.
In practice, for a NaI crystal, it is enough to consider, with a good approximation, the emissions from the iodine because the energy of X-ray K-shell edge of sodium is around 1 keV only, against the 33 keV about of iodine (see Table 1). This, substantially, makes the sodium K-escape peak practically indistinguishable from the full-energy peak.
In general, for all the elements of the Table of Mendeleev, the atomic shells other than the K are characterized by both energies and intensities values strongly lower than the K one [11], which authorizes to disregard them.
The same occurs in the majority of cases for the doping elements added to the scintillator components for optimizing their light-yield.
Finally, since the standard deviation of the average X-ray energy of the K-shells of a given scintillator component is considerably small compared to the typical detector energy resolution, the energy-values of the single-shells of such a component can be replaced, in the calculation of the escape-peak position in the pulse-height spectrum by the respective mean values.
Summarizing, for NaI, the iodine component will produce a specific escape-peak, on the left of the full-energy one, shifted from the last by a quantity equal to the average energy of the K-shells.
Last, it could be helpful to remark that the energy values of K X-rays is strongly increasing with respect to the atomic number Z of the considered individual scintillator component [11]. So, for each component, the higher the value of Z, the larger the shift on the left of the escape-peak from the full-energy one.
Regarding the quantification of iodine X-ray escape from NaI, a former work deducing the correction-factor of the photo-peak area for this process was presented in 1954 by P.Axel [12]. The method supposed that iodine X-rays were only from photoelectric interactions (i.e. the origin from Compton-scattered photons was excluded) and it was based on solid-angle calculations for front or lateral positions of a point source with respect to a right-cylindrical scintillator. The importance of the correction was found dependent on the energy of the radiation, on the dimensions of the crystal, and on the experimental setup. The order of magnitude of the ratio escape-to-total was found in the range from around 0.4 to 0.01 for photon-energy ranging from 33 to 150 keV, respectively.
The same year an experimental work by W.E. Meyerhof and H.I. West jr. substantially confirmed the Axel’s results [13].
3. Materials & Methods
3.1. NaI composition and characteristic fluorescence X-rays
An evaluation of the impact of X-ray escape process on the energy resolution of a NaI scintillation detector is given in present work. For this purpose, we have considered the photon-energy range from 1 keV to 1 MeV, which includes the domain of interest for medical imaging with radionuclides.
The values of the Elemental Composition (ECmp) of the NaI scintillator as well as the fluorescence K-shell edge X-ray energy are reported in Table 1. The ECmp values have been calculated at the NIST 1 website [14], while the X-rays data are from [11].
The characteristic fluorescence X-rays values from the NaI scintillator components and for the two innermost atomic shells are listed by ascending energy in Table 2. The X-ray data have been rearranged from Ref. [11], and the calculated quantities are described in the respective column header. Intensity values have been estimated by using the approximation rules suggested in the same Ref. [11]. As it is well known, the intensity values are usually reported, shell by shell, relative to the most intense line for a given atomic shell. Lines whose energy values is below 1 keV have been omitted.
3.2. NaI Interaction data
The values of the interaction coefficients in the photon energy range from 1 keV to 1 MeV have been calculated at the NIST website by using the XCOM software and the Photon Cross Sections Database [14]. Results are shown in Figure 2.
The trend of the total linear interaction coefficient as a function of the photon energy μ(E), can be obtained, in the given photon-energy range, by summing the ones of the photoelectric and Compton curves because the other physical processes produce interactions above the threshold of 1.022 MeV. The coherent scatter, that by definition is a not energy-spending physical process, is non added because it does not bring to the excitation of scintillator atoms. This can be written in Eq.(1).
where: μ(E) represents the total linear interaction coefficient, while the τ(E) and σ(E) stay for the photoelectric and Compton ones, respectively.
μ(E) = τ(E) + σ(E)
By using the μ(E) data, expressed in cm-1 with the density value of NaI of 3.67 g/cm3 (Ref. [10], p.235), the corresponding value λ(E) of the Mean Free Path (MFP(E)) at the given photon energy, expressed in cm, can be obtained from Eq.(2) (Ref. [10], p.53):
whose trend as a function of the photon energy is reported in Figure 3.
λ(E) = MFP(E) = 1 /μ(E)
The definition of this quantity, recalled from the same reference, is «the average distance traveled in the absorber before an interaction».
As above mentioned, the events, whose interaction stories within the scintillators include a X-ray photon escaping from the detector, contribute to building a specific escape-peak on the left of the full-energy peak. The distance (in energy units) between the centroids of these two peaks corresponds to the energy of the fluorescence X-ray characteristic of the atom involved in the interaction.
Therefore one can write the Eqs.(3-4) :
where, of course,
where the symbols represent the energy values as follows:
EEscape = EGamma – EXRF,
EGamma≥ EXRFedge
EEscape of the escaping X-ray,
EGamma of the incoming photon,
EXRF of the X-ray fluorescence from a given atomic shell, and
EXRFedge of the edge of the given shell.
Due to the substantial similarity of the values of the binding energies within a given atomic shell (see Table 2), in an acceptable approximation for present study, it is satisfactory to assume the EXRF as the value of the average of the energies weighted by the respective intensity values for the atomic shells. Furthermore, given the difference between the average energy values for different atomic orbitals, it would be enough in the present evaluation to consider the K-orbital only.
The physical process of the X-ray escape is thus a threshold process, that is, it takes place when the value of the energy of the incident photon exceeds or at most equals that of the ionization energy of an electron that is bound to an atom of one of the scintillator components.
The discontinuities of the curves shown in Figure 2 and Figure 3 are characteristic of both sodium and iodine, and are also reported in Table 2.
It should be observed that in the given energy interval (1 keV - 1 MeV) of the incident photon the probability of interaction is distributed in a binary way, with a ratio dependent on the energy, between photo-electric and scattering events. The latter are, in turn, divided between elastic (or coherent, or also Rayleigh) and inelastic scattering (or incoherent, as well Compton) events. The elastic scattering does not imply an exchange of energy between the incident photon and the atom involved in the interaction, but only a deviation of the trajectory of the photon itself from its original direction.
In this regard, see the Figure 2 where the interaction probability trends are reported for the NaI scintillator. In particular, it can be noted that the elastic interaction is (variously) prevalent among the scattering events for photon energy up to 89 keV, while the photoelectric events are (largely) prevalent over the scattering events for energies below 286 keV.
3.3. Organic and Inorganic scintillators
Regarding the process of X-ray escape, the behavior of organic and inorganic scintillators is in practice very different from each other because the formers typically have components with Z = 8 (oxygen) or less, while the latters do not show this limitation in Z.
Consequently, with reference to Eqs.(3-4), for the organic scintillators we have EEscape ≈ EGamma since EXRF edge ≤ 0.533 keV [11], and, experimentally, only a minimally distorted single-peak is observed. In practice, these scintillators can be considered as escape-free.
On the contrary, for the inorganics ones, it is usual to note a broadening of the peak in EGamma towards the left, up to its splitting, which depends on the scintillator ECmp and on the value of EGamma. This can occur if one or more elements with sufficiently high concentrations and with a high enough Z are among the components of the scintillator. In fact, as the value of the EXRF edge increases with Z at an average rate of about 1 keV per unit of Z [11], its order of magnitude can become greater than the half width at half maximum of the peak in EGamma itself.
3.4. Regions of Interest definitions
The evaluation method is based on mathematical analysis tools and, particularly, Gaussians functions for representing the single-peaks and the gamma-ray spectrum obtained by summing individual peaks.
For the calculation purposes, arranged by 2.5 keV steps, two simplifying assumptions have been made:
1) The first one regards the detection efficiency, whose value affects the area of the peaks, that has been assumed constant within each selected Region of Interest (RoI), due to their limited size with respect to centroid. The Table 3, Table 4 and Table 5 report the values of the nuclear, of the atomic emissions, as well as of the iodine-K escape peaks calculated for each of them. The average value and its standard deviation has been added to each Table to quantify the overall dispersion.
2) The second assumption refers to the iodine-K escape energy-value that has been taken equal to the weighted average of the single-shell values with respect to the intensities.
In this regard, the following RoIs have been selected:
- 140 keV from the Tc-99 decay, the most diffuse isotope utilized in the Single Photon Emission Computerized Tomography (SPECT) technique,
- 511 keV from F-18 decay usually used in Positro Emission Tomography (PET) technique and,
- 662 keV from Cs-137 decay, isotope widely in use for calibration in gamma-ray spectroscopy.
As specified in the respective “Table of nuclear and atomic radiations from nuclear decay, in the medical internal radiation dose format from the evaluated nuclear structure data file” 2, the photons included in these RoIs are identified so as to include the emissions whose energy is close to the peak emission which are not distinguishable for energy resolution reasons. Data concerning the gamma emissions within the considered RoIs, are reported in Table 3, Table 4 and Table 5.

Table 3.
Tc-99 and the corresponding escape peaks considered in the calculations. The values are reported in descending order. The half-life is of 6.0072 Hours, and the decay modes are β-3 and IT 4 [15].
| (i) | Radiation (i) | Egamma (i) (keV) | Yield (i) (Bq-s)-1 |
|---|---|---|---|
| 1 | γ 2 | 140.5 | 0.8890 |
| 2 | Ce-L, γ 2 | 137.0 | 0.0106 |
| 3 | Ce-K, γ 2 | 119.0 | 0.0879 |
| 4 | γ 2 esc | 111.3 | |
| 5 | Ce-L, γ 2 esc | 108.2 | |
| 6 | Ce-K, γ 2 esc | 90.2 | |
| Average | 117.8 | ||
| Std.deviation | 19.0 | 16 % |
Table 4.
keV RoI. Emissions from 9-F-18, and the corresponding escape peak considered in the calculations. The values are reported in descending order. The half-life is of 109.77 minutes, and the decay mode is ε 5 [15].
| (i) | Radiation | Egamma (keV) | Yield (Bq-s)-1 |
|---|---|---|---|
| 1 | γ ± | 510.9 | 1.93 |
| 2 | γ ± esc | 481.7 | |
| Average | 496.3 | ||
| Semi difference | 14.6 | 3 % |
Table 5.
keV RoI. Emissions from 55-Cs-137, and the corresponding escape peaks considered in the calculations. The values are reported in descending order. The half-life is of 30.04 years, and the decay mode is β – [15].
Table 5.
keV RoI. Emissions from 55-Cs-137, and the corresponding escape peaks considered in the calculations. The values are reported in descending order. The half-life is of 30.04 years, and the decay mode is β – [15].
| (i) | Radiation (i) | Egamma (i) (keV) | Yield (i) (Bq-s)-1 |
|---|---|---|---|
| 1 | γ 2 | 661.7 | 0.8510 |
| 2 | Ce-L, γ 2 | 655.7 | 0.0139 |
| 3 | γ2 esc | 632.5 | |
| 4 | Ce-L γ2 esc | 626.5 | |
| 5 | Ce-K, γ 2 | 624.2 | 0.0766 |
| 6 | Ce-K γ2 esc | 595.0 | |
| Average | 632.6 | ||
| Std.deviation | 24.1 | 3.8 % |
3.5. Peak representation
Each peak, relating to the gamma photons emitted by the given source within the assigned RoI, was calculated by using a Gaussian function of the photon energy as described in Eq.(005) :
where: both Yield(E) and Egamma are from the Table 3, Table 4 and Table 5, while the Full Width at Half Maximum (FWHM(E) ) is calculated by using the Eq.(6) describing, for a typical NaI detector, the linear decreasing trend of the natural logarithm of the energy resolution as a function of the natural logarithm of the photon energy expressed in units of m0c2 :
where: m0 is the value of the rest mass of the electron, c is the value of the speed of light in the vacuum, a and b are parameters assuming the values of the Eq.(7) which have been obtained from the Ref. [10], Figure 10.17:
Counts(E) = Yield(E)× EXP ( - 2× ( (E – Egamma) / FWHM(E) ) 2 ),
Ln R = a× Ln (E/m0c2 ) + b,
a = - 0.4332, and b = - 1.9774
Once the value of LnR for the given energy has been obtained, the value of R is calculated by using the Eq.(8) :
from which one can derive the value of the spread at half height ΔE by using the Eq.(9) for the energy of the considered emission:
From the total peaks (Figure 4, Figure 5 and Figure 6) one can obtain the values of the spreads at half-height and the peak-positions, giving the corresponding values of energy resolution by using the Eq.(8).
R = Exp(Ln R) = ΔE / E
FWHM(E) = ΔE = R× E .
4. Results
The Figure 4, Figure 5 and Figure 6 show the responses of a NaI scintillator for the emissions in the RoIs in Table 3, Table 4 and Table 5.
The calculation results shown so far have been iterated with values of percent of escape varying in the range between 0 (no escape) and 50%, by 10% steps. The results of these evaluations are reported in the Figure 7, Figure 8, Figure 9 and Figure 10.The escape-percent values assumed in these evaluations may appear excessive, but nevertheless a NaI detector can be thought of in both monolithic or pixelated form, whose dimension along the z axis (usually referred to as thickness) can vary in real cases from a few millimeters to a few inches. In the cases of a pixelated structure, a thickness from a few millimeters to a few tens of millimeters, as in the case of PET detection blocks [18]. The ranges of thickness variability therefore includes the so-called thin crystals, the use of which is sometimes preferred in cases of need for optimized energy resolution.
But it is quite clear that the definition of thin crystal can only refer to the definition of MFP, Ref. [10], p.53) which, as illustrated in Figure 3 for the NaI, varies considerably as a function of the photon energy, also showing the discontinuities clearly visible in the Figure 3 itself.
As could have been expected from the observation and the inter-comparison of Table 3, Table 4 and Table 5, among the given RoIs, the one most sensitive to the effects of the shifting of the peaks is that at 140 keV which shows, moreover, the highest dispersion of the average referred to the average itself (16%).
Among the given RoIs, the 511 keV one is the “cleanest” since, in addition to the β +annihilation, it only shows the additional contribution from the X-rays escape (3%).
On the other hand, the case of RoI at 662 keV, while showing a high absolute value of the dispersion of the mean, nevertheless shows the higher mean value which produces a smaller relative dispersion (3.9%).
The graphs shown in the Figure 7, Figure 8 and Figure 9 consistently show an increasing trend of the energy resolution ΔE/E, starting from the respective initial energy-dependent value of each RoI. This is justified, on the one hand, by the widening effect due to the overlapping of the escape peak(s) to the one(s) corresponding to the emission(s) and, on the other hand, by the presence of the other emission(s) present itself in the RoI.
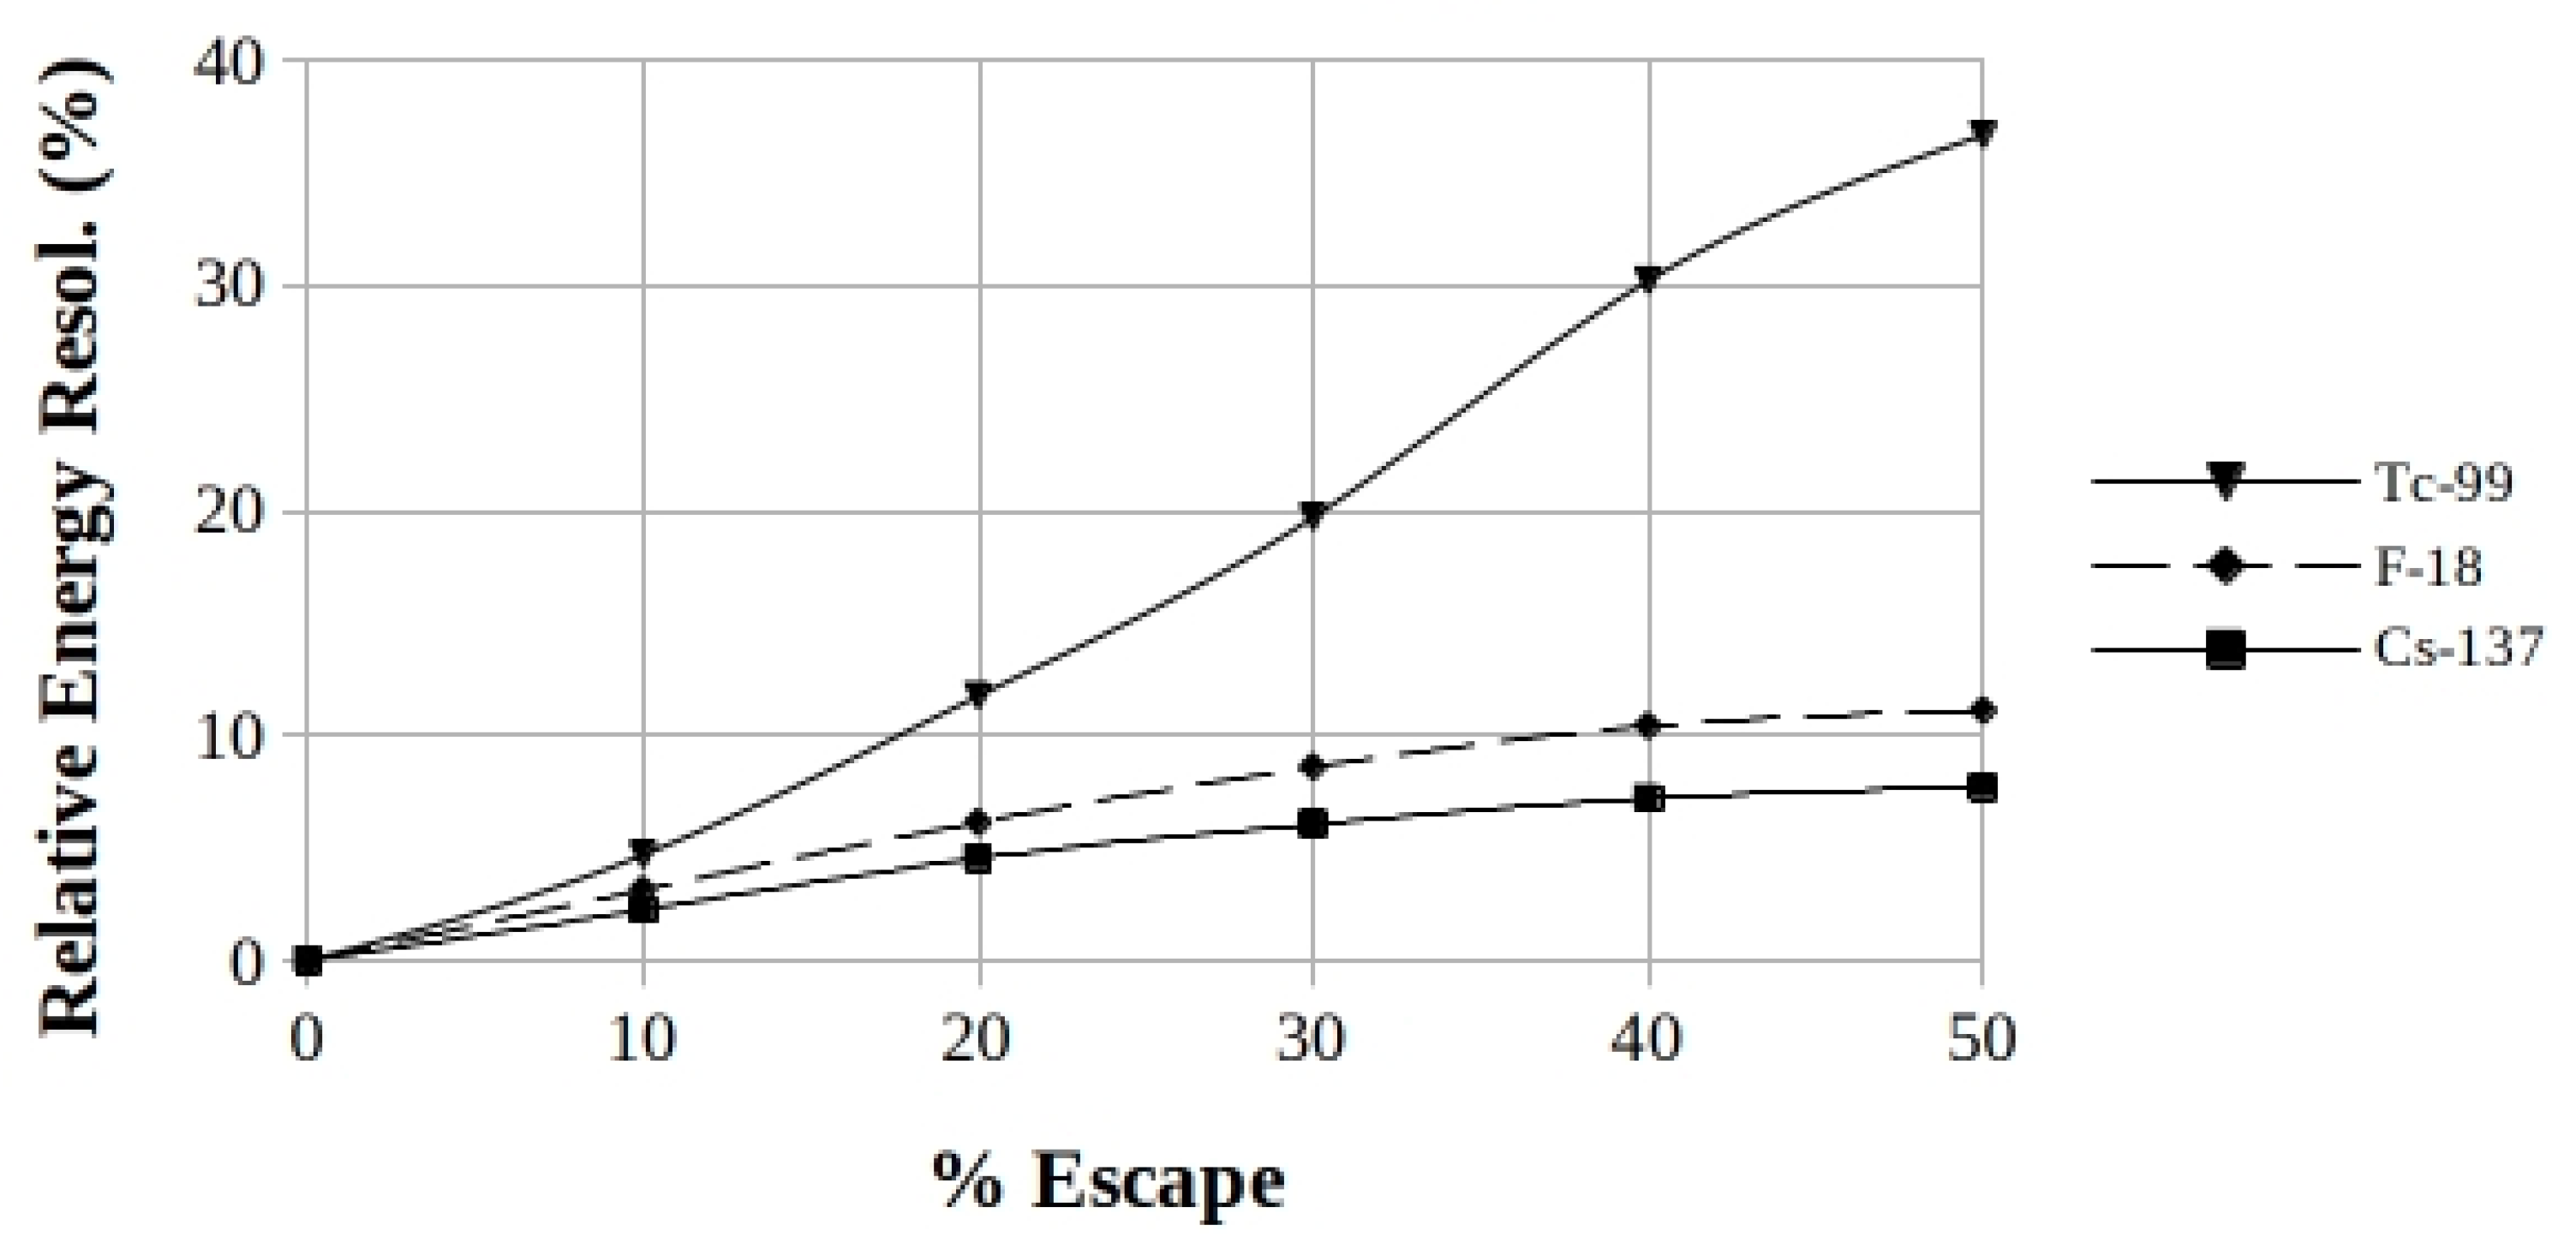
Moving on to the values expressed in percent, the final plot of Figure 10 shows the worsening in energy resolution for the different RoIs, that results in an amplified increase the more the escape percentage of the iodine-K X-ray increases and particularly for the lowest-energy RoI.
Figure 10.
NaI: comparison of the calculated percent energy resolution trends for the respective energy RoIs, as a function of the percent of the iodine-K X-ray escape. The RoIs are shown in the legend in the same sequence as the curves.
Figure 10.
NaI: comparison of the calculated percent energy resolution trends for the respective energy RoIs, as a function of the percent of the iodine-K X-ray escape. The RoIs are shown in the legend in the same sequence as the curves.
Appendix A. Volumetric ratio
Understanding that a Monte Carlo experiment is the most reliable way to do this evaluation, however some information can be roughly evaluated as discussed in the following.
The Figure A1 shows the portions of a crystal, close to its walls, from which the fluorescence X-rays from a scintillator component have chance of escaping from the crystal. The cases of the cylindrical and parallelepiped shapes, are depicted in the top and in the bottom of the Figure A1, respectively, both considered in the present evaluation.
The photons from the most popular nuclear medicine radio-tracers 6 travel in NaI for MFP(E) ranging from around 0.4 up to 3.0 cm, and reaches the value of around 4.0 cm for the 661.7 keV photons from the Cs-137 main emission.
On the other hand, the MFP(E) values for K-shells X-rays from NaI components are of about 3.E-5 and 9.E-3 cm from sodium and iodine, respectively. As a consequence, the escape process of these X-rays concerns the atoms that make up the outermost layer of all the faces of the scintillator (Figure A1), having this layer the thicknesses just above reported from sodium and iodine, respectively. Furthermore, the atomic emissions follow an isotropic spatial distribution, and only the X-rays moving towards the crystal walls have a chance of escape from the crystal itself without depositing their energy in the scintillator.
Figure A1.
On average, to successfully escape from the crystal, an X-ray must not only be emitted from one of the dotted regions of NaI close to the walls, but the X-ray itself must also be oriented outward. It should be noted also that the MFP(E) depends on the atomic number Z of the emitting atom, i.e. sodium or iodine, respectively, whose values are reported in Table 2. Thus the drawing is not to scale.

The interaction probability within a generic absorber for a parallel-beam of mono-energetic gamma-rays is expressed by the well known Eq.(A1):
where: Io and I represent the beam-intensities in or out of the absorber, respectively; μ(E) stays, according to Eq.(1), for the total linear interaction coefficient of the absorber at the given energy, and x represents the thickness traveled in the absorber.
(Io-I) / Io = 1 - Exp(-μ(E) x)
By setting x = MFP(E) in the Eq.(A1), one can verify that the beam intensity interacting within the absorber, relative to the incoming value, assumes the value of around 0.632.
The Eq.(A2) defines the quantity Vratio as the ratio of the volume of outermost layer to the total scintillator volume, being the thicknesses of such layer equal to the MFP(E), from which the fluorescence X-ray has a probability of escaping:
where:
Vratio = Vlayer / Vscint
Vratio = volumetric ratio;
Vlayer = volume of the outermost layer whose thickness is MFP(E), and
Vscint = total volume of the scintillator.
As the sketch of Figure A1 shows, in a first approximation, the fraction of escaping X-rays can be intuitively assumed to be proportional to the value of Vratio shown by the given crystal, because the higher this value, the higher the escape-peak area in the gamma-ray spectrum.
A second estimation can be taken for the thickness of this layer that can be attributed to iodine only, due to their much higher intensity compared to sodium, whose atomic number Z, in turn, is much lower (Table 1).
With reference to the considerations about the escape process reported in Ref. [10], p.318, « … . These peaks are generally labeled "X-ray escape peaks" and tend to be most prominent at low incident gamma-ray energies and for detectors whose surface-to-volume ratio is large. … » the second assertion has suggested the study on the Vratio parameter, which take into account of both the shape of the scintillator and its elemental composition.
To this aim it is convenient to make a distinction related to the shape and to the geometry of the scintillation crystal.
Monolithic and pixelated scintillation crystals and readout setup
Even if the scintillation crystals can be arranged with the shapes and the segmentation types more adequate to the specific application, the evaluations are hereafter limited to the cases of:
1).- a right-cylindrical scintillator, coupled to a single-channel (PMT);
2).- a square-array of right-parallelepiped crystal-pixels with square-base, coupled to a multi-anode Position-Sensitive PMT (PSPMT).
Right-cylindrical scintillation crystal with single-channel PMT
To evaluate the Eq.(A2) for a right-cylindrical scintillator one can write the Eq.(A3):
where: R and H are the values of lengths of radius and height of the cylinder, respectively.
Vscint =π ×R2× H,
Consequently, for the Vlayer value, the Eq.(A3) can be written like in Eq.(A4):
where the value of the interaction probability is around 0.632.
Vlayer = Vscint -π ×( R -MFP(E) ) 2× ( H -MFP(E) )
Regarding the monolithic cylindrical scintillation crystals, standard sized 1inch×1inch, 2inch×2inch, and 3inch×3inch, usually utilized for spectroscopic general-purpose have been investigated in present study. In addition to these, also the 2inch in diameter with height decreasing from 1inch down to 0.0625inch (about 1.6 mm), used for high-resolution small-field-of-view medical imaging, have been included. The results of evaluations for all these crystals are reported in Figure A2, where the standard sized crystals and the smaller ones are referred to as “thick cyl” and “thin cyl”, respectively.
Square-array of right-parallelepiped crystal-pixels with PSPMT
Even if NaI does not represent the ideal material for assembling an array of crystal-pixel due to its tendency to fracture under fast changes of temperature, however pixels made of that material have been included in present study because NaI is the gold standard for gamma-ray spectroscopy. As a consequence of a fracture in a pixel, the transport of luminous photons along its axis is strongly compromised by their reflections-back at the fractures itself, resulting in a dramatic decrease in the light-output at the pixel light-output-face up to making the event undetectable.
To evaluate the Eq.(A2) for a right-parallelepiped pixel one can write the Eq.(A5):
where: S and H are the lengths of pixel-side and of pixel-height, respectively.
Vscint =S2× H,
Consequently, for the Vlayer value, the Eq.(A6) can be written:
where the interaction probability corresponding to the MFP(E), is around 0.632.
Vlayer = Vscint – ( S -MFP(E) ) 2× ( H - MFP(E) )
Regarding the standard sized monolithic cylindrical scintillation crystals, 1×1, 2×2, and 3×3, 7, usually utilized for spectroscopic general-purpose, have been investigated. In addition, also the ones with decreasing heights 2×1, 2×1/2, …, down to 2×1/16 (around 1.6 mm-thick) used for some high-resolution small-field-of-view medical imaging have been evaluated.
The right-parallelepiped square-base-sized pixels have been also included in this study because of their involvement in PET applications [18] and, potentially, in SPECT [19], as well as in the field of intraoperative probes [20]. Their height has been fixed at 50-mm for NaI, essentially for the first application.
The results of the Vratio evaluations for these crystals are shown graphically in the Figure A2, where the larger parallelepiped crystals and the smaller ones are referred to as “LR pixels” and “HR pixels”, respectively. The Low (spatial) Resolution setups having pixel-base from 3×3- to 6×6-mm2, by 1-mm steps, are referred to as “LR pixels” in Figure A2. In addition, the High (spatial) Resolution pixels sized from 1×1- to 2.5×2.5-mm2, by 0.5-mm side-steps, have been also evaluated as comparison.
Volumetric-ratio results
The trends of the volumetric ratio Vratio as a function of the value of the figure of merit S/V for the iodine-K X-rays from NaI are plotted in the Figure A2 for the crystal-sizes above described. Two contrasting trends, one descending, the other ascending for the parallelepiped and the cylindrical ones, respectively, are shown in the examined range. The S/V ratio parameter seems unsuccessful, in the examined domain, to take into account of the differences in the size, in the shape, as well as in the ECmp of the scintillator itself. Moreover, the parallelepiped crystals (upper curve) show a more marked tendency (10 times about) to advantage X-rays escape in comparison with the cylindrical-ones (lower curve).
Conclusions
Traditionally, attention is payed to the physical process of escape of fluorescence X-rays when one have to deal with a thin NaI(Tl) monolithic crystals coupled to a single-channel PMT for low-energy spectroscopy. But an accumulation of events on the left of the photopeak, at a distance equal to the iodine K-shell X-rays energy, takes always place. In fact, there is no physical reason inhibiting the process of X-rays escape, making it visible only in particular conditions.
Understanding that a Monte Carlo experiment is the most reliable way to do this evaluation, however some information can be roughly evaluated as discussed in the following.
The impact of the X-ray escape process on the energy resolution of a scintillation detector for gamma-ray spectroscopy is shown in the plots of Figure 4, Figure 5 and Figure 6, drawn for values of escape-rate from 0 to 50%. Even in cases of lower impact, it is always possible to detect the presence of escape by simply evaluating the derivative of the count curve with respect to the channels to highlight its points of relative minimum, inflection, or maximum.
For pixelated crystals as well as for thin monolithic ones, a noticeable number of cases occur in which the atom releasing the fluorescence X-ray is located in close proximity of an outer wall of the scintillator and the contribution to the full-energy peak of the X-ray itself can be lost.
The quantity Vratio, defined as the ratio of the volume of outermost layer to the total scintillator volume, being the thicknesses of such layer equal to the MFP(E) has been evaluated in the Appendix A. By construction, from that layer, on average, the fluorescence X-ray has a probability of escaping.
In medical imaging, this makes the escape-process an important image-blurring factor, because of its numerically competing (or even dominating) effect, compared to inter-pixel scattering, to the point that it would be appropriate to speak of inter-pixel escape effect spreading events between the primary pixel and the first neighbors ones.
This emphasizes, once again, the advantage of recognizing multi-pixel interactions also when X-ray escape occurs because, in this case, the event-energy is spread in more than one pixel bordering the primary one.
In turn, this makes the prediction of the fraction of escaping fluorescence X-rays as a function of the scintillator elemental composition, as well as of the pixel-size one of the most important tools to have on hand when designing an high-resolution pixelated detector, because of the possibility of recognizing and discarding the events undergoing multi-pixel interactions Ref. [17].
Future work will be dedicated to evaluate the properties of scintillators from a specific spectroscopic point of view, including the role of fluorescence X-ray escape. In particular the spectrometric consequences of their ECmp have to focuse the attention in a larger way.
References
- Robert Hofstadter, Alkali Halide Scintillation Counters, Phys. Rev. 74 (1948) pp.100-101. [CrossRef]
- H.M. Taylor and N.F. Mott, A theory of the internal conversion of γ-rays, Proceedings of the Royal Society of London. Series A, Containing Papers of a Mathematical and Physical Character, Vol. 138, Iss. 836 (1932) pp. 665-695. [CrossRef]
- J.G. Jaeger and H. Hulme, The internal conversion of γ-rays with the production of electrons and positrons, Proceedings of the Royal Society of London. Series A, Containing Papers of a Mathematical and Physical Character, Vol. 148, Iss. 865, (1935) pp. 708-728]. [CrossRef]
- G.D. Latyshev, The Interaction of γ-Rays with Matter and the Spectroscopy of γ-Radiation, Revs. Mod. Phys., 19.2 (1947) pp. 132-145. [CrossRef]
- J.J. Livingood and G.T. Seaborg, Tables of the Isotopes, Revs. Mod. Phys., 12 (1940) pp.30-46.
- G.T. Seaborg, Tables of the Isotopes, Revs. Modern Phys., 16-1 (1944) pp.1-32.
- G.T. Seaborg and I. Perlman, Tables of the Isotopes, Revs. Mod. Phys., 20 (1948) pp.585-643.
- J.M. Hollander, I. Perlman and G.T. Seaborg, Tables of Isotopes, Revs. Mod. Phys., 25-2 (1953) pp.469-651.
- D. Strominger, J.M. D. Strominger, J.M. Hollander, and G.T. Seaborg, Tables of the Isotopes, Revs. Mod. Phys., 30-2, part 2 (1958) pp.585-904.
- G.F. Knoll, Radiation Detection and Measurement, Third Edition, John Wiley & Sons, Inc., New York, Copyright © 2000.
- NPL National Physical Laboratory - Kaye & Laby, Tables of Physical & Chemical Constants, X-ray absorption edges, characteristic X-ray lines and fluorescence yields.
- Peter Axel, Intensity Corrections for Iodine X-Rays Escaping from Sodium Iodide Scintillation Crystals, Review of Scientific Instruments 25(1954)p.391. [CrossRef]
- W.E. Meyerhof and H.I. West jr., Note on the Escape Peak Correction for NaI(Tl) Crystals, Review of Scientific Instruments 25(1954)p.1025.
- NIST, XCOM: Photon Cross Sections Data, accessed on 16 nov 2022 at the NIST website. Available online: https://www.physics.nist.gov/cgi-bin/Xcom/xcom3_2.
- Website. Available online: https://www.nndc.bnl.gov/nudat3/mird/ (accessed on 10 January 2023).
- F.G. Kondev, M. Wang, W.J. Huang, S. Naimi, G. Audi, The NUBASE2020 evaluation of nuclear physics properties, Chinese Physics C Vol. 45, No. 3 (2021) 030001. [CrossRef]
- Luca Indovina, Raffaele Scafè, Marco Puccini, Rosanna Pellegrini, Roberto Pani, A new generation of scintillation detectors with identification of events undergoing multiple interactions for gamma-ray imaging and spectroscopy, Applied Radiation and Isotopes 184 (2022) 110189. [CrossRef]
- M.E. Casey, R. Nutt, A multicrystal two dimensional BGO detector system for positron emission tomography, IEEE Trans. Nucl. Sci. 33 (1), 1986, pp.460–463. [CrossRef]
- C. Borrazzo, M. Bettiol, P. Bennati, E. Preziosi, A. Fabbri, R. Scafè, ... & R. Pani, Monte Carlo simulation to evaluate factors affecting imaging performances of compact scintillation gamma camera, In 2016 IEEE Nuclear Science Symposium, Medical Imaging Conference and Room-Temperature Semiconductor Detector Workshop (NSS/MIC/RTSD) (pp. 1-5). [CrossRef]
- R. Pani, R. Pellegrini, M.N. Cinti, M. Longo, R. Donnarumma, A. D'Alessio, ... & G. De Vincentis, Development of a novel gamma probe for detecting radiation direction. Journal of Instrumentation, 11(01), C01002, (2016). [CrossRef]
| 1 | National Institute of Standards and Technology (NIST), Gaithersburg, Maryland, U.S.A. |
| 2 | National Nuclear Data Center, Brookhaven National Laboratory, Upton, NY, USA. |
| 3 |
β - stays for β - decay, i.e. the decaying nucleus emits an electron and an electron antineutrino. In symbols: (A, Z) → (A, Z+1)+e-+ve[16]. |
| 4 |
IT stays for internal (isomeric) transition. An excited level of a metastable nucleus decays to a lower-energy level with the emission of photon or of an electron. In symbols: (A, Z) → (A, Z) + γ, or (A, Z+1) + e - [16]. |
| 5 |
ε stays for electron capture, that is: the nucleus undergoing the decay captures an electron from an atomic shell, and emits a neutrino. In symbols: (A, Z) + e - → (A, Z-1) + ν . The resulting nucleus is in an excited unstable state [16]. |
| 6 | At 140.5 keV and 510.9 keV, from Tc-99 and F-18 β + annihilation, respectively. |
| 7 | in extended notation: 1-inch in diameter and 1-inch in height. |
Figure 1.
Growth over the years of number of pages of the five compilations of Tables of (the) Isotopes published in the Reviews of Modern Physics in 1940, 1944, 1948, 1953 and 1958, respectively. The lengths of the collections were of 17, 32, 82, 182, and 319 pages, respectively.
Figure 1.
Growth over the years of number of pages of the five compilations of Tables of (the) Isotopes published in the Reviews of Modern Physics in 1940, 1944, 1948, 1953 and 1958, respectively. The lengths of the collections were of 17, 32, 82, 182, and 319 pages, respectively.
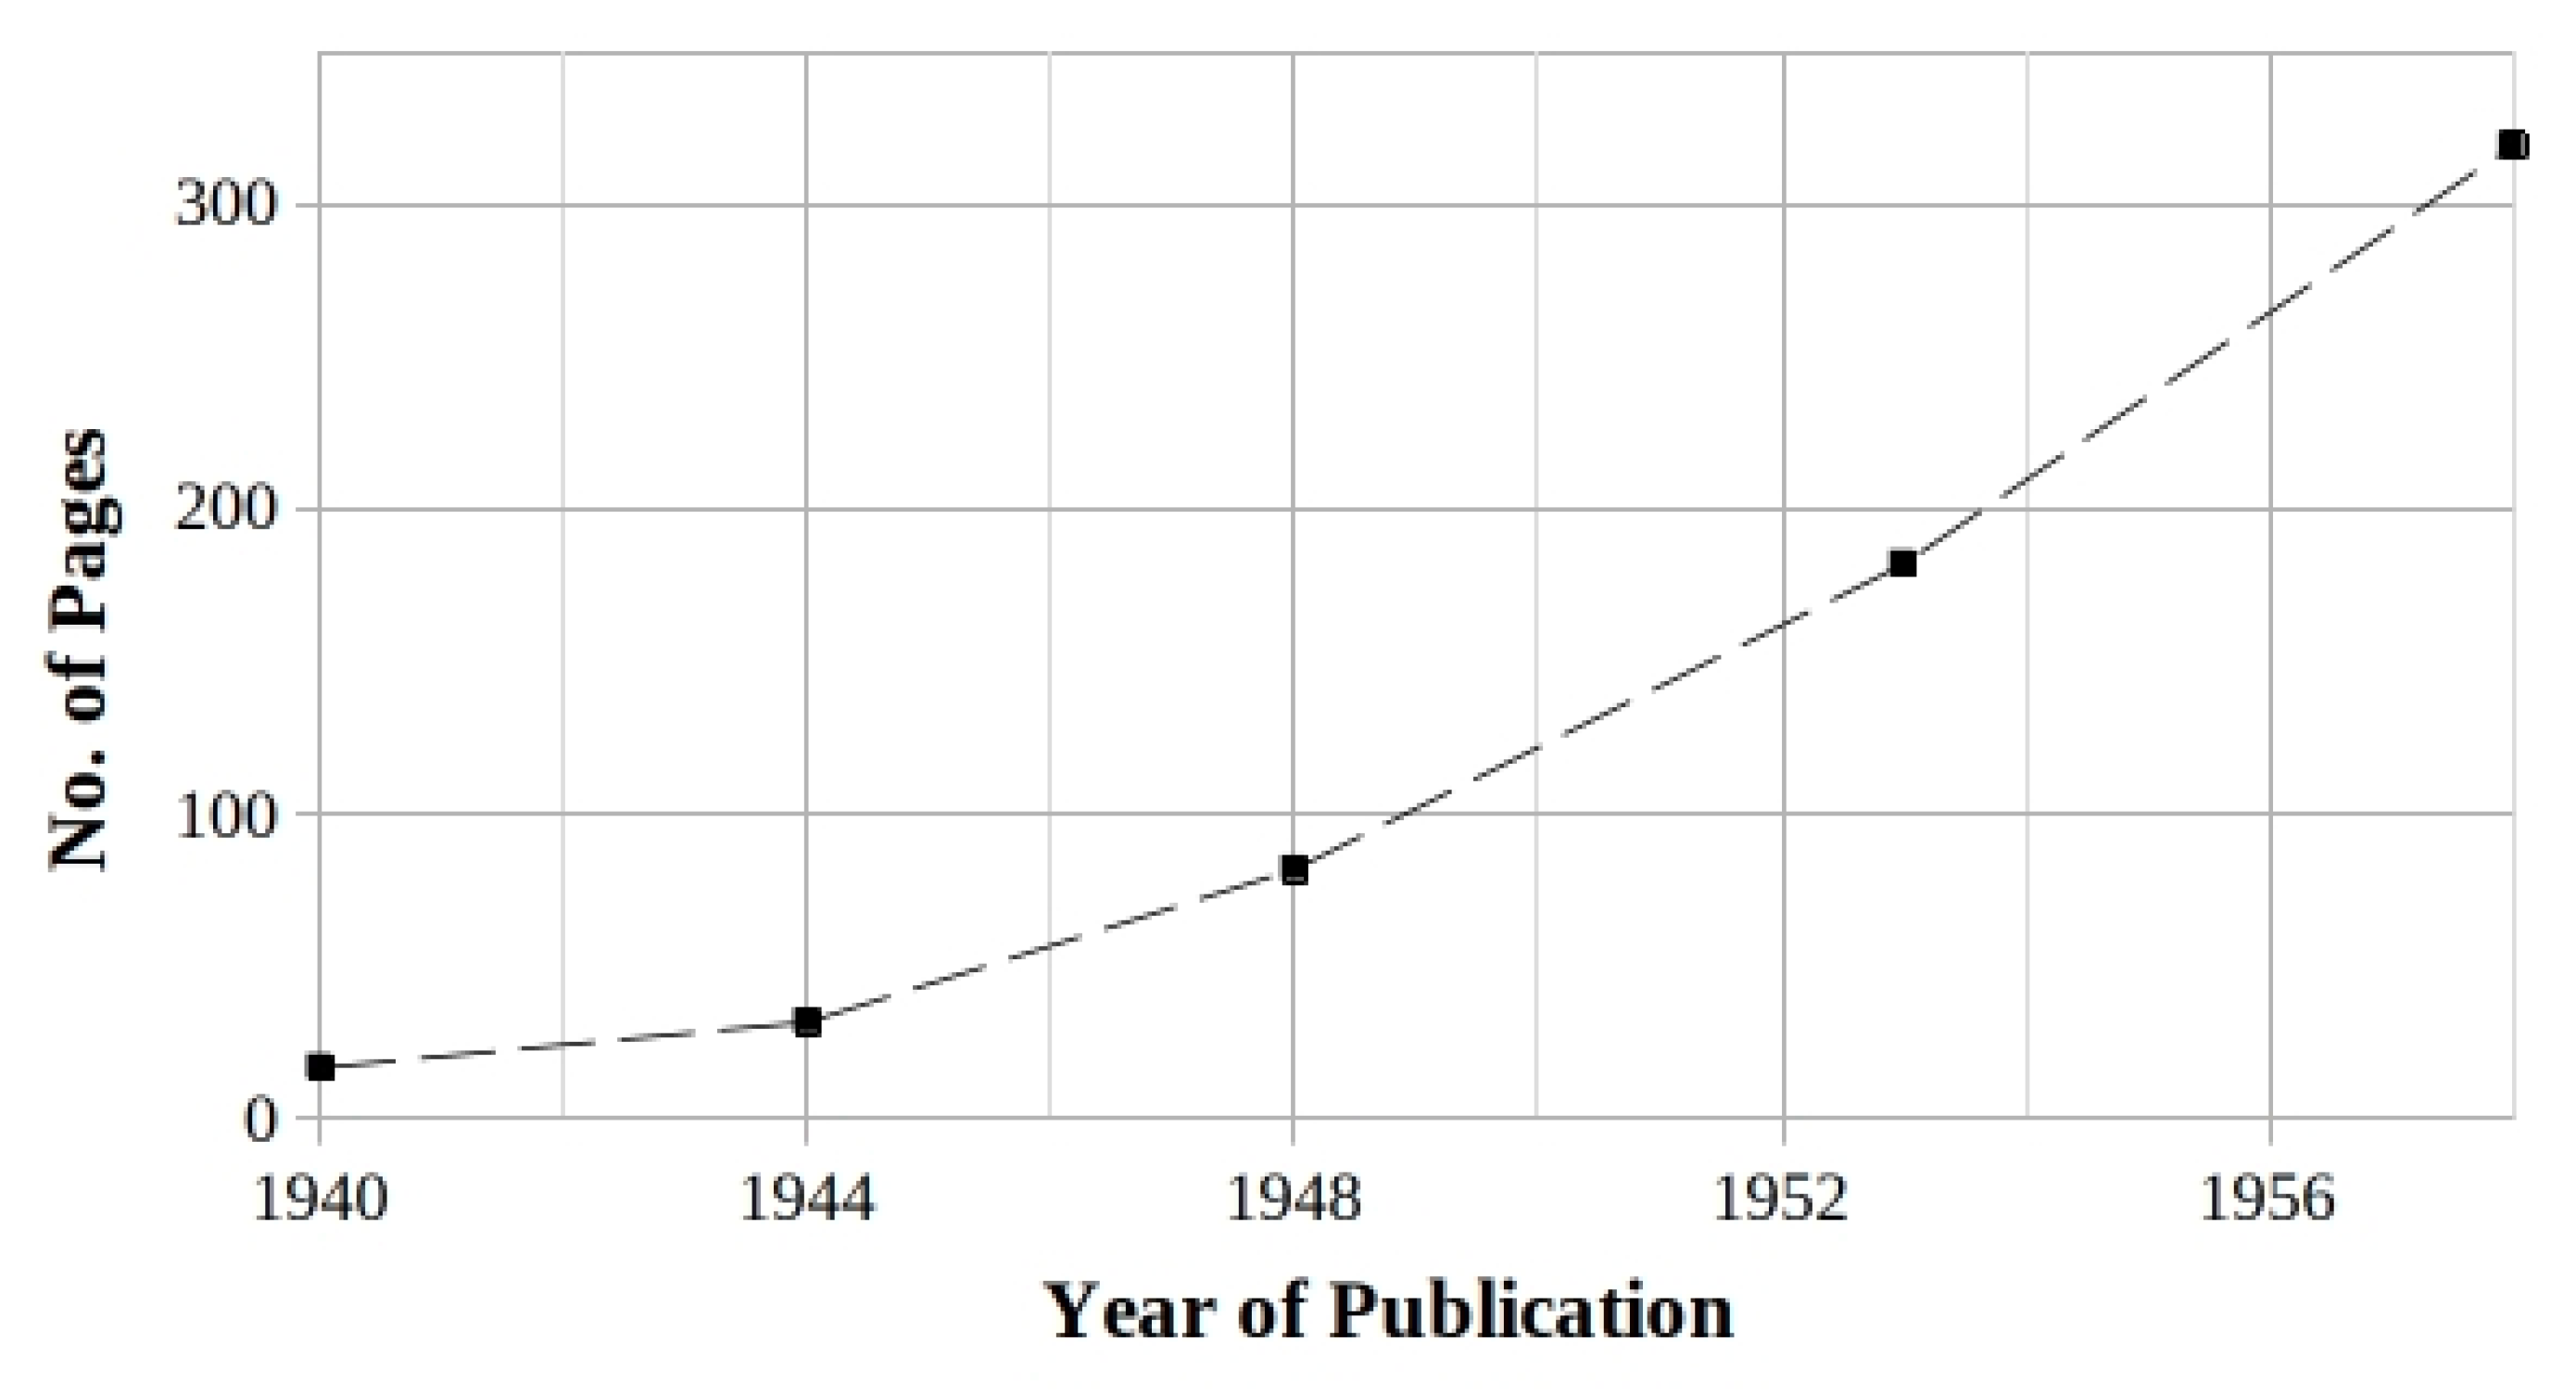
Figure 2.
Trends of the values of the interaction coefficients for the NaI scintillator, expressed in cm2/g, as a function of the photon-energy, based on data from Ref. [14].
Figure 2.
Trends of the values of the interaction coefficients for the NaI scintillator, expressed in cm2/g, as a function of the photon-energy, based on data from Ref. [14].
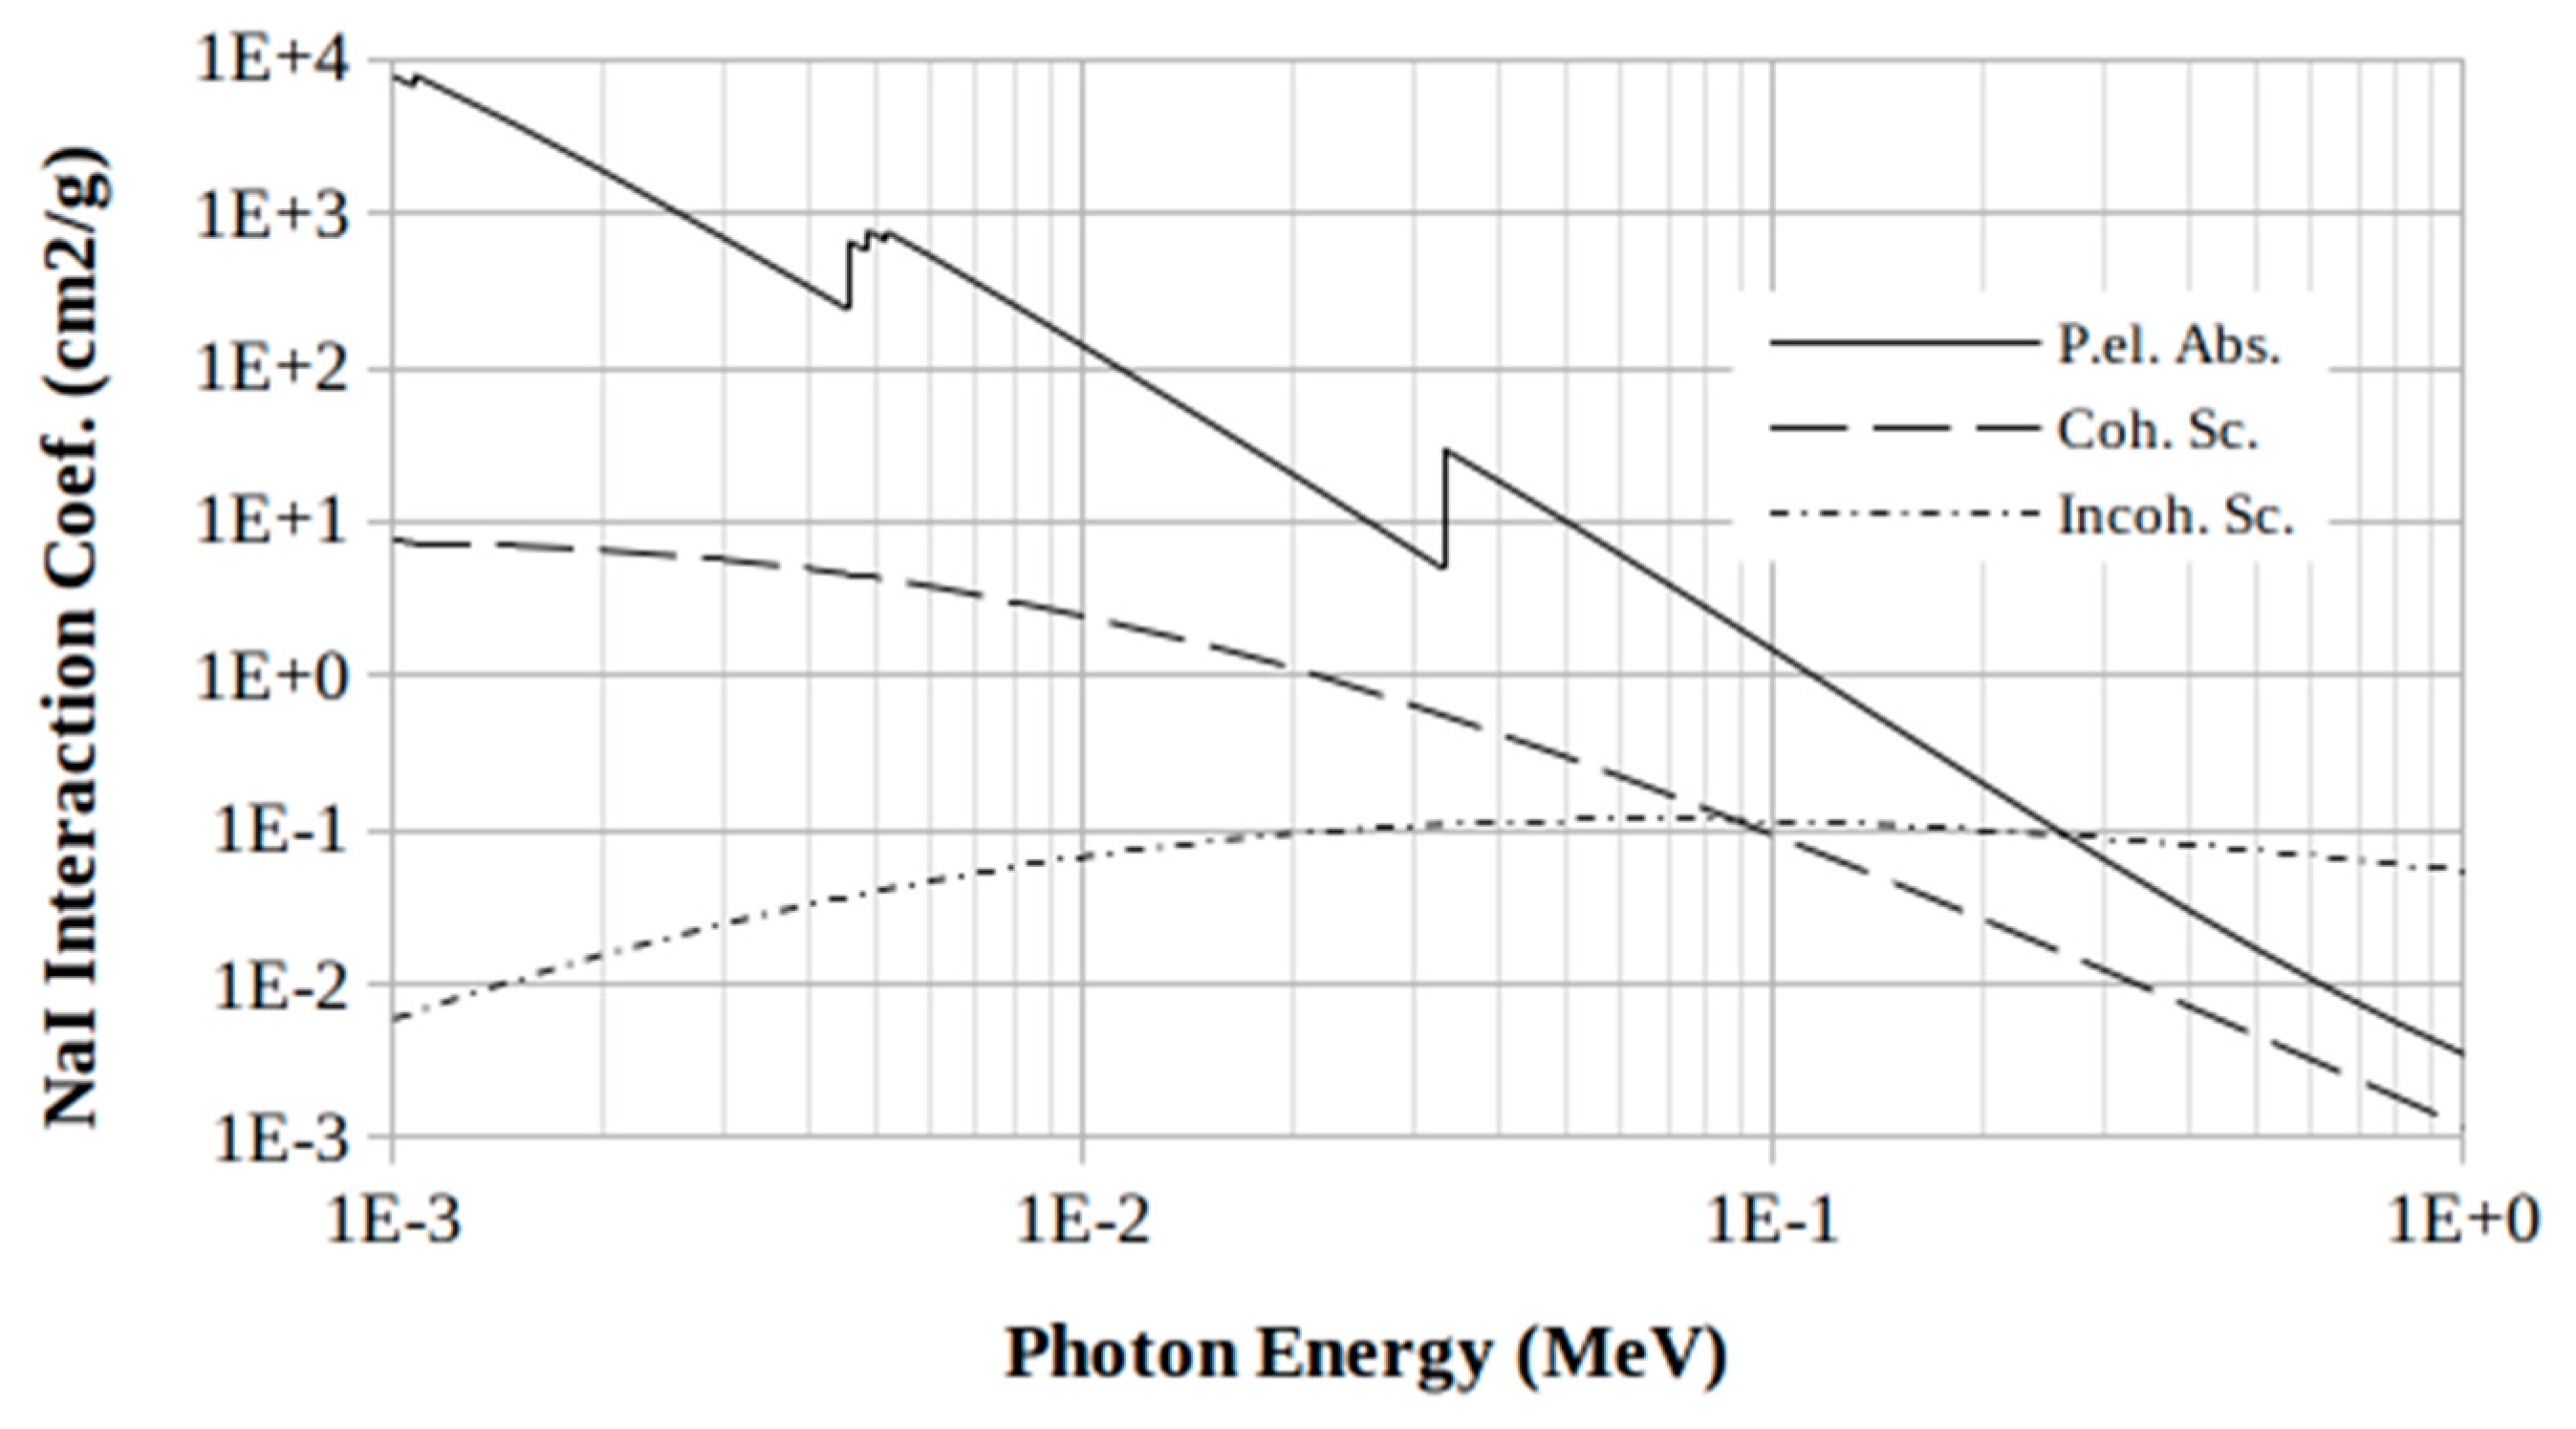
Figure 3.
Trends of the values of the mean free path, expressed in cm, as a function of the photon-energy for the NaI scintillator based on data from Ref. [14].
Figure 3.
Trends of the values of the mean free path, expressed in cm, as a function of the photon-energy for the NaI scintillator based on data from Ref. [14].
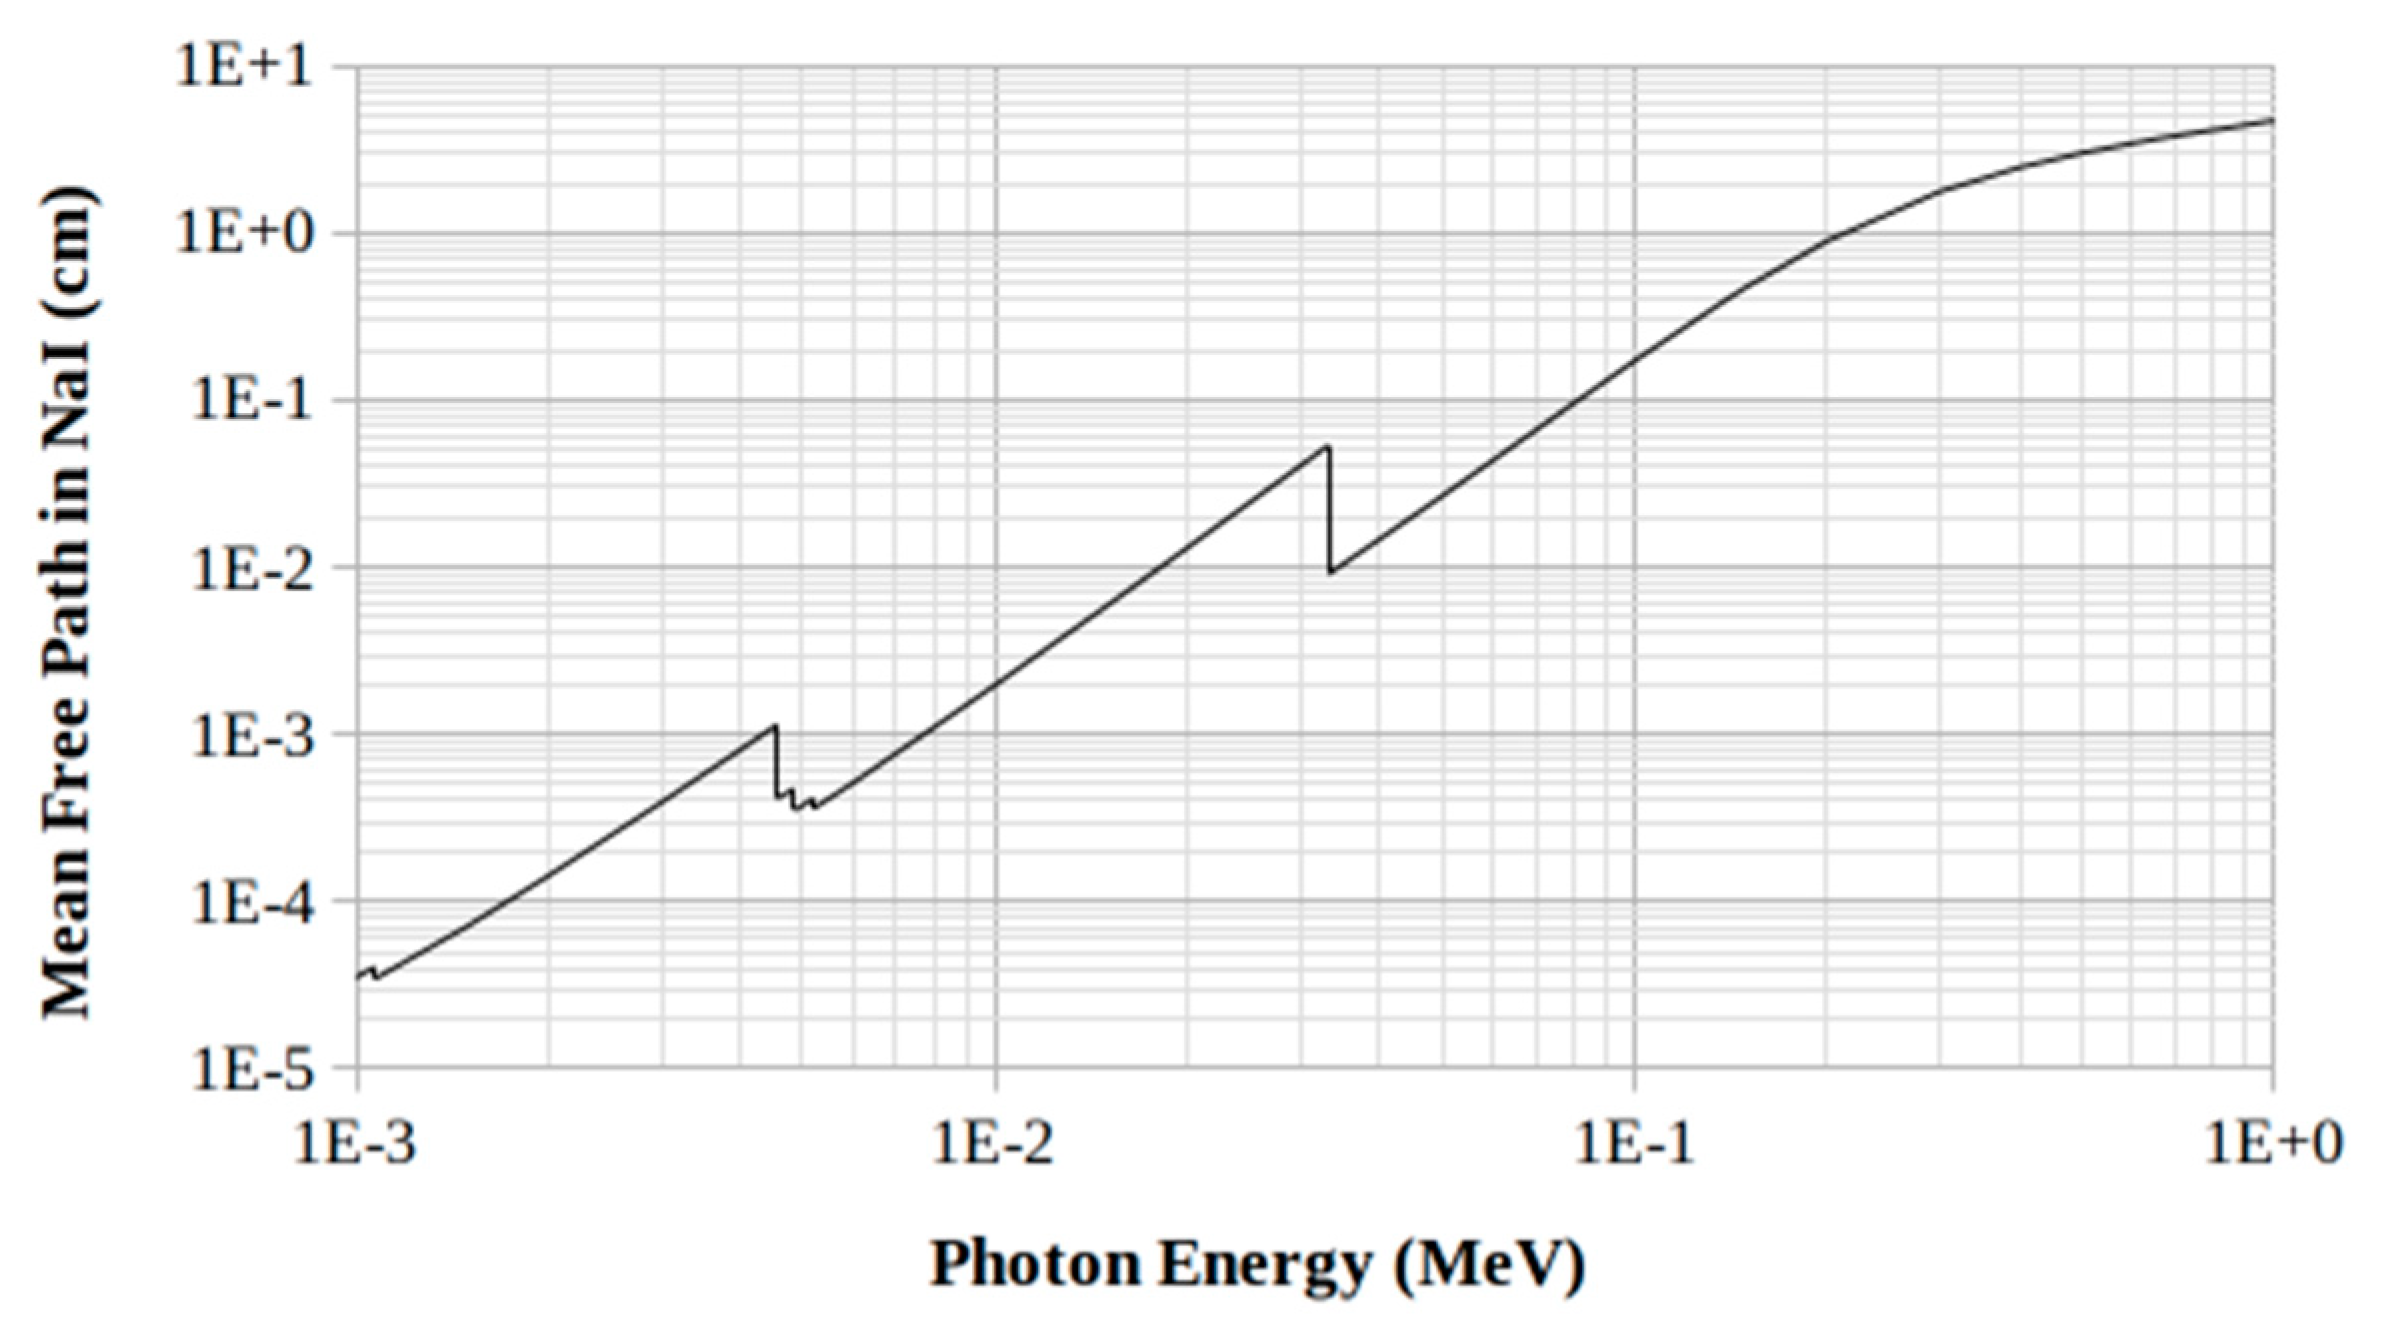
Figure 4.
Tc-99: NaI calculated photo-electric and iodine-K escape peaks in the 140 keV RoI, showing the enlargement on the left of the maximum of the total curve due to the contribution of all the emissions and of their iodine-K X-ray escape emissions. The diagrams are referenced in the legend, from top to bottom, in the same sequence as the curves itself. The Tc-99 emissions are detailed in Table 3.
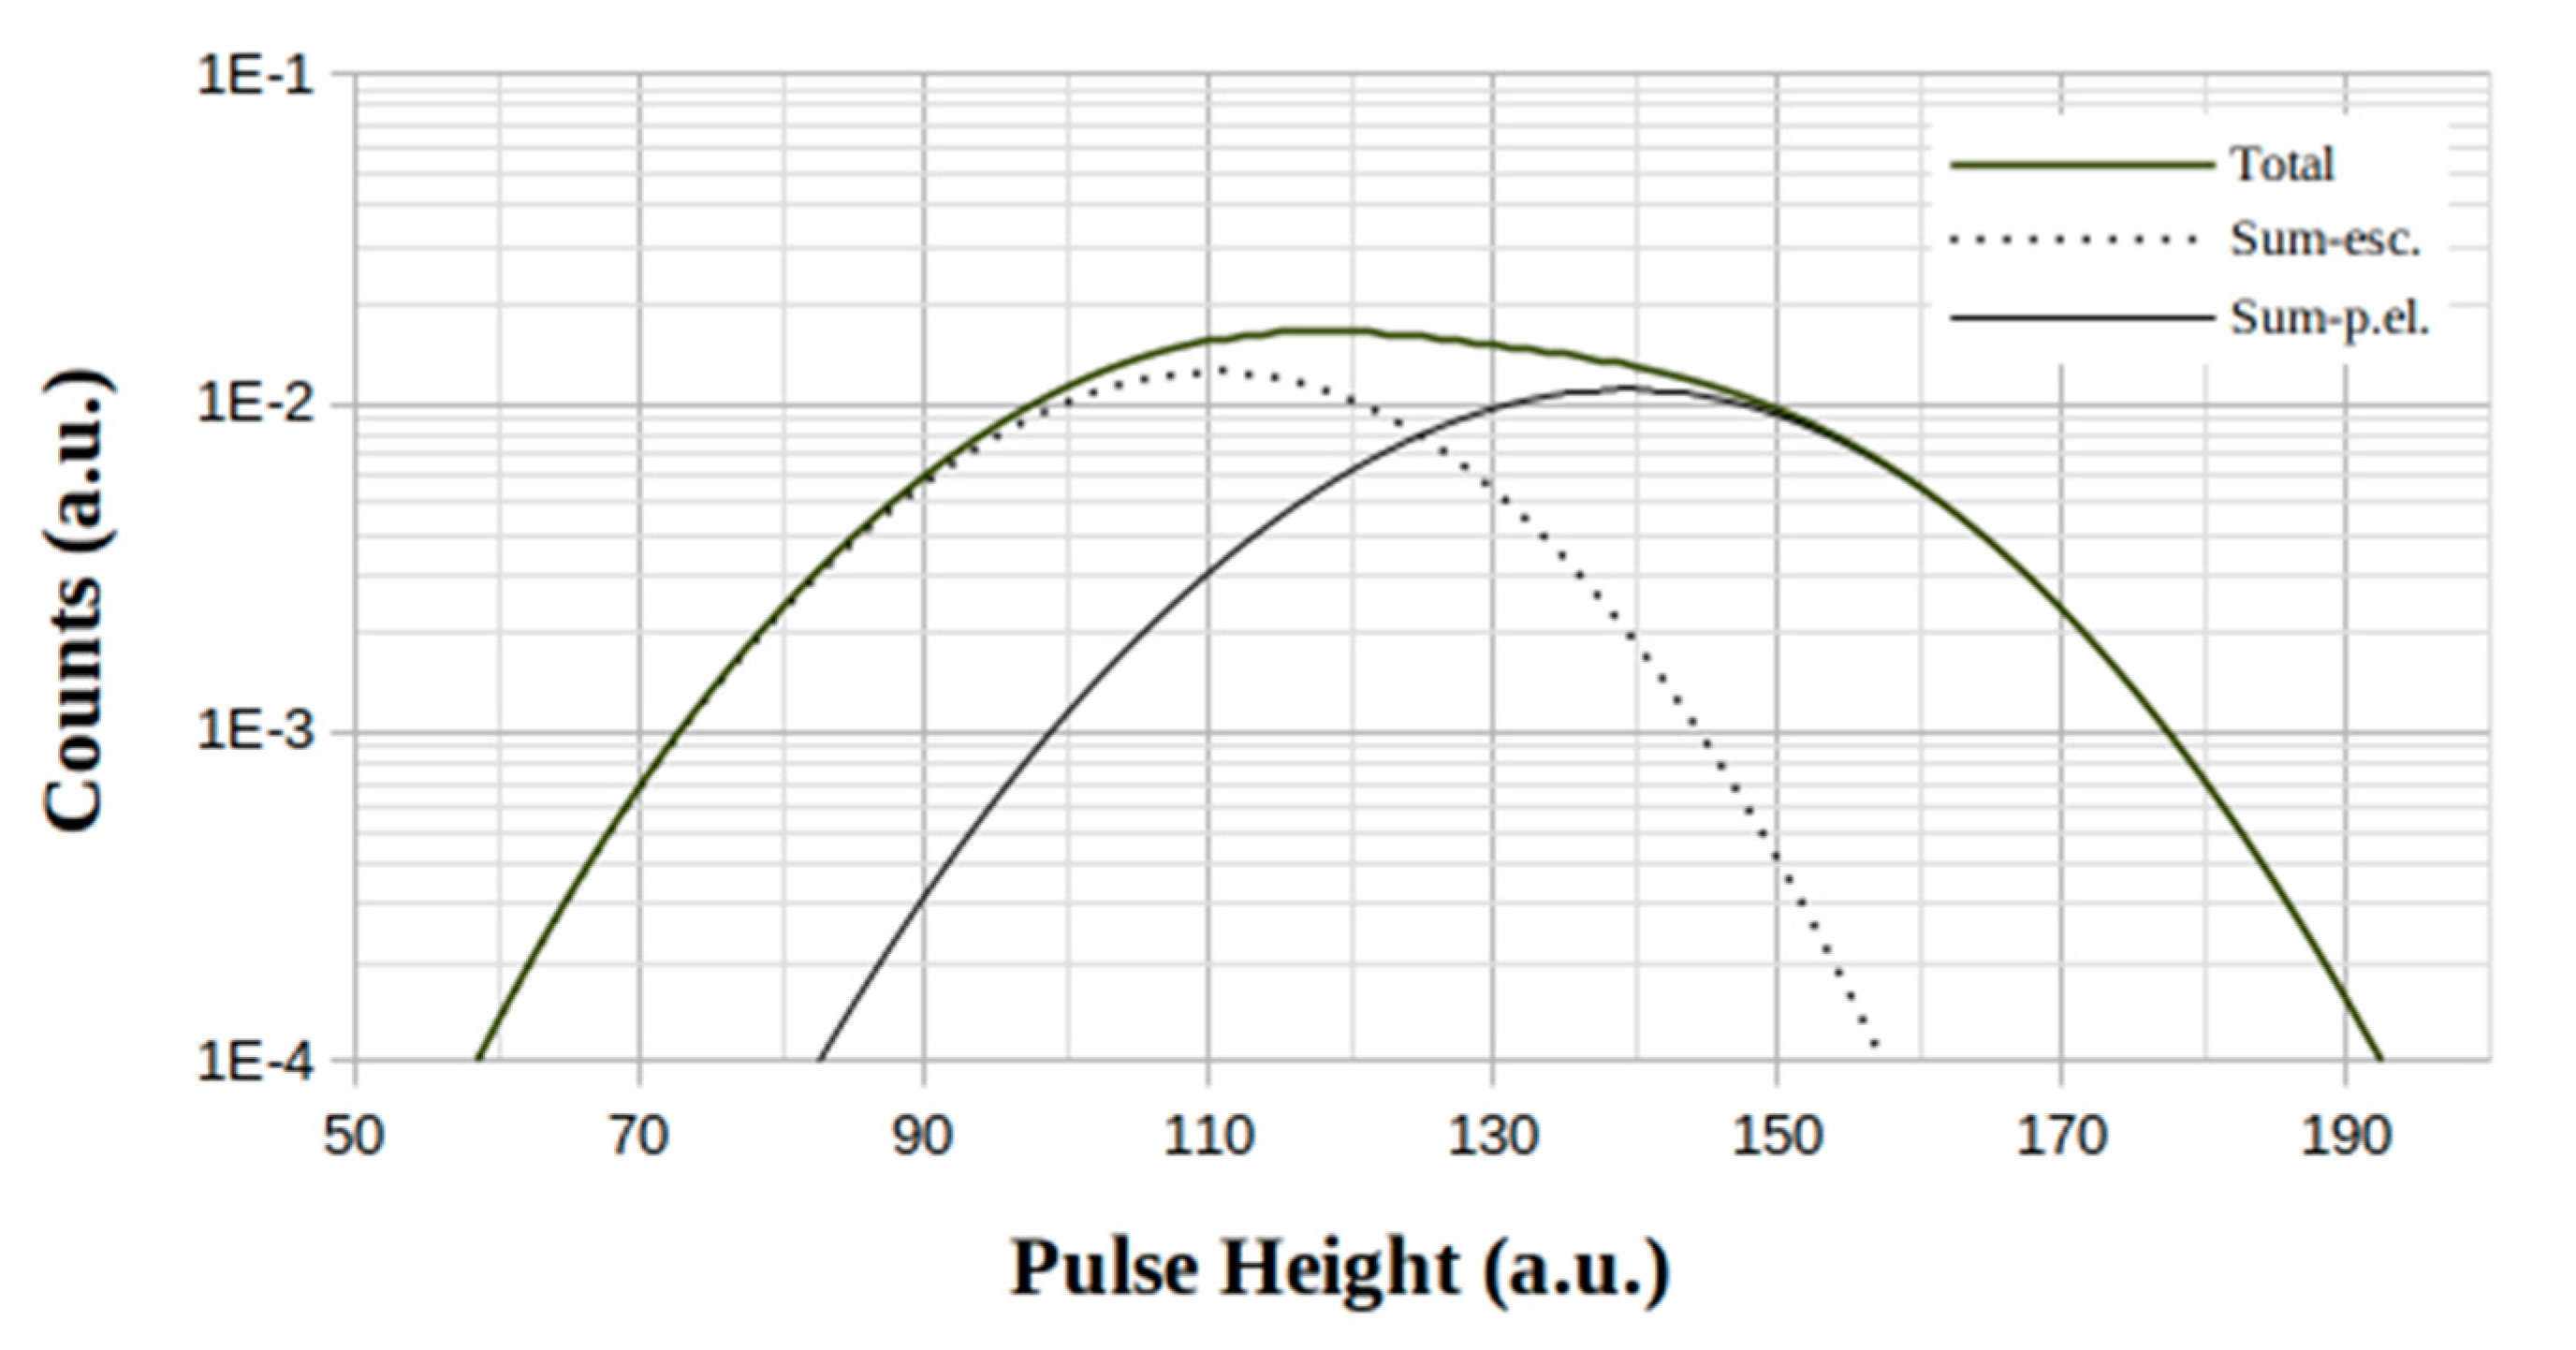
Figure 5.
F-18: NaI calculated photo-electric and escape peak in the 511 keV RoI, showing the enlargement on the left of the maximum of the total curve due to the contribution of the iodine-K X-ray escape emissions. The diagrams are referenced in the legend, from top to bottom, in the same sequence as the curves itself. The F-18 emissions are detailed in Table 4.
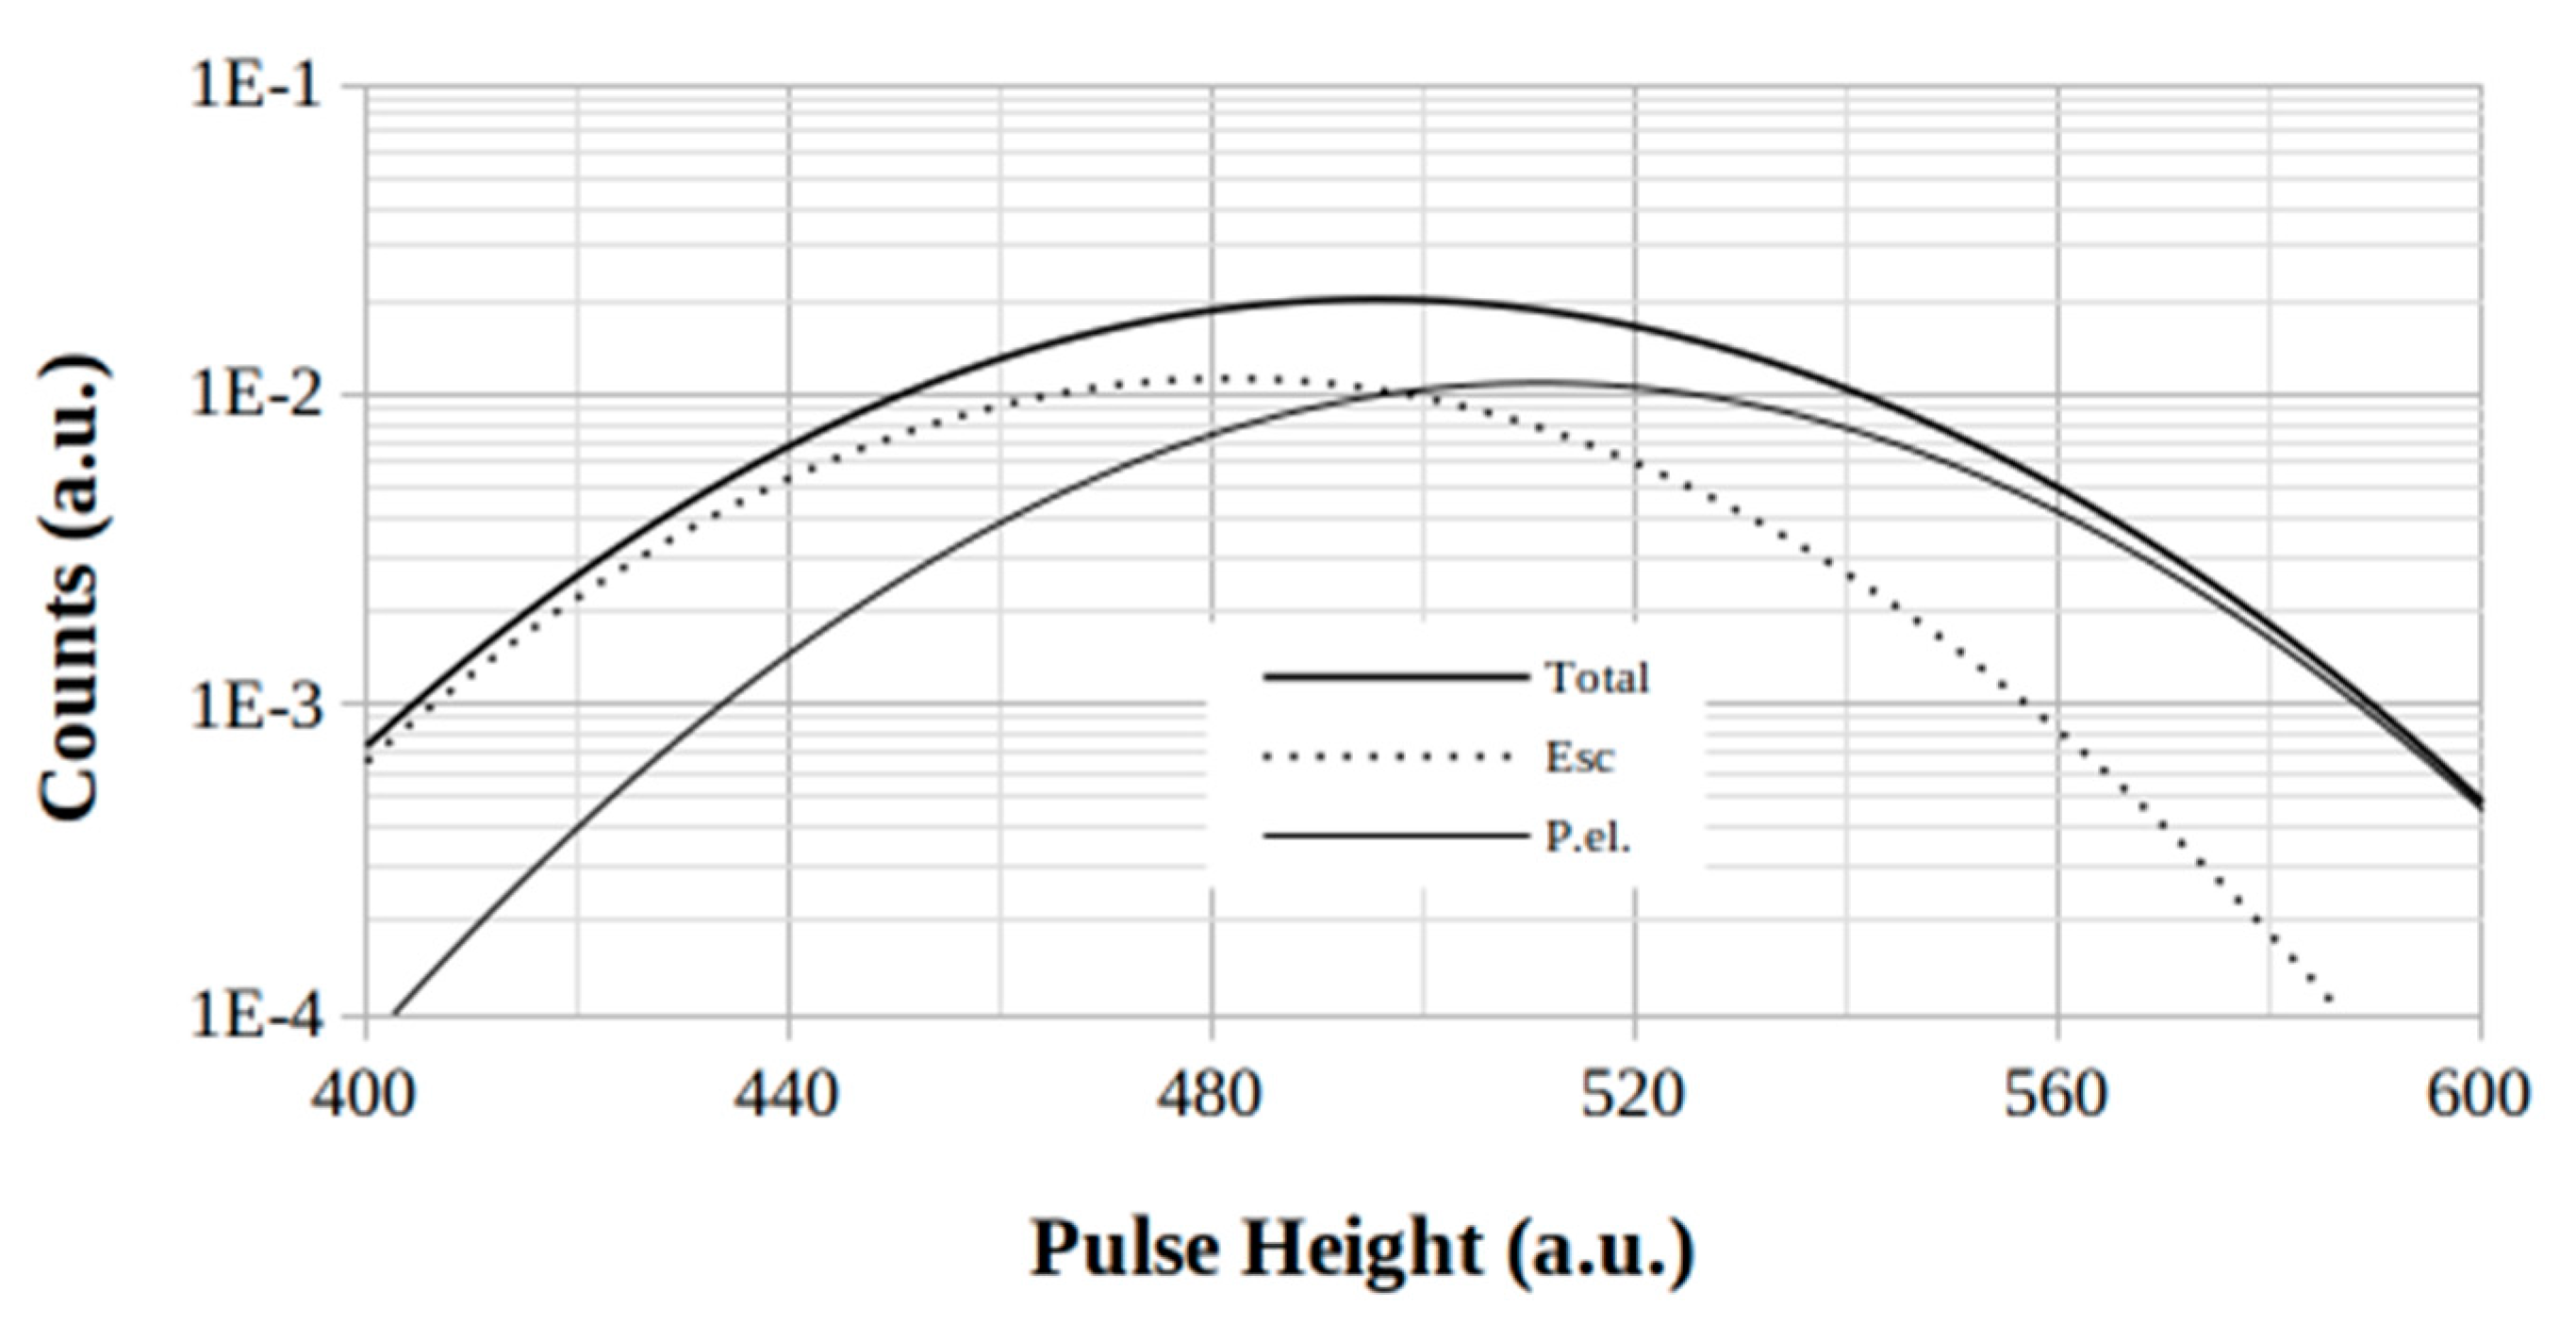
Figure 6.
Cs-137: NaI calculated photo-electric and iodine-K escape peaks in the 662 keV RoI, showing the enlargement on the left of the maximum of the total curve, due to the contribution of the iodine-K X-ray escape emissions. The diagrams are referenced in the legend, from top to bottom, in the same sequence as the curves itself. The Cs-137 emissions are detailed in Table 5.
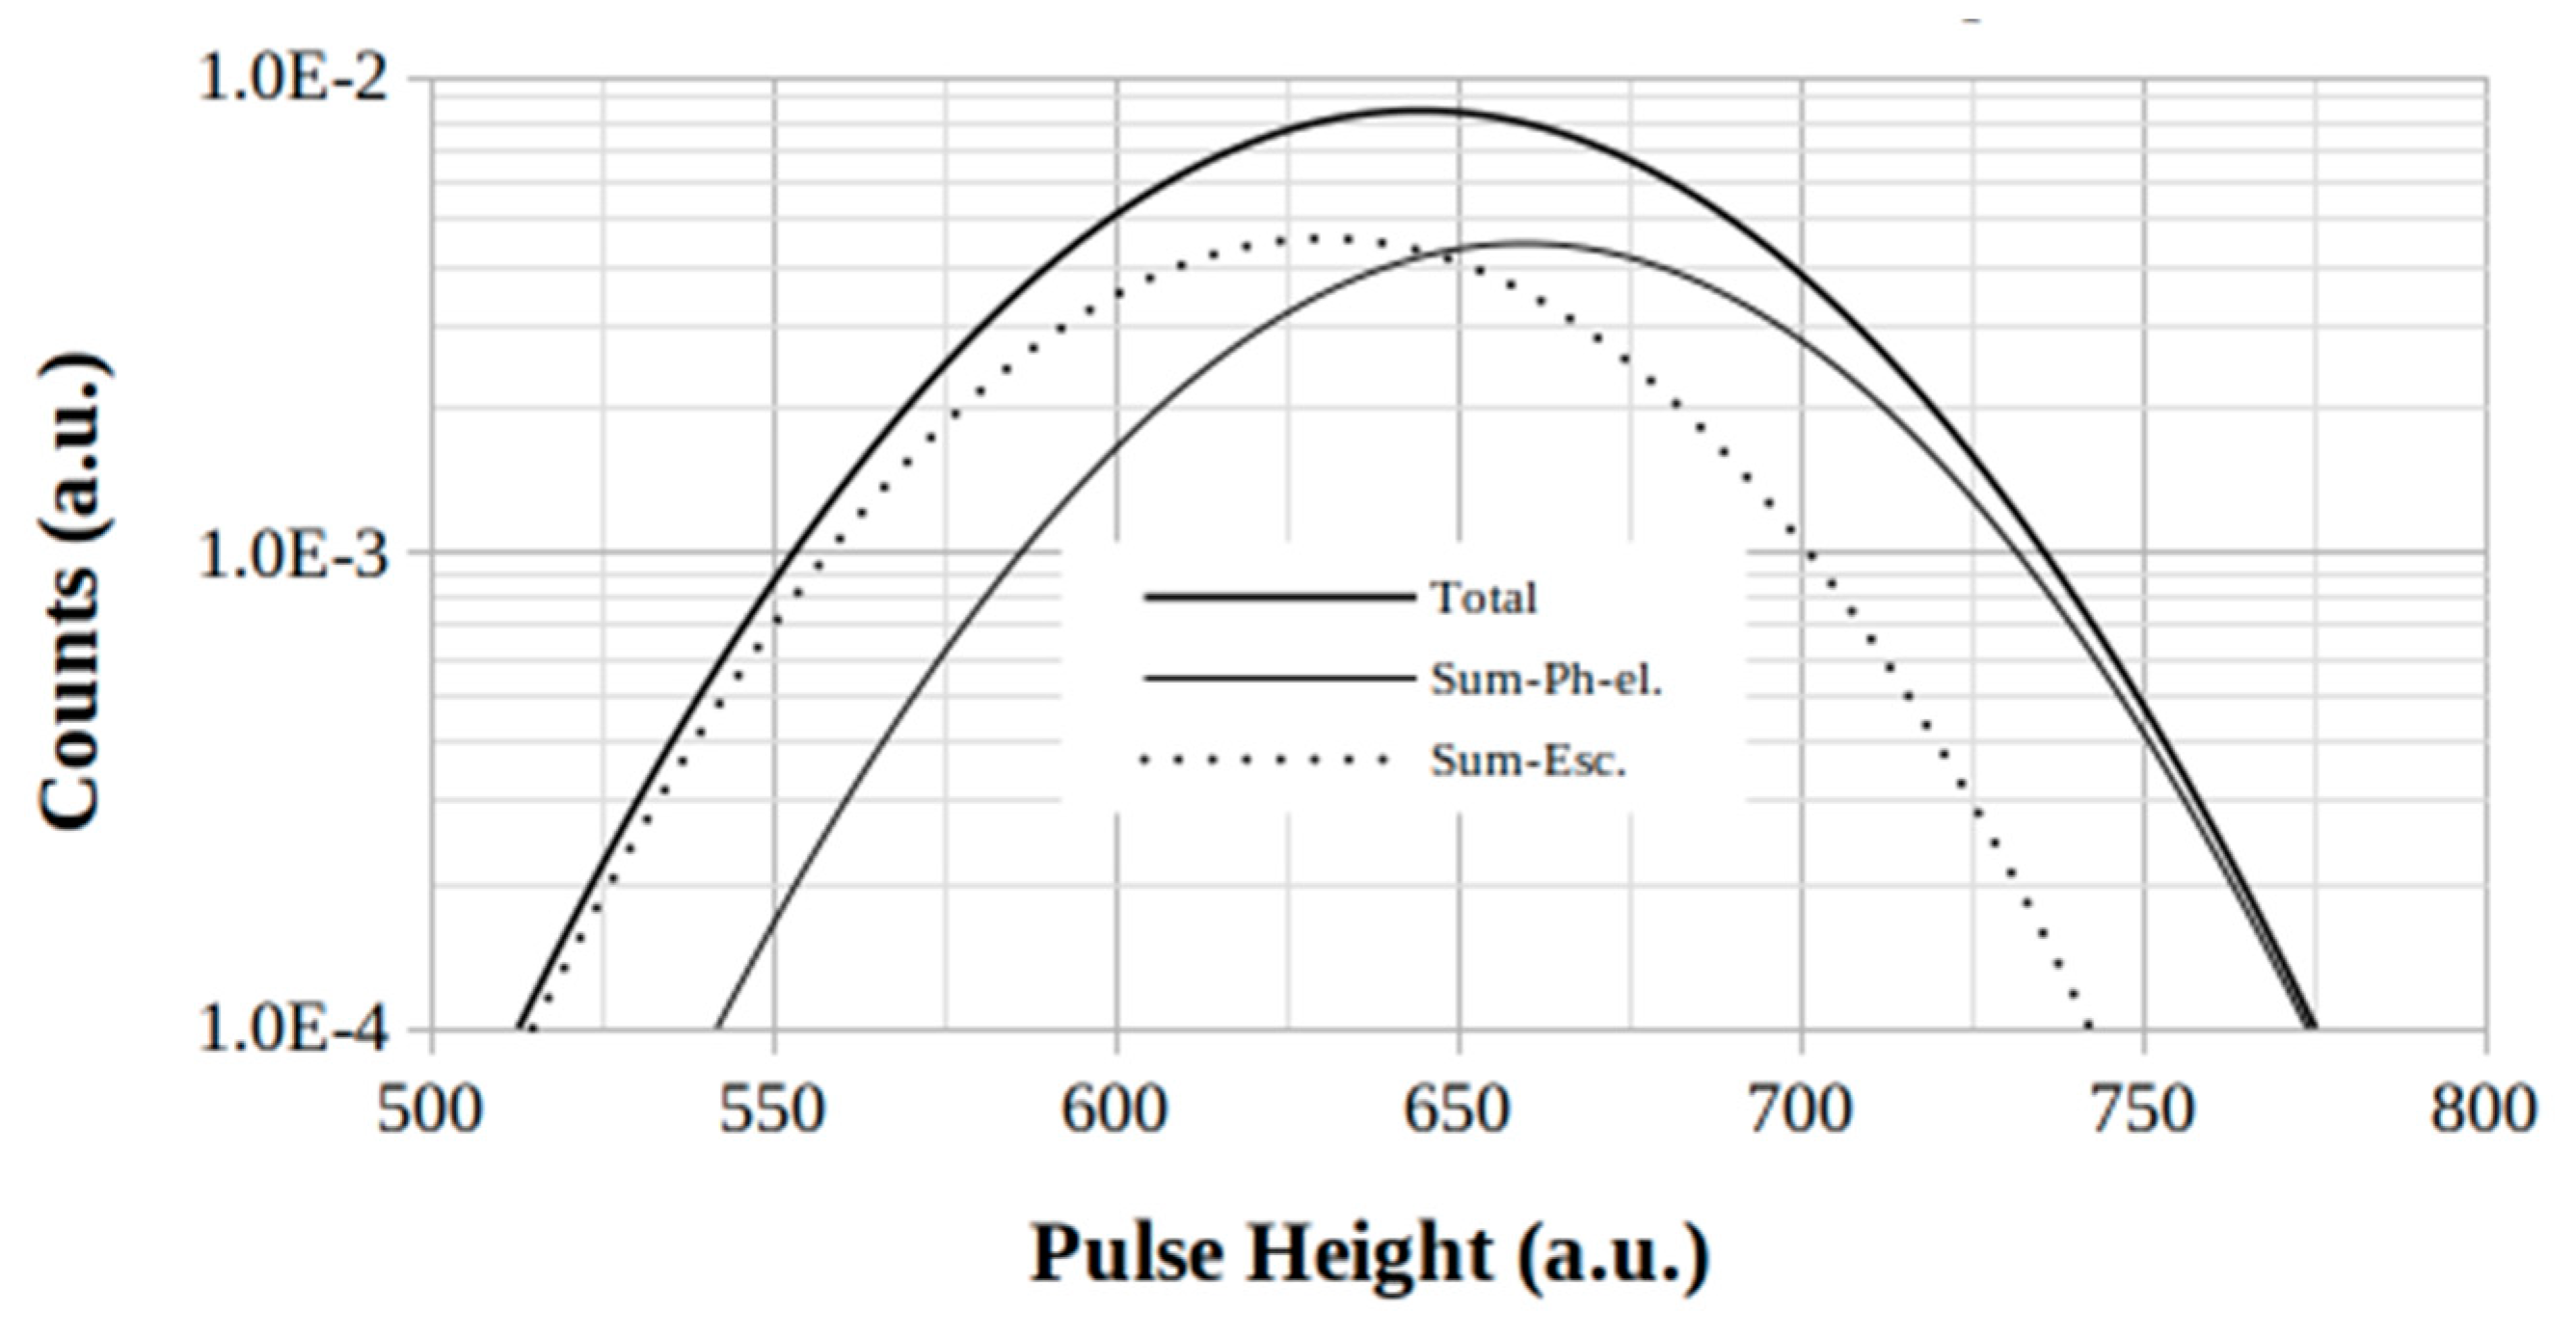
Figure 7.
Tc-99: NaI calculated energy resolution trend for the 140 keV RoI, and iodine-K Xray escape to photoelectric rate in the range from 0 to 50%.
Figure 7.
Tc-99: NaI calculated energy resolution trend for the 140 keV RoI, and iodine-K Xray escape to photoelectric rate in the range from 0 to 50%.
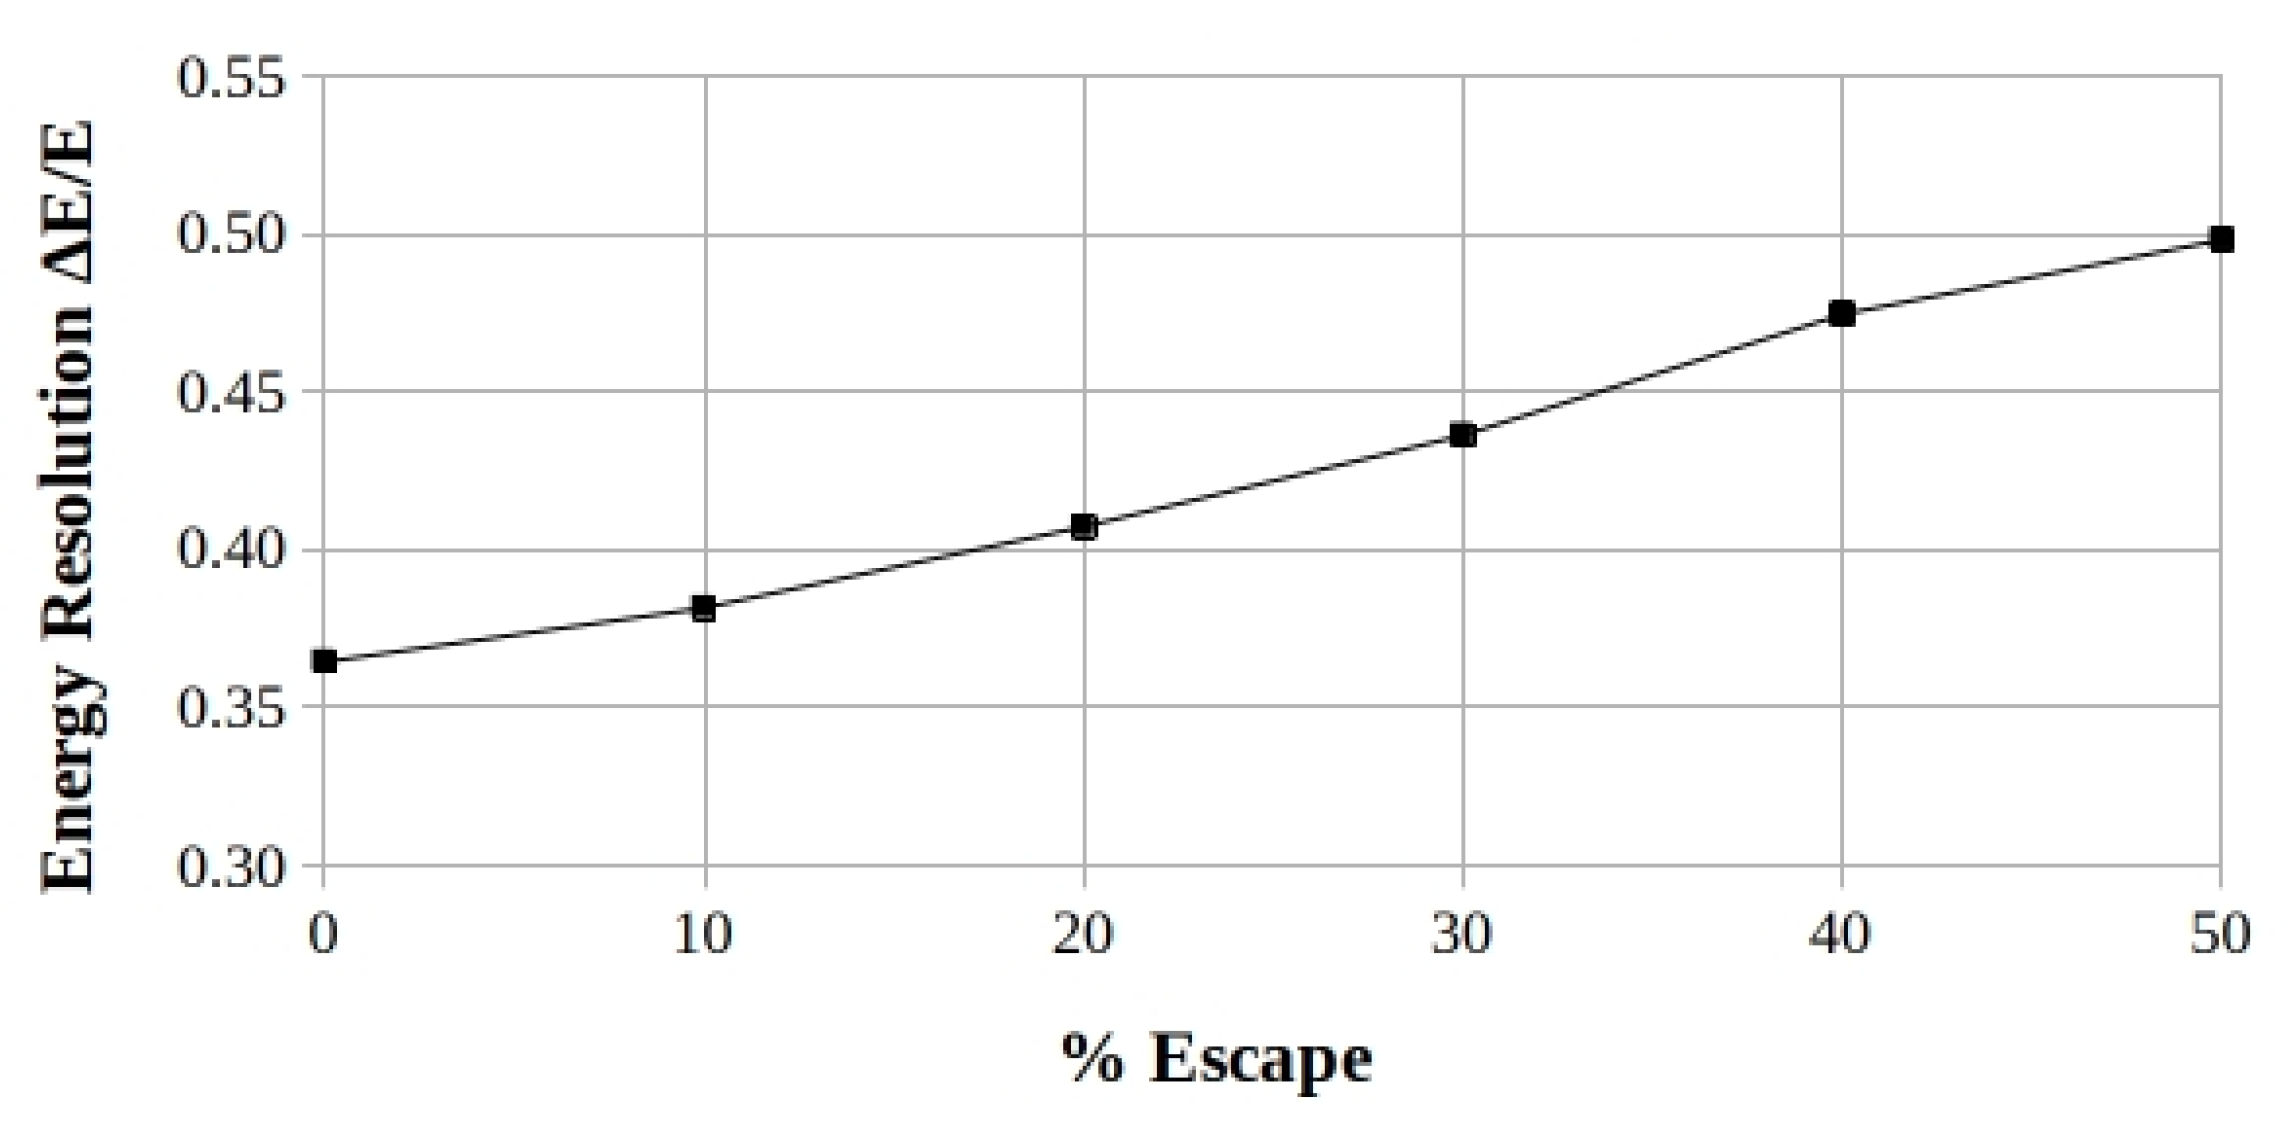
Figure 8.
F-18: NaI calculated energy resolution trend for the 511 keV RoI, and iodine-K Xray escape to photoelectric rate in the range from 0 to 50%.
Figure 8.
F-18: NaI calculated energy resolution trend for the 511 keV RoI, and iodine-K Xray escape to photoelectric rate in the range from 0 to 50%.
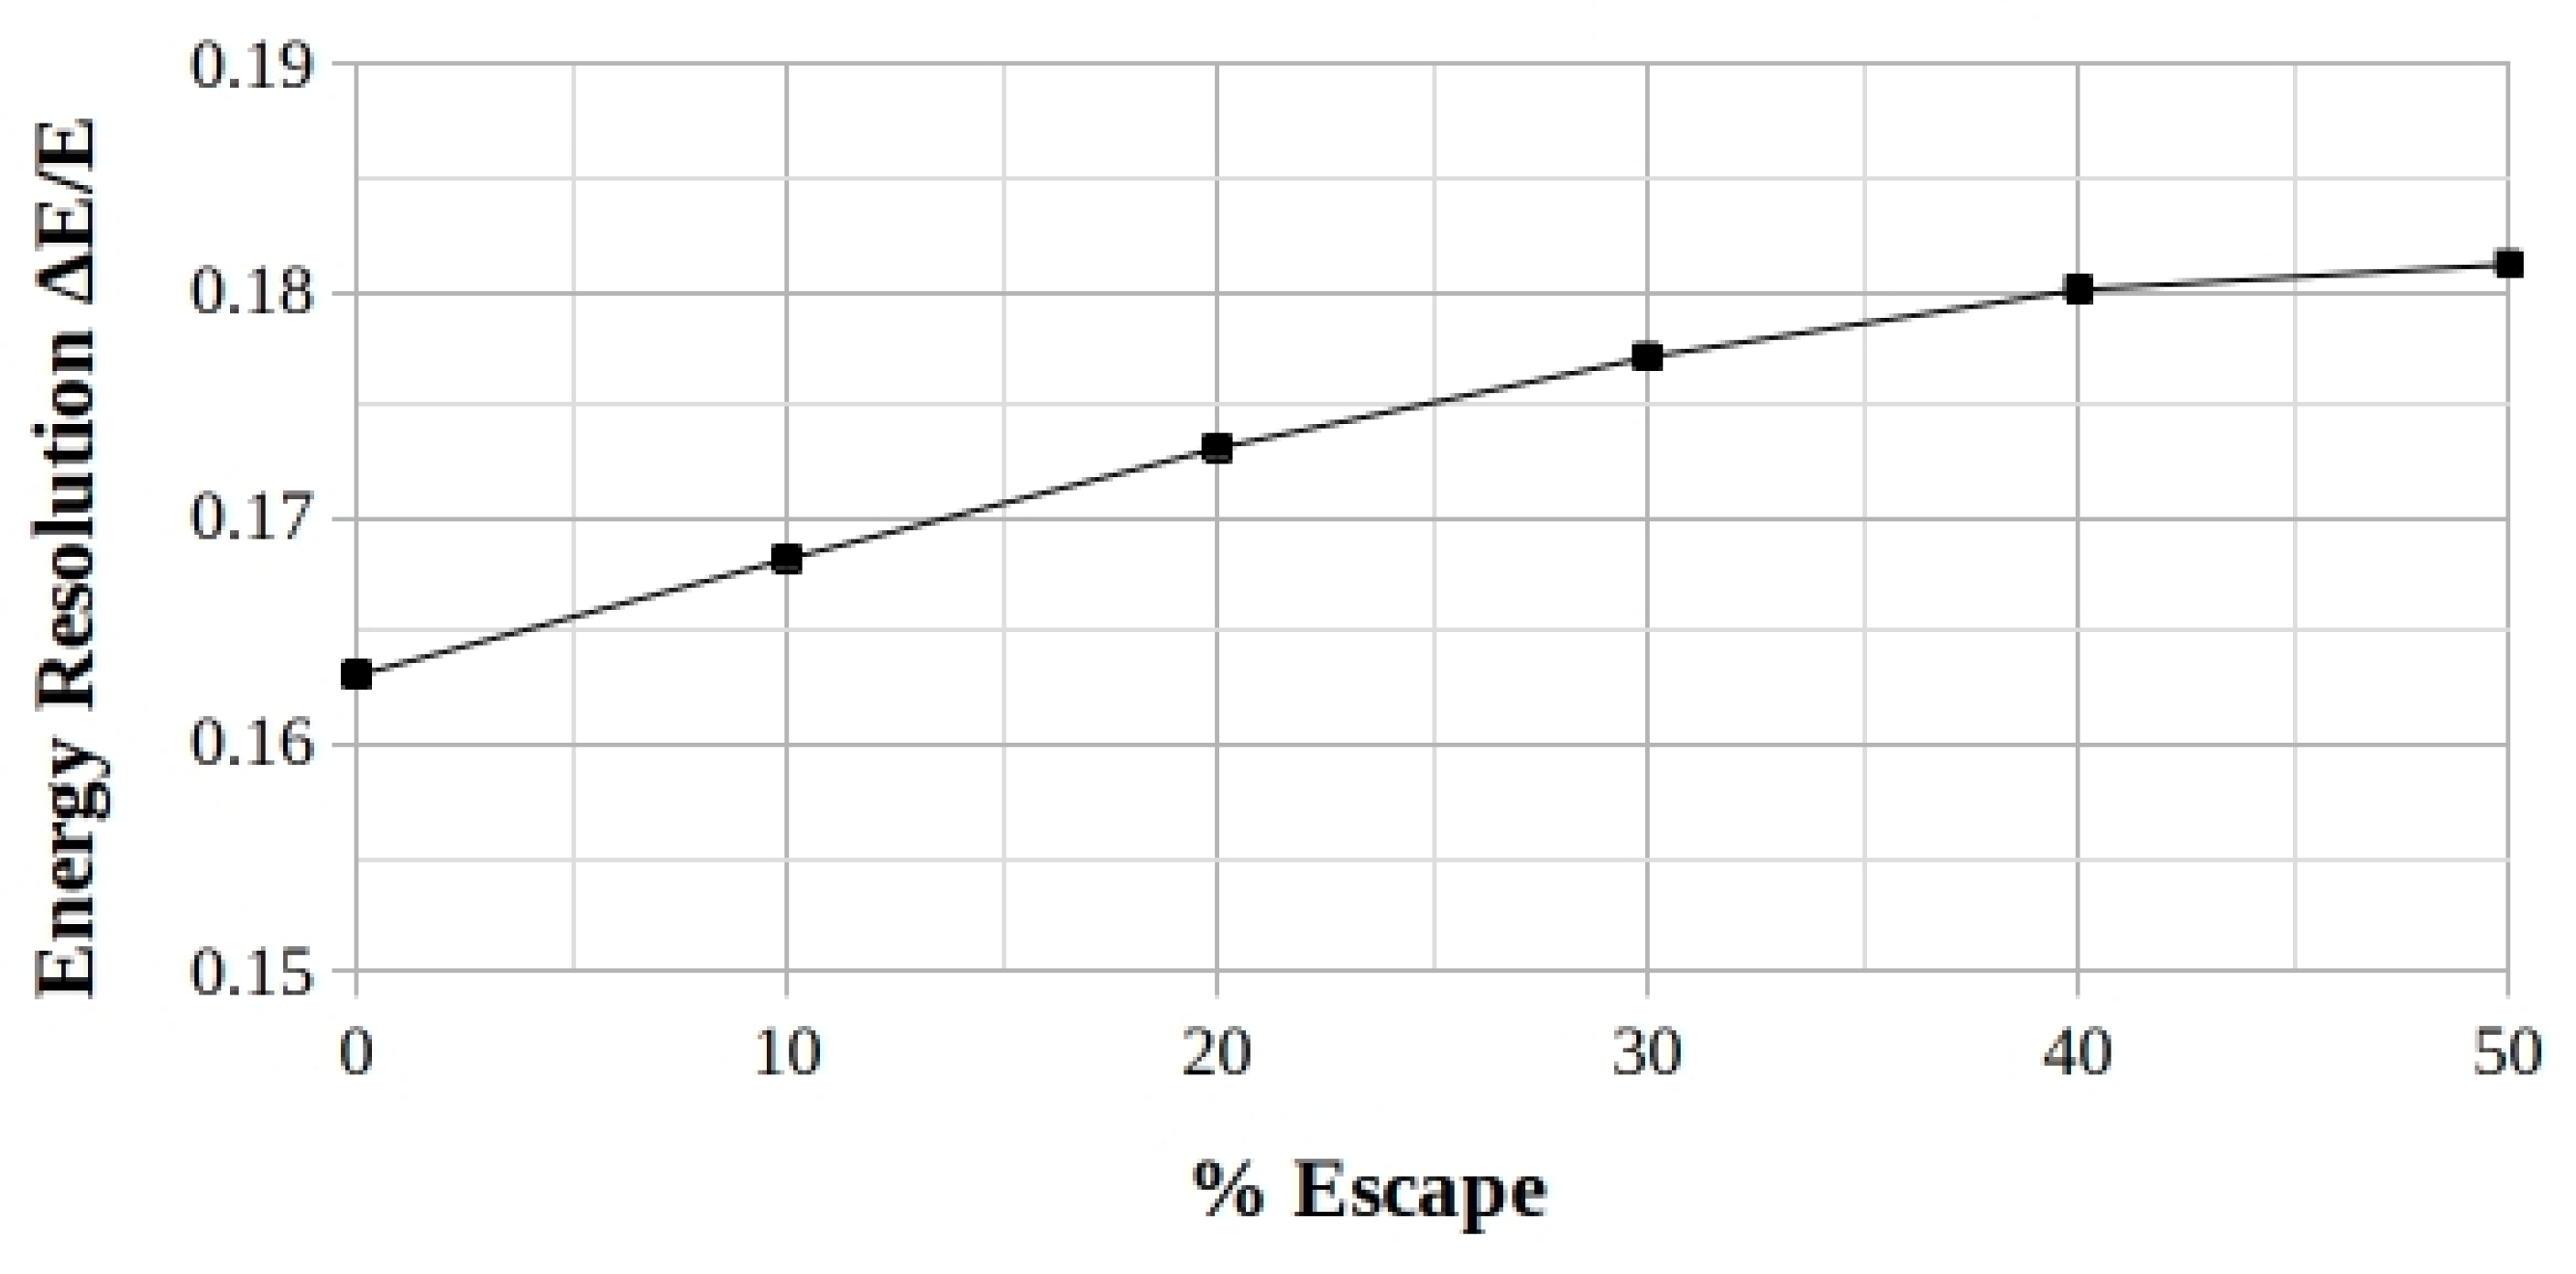
Figure 9.
Cs-137: NaI calculated energy resolution trend for the 662 keV RoI, and iodine-K Xray escape to photoelectric rate in the range from 0 to 50%.
Figure 9.
Cs-137: NaI calculated energy resolution trend for the 662 keV RoI, and iodine-K Xray escape to photoelectric rate in the range from 0 to 50%.
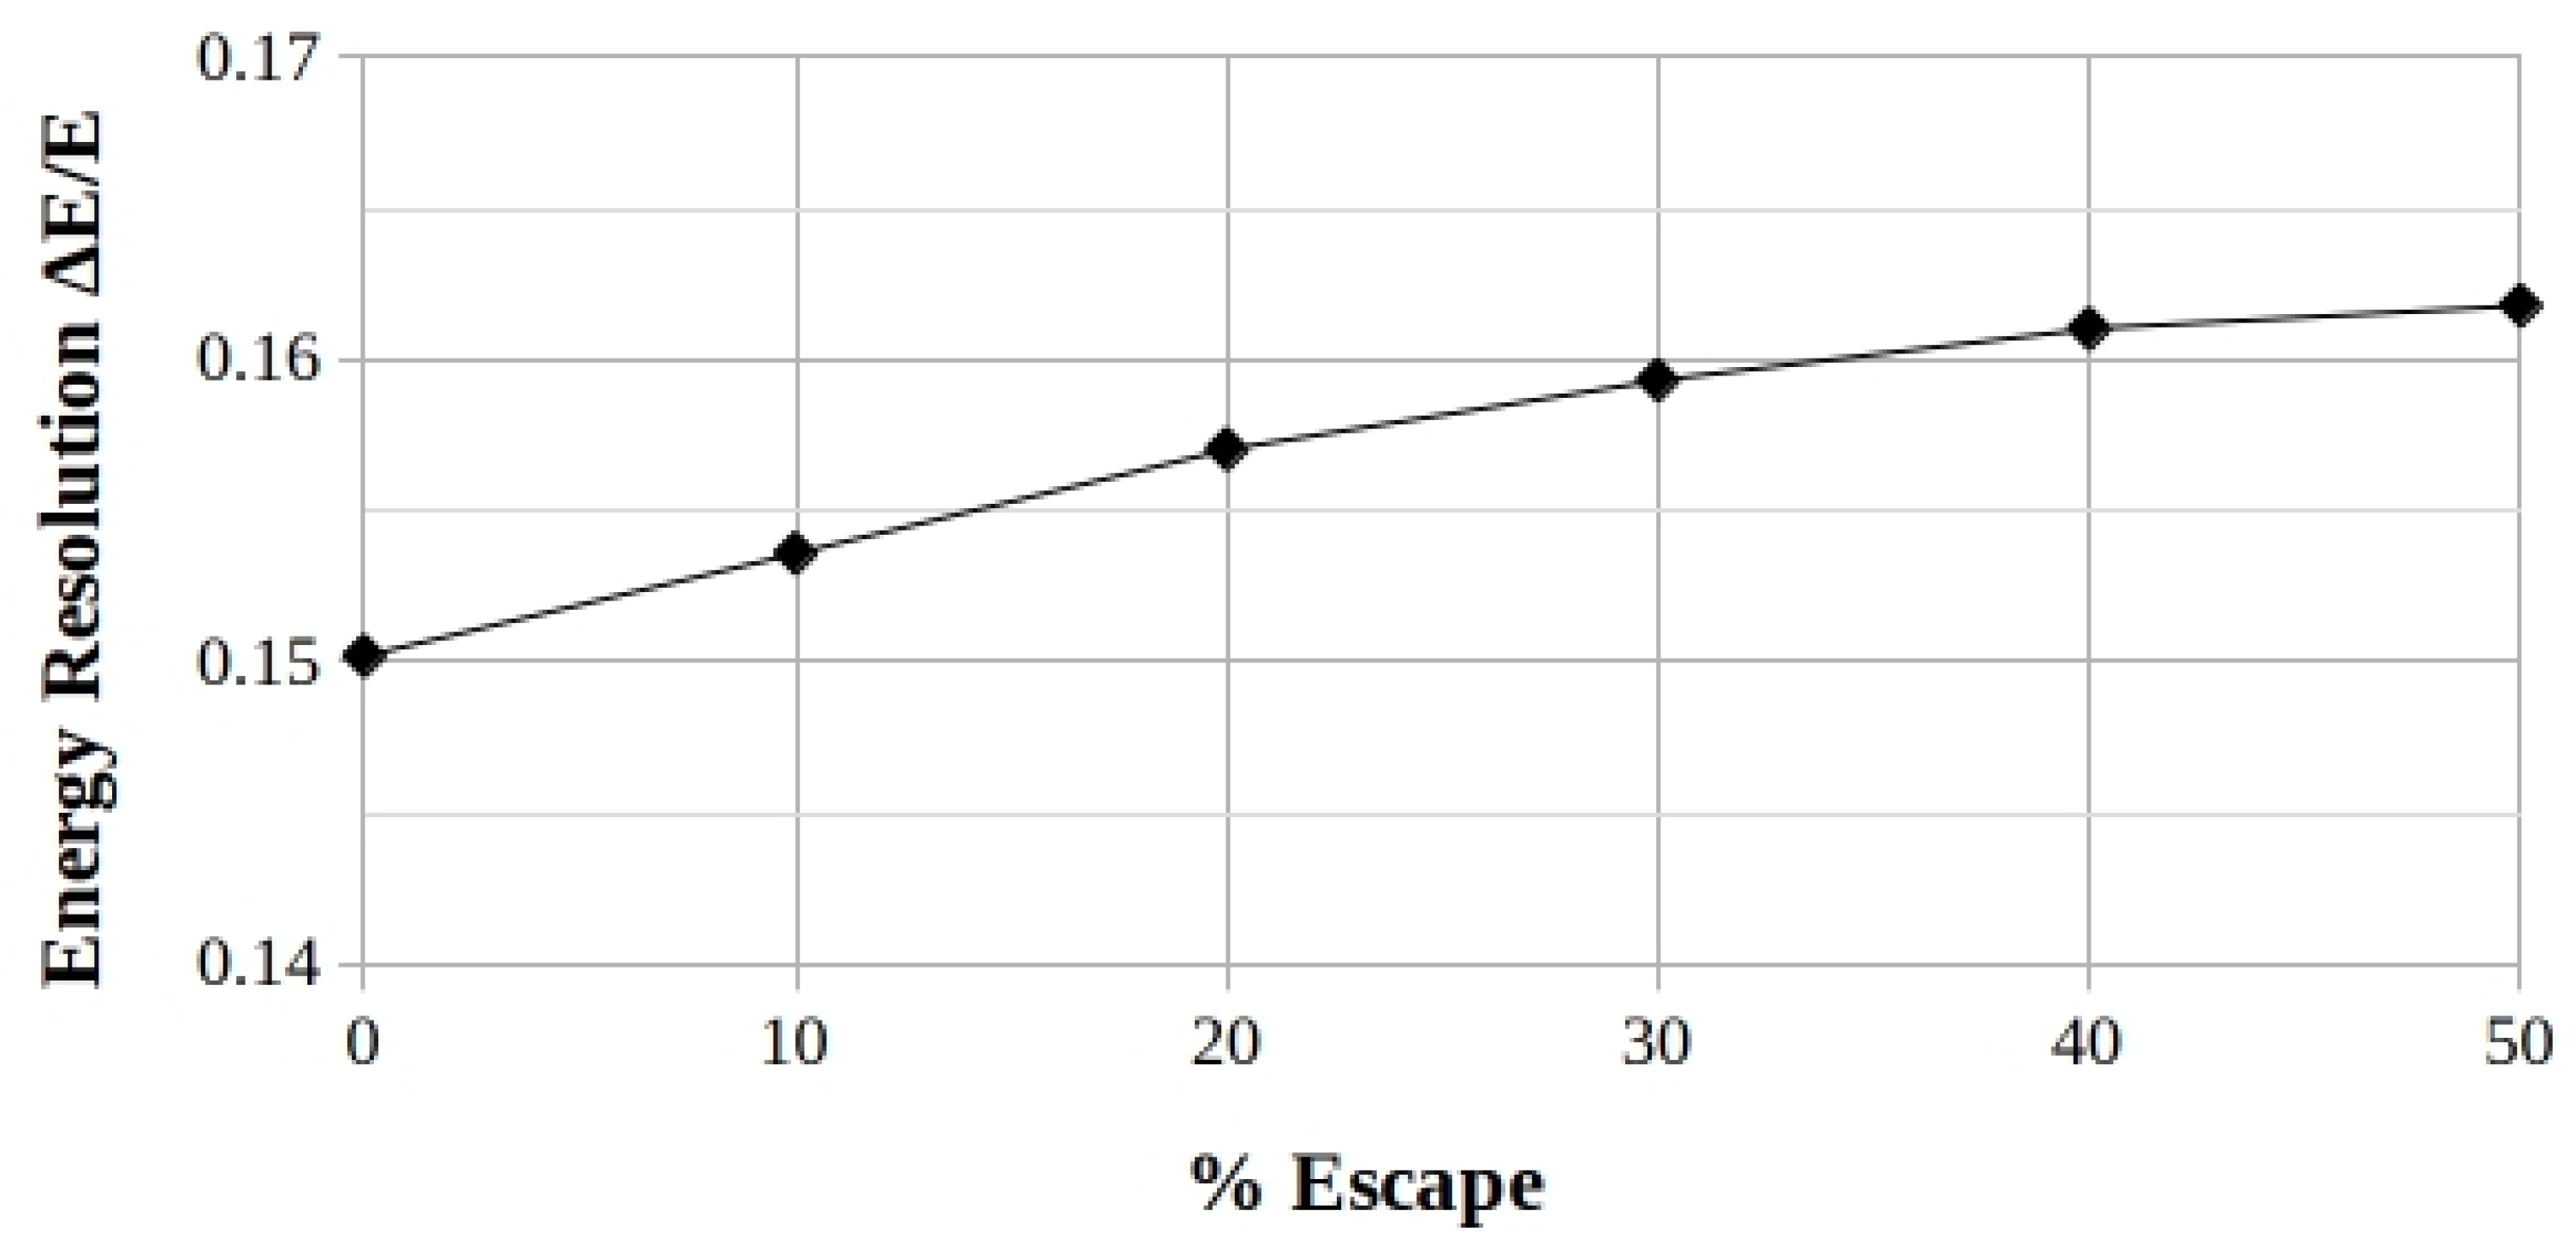
Figure A2.
Comparison of the trends of Vratio for the iodine-K X-rays from NaI as a function of the S/V for both the pixelated-parallelepiped- (top) and the monolithic-cylindrical-crystals (bottom). As one can note, the S/V ratio parameter seems failing to take into account of the differences in the size, in the their shape, as well as in the ECmp of the scintillator itself. In the other hand, the parallelepiped-crystals (upper curve) show a more marked tendency to favor the X-rays escape in comparison with the cylindrical-ones (lower curve).
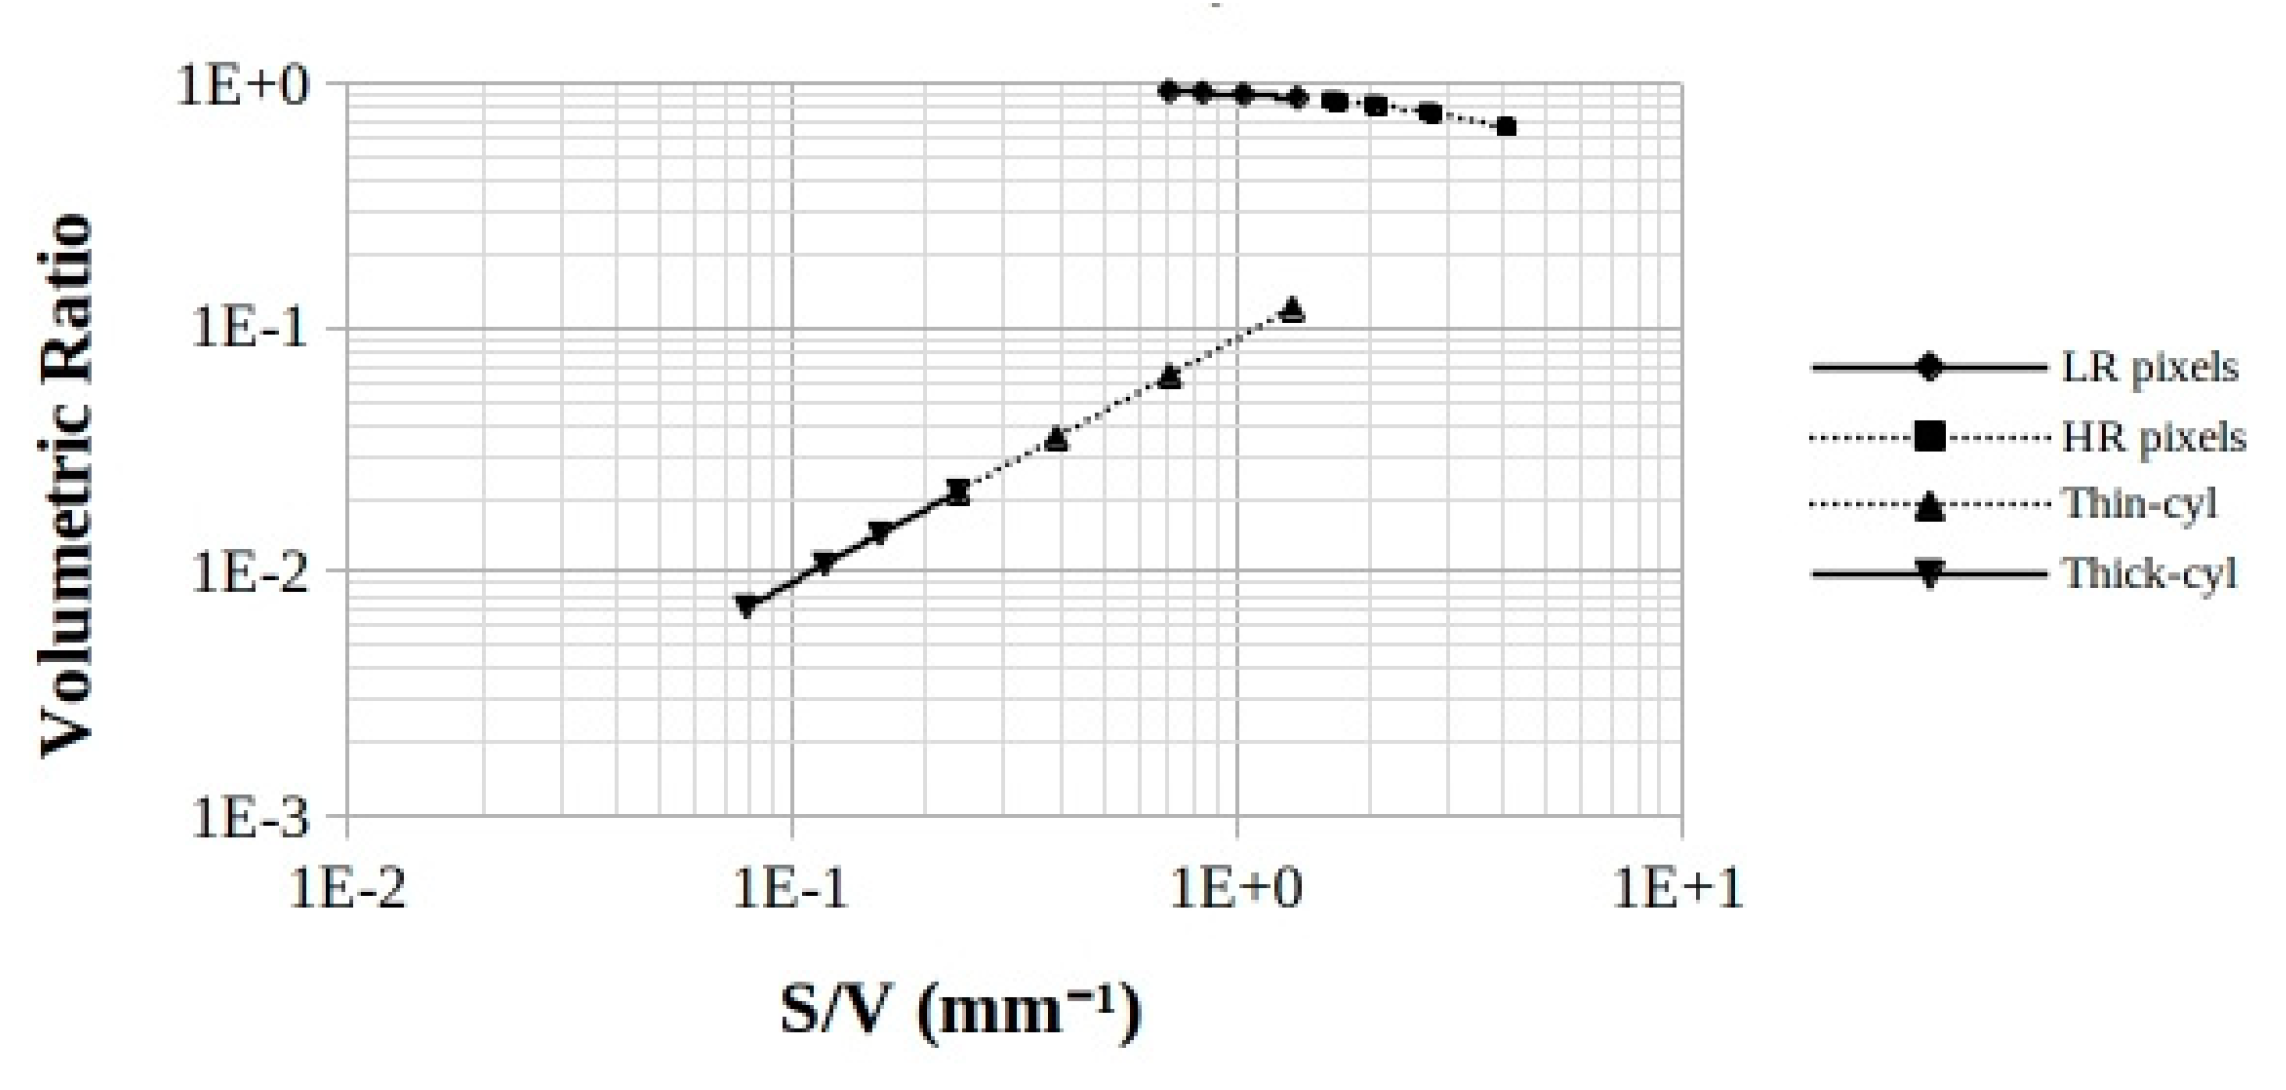
Table 1.
Elemental Composition of the NaI scintillator and fluorescence K-shell edge X-ray energy.
| Element | Z (atomic number) | ECmp (fraction by weight) | K-shell edge (keV) |
|---|---|---|---|
| Na | 11 | 0.153373 | 1.080 |
| I | 53 | 0.846627 | 33.168 |
Table 2.
keV) from the NaI scintillator components for the two innermost atomic shells and by ascending energy value, and associate quantities.
Table 2.
keV) from the NaI scintillator components for the two innermost atomic shells and by ascending energy value, and associate quantities.
| Element | Shell | Line Identification | Energy (keV) | ECmp × Intensity | Av. Energy weighted by EC × Intensity (keV) | Uncertainty(keV) |
|---|---|---|---|---|---|---|
| Na | K | Kα2 | 1.04 | 11.54 | 1.046 | 0.072 |
| Kβ3 | 1.07 | 2.30 | ||||
| I | L | Ll | 3.49 | 16.14 | 4.121 | 0.004 |
| Lα2 | 3.93 | 8.47 | ||||
| Lα1 | 3.94 | 76.20 | ||||
| Lβ1 | 4.22 | 84.66 | ||||
| Lβ4 | 4.26 | 16.93 | ||||
| Lβ3 | 4.31 | 28.84 | ||||
| Lβ2 | 4.51 | 5.03 | ||||
| Lγ1 | 4.80 | 5.29 | ||||
| Lγ3 | 5.07 | 4.23 | ||||
| K | Kα2 | 28.32 | 45.51 | 29.241 | 0.006 | |
| Kα1 | 28.61 | 84.66 | ||||
| Kβ2 | 32.24 | 8.47 | ||||
| Kβ1 | 32.30 | 16.93 | ||||
| Kβ3 | 33.05 | 4.77 |
Disclaimer/Publisher’s Note: The statements, opinions and data contained in all publications are solely those of the individual author(s) and contributor(s) and not of MDPI and/or the editor(s). MDPI and/or the editor(s) disclaim responsibility for any injury to people or property resulting from any ideas, methods, instructions or products referred to in the content. |
© 2023 by the authors. Licensee MDPI, Basel, Switzerland. This article is an open access article distributed under the terms and conditions of the Creative Commons Attribution (CC BY) license (http://creativecommons.org/licenses/by/4.0/).
Copyright: This open access article is published under a Creative Commons CC BY 4.0 license, which permit the free download, distribution, and reuse, provided that the author and preprint are cited in any reuse.


