Submitted:
07 August 2023
Posted:
08 August 2023
You are already at the latest version
Abstract
The fishmeal production industry is essential for providing protein for animal feed in the aquaculture sector. However, the industry faces challenges related to energy consumption and environmental sustainability. This study evaluates the energy efficiency and environmental benefits of waste heat recovery (WHR) technologies in a fishmeal production plant in Vietnam. Data were collected from the plant between 2016 and 2022, and a specific energy consumption (SEC) indicator and a comprehensive methodology were utilized. Implementing an economizer as a WHR technology resulted in a 55.5% decrease in SEC compared to the state before installation. The enhanced energy efficiency also translated to reduced energy consumption per output unit. Moreover, the economizer contributed to annual energy savings of 4,537.57 GJ/year and cost savings of $26,474.49. Additionally, carbon dioxide (CO2) emissions associated with producing one ton of fishmeal decreased by 58.37%. These findings highlight the potential for WHR technologies to improve energy efficiency and reduce the environmental footprint of fishmeal production. The study's results provide valuable insights for practitioners and policymakers in promoting energy efficiency practices and reducing environmental impact in the industry.
Keywords:
waste heat recovery technologies
; specific energy consumption (SEC)
; fish meal production
; energy efficiency practices
; environmental sustainability
1. Introduction
The fishmeal production (FMP) industry is critical in providing a valuable protein source for animal feed in the global aquaculture sector [1]. However, this industry faces significant challenges related to energy consumption, air pollution, and environmental sustainability [2]. The production process heavily relies on boilers, which consume substantial energy and release waste heat into the environment [3,4,5,6], contributing to greenhouse gas emissions and economic losses. In order to achieve sustainable development, fishmeal factories must explore solutions that enhance energy efficiency, recover waste heat, and minimize flue gas emissions.
Waste heat recovery (WHR) technologies have gained attention in various industrial sectors to improve energy efficiency and minimize environmental impacts [7,8]. By capturing and utilizing waste heat generated by industrial processes, WHR technologies offer benefits such as reducing energy consumption and addressing concerns related to greenhouse gas emissions. Implementing WHR technologies enables industries to improve operational sustainability while minimizing environmental footprint [7].
Several studies have demonstrated the benefits of WHR technologies in improving energy efficiency and reducing environmental impacts in different industries. For example, Singh and Dasgupta [9] studied waste heat utilization in a milk refrigeration plant, which substantially reduced carbon dioxide (CO2) emissions and total energy costs. Douvartzides and Karmalis [10] applied an Organic Rankine cycle to recover heat from exhaust gases, enhancing overall plant efficiency and reducing fuel consumption. Ganapathy [6] highlighted the advantages of using economizers for heat recovery boilers, such as energy savings and reductions in greenhouse gas emissions.
In the FMP industry, WHR technologies can improve energy efficiency and reduce the environmental footprint of these facilities. However, more scientific studies need to analyze the energy use efficiency and environmental benefits of implementing WHR technologies in FMP plants, particularly in developing countries.
The specific energy consumption (SEC) indicator has emerged as a valuable tool for assessing and improving energy efficiency in various industries [11,12]. SEC quantifies the amount of energy consumed per output unit, providing insights into the energy intensity of production processes [11]. It has been widely used to evaluate and enhance energy efficiency in different sectors [12,13]. However, its application in the FMP industry and its effectiveness in enhancing energy efficiency and sustainability require further research.
Given the limited research on the application and effectiveness of WHR technologies and the SEC indicator in the FMP industry, especially in developing countries like Vietnam, this study aims to fill this research gap. The study will conduct a comprehensive case study in Vietnam to evaluate the implementation of WHR technologies and the SEC indicator in a fish meal production plant. The objective is to assess the potential for improving energy efficiency through WHR technologies in the FMP process and quantify the energy savings and reductions in greenhouse gas emissions achieved by implementing WHR technologies.
The findings of this study will contribute valuable insights to the scientific community, providing evidence on the effectiveness of WHR technologies and the SEC indicator in enhancing sustainability in the FMP industry. The results and recommendations derived from this study can guide practitioners and policymakers in the fish meal production industry towards implementing energy-efficient practices and reducing environmental impact. Moreover, focusing on a developing country context adds to the existing body of knowledge, predominantly based on studies conducted in developed countries.
2. Materials and Methods
2.1. Case Study Selection in Vietnam
This study focuses on the Khanh Hoang Seaprexco Ltd. (KHS) factory, one of Vietnam’s largest fishmeal factories. The factory is located in Tran De town, Soc Trang province, within the Mekong Delta region of Vietnam. The KHS factory specializes in FMP and has an annual capacity of 12,500 tons [14]. It utilizes pangasius byproducts to produce fishmeals and operates various energy-consuming equipment, including a water pump, a grinder, a fan, and a boiler. Among these, the boiler is the most energy-intensive equipment and uses biomass, such as rice-husk pellets, as its fuel source. In late 2017, an economizer, a waste-heat recovery (WHR) technology, was installed on the boiler flue-gas system to enhance energy efficiency.
2.2. Description of FMP Process
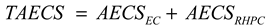
The FMP process at the KHS factory involves four main steps, as illustrated in Figure 1. Initially, the fish processing byproducts are indirectly heated by steam from the dryer’s boiler (step 1). The byproducts are then classified by a screening machine (step 2). In the third step, the screened products are crushed into pellets (step 3). Finally, the pellets undergo a cooling process in the fourth stage (step 4).
2.3. Implementation of Boiler and Waste Heat Recovery Technologies
2.3.1. Boiler Technology
The boiler is a critical component in the FMP process at the KHS factory and consists of two essential parts: the combustor and the heat exchanger (Figure 2). The combustor facilitates controlled biomass fuel combustion, such as rice husk pellet (RHP). Burners introduce RHP into the combustion chamber and mix them with the appropriate air flow for combustion. The combustion process generates significant heat, which is transferred to the surrounding water.
The heat exchanger complements the combustor by facilitating the transfer of heat generated in the combustor to the water, resulting in steam production. It typically consists of a long coiled or arranged serpentine-like pipe to increase the surface area and optimize heat transfer. The heated water from the heating system circulates through the heat exchanger, gradually absorbing the heat from the combustion process and increasing in temperature.
Combining the combustion chamber and the heat exchanger enables the boiler system to efficiently convert the energy derived from fuel combustion into heat energy. This heat energy is transferred to the water, resulting in steam production. The resulting steam indirectly heats the fish processing byproducts (step 1).
2.3.2. Waste Heat Recovery Technologies
To further enhance the energy efficiency of the FMP process at the KHS plant, an economizer, as a waste heat recovery (WHR) technology, was installed in the boiler system at the end of 2017 (Figure 3). The economizer is a heat exchanger device that recovers waste heat from the flue gases generated during the combustion process in the boiler. This recovered heat is then used to preheat the feed water, a key step in the boiler operation.
The key characteristics and functions of the economizer are as follows:
Heat Recovery: The economizer is designed to recover waste heat from the hot flue gases, which would otherwise be released into the atmosphere. By capturing this waste heat, the economizer effectively utilizes it for a helpful purpose, specifically for preheating the feed water.
Improved Energy Efficiency: By preheating the feed water, the economizer reduces the energy required to bring the water to the desired temperature for steam production. This leads to improved energy efficiency in the FMP process [12]. As a result, the specific energy consumption (SEC) is reduced, and the production plant becomes more energy-efficient.
Reduction in CO2 Emissions: As a direct consequence of reduced energy consumption, installing the economizer leads to a substantial decrease in CO2 emissions. Burning rice husk pellets for steam generation is a significant source of CO2 emissions in fish meal production [15]. By optimizing energy use and reducing the consumption of rice husk pellets, the economizer helps to mitigate the release of CO2 into the atmosphere, making the production process more environmentally friendly.
Process Integration: The economizer is integrated into the boiler system as a heat transfer component. It allows the hot flue gases to pass through its coils while the feed water flows through the interior of these coils. This arrangement facilitates efficient heat exchange between the two streams, maximizing waste heat recovery and minimizing heat losses.
Cost Savings: Apart from its environmental benefits, the economizer contributes to cost savings for the fish meal production plant. By reducing energy consumption and optimizing the use of rice husk pellets, the plant’s energy costs are minimized, leading to economic benefits and enhancing the overall sustainability of the operation.
2.4. Data Collection and Analysis
2.4.1. Data Collection
Data collection for this study involved two primary methods: direct data collection from the KHS factory and secondary data collection from published studies.
Direct data collection from the KHS factory consisted of three field surveys conducted by the research team in December 2017, December 2018, and June 2023. These surveys involved observing the factory’s operations and gathering information on the structure and operation of the boiler and energy saver. Figure 1, Figure 2, and Figure 3 were created based on these observations. Moreover, we collected monthly data on fishmeal output (FMO), electricity consumption (EC), and rice husk pellets consumption (RHPC) for seven years, divided into two phases: before the installation of the economizer (2016-2017) and after the installation of the economizer (2018-2022), from factory reports. Detailed data collected from the field can be found in Section 1 of the Supporting Information.
Secondary data collection involved reviewing published documents to obtain the necessary data for calculating total annual energy savings (TAES) from heat recovery, CO2 emissions to the environment, annual energy savings (AES), and annual energy cost savings (AECS) resulting from the economizer system installation at the KHS factory. The secondary data involved using default emission factors (EF) of CO2 based on fuel type, the percentage of heat lost through flue-gas system (%f), the efficiency of the heat recovery system (%HR), and the price of electricity/RHP in Vietnam. The specific details of the secondary data are presented in Section 2 of the Supporting Information.
2.4.2. Data Analysis
The data-analysis process in this study involves several steps, including data visualization and examination, calculation of total energy consumption (TEC), determination of the specific energy consumption (SEC), examination of the difference in the SEC index, calculation of AES, estimation of AECS, and calculation of CO2 emissions. Each step is described sequentially.
2.4.2.1. Visualizing and Analyzing the Collected Data
The collected data from the field (FMO, EC, and RHPC) were visualized using the Textable function in the Tableau Public platform. This approach represented the data as rectangular shapes, with the colour of each rectangle reflecting its corresponding values.
This study employed the qqnorm function in R to generate and analyze QQ plots, aiming to evaluate the conformity of the collected data from the KHS factory (FMO, EC, and RHPC) to a normal distribution or its approximation. The procedure for utilizing the qqnorm function is detailed in Section 4.1 of the Supporting Information.
2.4.2.2. Calculation of Total Energy Consumption
Total energy consumption (TEC) in this study refers to the overall energy consumed during the operation of the KHS factory, including electricity and rice-husk pellets. TEC is calculated as the sum of EC and RHPC using Equation (1).
where: TEC represents the total energy consumption measured in gigajoules (GJ). EC denotes the electricity consumption by the KHS factory measured in gigajoules (GJ). RHPC signifies the amount of RHP consumed by the factory measured in gigajoules (GJ).
TEC = EC + RHPC
2.4.2.3. Calculation of Specific Energy Consumption
Specific energy consumption (SEC) in this study refers to the energy required to produce one ton of fishmeal at the KHS factory. The SEC index at the KHS factory is calculated monthly and averaged yearly for seven years (2016-2022). It is determined by dividing the total energy consumed (TEC) by the fishmeal output (FMO) according to Equation (2).
The unit used for SEC is GJ/ton, TEC is measured in GJ, and FMO is measured in tons.
2.4.2.4. Examination of the Difference in the SEC Index
An independent t-test is conducted using the R software to compare the average SEC index before (2016, 2017) and after (2018, 2019, 2020, 2021, and 2022) the economizer installation at the KHS factory.
2.4.2.5. Analyzing the Linear Correlation among Indices
The Pearson correlation coefficient is used to analyze the linear correlation among five indices (FMO, EC, RHPC, TEC, and SEC). The Pearson correlation coefficient measures the degree of linear correlation between two variables, ranging from -1 to +1. A coefficient close to -1 or +1 indicates a strong correlation, while a coefficient near 0 suggests a lack of significant linear correlation. The Pearson correlation analysis is conducted using the R software. The specific command structure is presented in Section 4.3 of the Supporting Information.
2.4.2.6. Calculation of Annual Energy Savings
The annual energy savings (AES) refer to the amount of energy that the KHS factory has saved through the installation of the economizer. This study aims to calculate the AES achieved by the KHS factory from 2018 to 2022, separately for each specific energy source (EC and RHPC) and for the overall energy savings. The AES is calculated using Equations (3)–(5), and a detailed breakdown of the calculation process can be found in Table S3.3, Section 3, which is provided as Supplementary Information.
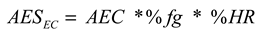
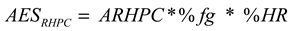
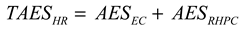 where: AESEC is the annual energy savings from electricity consumption (GJ/year), AEC is the annual electricity consumption at the KHS factory (unit: GJ), %fg is the percentage of heat lost through flue gas (unit: %), %HR is the efficiency of the heat recovery system (unit: %); AESRHPC is the annual energy savings from rice husk pellet consumption (GJ/year), ARHPC is the annual rice husk pellet consumption at KHS factory (unit: ton); TAESHR is the total annual energy savings from heat recovery (GJ/year).
In this study, the measurement or estimation of two parameters, namely the heat loss through flue gas (%fg) system and the efficiency of the heat recovery system (%HR), was not conducted due to practical constraints and limitations within the scope of the research. Direct measurements or estimations of these parameters would have required substantial resources, including time and specialized equipment, which were unavailable for this study. Consequently, credible literature sources were consulted to overcome these limitations and obtain values for %fg and %HR.
One relevant study conducted by Willems [16] focused on advanced system controls and energy savings for industrial boilers. This research provided an overview of boiler systems, including their components and typical heat losses. The efficiency of a boiler was assessed through input/output calculations, considering factors such as fuel input, steam output, and heat losses. The study also discussed advanced developments in boiler technology, such as using extended heat transfer surfaces, energy savings from heat recovery, and computational fluid dynamics. Within this study, the researchers reported that 18% of the heat is lost through the exhaust gas system (%fg = 18), while the heat-recovery system achieved an efficiency of 30% (%HR = 30). These values contributed to understanding energy savings obtained through advanced system controls and heat recovery systems.
Although the use of cited values introduces a certain level of uncertainty, it allowed this study to make preliminary assessments and gain valuable insights into the potential energy savings achievable through heat-recovery systems in the specific context of the KHS factory system. Future research endeavours can aim to investigate these parameters through on-site measurements or numerical estimations to enhance the precision and reliability of the analysis.
2.4.2.7. Calculation of Annual Energy Cost-Savings (AECS)
The annual energy cost-savings (AECS) refers to the monetary value the KHS factory saves annually from reducing energy consumption, specifically EC and RHPC, by implementing an economizer. This research aims to calculate three indices about the energy cost-savings at the KHS factory between 2018 and 2022. These indices encompass the AECS derived from electricity consumption (AECSEC), the AECS from rice husk pellet consumption (AECSRHPC), and the total AECS encompassing all forms of energy consumption (TAECS). The calculation of the annual cost savings utilizes the AES data mentioned in section 2.4.2.6, in conjunction with the prevailing electricity and rice husk pellet prices in Vietnam. To determine the AECS, Equations (6)–(8) are applied The detailed calculation process is provided in Table S3.4 in the Supplementary Information.
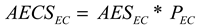
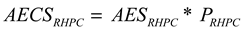
 where, AECSEC is calculated in USD, AESEC is calculated in GJ, PEC is the price of electricity consumption in USD per kilowatt-hour (unit: USD/GJ); AECSRHPC is calculated in USD, PRHPC is the price of one kg of rice husk pellet consumption (unit: USD/kgRHPC). TAECS is calculated in USD.
2.4.2.8. Calculation of CO2 Emissions
CO2 emissions are calculated using the Intergovernmental Panel on Climate Change (IPCC) guidelines [6], considering emission factors specific to the fuel types and the national grid emission factor for electricity consumption in Vietnam in 2018 [7]. The calculation of CO2 emissions from biomass utilization and electricity consumption are outlined in Equation (9), and a comprehensive breakdown of the calculation process can be found in Table S3.5 in the Supplementary Information.
where, CO2 (emission) is emission of CO2 by type of fuel (kgCO2). Nfuel is the amount of fuel combusted (TJ), and EFfuel is the default emission factor of CO2 by type of fuel (kgCO2/TJ).
3. Results
3.1. Overview of Fishmeal Output and Energy Consumption from 2016 to 2022
Figure 4 presents data on fishmeal output (FMO) and energy consumption (EC and RHPC) at the KHS factory from 2016 to 2022. Figure 4a focuses on monthly FMO production, showing that the minimum production was 149 tons in February 2016, while the maximum production reached 1,476 tons in September 2019. FMO production decreased in February and March but consistently increased in August and September each year. The annual averaged FMO at the KHS factory increased from 387 tons in 2016 to 954 tons in 2022.
Figure 4b illustrates monthly electricity consumption (EC) at the KHS factory from 2016 to 2022. The lowest EC occurred in March 2022 (4,440 kWh), while the highest was recorded in September 2019 (203,607 kWh). Like FMO production, low EC was observed in February and March, while high consumption was observed in September and October. The annual EC showed a gradual increase from 2016 to 2019, followed by a slight decrease in 2021 and a slight increase in 2022.
Figure 4c presents monthly rice husk pellet consumption (RHPC) data at the KHS factory from 2016 to 2022. The lowest RHPC was observed in January 2019 (251 tons), while the highest consumption occurred in May 2017 (734 tons). January consistently exhibited the lowest RHPC, while May and June generally showed the highest levels. The average monthly RHPC consumption ranged from 433.9 to 491.9 tons.
The QQ plot-analysis results in Figure 5 demonstrate that the data from the KHS factory, including FMO, EC, and RHPC, closely resemble a normal distribution, as the data points cluster around the standard reference line.
3.2. Total Energy Consumption and Specific Energy Consumption
Figure 6 shows the monthly total energy consumption (TEC) at the KHS factory from 2016 to 2022. The TEC varied significantly, ranging from 3,927 to 10,988 GJ. The lowest TEC value was recorded in January 2016, while the highest was observed in May 2017. The TEC index followed a similar pattern to the RHPC and EC indices, with lower values during winter (mainly January) and higher values during summer (April to September). After installing the economizer, the annual TEC index decreased compared to the period before installation.
Figure 7 displays the specific energy consumption (SEC) index for the KHS factory from 2016 to 2022. The SEC values ranged between 3.39 and 52.30 during this period. The lowest SEC value occurred in September 2019, while the highest was observed in February 2016. Overall, the SEC values showed a decreasing trend from 2016 to 2022 (with exception of 2021). The monthly average SEC was highest in 2016 and lowest in 2022. The average monthly SEC index before installing the WHR technology (2016-2017) was 263, while for the period after installation (2018-2022), it was 117, representing a 55.5% decrease.
3.3. Correlations between Indicators and Difference in SEC before and after Economizer Installation
3.3.1. Analysis of the Correlation between Indicators
The correlation analysis examined the interrelationships among five indices: FMO, EC, RHPC, TEC, and SEC at the KHS factory from 2016 to 2022. The results in Figure 8 reveal a robust positive linear correlation between the TEC and RHPC indices, with a correlation coefficient 1. On the other hand, a weak correlation was observed between the TEC and EC indices, with a correlation coefficient of 0.11. A strong negative correlation was also found between the SEC and FMO indices, with a correlation coefficient of -0.78. However, the TEC index did not exhibit any significant linear correlation. Furthermore, no meaningful correlations were observed among the remaining pairs of indices.
3.3.2. Analysis of the Difference in SEC Before and After Economizer Installation
Table 1 presents the t-test results conducted to analyze the difference in average SEC values at the KHS factory between the periods before (2016 and 2017) and after (2018, 2019, 2020, 2021, and 2022) the installation of the economizer. The findings indicate statistically significant differences in the SEC index between the two periods, with t-test values ranging from 2.43 to 3.92 and p-values less than 0.05. The SEC index before the economizer installation consistently exceeded the values observed after the installation, with mean differences ranging from 9.87 to 13.20 and a 95% confidence interval from 1.42 to 20.83.
3.4. Energy and Economic Savings through the Implementation of Waste Heat Recovery technologies
3.4.1. Energy Savings
Figure 9 visually represents the annual energy savings (AES) achieved by implementing an economizer at the KHS factory. The AES values were computed using the methodologies discussed in Section 2.4.2.6. The results indicate that, on average, the economizer contributed to energy savings of 4,537.57 GJ/year. These savings fluctuated slightly, ranging from 4,292.92 GJ/year in 2019 to 4,804.79 GJ/year in 2021. Most of the achieved savings, ranging from 95.82% to 97.06%, were attributed to energy recovery from RHPC. Specifically, the AES resulting from the RHPC amounted to 4,373.55 GJ/year, while the AES derived from EC accounted for 164.02 GJ/year.
3.4.2. Annual Energy Cost Savings
Table 2 illustrates the annual energy cost savings (AECS) achieved by the KHS factory after implementing of the economizer. The AECS values were determined utilizing the methodologies expounded upon in Section 2.4.2.7. The outcomes, derived from the aggregate AES obtained through heat recovery and the prevailing prices of electricity and RHP each year, reveal that the KHS factory attains an average annual savings of $26,474.49. The lowest savings were recorded in 2019 at $25,804.84, while the highest was in 2021 at $27,194.49. A substantial majority of the savings, exceeding 95% of the total, were realized through reduced RHPC.
3.5. Reductions in CO2 Emissions
The bar chart in Figure 10 depicts the yearly release of CO2 emissions into the environment due to the consumption of electricity and RHP at the factory from 2016 to 2022. The calculation of annual CO2 emissions was performed using the methodologies outlined in Section 2.4.2.8. The findings reveal that the recorded CO2 emissions ranged between 8,459.87 and 9,985.92 tons/year, with the lowest emissions observed in 2019 and the highest in 2017. The consumption of RHP substantially contributed to most CO2 emissions, accounting for approximately 90% to 93.7% during the specified years. Notably, there was no significant fluctuation in CO2 emissions before and after the installation of the economizer, with emissions amounting to 9,736.2 tons and 8,869.5 tons/year, respectively, resulting in an 8.9% reduction.
The line chart in Figure 10 visually represents the temporal evolution in CO2 emissions attributed to producing one ton of fishmeal throughout the study. Before the installation, the KHS factory emitted an average of 2.05 tons of CO2 into the environment for every ton of fishmeal produced. This number is found to be 58.37% higher compared to the emissions observed after the WHR installation, which amounted to 0.85 tons of CO2 per ton of fishmeal.
4. Discussion
4.1. Interpretation of the Results
The results of this study provide valuable insights into the energy efficiency and environmental benefits of waste heat recovery (WHR) technologies in FMP plants. The analysis of fishmeal output (FMO), total energy consumption (TEC), and specific energy consumption (SEC) revealed essential trends that contribute to a deeper understanding of the potential for improving energy efficiency and reducing environmental impacts in the FMP industry.
The analysis of FMO data showed an increasing trend over the study period, indicating the growth of FMP at the KHS factory. This increasing trend aligns with the growing demand for fishmeal as a protein source in aquaculture [17]. The rising FMO highlights the importance of addressing energy efficiency and environmental sustainability in FMP to meet the increasing demand while minimizing resource consumption.
The analysis of TEC demonstrated significant variations throughout the study period, with the lowest values observed during winter and the highest values during summer. Weather conditions and variations in fish availability for processing most likely cause this seasonal fluctuation. The findings also showed significant variations in TEC throughout the study period, with lower energy consumption observed before the economizer installation. This finding suggests that implementing WHR technologies, such as the economizer, can save energy in FMP.
The SEC index, representing the energy required to produce one ton of fishmeal, decreased over the study period (a 55.5% decrease compared to SEC before installing the WHR), indicating an improvement in energy efficiency at the KHS factory. The implementation of WHR technologies, particularly the economizer, reduced SEC by preheating the feed water and utilizing waste heat from the flue gases.
The correlation analysis revealed a strong negative correlation between the SEC index and the FMO, indicating that as the FMO increases, the SEC per unit of output decreases. This finding suggests that increased production efficiency and scale economies in the fishmeal production process have reduced energy consumption per output unit. However, it is essential to note that while the SEC index has improved over the years, the TEC has yet to show a consistent decrease. This indicates that the increase in the FMO has led to higher overall EC, but the energy intensity per unit of output has decreased.
4.2. Assessment of the Potential for Improving Energy Efficiency in the FMP Process
The findings of this study provide evidence of the potential for improving energy efficiency in the FMP process through the implementation of WHR technologies. Installing an economizer at the KHS factory saved energy savings and reduced SEC. The WHR technologies enabled heat recovery from the boiler flue gas, which was utilized to preheat the feed water, reducing the energy required for steam production. This optimization improved energy efficiency and reduced energy consumption per unit of fishmeal output.
A statistically significant difference in the SEC index before and after the economizer installation provides further evidence of the potential for enhancing energy efficiency. The lower SEC values observed after the installation indicate the positive impact of WHR technologies on energy consumption in the FMP process. These findings suggest that implementing similar WHR technologies in other FMP plants can reduce SEC index and improve energy efficiency.
The results also reveal that implementing the economizer has led to annual energy savings (AES) and energy cost savings (AECS). The results showed that the installation of the economizer led to an AES of approximately 4,537.57 GJ/year, primarily from the recovery of heat from RHPC. These energy savings translate into annual cost savings of $26,474.49. The findings highlight the potential for WHR technologies to enhance energy efficiency and contribute to cost savings for FMP plants.
4.3. Environmental Impacts and Sustainability Benefits
The analysis of CO2 emissions in the FMP process demonstrates the environmental benefits of WHR technologies. Specifically, the installation of an economizer at the KHS factory resulted in a significant reduction in CO2 emissions. After the economizer was installed, the emissions associated with producing one ton of fishmeal decreased by 58.37%. This reduction can be attributed to the improved energy efficiency and reduced energy consumption achieved through WHR technologies. These findings highlight the positive environmental impact of implementing WHR technologies in FMP plants.
In addition to reducing CO2 emissions, WHR technologies also minimize air pollution and decrease the environmental footprint of FMP. By optimizing energy use and reducing the consumption of fossil fuels, these technologies help mitigate the release of pollutants into the atmosphere. This is particularly important in regions with strict environmental regulations and concerns about air quality [18,19].
The sustainability benefits of WHR technologies in FMP are significant. The findings of this study underscore the role of these technologies in achieving sustainable development goals by improving energy efficiency, reducing resource consumption, and minimizing environmental impacts. The energy and cost savings resulting from WHR contribute to the economic viability and long-term sustainability of FMP. Furthermore, the reduced reliance on fossil fuels and the associated decrease in greenhouse gas emissions align with global efforts to combat climate change and promote sustainable practices [20,21].
Moreover, WHR technologies in FMP plants contribute to the circular economy by utilizing waste heat as a valuable resource. By recovering and utilizing waste heat, these technologies minimize waste and enhance resource efficiency in the production process [22]. This aligns with the principles of a circular economy, which aims to use resources sustainably and efficiently.
The environmental and sustainability benefits of WHR technologies extend beyond individual FMP plants. Given the significant contribution of the fishmeal industry to global aquaculture [23], implementing energy-efficient and sustainable practices can have a broader positive impact on the aquaculture sector. The findings of this study can guide policymakers and industry practitioners in promoting energy-efficient and environmentally sustainable practices in the FMP industry [24,25].
4.4. Comparison of the Findings with Other Studies in the FMP Industry
This study contributes to the existing body of knowledge by providing insights into the energy efficiency and environmental benefits of WHR technologies in the FMP industry, particularly in the context of developing countries like Vietnam. While there is limited research specifically focusing on WHR in FMP, the findings of this study can be compared and contextualized with studies conducted in other industrial sectors.
Several studies in different industries have demonstrated the potential benefits of WHR technologies in improving energy efficiency and reducing environmental impacts. For example, a study conducted in a Biscuit Factory in Turkey reported energy savings of 27.13 tons of CO2 emissions per year using economizers to recover waste heat from their boiler [26]. Similarly, installing WHR technology in industrial boilers in Malaysia’s paper and pulp industries achieved savings of 2,150 tons of CO2 per year [27], comparable to the observed reduction of 866.70 tons of CO2 emissions per year in the KHS factory.
Comparing the results of annual energy and annual cost savings with those of other studies can provide valuable insights into the effectiveness of the economizer technology. For example, a study by Rakib, et al. [28] conducted research demonstrating that a waste-heat recovery boiler utilizing hot exhaust from an onsite electricity generator, with a capacity of 2.70 t/h, was able to conserve 15,094 GJ/year of energy annually and reduce energy costs by $ 141,280. Additionally, installing an economizer resulted in a 4.9% reduction in boiler fuel consumption. Another study by Hasanuzzaman, et al. [29] reviewed industrial process heating systems in the industrial sector; the results found that in the case of boilers, 10% to 20% of energy can be saved using economizers. At the KHS plant, the installation of the economizer led to annual energy savings of approximately 4,537.57 GJ/year, translated into annual cost savings of $26,474.49.
While the specific applications and contexts may differ, the findings of those studies align with the results of this research, demonstrating the effectiveness of WHR technologies in improving energy efficiency and reducing environmental impacts. The comparison of findings across different industries highlights the cross-sectoral relevance of WHR technologies and their potential transferability to enhance sustainability in various manufacturing processes.
4.5. Limitations of the Study and Suggestions for Future Research
This study has certain limitations that should be acknowledged. Firstly, the research focused on a single case study in Vietnam’s FMP industry. While the findings provide valuable insights into the specific context, generalizations should be made cautiously to other FMP plants and regions. Further studies encompassing multiple case studies in different countries and regions would provide a more comprehensive understanding of WHR technologies’ energy efficiency and environmental benefits in the FMP industry.
Secondly, the study relied on secondary data for specific calculations, such as CO2 emissions and energy cost savings. The accuracy and reliability of these calculations depend on the availability and accuracy of the secondary data sources. Future research could involve primary data collection for a more robust energy and economic savings analysis.
Additionally, the study focused primarily on energy efficiency and environmental impacts, particularly CO2 emissions reduction. Future research could explore other environmental indicators and impacts, such as water consumption, wastewater treatment, and air quality. A comprehensive assessment of the environmental footprint of the FMP process would provide a more holistic understanding of the sustainability implications.
Lastly, the study did not consider the social and socio-economic aspects of implementing WHR technologies in the FMP industry. Future research could explore the socio-economic benefits, including job creation, local community engagement, and the social acceptance of these technologies. Understanding the broader social implications would facilitate the development of strategies and policies that promote sustainable and socially responsible practices in the FMP industry.
5. Conclusion
This study assessed the energy efficiency and environmental benefits of WHR technologies in the FMP industry, with a case study in Vietnam. The objectives were to evaluate energy efficiency through WHR technologies, quantify energy savings and greenhouse gas emission reductions, and assess sustainability implications in the FMP industry. The WHR economizer at the KHS factory resulted in significant energy savings (4,537.57 GJ/year) and reduced SEC by 55.5%, demonstrating the potential for WHR technologies to improve energy efficiency in the FMP industry. Installing the economizer also led to a 58.37% reduction in CO2 emissions, contributing to global efforts to mitigate climate change and promote sustainable practices.
The implications for enhancing sustainability in the FMP industry are significant. The energy and cost savings achieved through WHR technologies contribute to the economic viability and long-term sustainability of FMP plants. Moreover, the environmental benefits of WHR technologies, such as minimizing air pollution and reducing the environmental footprint of FMP, align with the principles of a circular economy by utilizing waste heat as a valuable resource and enhancing resource efficiency. The environmental and sustainability benefits of WHR technologies extend beyond individual FMP plants and can positively impact the aquaculture sector, given the fishmeal industry’s significant contribution to global aquaculture.
In conclusion, this study emphasizes the energy efficiency and environmental benefits of WHR technologies in the FMP industry, contributing to the growing body of knowledge on sustainable practices and providing insights for policymakers and industry practitioners to promote energy-efficient and environmentally sustainable processes.
Acknowledgments
This research is funded by Vietnam National Foundation for Science and Technology Development (NAFOSTED) under grant number 105.99-2020.15. The authors are also grateful for the research collaboration between groups, institutions, and universities.
References
- Tacon, A. G. J.; Metian, M., Global overview on the use of fish meal and fish oil in industrially compounded aquafeeds: Trends and future prospects. Aquaculture 2008, 285, (1), 146-158. [CrossRef]
- Aubin, J.; Papatryphon, E.; van der Werf, H. M. G.; Chatzifotis, S., Assessment of the environmental impact of carnivorous finfish production systems using life cycle assessment. Journal of Cleaner Production 2009, 17, (3), 354-361. [CrossRef]
- Le, T. Vietnam becomes the third largest seafood exporter in the world. https://vnbusiness.vn/thi-truong/viet-nam-tro-thanh-quoc-gia-xuat-khau-thuy-san-lon-thu-3-the-gioi-1090242.html (16/01).
- Shahidi, F., Seafood processing by-products. In Seafoods: Chemistry, processing technology and quality, Springer: 1994; pp 320-334. [CrossRef]
- Arvanitoyannis, I. S.; Kassaveti, A., Fish industry waste: Treatments, environmental impacts, current and potential uses. International journal of food science technology 2008, 43, (4), 740-745. [CrossRef]
- Ganapathy, V., Industrial boilers and heat recovery steam generators: Design, applications, and calculations. CRC Press: 2002.
- Jouhara, H.; Khordehgah, N.; Almahmoud, S.; Delpech, B.; Chauhan, A.; Tassou, S. A., Waste heat recovery technologies and applications. Thermal Science and Engineering Progress 2018, 6, 268-289. [CrossRef]
- Delpech, B.; Milani, M.; Montorsi, L.; Boscardin, D.; Chauhan, A.; Almahmoud, S.; Axcell, B.; Jouhara, H., Energy efficiency enhancement and waste heat recovery in industrial processes by means of the heat pipe technology: Case of the ceramic industry. Energy 2018, 158, 656-665. [CrossRef]
- Singh, S.; Dasgupta, M., CO2 heat pump for waste heat recovery and utilization in dairy industry with ammonia based refrigeration. International Journal of Refrigeration 2017, 78, 108-120. [CrossRef]
- Douvartzides, S.; Karmalis, I., Working fluid selection for the Organic Rankine Cycle (ORC) exhaust heat recovery of an internal combustion engine power plant. IOP Conference Series: Materials Science and Engineering 2016, 161, (1), 012087. [CrossRef]
- (IEA), I. E. A. Capturing the Multiple Benefits of Energy Efficiency; Paris, 2015; p 232. [CrossRef]
- Lawrence, A.; Thollander, P.; Andrei, M.; Karlsson, M., Specific energy consumption/use (SEC) in energy management for improving energy efficiency in industry: Meaning, usage and differences. Energies 2019, 12, (2), 247. [CrossRef]
- Menghi, R.; Papetti, A.; Germani, M.; Marconi, M., Energy efficiency of manufacturing systems: A review of energy assessment methods and tools. Journal of Cleaner Production 2019, 240, 118276. [CrossRef]
- Khanh Hoang Seaprexco Energy audit report; Soc Trang province, 2019; p 325.
- Tan, X.; Li, H.; Guo, J.; Gu, B.; Zeng, Y., Energy-saving and emission-reduction technology selection and CO2 emission reduction potential of China’s iron and steel industry under energy substitution policy. Journal of Cleaner Production 2019, 222, 823-834. [CrossRef]
- Willems, D., Advanced system control and energy savings for industrial boilers. In Northeast Midwest Institute: Washington, D.C., 2009. [CrossRef]
- Boyd, C. E.; McNevin, A. A.; Davis, R. P., The contribution of fisheries and aquaculture to the global protein supply. Food Security 2022, 14, (3), 805-827. [CrossRef]
- Cheng, Y.; Du, K.; Yao, X., Stringent environmental regulation and inconsistent green innovation behavior: Evidence from air pollution prevention and control action plan in China. Energy Economics 2023, 120, 106571. [CrossRef]
- Shapiro, J. S.; Walker, R. Is Air Pollution Regulation Too Stringent?; National Bureau of Economic Research: 2020. [CrossRef]
- Nielsen, K. S.; Nicholas, K. A.; Creutzig, F.; Dietz, T.; Stern, P. C., The role of high-socioeconomic-status people in locking in or rapidly reducing energy-driven greenhouse gas emissions. Nature Energy 2021, 6, (11), 1011-1016. [CrossRef]
- Leal Filho, W.; Ng, A. W.; Sharifi, A.; Janová, J.; Özuyar, P. G.; Hemani, C.; Heyes, G.; Njau, D.; Rampasso, I., Global tourism, climate change and energy sustainability: Assessing carbon reduction mitigating measures from the aviation industry. Sustainability Science 2023, 18, (2), 983-996. [CrossRef]
- Fadeeva, Z.; Van Berkel, R., Towards Circular Economy of Food Systems: An Explorative Appraisal of Opportunities in Fish, Seafood Value Chains. In Sustainable Food Value Chain Development: Perspectives from Developing and Emerging Economies, Narula, S. A.; Raj, S. P., Eds. Springer Nature Singapore: Singapore, 2023; pp 61-86. [CrossRef]
- Jiang, Q.; Bhattarai, N.; Pahlow, M.; Xu, Z., Environmental sustainability and footprints of global aquaculture. Resources, Conservation and Recycling 2022, 180, 106183. [CrossRef]
- Asche, F.; Eggert, H.; Oglend, A.; Roheim, C. A.; Smith, M. D., Aquaculture: Externalities and policy options. Review of Environmental Economics and Policy 2022, 16, (2), 282-305. [CrossRef]
- Costa-Pierce, B. A.; Bockus, A. B.; Buck, B. H.; van den Burg, S. W.; Chopin, T.; Ferreira, J. G.; Goseberg, N.; Heasman, K. G.; Johansen, J.; Shumway, S. E., A Fishy Story Promoting a False Dichotomy to Policy-Makers: It Is Not Freshwater vs. Marine Aquaculture. Reviews in Fisheries Science & Aquaculture 2022, 30, (4), 429-446. [CrossRef]
- Celep, G. K.; Rusen, S. E. In Application of economizer for waste heat recovery from exhaust flue gas in steam boiler: A case study in a biscuit factory, 4th International Symposium on Innovative Technologies in Engineering and Science (ISITES2016) 3-5 Nov 2016 Alanya, Antalya-Turkey, 2016; Antalya-Turkey, 2016.
- Agathokleous, R.; Bianchi, G.; Panayiotou, G.; Aresti, L.; Argyrou, M. C.; Georgiou, G. S.; Tassou, S. A.; Jouhara, H.; Kalogirou, S. A.; Florides, G. A.; Christodoulides, P., Waste Heat Recovery in the EU industry and proposed new technologies. Energy Procedia 2019, 161, 489-496. [CrossRef]
- Rakib, M. I.; Saidur, R.; Mohamad, E. N.; Afifi, A. M., Waste-heat utilization – The sustainable technologies to minimize energy consumption in Bangladesh textile sector. Journal of Cleaner Production 2017, 142, 1867-1876. [CrossRef]
- Hasanuzzaman, M.; Rahim, N. A.; Hosenuzzaman, M.; Saidur, R.; Mahbubul, I. M.; Rashid, M. M., Energy savings in the combustion based process heating in industrial sector. Renewable and Sustainable Energy Reviews 2012, 16, (7), 4527-4536. [CrossRef]
Figure 1.
The scheme of FMP process using fish byproducts at the KHS factory, showing the installation of the economizer in the upper right corner.
Figure 1.
The scheme of FMP process using fish byproducts at the KHS factory, showing the installation of the economizer in the upper right corner.
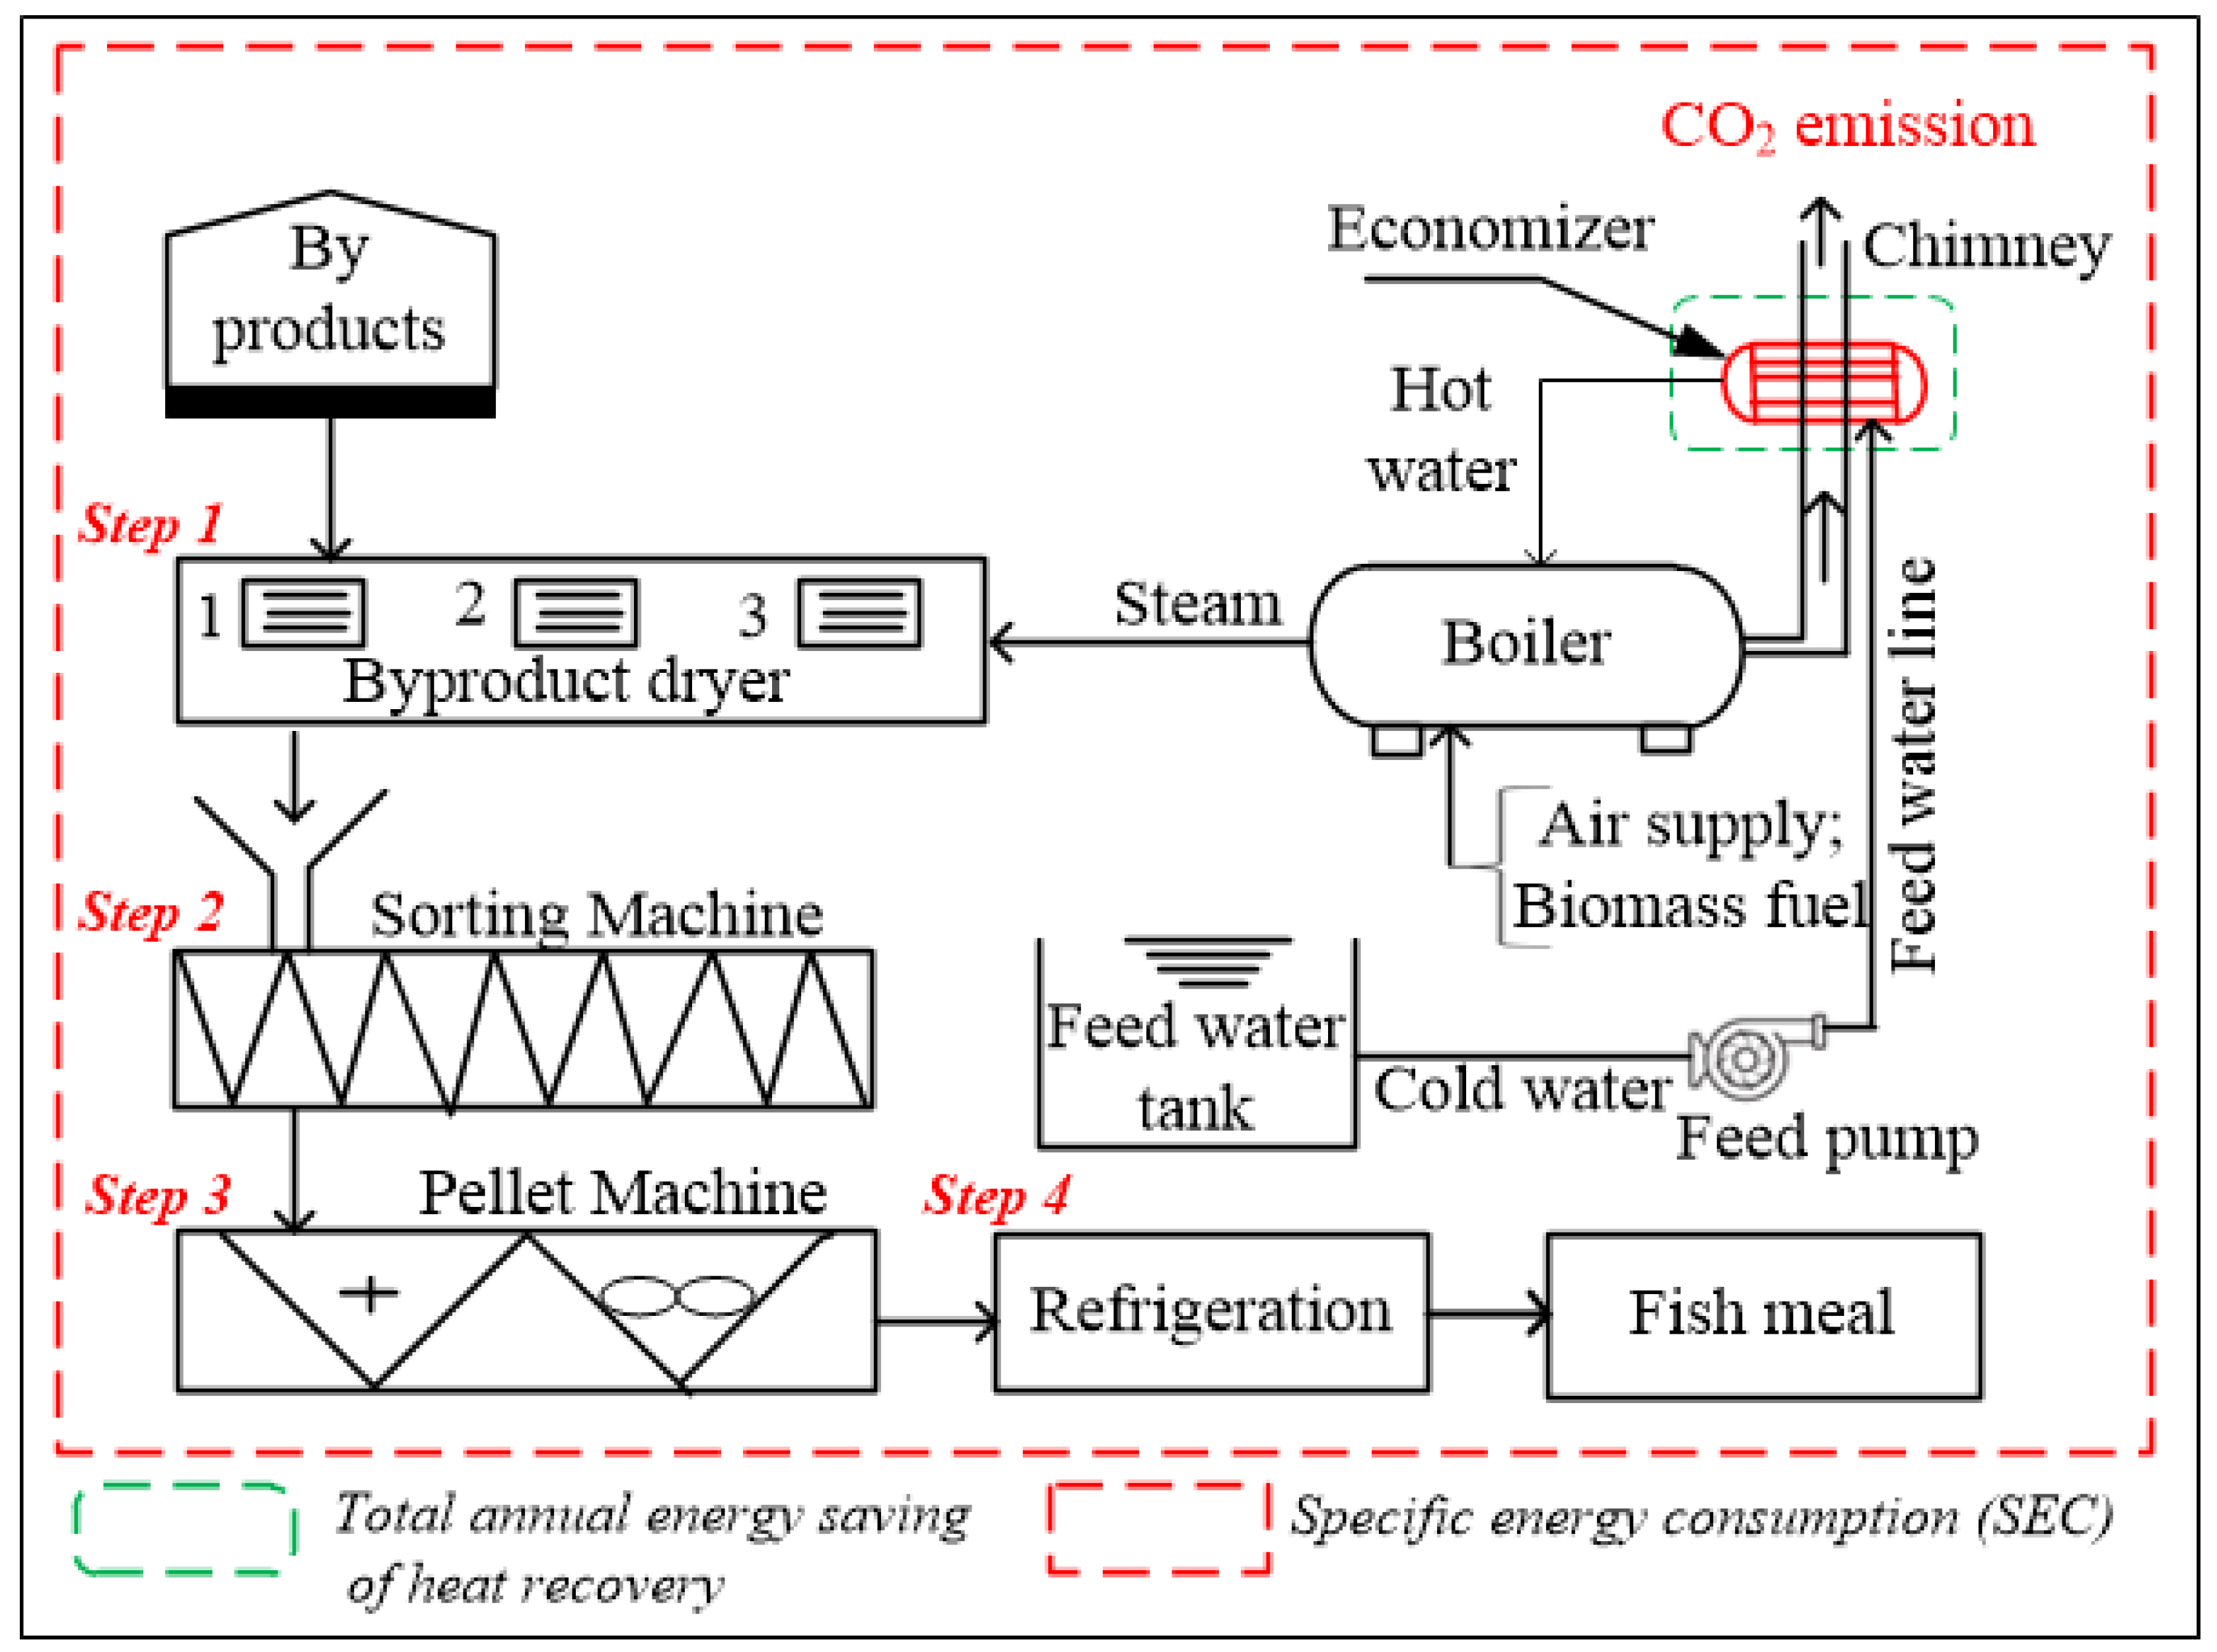
Figure 2.
Diagram depicting the configuration of the combustion chamber and heat exchanger within a boiler.
Figure 2.
Diagram depicting the configuration of the combustion chamber and heat exchanger within a boiler.
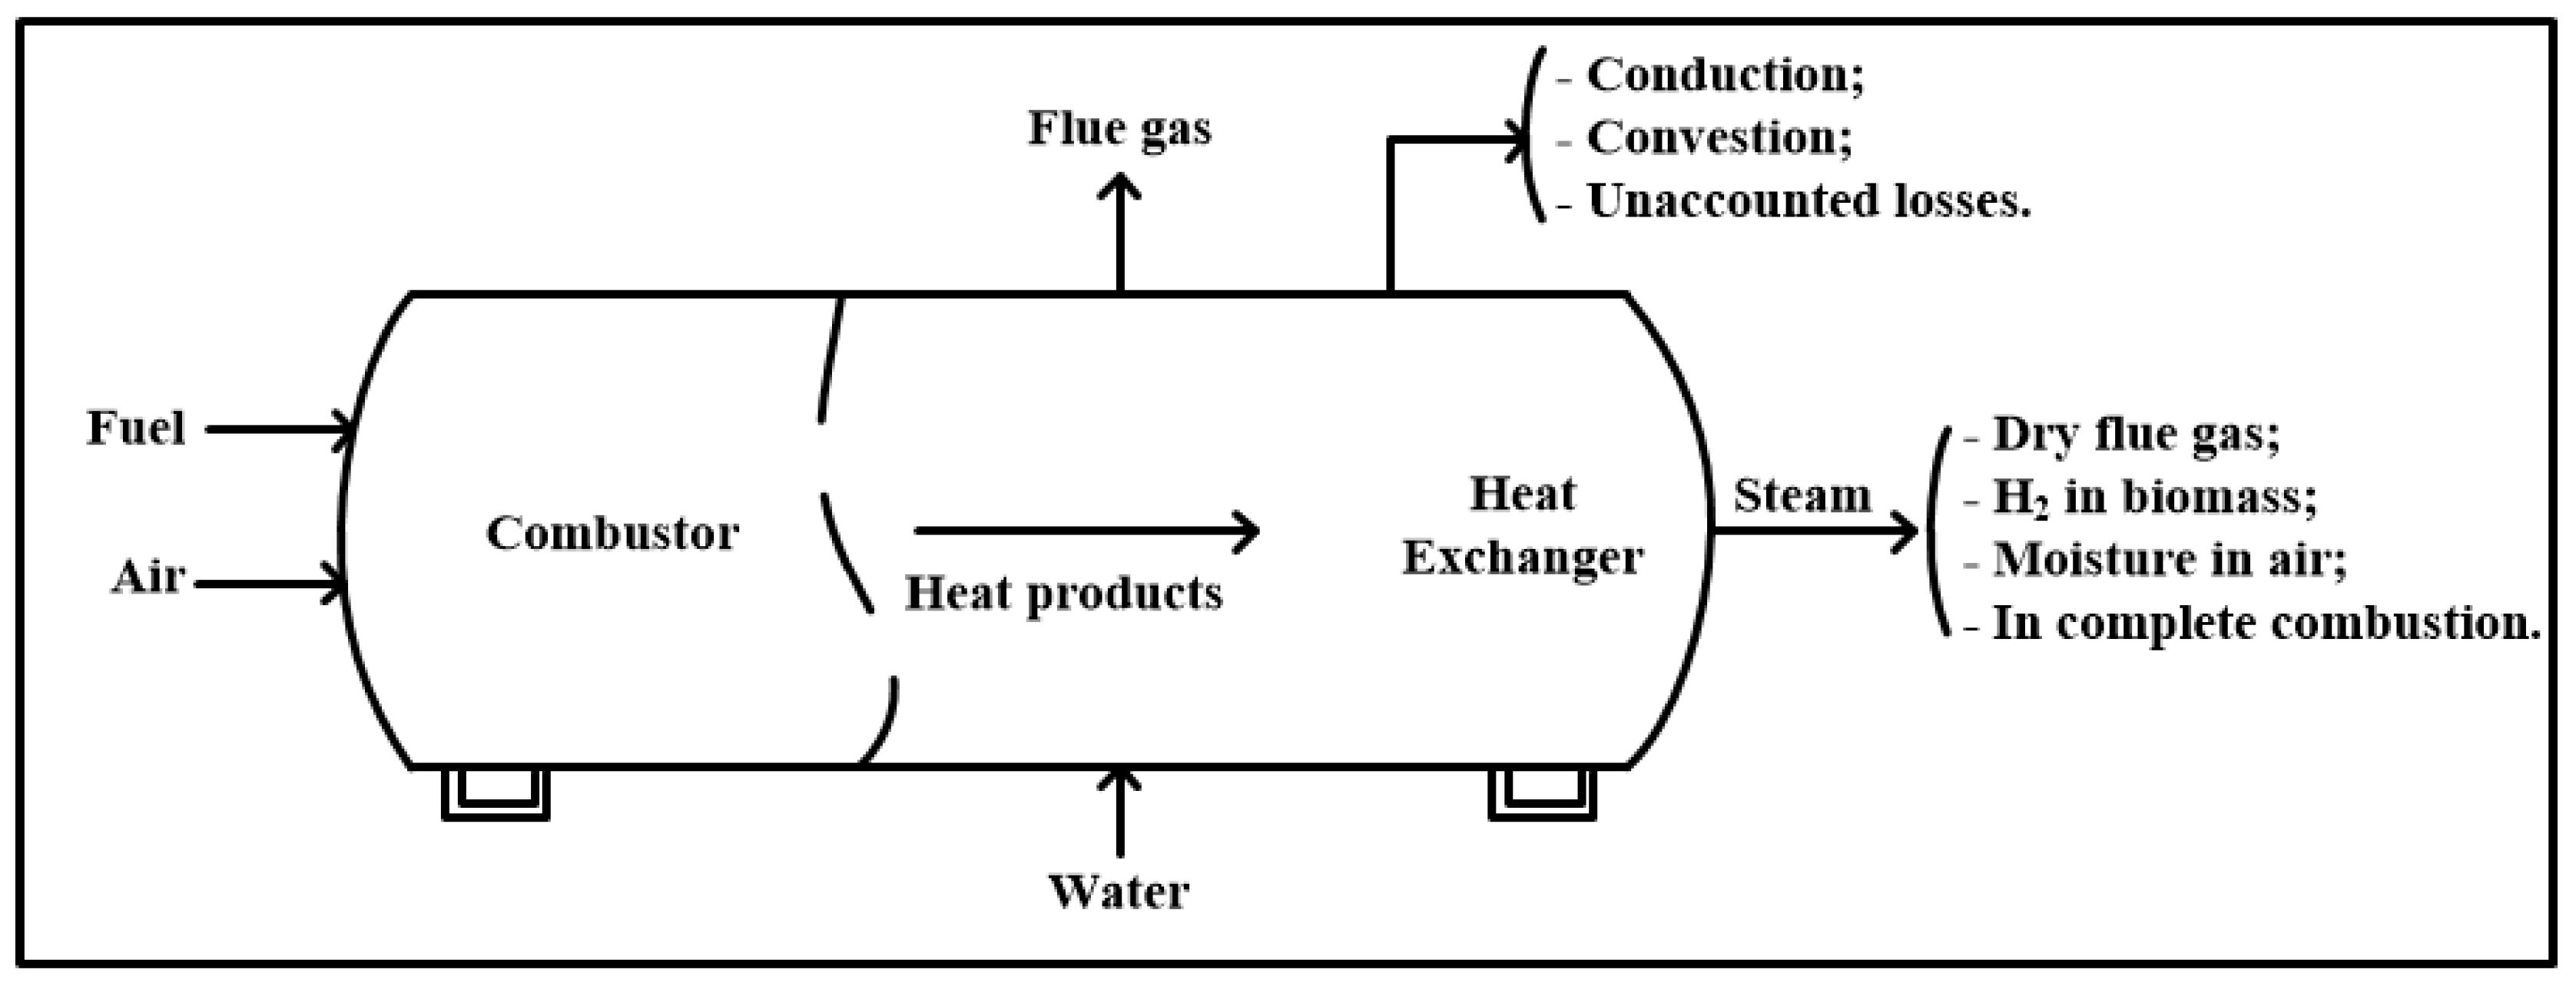
Figure 3.
Structure of the economizer.
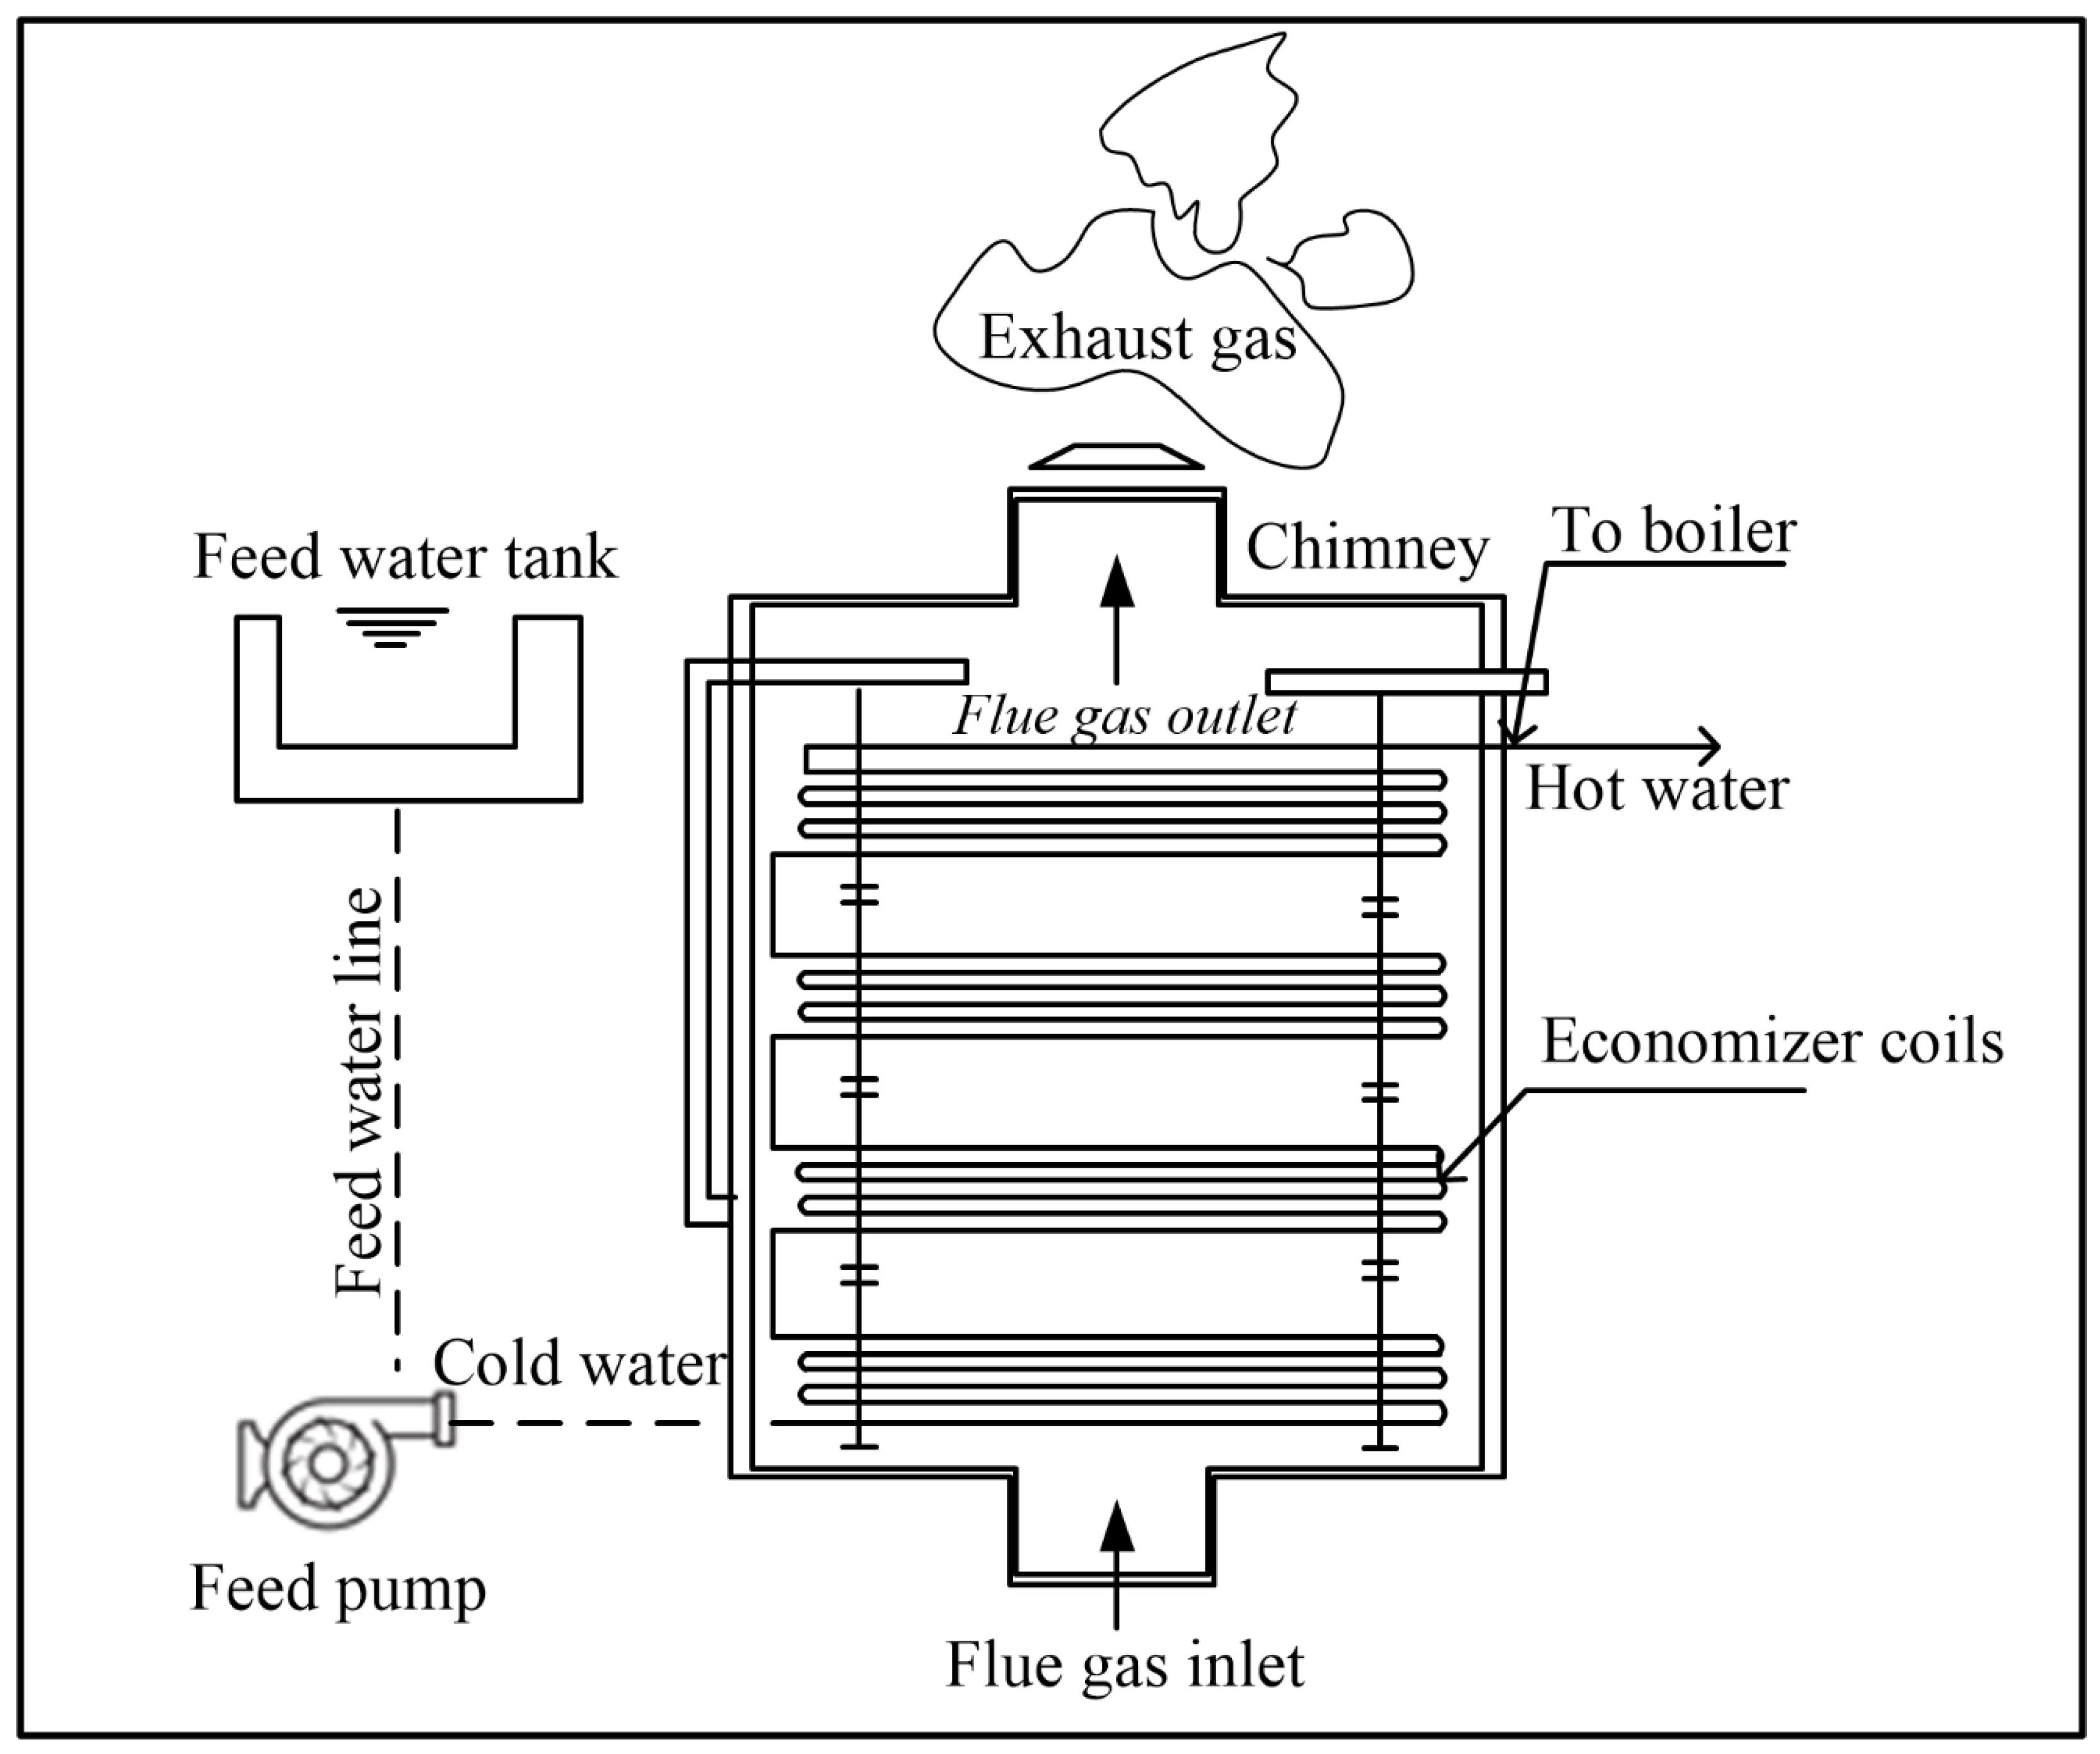
Figure 4.
Monthly data on fishmeal output and energy consumption from 2016 to 2022 collected at the KHS factory: a). FMO - tons, b). EC - kWh, c). RHPC - tons.
Figure 4.
Monthly data on fishmeal output and energy consumption from 2016 to 2022 collected at the KHS factory: a). FMO - tons, b). EC - kWh, c). RHPC - tons.
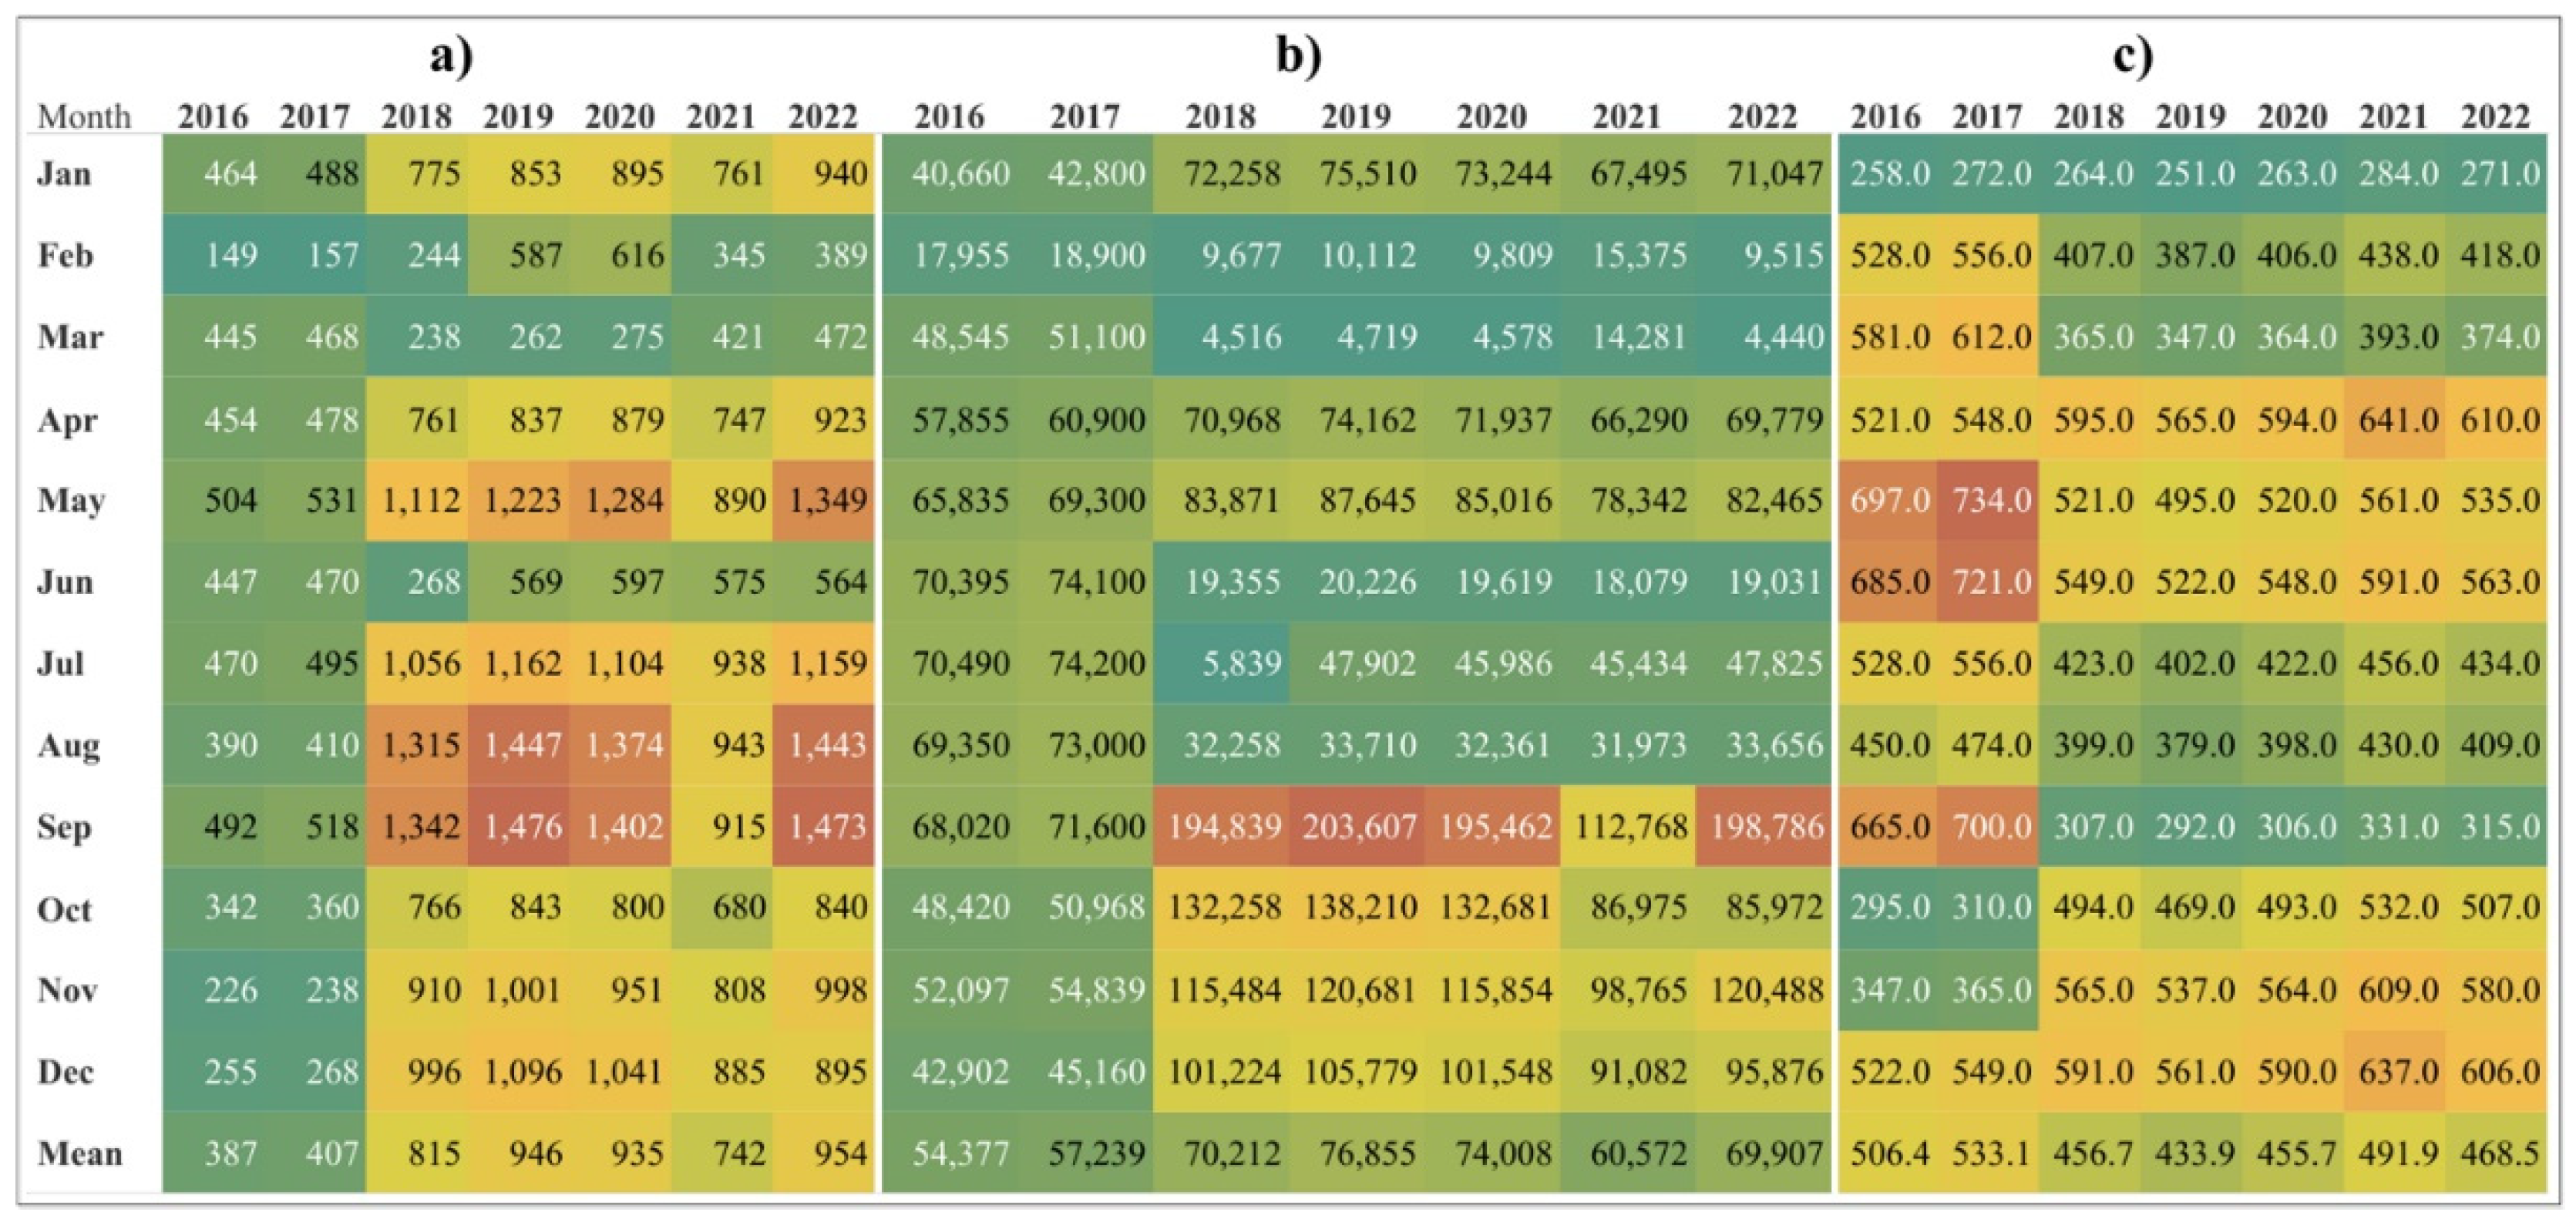
Figure 5.
QQ plot-analysis results for data collected from 2016 to 2022 collected at the KHS factory (FMO, EC, and RHPC).
Figure 5.
QQ plot-analysis results for data collected from 2016 to 2022 collected at the KHS factory (FMO, EC, and RHPC).
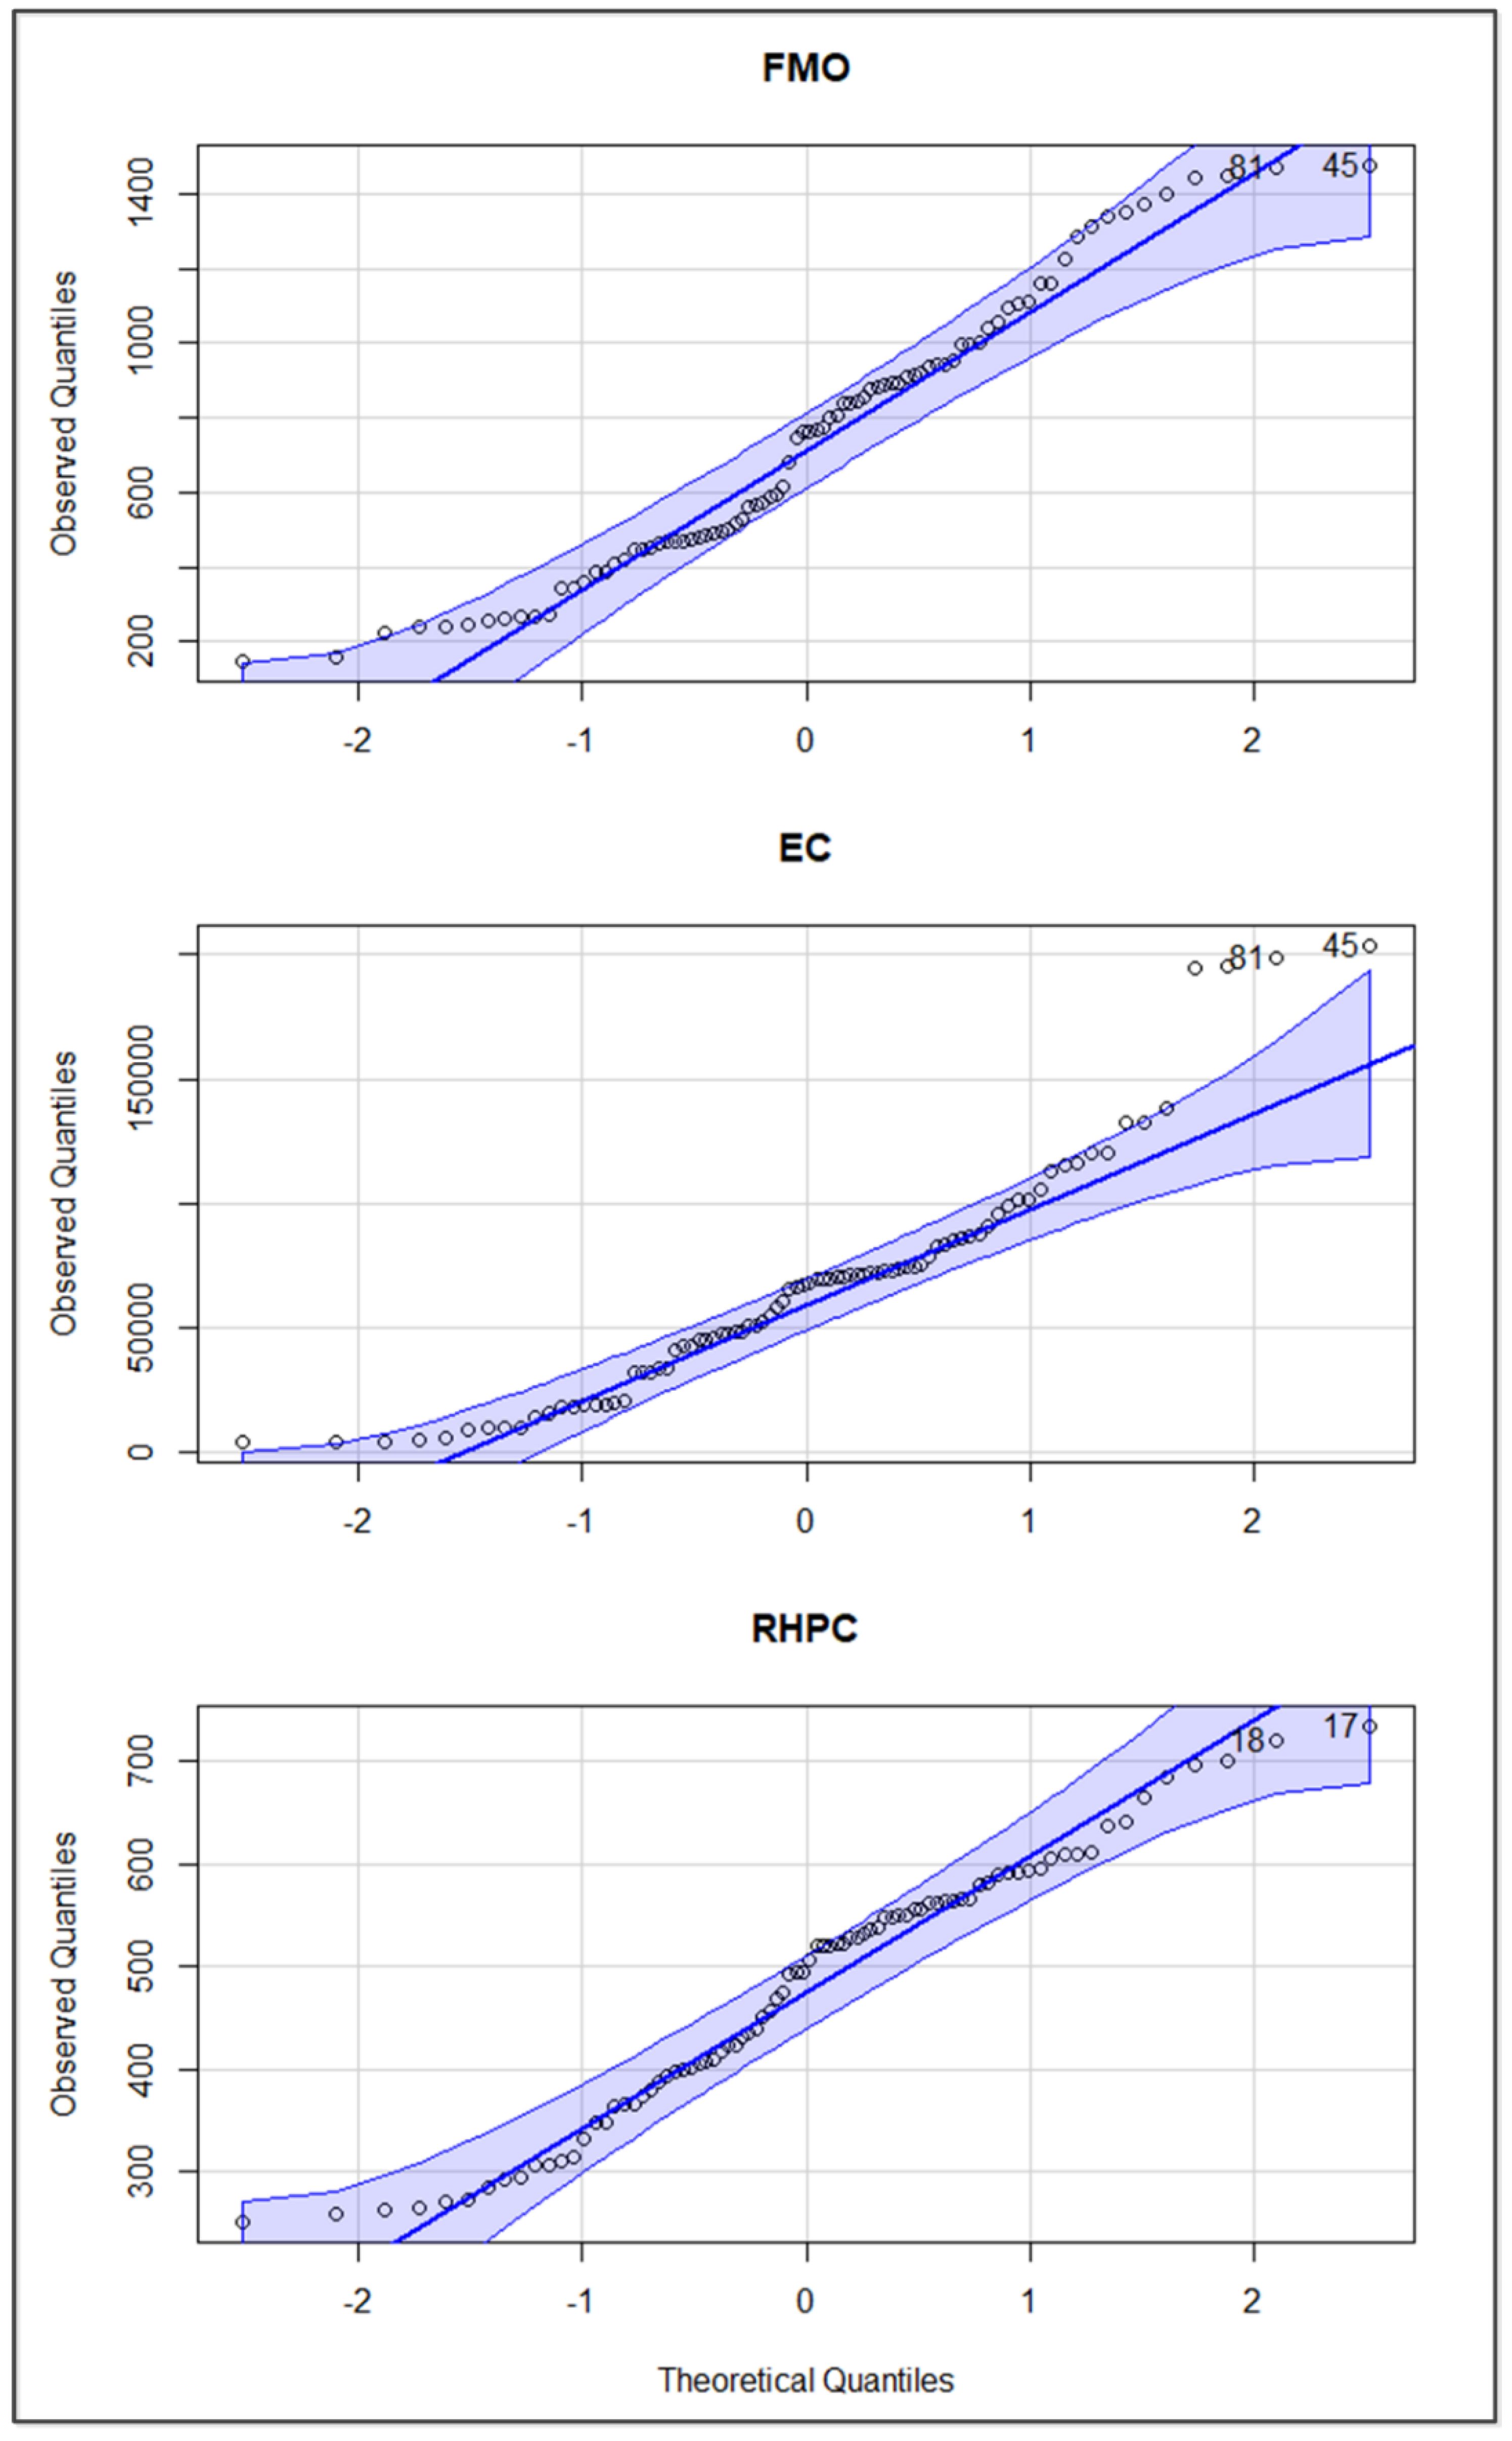
Figure 6.
Monthly total energy consumption data for the KHS factory from 2016 to 2022 (unit: GJ).
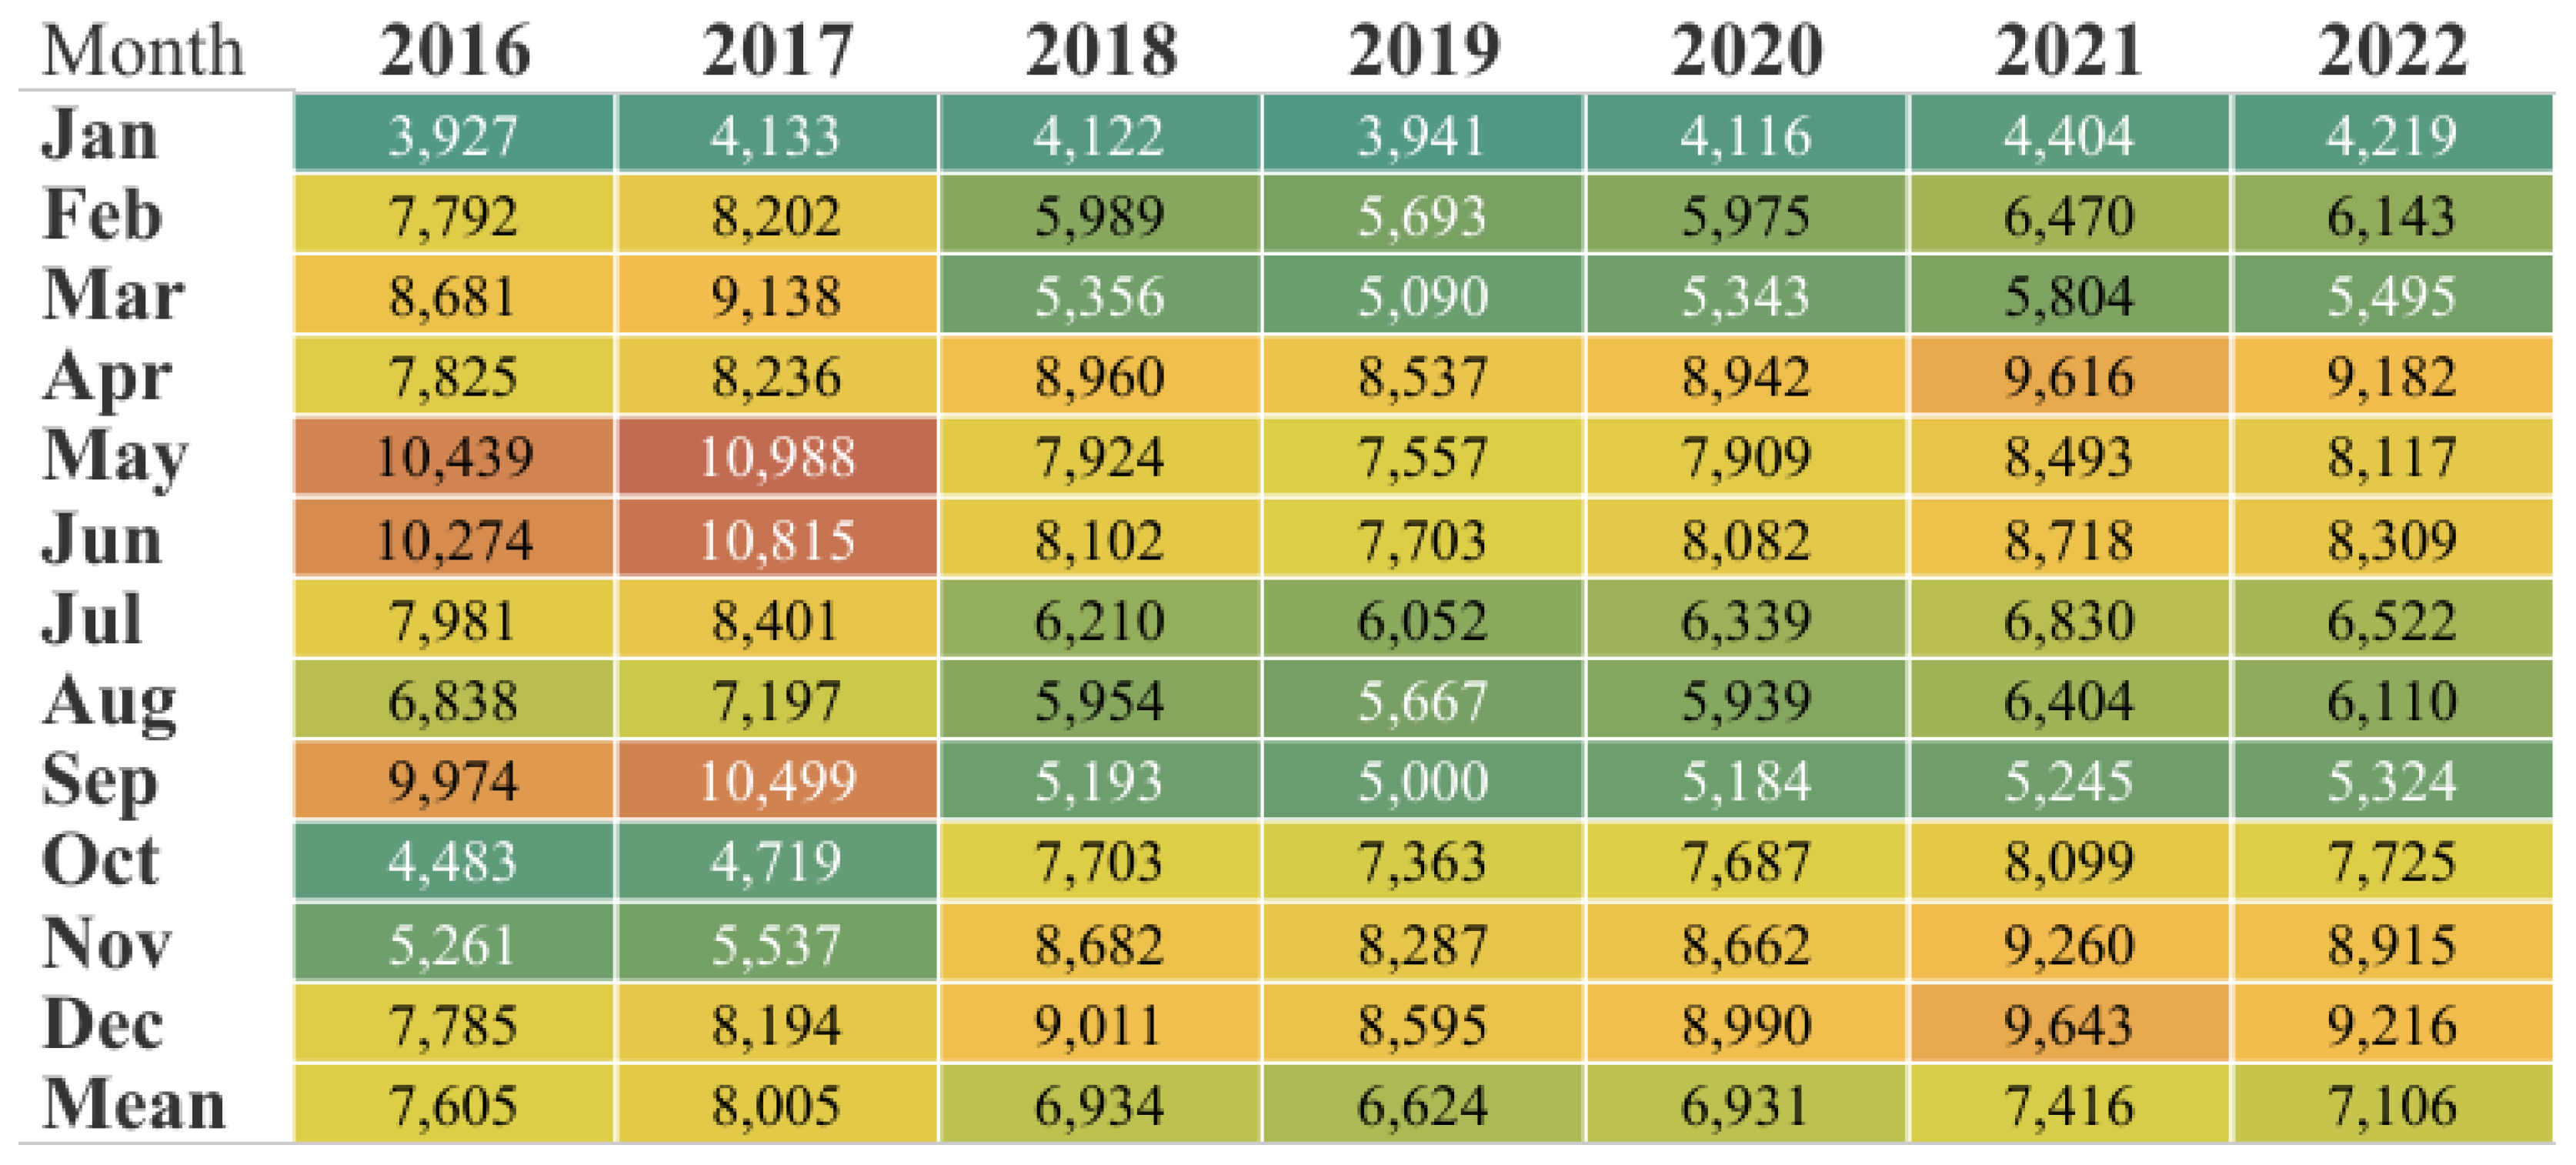
Figure 7.
Monthly index of specific energy consumption for the KHS factory from 2016 to 2022 (unit: GJ/tons).
Figure 7.
Monthly index of specific energy consumption for the KHS factory from 2016 to 2022 (unit: GJ/tons).
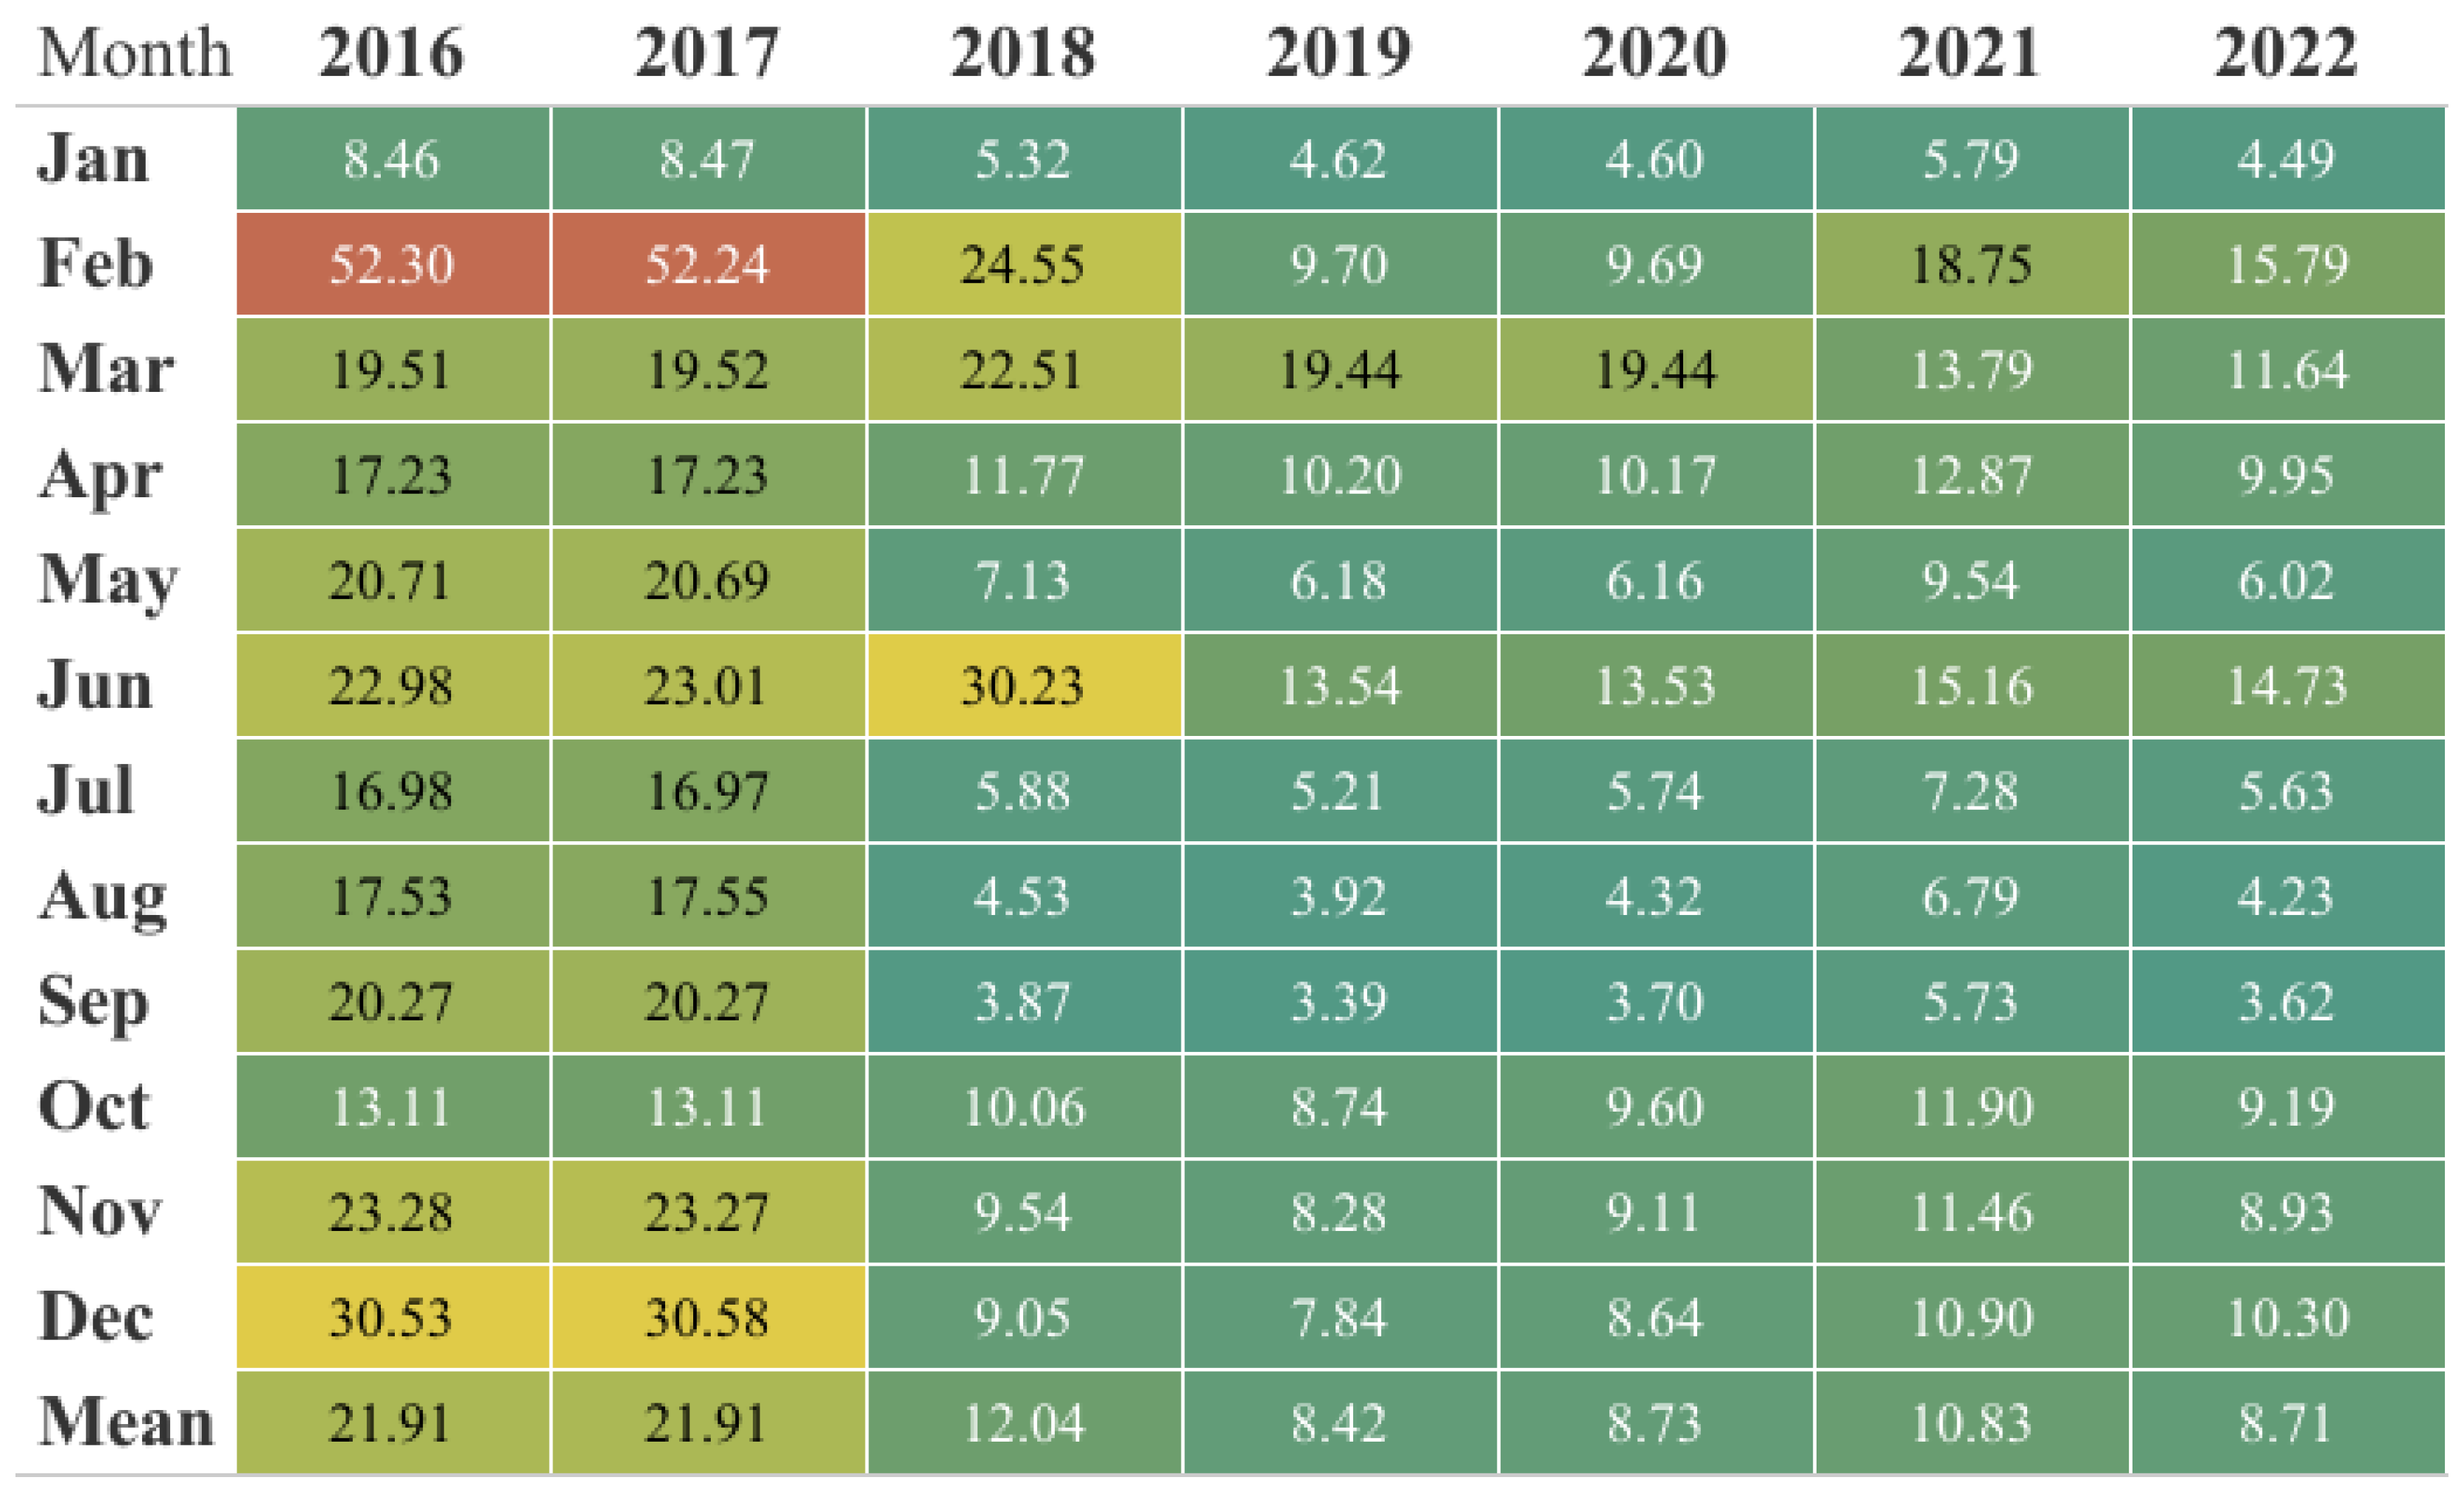
Figure 8.
Correlations among FMO, EC, RHPC, TEC, and SEC index at the KHS factory during the period 2016-2022.
Figure 8.
Correlations among FMO, EC, RHPC, TEC, and SEC index at the KHS factory during the period 2016-2022.
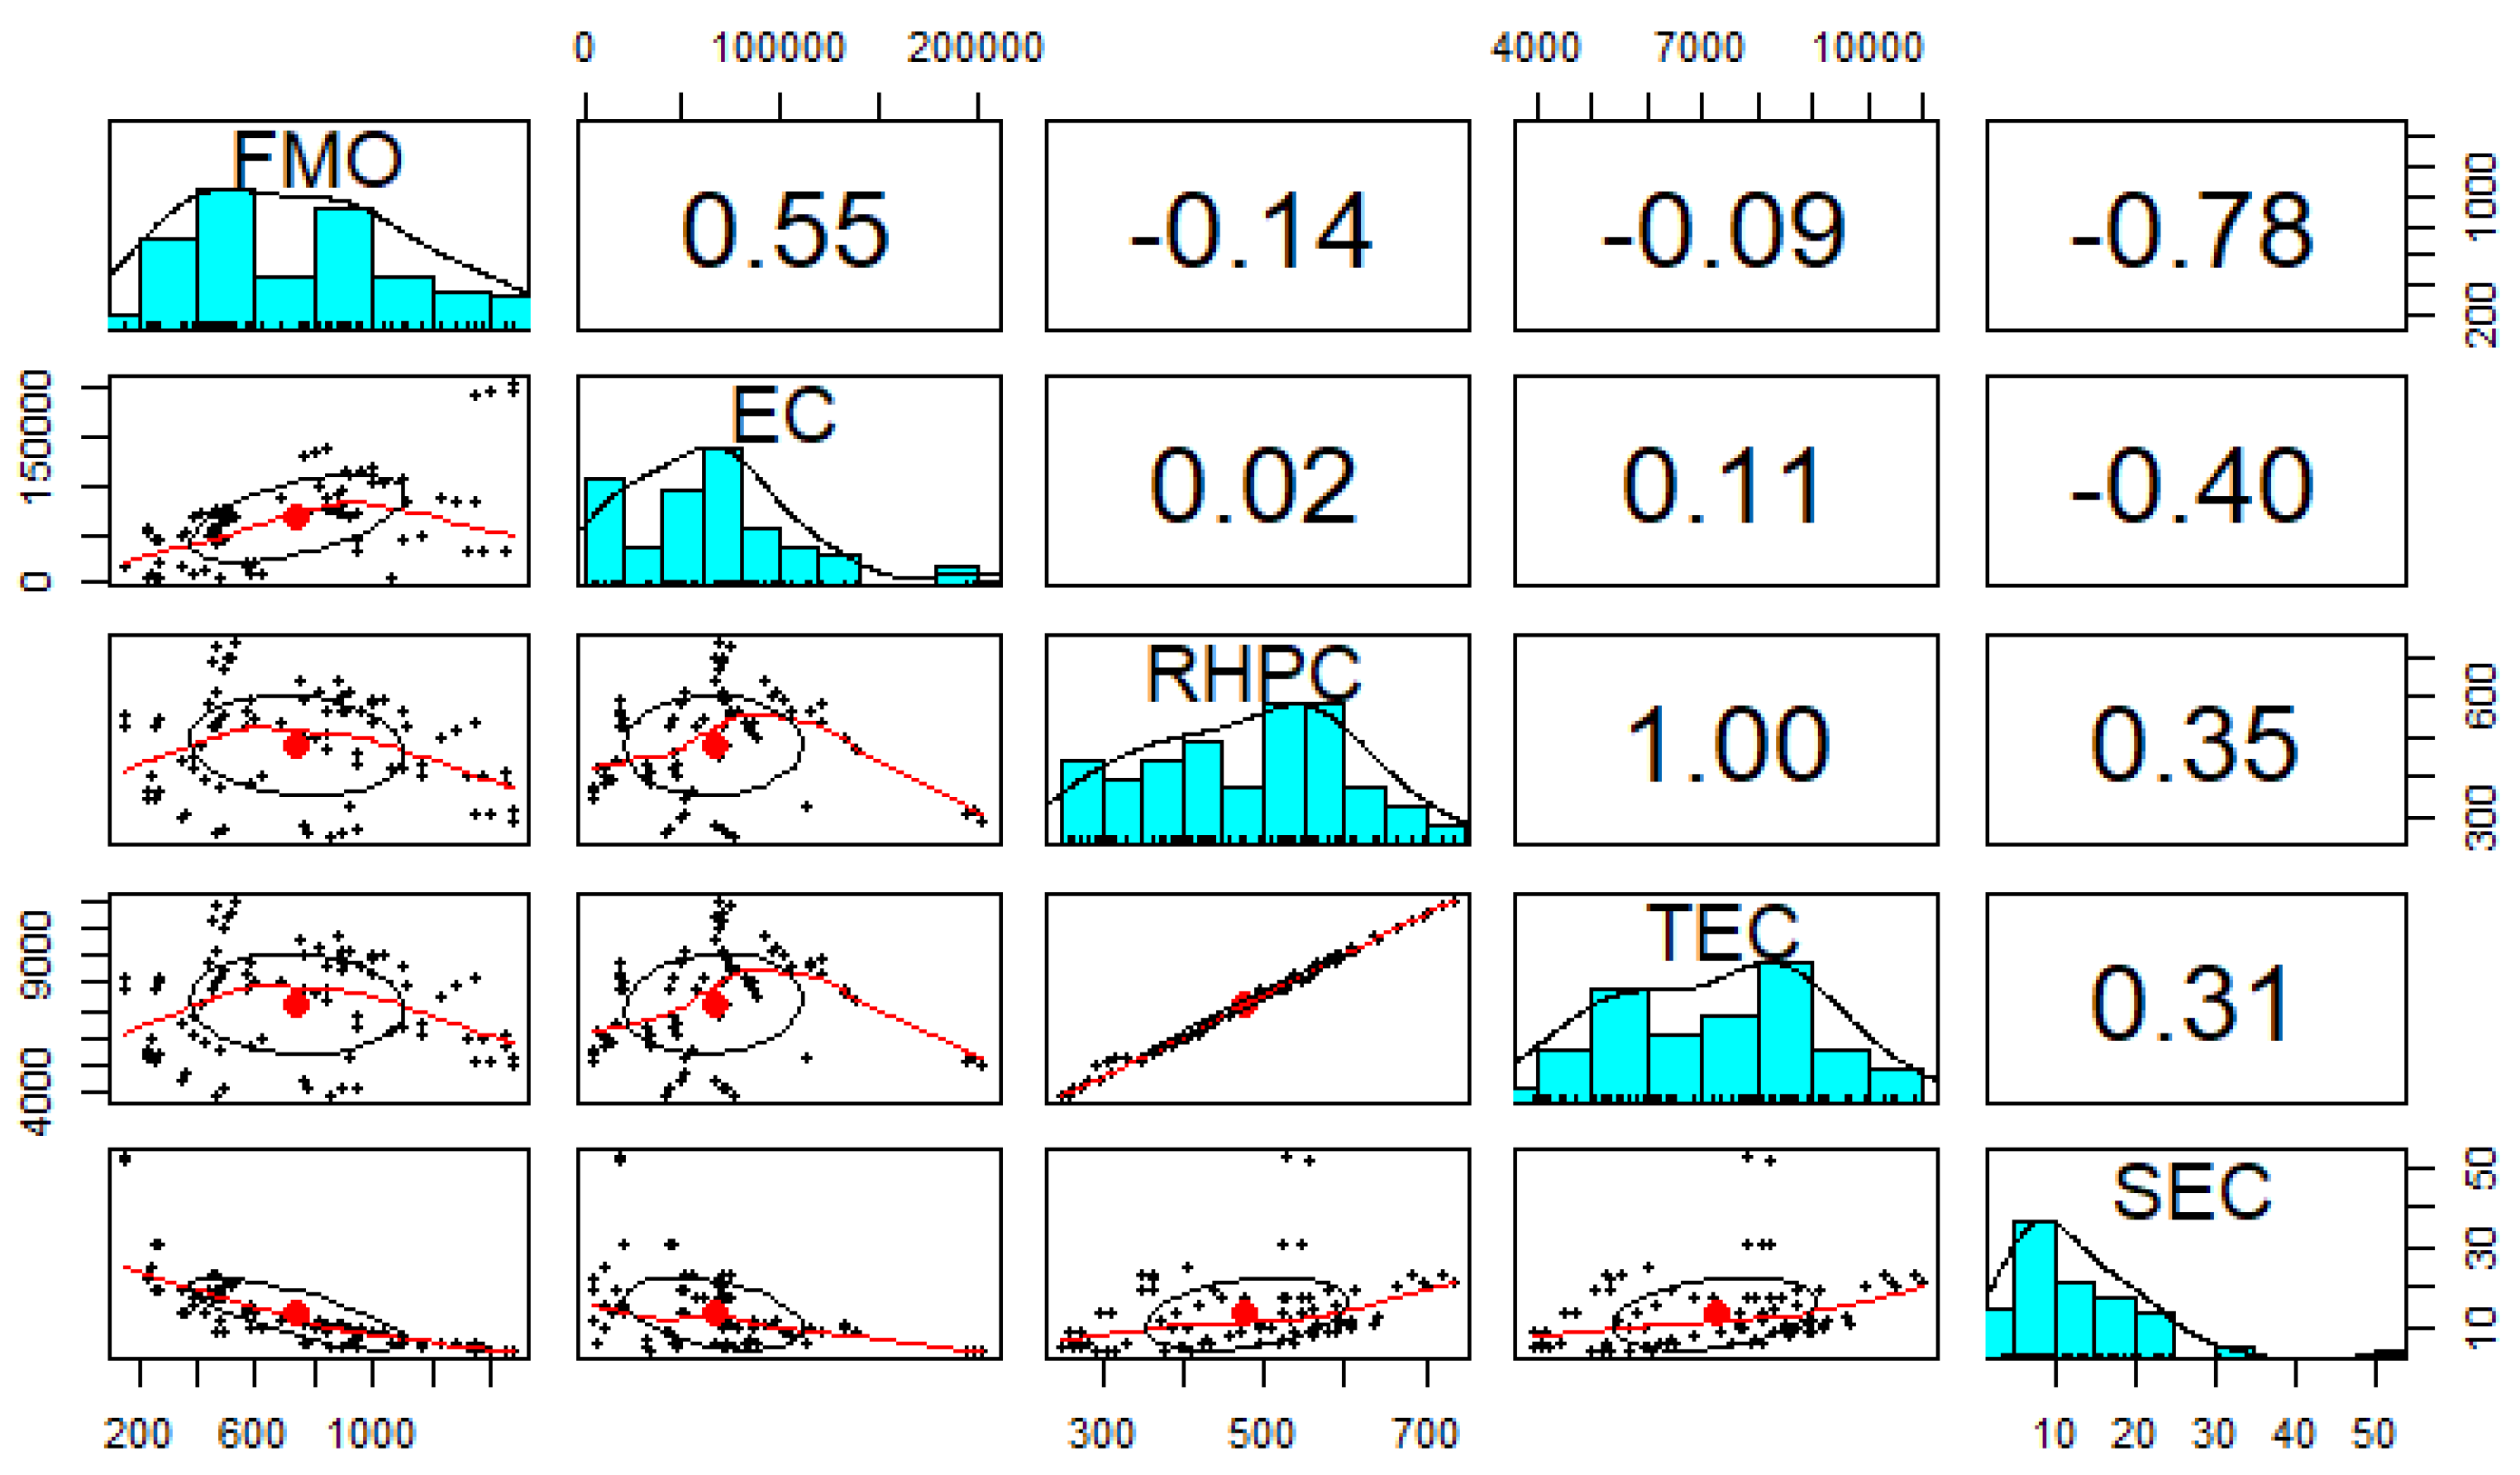
Figure 9.
Annual energy savings (AEV) achieved by the KHS factory after the installation of the economizer (yellow represents energy savings from EC, green represents energy savings from RHPC).
Figure 9.
Annual energy savings (AEV) achieved by the KHS factory after the installation of the economizer (yellow represents energy savings from EC, green represents energy savings from RHPC).
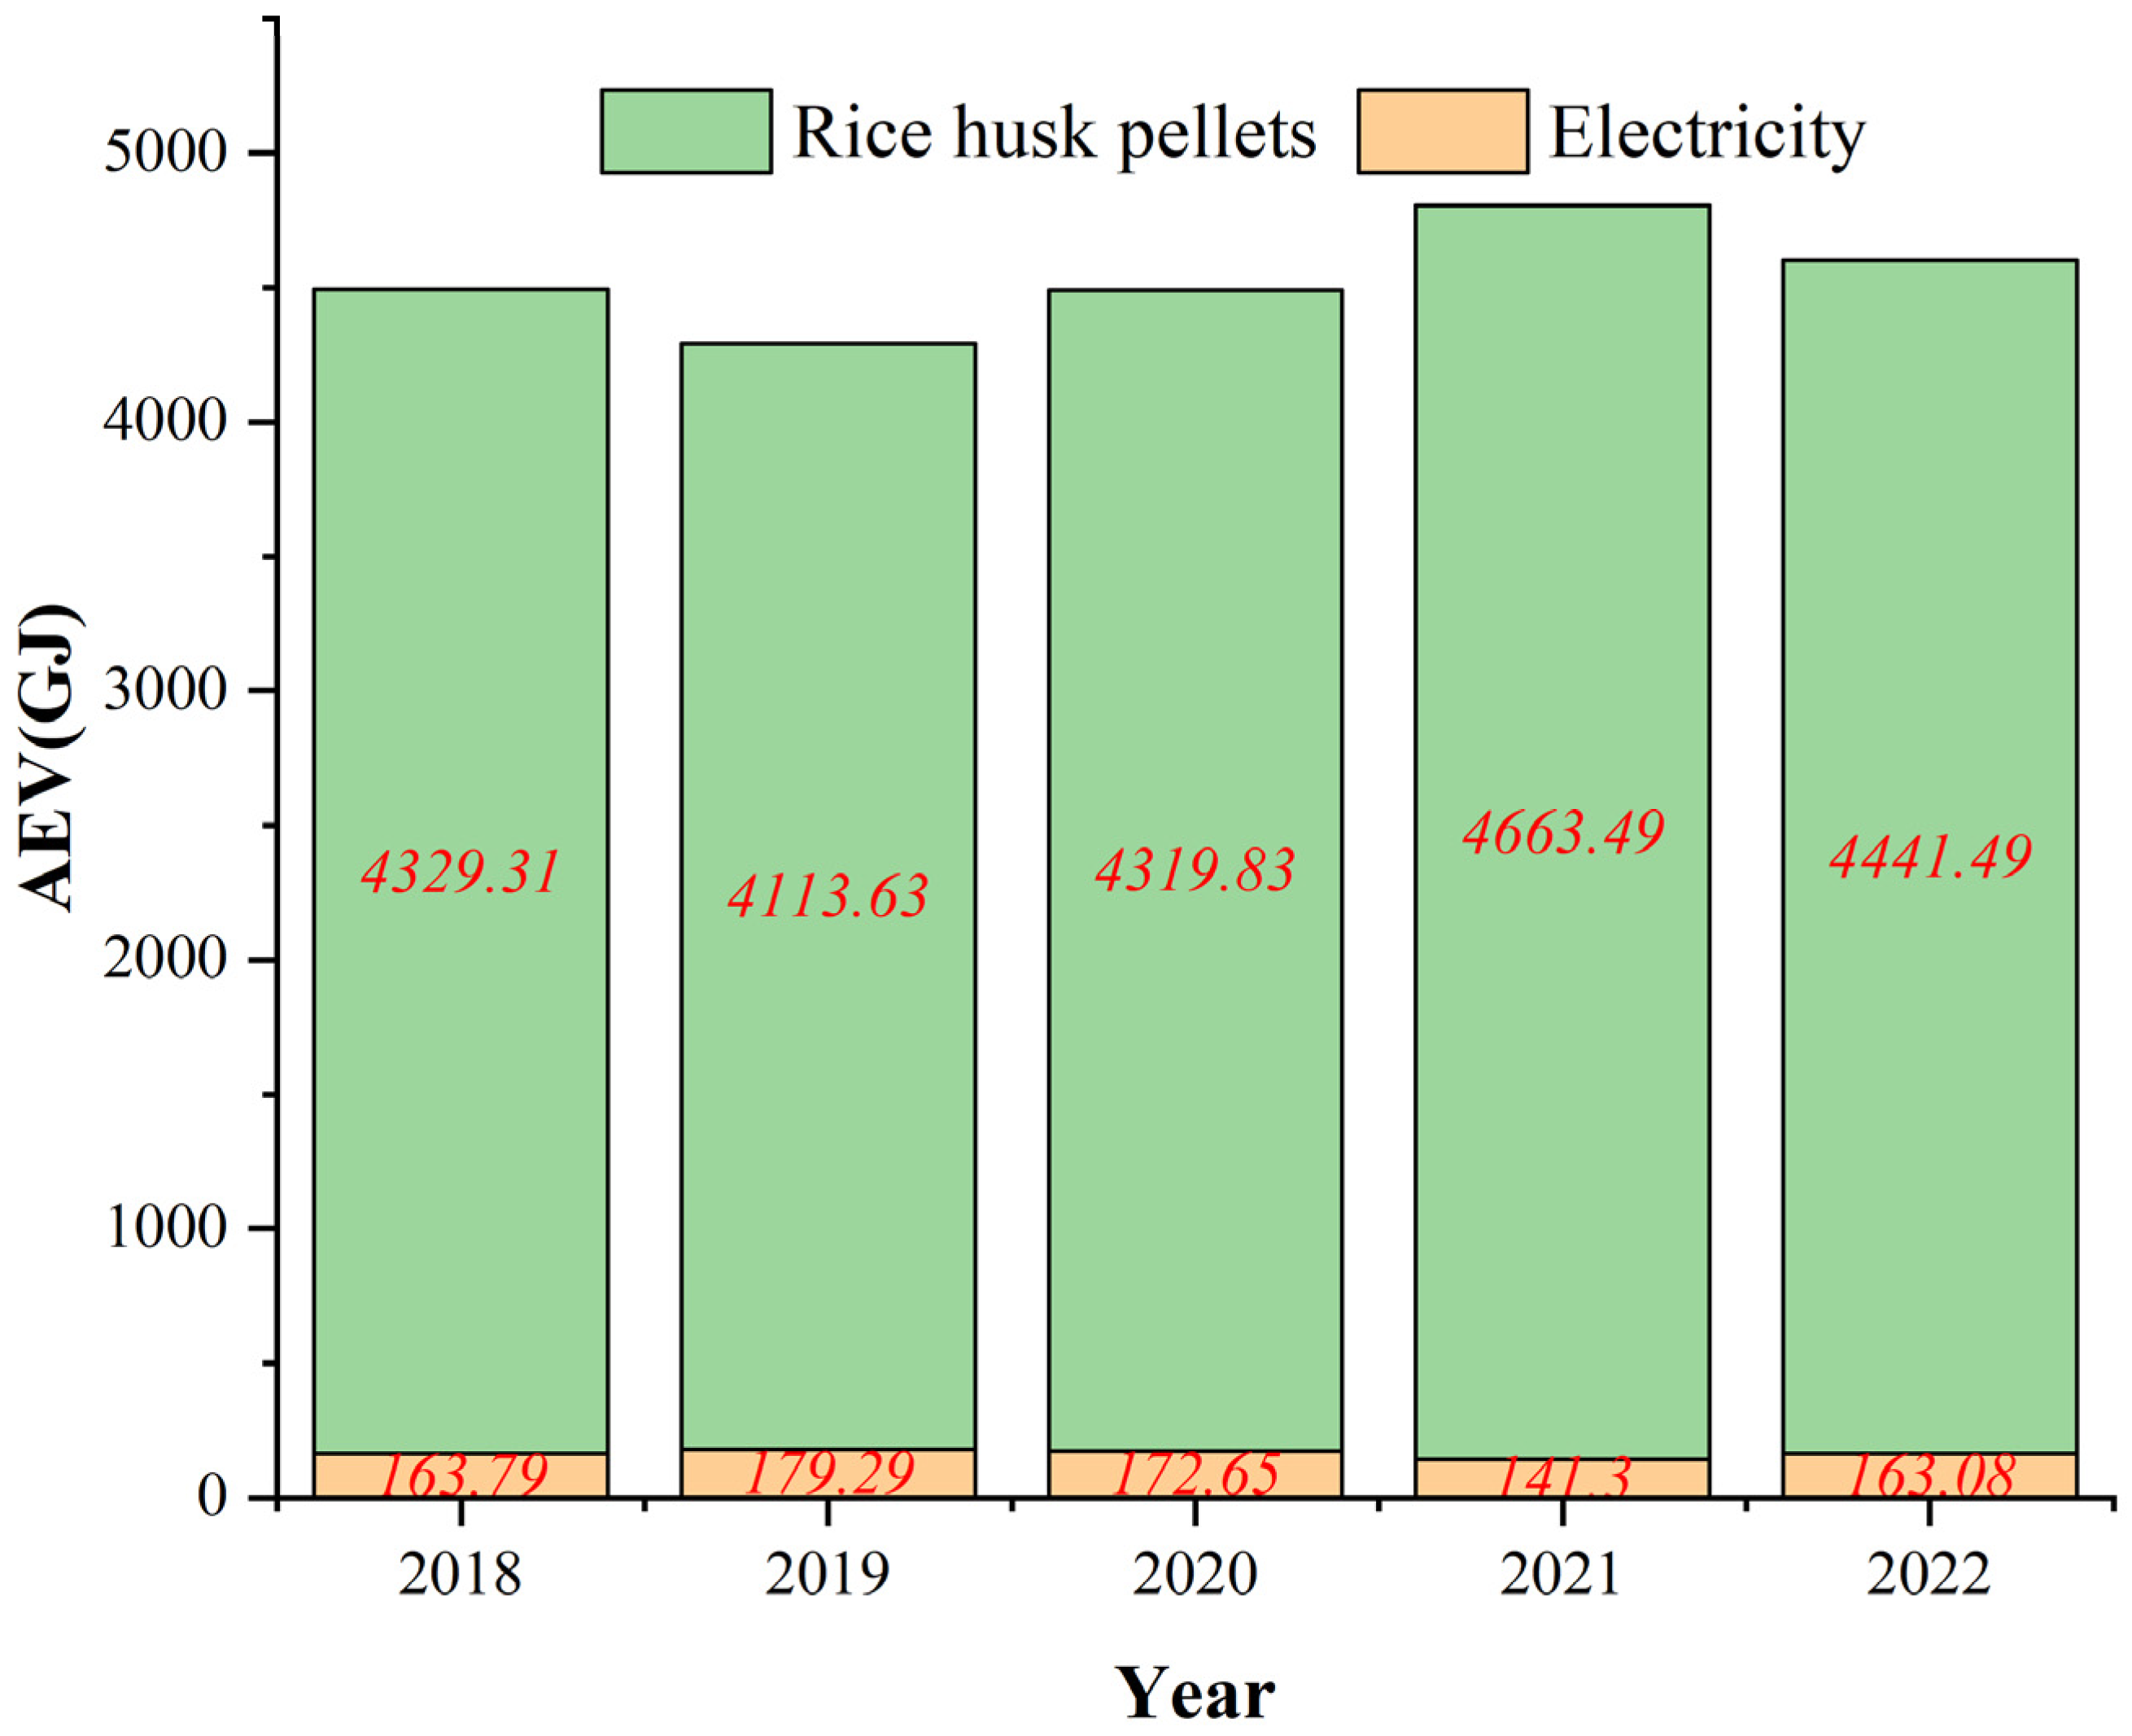
Figure 10.
CO2 emissions from electricity consumption and RHP consumption at KHS Factory from 2016 to 2022 (bar chart); and CO2 emissions from the production of one ton of fishmeal during the same period (line chart).
Figure 10.
CO2 emissions from electricity consumption and RHP consumption at KHS Factory from 2016 to 2022 (bar chart); and CO2 emissions from the production of one ton of fishmeal during the same period (line chart).
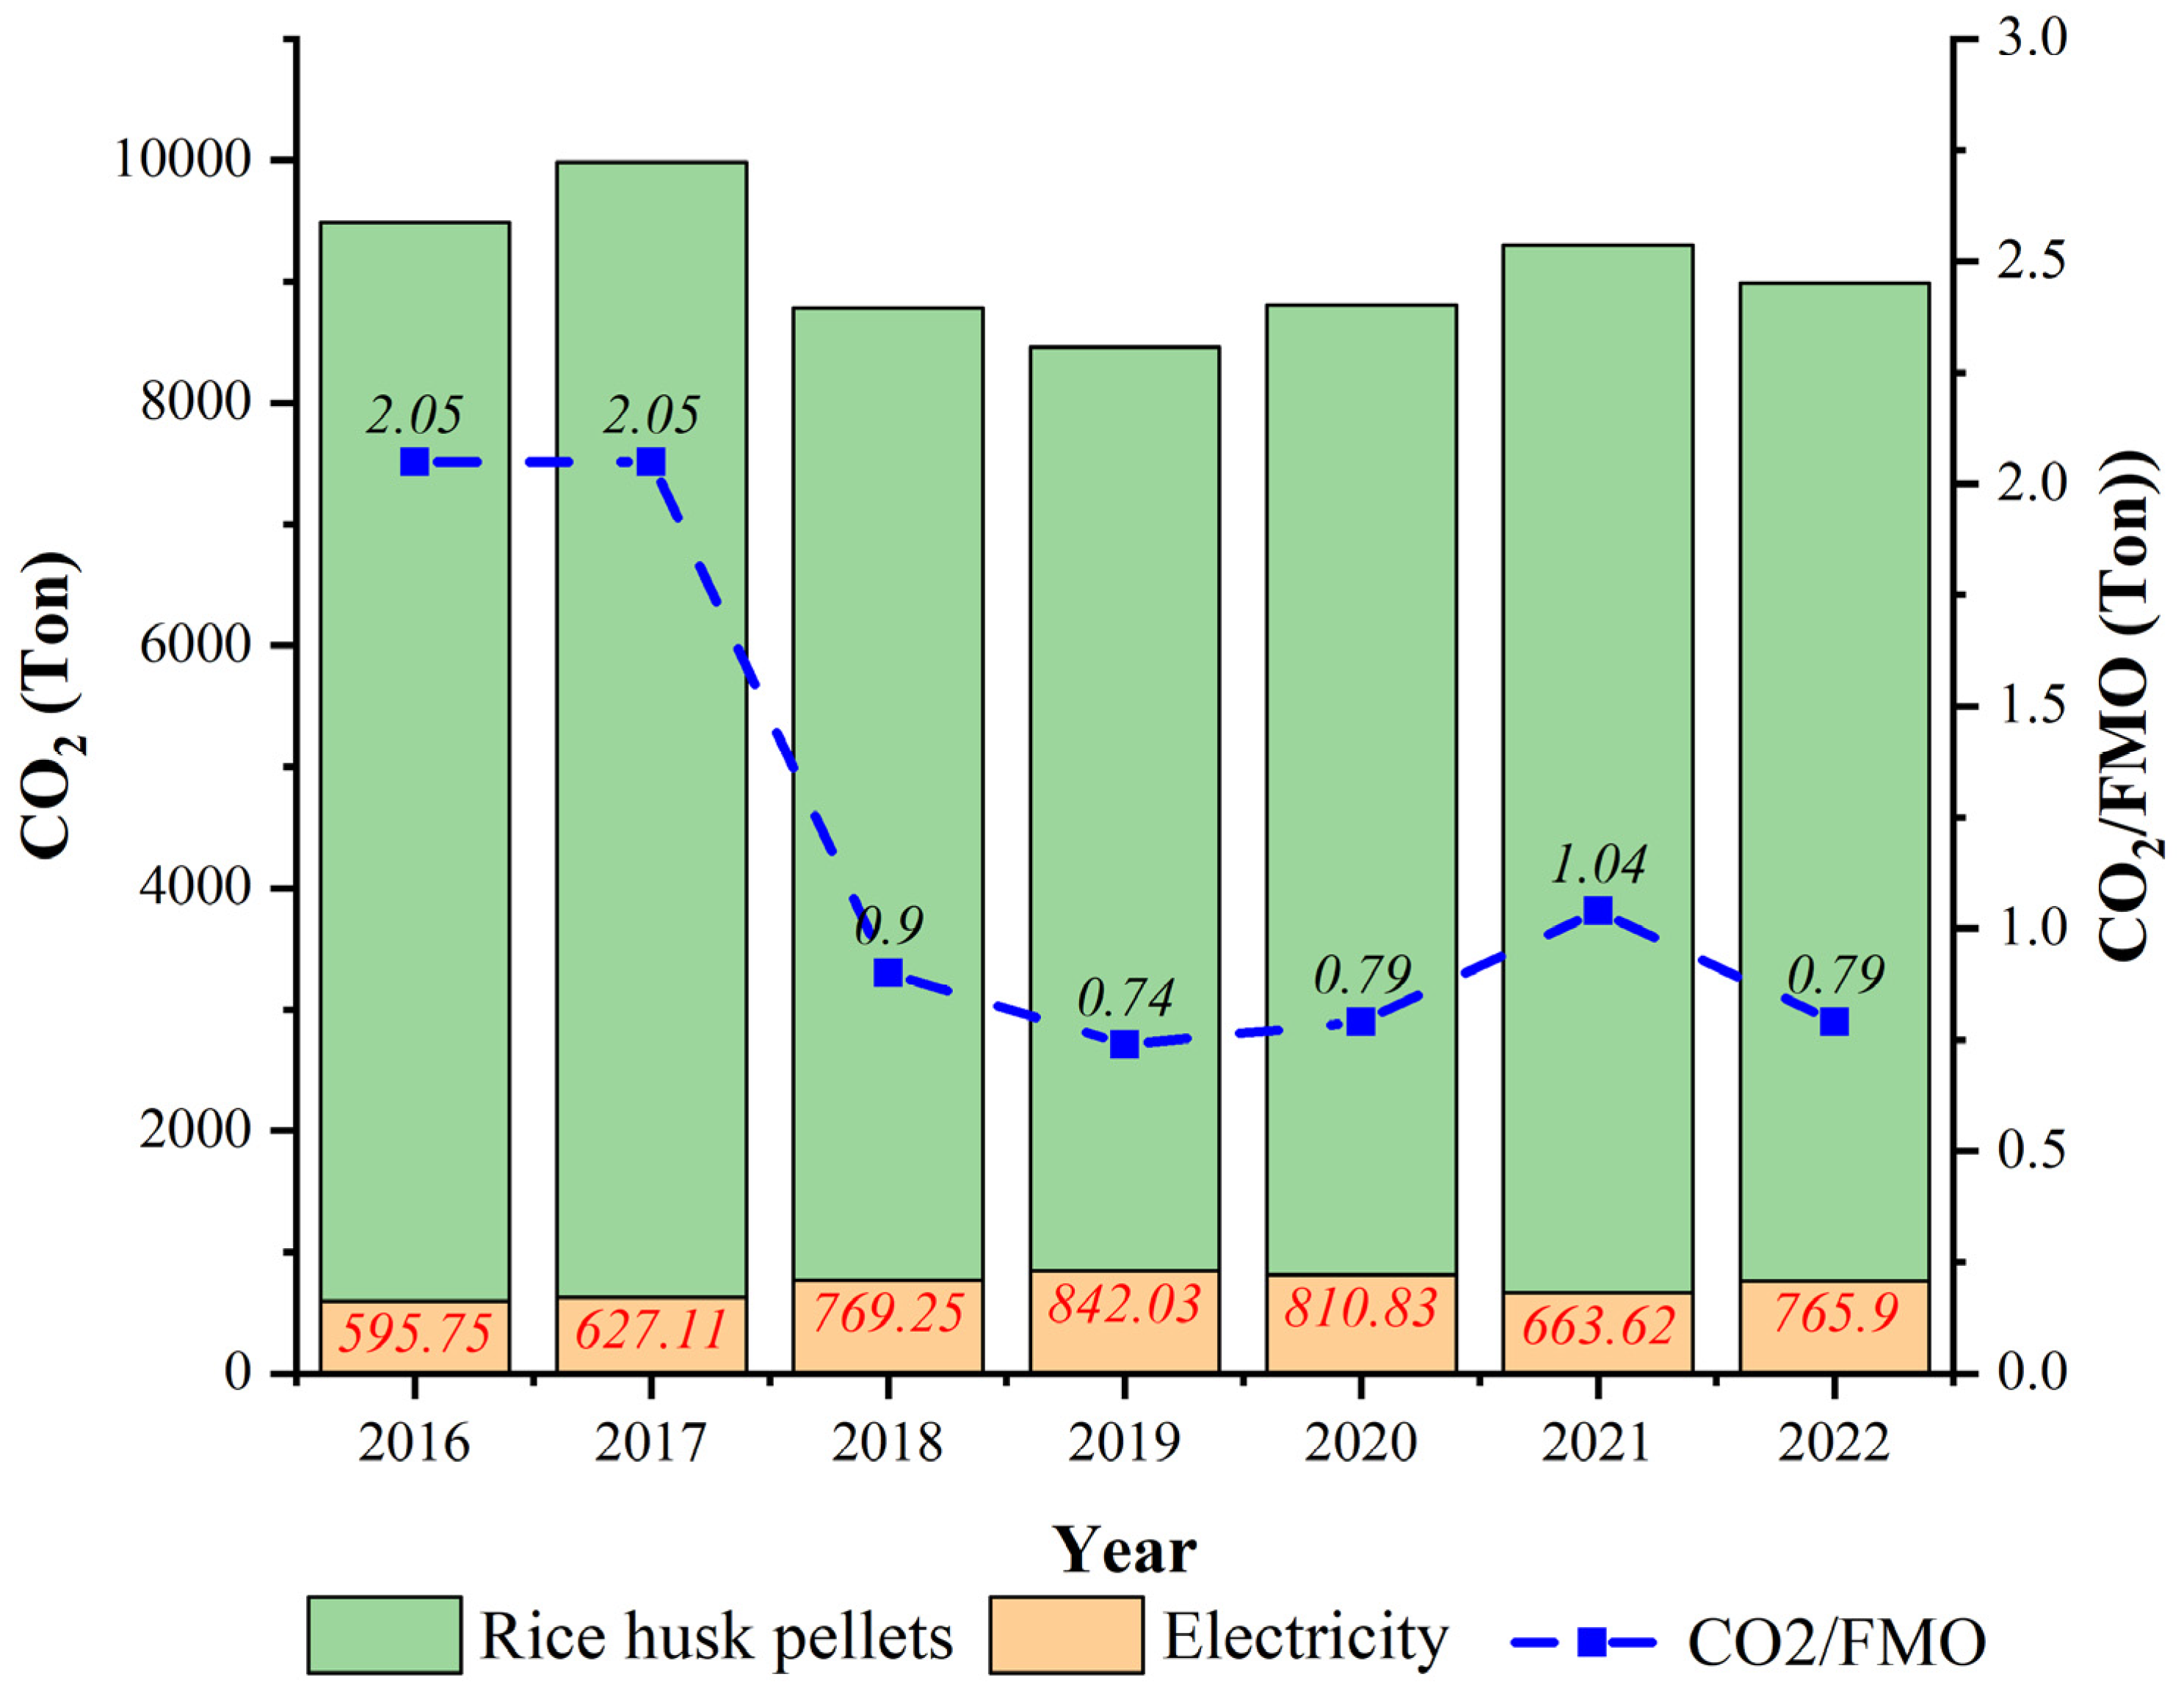

Table 1.
Annual SEC index difference at the KHS factory before and after economizer installation.
| Pair of years | t | df | p-value | Mean Difference |
95% Confidence Interval of Difference | |
|---|---|---|---|---|---|---|
| Lower | Upper | |||||
| (y2016,y2018) | 2.43 | 20.95 | 0.024 | 9.87 | 1.42 | 18.33 |
| (y2016,y2019) | 3.92 | 14.66 | 0.001 | 13.49 | 6.19 | 20.83 |
| (y2016,y2020) | 3.84 | 14.52 | 0.002 | 13.18 | 5.85 | 20.52 |
| (y2016,y2021) | 3.27 | 13.88 | 0.006 | 11.08 | 3.81 | 18.34 |
| (y2016,y2022) | 3.90 | 13.91 | 0.002 | 13.20 | 5.93 | 20.47 |
| (y2017,y2018) | 2.43 | 20.96 | 0.024 | 9.87 | 1.42 | 18.32 |
| (y2017,y2019) | 3.92 | 14.66 | 0.001 | 13.49 | 6.15 | 20.83 |
| (y2017,y2020) | 3.85 | 14.52 | 0.002 | 13.18 | 5.86 | 20.52 |
| (y2017,y2021) | 3.28 | 13.89 | 0.006 | 11.08 | 3.82 | 18.34 |
| (y2017,y2022) | 3.90 | 13.92 | 0.002 | 13.20 | 5.94 | 20.47 |
Note: "t": the t-value, "df": degrees of freedom, "p-value": the statistical significance of the results, "Mean Difference": the average difference between the means of the compared groups.
Table 2.
Annual energy cost savings at the KHS factory after the installation of the economization system (unit: USD).
Table 2.
Annual energy cost savings at the KHS factory after the installation of the economization system (unit: USD).
| 2018 | 2019 | 2020 | 2021 | 2022 | Mean | |
|---|---|---|---|---|---|---|
| AECSEC | 5,161.30 | 6,122.45 | 6,008.51 | 4,881.21 | 5,568.91 | 5,548.48 |
| AECSRHPC | 20,714.34 | 19,682.38 | 20,668.98 | 22,313.28 | 21,251.08 | 20,926.01 |
| TAECS | 25,875.64 | 25,804.84 | 26,677.49 | 27,194.49 | 26,819.99 | 26,474.49 |
Note: AECSEC: Annual energy cost savings from electricity consumption, AECSRHPC: Annual energy cost savings from RHP consumption, TAECS: total annual energy cost savings.
Disclaimer/Publisher’s Note: The statements, opinions and data contained in all publications are solely those of the individual author(s) and contributor(s) and not of MDPI and/or the editor(s). MDPI and/or the editor(s) disclaim responsibility for any injury to people or property resulting from any ideas, methods, instructions or products referred to in the content. |
© 2023 by the authors. Licensee MDPI, Basel, Switzerland. This article is an open access article distributed under the terms and conditions of the Creative Commons Attribution (CC BY) license (http://creativecommons.org/licenses/by/4.0/).
Copyright: This open access article is published under a Creative Commons CC BY 4.0 license, which permit the free download, distribution, and reuse, provided that the author and preprint are cited in any reuse.


