
Submitted:
04 August 2023
Posted:
08 August 2023
You are already at the latest version
Abstract
This study investigates the cyclic load application impact on fly ash-based geopolymer composites that are reinforced with a low amount of fibre reinforcement. For reinforcement purposes, PVA and steel fibres are used. For testing purposes, four geopolymer composite mixes were made, 3 of which had fibre reinforcement. Simultaneously specimens were tested for shrinkage, static load-induced creep, and cyclic load-induced creep. For static and cyclic creep testing, specimens were loaded with 20% of their strength. For cyclic creep testing, load application and release cycles were seven days long. When each cycle was introduced, the load was added in steps. In 5 minutes, by 25% steps of the necessary load, the specimens were loaded or unloaded. Only plain specimens show that static creep strains are within cyclic creep strains. For all the other specimens, the static load is higher than the cyclic load-induced creep amplitude. Also, 1% PVA fibre-reinforced specimens show the most elastic characteristics under cyclic load, and 1% steel fibre-reinforced specimens appear to be the most resistant to the cyclic load introduction.
Keywords:
fly ash-based geopolymer composite
; long-term properties under cyclic load
; fibre-reinforced geopolymer
1. Introduction
As it is known, unreinforced cementitious materials exhibit high brittleness and low tensile strength. Therefore, they do not have favorable mechanical properties in case of dynamic loading such as earthquakes, explosions, impacts, and others [1]. Also, cyclic loading is not desirable for structures of offshore platforms and railway infrastructure [2]. Furthermore, it has been showed and calculated that existing reinforcement in concrete bridges would not restrict long-term strains as it has been anticipated in the design stage but according to currently available creep models they would exceed these strains significantly [3]. Many scientists [4], including Bažant [5], concluded that the superposition of static creep loading and cyclic loading increases long-term strains of concrete. If these strains are underestimated, it can result in significant damage and concerns safety aspects.
Static loading caused total strain (εtot, cr) is divided in elastic strain (εel) and time-dependent creep strain partition (ευ,cr), as it is shown in Figure 1b. Creep strain, as such, can be partialized in viscoelastic (ευ,el) and viscoplastic (ευ,pl) parts. In case of applied stress level exceeds 40% of the ultimate stress level, then additional plastic strains are caused due to structural changes into the microstructure. In this case, the plastic strain caused by a structural change of microstructure is considered as a part of the viscoplastic strain (ευ,pl) part. In cases of high-stress application, the strain development can be divided into three groups:
- In the first stage, strains increase greatly;
- In the second stage, strains develop more moderately;
- In the third stage, strains again increase rapidly until failure due to high-stress application [3].
Strain development throughout data recording is connected mainly with microcrack development, and their amount increases throughout testing time [3].
The cyclic load applications (Figure 1c) caused total strain can be partialized into elastic strain (εtot, cycl) partition and a time-dependent, viscous strain (ευ) partition (Figure 1d). Additionally, a load cycle-dependent plastic strain is introduced due to damage [6]. The viscous strain part (ευ) can be divided into viscoelastic (ευ,el) part and viscoplastic strain part (ευ,pl). The strain growth at minimum and maximum stress peak (correspondingly εtot,max and εtot,min) is usually investigated with the cyclic strain analysis. The maximum strains can be divided into elastic (εel) and viscous (ευ) parts. The strain development for εtot,max, and εtot,min can be divided into three parts:
- Disproportionate strain increase. This is due to the increased growth of microcracks and consequent plastic settlement during first loading cycles;
- Linear strain increase. In this part, the microcrack development speed is stable with diffuse character;
- Disproportionate strain increases up to specimen failure. It is only reached in high-stress level cases. It happens due to the unstable growth of microcrack net that connects and develops earlier caused microcracks [3].
The most widely used construction material for such civil infrastructure as tunnels, bridges and roads as well as buildings is Portland cement (PC). For these structures the most preferable and widely used material is steel. Due to the fact that population keeps on increasing the need and demand for infrastructure and civil building will keep increasing, therefore, it is not likely that the demand for Portland cement and steel will stabilize. On contrary most likely the demand will increase and consequently the CO2 emissions will increase as well [7]. It has been estimated that cement production alone contributes 5% of global CO2 emissions [8]. According to various assessments replacing Portland cement as a binder with a geopolymer binder brings CO2 emissions from a moderate 9% to 64% [9,10]. Geopolymer composites are considered as a sustainable alternative material to the PC base composites mainly because it utilizes industrial waste materials as binders, such as, fly ash and various slags. Geopolymer has great resistance to fire, acid, and sulfate attack and if the design is right it can have high compressive strength [7].
The steel fiber reinforcement usage as a replacement reinforcement to steel bars has increased in the past decades. Main reasons for such change is the relatively easy usage of the fiber reinforcement and increased corrosion resistance of the concrete that has been reinforced with steel fibres. In steel fibre reinforced concrete the fibres are introduced in low amount to increase toughness and ductility [2].
It has been shown that compression at low load levels causes the strengthening of concrete specimens. Under high levels of compression, the non-linear mechanical behavior of concrete emerges [11].
This research aims to see if static loading causes lower amounts of creep strains than cyclic loading and does fibre reinforcement helps to reduce static and cyclic loading impact on creep strains of geopolymer composites.
2. Materials and Methods
The matrix of the geopolymer composite specimens was based on fly ash. Fly ash was mixed with sand with a proportion of 1:1. As a activator 10 mol NaOH and Na2O + SiO2 solution was used that was added to the sand and fly ash mix after the sand and fly ash was mixed together in dry state. For the testing purposes four geopolymer mixes in equal specimens amounts were prepared. Four reinforced specimens 1% PVA, 1% steel and 0.5% PVA and 0.5% steel fibres were used. Also, specimens without reinforcement were prepared. Precises preparation procedure and fly ash chemical composition can be found in [12,13,14]
Specimen size and consequently long- term tests were done based on RILEM TC 107-CSP recommendations [15]. Specimens were cylinders with dimensions of Ø46 × 190 mm or approximately 1:4 diameter-to-height ratio. For stain gauge attachment, six aluminum plates (10 × 15 mm) were glued in pairs to each specimen. Afterward, strain gauges were attached to those plates. The same preparations are done for the shrinkage specimens. Long-term strain tests (shrinkage, static creep, cyclic creep) were done in a laboratory conditions with controlled atmosphere conditions: temperature 24 ± 1 °C and relative humidity 30% ± 3%.
The readings of shrinkage and static creep strains were monitored every day for the first two weeks, after which they were monitored every other day. A constant load was applied throughout the whole static creep testing period. The specimens were loaded with a load equivalent to 20% of the ultimate compressive strength, which was determined in compressive strength tests prior to long-term tests. The readings of the cyclic creep strains were monitored every day, especially on the day when specimens were loaded, or the load was taken of the readings were taken prior to the load application or unloading and every hour till within spec of one hour the strain did not change. The cyclic creep specimens were gradually loaded up to the same stress level as the static creep specimens by steps of 25% of the necessary load in a short period (within 5 min). Cyclic loads were applied and unloaded every 7th day.
3. Results and Discussion
Compressive strength of the specimens was determined before the creep tests at the age of 28 days. The compressive strength was determined to total of 16 specimens (4 from each geopolymer composite composition) that were the same shape as the creep specimens. The compressive strength results are represented in Figure 2.
The necessary load that has to be applied to creep test stands is calculated from average compressive strength values in Figure 2. Also, if the Figure 2 results are looked together with the claims made by Moradikhou [16], that the compressive should slightly improve if fibre reinforcement is used it is visible that in this case, all of the fibre reinforced composites show lower compressive strength values than plain geopolymer mortar. It might seem that the used fibre amount is not sufficient but as the Ravinder et al. have showed when used fibre dosage is increased from 0% to 0.3%, the compressive strength should increase by 6% [17]. From Figure 2, it is clear that none of the used reinforcement amounts improves compressive strength capacity. The compressive strength in contrast to plain specimens has decreased by 20.22%, 17.66%, and 6.00% for 1% PVA fibre, 1% steel fibre, and 0.5% PVA and 0.5% steel fibre reinforced geopolymer composite specimens respectfully. It has been reported that increase of compressive strength is possible till certain amount of the specific fibres. When this amount is exceeded, compressive strength gradually reduces. Authors have found out that for high-strength concrete fiber usage up to 0.60% by volume increased compressive strength. When this amount was exceeded compressive strength dropped down significantly to the compressive strength of a plain high-strength concrete [18,19]. In this case, it is clear to see that because of the relatively large size of PVA and steel fibres the specific surface area of the fibres in the specimen is insufficient to make any improvement in compressive strength values. To improve compressive strength values, it would be necessary to increase fibre amount to 3%.
The static and cyclic creep as well as shrinkage tests, begun right after the initial compressive strength test. The static creep, cyclic creep and shrinkage tests lasted for 105 days. The static creep and cyclic creep test active phase was 91 days with 14-day relaxation stage or in other words on 91st day specimens were unloaded (for cyclic creep specimens that was the last unloading) and they were kept unloaded for 14 days (2 weeks) as it is shown in Figure 3.
Figure 3 shows that the static creep strains are significantly higher than cyclic creep strains. The exception is plain geopolymer composite. On average static creep strains are 21.70%, 37.69% and 27.64% larger than cyclic for 1% PVA fibre, 1% steel fibre and 0.5% PVA and 0.5% steel fibre reinforced geopolymer specimens. For plain geopolymer composites, the cyclic creep strains are, on average, 21.12% larger than static creep strains. A similar correlation between previously stated cyclic creep strains and static creep strains is visible when the specimens are unloaded. For all of the fibre-reinforced specimens, static creep strains hold a significantly higher amount of plastic strains than the specimens that have been subjected to cyclic load. The exception here is the plain geopolymer composite specimens that show lower plastic stains for static creep curves.
The Static and cyclic creep strains are shown in Figure 4.
Yet it is not entirely conclusive from Table 1, Figure 2, Figure 3 and Figure 4 which one of the tested geopolymer composites shows the lowest possibility to creep under static and cyclic load. Therefore, the specific creep is shown in Figure 5.
From Figure 5, it is apparent that the largest specific creep under static load is to 1% steel fibre reinforced geopolymer composite that is followed by almost identical specific creep under static load values of 1% PVA fibre reinforced and 0.5% PVA and 0.5% Steel fibre reinforced geopolymer composites and are on average 11.41% and 12.89% lower. The specific creep value under static loading is surprisingly low for plain geopolymer composite and on average is 32.40% lower than the specific creep value under static load of 1% steel fibre reinforced geopolymer composite.
The cyclic creep strain and shrinkage strain relation is shown in Figure 6.
As is visible in Figure 6, shrinkage for plain and 1% PVA fibre-reinforced geopolymer composites is almost identical is it is to 1% steel fibre and 0.5% PVA fibre, and 0.5% steel fibre-reinforced composites. The shrinkage strain development for plain and 1% PVA fibre-reinforced geopolymer composites is significantly more rapid than for 1% steel fibre and 0.5% PVA fibre, and 0.5% steel fibre-reinforced geopolymer composites. For the first 64 days of the testing, 1% steel fibre and 0.5% PVA fibre, and 0.5% steel fibre reinforced geopolymer composites show, on average, 30.34% shrinkage strains of the plain and 1% PVA fibre-reinforced geopolymer composite shrinkage strains. After the 64th day of the testing, plain and 1% PVA fibre-reinforced composite specimens show on average, 38.31% lower shrinkage strains than 1% steel fibre and 0.5% PVA fibre, and 0.5% steel fibre-reinforced geopolymer composites.
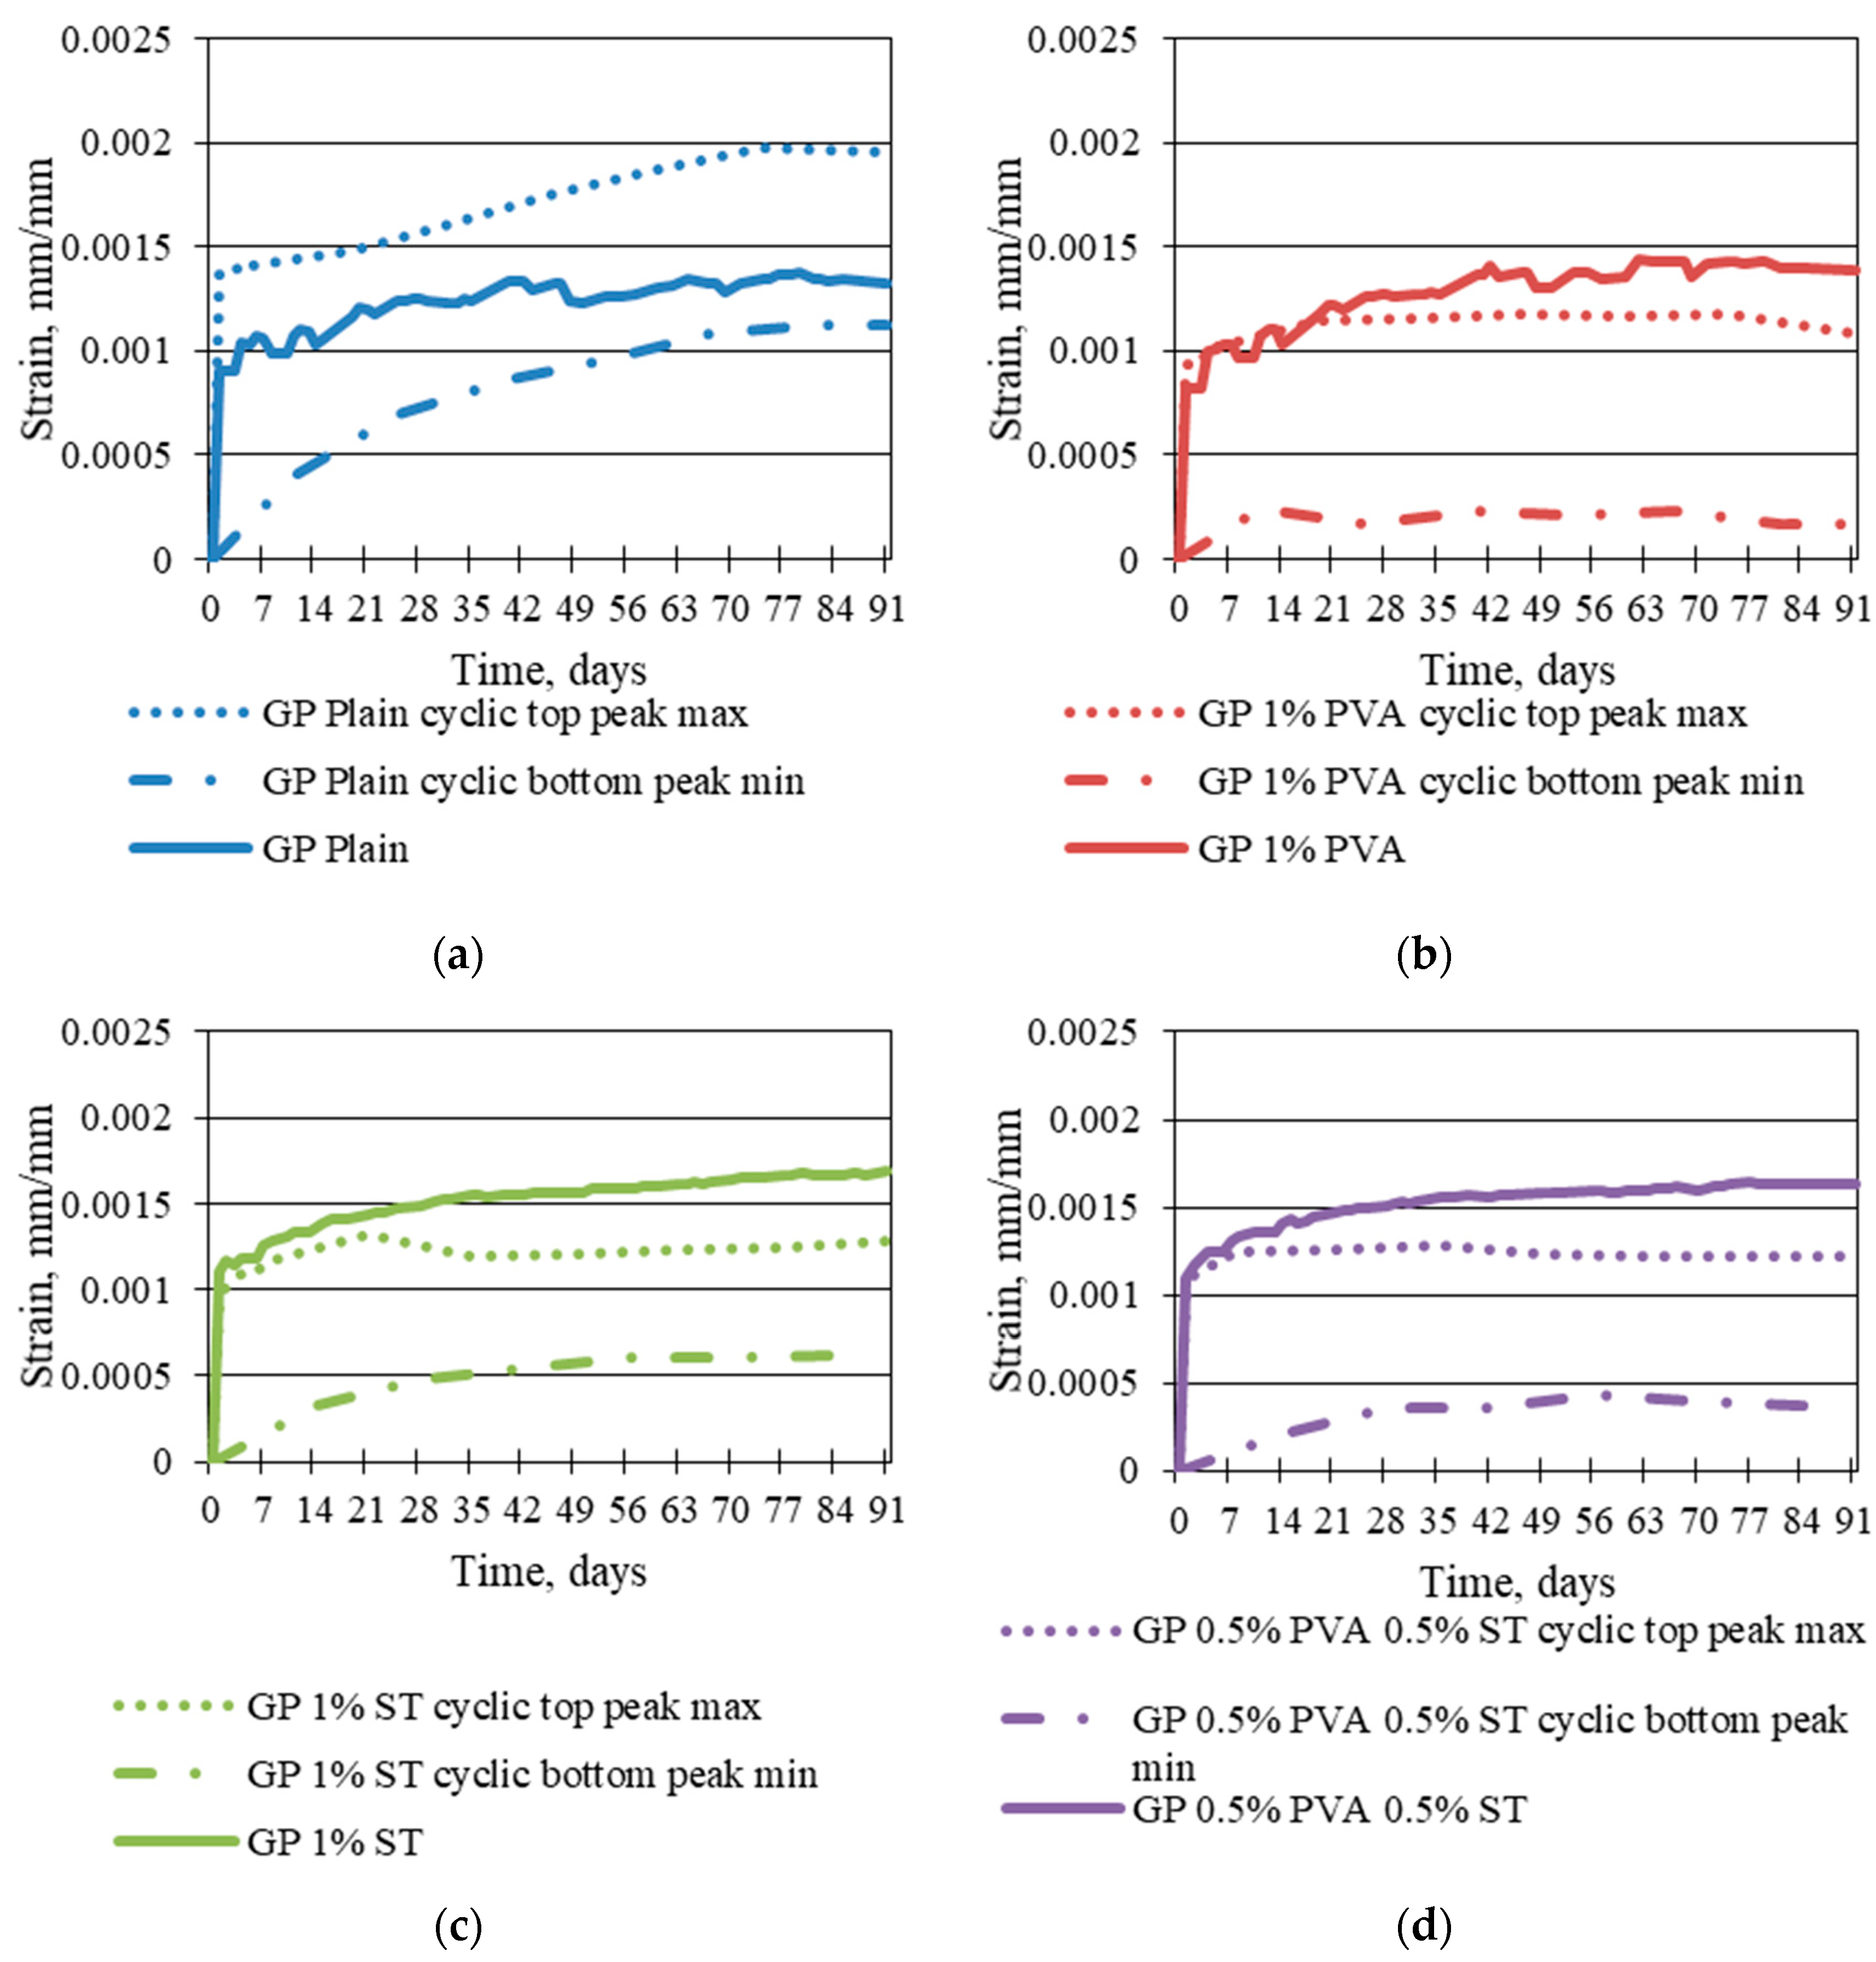
To further evaluate cyclic creep strain differences from static creep strains in Figure 7, the cyclic creep strain maximum top peak and minimum bottom peak points are made into separate curves and represented together static creep strain curve surface area in the graph.
In graphs of Figure 7, it is apparent that only geopolymer composite that has static creep strains within the area between the curves made from cyclic creep strain curve maximum top peak and minimum bottom peak points is plain geopolymer composite (Figure 7a). Static creep strains for all other geopolymer composites step out of the area between the previously mentioned maximum and minimums curves. This further shows that fibre inclusion in the geopolymer matrix does reduce plastic strain acquiring. The most significant improvement is to 1% steel fibre, which reduces plastic creep to a peak of 37.19% on average and is followed by 0.5% PVA and 0.5% ST and 1% PVA fibre reinforced specimens with cyclic creep top peak reduction of 33.06% and 24.40% correspondingly. For plain specimens, cyclic creep top peaks are 21.98% higher than static creep values.
Also, as it is shown in Figure 7c, the 1% steel fibre reinforced specimen, the difference between cyclic creep top and bottom peaks is lower than all the rest of the tested geopolymer composites. For the plain specimens, the difference or the amplitude of top and bottom peaks of cyclic creep is 14.88% higher than 1% steel fibre reinforced specimens. For 0.5% PVA and 0.5% ST, and 1% PVA fibre-reinforced specimens, this amplitude is 51.02% and 62.35% higher than 1% steel fibre-reinforced specimens correspondingly. For 1% steel fibre reinforced specimens, the amplitude of top and bottom peaks of cyclic creep is 0.00025689 mm/mm on average.
From the Figure 7 curves, it is clear that fibre inclusion into the geopolymer matrix makes the material act in compression under cyclic load application more elastically than without fibre addition. Furthermore, PVA fibre addition makes the material more elastic than steel fibre addition. This can be drawn from the top and bottom amplitudes of cyclic creep where for 1% PVA fibre reinforced specimens the bottom cyclic creep values are on average 45.45%, 65.26%, and 80.34% lower than 0.5% PVA, and 0.5%ST, 1%ST and plain geopolymer composite cyclic creep bottom values. Furthermore, 1% PVA fibre-reinforced geopolymer composite cyclic creep to peaks are within a 3% gap of the 1%ST and 0.5% PVA and 0.5% ST fibre-reinforced specimen and only 35.19% lower than plain specimen cyclic creep top values. Still, the cyclic creep strain amplitude for 1% PVA fibre-reinforced specimens is the largest of all the tested specimens, 0.000682 mm/mm correspondingly.
4. Conclusions
The long-term property tests under static and cyclic loads were done for a total of 105 days. For 91 days, the specimens were intended for long-term cyclic load-induced creep measurements. The main conclusions are:
- Under static loading, fibre inclusion does not always reduce long-term properties. For creep reduction, the most effective was 1% PVA fibre usage which still was 4.36% higher than plain specimens creep strains under static loading. By using 0.5% PVA and 0.5% St and 1% ST fibre reinforcement, the creep strains were 17.06% and 18.05% higher than plain specimens.
- Under cyclic long-term load application, the most resistant or with the lowest cyclic creep values and strain amplitudes were specimens with 1% steel fibre reinforced. Plain specimens had 14.88% higher amplitude and 0.5% PVA and 0.5% ST and 1% PVA fibre-reinforced specimens had 51.02% and 62.35% higher cyclic creep amplitude range than 1% ST fibre-reinforced specimens. The cyclic creep on average was 3.03%, 5.03%, and 14.88% higher than the 1% PVA, 0.5% PVA, and 0.5% ST fibre-reinforced specimens and plain specimens correspondingly.
- The most elastic under long-term cyclic load application was 1% PVA fibre reinduced specimens that, on average, had 23.14%, 55.77%, and 62.35% higher cyclic creep amplitude than 0.5% PVA and 0.5% ST, plain specimen, and 1% ST fibre reinforced specimen cyclic creep amplitudes. They also showed the lowest bottom values of cyclic creep of 0.0021 mm/mm which was 45.45%, 65.26%, and 80.34% lower than 0.5% PVA and 0.5% ST, 1% ST fibre reinforced and plain geopolymer specimen bottom cyclic creep values.
Author Contributions
Conceptualization, R.G. and A.S.; methodology, R.G.; software, R.G.; validation, R.G., and P.G.; formal analysis, R.G.; investigation, R.G.; resources, M.L.; data curation, R.G.; writing—original draft preparation, R.G.; writing—review and editing, A.S. and L.P.; visualization, R.G.; supervision, L.P.; project administration, A.S. and L.P.; funding acquisition A.S. and M.L. All authors have read and agreed to the published version of the manuscript.
Data Availability Statement
Not applicable.
Acknowledgments
This work was supported by the European Social Fund within the Project No 8.2.2.0/20/I/008 ”Strengthening of PhD students and academic personnel of Riga Technical University and BA School of Business and Finance in the strategic fields of specialization” of the Specific Objective 8.2.2 ”To Strengthen Academic Staff of Higher Education Institutions in Strategic Specialization Areas» of the Operational Programme «Growth and Employment”. This work has been supported by the Latvian Council of Science within the scope of the project “Foamed Geopolymer Made by Additive Manufacturing for the Construction Technology Applications (3D-FOAM)” No. project9608.
Conflicts of Interest
The authors declare no conflict of interest.
References
- A. C. C. Trindade, A. A. Heravi, I. Curosu, M. Liebscher, F. de Andrade Silva, and V. Mechtcherine, “Tensile behavior of strain-hardening geopolymer composites (SHGC) under impact loading,” Cem. Concr. Compos., vol. 113, no. June, 2020. [CrossRef]
- S. Blasón, E. Poveda, G. Ruiz, H. Cifuentes, and A. Fernández Canteli, “Twofold normalization of the cyclic creep curve of plain and steel-fiber reinforced concrete and its application to predict fatigue failure,” Int. J. Fatigue, vol. 120, no. November 2018, pp. 215–227, 2019. [CrossRef]
- B. Kern, N. Oneschkow, A. Podhajecky, L. Lohaus, S. Anders, and M. Haist, “Comparative analysis of concrete behaviour under compressive creep and cyclic loading,” Int. J. Fatigue, p. 106409, 2021. [CrossRef]
- C. P. Whaley and A. M. Neville, “Non-elastic deformation of concrete under cyclic compression,” Mag. Concr. Res., vol. 25, no. 84, pp. 145–154, 1973. [CrossRef]
- Z. P. Bažant, R. Wendner, M. H. Hubler, and Q. Yu, “Pervasive lifetime inadequacy of long-span box girder bridges and lessons for multi-decade creep prediction,” Life-Cycle Sustain. Civ. Infrastruct. Syst. - Proc. 3rd Int. Symp. Life-Cycle Civ. Eng. IALCCE 2012, no. October, pp. 42–50, 2012.
- N. Oneschkow, “Fatigue behaviour of high-strength concrete with respect to strain and stiffness,” Int. J. Fatigue, vol. 87, pp. 38–49, 2016. [CrossRef]
- Z. Huang et al., “Shear behaviour of ambient cured geopolymer concrete beams reinforced with BFRP bars under static and impact loads,” Eng. Struct., vol. 231, no. June 2020, p. 111730, 2021. [CrossRef]
- K. Z. Farhan, M. A. M. Johari, and R. Demirboğa, “Impact of fiber reinforcements on properties of geopolymer composites: A review,” J. Build. Eng., vol. 44, no. April, 2021. [CrossRef]
- J. L. Provis, A. Palomo, and C. Shi, “Cement and Concrete Research Advances in understanding alkali-activated materials,” Cem. Concr. Res., vol. 78, pp. 110–125, 2015. [CrossRef]
- S. Huey, T. Wiedmann, A. Castel, and J. De Burgh, “Hybrid life cycle assessment of greenhouse gas emissions from cement, concrete and geopolymer concrete in Australia,” J. Clean. Prod., vol. 152, pp. 312–320, 2017. [CrossRef]
- G. Kim, G. Loreto, J. Y. Kim, K. E. Kurtis, J. J. Wall, and L. J. Jacobs, “In situ nonlinear ultrasonic technique for monitoring microcracking in concrete subjected to creep and cyclic loading,” Ultrasonics, vol. 88, pp. 64–71, 2018. [CrossRef]
- R. Gailitis, A. Sprince, T. Kozlovskis, L. Radina, L. Pakrastins, and N. Vatin, “Long-Term Properties of Different Fiber Reinforcement Effect on Fly Ash-Based Geopolymer Composite,” pp. 1–8, 2021.
- K. Korniejenko, “Geopolymers for Increasing Durability for Marine Infrastructure,” Spec. Publ., vol. 326.
- M. Łach, J. Mikuła, and M. Hebda, “Thermal analysis of the by-products of waste combustion,” J. Therm. Anal. Calorim., vol. 125, no. 3, pp. 1035–1045, 2016. [CrossRef]
- P. Acker et al., “RILEM TC 107-CSP: CREEP AND SHRINKAGE PREDICTION MODELS: PRINCIPLES OF THEIR FORMATION Recommendation Measurement of time-dependent strains of concrete,” Mater. Struct., vol. 31, pp. 507–512, Oct. 1998.
- B. Moradikhou, A. Esparham, and M. Jamshidi Avanaki, “Physical & mechanical properties of fiber reinforced metakaolin-based geopolymer concrete,” Constr. Build. Mater., vol. 251, p. 118965, 2020. [CrossRef]
- R. Ravinder, V. Kumar, C. Kumar, A. Prakash, and P. V. V. S. S. R. Krishna, “Strength Characteristics of Fibrous Self Curing Concrete Using Super Absorbent Polymer Strength Characteristics of Fibrous Self Curing Concrete Using Super Absorbent Polymer,” no. July, pp. 5–10, 2019.
- T. W. Ahmed, A. A. M. Ali, and R. S. Zidan, “Properties of high strength polypropylene fiber concrete containing recycled aggregate,” Constr. Build. Mater., vol. 241, p. 118010, 2020. [CrossRef]
- S. P. Yap, C. H. Bu, U. J. Alengaram, K. H. Mo, and M. Z. Jumaat, “Flexural toughness characteristics of steel-polypropylene hybrid fibre-reinforced oil palm shell concrete,” Mater. Des., vol. 57, pp. 652–659, 2014. [CrossRef]
Figure 1.
Schemes of static creep loading in time (a) corresponding strain in time (b), cyclic creep loading in time (c) and corresponding strain development in time (d) [3].
Figure 1.
Schemes of static creep loading in time (a) corresponding strain in time (b), cyclic creep loading in time (c) and corresponding strain development in time (d) [3].
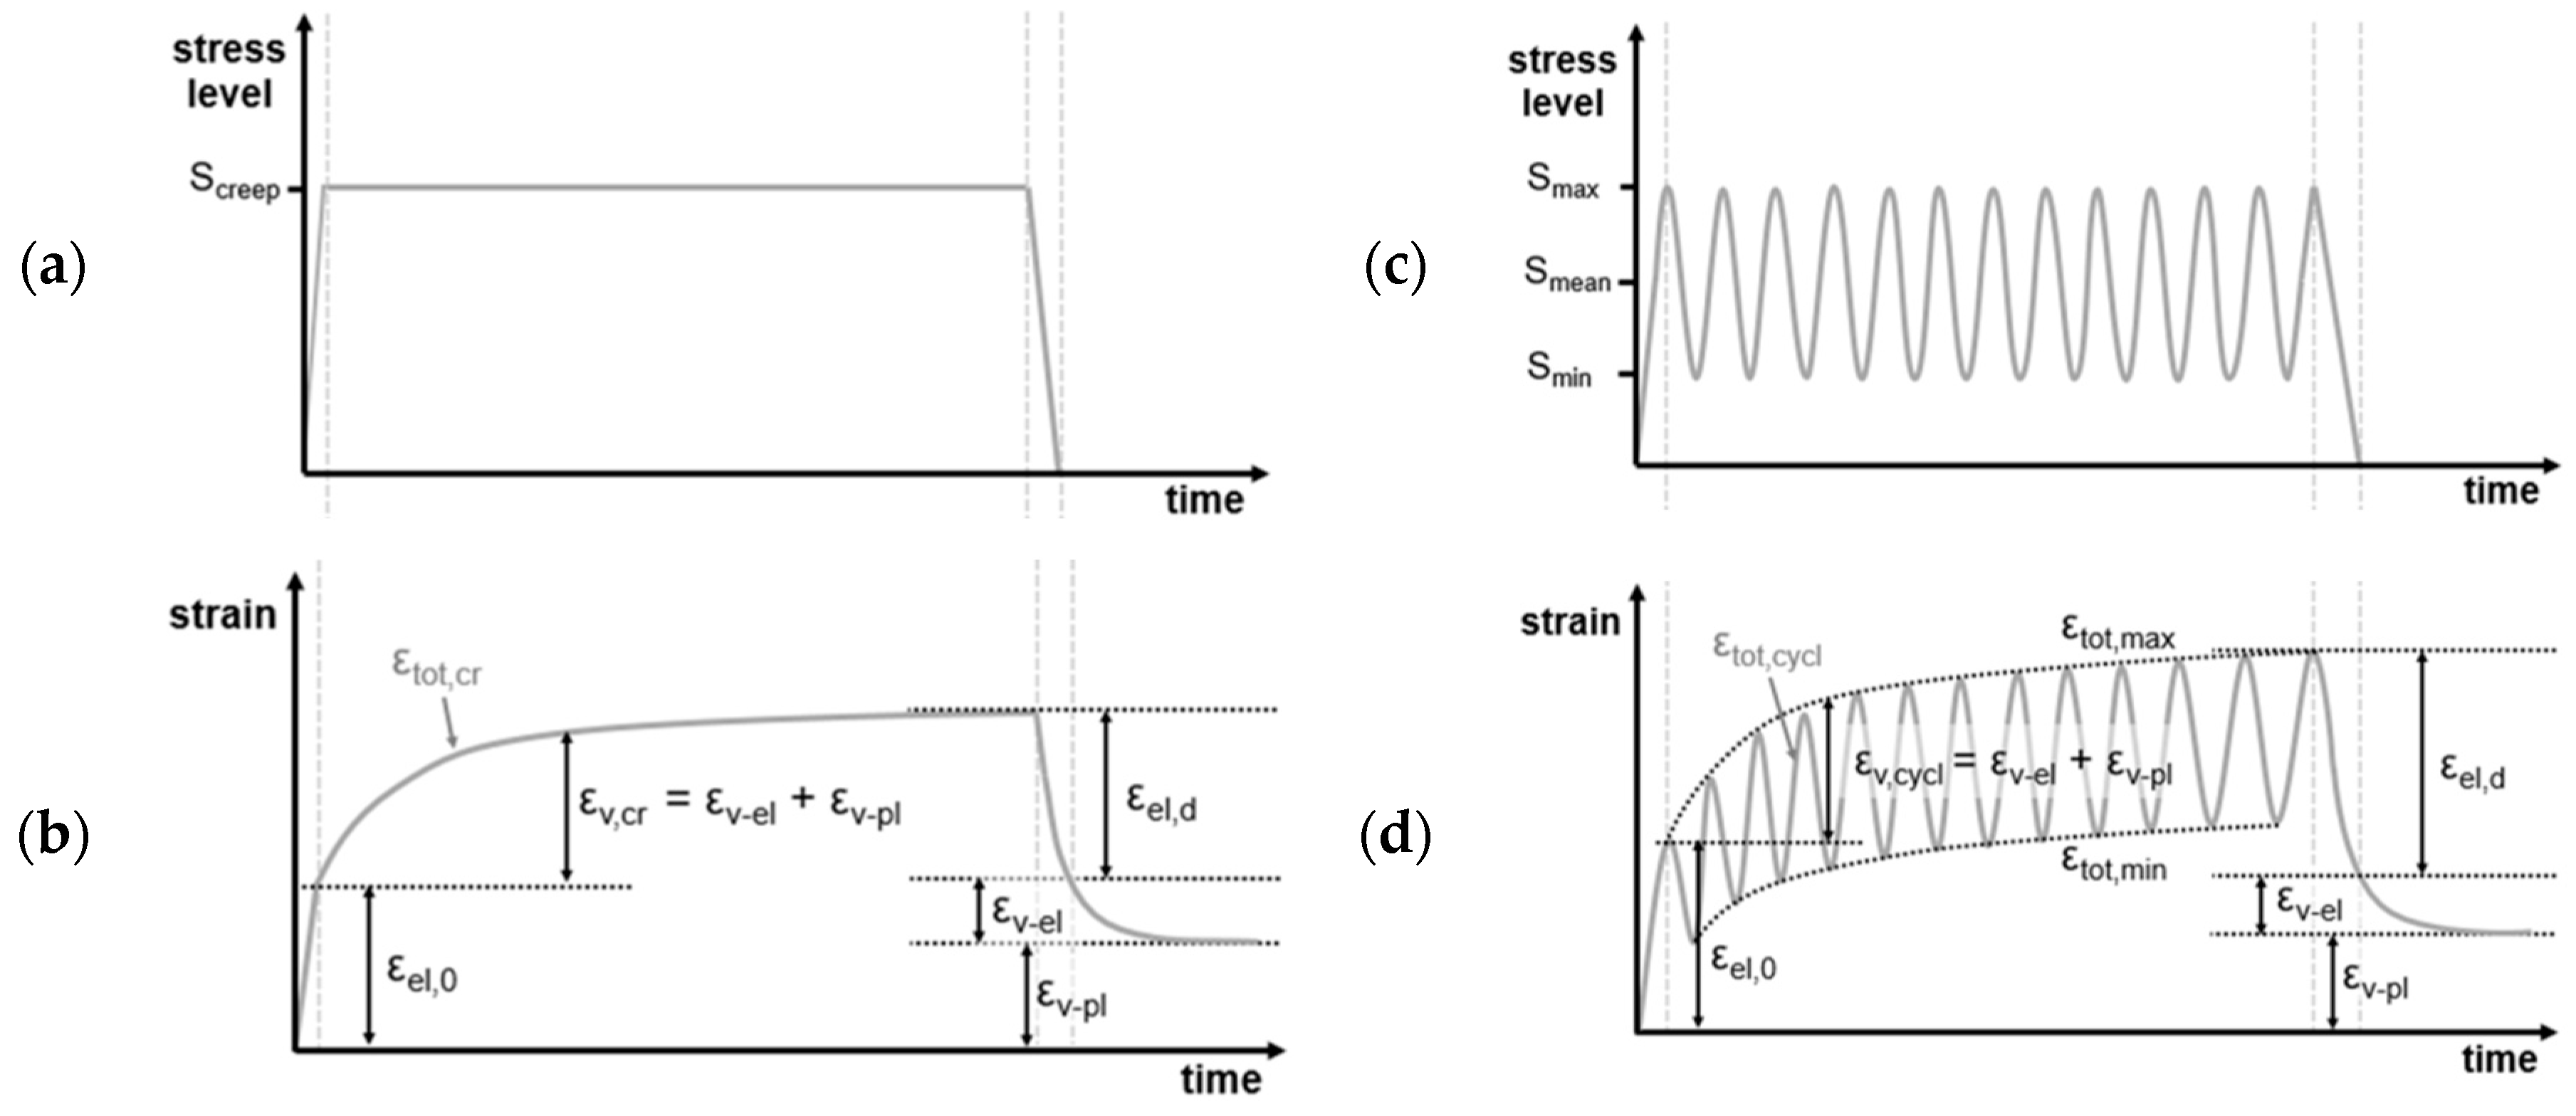
Figure 2.
Geopolymer composite compressive strength values prior to creep tests.
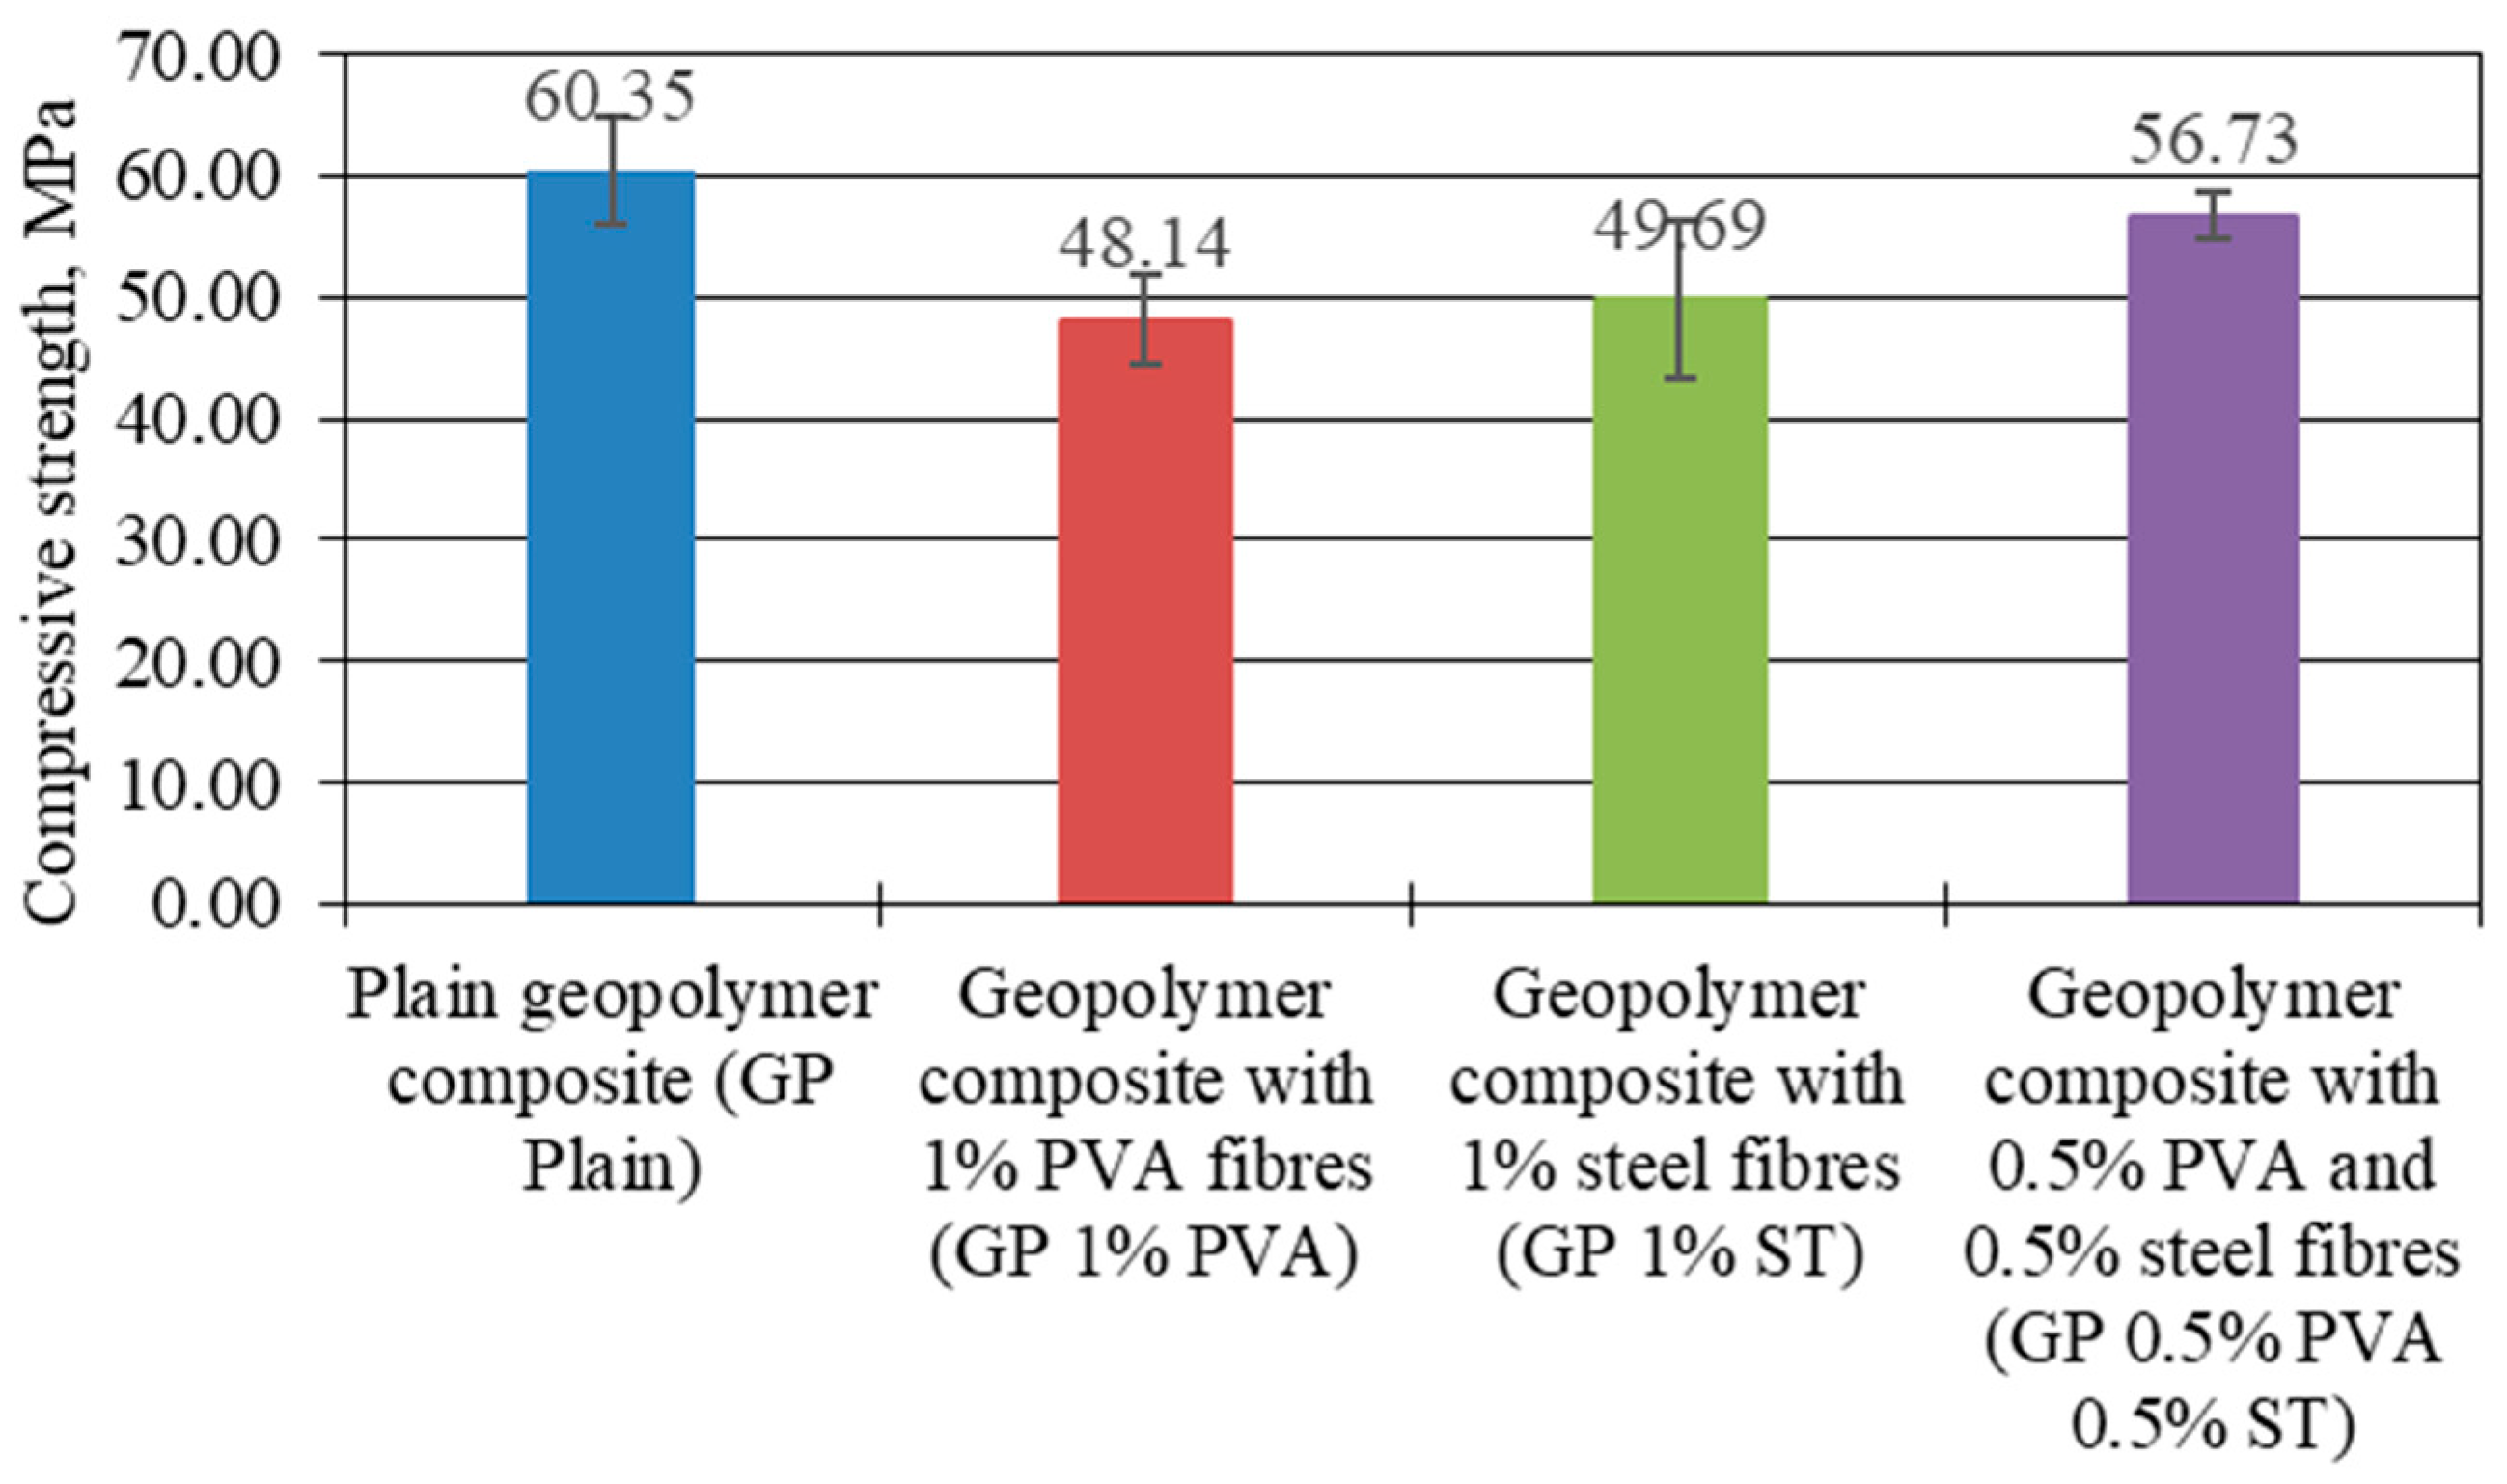
Figure 3.
Reinforced and plain geopolymer composite static and cyclic creep strains.
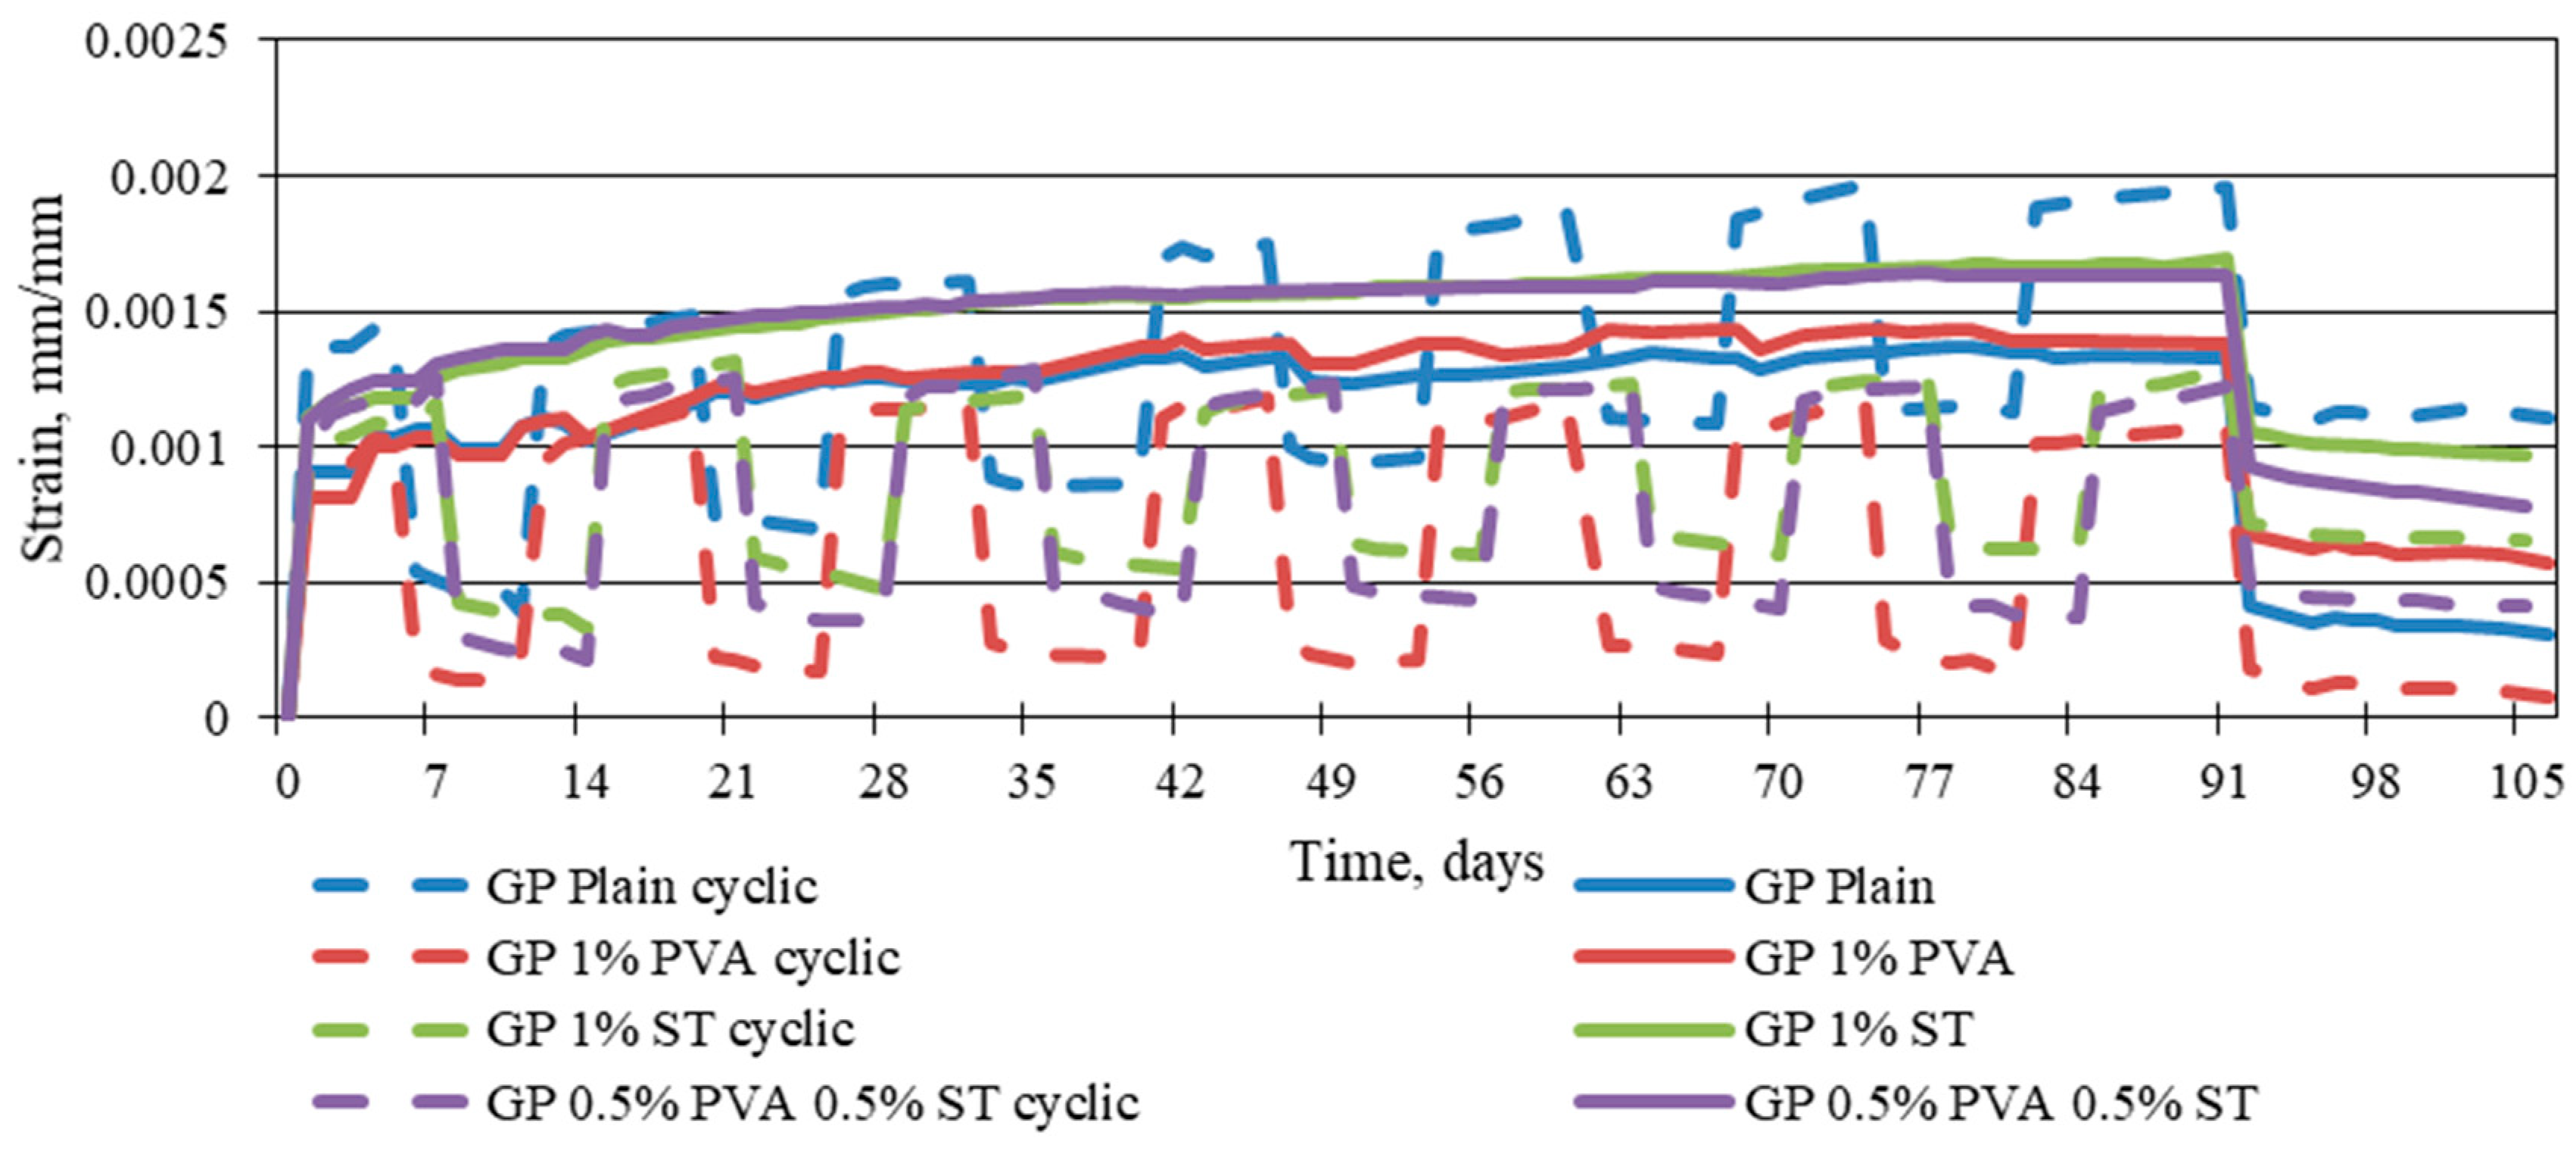
Figure 4.
Reinforced and plain geopolymer composite static and cyclic creep strains without elastic strains.
Figure 4.
Reinforced and plain geopolymer composite static and cyclic creep strains without elastic strains.
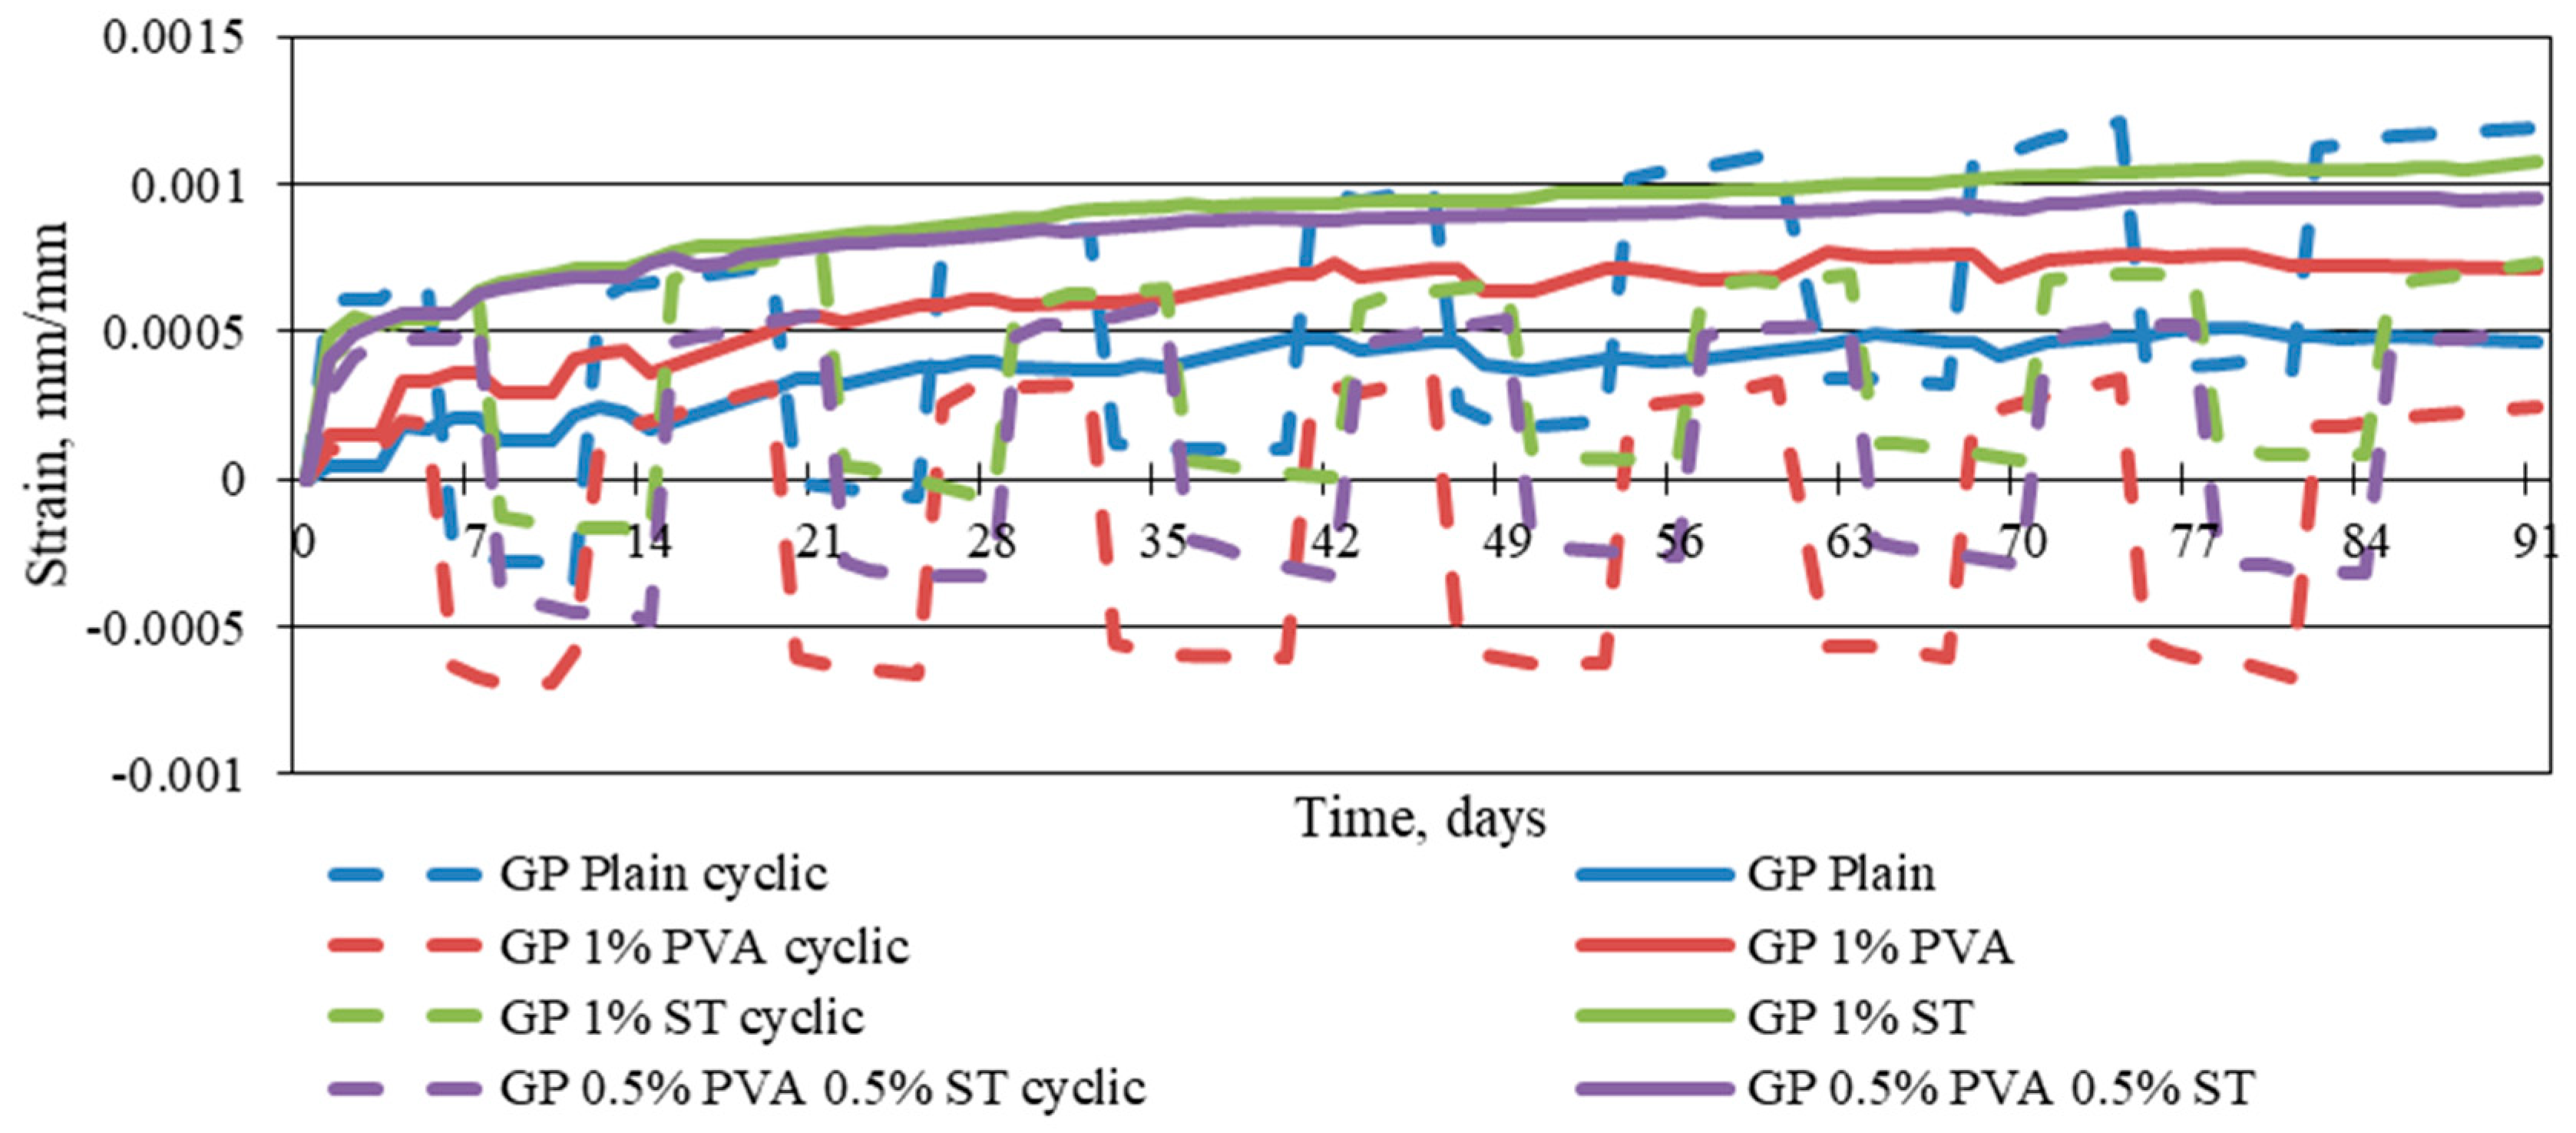
Figure 5.
Reinforced and plain geopolymer composite specific static and specific cyclic creep strains.
Figure 5.
Reinforced and plain geopolymer composite specific static and specific cyclic creep strains.
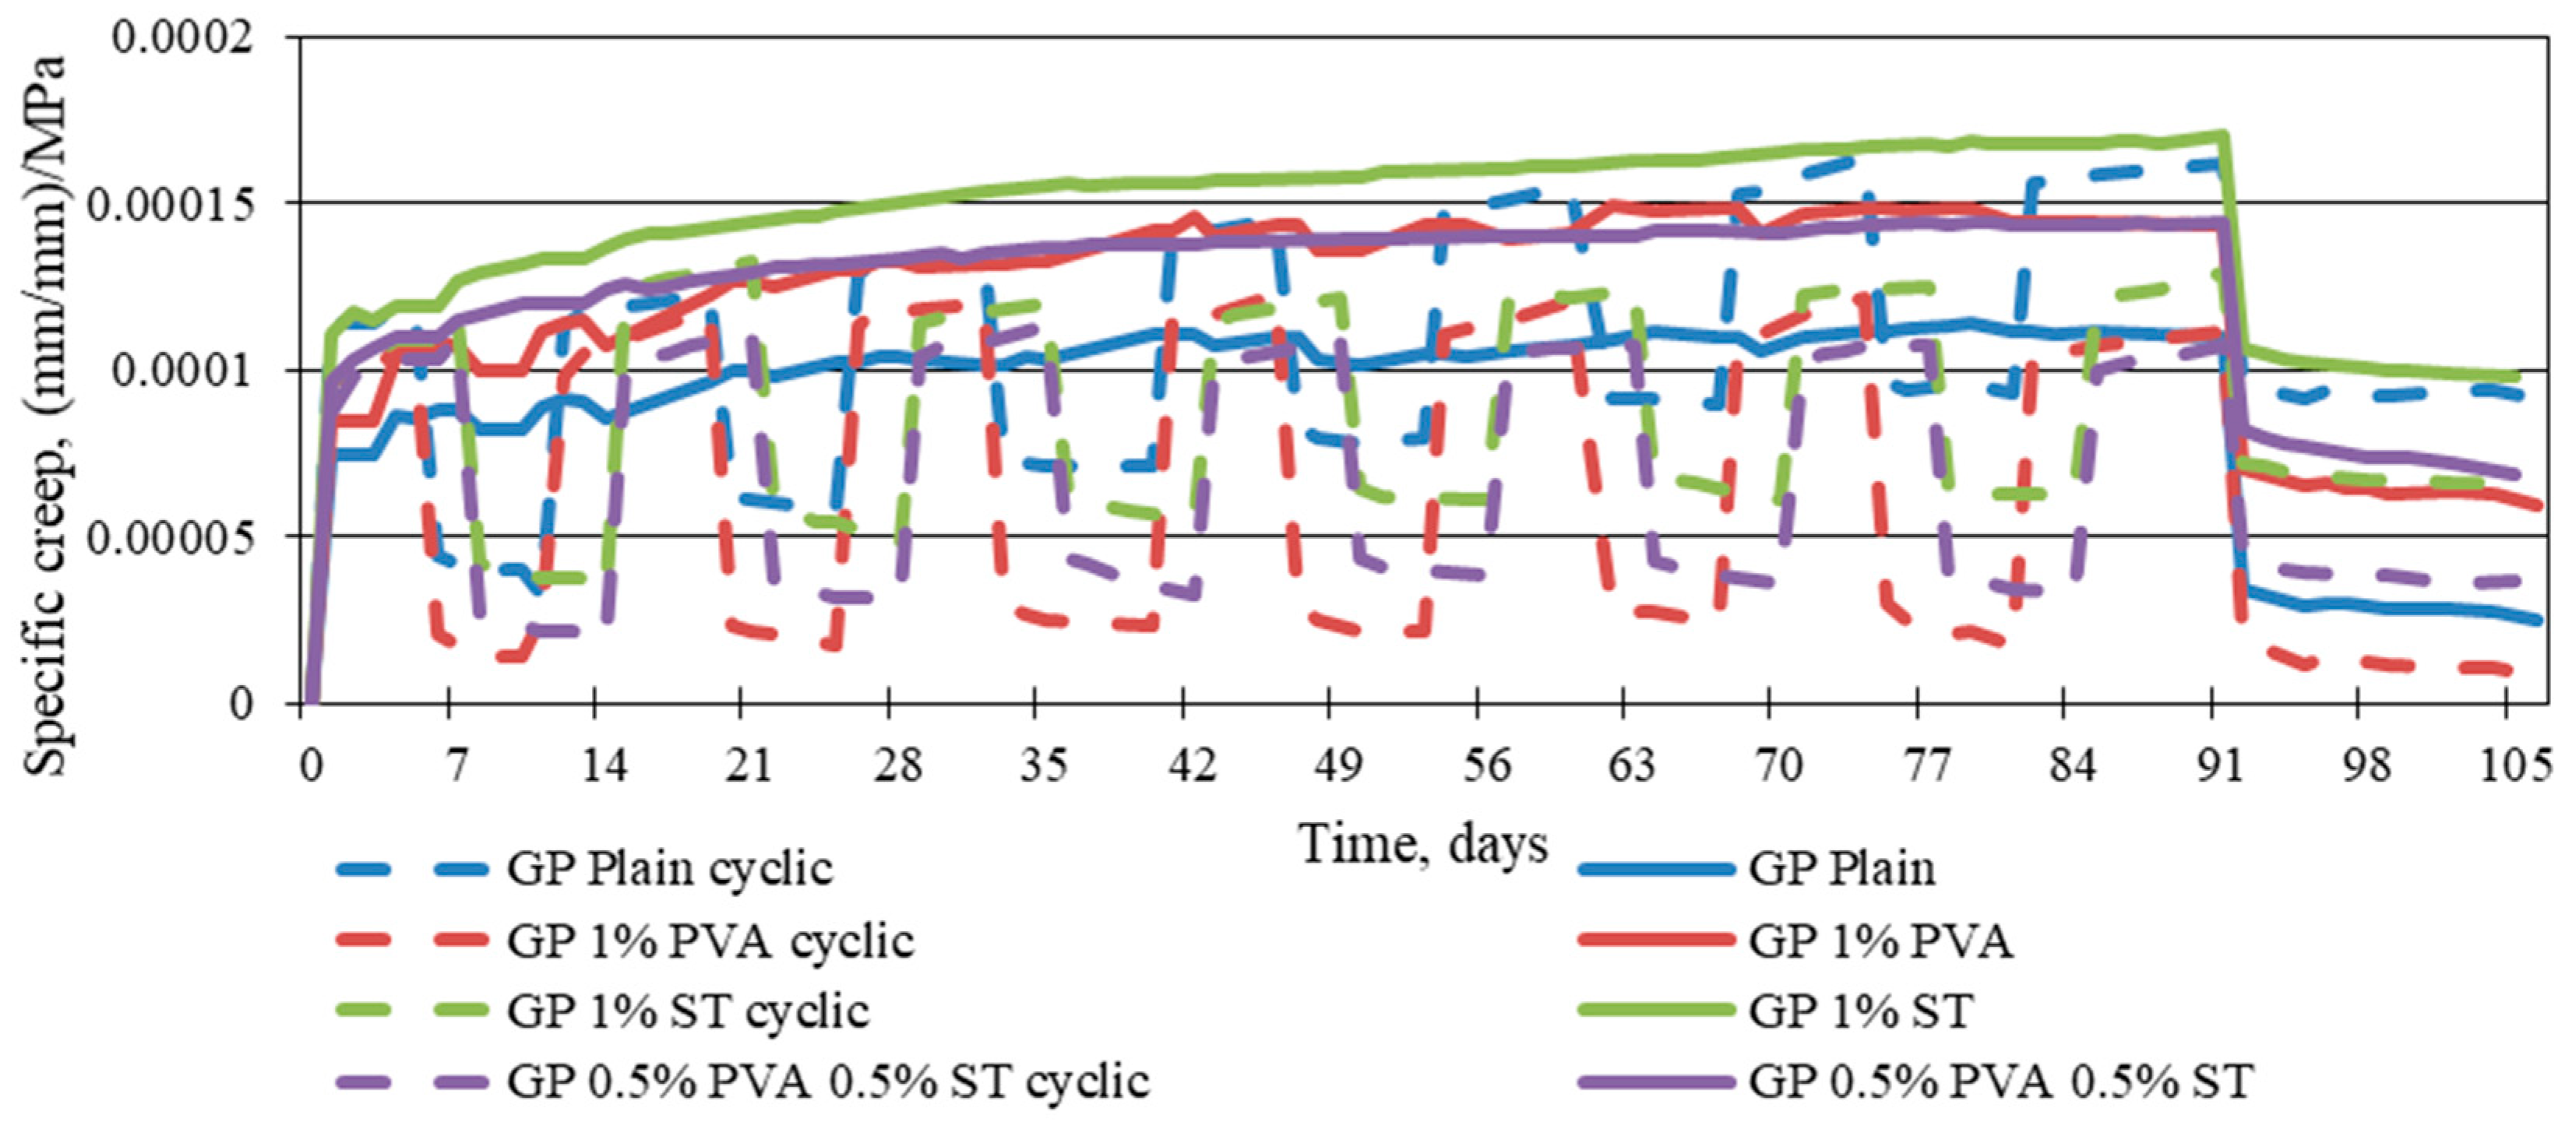
Figure 6.
Cyclic creep strains and shrinkage strains of reinforced and plain geopolymer composite.
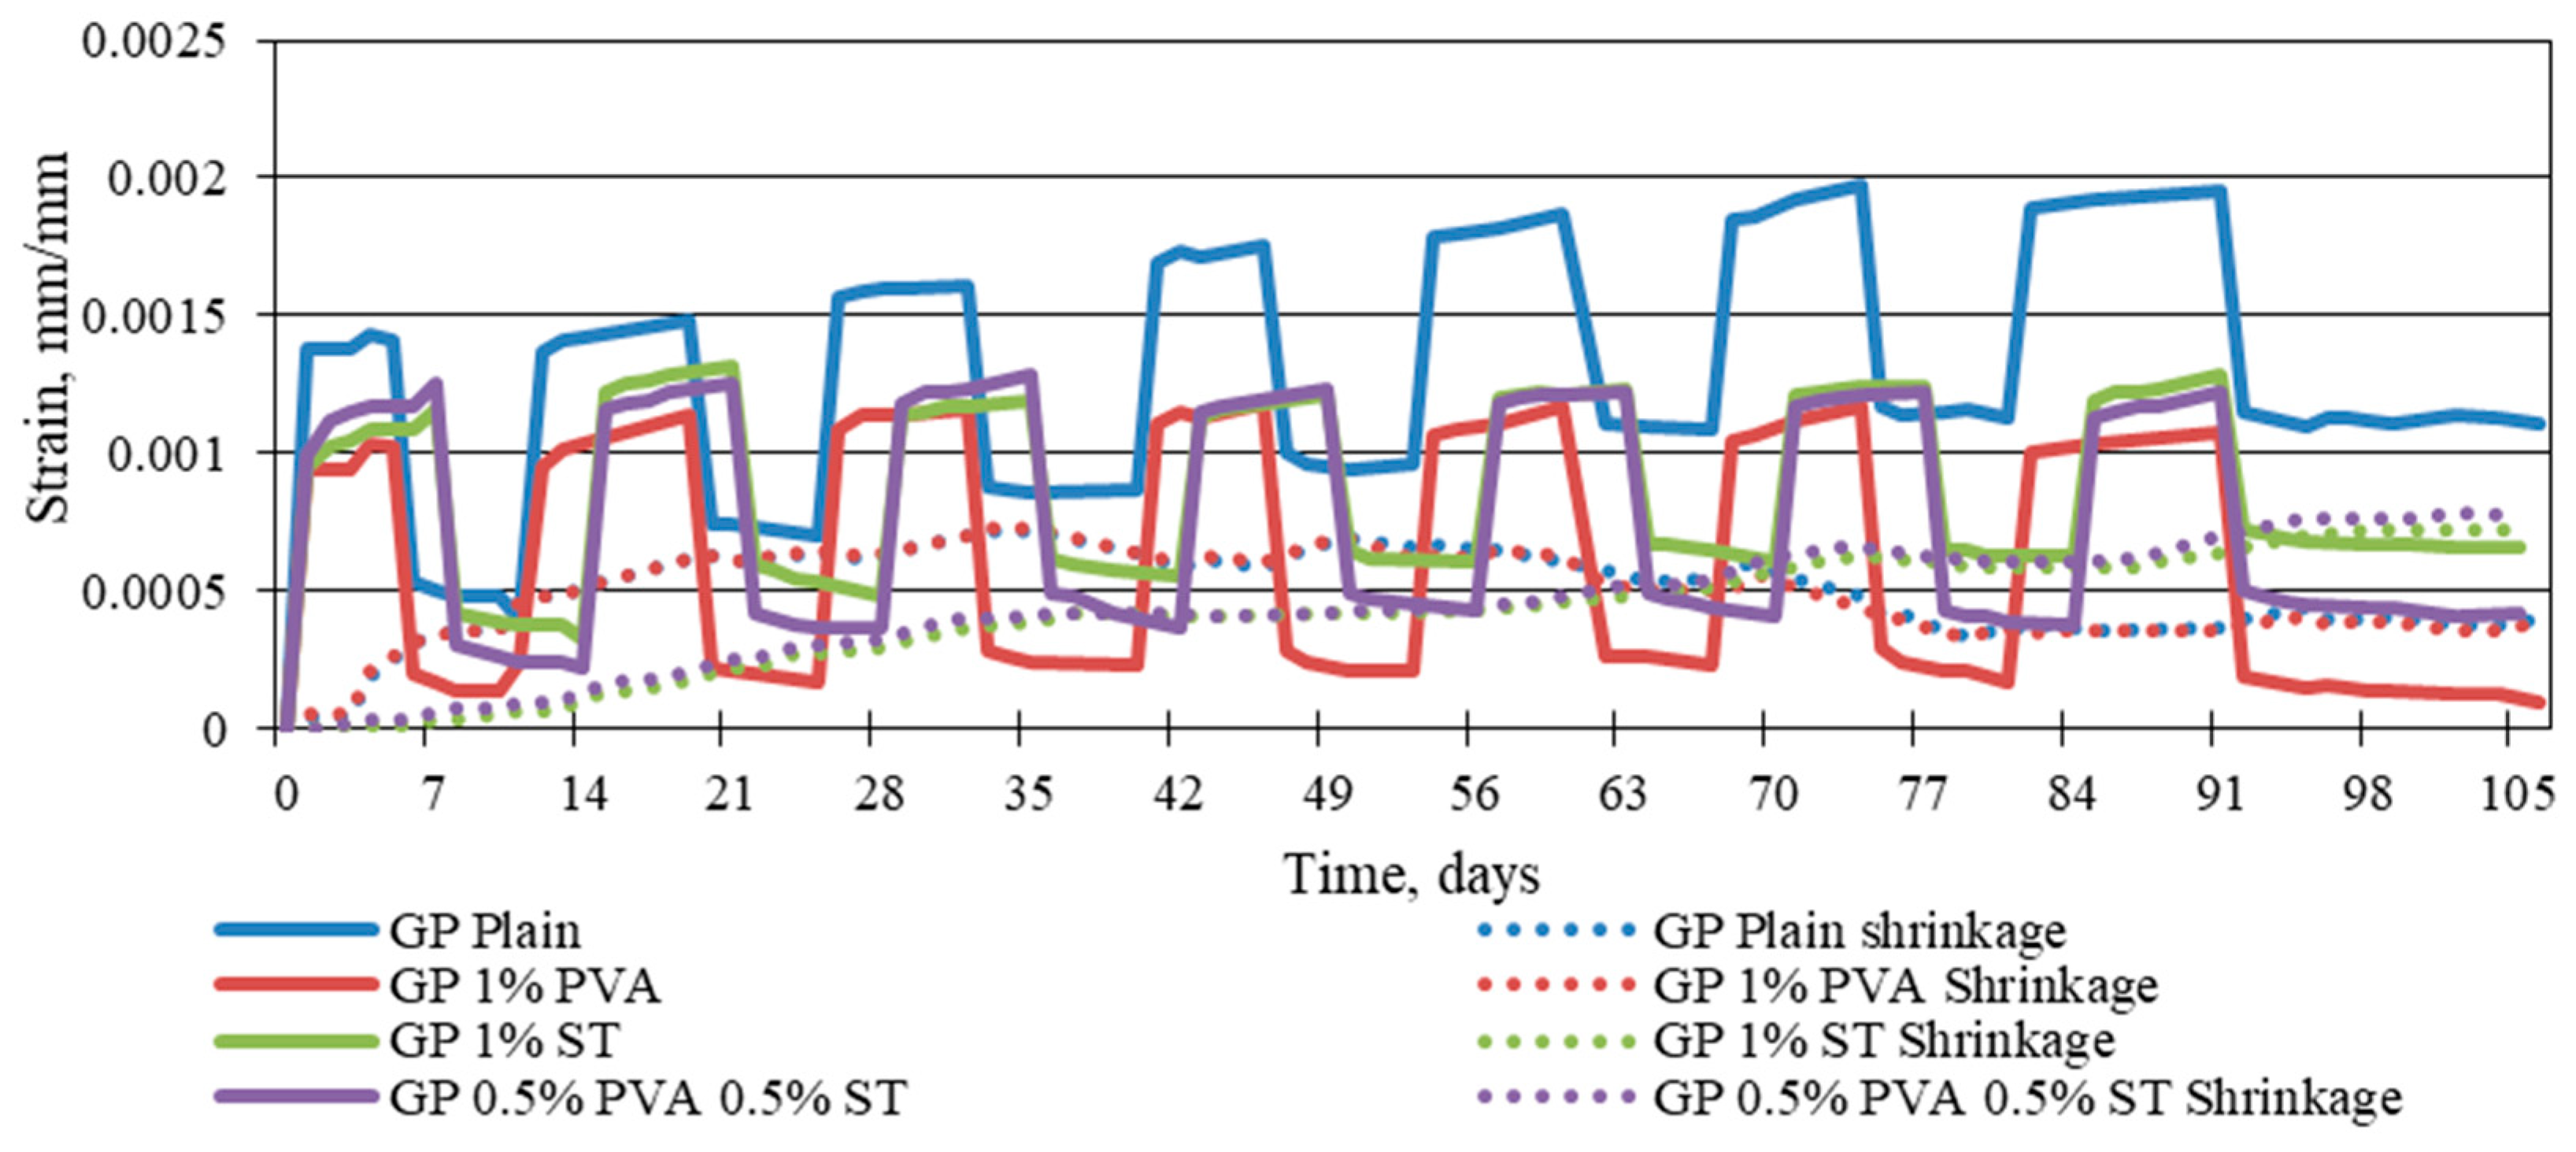
Figure 7.
Plain (a) 1% PVA fibre (b) 1% steel fibre (c) and 0.5% PVA and 0.5% ST fibre (d) reinforced geopolymer composite static creep and cyclic creep amplitude.
Figure 7.
Plain (a) 1% PVA fibre (b) 1% steel fibre (c) and 0.5% PVA and 0.5% ST fibre (d) reinforced geopolymer composite static creep and cyclic creep amplitude.
Disclaimer/Publisher’s Note: The statements, opinions and data contained in all publications are solely those of the individual author(s) and contributor(s) and not of MDPI and/or the editor(s). MDPI and/or the editor(s) disclaim responsibility for any injury to people or property resulting from any ideas, methods, instructions or products referred to in the content. |
© 2023 by the authors. Licensee MDPI, Basel, Switzerland. This article is an open access article distributed under the terms and conditions of the Creative Commons Attribution (CC BY) license (https://creativecommons.org/licenses/by/4.0/).
Copyright: This open access article is published under a Creative Commons CC BY 4.0 license, which permit the free download, distribution, and reuse, provided that the author and preprint are cited in any reuse.


