Submitted:
04 August 2023
Posted:
07 August 2023
You are already at the latest version
Abstract
This paper examines the relationship between GDP per capita and waste generated in European Union countries, highlighting the importance of this relationship for understanding the environmental consequences of economic growth and formulating waste management policies. The analysis findings demonstrate that, in most cases, higher GDP is associated with higher amounts of waste, although there are exceptions to this trend. A smaller number of countries are also found where no such relationship exists. These are primarily high-income countries in the lower part of the EKC or countries in transition. Cluster analysis reveals regional differences in the relationship between GDP and waste that the economic factors and the level of development in the regions concerned can explain. Bulgaria is among the European countries with the lowest economic growth associated with a large amount of waste. The analysis, therefore, focuses on Bulgaria. The impact of GDP per capita, Human Development Index and Population Density on municipal waste in Bulgaria is studied. The aim is to identify significant relationships and dependencies between these factors and the amount of waste. Based on the results of multiple regression analysis and the findings from municipal waste management data in Bulgaria, specific actions are proposed for municipal waste management in the country. Recommendations are made for developing sustainable waste management policies and sharing best practices between regions.
Keywords:
economic growth
; environment
; municipal waste
; waste management
; Bulgaria
1. Introduction
1.1. Description of the problem
Economic growth drives every country’s economy but often has a negative impact, especially on the environment. Increased growth rates are often accompanied by more waste that negatively affects the environment. An in-depth examination of the correlation and reliance between these two indicators is necessary. Waste is an essential indicator of a country’s environmental status, while GDP measures economic growth. Therefore, this relationship can help understand the ecological consequences of economic growth and design better environmental and waste management policies. Investigating this relationship can lead to valuable conclusions about the sustainable development of the countries and predictions about their future economic and ecological trends.
The paper examines and analyses the EU-27 countries, identifying regional differences. Bulgaria has the most critical values in terms of the analysed indicators. Bulgaria is one of the countries in the European Union with the highest percentage of municipal waste going to landfill. In 2020, about 61% of Bulgaria’s municipal waste ended up in landfills, compared to the European average of 24%. Compared to other EU Member States, Bulgaria is seriously behind in waste collection and treatment. This problem significantly impacts the country’s GDP, one of the lowest in the European Union. According to a World Bank report, the issue of municipal waste in Bulgaria leads to annual economic losses of nearly EUR 300 million. These losses are linked to environmental pollution and the negative effect on tourism and the nation’s health.
Several problems emerge in municipal waste management in Bulgaria: underestimation of the packaging waste generated, heavy reliance on landfilling, lack of separate collection of biological waste, insufficient number of collection points for packaging waste and lack of economic incentives for separate disposal [1]. These factors limit the effectiveness of the waste management system and require attention and improvements. However, in recent years, steps have been taken in Bulgaria to improve the collection and treatment of municipal waste. In 2020, waste recycling in Bulgaria increased to 31.5%, compared to 19% in 2010. In addition, significant investments have been made in waste management infrastructure, leading to waste collection and treatment system improvements. These positive trends show that Bulgaria is taking the municipal waste problem seriously and is working to solve it. If the country continues to make the necessary reforms and investments in this area, this will positively affect the country’s GDP, the population’s health and the environment.
1.2. Literature review
Many researchers have studied the correlation between economic growth, as measured by GDP, and the amount of household waste generated by a country’s population.
The so-called Environmental Kuznets Curve (EKC) is at the core of this research. Kuznets studied the relationship between economic growth and income inequality [2]. As incomes increase, income inequality initially increases but gradually decreases after reaching a so-called turning point. In other words, income distribution is more unequal at lower economic growth rates. Income inequality gradually evens out as they rise. The so-called inverted U shape can graphically represent this relationship. It was subsequently named after its author or the Kuznets Curve. A few decades later, in the 1990s, the Kuznets Curve was rediscovered and used to prove the relationship between environmental quality and income per capita. The researchers concluded that the same curve can describe both relationships.
The environmental damage is minimal at deficient levels of per capita income. Furthermore, the public responsibility and concern for environmental problems is negligible. Gradually, the ecological quality deteriorates with industrialisation, urbanisation and population growth. At the same time, the state’s revenues are insufficient, and the government consequently allocates few resources to environmental spending. With rising incomes and industrialisation, ecological quality continues to deteriorate, but up to a point. Once this point is reached, the subsequent successive increase in per capita income improves the environment. A wealthy society is more responsible, informed and committed to environmental issues. It can invest resources in improving the quality of life. It can spend more on purchasing environmentally friendly and healthy products. New technologies are being developed to protect the environment. The richer a society becomes, its priorities are reordered and "the environment moves up in the hierarchy of human needs" [3].
Despite his criticism, Beckerman concludes that the surest way to improve the environment is to become rich. On the other hand, a wealthy state [4] can allocate more resources to ecology, spending them more efficiently. Several regulations are also passed to enforce regulatory measures to protect the environment. Environment degradation must occur before any improvements in environmental quality can occur.
An inverted U shape curve has been approved concerning indicators to measure environmental quality [5,6,7,8]. According to Arrow [9], it is valid only for pollutants involving local short-term costs, such as sulfur, particulates, and fecal coliforms. Shafic and Bandyopadhyay also study the relationship between economic growth and the environment, concluding that it is "far from simple" [10]. Using eight indicators, they measure the environmental quality for 149 countries at different income levels from 1960 to 1990. These are lack of safe water and urban sanitation, deforestation, dissolved oxygen in rivers, fecal coliform in rivers, ambient Sulphur dioxide, suspended particulate matter, municipal solid waste, and carbon emissions per capita.
Some indicators find that environmental quality improves as income increases; for others, there is first deterioration and then improvement, and for others, there is no relationship. They prove the EKC hypothesis for air pollutants with $300-4,000 turning points. They subsequently conclude that when environmental quality directly affects human health, higher incomes are associated with better ecological quality [11]. In addition, Shafic and Bandyopadhyay also examine the impact of investment, trade, debt, and other macroeconomic indicators, finding that they have a negligible effect on the environment. In cases where environmental problems can be externalised, no improvement in the ecological quality is observed with increasing income [10,12].
Panayotou [13] proves the inverted U-shape hypothesis of the relationship between environmental degradation and economic development using data from developing and developed countries. He measures environmental quality using two indicators - deforestation and air pollution. Panayotou introduced the concept of the Environmental Kuznets Curve (EKC). He calculates turning point values. Deforestation occurs at income levels between $800-1200, and in terms of air pollution, $3,800-5,500. Combining the two indicators moves the turning point between $1000-3000. Panayotou next reports a more sensitive structural change at income levels above $10,000 per capita when there is a shift from energy-intensive heavy industry to technology-intensive industry.
Various authors are researching what should be the value of the turning point at which environmental quality enhances alongside economic growth. Grossman and Krueger [14] measure environmental quality with four indicators - urban air pollution, the state of the oxygen regime in river basins, fecal contamination of river basins, and contamination of river basins by heavy metals. Although they report differences between the different indicators, they conclude that in most cases, the turning point occurs when the country reaches a per capita income of $8,000. Even higher values are compared by Selden and Song [15]. They prove an inverted U-shape relationship between economic growth and four indicators measuring air quality - Sulphur dioxide, suspended particulates, nitrogen oxides, and carbon monoxide for 30 countries. They find turning points of $8,709 for SO2, $10,289 for SPM, $11,217 for NOx, and $5,963 for CO. The authors attribute the higher values obtained to differences in the data used.
Cole, Rayner and Bates [16] examine the relationship between income and environmental quality as measured by various indicators such as total energy use, SO2, SPM, NO2, nitrates in water, traffic volumes, chlorofluorocarbons emissions (CFCs) and methane. They prove inverted EKC only concerning local air pollutants. The other more global, indirectly influenced environmental indicators increase monotonically with increasing income or have a higher turning point. They conclude that local air pollutants peak at lower income levels relative to total emissions per capita, while transport-generated local air pollutants peak at higher income levels. This conclusion is also confirmed by Holtz-Eakin and Selden [17]. They examine the EKC relationship for SO2 and show that CO2 emissions decline after reaching a per capita income of $35,000.
Panayotou [18] examines the relationship between economic growth and the environment in countries of the ECE region. He includes countries at different stages of economic growth, starting with poor countries with incomes below $1,000, such as Tajikistan and coming to rich countries with incomes above $30,000. Panayotou finds that the poor and transition countries are on the left side of the turning point in the upward part of the Kuznets curve. In this part, economic growth is associated with environmental degradation. The rich countries are on the right side of the turning point in the downward part of the curve. However, Panayotou believes that even poor countries can improve the environment and "succeed in decoupling environmental pollution and resource use from economic growth" through structural, technological and policy change or a combination of the three.
Panayotou concludes that EKC is not a universal and irreversible pattern but depends on the type of pollution, political and institutional factors, technological progress and global effects. Some types of pollution may have flatter or more curved EKC or may not even exhibit EKC. Some countries may transition faster or slower to a cleaner environment depending on their political and institutional systems. Some technologies may cause overuse of natural resources or lead to global warming. Economic growth is not necessarily counterproductive for the environment but can be part of the solution. It can provide the resources needed to invest in cleaner technologies, improve institutions and increase environmental education and awareness. Economic growth can also stimulate innovation and the diffusion of cleaner technologies, as well as increase the elasticity and adaptability of society to environmental problems.
Gene Grossman and Alan Krueger [19] examine the relationship between economic growth and the environment, focusing on waste. They find that in the initial stages of economic growth, municipal waste increases as the consumption of goods and services increases. The achieved further economic development leads to innovations and technological improvements that allow society to consume more efficiently and produce goods and services with less waste. They argue that economic growth can be compatible with environmental protection, provided that effective waste management policies are adopted. Hence, including environmental protection costs in national GDP accounts can lead to a better measurement of real economic progress, also considering the environmental protection costs necessary to achieve sustainable growth.
Thomas Kinnaman [20], professor of economics at Bucknell University, has published several studies on waste and the environment. In one of his best-known studies, “The generation of municipal solid waste in the US: An estimation framework and Cointegration analysis”, Kinnaman uses an elasticity coefficient to estimate the relationship between GDP and municipal waste generation. The results show that the elasticity between GDP and municipal waste is between 0.8 and 0.9, meaning that for every 1% increase in GDP, municipal waste increases by 0.8-0.9%. Hence the amount of waste households generate also increases with economic growth.
In the article "Dynamic and causality interrelationships from municipal solid waste recycling to economic growth, carbon emissions and energy efficiency using a novel bootstrapping autoregressive distributed lag" [21], Asif Razzaq et al. analyse the relationship between GDP and municipal solid waste generation in the USA. They use data from 1990 to 2017 and investigate the long-term relationship between GDP and municipal solid waste generation. This study confirms a unidirectional causal link between municipal solid waste recycling to economic growth, carbon emissions, and energy efficiency. These findings imply that any policy intervention related to municipal solid waste recycling leads to significant changes in economic growth and carbon emissions.
Martin Wagner and Jakob Weber [22] explore the relationship between GDP and waste in their article "The carbon Kuznets curve: A cloudy picture emitted by bad econometrics?". They explore the Carbon Kuznets Curve (CKC) hypothesis, which suggests that per capita carbon emissions will increase with GDP growth up to a certain threshold, after which they will decrease. Wagner and Weber criticise many previous studies that have found such a relationship for using flawed or inappropriate statistical methods. They use more modern techniques and examine the relationship between GDP and per capita carbon emissions in 59 countries from 1960 to 2005. The results of Wagner and Weber’s study do not support the CKC hypothesis. They find that per capita carbon emissions continue to increase with GDP growth, with no apparent threshold after which they begin to decline. Wagner and Weber conclude that reducing carbon emissions requires active policies to reduce emissions rather than relying on economic growth to solve the environmental problem.
Vassilis J. Inglezakis and colleagues [23] analyse the relationship between waste management and the economic situation in several countries - Romania, Bulgaria, Slovenia, and Greece- from 2000 to 2013. They focus on the "separation principle" of economic growth from resource use, which falls within the policies of the EU. The authors use population growth, gross domestic product (GDP), and municipal solid waste generation as critical indicators. These indicators are integrated into one composite index - the Municipal Waste Indicator (MWI), allowing easy comparison between countries and simplifying data analysis. The study concludes that separation occurs when the rate of increase in the environmentally relevant variable (such as waste generation) is lower than that of its economic driving force (such as GDP) for a given period.
Shigefumi Okumura, Tomohiro Tasaki & Yuichi Moriguchi [24] conclude that economic growth affects the selection of waste treatment options in Asian countries, such as Japan, Korea, and China. The authors use statistical analyses and an analytic hierarchy process to examine how GDP per capita and other factors influence these countries’ municipal waste incineration and composting rate. They find that:
- There is a positive correlation between GDP per capita and incineration rate, meaning that higher levels of economic development are associated with higher waste incineration rates;
- There is a negative correlation between GDP per capita and composting rate in Japan and China, meaning that higher levels of economic development are associated with lower rates of waste composting. However, there is a positive correlation in Korea, meaning that higher levels of economic growth are associated with higher rates of waste composting;
- The incineration rate in Japan and China has increased in parallel with economic growth, while the composting rate has decreased or remained stable. In Korea, both the incineration and composting rates have increased with economic growth;
- The preferences and priorities of experts and government officials from Southeast and East Asian countries for waste treatment options vary depending on their income level and economic growth. For instance, social acceptance is essential in upper middle-income countries (USD 4,036–12,475), while environmental impact is vital in lower middle-income countries (USD 1,026–4,035).
The authors conclude that economic growth affects the selection of waste treatment options in Asian countries. Policy interventions should consider the different degrees of economic development and the elasticity of waste generation concerning GDP per capita. They recommend conducting further research to understand the causal mechanisms behind the observed trends and correlations.
Wasi Ul Hassan Shah, Rizwana Yasmeen, Muddassar Sarfraz, and Larisa Ivascu [25] assess the consequences of economic growth, industrialisation, and foreign direct investments on municipal solid waste in OECD countries from 2000 to 2020. Further investigation includes the role of technology in managing the impacts of waste activities. The authors also examine the mediating effect of technology and industrialisation on economic growth concerning waste generation in OECD economies. The empirical evaluation is conducted in two ways. First, the authors employ graphs to assess the trends over the years and their relationship with critical factors. Second, they apply appropriate econometric methods to investigate the empirical relationships between the respective factors. The study finds that economic growth and industrialisation evolve, increasing waste generation in OECD economies. The influx of foreign direct investments enhances waste production. However, the magnitude of the effect of foreign direct investments is lower compared to that of economic growth and industrialisation. Technological progress (research and development activities) is a significant factor in reducing waste generation. The latter stage of economic growth is still unfavourable for reducing waste generation in OECD countries.
Different scholars and researchers agree that there is a correlation between household waste and GDP, although this relationship can be estimated in other ways using other methods and data. Furthermore, how household waste is treated and managed depends on economic growth [26]. Each author reveals different aspects of this relationship by analysing factors that may influence it. However, the general opinion among the scientific community is that these two variables are interrelated, and their relationship can be used to understand the environmental consequences of economic growth and formulate future sustainable development strategies.
The relationship between municipal waste and GDP has been studied by the academic world and various organisations such as the World Bank, the Organisation for Economic Co-operation and Development (OECD), the European Environment Agency, etc. According to OECD, there is a positive relationship between municipal waste and GDP in many countries.
For example, in 2019, on average across OECD countries, there is a correlation of 0.84 between GDP and per capita municipal waste generation [27]. A higher GDP is associated with more municipal waste generated per capita. Of course, the value of the correlation can vary between countries depending on various factors such as the economy’s structure, demographic characteristics and waste management. World Bank data from 2010 to 2019 shows a positive correlation between GDP and municipal waste generation in major economies such as the US, China, Japan, Germany, etc. [28]. For example, the correlation coefficient is 0.87 for the US, 0.93 for China, 0.84 for Japan and 0.93 for Germany. However, there are countries where GDP growth is not accompanied by increased household waste, such as South Korea, where the correlation is only 0.09. The 2019 United Nations State of the World’s Environment (GEO) Global Environment Outlook (GEO) report looks at various aspects of global environmental issues, including the problem of municipal waste. According to this report, about 2.01 billion tons of municipal waste is produced annually worldwide, increasing by 70% by 2050 [29]. At the same time, the economic growth of the world economy is expected to increase if more efficient waste management methods and changing consumption patterns are implemented. In summary, UN data show that the relationship between municipal waste and GDP is complex and often depends on many factors, such as national economic and social conditions, waste management policies, the degree of industrialisation, etc. According to Eurostat, 502 million tonnes of municipal waste was generated in the European Union (EU) in 2020, down from 513 million tonnes in 2019. At the same time, the EU GDP grew by 2.2% in 2020 compared to the previous year.
The present study aims to contribute to the expansion of knowledge in the field of waste management, provide valuable insights into the complex relationship between GDP and household waste, and offer directions for enhancing policies and strategies for sustainable waste management in the future.
1.3. Objective of the study.
The paper aims to examine the relationship between average GDP per capita and average waste generated per capita in EU countries through comparative analysis. The investigation uses correlation and cluster analysis to explore the impact of higher or lower GDP per capita on the waste generated. It will also analyse regional differences in GDP and waste generated by discussing economic factors and the level of development in the respective regions. The sub-objective of the paper is to extend the analysis focusing on Bulgaria. The research seeks to analyse the impact of GDP per capita, Human Development Index and Population Density on the amount of municipal waste in Bulgaria via multiple regression analysis. The aim is to identify significant relationships and dependencies between these factors and waste quantity, which will contribute to a better understanding of the relationship between economic and socio-demographic development and waste management in the country.
1.4. Research tasks.
The authors focus on several essential research tasks:
- Investigate how waste generation varies according to the GDP level for different countries based on 2021 data for the EU-27 using the Environmental Kuznets Curve. The hypothesis is that, as the economy develops, the level of pollution increases, but once a certain threshold is reached, it starts to decrease due to the implementation of greener technologies and policies;
- Compare countries in terms of average GDP per capita and municipal waste per capita and analyse their differences. The research assumes that a high GDP per capita can be associated with a higher volume of consumption and, consequently, with higher amounts of waste produced by the population;
- Divide countries into categories based on their population’s income and the amount of waste generated and examine the profiles of each group. This can show how the socio-economic status of countries affects their environmental footprint;
- Calculate and interpret the correlation coefficients between GDP per capita and municipal waste per capita for different countries and determine the degree of the linear relationship between these two variables. This will help to understand the nature and strength of the relationship between GDP and municipal waste in different countries;
- Classify countries according to the degree of relationship between GDP per capita and municipal waste per capita using hierarchical cluster analysis. This task is crucial because it can show how countries can be divided into subgroups according to their similarities and differences concerning these two variables;
- Perform a multivariate regression analysis for Bulgaria, where municipal waste generated is the dependent variable and GDP per capita, human development index, and population density are the independent variables. This will give us a better understanding of the factors that influence waste generation in Bulgaria and can serve as a basis for policies and measures for sustainable waste management.
2. Materials and Methods
The research follows specific steps presented in a flowchart (Figure 1). This flowchart provides a visual representation of the sequence and connections between the different stages and processes within the research. The flowchart provides a systematic approach to conducting the survey. Each step is interconnected with the previous ones and is critical to the overall success of the study.
Figure 1.
Flowchart of the investigation.
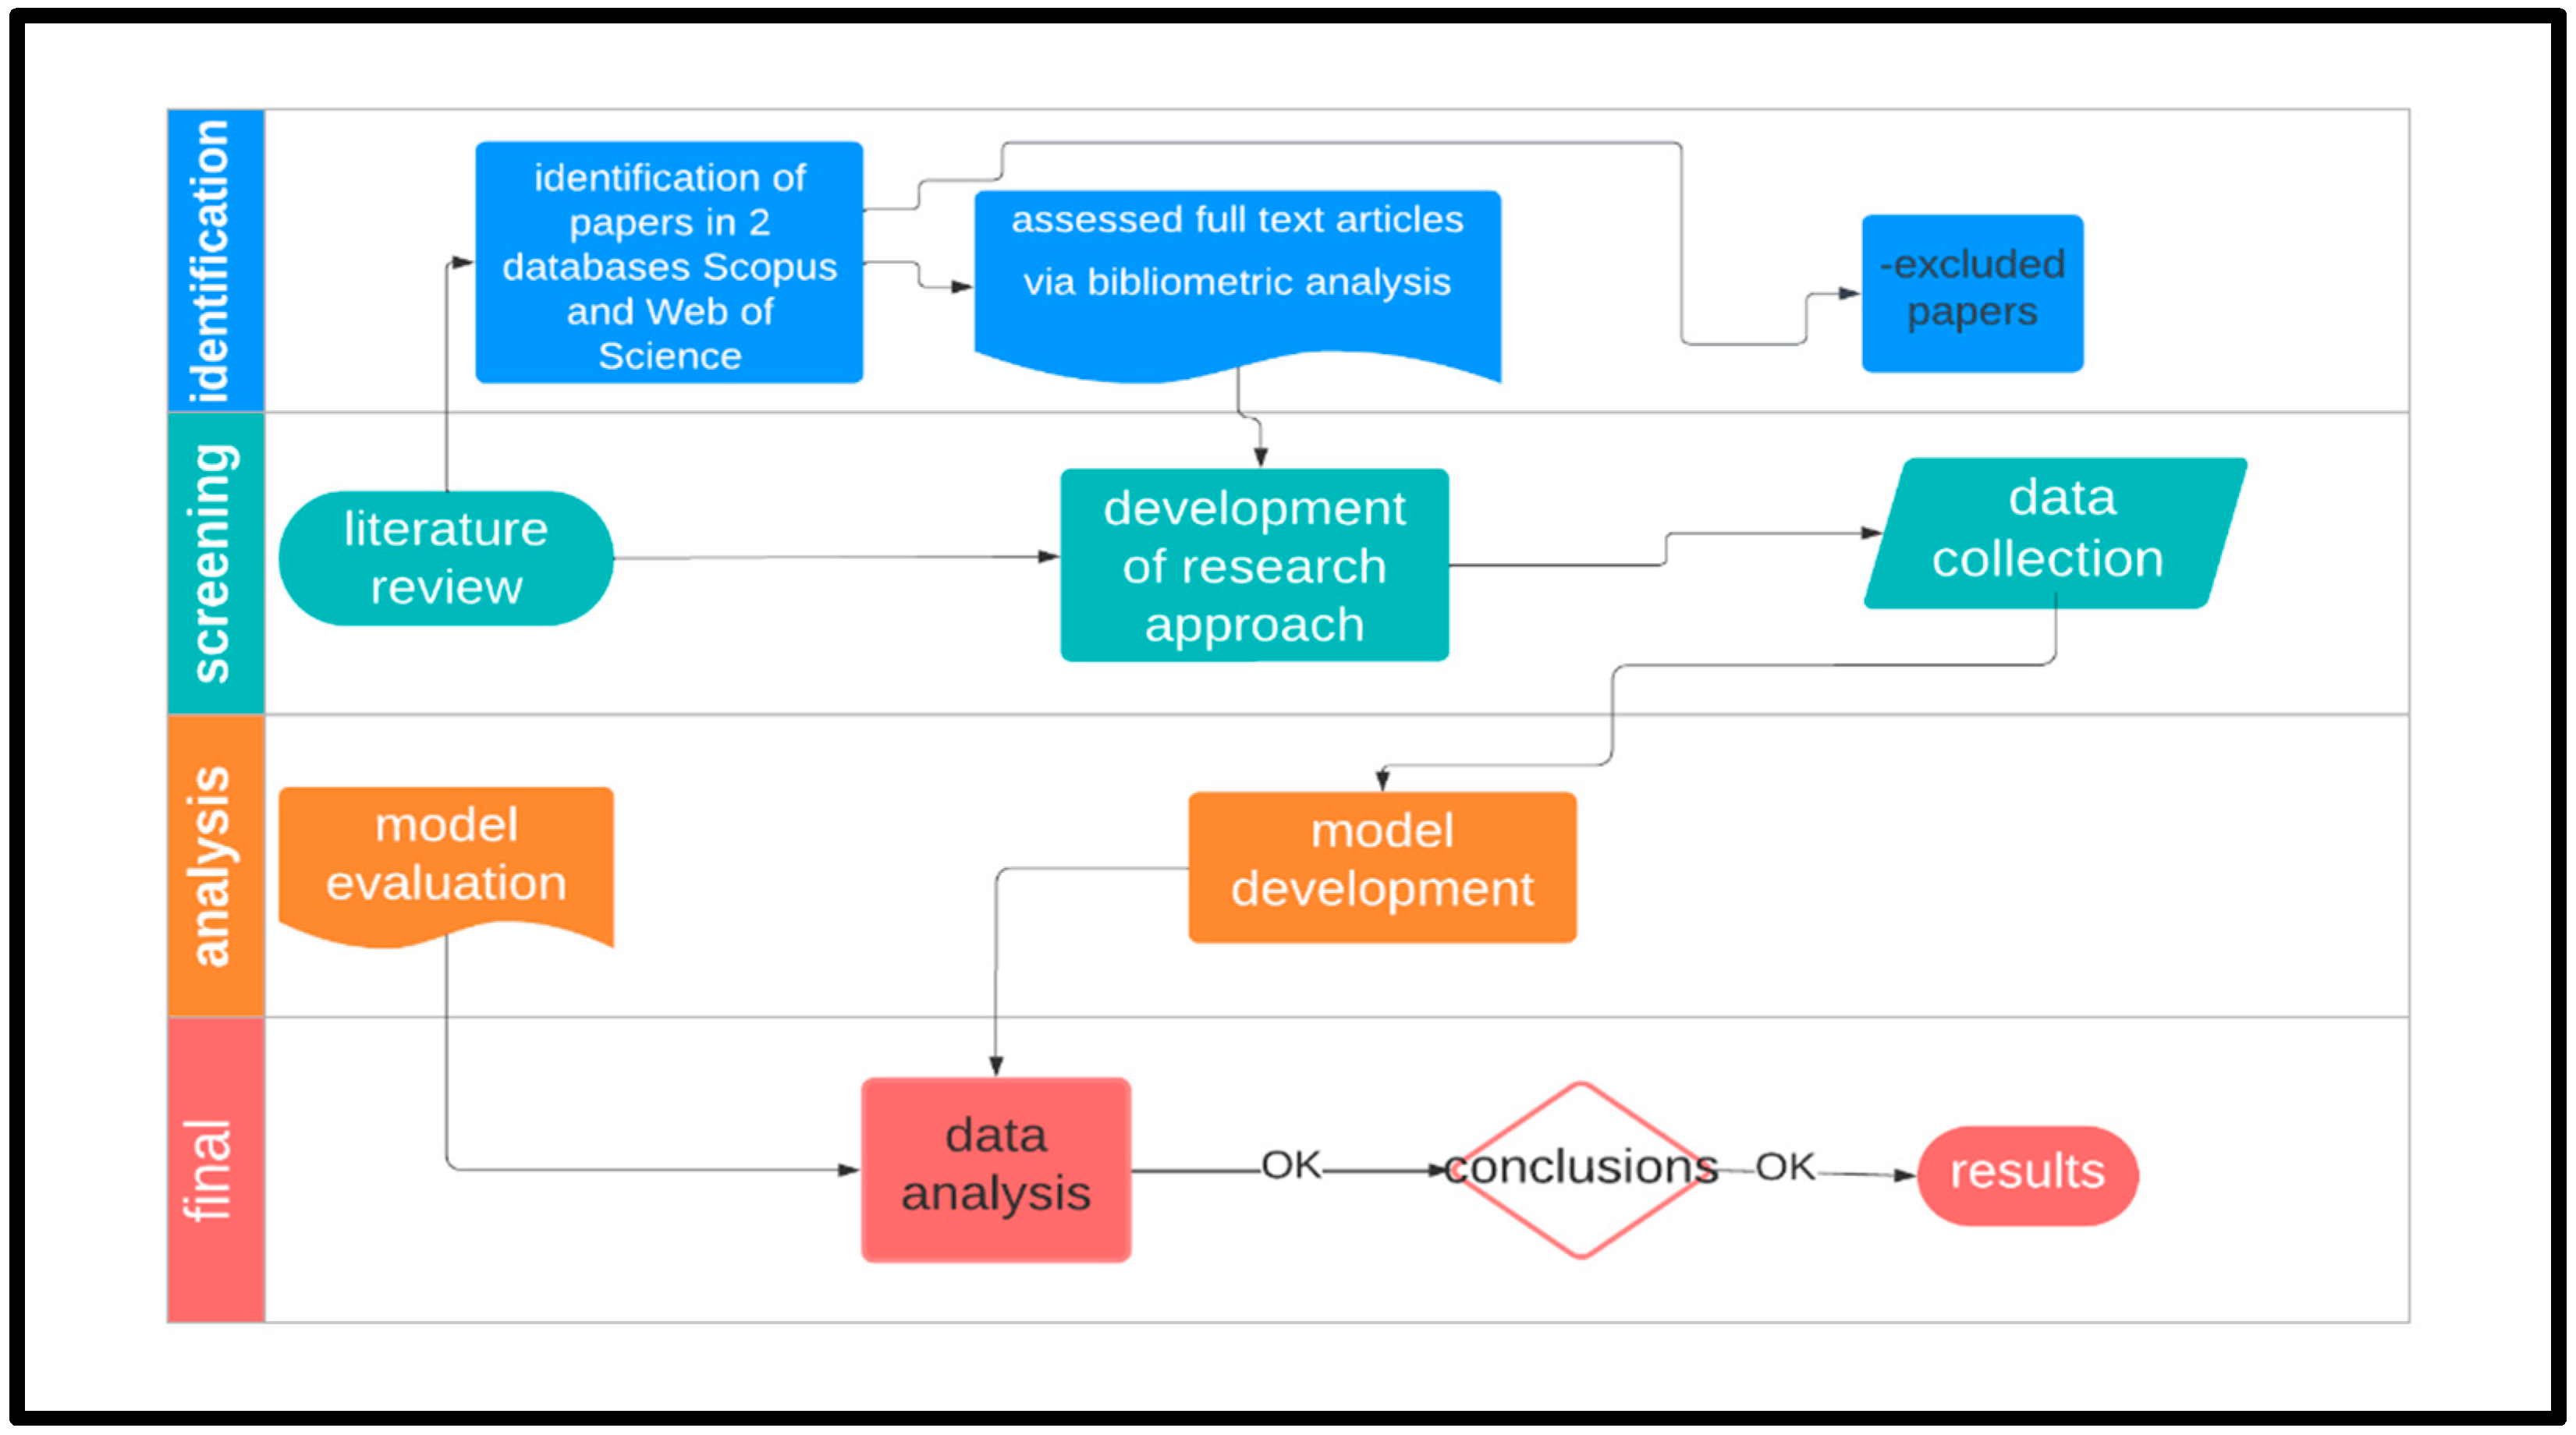
Numerous scientific sources related to the relationship between economic growth and municipal waste generation in different world regions have been reviewed and analysed. The literature review mainly includes articles published in refereed scientific journals and other academic sources available in scientific databases such as Scopus, Web of Science, etc. Databases from globally recognised organisations such as Eurostat, World Bank, United Nations, Organization for Economic Cooperation and Development, Human Development Report, and others are used in the study. This extensive and multifaceted literature review contributes to the reliability and quality of the data and analyses presented in the paper. It allows the authors to draw an overall picture and conclusions on the relationship between economic growth and municipal waste generation.
The study employs a comparative analysis of the relationship between waste generation and GDP using the EKC and the relationship between Average GDP euro/capita and Average municipal waste kg/capita.
For each of the mentioned countries, the following indicators are calculated:
where - gross domestic product for a given country in the i-th year (n-number of years, n=21 for Bulgaria, Ireland, Greece, Italy, Austria; n=22 for the other countries studied).
where- waste generated in the i-th year in the given country.
Correlation analysis [30] concerns the data on average GDP per capita and average municipal waste per capita [31].
The following indicator is calculated:
where - Pearson correlation coefficient (Pearson’s correlation n.d.)
The research uses the clustering method to divide countries into three groups according to the population’s income and the amount of waste generated, analysing the differences between the groups and examining possible patterns or trends.
The study performs a hierarchical cluster analysis [32,33] on the data related to Average GDP euro/capita and Average municipal waste kg/capita and analysed the results to determine the degree of similarity or difference between the countries regarding these indicators.
Multivariate regression analysis [34,35] is applied to Bulgaria. Municipal waste generation is a dependent variable; independent variables are GDP per capita, Human Development Index [36] and population density [37]. An investigation of the impact of the independent variables on municipal waste generation and determining the statistical significance of the factors included is carried out.
27 European countries are studied. The study period covers 22 years, from 2000 to 2021, for 22 countries considered. For the remaining five countries, Bulgaria, Ireland, Greece, Italy and Austria, the time interval includes 2000-2020, as data on waste generated per capita for 2021 are unavailable.
The present study faces certain limitations. The study is limited by the period due to a lack of statistical data to cover a larger span. This could result in an incomplete understanding of the relationship between GDP and household waste on a global or regional scale. There may be gaps in the statistical data for specific countries or years, which could complicate the analysis and summarisation of the results. The economic, social, and environmental factors not included in the study could impact the connection between GDP and household waste.
3. Results
3.1. Comparative analysis between generated waste and GDP by EKC
The relationship between waste generated and GDP can be visualised in Figure 2. We can easily trace an increase between the mentioned indicators, with a stepwise progression at the beginning, but up to a certain level of approximately 45,000 euros. After this value, the increase is already smooth, and the curve describing it gradually flattens its slope, tending to reach the turning point. Following the EKC dynamics, the curve is expected to enter the downward part of its development after getting the turning point.
Figure 2.
Municipal waste generated and GDP per capita in the EU-27 2021 (Bulgaria, Ireland, Greece, Italy and Austria 2020 values).
Figure 2.
Municipal waste generated and GDP per capita in the EU-27 2021 (Bulgaria, Ireland, Greece, Italy and Austria 2020 values).
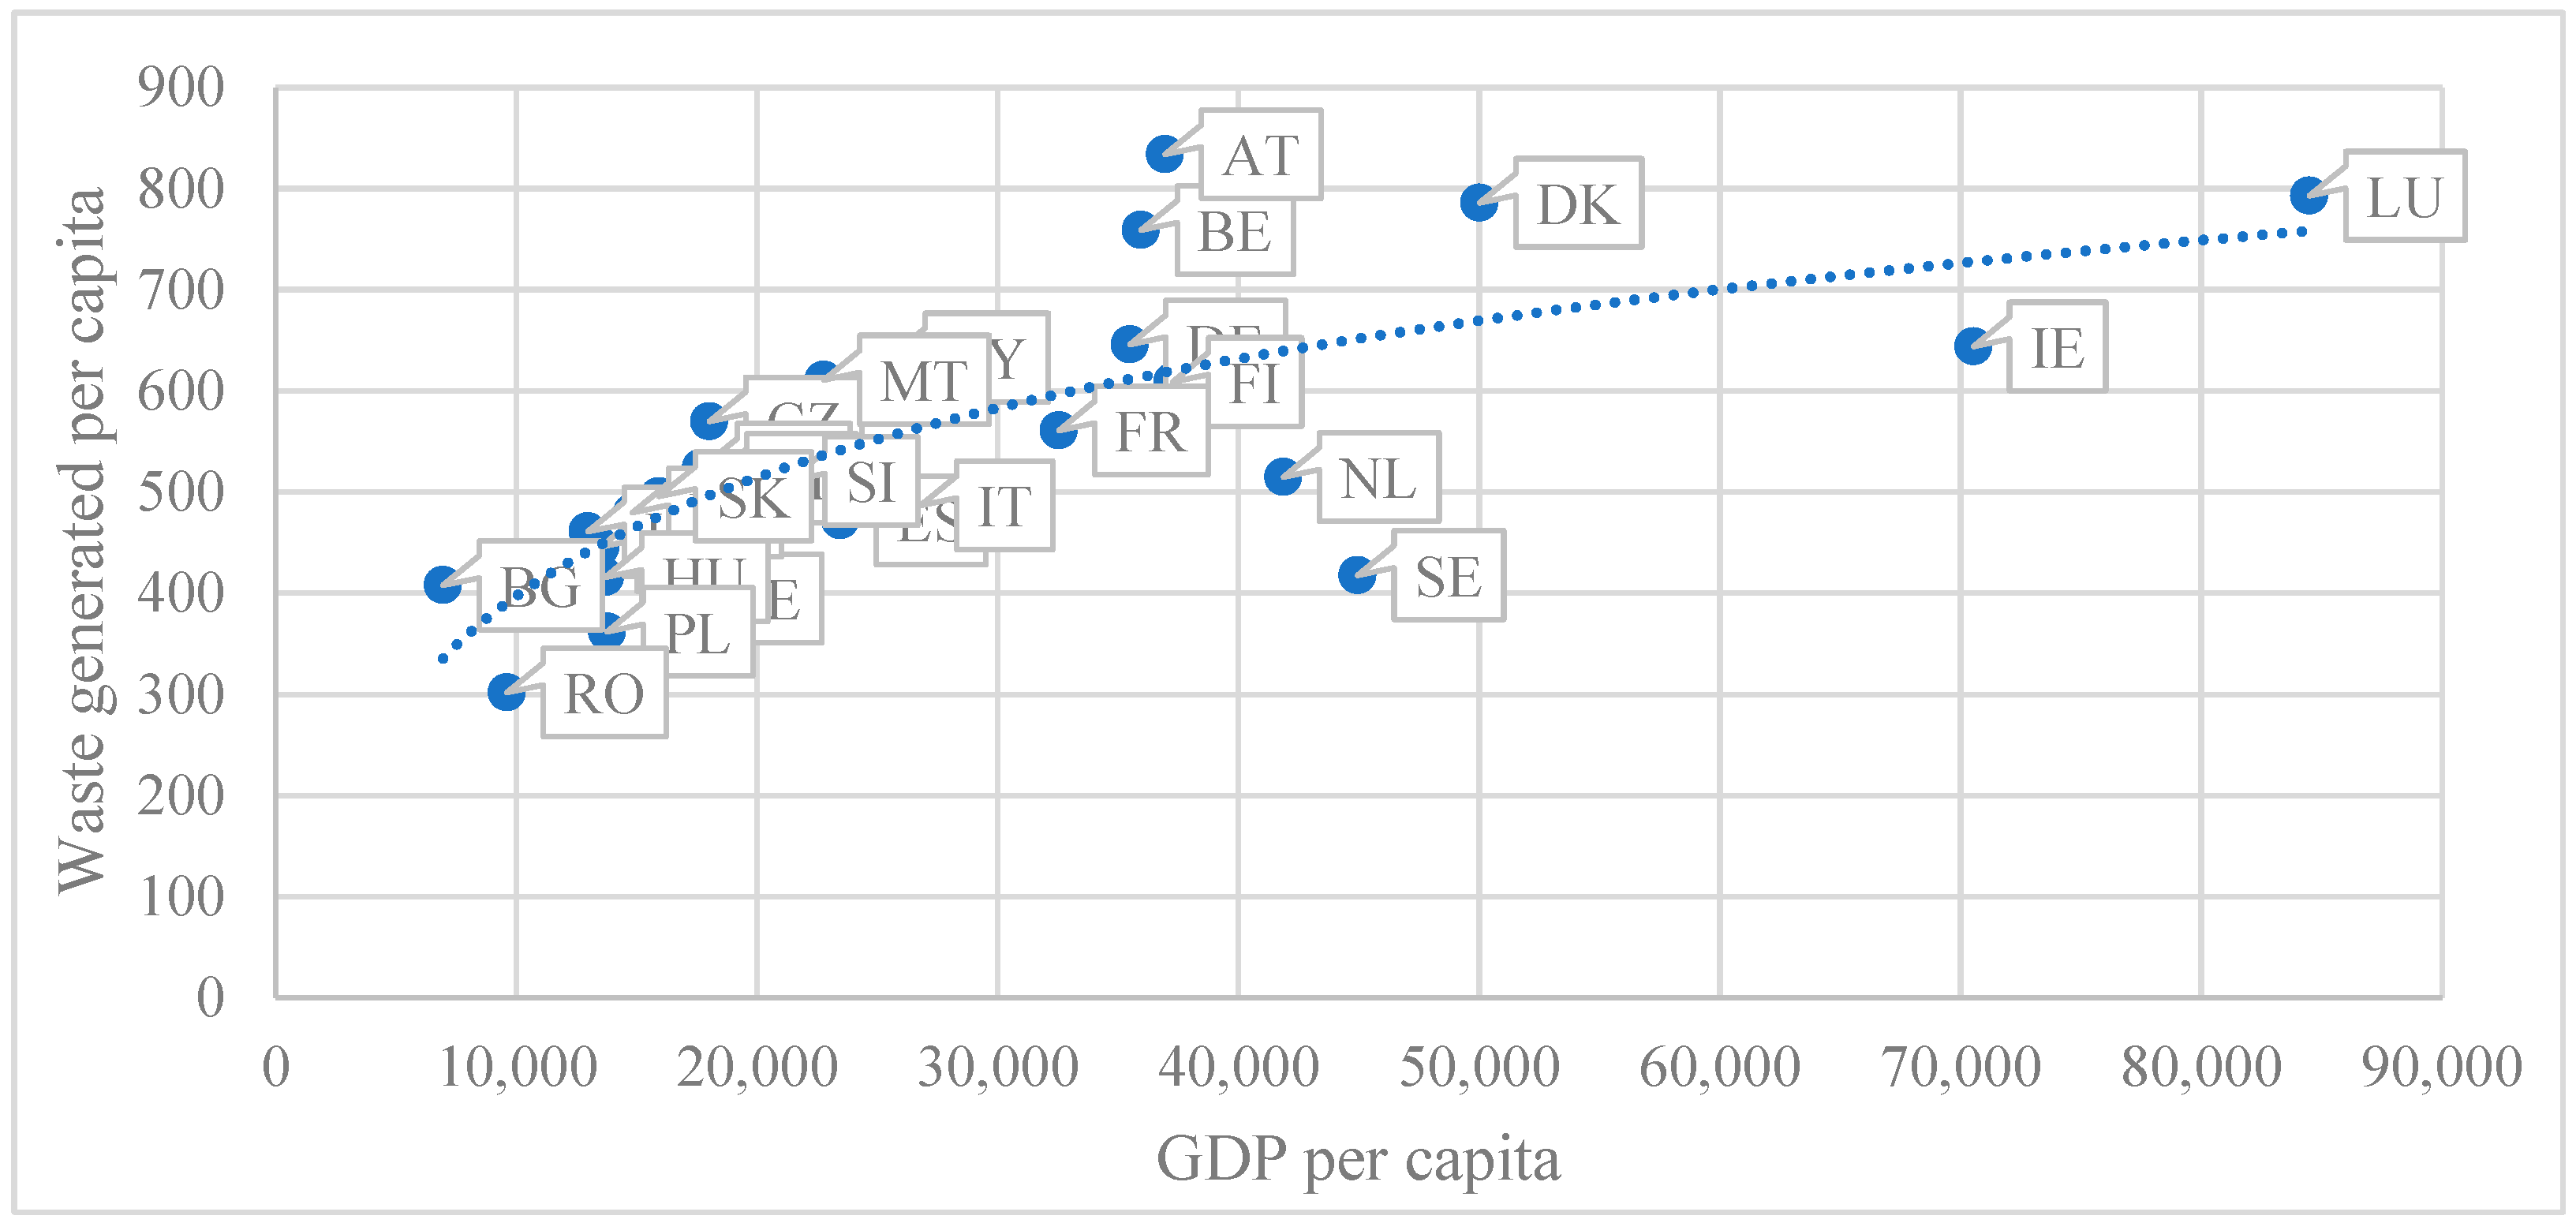
Figure 2 shows that the overwhelming number of EU countries are concentrated in the lower upward part of the curve. This implies that any further increase in economic growth will still be associated with increased waste. For some countries, this increase is more gradual. That’s why they are below the curve. Countries at the two opposite ends are also of interest. On the one hand, these countries are Luxembourg and Ireland. Compared to countries on the same horizontal axis, such as Denmark, Belgium and Austria, Luxemburg’s economic growth is nearly double, despite the similar levels of waste generated. The same trend is observed when comparing Ireland with Germany, Finland, Cyprus and Malta. The gradual decline of the curve describing the correlation between these indicators proves the same conclusion. Hence, as economic growth increases, the increase in waste generation starts to decrease gradually. At the opposite end are the countries with the lowest economic growth - Bulgaria and Romania. A parallel between Bulgaria and the other countries on the same horizontal line can be drawn - Hungary, Sweden and Estonia. Despite the significant reduction of waste generated in Bulgaria in the last decades, the waste generation figures are still too high against the background of the insignificant GDP, which is two or more times lower compared to countries with similar waste generation figures. Romania has the least waste generation and recorded higher economic growth than Bulgaria.
3.2. Comparative analysis of the relationship Average GDP euro/capita - Average municipal waste kg/capita
The variables average GDP per capita () and average municipal waste per capita () are analysed for the 27 EU countries studied. The columns in Figure 2 represent the average GDP values for the period (shown on the primary vertical axis). In contrast, the line represents the average waste generated (shown on the secondary vertical axis). Note that the variable () for Denmark is the highest. In addition, the variable () has a significantly higher value for Luxembourg than those for the other 26 countries considered.
Figure 3.
Graphical analysis of average GDP euro/capita and average municipal waste kg/capita in the EU-27 in the period 2000-2021.
Figure 3.
Graphical analysis of average GDP euro/capita and average municipal waste kg/capita in the EU-27 in the period 2000-2021.

Countries can be divided into categories according to the average GDP per capita level and look at the average values of municipal waste generated per person for each type. In this case, we will use the following categories:
- High GDP per capita: Luxembourg, Denmark, Ireland, Sweden, Belgium, Netherlands, Austria, Finland, Germany;
- Medium GDP per capita: France, Italy, Cyprus, Spain, Greece, Portugal;
- Low GDP per capita: Bulgaria, Czech Republic, Estonia, Croatia, Hungary, Latvia, Lithuania, Malta, Poland, Romania, Slovenia, Slovakia.
Here are some conclusions we can draw from the comparative analysis:
- Luxembourg has an extremely high average GDP per capita and correspondingly high levels of average household waste per capita. This can be linked to the specific economic conditions and the country’s significant financial sector presence;
- Countries with high average GDP per capita are associated with higher average waste generated per capita levels than countries with medium and low GDP. This can be explained by more significant economic activity and higher consumption levels;
- Countries with medium GDP per capita are in an average position regarding average municipal waste per capita. Although the average GDP per capita is lower than high GDP per capita countries, the average waste generated per capita is not significantly lower;
- Low GDP per capita countries have various values for average municipal waste generated per capita. Although some low-GDP countries generate less waste (e.g. Romania and Poland), other countries such as the Czech Republic, Estonia, and Latvia have higher waste generated;
- Although Bulgaria has a low GDP per capita, its municipal waste generated per capita is relatively high. Consumption habits, the efficiency of the waste management system and other socioeconomic factors are among the factors that can influence this result.
3.3. Correlation analysis applied to the survey data on GDP euro/capita and municipal waste kg/capita
A correlation analysis is performed for the above data on gross domestic product and municipal waste generated for the 27 EU member states mentioned. The calculated correlation coefficients are visualised in Figure 4.
The results allow us to distinguish several separate groups - countries with very strong, strong, moderate and weak correlations. No correlation is observed between the indicators considered for some countries examined.
Figure 4.
Correlation coefficients in the EU-27 2000-2021.
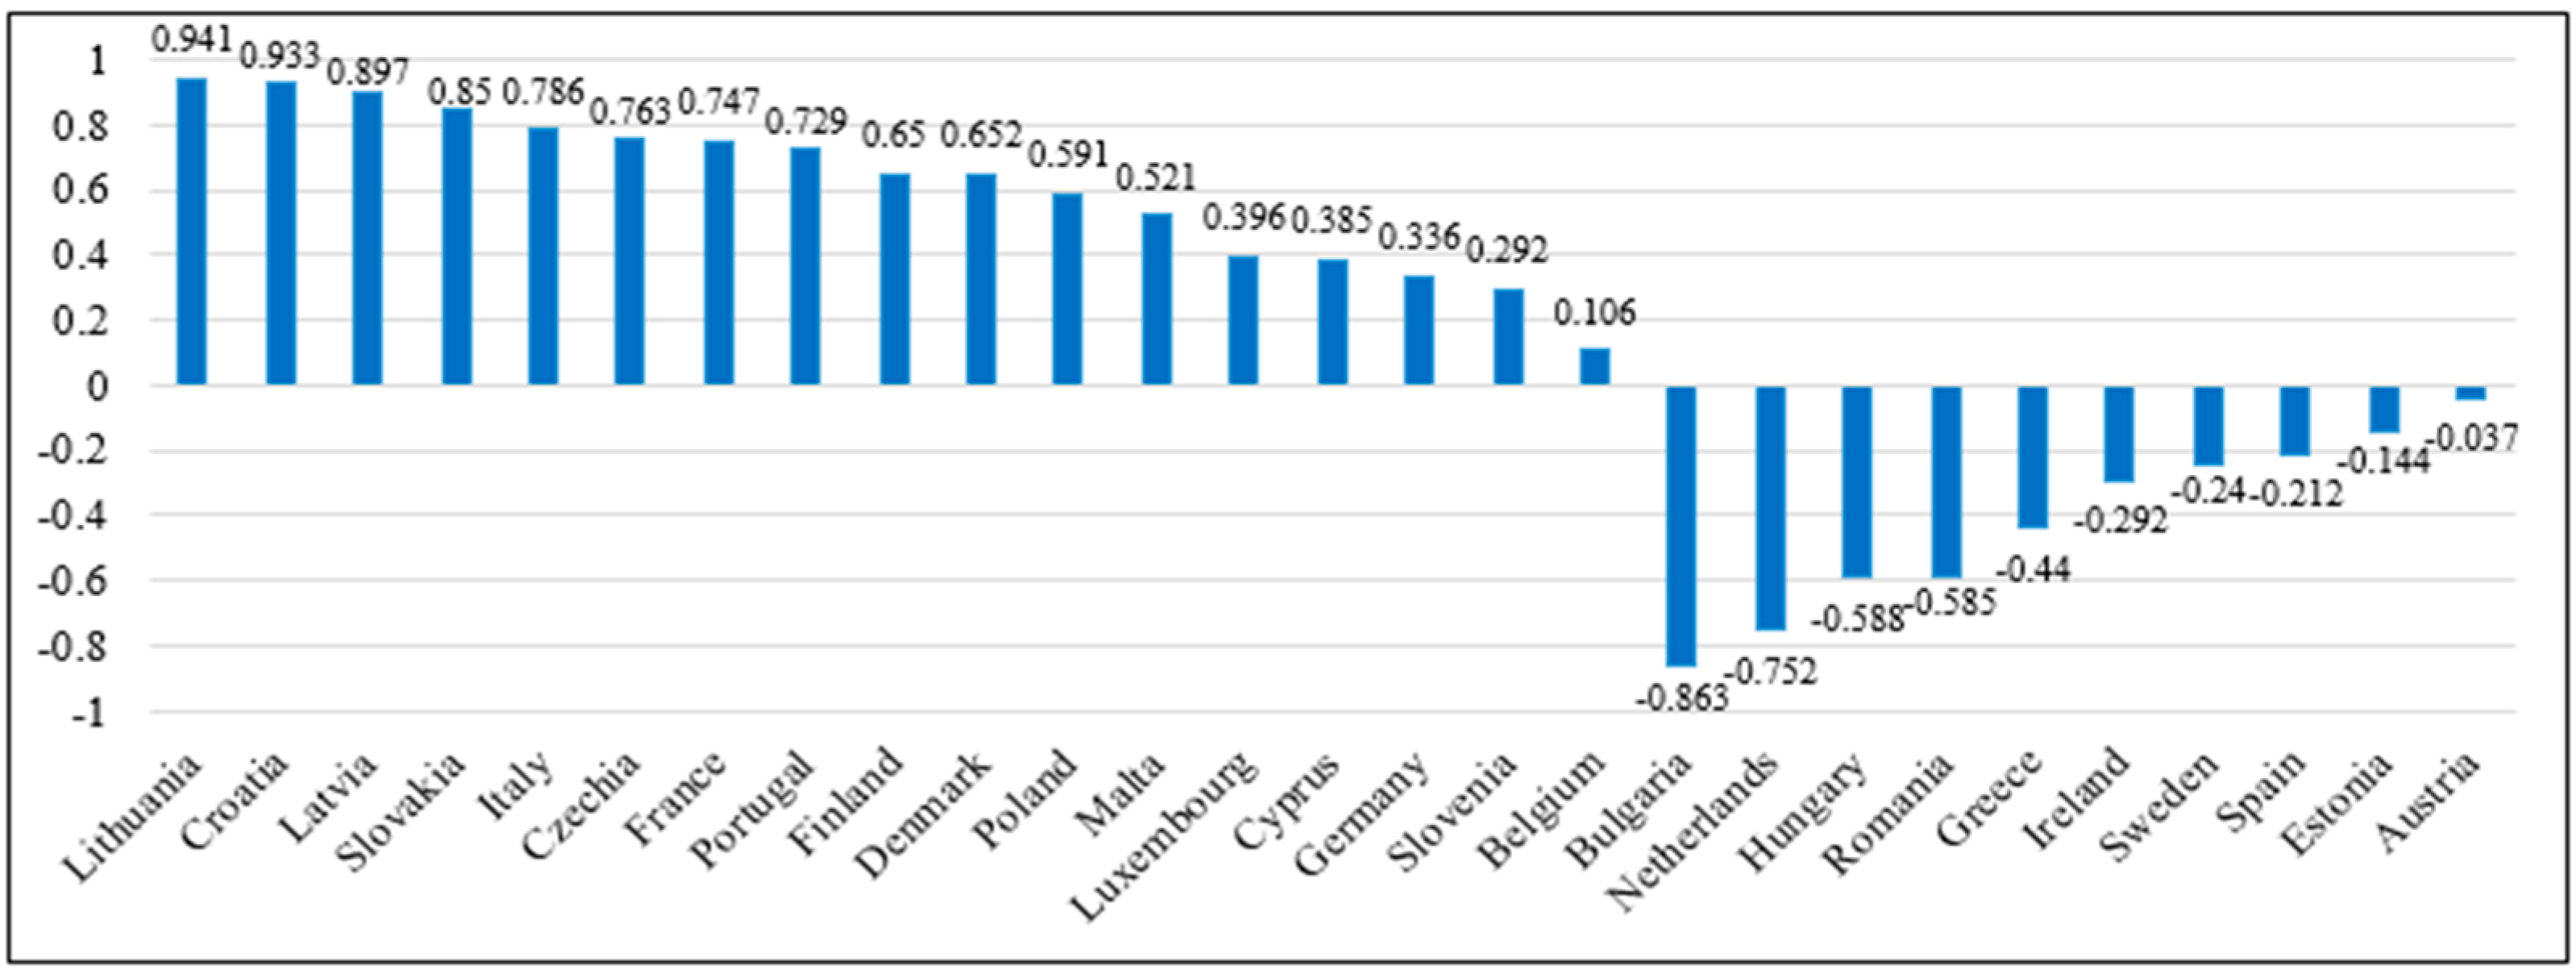
The correlation coefficients for these two indicators for Lithuania, Latvia, Slovakia and Croatia are 0.941-0.850, indicating a very strong positive relationship. There is an increase of 2.8 and 2.4 times in the values of one of the indicators (GDP per capita) at the end of the period for the first and second-listed countries. The third and fourth country’s increase is about 2 and 1.7 times. The other variable examined (municipal waste generated per person) shows similar results. The most significant increase of about 1.9 times is calculated for Slovakia. For Latvia and Croatia, it is about 1.7 times; for Lithuania, it is over 1.3 times. It should be noted that there are some years where a decrease is found for the above variables. The observed increase in GDP per capita and municipal waste generated per capita in Lithuania, Latvia, Slovakia and Croatia can be explained by the significant economic growth these countries have achieved. The increase in the economic activity and income of the population has probably encouraged consumption and consumption of resources, which ultimately leads to a higher amount of municipal waste generated.
The results show that this relationship is inherent in all four countries studied, but there are some differences in the intensity of the relationship. For example, the increase in GDP per capita and household waste is more pronounced for Slovakia and Croatia than for Latvia and Lithuania. This may be due to differences in economic models, consumption habits and waste management infrastructure in these countries. A problem for Lithuania, Latvia and Croatia is a strong reliance on landfilling and limited levels of separately collected recyclables (especially bio-waste, plastics and metals), and for Slovakia, fragmented management of municipal waste and a lack of sufficient capacity to treat bio-waste [1]. A good practice in Latvia is developing a website that provides information on the location of sorting facilities and associated waste separation practices. In Lithuania, home composters are provided to encourage composting. In Croatia, an online platform allows companies to publish data on the waste they generate and others to locate and operate them.
The correlation coefficients for GDP and waste generated for six listed countries ranged from 0.786 to 0.650, indicating a strong positive relationship. These countries are Italy, Czechia, France, Portugal, Finland and Denmark (Figure 4). A more significant increase in the indicators is found for Czechia at the end of the study period. The correlation between higher GDP per capita and higher amounts of municipal waste generated per capita is evident in this group of countries. However, some countries report significant progress in municipal waste management and have increased recycling rates [1]. Denmark has set up a sound system for managing its municipal waste with precise responsibilities for the actors involved - government, citizens, and local authorities. The online knowledge-sharing platform is an excellent practice to help municipalities exchange information on successful municipal waste recycling practices. In France, extended producer responsibility; introducing a repairability index, which allows consumers to choose electrical and electronic appliances that are easier to repair; labelling for recycled content, etc., have produced good results.
Finland has been successful with high recycling rates for municipal waste (41.6% in 2020). Despite high incineration rates (59.7% in 2020), the deposit-return scheme for beverage packaging and the system for preparing wooden pallets for reuse are performing well. The combined door-to-door separate collection and pay-as-you-throw scheme is a good practice in Italy. It increased the separate collection rate from 48.5% to 72% and reduced with 15% the waste generated in just four years. The Czech Republic has also expanded its recycling rate of municipal waste (45.5% in 2020) and reports the establishment of a Reuse Centre as good practice. This centre prevented 77 tonnes of municipal waste from entering landfills for a year. It is also used for educational purposes. Another part of this group of countries has additional challenges in dealing with municipal waste [1]. Portugal faces challenges such as insufficient infrastructure for separate collection and treatment of biowaste and packaging, a strong reliance on landfilling (47.5% in 2020) and low levels of separately collected recyclables.
The correlation coefficient between the indicators considered for the two countries (Poland and Malta) is 0.591 and 0.521, indicating a moderate positive relationship. Again, the analysis proves the hypothesis that higher economic development (as measured by GDP) is associated with higher amounts of municipal waste generated. GDP in Poland increased continuously in the analysed years except for 2020. Economic factors such as investment growth, increased business competitiveness, political stability and other measures to stimulate the economy are possible explanations for the mentioned GDP growth in Poland. Household waste per person in Poland grew at a low rate, from 320 kg per person in 2000 to 362 kilograms per person in 2020. Poland faces problems such as a low capture rate of biowaste, limited capacity to treat separately collected biowaste and a heavy reliance on landfilling, resulting in limited resource reuse [1]. Identifying individual waste-producing households through labelling garbage containers and bags that improve separate waste collection and promoting composting through a garbage fee exemption are good practices in Poland.
GDP per capita in Malta increased from €13,750 thousand in 2000 to €22,760 thousand in 2020. Despite the fluctuations in municipal waste per capita figures in the last years (2018-2020), the values have remained lower than the previous years. This may signify an improvement in the efficiency of waste management systems and the implementation of sustainable practices in Malta [38]. However, low household waste recycling rates (10.5%) and limited waste recycling infrastructure are characteristic of Malta [1]. The high tourist activity, around 2.5 million people annually, also hurts recyclable waste levels. By producing comic books, Malta is committed to raising public awareness of waste generation, collection, separation and disposal, including school children.
In addition, the 12 correlation coefficients discussed above are statistically significant at α=0.05 significance level.
As shown in Figure 4, the estimates of the coefficients of correlation between variables in the study for all four countries ranging from 0.396 to 0.292, indicate a weak positive relationship. These examined countries are Luxembourg, Cyprus, Germany and Slovenia. The correlation coefficient found between GDP and waste generated for Belgium is 0.106. In this case, there is no relationship between the two mentioned indicators. The five correlation coefficients listed here are not statistically significant. All five countries are in the rich country category according to the World Bank classification. They are most likely in the downward part of the EKC, where increased economic growth leads to less waste generation. These results are thanks to government investment and a high degree of responsibility from higher-income societies. The disparity in economic and social conditions may cause the effects. Each country studied has unique economic and social conditions that may influence the relationship between GDP and household waste. Differences in industrial structure, consumption habits, waste management policies and other factors may lead to a weak correlation between these indicators.
Other factors influence the amount of municipal waste generated in a particular country, regardless of its GDP. Such factors include a developed waste management infrastructure, environmental awareness and education of the population, recycling and waste sorting policies, urban planning and regulation, etc. Luxembourg had a municipal waste recycling rate of 52.8% in 2020 and a meagre landfill rate of 3.8% in 2020 [1]. The country boasts an excellent waste management system covering the disposal and recycling of almost all waste materials, including the disposal, treatment and recycling of electrical and electronic equipment. Germany is one of the leading countries in Europe in terms of waste recycling. In 2020, around 69% of the country’s total waste is recycled or composted [1]. The country’s landfill rate is below 1%. Germany’s national deposit refund scheme is one of the first in Europe.
Slovenia is also known for its high recycling rates. In 2020, around 59.3% of the country’s municipal waste volume is recycled [1]. According to Eurostat, Belgium boasts all European Union countries’ highest recovery and recycling rates. It recycled 79.2% of all waste in 2020, well above the EU average of 53% [39]. Regarding packaging waste, Belgium shows a recycling rate of 94.9% in 2020. The last country in this group, Cyprus, has a high dependency on landfilling (67% in 2020), a low recycling rate (16.8% in 2020), and insufficient infrastructure and systems for separate collection and treatment of bio-waste [1]. Data show that Cyprus achieved economic growth from 2000 to 2020, with GDP per capita increasing. Municipal waste per capita has remained stable without significant fluctuations. However, the country needs to improve the efficiency of its waste management system [40].
As shown in Figure 4, the calculated correlation coefficients for Bulgaria and Netherlands are -0.863 and -0.752, indicating a very strong and strong negative relationship, respectively. In this case, an inversely proportional dependence is observed between the studied indicators. GDP per capita increase of more than 2.1 times is considered over the 21 years in Bulgaria. An insignificant decline is recorded for only two studied years - 2009 and 2020. It should be noted that for the 25 countries listed, there is also some decline in GDP for 2020. The values of the other indicator (generated waste) decrease about 0.6 times for Bulgaria at the end of the time interval considered. The situation is similar for the Netherlands, but here the increase in GDP per capita is approximately 1.19 times, while the decrease in the second variable (generated waste) is more than 0.8 times. The same conclusions could be drawn for Romania and Hungary.
GDP shows some growth, while the second variable shows some decline at the end of the period. The correlation coefficients for the three studied countries, Romania, Hungary and Greece, are -0.588, -0.585 and -0.44, respectively, indicating a moderate negative relationship. Therefore, an inversely proportional dependence is obtained between the studied indicators. It should also be noted that the correlation coefficients obtained are statistically significant at α=0.05 for Bulgaria, Netherlands, Romania, Hungary and Greece for the data considered on the two indicators studied.
The inverse relationship between GDP per capita and municipal waste per capita is a positive fact that can be explained by several reasons. First, higher GDP per person can be associated with more advanced technology and more efficient use of resources, which reduces the amount of waste generated. Second, in more developed economies, industry has shifted away from industry towards the service and information technology sectors. These sectors typically generate less municipal waste than industry. Third, people’s consumption behaviour changes as GDP and living standards rise. Wealthier societies focus more on longer-lasting products and recyclable materials, reducing waste generation. Fourth, more developed countries have more efficient waste management systems, including separate collection, recycling and treatment of waste. These activities reduce the volume of untreatable waste and contribute to lower waste generation. Finally, high public awareness of the importance of environmental protection and sustainable development can lead to a change in people’s behaviour and to a more responsible attitude towards waste. However, the above applies to the Netherlands, which has one of the highest GDP per capita of the 24 countries surveyed. The Netherlands invests in developing recycling infrastructure, including recycling centres and waste treatment facilities. These facilities permit efficient separation, sorting and recycling of the different waste fractions. The recycling rate of municipal waste in the country is 56.8% in 2020, and only 1.4% of municipal waste is landfilled [1]. The Netherlands applies a ’pay-as-you-go’ system for waste collection. The citizens pay a fee depending on the amount of waste they produce. This system encourages citizens to reduce waste and actively participate in separate collection and recycling.
The other three countries (Romania, Hungary and Bulgaria) have Europe’s lowest GDP per capita. In this case, the inverse relationship between GDP per capita and household waste per capita is due to different reasons. All three countries are economies in transition. Studies prove that transition countries improve their environment faster due to Rising energy prices and penalising energy-intensive activities [41,42]. In addition, countries with low GDP per capita usually go through early industrialisation and economic development stages. Production processes and resource consumption are typically less efficient in these stages and create more waste. Countries with lower economic growth may face challenges in establishing an effective waste management infrastructure. A lack of separate waste collection, recycling and treatment results in higher waste generation. All three countries have low recycling rates (13.7% for Romania, 32% for Hungary, 31.5% for Bulgaria in 2020) and high landfill rates (74.3% for Romania, 54% for Hungary, and 61% for Bulgaria in 2020 [1]. Economic development and increasing incomes are a priority in these countries rather than environmental sustainability and waste management.
The calculated correlation coefficients for the following three countries - Ireland, Sweden, and Spain are -0.292, -0.24 and -0.212, respectively, indicating a weak negative relationship. Here, an inversely proportional dependence is also found between these two variables. This means that a higher GDP per person is usually associated with less waste generated per person and vice versa. A more efficient use of resources and a lower dependence on materials leading to waste explain such a result. Ireland has a household waste recycling rate of 40.4% in 2020 and a landfill rate of 22.5% in 2020 [1]. Ireland is progressing in its municipal waste management by relying on producer responsibility and public awareness activities despite low waste separation rates and insufficient infrastructure for the separate collection and treatment of bio-waste. Sweden is known for its use of waste as a source of energy. Much of the waste generates heat and electricity in highly efficient waste-to-energy facilities. This helps reduce the use of fossil fuels and the country’s carbon footprint [43]. Sweden has a landfill rate of less than 1% due to National Landfill Bans for certain types of waste [1]. Spain has a high landfill rate for its municipal waste (52% in 2020) and an insufficient population covered by separate waste collection. Nevertheless, highly efficient recycling schemes and the pay-as-you-throw system are good practices in the country, but these practices are only implemented in some cities.
The calculated correlation coefficients for Estonia and Austria are -0.144 and -0.037. There is no relationship between these two indicators in this case. Hence, other factors or influences are vital in determining the waste generated in these two countries. The five correlation coefficients listed above are not statistically significant in this case. Austria is known for its high waste management standards. It is one of the leading recycling nations in Europe [44]. The country uses extensive separate waste collection systems, with citizens separating the waste into different fractions. Austria has achieved high recycling rates for packaging, paper, cardboard and glass (62.2% in 2020). It has also developed programmes for composting bio-waste and recovering energy from waste. The landfill rate of municipal waste is 1.8% [1]. Creating incentives for Austrian citizens to give electronic devices for repair instead of throwing them away through vouchers for half of the repair costs is a good practice in the country. Estonia is also a country with good waste management. It is actively working to reduce waste and increase recycling [45]. The country offers incentives and rewards for citizens actively participating in recycling and waste reduction. Estonia emphasises the development of innovative technologies and recycling centres, such as the Real-Time Data Collection System. The country still has low levels of separate collection and recycling of household bio-waste (28.9% in 2020) but a high recycling rate for packaging waste - 71.4% in 2020 [1].
We can draw the following conclusions comparing the data on average GDP per capita and average household waste per capita with the resulting correlation coefficients from Figure 4:
- The countries with a high correlation (close to 1) between GDP per capita and municipal waste generated per capita are Lithuania, Latvia, Slovakia and Croatia. These countries have relatively low average GDP per capita compared to other countries, with average municipal waste per capita in the middle range;
- Countries with a low correlation (close to 0) between GDP per capita and municipal waste generated per capita are Germany, Slovenia, Belgium, Ireland, Sweden, Spain, Estonia and Austria. These countries have a higher average GDP per capita than others, with average municipal waste per capita in the middle or lower range;
- The countries with a negative correlation (close to -1) between GDP per capita and municipal waste generated per capita are Bulgaria, the Netherlands, Hungary, Romania, Greece and Poland. These countries have a lower average GDP per capita than others, with average municipal waste per capita in the middle or higher range.
In summary, countries with high correlation have lower average GDP per capita but relatively high levels of municipal waste generated per capita. Countries with low and negative correlation have higher average GDP per capita but different levels of municipal waste generated per capita.
3.4. Correlation between per capita income and waste generation
Differences can also be observed depending on the level of income received. This indicator is closely linked to the economic growth and GDP of the country. The World Bank divides countries into Lower income, Lower middle income, Upper middle income and High income. None of the European countries is in the category of the first group. Bulgaria is the only country in the second group. Lithuania, Latvia, Poland and Romania are the four countries in the third group, and the remaining European countries belong to the last group. The waste generated by these three groups can be seen in Figure 5:
Figure 5.
Waste generation by income group EU-27 in euro per capita.
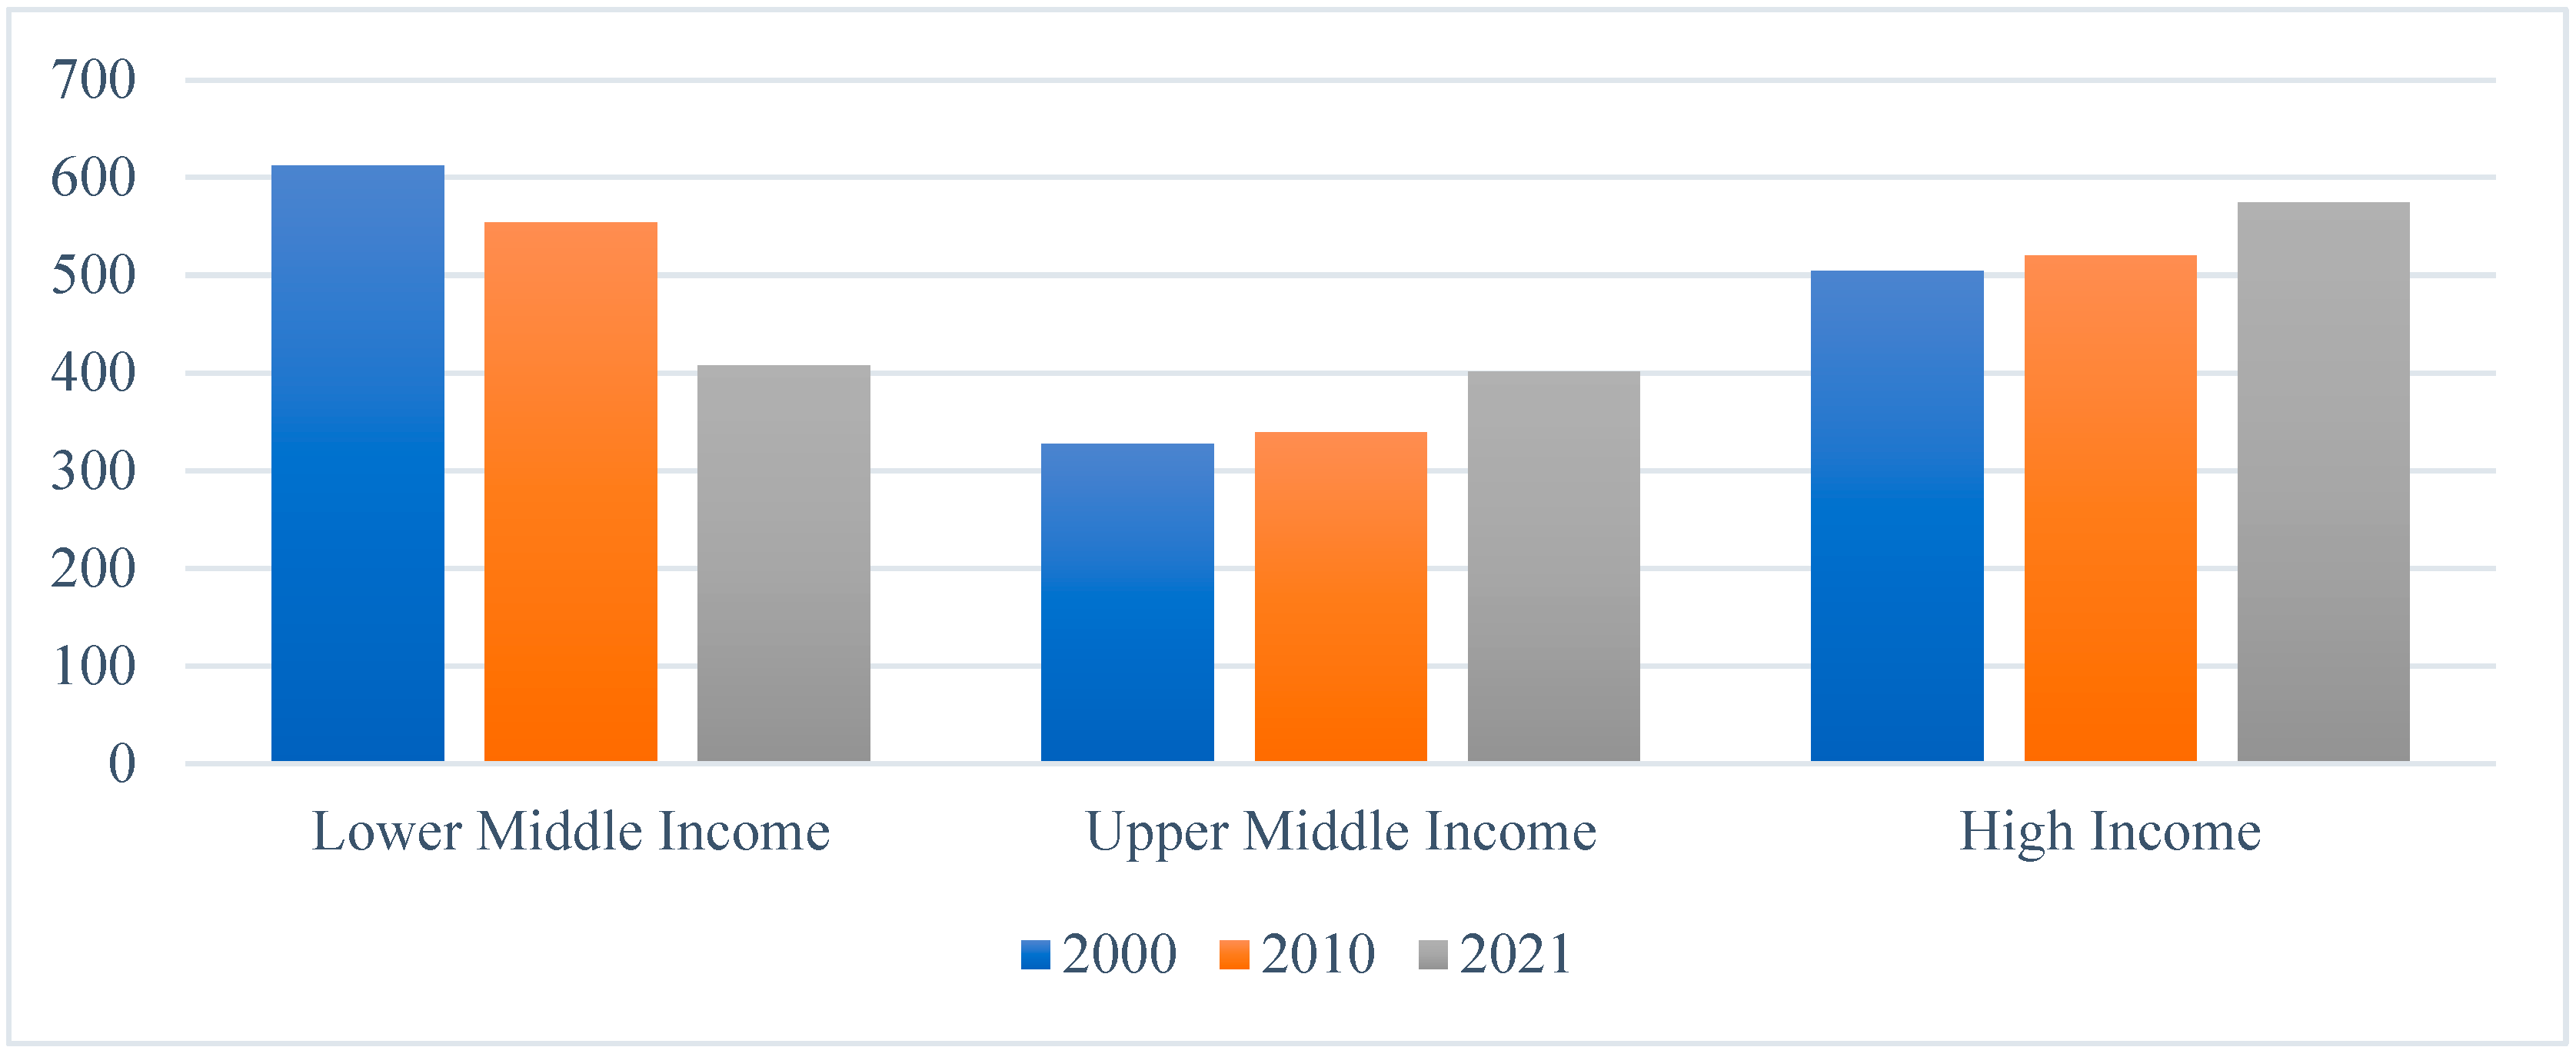
A well-visible trend is that high incomes are associated with more waste generated. The exception to this rule is the Lower Middle-Income group. Bulgaria is the only representative in this category, and all conclusions are related only to it. Waste per capita was significantly above the European average despite the low-income level in the country in 2000 when the country was still outside the EU. Bulgaria’s accession in 2007 and the adoption of several European waste management standards led to a gradual reduction in waste. It is evident already in 2010 but even more noticeable in 2021, when the figures fall below those of the High-income countries but are still above the Upper middle-income group. Low values of waste generated, influenced mainly by Romania and Poland, are typical for the Upper middle-income group. These are the countries with the least waste within the EU. However, in the last decade, there has been a more marked increase, more significant even compared to the high-income countries. There has also been an increase but at a slower pace. This verifies the thesis that as incomes rise and get closer to the turning point, the waste increase gradually begins to slow down. Upon reaching it, the waste generated will decline following its downward tendency.
3.5. Hierarchical cluster analysis according to average GDP euro/capita and average municipal waste kg/capita
The grouping of the countries according to average GDP euro/capita and average municipal waste kg/capita is presented in the dendrogram of Figure 6:
Figure 6.
Grouping of the countries according to average GDP euro/capita and average municipal waste kg/capita.
Figure 6.
Grouping of the countries according to average GDP euro/capita and average municipal waste kg/capita.
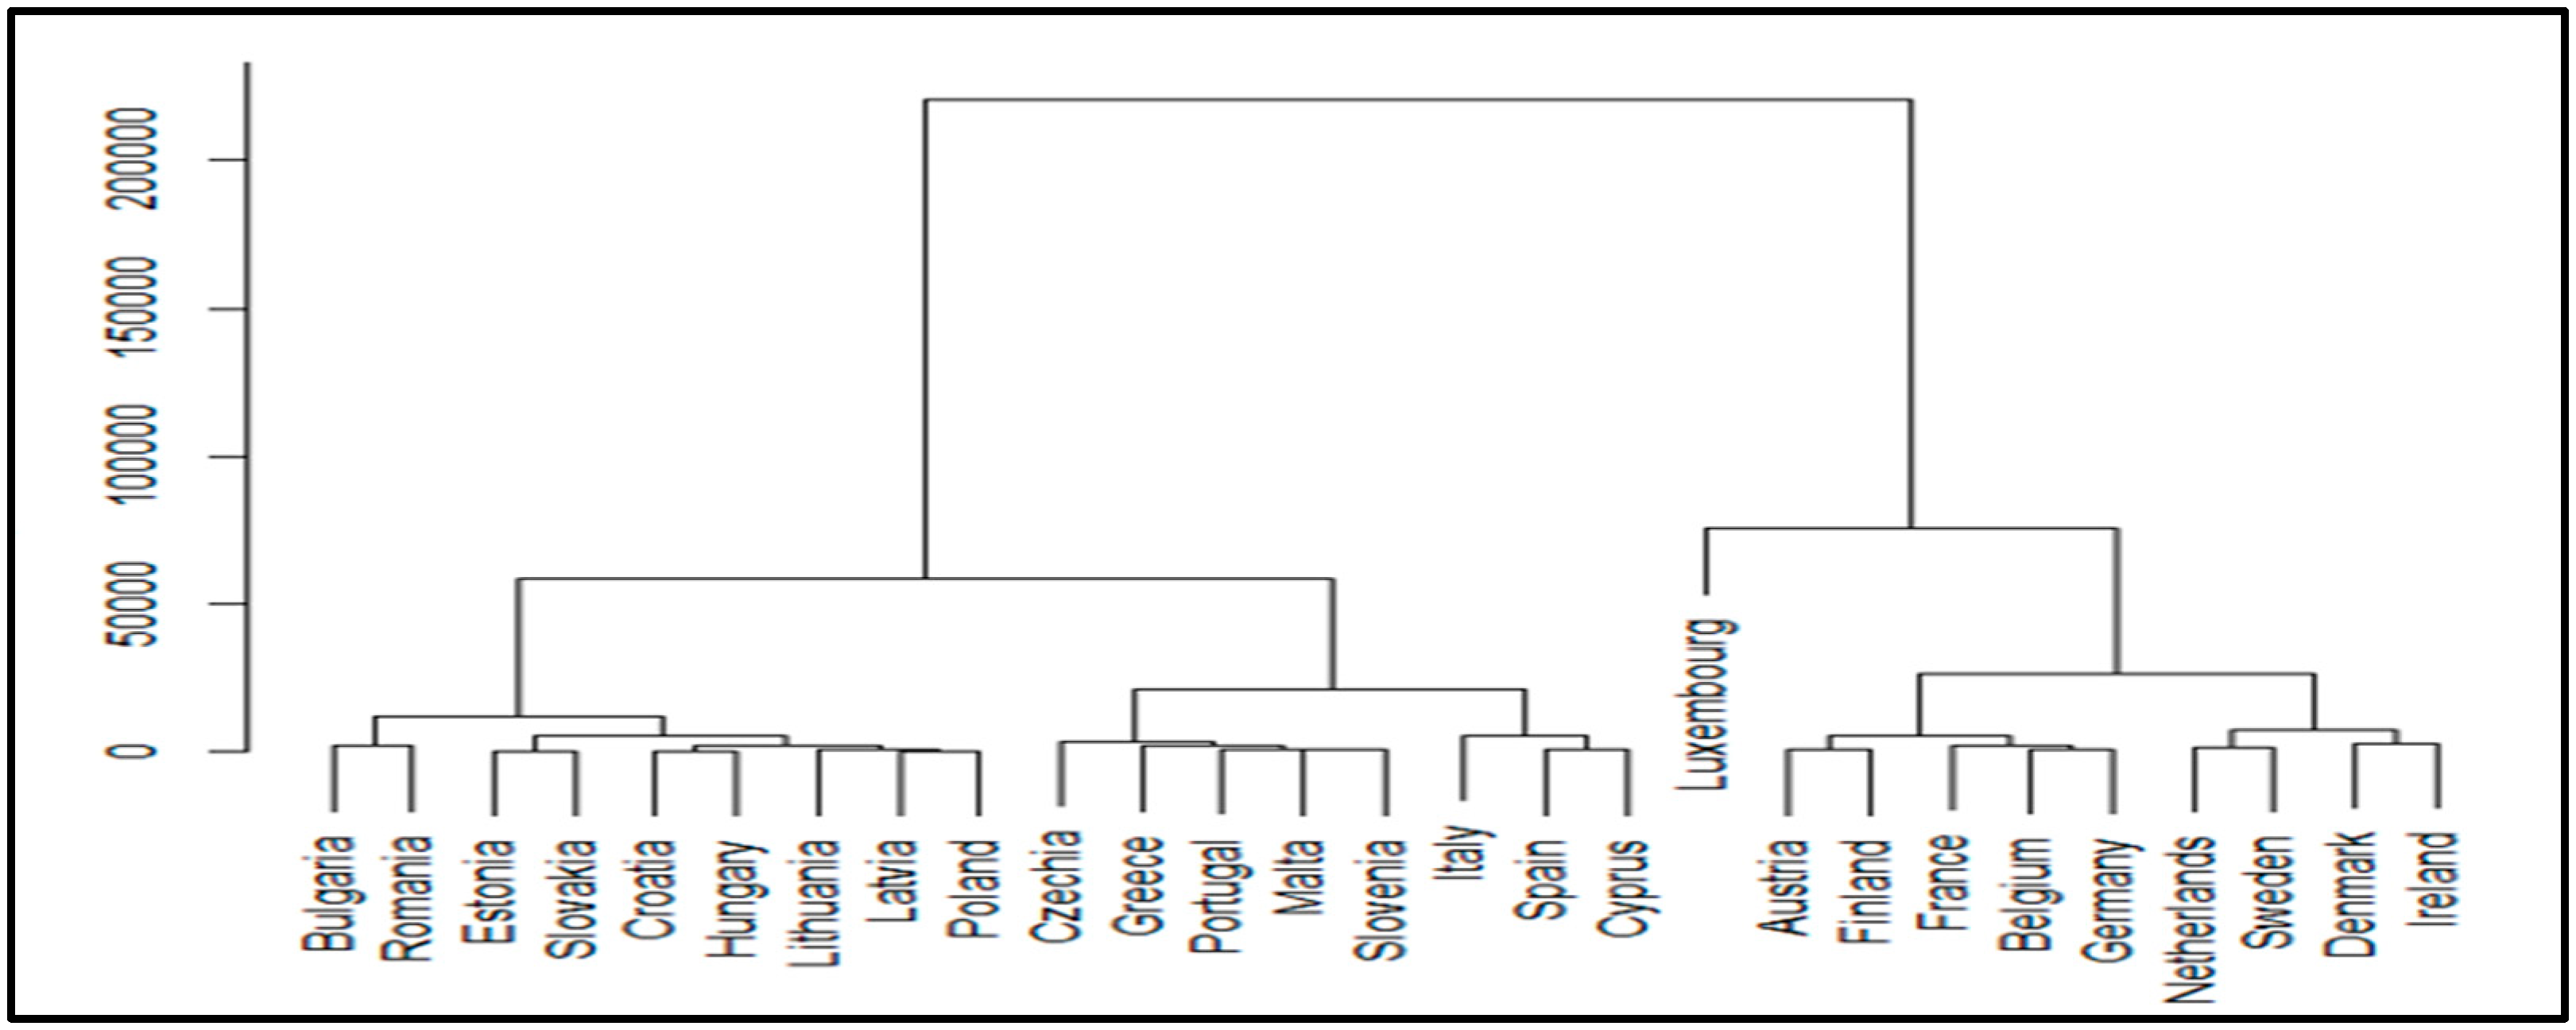
The resulting clusters are four:
The first cluster includes nine countries - Poland, Latvia, Lithuania, Hungary, Croatia, Slovakia, Estonia, Romania and Bulgaria. These countries are characterised by lower average GDP per capita and higher average waste generated per capita compared to the other countries. These are countries lagging behind economically - mainly Eastern European and Baltic countries.
The following cluster contains two sub-clusters. The first includes five countries - Slovenia, Malta, Portugal, Greece and the Czech Republic. These countries with average GDP per capita and average waste generated per capita are higher than the first cluster but lower than the third cluster. The second sub-cluster contains three countries - Cyprus, Spain and Italy. These countries have an average GDP per capita and average waste generated per capita that are higher than those in the third cluster but lower than those in the first cluster. The second cluster highlights the need to improve waste management systems and introduce more efficient recycling and waste reduction practices.
Two sub-clusters are represented in the third cluster. The first sub-cluster comprises four countries (Ireland, Denmark, Sweden and the Netherlands) with high average GDP per capita and relatively low average waste generated per capita. The second sub-cluster includes the following five countries - Austria, Finland, France, Belgium and Germany. These countries have high average GDP per capita and average waste generated per capita compared to the other clusters. This cluster includes countries with more developed economies and efficient waste management systems. However, they must continue to invest in sustainable practices and infrastructure to maintain the high level of waste management achieved. Countries from Western Europe and Scandinavia are represented in this group.
Luxembourg forms a separate cluster as it has an extremely high average GDP per capita and high average waste generated per capita compared to the other countries in the analysis. This could point to the direction of economic resources and focus on the growth of industries that can generate more waste.
3.6. Multivariate regression analysis applied to the indicators studied for Bulgaria
The relationship between GDP and municipal waste in Bulgaria is of particular interest due to the following factors:
- The fact that Bulgaria has the lowest GDP per capita among the countries analysed highlights the country’s economic challenges and constraints. This may affect consumption habits and the ability of the population to avoid unnecessary waste, as well as investment in modern waste management technologies;
- Above-average municipal waste per capita. Despite Bulgaria’s low GDP per capita, municipal waste is above the average. Hence, the population generates significant waste despite the limited economic opportunities. Consumption habits, the approach to recycling and waste management are the factors that can cause this result.
A multivariate regression analysis is performed to analyse the relationship between municipal waste and GDP in Bulgaria covering the period 2000 - 2020. Municipal waste in a million tonnes is the dependent variable in this analysis, while indicators related to economic growth, social development and population are included as independent variables.
GDP per capita (thousand euros) is the first independent variable. This indicator can serve as a measure of a country’s economic growth and well-being. Economically developed countries usually have a higher waste generated due to a higher level of consumption, but also more efficient waste management systems [46,47,48,49]
The Human Development Index is an indicator of a country’s standard of living that gives information on the population’s economic, educational and health indicators. A higher index usually means a higher standard of living. Therefore, it can be linked to specific consumption patterns of the population that influence municipal waste generation. On the other hand, the Human Development Index can provide insight into the level of awareness of the population on the importance of environmental protection as well as the policies adopted by the government for waste management. This consideration can also influence the municipal waste generated in a country [50,51,52,53,54].
Population density persons/km2 is a measure of population density. A larger population usually produces more waste due to a higher level of consumption. At the same time, higher population density is associated with more efficient waste management systems [28,55,56,57,58].
Analysing the relationship between GDP and municipal waste in Bulgaria can help us understand two main things.
First, the multivariate regression analysis, including the GDP per capita, Human Development Index, and Population Density, can give us a more detailed insight into the impact of economic development on waste generation. This can help us identify relationships and dependencies between these factors and build a more comprehensive understanding of Bulgaria’s waste management trends and challenges. For example, we can understand whether higher GDP generates more waste or whether the human development index impacts preferences and habits for sustainable waste management. Also, we can explore how population density can influence the waste generated.
Second, multivariate regression analysis allows us to examine the existing relationships between factor variables and the municipal waste generated while controlling for the influence of other factors. This enables us to identify and analyse the significant factors explaining municipal waste in Bulgaria. Such an analysis can help develop sustainable waste management strategies and policies, focusing efforts on areas with the most important potential to reduce waste and improve the country’s sustainability.
Examining the relationship between GDP, Human Development Index, Population Density, and municipal waste can help us understand and justify the interaction between economic, social and environmental factors in sustainable development. This will provide us with valuable guidance to improve waste management in Bulgaria and achieve a more sustainable and environmentally responsible future.
In general, the regression model has the following form:
y=a0+a1x1+a2x2+a3x3
where a0, a1, a2, a3 - coefficients of the equation, y - municipal waste (million tons), х1 - GDP per capita (thousand euros), х2 - Human Development Index, х3 - Population density persons/km2.
Finding these coefficients, the following equation is obtained:
y = -18.95+0.93x1-8.91x2+0.4x3
The calculated correlation coefficient is 0.9777, meaning a strong correlation exists between the independent and dependent variables. The coefficient of determination shows that the variation in the independent variables can explain 95.58% of the variation in the dependent variable. This is a high percentage and proves that the model is good at predicting municipal waste in Bulgaria. The regression model presented is statistically significant as Significance F is 0.00, less than α = 0.05.
Based on the results of the multiple regression analysis, we can draw the following conclusions about the influence of different factors on the municipal waste generated in Bulgaria:
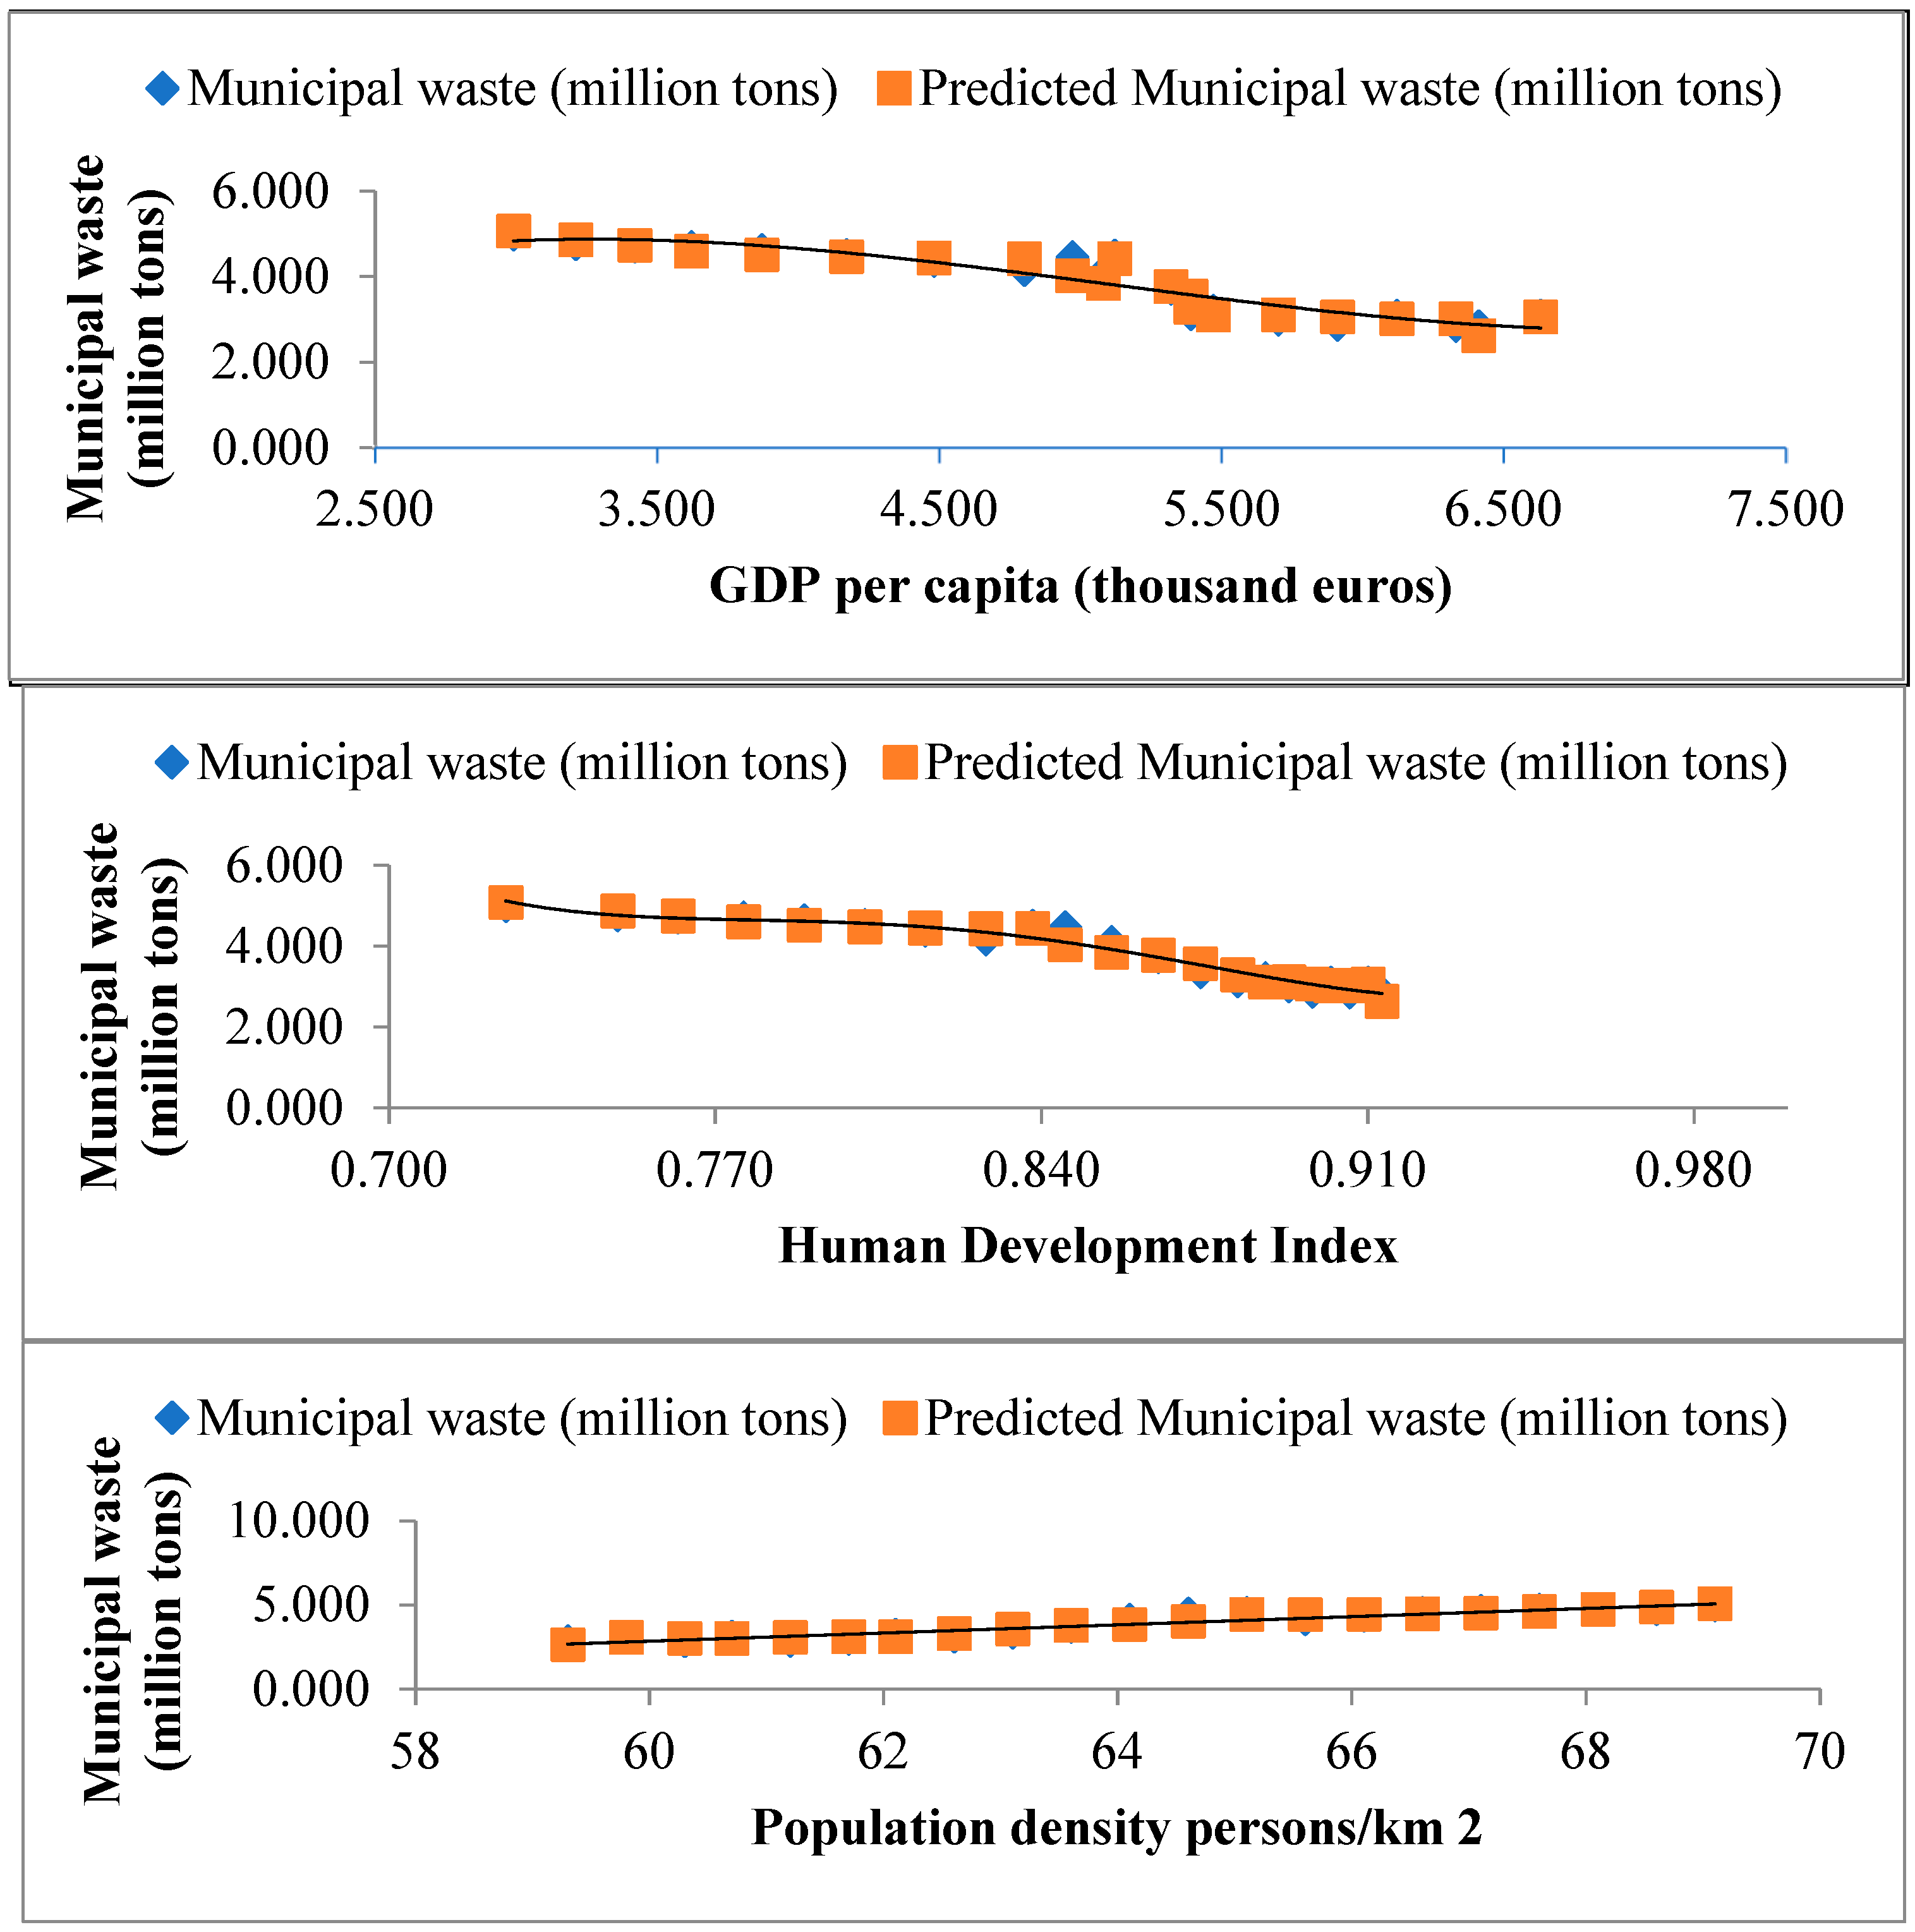
Influence of GDP per capita: The regression coefficient for GDP per capita is positive (0.925), indicating that a higher GDP per capita in the country leads to an increase in municipal waste. With every rise in GDP per capita by 1 thousand, municipal waste increases by 0.9252 million tonnes when other factors are constant. This result can be explained by the fact that higher living standards and economic growth encourage waste consumption and production.
Impact of HDI (Human Development Index): the regression coefficient for HDI is negative (-8.912). This indicates that higher levels of human development associated with better education, health and social services can contribute to more effective waste management and a reduction in municipal waste generated. Municipal waste is reduced by 8.91 million tonnes for every unit of HDI growth.
Impact of population density: the regression coefficient for population density is positive (0.401), indicating that a higher population density in a given area leads to increased municipal waste. When the population per square kilometre grows by a single person, municipal waste increases by 0.4012 million tonnes when other factors are constant. This can be explained by the higher concentration of people in a small area, which imposes a greater need for waste services and management.
Figure 7.
Correlation between municipal waste and GDP per capita, Human Development Index and population density over the period 2000-2020 found in a univariate regression analysis.
Figure 7.
Correlation between municipal waste and GDP per capita, Human Development Index and population density over the period 2000-2020 found in a univariate regression analysis.
In conclusion, the model illustrates the relationship between municipal waste and the independent variables used. However, it is still important to remember that the results may be influenced by other factors that are not included. The model’s predictive ability may be limited because it is based on data from 2000 to 2020, and new factors may emerge to influence the generated municipal waste. The model may need regular updating and revision of the coefficient values of the independent variables to be accurate and up-to-date for predictions in the future.
Based on the multivariable regression analysis results and the conclusions about municipal waste management in Bulgaria, we can propose specific measures for municipal waste management in the country. These measures are based on analysing the factors that influence the amount of municipal waste. A high GDP per person seems to increase municipal waste, which higher consumption and production can explain.
In this case, measures such as promoting sustainable consumption patterns, stimulating recycling and reducing unnecessary single-use items can help reduce municipal waste generated. Also, a high human development index (HDI) level is linked to more effective waste management. Investing in education, public services and health can facilitate more effective management and reduction of household waste. Population density also has an impact on the municipal waste generated. A larger population in a given area has a greater need for waste services and management. Here, separate waste collection and efficient waste storage and treatment systems can be encouraged. All these measures must be supported by cooperation between different sectors - government, business, public institutions and civil society.
4. Conclusions and recommendations
- A study of the relationship between economic growth and the waste generated in EU countries shows a progressive relationship. In the beginning, the progression is steep, but as incomes rise, it gradually decreases and flattens out, tending to reach its turning point. This tendency is observed when similar levels of waste generated grow two or more times higher.
- The comparative analysis demonstrates a relationship between average GDP per capita and average waste generated per capita in most countries analysed. Specifically, higher GDP is generally associated with higher amounts of waste, while lower GDP is associated with less waste generated. This relationship can be explained in several ways. Countries with a higher GDP per capita have more advanced and intensive economies, leading to a higher production and consumption volume. This results in increased waste generated by industry, households and services. On the other hand, richer countries are starting to invest more in environmental protection. In this way, they create a better-developed infrastructure for waste collection, treatment and management, leading to more efficient waste management and reducing its negative environmental impact. Countries with lower GDP per capita have limited resources and weaker waste management infrastructure. They encounter challenges such as a lack of waste collection and treatment, inefficient use of resources and environmental problems.
- Some countries have no significant correlation between income and waste. These are primarily high-income countries in the lower part of the EKC or countries in transition. As a representative case, Luxembourg shows an economic growth rate twice as high as countries with comparable levels of waste generation, with no correlation between these indicators being observed.
- The results of the correlation analysis suggest that, whilst GDP per capita and municipal waste per capita in most countries in the EU have a positive relationship, the strength and direction of this relationship differ between countries. Still, there are exceptions to this rule, with certain countries with low GDP per capita producing less waste and countries with high GDP per capita producing lower levels of waste, highlighting the importance of effective waste management and environmental protection policies.
- The cluster analysis shows regional differences in average GDP and average waste generated per person. Eastern European and Baltic countries have lower GDP per capita and higher waste generated per capita. Western European and Scandinavian countries have higher GDP and lower waste per person. Various economic factors and development levels explain those differences between the countries. Higher GDP in Western Europe and Scandinavia is linked with more advanced industrialisation, service development and higher living standards. At the same time, although Eastern European and Baltic countries have made economic progress, they still struggle with financial challenges and a lower level of development. Understanding these differences is essential for formulating policies and strategies for sustainable development and waste management. Regions with lower GDPs and higher waste can focus on improving economic infrastructure, energy efficiency and increasing recycling. In comparison, regions with higher GDPs can strive to achieve more sustainable economic models and waste management.
- The multivariable regression analysis focusing on Bulgaria shows that economic development and socio-demographic factors must be considered to achieve more sustainable and efficient municipal waste management in the country. It is essential to concentrate on the financial aspects of progress, including investment in waste infrastructure, promotion of recycling industries and innovation in sustainable resource management, not forgetting social and demographic factors, such as education and awareness of citizens.
The recommendations of this study can be divided into two groups:
1. Sustainable waste management policies development:
- Expanding the separate collection and recycling system: Policies should focus on promoting the separate collection and recycling of different types of waste, such as paper, plastics, metals and glass. This includes expanding the network of separate collection containers, providing education campaigns and educating citizens on proper separate collection;
- Banning or restricting specific waste: The government can introduce bans or restrictions on certain types of waste with particularly harmful impacts on the environment and human health. Examples include prohibitions on certain plastic products or restrictions on using hazardous chemicals and substances;
- Stimulating the processing and recycling industry: The government can provide financial incentives and support for developing a processing and recycling industry. Subsidies, tax breaks or funding for research and innovation in waste management could be a part of this policy;
- Promoting the product life cycle and circular economy: Policies should promote the principles of the circular economy, where products are designed and manufactured to maintain a high degree of recyclability and reusability. Manufacturers may be required to produce easily disassembled and recycled products, promoting products’ long life through repair and refurbishment and encouraging sharing and reuse of items;
- Raising awareness and education of citizens: Policies should include education campaigns and information programmes to raise citizens’ understanding of the importance of proper waste management and the opportunities for recycling and waste reduction. This can be achieved through media campaigns, educational programmes in schools and providing information through websites and social networks.
2. Exchange of best practices between regions:
- Organising workshops and seminars to share successful practices and experiences in waste management of different regions. Regions can draw from each other’s expertise and employ approaches that have been successful elsewhere;
- Establishing online forums or discussion platforms where representatives from different regions can discuss their challenges, successes and ideas on waste management. This will create an opportunity for an active exchange of ideas and suggestions between professionals in the field;
- Providing funding for pilot projects built on best practices in waste management. This will allow regions to test new and innovative approaches and share results and experiences with others;
- Organising technical cooperation between regions where waste management specialists and experts can provide advice and assistance to regions that need to improve their policies and practices.
Future research by the authors could explore the effectiveness of various policies and measures for waste management in different countries and how they impact the relationship between GDP and household waste. This could provide insights for improving and refining future policies and strategies for sustainable waste management.
Author Contributions
Conceptualization, N.B. and V.G.; methodology, D.D. and V.G.; software, D.D.; validation, D.D.; formal analysis, N.B. and V.G.; investigation, N.B., V.G. and D.D.; resources, D.D.; data curation, D.D.; writing—original draft preparation, V.G. and N.B.; writing—review and editing, V.G. and N.B.; visualisation, N.B.; supervision, V.G.; project administration, D.D.; funding acquisition, N.B. All authors have read and agreed to the published version of the manuscript.
Funding
This research is supported by Agricultural University, Bulgaria, Plovdiv
Institutional Review Board Statement
Not applicable.
Informed Consent Statement
Not applicable
Data Availability Statement
All data is available at the Eurostat database, https://ec.europa.eu/eurostat/data/database. Other data sources included in the investigation are referenced in the text.
Conflicts of Interest
The authors declare no conflict of interest.
References
- European Commission. Report from the Commission to the European Parliament, the Council, the European Economic and Social Committee and the Committee of the Regions identifying the Member States at risk of not meeting 2025 preparing for re-use and recycling target for municipal, 2023, https://eur-lex.europa.eu/legal-content/EN/TXT/?uri=COM%3A2023%3A304%3AFIN.
- Kuznets, S. Economic growth and income inequality. The American Economic Review 1955, 1-28, https://assets.aeaweb.org/asset-server/files/9438.pdf. /: https.
- Beckerman, W. Economic growth and the environment: whose growth? Whose environment? World Development 1992, 20, 481–496. [Google Scholar] [CrossRef]
- Galeotti, M.; Lanza, A. Richer and cleaner? A study on carbon dioxide emissions in developing countries. Energy Policy 1999, 27, 565–573. [Google Scholar] [CrossRef]
- Yang, L.; Yuan, S.; Sun, Le. The Relationships between Economic Growth and Environmental Pollution Based on Time Series Data: An Empirical Study of Zhejiang Province. Journal of Cambridge Studies 2012, 7, 33–42. [Google Scholar] [CrossRef]
- Alajmi, R. The Relationship between Economic Growth and Municipal Solid Waste & Testing the EKC Hypothesis: Analysis for Saudi Arabia. Journal of International Business Research and Marketing 2016, (5), 20–25. [Google Scholar] [CrossRef]
- Cialani, C. Economic growth and environmental quality: An econometric and decomposition analysis. Management of Environmental Quality: An International Journal 2007, 18(5), 568–577. [Google Scholar] [CrossRef]
- Galeotti, M.; Lanza, A.; Pauli, F. Reassessing the environmental Kuznets curve for CO2 emissions: A robustness exercise. Ecological Economics 2006, 57, 152–163. [Google Scholar] [CrossRef]
- Arrow, K.; Bolin, B.; Costanza, R.; Dasgupta, P.; Folke, C.; Holling, C.; Janson, B.; Levin, S.; Maler, K.; Perrings, C.; Pimentel, D. Economic growth, carrying capacity, and the environment. Ecological economics 1992, 15, 91–95. [Google Scholar] [CrossRef]
- Shafik, N.; Bandyopathyay, S. Economic Growth and Environmental Quality: Time Series and Cross-Country Evidence. World Bank Policy Research Working Paper WPS904, Washington DC, 1992, https://documents1.worldbank.org/curated/en/833431468739515725/pdf/multi-page.pdf.
- Gangadharan, L.; Valenzuela, R. Interrelationships between income, health and the environment: extending the Environmental Kuznets Curve hypothesis. Ecological economics 2001, 36, 513–531. [Google Scholar] [CrossRef]
- Dinda, S. Environmental Kuznec Curve Hypothesis: A Survey. Ecological economics 2004, 49, 431–455. [Google Scholar] [CrossRef]
- Panayotou, T. Empirical Test and Policy Analysis of Environmental Degradation at Different Stages of Economic Development. 1993, ILO, Technology and Employment Programme, WP238, http://www.ilo.org/public/libdoc/ilo/1993/93B09_31_engl.pdf.
- Grossman, G.; Krueger, A. Environmental Impact of a North American Free Trade Agreement. National Bureau of Economic Research 1991, Working Paper 3914. [CrossRef]
- Selden, T.; Song, D. Environmental Quality and Development: Is There a Kuznec Curve for Air pollution emission. Journal of environmental economics and Management 1994, 27, 147–162. [Google Scholar] [CrossRef]
- Cole, M.; Rayner, A.; Bates, J. The environmental Kuznets curve: an empirical analysis. Environment and Development Economics 1997, 2, 401–416. [Google Scholar] [CrossRef]
- Holtz-Eakin, D.; Selden, T. Stoking the fires? CO2 emissions and economic growth. Journal of Public Economics 1995, 57, 85–101. [Google Scholar] [CrossRef]
- Panayotou, T. Economic Growth and the Environment. Economic Survey of Europe 2003, 2, 45–67. [Google Scholar]
- Grossman, G.; Krueger. A. Economic growth and the environment. The Quarterly Journal of Economics 1995, 110(2), 353–377. [Google Scholar] [CrossRef]
- Kinnaman, Т. Examining the justification for residential recycling. Journal of Economic Perspectives 2006, 20(4), 219–232. [Google Scholar] [CrossRef]
- Razzaq, А.; Sharif, А.; Najmi, А.; Tseng, M.; Lim, М. Dynamic and causality interrelationships from municipal solid waste recycling to economic growth, carbon emissions and energy efficiency using a novel bootstrapping autoregressive distributed lag. Resources, Conservation and Recycling 2021, 166. [Google Scholar] [CrossRef]
- Wagner, M.; Weber, J. The carbon Kuznets curve: A cloudy picture emitted by bad econometrics? Resource and Energy Economics 2011, 33(4), 878–897. [Google Scholar] [CrossRef]
- Inglezakis, V.; Zorpas, A.; Venetis, C.; Loizidou, M.; Moustakas, K.; Ardeleanu, N.; Ilieva, L.; Dvorsak, S. Municipal Solid Waste Generation and Economic Growth Analysis for the years 2000-2013 in Romania, Bulgaria, Slovenia and Greece 2021, Fresenius Environmental Bulletin, 21(8), 2362-2367, Available online: https://www.researchgate.net/profile/Vassilis-Inglezakis/publication/261365729_Municipal_Solid_Waste_Generation_and_Economic_Growth_Analysis_for_the_years_2000-2013_in_Romania_Bulgaria_Slovenia_and_Greece/links/59b4f1d4458515a5b493388f/Municipal-Solid-Waste-Generation-and-Economic-Growth-Analysis-for-the-years-2000-2013-in-Romania-Bulgaria-Slovenia-and-Greece.pdf (accessed on 25.07.2023).
- Okumura, S.; Tasaki, T.; Moriguchi, Y. Economic growth and trends of municipal waste treatment options in Asian countries. Journal of Material Cycles and Waste Management 2014, 16, 335–346. [Google Scholar] [CrossRef]
- Shah, W.U.H.; Yasmeen, R.; Sarfraz, M.; Ivascu, L. The Repercussions of Economic Growth, Industrialization, Foreign Direct Investment, and Technology on Municipal Solid Waste: Evidence from OECD Economies. Sustainability 2023, 15, 836. [Google Scholar] [CrossRef]
- Sood, A.; Sahni, K.; Gupta, P.; Sethi, R. Understanding the Relationship between GDP and Mismanaged Waste. International Journal of Innovative Research in Science, Engineering and Technology 2022, 11, 3422–3425. [Google Scholar]
- OECD, Waste: Municipal waste, OECD Environment Statistics (database). [CrossRef]
- Kaza, S.; Yao, L.; Bhada-Tata, P.; Van Woerden, F. What a Waste 2.0: A Global Snapshot of Solid Waste Management to 2050. 2018, Urban Development, DC: World Bank, https://openknowledge.worldbank.org/entities/publication/d3f9d45e-115f-559b-b14f-28552410e90a/full.
- UNEP. United Nations Environment Programme. Global Environment Outlook - GEO-6: Summary for Policy Makers. Nairobi: UNEP, 2019, https://www.unep.org/resources/assessment/global-environment-outlook-6-summary-policymakers. /.
- Gogtay, N.; Thatte, U. Principles of Correlation Analysis. Journal of The Association of Physicians of India 2017, 65, 78–81, https://www.kem.edu/wp-content/uploads/2012/06/9-Principles_of_correlation-1.pdf. [Google Scholar] [PubMed]
- Ratner, B. The correlation coefficient: Its values range between +1/−1, or do they? Journal of Targeting, Measurement and Analysis for Marketing 2009, 17, 139–142. [Google Scholar] [CrossRef]
- Řezanková, H. Cluster analysis of economic data. Statistika 2014, 94(1), 73–86, https://www.czso.cz/documents/10180/25609555/32019714q1073.pdf/15471f8e-d003-4ebe-9d46-41f934ebd45a?version=1.0. [Google Scholar]
- Bajada Beckerman, B. Quality of life indicators in selected European countries: Statistical hierarchical cluster analysis approach. Croatian Review of Economic, Business and Social Statistics 2015, 1(1-2), 42–54. [Google Scholar] [CrossRef]
- Uyanık, G.; Güler, N. A study on multiple linear regression analysis. Procedia - Social and Behavioral Sciences 2013, 106, 234–240. [Google Scholar] [CrossRef]
- Stockemer, D. Quantitative Methods for the Social Sciences, 1st ed.; Publisher: Springer, Canada, 2019. [Google Scholar] [CrossRef]
- United Nations Development Programme. Human Development Report 2021-22: Uncertain Times, Unsettled Lives: Shaping our Future in a Transforming World 2022, New York, https://reliefweb.int/report/world/human-development-report-20212022-uncertain-times-unsettled-lives-shaping-our-future-transforming-world-enruzh?gclid=Cj0KCQjwiIOmBhDjARIsAP6YhSUx_uaiyHihCmIJFdzK-qZcsT_9oYEddqmyWSB1y8t6yRWkgPnTj_AaAi3cEALw_wcB.
- World Bank. Population density (people per sq. km of land area) - Bulgaria. 2023, https://data.worldbank.org/indicator/EN.POP.DNST?locations=BG.
- Conrad, Е.; Cassar, L. Decoupling Economic Growth and Environmental Degradation: Reviewing Progress to Date in the Small Island State of Malta. Sustainability 2014, 6(10), 6729–6750. [Google Scholar] [CrossRef]
- Eurostat, https://ec.europa.eu/eurostat/web/waste/data/database.
- Angelis-Dimakis, A.; Arampatzis, G.; Alexopoulos, A.; Pantazopoulos, A.; Vyrides, I.; Chourdakis, N.; Angelis, V. Waste Management and the Circular Economy in Cyprus—The Case of the SWAN Project. Environments 2022, 9, 16. [Google Scholar] [CrossRef]
- Nilsson, L. Energy intensity trends in 31 industrial and developing countries: 1950 – 1988. Energy 1993, 18, 309–322. [Google Scholar] [CrossRef]
- Vukina, T.; Beghin, J.; Solakoglu, E. Transition to markets and the environment: Effects of the change in the composition of manufacturing outputs. Environment and Development Economics 1999, 4, 582–598. [Google Scholar] [CrossRef]
- Guziana, B.; Song, H.; Thorin, E.; Dotzauer, E.; Yan, J. Policy Based Scenarios for Waste-to-Energy Use: Swedish Perspective. Waste Biomass Valor 2014, 5, 679–688. [Google Scholar] [CrossRef]
- Salmenperä, H. Different pathways to a recycling society – Comparison of the transitions in Austria, Sweden and Finland. Journal of Cleaner Production 2021, 292, 125986. [Google Scholar] [CrossRef]
- Voronova, V.; Piirimäe, K.; Virve, M. Assessment of the applicability of the Pay As You Throw system into current waste management in Estonia. Management of Environmental Quality 2013, 24(5), 667–681. [Google Scholar] [CrossRef]
- Maddison, A. A Comparison of Levels of GDP Per Capita in Developed and Developing Countries, 1700–1980. The Journal of Economic History 1983, 43(1), 27–41. [Google Scholar] [CrossRef]
- Jagun, Z.; Daud, D.; Ajayi, O.; Samsudin, S.; Jubril, A.; Rahman, M. Waste management practices in developing countries: a socio-economic perspective. Environ Sci Pollut Res Int. 2022. [Google Scholar] [CrossRef] [PubMed]
- Cotta, B. What goes around, comes around? Access and allocation problems in Global North–South waste trade. Int Environ Agreements 2020, 20, 255–269. [Google Scholar] [CrossRef]
- Ozturk, S.; Suluk, S. The granger causality relationship between human development and economic growth: The case of Norway. International Journal of Research in Business and Social Science 2020, 9(6), 143–153. [Google Scholar] [CrossRef]
- Pandey, M.; Nathwani, J.; Lind, N. The derivation and calibration of the life-quality index (LQI) from economic principles. Structural Safety 2006, 28, 341–360. [Google Scholar] [CrossRef]
- Ogwueleka, T. Municipal solid waste characteristics and management in Nigeria. Iranian Journal of Environmental Health Science & Engineering https://www.researchgate.net/publication/40542918_Municipal_solid_waste_characteristics_and_management_in_Nigeria. 2009, 6(3), 173–180. [Google Scholar]
- Hoornweg, D.; Bhada-Tata, P.; Kennedy, C. Environment: Waste production must peak this century. Nature 2013, 502(7473), 615–617. [Google Scholar] [CrossRef]
- Ravallion, М. Troubling tradeoffs in the Human Development Index. Journal of Development Economics 2012, 99(2), 201–209. [Google Scholar] [CrossRef]
- Lind, N. A Development of the Human Development Index. Social Indicator Research 2019, 46, 409–423. [Google Scholar] [CrossRef]
- McDougall, F.; White, P.; Franke, M. Integrated solid waste management: a life cycle inventory. Blackwell Science, 2001, https://www.eng.hokudai.ac.jp/labo/waste/english/wp-content/uploads/2014/03/integrated-solid-waste-managemen-a-life-cycle-inventory.pdf, Accessed on 28/07/2023.
- Wilson, D.; Velis, C. Waste management – still a global challenge in the 21st century: An evidence-based call for action. Waste Management & Research 2015, 33(12), 1049–105. [Google Scholar] [CrossRef]
- Kawai, K.; Tasaki, T. Revisiting estimates of municipal solid waste generation per capita and their reliability. Journal of Material Cycles and Waste Management 2016, 18, 1–13. [Google Scholar] [CrossRef]
- Schuyler, Q.; Wilcox, C.; Lawson, T.; Ranatunga, R.; Hu, C. Human Population Density is a Poor Predictor of Debris in the Environment. Front. Environ. 2021, 9. [Google Scholar] [CrossRef]
Disclaimer/Publisher’s Note: The statements, opinions and data contained in all publications are solely those of the individual author(s) and contributor(s) and not of MDPI and/or the editor(s). MDPI and/or the editor(s) disclaim responsibility for any injury to people or property resulting from any ideas, methods, instructions or products referred to in the content. |
© 2023 by the authors. Licensee MDPI, Basel, Switzerland. This article is an open access article distributed under the terms and conditions of the Creative Commons Attribution (CC BY) license (http://creativecommons.org/licenses/by/4.0/).
Copyright: This open access article is published under a Creative Commons CC BY 4.0 license, which permit the free download, distribution, and reuse, provided that the author and preprint are cited in any reuse.


