Submitted:
03 August 2023
Posted:
04 August 2023
You are already at the latest version
Abstract
The sustainable development of mines has been the focus of attention in recent years, in China, there are a large number of untreated mined-out areas, and a series of disasters caused by instability of the goaf will bring heavy blows to people’s safety and financial resources. Mined-out areas management is an important part that cannot be ignored in mine sustainable development, and filling management is one of the most effective ways to solve the hidden danger of mined-out areas. Among them, cemented filling with tailings and the ultra-high-water backfilling are commonly used in mining enterprises. However, filling treatment will lead to increasing cost and the decreasing profits, which seriously depresses the motivation of mining enterprises and even leads to mor-al hazard. Therefore, the analysis of the economic benefits of goaf control plays a vital role in the sustainable construction and long-term development of mines. This paper proposed the mine-out area treatment economic model, the proposed method employs the guiding philosophy of news-boy model to create a mathematical economy model that provides the basis of goaf management mode for mine. The following research results are achieved: (1) The economic model of mined-out area backfilling treatment is constructed, and which is classified three different modes. (2) Com-bined with mathematical derivation and simulation, the influence of relevant variable parameters on each type of filling mode is discussed. (3) Various types of goaf filling treatment mode are com-pared with non-filling scheme (benchmark mode), so as to provide theoretical support for mining enterprises to choose the appropriate filling scheme. The results shows that the economic model of mined-out area management provides the optimal mode for mined-out area filling, the balance of tailings and ultra-high water filling materials procurement is realized, to making maximum profits. In this paper, the use of economic thinking has an important impact on the sustainable development of safety goaf management. To evaluate the sustainable development of goaf management by building economic models. It has important theoretical basis and practical guiding significance for the development and exploration of mined-out area management by combining economy with sustainable development.
Keywords:
mine sustainable development
; economic model
; mined-out area backfilling
; profits maximization
1. Introduction
Rural Non-Farm Enterprise (RNFE) evolves overtime as households try to adjust their income portfolio to changing opportunities, to their capacities and challenges, including their experience to shocks. In many of the poor agrarian economies such as much of Africa, RNFE is a potential alternative to agriculture for stimulating rural income growth. Evidences suggest that over time the contribution of the rural non-farm sector to employment and income has increased [1]. This contribution is unlikely to diminish in the future in countries like Ethiopia given that rural businesses will be needed to support the job creation and hence livelihood to the growing number of youths who do not have access to farming land. However, the contributions of RNFE and implications for development not only depend on entry into off-farm employment but also on the ability to remain employed [2]. In this regard, an understanding of the dynamics of non-farm enterprise and participation of the youth is imperative for any policy-maker who seeks to create employment opportunity for the youth and improve household’s income from non-farm sector.
While employment in RNFEs has received extensive attention in the existing literature, there are some important limitations. Most of the literature on RNFE has focused on determinants of drivers of diversification (see for example, [3,4]). Moreover, the available evidence mainly relies on cross-sectional data. Such data cannot be used to investigate dynamics over time. In recent years, with availability of panel data, there are some studies that investigate dynamics in RNFE [2,5]. For example, using the Ethiopian Rural Household Survey (ERHS) data, [2] categorized RNFE into high-return and low-return RNFEs, and analysed dynamics with a focus on employment transitions involving high-return RNFE. They found that capital accumulation increases in adult labour in a household and access to credit and saving options positively drive the transition to high-return RNFE. [6] studied factors associated with changes in household RNFE income diversification over time in rural Ethiopia. They found that household risk perceptions guide subsequent RNFE diversification and that greater initial income diversification was associated with higher subsequent consumption levels. [5] analysed dynamics of off-farm employment in Sub-Saharan Africa using national panel survey data from Ethiopia, Malawi, Nigeria, Tanzania and Uganda. They found that drivers of entry into employment and continued employment are country-specific, with initial asset holdings, occurrence of shocks, and social factors as most important determinants.
Using panel data from the Ethiopian Socioeconomic Survey, this paper analyzes factors that determine entry and stay in non-farm enterprises as well as movement between different activities within the non-farm sector. It has three major contributions. First, we analysed the drivers to entry into and continued participation in RNFE as well as movement between different activities within the non-farm sector. This allows us to understand why people enter or exit RNFE and how people move from one form of non-farm enterprise into another. Secondly, the analysis takes age differences of RNFE owners into account to determine if the youth perform differently in the movement within RNFE. Third, methodologically we use a panel double hurdle model, which controls for unobserved effects and allows for an unbiased estimation of the relationship between non-farm enterprise diversification and the independent variables.
We found that age of household heads is a significant factor both for entry and stay in RNFE. The proportion of households who stay in RNFE is higher among the youth than among matured households. Though entry is similar for both groups, dropout rates are higher among youth households. In terms of the movements from one form of employment into another within the non-farm enterprises, we found that agricultural shocks negatively affect the movement towards high-return RNFE for both the youth and matured households. However, initial endowments mainly proportion of households with primary education and above, and access to finance in the form of credit are particularly important for the youth to move towards high-return RNFEs.
The rest of the paper is organized as follows. In section 2 we review the literature on dynamics of RNFE. Section 3 describes the LSMS-ISA data set and the methodology used for data analysis. Section 4 reports our empirical findings both descriptive and econometric results on dynamics of RNFE. The final section concludes.
2. Literature Review
Despite the traditional believe that views rural off-farm sector as a low-productivity sector, recent years have witnessed a shift away from this position towards recognition of its roles [7]. Compared to agriculture, rural non-farm sector is growing rapidly in many developing countries, therefore, it can play a key role to alleviate rural poverty and unemployment. Today the literature suggests that between 40 to 50 percent of household income in rural Africa originates from rural non-farm entrepreneurship [1,7,8,9,10].
Despite rapid economic growth over the last few decades, Ethiopia’s economy still relies heavily on agriculture. However, dependence on agriculture, particularly in crop production, is increasingly unsustainable due to first, cropland is limited; landholding size is declining across farmers of all age groups, particularly youth farmers [11]. Second, the rural population is quickly growing; growth in the working age population (15-64 years old) is faster relative to growth in available cultivated land. This trend will likely continue, leading to 24% more residents and 44% more working age people in rural areas by 2037, relative to 2017 figures [11]. Third, Ethiopia’s youth, which account for roughly 70% of the overall population and predominantly reside in rural areas, are becoming increasingly educated and looking to opportunities outside of agriculture [11].
Previous studies on RNFE in Ethiopia have focused on the determinants and patterns of diversification [12,13] and on the role that RNFEs play in mitigating risk and smoothing consumption. Some studies found RNFEs activities to be seasonal but countercyclical with agriculture [14], and welfare improving [2], other studies found RNFEs in rural Ethiopia to be less effective to smooth consumption [15].
While these and other studies have documented the importance of non-farm enterprises in Ethiopia, most tend to disregard the heterogeneity of the non-farm sector. All non-farm activities are aggregated into a uniform group of tasks without regard for the type of employment, level of skill and degree of investment required [16]. Moreover, most studies look at household-level participation in RNFE without considering differences in gender and age. As the youth are assumed to be disproportionally disadvantaged in both quantity and quality of RNFE participation, age disaggregated data is a must to study the inclusiveness of RNFE indicating advances still need to be made related to the understanding of the dynamics of the sector and participation of the youth.
Our study aligns with two strands of the literature. The first strand focuses on factors that determine entry and stay in non-farm enterprises, and more specifically on various factors that affect households’ participation on RNFEs. [1,5] explore how the World Bank’s Living Standards Measurement Study – Integrated Surveys on agriculture (LSMS-ISA) data for Ethiopia, Malawi, Nigeria, Tanzania and Uganda could be used to determine households’ entry and stay in non-farm enterprises. They found that the drivers of entering off-farm employment are country and gender specific, and include household characteristics, individual characteristics of the head, the experience of shock, access to credit and markets. For analysis of determinants of entry and stay in non-farm enterprises in Ethiopia, our study also uses the LSMS-ISA data, but we use a panel data to analyse determinants of entry and stay.
The second strand of the literature our study ties into concerns the factors explaining the dynamics of non-farm enterprise participation, which refers to entry and exit from the non-farm enterprise as well as movement between different activities within the non-farm sector. Households participate in RNFE either out of necessity (push factors) or opportunity (pull factors) [17]. Both push and pull factors influence households to own non-farm enterprises. On the one hand, due to lack of insurance and social security, households use non-farm income as a response to idiosyncratic shocks and to manage risks. On the other hand, non-farm enterprises are used as an opportunity to grow income and generate wealth. The two categories (entry out of necessity and entry out of opportunity) are different both in terms of return and barriers to enter. While the former is expected to be a low return and low entry barrier type, the later is relatively high return and high entry barrier. [2] analysed rural households’ engagement in non-farm employment by categorizing RNFE into low return and high return RNFEs. They assessed whether poor household are able to access the high-return employment overtime through accumulation of capital. They found that low return RNFE participants who accumulated capital were subsequently more able to access high-return RNFE.
Following the two strands in the literature, we analysed both determinants of entry and stay, and movements in engagements in RNFE overtime. Using panel hurdle model, the study analysed determinants of participation in RNFE and level of participation. The panel data enables us to observe households’ engagement in RNFE over time. In an effort to analyse dynamics in engagements in RNFEs, i.e., movements from one form of RNFE into another, we followed [2] and categorized RNFEs into low-return and high-return. We examined the profile of these RNFEs and take advantage of the panel nature of the data to extend our analysis to mobility between business enterprise statues and the factors explaining the transition to a higher work status. Given the contraction of per capita arable land and the increasing number of better educated youth in rural areas in Ethiopia [11], policies that facilitate the emergence and expansion of non-agricultural rural jobs are indispensable to absorb the rapidly growing working-age population. Thus, we conduct the analysis through the youth lens, asking whether it is the young that enters into these enterprises and whether the youth is a driving force for the transition from low return to high return RNFE.
3. Data source and Methodology
3.1. Data source
We use the national, longitudinal and multi-topic household survey data for Ethiopia generated as part of the World Bank Living Standards Measurement Study (LSMS-ISA)1 initiative. Data is collected in four survey rounds for Ethiopia (2011, 2013, 2015 and 2018). However, the ESS panel was refreshed in the fourth wave and data for 2018 is not comparable with data for the previous three waves. Thus, to take advantage of the panel information, the first three waves are used in this report. The survey consists of three parts: a community questionnaire, an agricultural questionnaire and a household questionnaire. Our unit of analysis is the household and the emphasis is on households’ engagement in non-farm enterprises. We use panel data with a focus on dynamics of rural non-farm enterprises. Hence data collected for households from medium and large towns starting the second wave are dropped.
3.2. Estimation Methods
We employ two estimates in the RNFE analysis. First, we estimate households’ participation in RNFE and its determinants, where we explore the choice of households whether to engage in RNFEs and on what types of RNFEs and the extent of participation in RNFE expressed in terms of income from non-farm enterprise. Second, we estimate dynamics of RNFEs where we analyse mobility between business enterprise status and the factors explaining transition to a higher work status. In this case, the analysis is further disaggregated by age of participants in order to examine if the youth have a different choice, and if the factors that determine upward movement in the business ladder are different for the youth and matured households.
3.2.1. Choice of Household’s participation in RNFEs
To analyse participation of households in RNFEs, we used panel double hurdle model. The panel-hurdle model was developed by [18], who applied the model to household milk consumption. The panel-hurdle model with independent error terms considers the participation decision (in our case, participation in non-farm enterprise), and the level of participation (i.e. non-farm enterprise income) as a linear function of first-hurdle regressors and the second regressors , defined as follows:
First hurdle:
Second hurdle:
and are error terms in the first and second hurdle respectively, and is subject-specific random-effect term that allows between-subject heterogeneity and thereby within-subject dependence.
Observed
3.2.2. Dynamics in RNFEs
To examine dynamics of the RNFEs, households are assumed to choose the activity – pure agriculture, low-return or high-return RNFE. Following [2], RNFEs are classified into high or low return enterprises based on investment and return. It is expected that the high investment business will have high return and this is classified as High Return Rural Non-Farm Enterprises (HRRNFE). This includes cattle and cereal trading, transportation, restaurant and hotel business etc. The low investment businesses include activities such as homemade food and beverage production, petty trade etc. Activities in this sector require less investment and the returns are equally expected to be smaller. Table 2 indicates distribution of sample households by activity type in each wave.
A household’s transition from each of the initial status of employment into a different can thus be reflected in three scenarios – first, a household initially in agriculture will either remain in agriculture or transit to low return RNFE or high return RNFE. The same procedure follows if a household was initially in low return RNFE or high return RNFE. To examine the household’s transition from each of the three initial states of engagement, we estimate multinomial logit models based on the familiar random utility model [20]. We estimate three multinomial logit models, one for each initial engagement status: pure agriculture (no RNFE), low-return RNFE and high-return RNFE. Our focus, however, is mainly on the transition towards high return RNFE, the subsector offering most households the greatest prospect for upward mobility [3,4,21]. We use different covariates to assess the transition. We include human and physical capital, shocks the households experienced over the survey years, household characteristics such as age and gender of household head, access variables such as distance to market and population centers, access to credit, access to government transfer. To see if the youth perform differently in the upward movement in the business ladder, we analyse the dynamics of firms separately for the youth and matured owners. The youth in this case refers to young adults aged 15 to 34 years inclusive.3
4. Results and discussion
4.1. Descriptive results
Dynamics in RNFE participation: Figure 1 shows the dynamics in RNFE participation in rural Ethiopia. The figure indicates the rates of people who entered and exited RNFE and who were never or always employed in RNFE over the survey period from 2011 to 2015. We observe that a large proportion of the households, at least 60% never employed in RNFE in Ethiopia. This is a large figure indicating that RNFE is not yet developed in rural Ethiopia. However, the figure is different among the youth and matured households. While 67 percent of the matured households never participated in RNFE, the figure for the youth households is 47 percent. This indicates that the older households get, the more risk averse they become. Moreover, it could also mean that the youth are more educated and entrepreneurial than the old and this makes them to diversify to non-farm business activities, which enables them to make more money in non-farm businesses compared to agricultural businesses. With the high population growth in Ethiopia especially the growth rate on the youth, it is possible that the youth may not have access to land as the old households and this may push them towards diversifying to non-farm activities.
The share of people who are continuously in RNFE is higher among the youth than the old. Close to one third of the youth households continuously participate in RNFE compared to only one-fifth for the matured households. Though, entry rates are the same between the youth and matured households, exit is higher among the youth than the matured households, indicating more dynamics among the youth than among the matured households.
Transition into and out of high-return RNFE: Table 3 reports proportion of households who transited from low-return and pure agriculture into and out of high return RNFE in 2013 or 2015. Both transition into and out of high-return RNFE is higher among the youth households than among matured households. Out of the youth households engaged in pure agriculture or low-return RNFE in 2011, 12.6 percent transited into high-return RNFE in 2013 or 2015. Similarly, 7.2 percent transited out of high-return RNFE in 2013 or 2015. The figures for matured households are 9.7 percent and 4.2 percent respectively, indicating that dynamics in movement into and out of high-return RNFE is higher among the youth.
Initial capital endowments and transition into and out of high-return RNFEs:Table 4 indicates initial capital endowments and transition into high-return RNFE. It indicates that initial capital endowments are correlated with the transition into high-return RNFE. Households who moved into high-return RNFE have on average lower land and livestock holdings, and large number of adults and better education level. However, not all mean differences among those who stayed or moved are statistically significant. For youth households, large number of adult household members and high proportion of household members with elementary education are statistically significant whereas for matured households, land and livestock holding are statistically significant.
Licensing and Seasonality of RNFE: Table 5 indicates seasonality in operation of RNFE, average number of months per year and average number of days per month worked and proportion of enterprises with a license over the period 2011 through 2015. The result is separately reported for the youth and matured business owners.
Seasonality in operation of RNFE seems to be high especially in the initial survey period – 2011. More than 46 percent of the RNFEs operate seasonally working on average for less than 8 months in a year and almost for half of the days in a month in 2011. However, both the seasonality and average number of months and average number of days worked show improvement over time. In 2015, only 28 percent of the enterprises reported that their operation is seasonal. As expected, most of the RNFE operate without a license. Only less than 14 percent of the enterprises had a license in 2011. Since most RNFE are small, they are not expected to have a license for their operation. However, the proportion of enterprises with a license has increased overtime reaching to almost 19% in 2015.
Considering this separately for the youth and matured business owners, there are not much differences between the two. Though, the matured business owners seem to have less seasonality and work on average more months in a year and days in a month, the difference is not statistically significant except for average number of months in operation for 2011 and 2013. This indicates that in terms of operation of business enterprises, there is not much difference between the youth and matured business owners.
4.2. Econometric Results
4.2.1. Empirical Model of RNFE Income
In this empirical application, we follow a panel of rural households over a period of five years from 2011 through 2015. Table 6 summarizes the results from the estimation of panel double hurdle model. The outcome in the first hurdle applies to the households in all periods, i.e., if a household is a participant in the first wave, it continues to be a participant throughout the panel period. However, the level of participation indicated by amount of business income generated can vary over the panel period.
The results in Table 6 revealed that several factors determine rural household’s ownership of non-farm enterprises and size of income generated from these enterprises. The first set of results for RNFE participants show that age and female-headed households are important factors in the decision to participate and level of participation. The age of the household head has a negative impact on the decision to participate in rural non-farm enterprises and amount of income generated from these enterprises. There are several explanations for this. One explanation supported by empirical evidence is related to risk aversion. Risk aversion is high at older age. [12,22] state that farmers tend to focus solely on agricultural activities for subsistence as opposed to diversifying their livelihoods as they get older. Another factor is related to the imbalance between population growth and cultivable land. The rural population is quickly growing; growth in the working age population (15-64 years old) is faster relative to growth in available cultivated land4. Thus, there is an increasing youth population who have less or no farm land in the rural areas of Ethiopia. Moreover, Ethiopia’s youth which account for roughly 70% of the overall population [11], and predominantly reside in rural areas are becoming increasingly educated and looking for opportunities outside of agriculture [11].
Female headed household is positively correlated with a household’s choice to participate in RNFE but is negatively correlated with the level of participation expressed by amount of income earned from RNFE. The positive correlation indicates that female headed households participate in RNFE more than their male headed counterparts. This finding is in line with the findings by [5] who reported that women’s rural non-farm entrepreneurship is common in Ethiopia and Nigeria. This could be due to the fact that female headed households are often labour constrained to operate agriculture, as farming in the current framework in rural Ethiopia, particularly ploughing using oxen, requires more of man’s labour. This limits participation of female headed households in agriculture unless they have adult male household members. Thus, female headed households often look for other means to support their livelihood. This brings RNFE into the picture. Often women engage in low capital intensive but low paying RNFEs. This is clearly seen by the negative correlation between female headed household and level of participation explained by amount of income earned from RNFE. Even if female headed households often attempt to diversify income sources to non-farm enterprises, this diversification often comes due to push factors. This usually confines their participation in low paying rural non-farm enterprises that require less capital as well as skills.
Initial capital endowments which include assets, human capital, land and livestock are more important/significant for level of participation expressed in terms of income from RNFE. Number of adult household members in the form of human capital and number of rooms as an indication of wealth have a positive implication for business income generated from RNFE. On the other hand, education mainly at primary level is significant for households’ decision to enter into RNFE. The higher is the proportion of household members with elementary education, the larger the possibility to diversify to RNFE. However, higher proportion of household members with primary complete, i.e., above primary level of education, neither affects the decision to diversify nor the intensity of diversification. This could be due to the fact that rural enterprises do not require sophisticated skills. It could also mean that the relatively educated persons in rural areas prefer to look for relatively high paying jobs rather than working in small businesses in the rural areas.
Shocks that rural households experience, although they enter with negative signs, most are not significant. However, agricultural input price shock negatively affects decision to diversify to non-farm enterprise.
Distance variables mainly distance to market, distance to road and distance to population center, do not affect the decision to diversify but distance to road positively affects level of participation. This could be due to the fact that remote areas far from the main road are often inaccessible and business activities in these areas could attract higher prices due to low level of competition.
Among weather related variables, temperature is negatively and statistically significantly correlated with participation in RNFE but the relationship with level of participation expressed by income earned from RNFE is positive and statistically significant. This could be due to the fact that a high temperature reduces agricultural productivity and this reduces rural households’ ability to accumulate capital to enter into RNFE. But once households enter into RNFE, the low agricultural productivity due to temperature shock enhances their determination to stay and work more on RNFE and hence a positive impact on intensity of participation.
Finally, location in the form of rural vs small towns reveals that rural areas are less attractive to ownership of business enterprises both for diversification and intensity of income generated from business enterprises.
In general, diversification into and level of participation in RNFE is highly related to age of the household heads and some capital endowments indicating the fact that RNFE can be an important source of livelihood diversification for the youth which is growing alarmingly in the rural areas. Moreover, the fact that initial capital endowments are important for level of participation rather than for entry into RNFE indicates that entry into RNFE is easy, i.e, the poor can enter into the sector, but extent of participation often is constrained by capital endowments.
4.2.2. Empirical models of dynamics of RNFE
Dynamics of RNFE is reflected by the transition from an initial state of employment, employment status in 2011, into a different employment status in 2015. This is further analysed for the youth - household heads aged between 15 and 34, and matured households – household heads aged between 35 and 64 years. To examine the transition, we estimated multinomial logit models. Households are assumed to choose the activity – pure agriculture, low-return or high-return RNFE – that maximises expected utility associated with participation, given initial human and physical capital, shocks the households experienced between 2011 and 2015, access variables mainly expressed in terms of access to market, access to credit, distance to population center, distance to road, controlling for household and individual characteristics such as age and gender of household head and location of households, i.e. whether households are located in rural areas or small towns.
We are interested in the transition towards high return RNFE, for transition towards this group is believed to be welfare improving. In this way, we estimated two multinomial logit models one each for the transition from pure agriculture to low return and high return RNFE and another from low return RNFE to pure agriculture and high return RNFE. Each, however, is further disaggregated by age group of household heads – one for the youth aged 15 to 34 and another for matured households aged 35 to 64 years. Thus, a total of six multinomial logit models are estimated.
Table 7 and Table 8 report the estimation results for households initially in pure agriculture and low return RNFE, each further disaggregated by age category of household heads.
Transition into High-Return RNFE
Since high-return RNFE is expected to be welfare improving, we focus our discussion on movement into high-return RNFE. We further disaggregate the analysis by age category to understand if the factors to move to high-return RNFE are different among the youth and matured households.
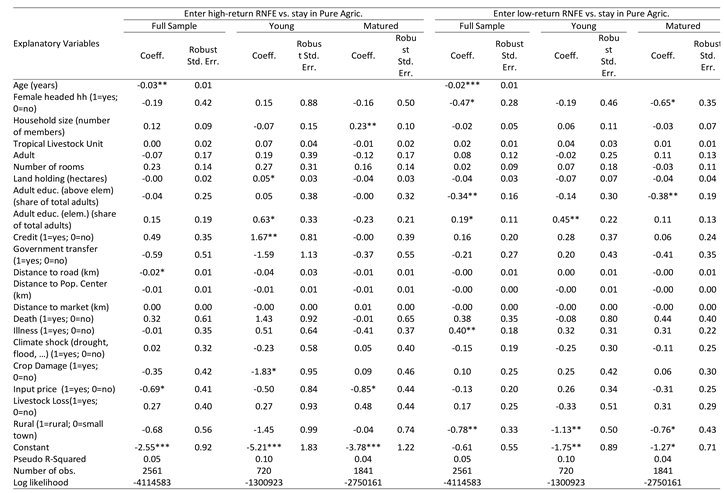
Transition from Pure Agriculture to High-Return RNFE: The first panel of table 7 indicates the factors that affect the movement from pure agriculture to high-return RNFE. Age of household head, distance to road and shocks in the form of input price negatively affect the movement from pure agriculture to high return RNFE. As expected, the older the household head, the less likely the household moves towards high-return RNFE. Similarly, remoteness and shocks mainly agricultural input price shock that affect agricultural productivity affect negatively the movement towards high-return RNFE. However, the factors are different for the youth and for the matured households.
Analysing the factors that affect the transition from pure agriculture to high-return RNFE separately for the youth and matured households, we find that agricultural shocks mainly crop damage (for the youth) and input price change (for matured households) that reduce agricultural productivity have negative influence on the transition from pure agriculture towards high-return RNFE for both the youth and matured households.
For the youth, initial endowments mainly land holding and educational level affect positively the transition from pure agriculture to high-return RNFE. Access to credit likewise significantly increases the probability of transiting from pure agriculture to high-return RNFE. Both the initial endowment and access to credit signal the importance of human capital and access to finance to engage in high-return nonfarm activities for the youth. For matured households on the other hand, family size which is expected to release labour to participate in non-farm activities significantly affect the transition from pure agriculture to high-return RNFE.
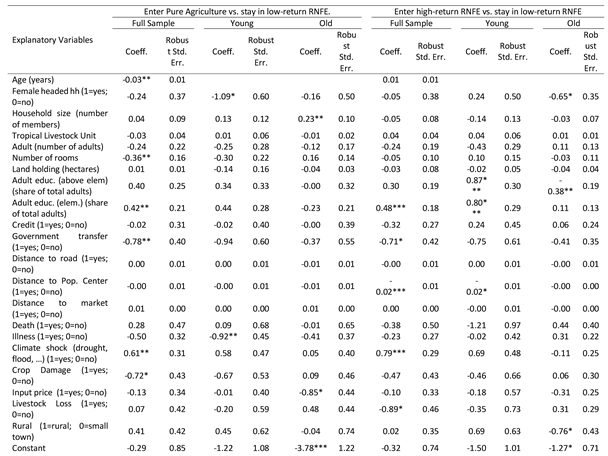
Transition from Low-Return RNFE to High-Return RNFE: The second panel of Table 8 indicates results for the transition from low-return RNFE to high-return RNFE. The result is further disaggregated for the youth and matured households. The transition from low-return RNFE to high-return RNFE is positively affected by initial human capital endowment mainly proportion of members in a household who have primary education, signaling the importance of education and hence skills to engage in high-return RNFE. Government transfer mainly in the form of safety net program given to the poorest of the poor, distance from population centers and shocks mainly loss of livestock negatively affect the transition from low-return RNFE to high-return RNFE. Disaggregating the result by age category, we observe that initial endowment in the form of proportion of household members with primary education and above significantly and positively affect the transition for youth households.
Transition out of High-Return RNFE
Table 9 indicates the result for the transition from high-return RNFE to low-return RNFE and pure agriculture for the whole sample. The transition from high-return RNFE to low-return RNFE is positively influenced by remoteness expressed by distance from population center and shock that a household faces mainly illness of a household member. On the other hand, shocks such as death of a household member and livestock loss negatively influence the transition from high-return RNFE to pure agriculture. Since agriculture requires more labour and livestock (mainly oxen) for farming, households that face the aforementioned shocks are less likely to transit to pure agriculture. However, households that face climate related shocks are more likely to transit to agriculture. This could be due to the fact that such a shock reduces agricultural income and may affect the source of capital required to sustainably run high-return RNFE that require more capital.
5. Conclusion
We analysed the factors that determine participation and intensity of participation in RNFEs, and dynamics in the sector with a focus on transition into and out of high-return RNFEs. We used panel-double hurdle model to analyse the non-farm enterprise behavior of rural households. The results from the panel hurdle model show that household characteristics mainly age and gender of household head determine participation and intensity of participation in RNFEs. Age of household head negatively affects both entry and intensity of participation whereas gender of household head, i.e., female headed household affects entry positively but is negatively and significantly correlated with intensity of participation. Moreover, initial capital endowments such as assets, human capital, land and livestock affect intensity of participation than entry into RNFE. This infers that initial capital endowments are not barriers to entry into RNFE implying the poor can enter into the sector. However, for optimizing returns, these endowments are significant indicating the fact that the sector requires initial investment and skills to develop.
Dynamics in RNFE participation is analyzed separately for the youth and matured households. Results indicate that both participation and rate of participation indicated by continuously participating in RNFE is high among the youth than among matured households. Similarly, the factors that affect transition from pure agriculture and low-return RNFE to high-return RNFE are different for the two. For youth households, initial capital endowments mainly land holding and educational level and access to credit positively and significantly affect the transition to high-return RNFE. For matured households, family size positively affects the transition to high-return RNFE.
Our results for both entry and stay, and dynamics in RNFE participation provide some justifications for policies that support enterprise owners if RNFEs are to serve as a way out of poverty especially for the youth. Instruments such as entrepreneurial skills development and access to finance that enhance investments and gradual accumulation of capital are vital especially for the youth to earn higher returns and also to transit to high-return RNFEs. Hence, it is critical to identify and support talented young entrepreneurs that have the potential to take on more risky but also more productive types of businesses. Moreover, women’s rural non-farm entrepreneurship is common but their intensity of participation expressed by amount of income earned is low. This signifies the need for policy interventions to increase access to finance and build business skills capacity of women so as to make them beneficiaries of RNFEs. Finally, shocks mainly those that reduce agricultural productivity are significant not only in limiting the probability of the transition to high-return RNFE but also on increasing the probability of transiting out of high-return RNFE. This signifies the need for social protection schemes including measures that can mitigate shocks.
Author Contributions
Both authors contributed to the study’s conception and design. Material preparation, data collection and analysis were performed by E.H.S. The first draft of the manuscript was written by F.N.T. They both reviewed the first draft and marked their comments. Both authors have read and agreed to the published version of the manuscript.
Funding
This research was financially supported by the 50x2030 Initiative through the International Fund for Agricultural Development (IFAD) through project number (73072 – 0001).
Acknowledgments
We gratefully acknowledge Roberto Telleria for his constructive review and useful comments.
References
- Nagler, P.; Naudé, W. Non-farm entrepreneurship in rural sub-Saharan Africa: New empirical evidence. Food Policy 2017, 57, 175–191. [Google Scholar] [CrossRef] [PubMed]
- Bezu, S.; Barrett, C. Employment Dynamics in the Rural Nonfarm Sector in Ethiopia: Do the Poor Have Time on Their Side? J. Dev. Stud. 2012, 48, 1223–1240. [Google Scholar] [CrossRef]
- Dercon, S.; Krishnan, P. Income portfolios in rural Ethiopian and Tanzania, choices and constraints. J. Dev. Stud. 1996, 32, 850–875. [Google Scholar] [CrossRef]
- Lay, Jo, Mahmoud, T.O., & M’mukaria, G.M. Few opportunities, much desperation: The dichotomy of non-agricultural activities and inequality in Western Kenya. World Dev. 2008, 36, 2713–2732. [Google Scholar] [CrossRef]
- Van Den Broeck, G.; Kilic, T. (2018), “Dynamics of Off-farm Employment in Sub-Saharan Africa”, paper presented at the 39th international conference of Agricultural Economists, 28 July – 2 August, Vancouver, Canada.
- Block, S.; Webb, P. The dynamics of livelihood diversification in post-famine Ethiopia. Food Policy 2001, 26, 333–350. [Google Scholar] [CrossRef]
- Lanjouw, J.O.; Lanjouw, P. The rural non-farm sector: issues and evidence from developing countries. Agric. Econ. 2001, 26, 1–23. [Google Scholar] [CrossRef]
- Reardon, T.; Berdegue, J.; Barrett, C.; Stamoulis, K. Household Income Diversification into Rural Non-Farm Activities; Johns Hopkins University Press: Baltimore, 2006. [Google Scholar]
- Rijkers, B.; Costa, R. Gender and Rural Non-Farm Entrepreneurship. World Dev. 2012, 40, 2411–2426. [Google Scholar] [CrossRef]
- Start, D. The Rise and Fall of the Rural Non-farm Economy: Poverty Impacts and Policy Options. Dev. Policy Rev. 2001, 19, 491–505. [Google Scholar] [CrossRef]
- Bachewe, F. , Tamiru, S., & Koru, B., (2022), “Prospects for rural jobs in Ethiopia”. International Growth Center (IGC), Available online:. Available online: https://www.theigc.org/blogs/prospects-rural-jobs- ethiopia (accessed on 20 February 2023).
- Tshabalala, P.M.; Sidique, S.F. Determinants of non-farm enterprise diversification in rural Ethiopia. J. Enterprising Communities People Places Glob. Econ. 2020, 14, 495–513. [Google Scholar] [CrossRef]
- Woldenhanna, T.; Oskam, A. Income diversification and entry barriers: evidence from the Tigray region of northern Ethiopia. Food Policy 2001, 26, 351–365. [Google Scholar] [CrossRef]
- Loiening, J.; Rijkers, B.; Soderbom, M. (2008), “Nonfarm micro enterprise performance and the investment climate: Evidence from rural Ethiopia”, Policy Research Working Paper Series, No. 4577.
- Rijkers, B.; Söderbom, M. The Effects of Risk and Shocks on Non-Farm Enterprise Development in Rural Ethiopia. World Dev. 2013, 45, 119–136. [Google Scholar] [CrossRef]
- Bezu, S.; Barrett, C.B.; Holden, S.T. Does the Nonfarm Economy Offer Pathways for Upward Mobility? Evidence from a Panel Data Study in Ethiopia. World Dev. 2012, 40, 1634–1646. [Google Scholar] [CrossRef]
- Herrington, M., & Kelly, D. (2012)“African Entrepreneurship: Sub-Saharan Africa Regional Report”, Global Entrepreneurship Monitor.
- Dong, D.; Kaiser, H.M. Studying household purchasing and non-purchasing behaviour for a frequently consumed commodity: Two models. Appl. Econ. 2008, 40, 1941–1951. [Google Scholar] [CrossRef]
- Engel, C.; Moffatt, P.G. Dhreg, xtdhreg, and bootdhreg: Commands to implement double-hurdle regression. Stata J. 2014, 14, 778–797. [Google Scholar] [CrossRef]
- Madalla, G.s. (1983), “Limited-dependent and qualitative variables in econometrics (Econometric Society Monographs), Cambridge University Press, Cambridge.
- Lanjouw, P. Nonfarm Employment and Poverty in Rural El Salvador. World Dev. 2001, 29, 529–547. [Google Scholar] [CrossRef]
- Kassie, G.W.; Kim, S.; Fellizar, F.P.; Ho, B. Determinant factors of livelihood diversification: Evidence from Ethiopia. Cogent Soc. Sci. 2017, 3. [Google Scholar] [CrossRef]
| 1 | For additional information on the LSMS-ISA, see the World Bank’s website www.worldbank.org/isms-isa. |
| 2 | Tropical Livestock Unit is a common unit used to describe livestock numbers across species to produce a single figure indicating the total ‘amount’ of livestock owned. It is based on metabolic body weight of animals taking the metabolic body weight for a 250 kg animal as a reference. |
| 3 | The youth in this case is includes young adults up to the age of 34 so as to include experienced youth in the group, despite the fact that the Ethiopian National Youth Policy puts the age limit for the youth at 29 years. |
| 4 | According to the World Bank data, arable land (hectares) per person declined from 0.19 in 1993 to 0.14 in 2020 (World Bank, available at https://data.worldbank.org/indicator/AG.LND.ARBL.HA.PC?locations=ET ). |
Figure 1.
Dynamics in RNFE participation by age category over the period 2011 - 2015.
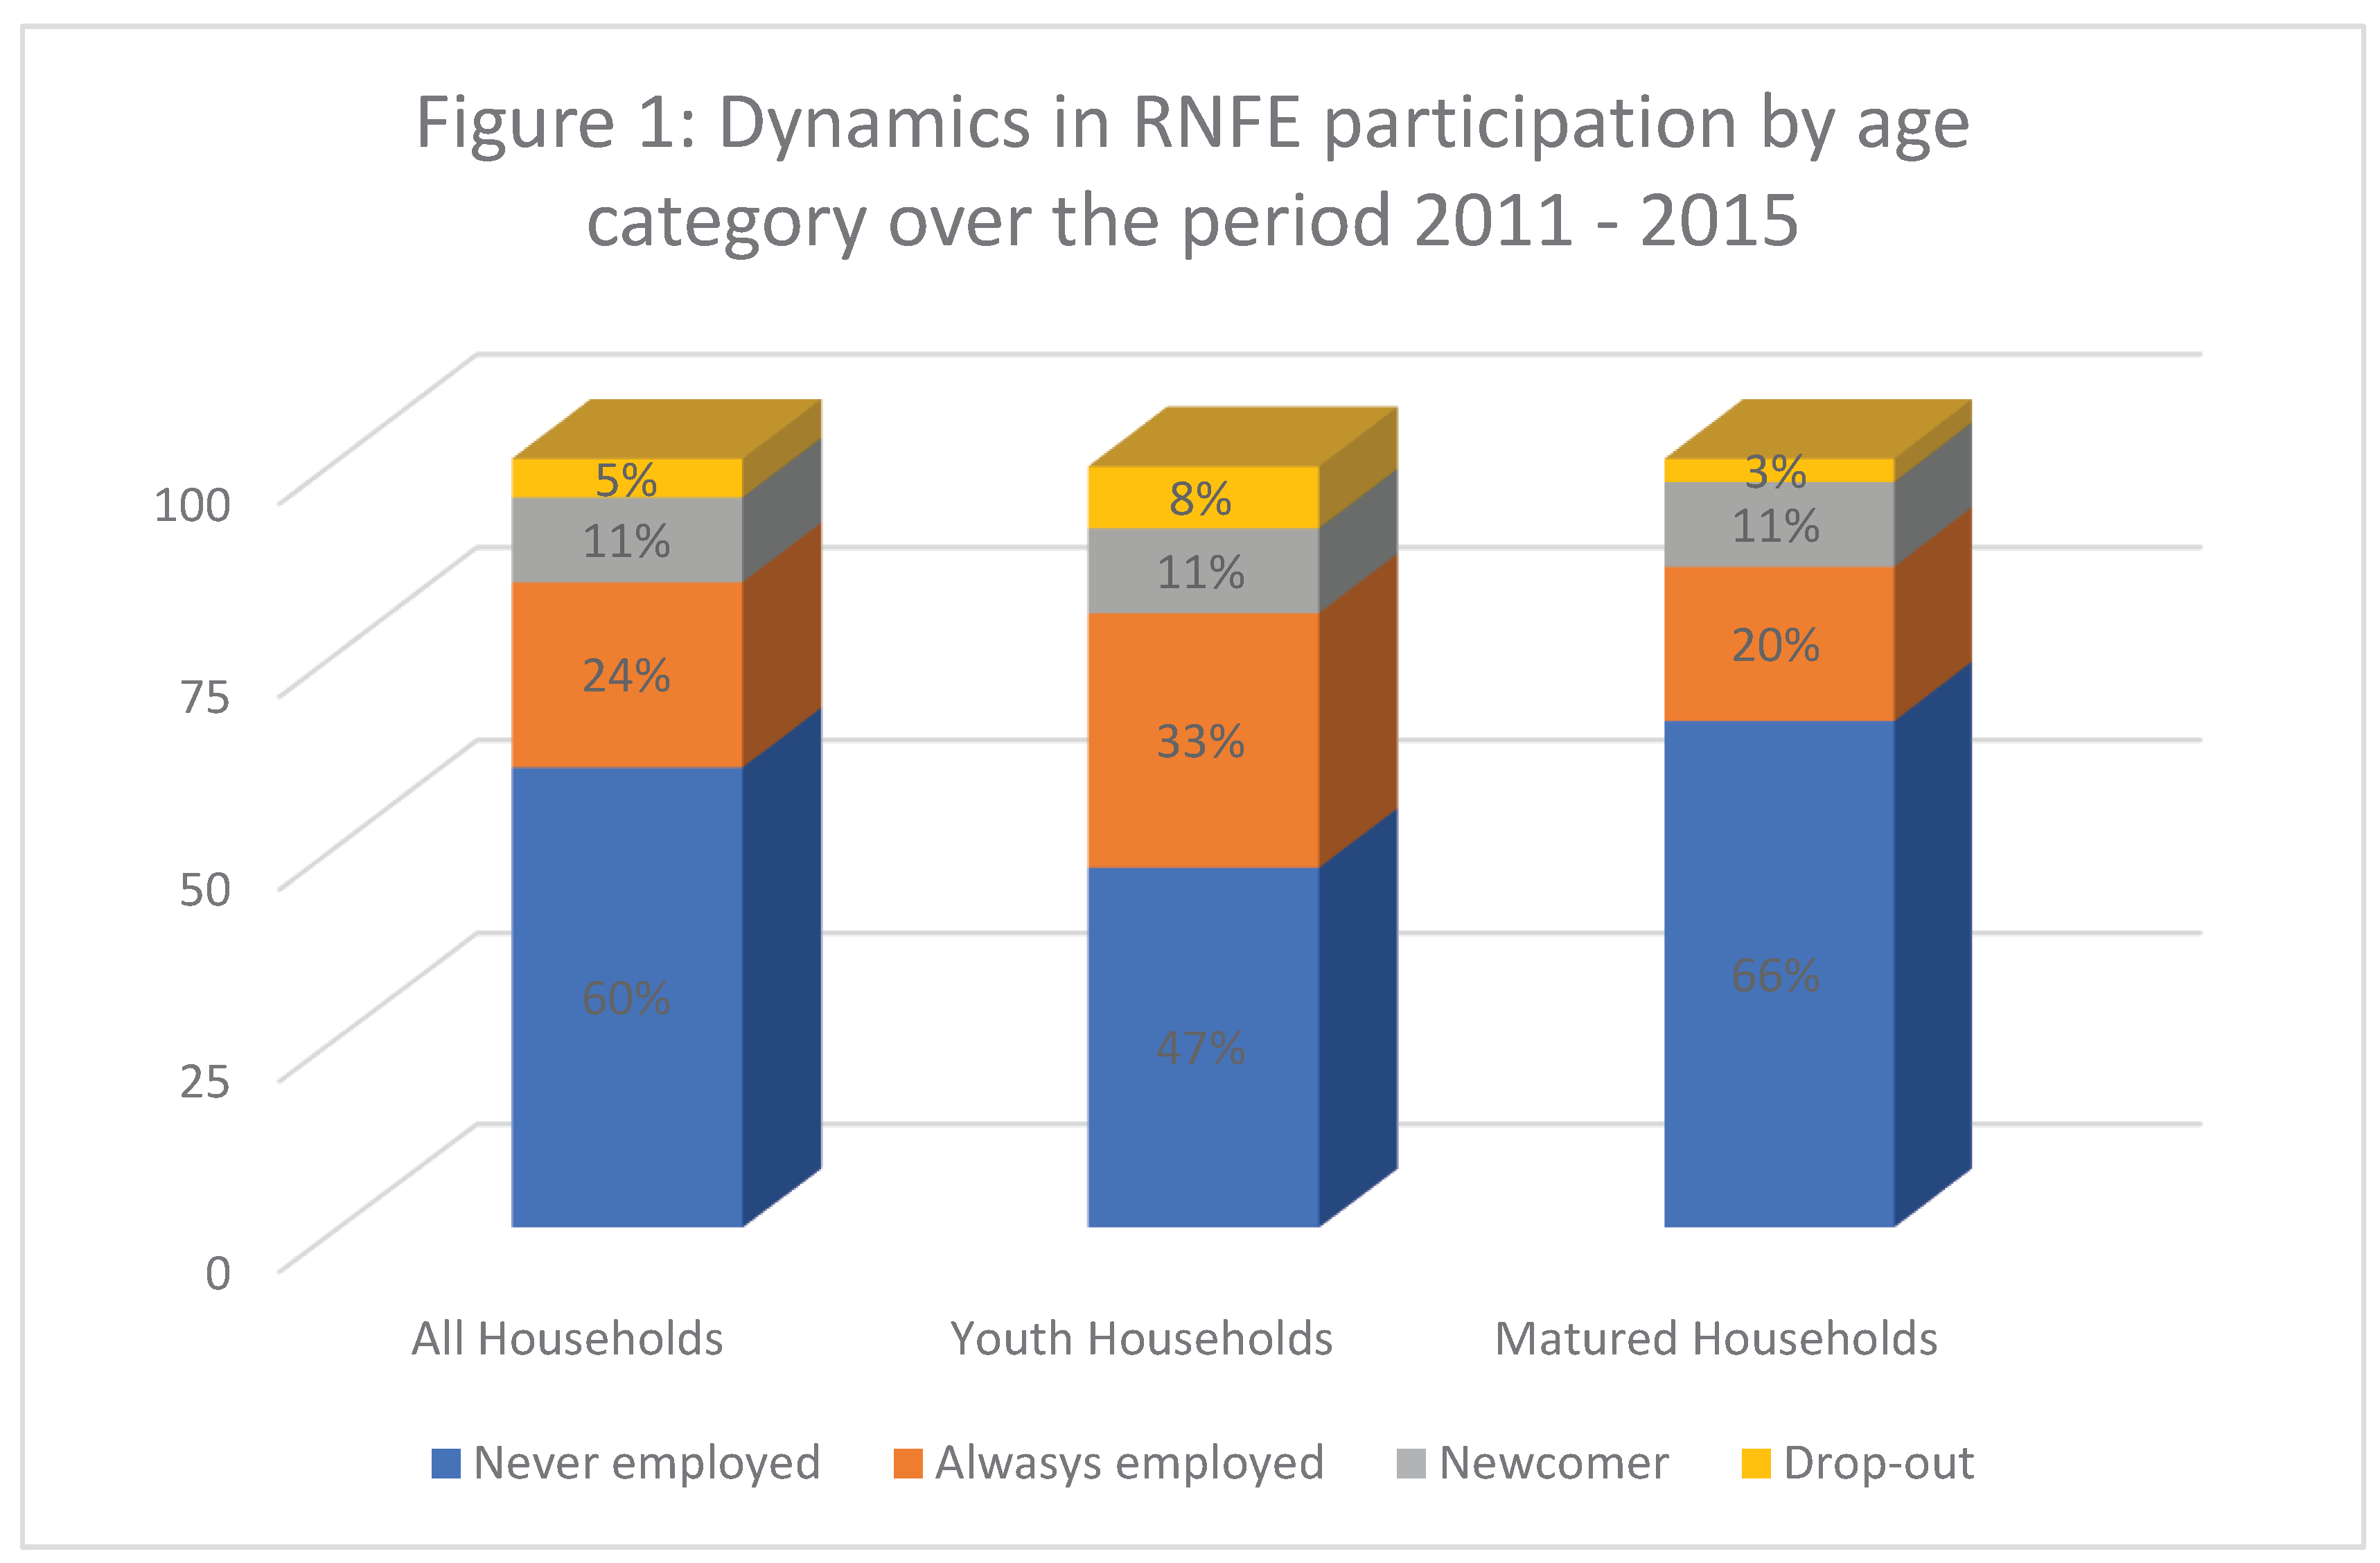

Table 1.
List of variables that affect participation in RNFE.
| Variables | RNFE Participants | Pure Agriculturalists | All Households | |||||
| Mean | sd | Mean | Sd | Mean | Sd | |||
| Household Characteristics | ||||||||
| Age of Household Head (years) | 39.52 | 13.62 | 48.04 | 15.80 | 45.56 | 15.68 | ||
| Female Headed Household (1=yes; 0 = no) | 0.27 | 0.45 | 0.25 | 0.44 | 0.26 | 0.44 | ||
| Household Size (No. of members?) | 5.14 | 2.30 | 5.01 | 2.36 | 5.05 | 2.35 | ||
| Initial Capital/Endowment | ||||||||
| Land holding (hectares) | 0.96 | 2.85 | 1.52 | 6.71 | 1.36 | 5.86 | ||
| Livestock (Tropical Livestock Unit2) | 3.59 | 18.44 | 4.94 | 7.59 | 4.55 | 11.84 | ||
| Number of Adult Household Members | 2.70 | 1.46 | 2.55 | 1.45 | 2.60 | 1.45 | ||
| Education (above elementary) (share of total adults) | 0.62 | 0.95 | 0.43 | 0.80 | 0.48 | 0.85 | ||
| Education (Elementary) (share of total adults) | 0.81 | 0.94 | 0.65 | 0.87 | 0.70 | 0.89 | ||
| Number of Rooms | 1.87 | 1.13 | 1.63 | 0.94 | 1.70 | 1.01 | ||
| Access Variables | ||||||||
| Government Transfer (1= yes; 0 = no) | 0.16 | 0.37 | 0.20 | 0.40 | 0.19 | 0.39 | ||
| Access to credit (1=yes; 0 = no) | 1.71 | 0.46 | 1.78 | 0.42 | 1.76 | 0.43 | ||
| Distance Variables | ||||||||
| Distance to Road (km) | 15.33 | 19.47 | 16.67 | 20.51 | 16.28 | 20.22 | ||
| Distance to Population Center (km) | 39.89 | 33.36 | 40.98 | 33.04 | 40.66 | 33.14 | ||
| Distance to Market (km) | 66.06 | 48.27 | 68.24 | 50.29 | 67.60 | 49.72 | ||
| Weather Related Variables | ||||||||
| Temperature (˚C) | 195.13 | 34.40 | 192.39 | 35.00 | 193.19 | 34.85 | ||
| Precipitation (mm/year) | 1127.13 | 408.97 | 1079.99 | 401.80 | 1093.71 | 404.45 | ||
| Shocks households experience | ||||||||
| Death of Household Member (1=yes; 0 = no) | 0.02 | 0.15 | 0.02 | 0.15 | 0.02 | 0.15 | ||
| Illness of household member (1=yes; 0 = no) | 0.16 | 0.36 | 0.16 | 0.36 | 0.16 | 0.36 | ||
| Climate shock (drought, flood …) (1=yes; 0 = no) | 0.16 | 0.37 | 0.24 | 0.43 | 0.22 | 0.41 | ||
| Crop Damage (1=yes; 0 = no) | 0.06 | 0.23 | 0.05 | 0.23 | 0.05 | 0.23 | ||
| Input Price (1=yes; 0 = no) | 0.08 | 0.28 | 0.12 | 0.33 | 0.11 | 0.31 | ||
| Livestock Loss (1=yes; 0 = no) | 0.05 | 0.22 | 0.07 | 0.25 | 0.06 | 0.24 | ||
| Location | ||||||||
| Rural (1=rural; 0=small town) | 0.74 | 0.44 | 0.95 | 0.22 | 0.89 | 0.32 | ||
Source: Own calculation based on LSMS-ISA data for Ethiopia.
Table 2.
Distribution of sample households by activity type.
| Activity Type | 2011/12 | 2013/14 | 2015/16 | |||
|---|---|---|---|---|---|---|
| Freq. | Percent | Freq. | Percent | Freq. | Percent | |
| Pure_Agriculture | 2,856 | 71.96 | 3,493 | 66.42 | 3,111 | 62.47 |
| high_NRFE | 206 | 5.19 | 480 | 9.13 | 422 | 8.47 |
| low_NRFE | 907 | 22.85 | 1,286 | 24.45 | 1,447 | 29.06 |
Source: Own calculation based on LSMS-ISA data for Ethiopia.
Table 3.
Proportion of households who transited from pure agriculture or low-return RNFE in 2011 to high return RNFE in 2013 and 2015.
Table 3.
Proportion of households who transited from pure agriculture or low-return RNFE in 2011 to high return RNFE in 2013 and 2015.
| Household type | Transition into high-return RNFE in 2013 or 2015 | Transition out of high-return RNFE in 2013 or 2015 |
|---|---|---|
| Youth households | 12.6 | 7.2 |
| Matured households | 9.7 | 4.2 |
| All households | 10.7 | 5.2 |
Source: Own calculation based on LSMS-ISA data for Ethiopia.
Table 4.
Initial capital endowment and accumulation by transition into high-return RNFE.
| Capital endowment in 2011 | Transition from pure agriculture or low-return RNFE into high-return RNFE in 2013 or 2015 | |||||
|---|---|---|---|---|---|---|
| Youth Households | Matured Households | All Households | ||||
| Stayed | Moved | Stayed | Moved | Stayed | Moved | |
| Average land holding in hectare | 1.15 | 0.86 | 1.43 | 0.84*** | 1.39 | 0.85*** |
| Average number of adult HH members | 2.09 | 2.27** | 2.57 | 2.56 | 2.54 | 2.48 |
| Average adult education: Above elementary (share of total adults) | 0.35 | 0.44 | 0.42 | 0.55 | 0.41 | 0.51 |
| Average adult education: Elementary (share of total adults) | 0.60 | 0.85*** | 0.70 | 0.79 | 0.70 | 0.83*** |
| Average livestock holding in tropical livestock unit | 3.19 | 2.40 | 4.75 | 2.92*** | 4.36 | 2.75*** |
Population statistics are corrected using sampling weights. Significant difference across age of business owners are indicated with *p<0.10, **P<0.05, ***P<0.01. Source: Own calculation based on LSMS-ISA data for Ethiopia.
Table 5.
Licensing and Seasonality of RNFE.
| 2011 | 2013 | 2015 | |||||||
|---|---|---|---|---|---|---|---|---|---|
| All | Youth | Matured | All | Youth | Matured | All | Youth | Matured | |
| Proportion of enterprises whose operation is seasonal (%) | 46.09 | 48.31 | 44.09 | 31.46 | 32.63 | 30.18 | 28.16 | 28.96 | 26.83 |
| Average number of months operated in a year | 7.86 | 7.5 | 8.15** | 8.72 | 8.36 | 9.04*** | 9.01 | 8.71 | 9.24 |
| Average number of days per month in operation | 15.75 | 15.45 | 15.93 | 16.11 | 16.45 | 15.72 | 15.7 | 15.81 | 15.62 |
| Proportion of enterprises with a license (%) | 13.8 | 13.04 | 13.56 | 17.47 | 14.82 | 19.1 | 18.89 | 18.24 | 18.75 |
Population statistics are corrected using sampling weights. Significant difference across age of business owners are indicated with *p<0.10, **P<0.05, ***P<0.01 Source: Own calculation based on LSMS-ISA data for Ethiopia.
Table 6.
Panel Hurdle Model for Overall Participation and Level of Participation in Rural Non-Farm Enterprises.
Table 6.
Panel Hurdle Model for Overall Participation and Level of Participation in Rural Non-Farm Enterprises.
| Explanatory Variables | Hurdle One Participation in Rural Non-farm Enterprises |
Hurdle Two Level of participation (Income from RNFE) |
||||
| Coef. | Std. Err | Coef. | Std. Err | |||
| Household Characteristics | ||||||
| Age (years) | -0.01*** | 0.00 | -406.76*** | 54.46 | ||
| Female headed household (1=yes; 0=no) | 0.42*** | 0.12 | -5872.73*** | 2200.92 | ||
| Household size (number of members) | 0.02 | 0.02 | 428.48 | 409.22 | ||
| Asset/Capital/Access endowment | ||||||
| Land holding (in hectare) | -0.01 | 0.01 | -177.57 | 153.71 | ||
| Tropical Livestock Unit | -0.00 | 0.00 | -6.89 | 24.81 | ||
| Adult (number of adult members) | -0.06* | 0.04 | 1639.43*** | 617.43 | ||
| Adult Education (above elementary) (share of total adults) | 0.07 | 0.05 | 160.48 | 865.16 | ||
| Adult Education (Elementary) (share of total adults) | 0.10** | 0.04 | -589.57 | 715.56 | ||
| Number of rooms | -0.07 | 0.06 | 4618.69*** | 1454.65 | ||
| Government transfer (1=yes; 0=no ) | -0.16 | 0.08 | 1757.44 | 1345.38 | ||
| Credit (1=yes; 0=no) | -4689.46 | 4077.47 | ||||
| Shock experience | ||||||
| Death of household member (1=yes; 0=no) | -0.05 | 0.21 | -863.15 | 2858.14 | ||
| Illness of household member (1=yes; 0=no) | -0.03 | 0.07 | -994.16 | 1222.48 | ||
| Climate shock (drought, flood, …) (1=yes; 0=no) | -0.10 | 0.08 | -678.30 | 1265.18 | ||
| Crop damage (1=yes; 0=no) | 0.09 | 0.11 | 329.87 | 1935.68 | ||
| Input price (large change in input price) | -0.19** | 0.09 | -1487.49 | 1556.77 | ||
| Loss of livestock 1=yes; 0=no) | 0.10 | 0.11 | -2103.48 | 1949.26 | ||
| Distance Variables | ||||||
| Distance to market (km) | -0.00* | 0.00 | 45.07 | 38.38 | ||
| Distance to road (km) | -0.00 | 0.00 | 140.29** | 66.82 | ||
| Distance to population center (km) | -0.00 | 0.00 | 45.07 | 38.38 | ||
| Weather related variables | ||||||
| Temperature (˚C) | -0.00* | 0.00 | 196.18*** | 46.57 | ||
| Precipitation (mm/year) | -0.00 | 0.00 | 6.16 | 5.28 | ||
| Rural | -0.48** | 0.19 | -19127.87*** | 4213.34 | ||
| Constant | 2.44*** | 0.80 | -25540.51 | 17322.64 | ||
| Sigma_u _cons |
26769.95*** |
1718.26 |
||||
| Sigma_e _cons |
19126.41*** |
326.43 |
||||
| Transformed_rho _cons |
-1.28*** |
0.09 |
||||
| log likelihood | -26806.17 | |||||
| Wald chi2 | 112.97 | |||||
| Number of observations | 8835.00 | |||||
* p<0.10, ** p<0.05, *** p<0.01 Source: Own calculation based on LSMS-ISA data for Ethiopia.
Table 7.
Multinomial logit estimation of determinants of transition for households which did not participate in any RNFE in 2011.
Table 7.
Multinomial logit estimation of determinants of transition for households which did not participate in any RNFE in 2011.
* p<0.10, ** p<0.05, *** p<0.01.
Table 8.
Multinomial logit estimation of determinants of transition for households which were engaged in low return RNFE in 2011.
Table 8.
Multinomial logit estimation of determinants of transition for households which were engaged in low return RNFE in 2011.
* p<0.10, ** p<0.05, *** p<0.01. Source: Own calculation based on LSMS-ISA data for Ethiopia.
Table 9.
Multinomial logit estimation of determinants of transition for households who were engaged in high-return RNFE in 2011.
Table 9.
Multinomial logit estimation of determinants of transition for households who were engaged in high-return RNFE in 2011.
| Explanatory Variableys | Enter Pure Agric vs. stay in high-return RNFE. | Enter low-return RNFE vs. stay in high-return RNFE | ||
| Coeff. | Robust Std. Err. | Coeff. | Robust Std. Err. | |
| Age (years) | -0.05** | 0.02 | -0.02 | 0.02 |
| Female headed hh (1=yes; 0=no) | 0.71 | 0.94 | 0.58 | 0.69 |
| Household size (number of members) | 0.24 | 0.24 | -0.08 | 0.15 |
| Tropical Livestock Unit | 0.10 | 0.09 | 0.03 | 0.06 |
| Adult (number of adults) | -0.30 | 0.68 | 0.13 | 0.29 |
| Number of rooms | -0.38 | 0.38 | 0.21 | 0.31 |
| Land holding (hectares) | 0.06 | 0.33 | 0.20 | 0.24 |
| Adult educ. (above elem) (share of total adults) | 0.02 | 0.68 | -0.19 | 0.32 |
| Adult educ. (elem.) (share of total adults) | -0.30 | 0.53 | -0.25 | 0.30 |
| Credit (1=yes; 0=no) | 0.78 | 0.77 | -0.64 | 0.62 |
| Government transfer (1=yes; 0=no) | -0.22 | 1.09 | -0.07 | 0.80 |
| Distance to road (km) | 0.00 | 0.02 | 0.00 | 0.01 |
| Distance to Pop. Center (km) | 0.01 | 0.02 | 0.03** | 0.01 |
| Distance to market (km) | -0.02* | 0.01 | -0.01* | 0.01 |
| Death (1=yes; 0=no) | -21.34*** | 1.05 | 1.00 | 0.99 |
| Illness (1=yes; 0=no) | 0.54 | 0.78 | 1.27* | 0.72 |
| Climate shock (drought, flood, etc.) (1=yes; 0=no) | 1.45* | 0.87 | 1.20 | 0.78 |
| Crop Damage (1=yes; 0=no) | 1.42 | 1.22 | 0.96 | 0.93 |
| Input price (1=yes; 0=no) | 0.78 | 0.83 | 0.87 | 0.63 |
| Livestock Loss (1=yes; 0=no) | -1.88** | 0.95 | -1.50* | 0.78 |
| Rural (1=rural; 0=small town) | 0.50 | 1.13 | 0.44 | 0.66 |
| Constant | -0.04 | 2.20 | 0.93 | 1.34 |
| Pseudo R-Squared | 0.21 | 0.21 | ||
| Number of obs. | 191 | 191 | ||
| Log likelihood | -392926.1 | -392926.1 | ||
* p<0.10, ** p<0.05, *** p<0.01 Source: Own calculation based on LSMS-ISA data for Ethiopia.
Disclaimer/Publisher’s Note: The statements, opinions and data contained in all publications are solely those of the individual author(s) and contributor(s) and not of MDPI and/or the editor(s). MDPI and/or the editor(s) disclaim responsibility for any injury to people or property resulting from any ideas, methods, instructions or products referred to in the content. |
© 2023 by the authors. Licensee MDPI, Basel, Switzerland. This article is an open access article distributed under the terms and conditions of the Creative Commons Attribution (CC BY) license (http://creativecommons.org/licenses/by/4.0/).
Copyright: This open access article is published under a Creative Commons CC BY 4.0 license, which permit the free download, distribution, and reuse, provided that the author and preprint are cited in any reuse.


