
Submitted:
31 July 2023
Posted:
02 August 2023
You are already at the latest version
Abstract
A healthy lifestyle and environmental protection play a big role in today's modern society. The production of organic wine, as with other organic commodities, is therefore increasingly popular with consumers. The selling price of organic wine is higher than that of wine that is not declared organic or BIO, so the question arises from consumers whether these wines contain more bioactive compounds and substances beneficial to the body. From a general point of view, it is known that grapevines contain a wide range of natural phenols and polyphenols. These substances affect the sensory properties of wines, especially color, and taste. The most of phenolic substances are found in red wines, slightly less in orange, and the lowest amounts are found in white wines. However, the representation of individual substances and their ratios differ based on the varieties and age of the wines. Therefore, this study aimed to compare the profile (chemical, physical and sensory) of organic wines compared to wines made from non-organic grapes, which are grown in a selected wine region - Kutná Hora. The analyzed wines were made from the same grape wine cultivar in the Kutná Hora area. The following analyzes were performed on the wine samples: the phenolic and antioxidant profile, the content of sulfites (free and total), alcohol, sugars, vitamins, density determination, and also sensory evaluation. The present study showed exact differences between samples of wines produced from the same cultivar, and same region, but declared as organic wines and wines from conventional production. Although a higher amount of bioactive substances is expected in wines from organic production, in most cases of presented analyzes, it did not show a statistically significant difference in the sense of a higher amount in BIO wines, on the contrary, in many cases the content of these substances was higher in wines from integrated production.
Keywords:
antioxidant capacity
; integrated viticulture
; organic viticulture
; polyphenols
; Pinot Noir
; Riesling
; sacharides
; sulfur dioxide
; vitamins
1. Introduction
The production of wine belongs to Czech Republic historically, where white wines production predominates over red wines. The production process of white wines is characterized by the fermentation of musts from white varieties and the processing of wines is being carried out without solid parts of the berries. The first step is grinding and crushing, which has a positive effect on the quality of the wines. In addition, there is a separation of flakes, which negatively affect the taste of wines. Maceration is only used for some varieties or depending on the ripeness of the grapes and their condition [1].
There are various ways of viticultural management. As other plant production, viticulture uses conventional or biodynamic type. The goal of conventional agriculture is the largest harvest regardless of the damage it causes to the environment. This farming makes extensive use of industrial fertilizers, soil loosening and herbicides. The consequence is a reduction in the diversity and activity of soil life, loss of humus, etc. Conventional production also negatively affects the vine seedlings themselves, which thereby lose their defense capabilities [2]. Biodynamic viticulture is ecologic production based on respect for the area of life and the area of forces. The plant should be treated as a living thing, which for its prosperity needs not only substances, but also vital forces in the form of organic fertilizers [3]. This method of farming is based on the belief that life on Earth, including the growth, development, quality and resistance of plants, is influenced by cosmic forces - light, heat and the force field of the Moon. This is manifested in practice by usage of the lunar calendar when carrying out individual actions within the framework of cultivation and production [4]. Organic products are becoming more and more popular with consumers in general thanks to a gentler way of farming and less negative effects on the environment. Organic products, including BIO wine, are also often considered by society to be of higher quality, which is, of course, reflected in the higher price of these products. The issue of organic wines and their comparison with wines from different productions has been a current topic for several years. Wine has attracted attention for its health effects, as it is known to be a significant source of polyphenolic substances. There are a number of studies that have shown the positive effect of regular wine consumption on human health. The so-called "French paradox", i.e. the lower incidence of cardiovascular diseases in people in France despite the consumption of foods rich in saturated fat, is well known, which is often explained by the regular consumption of red wines [5]. Up to thousands of components of wine have a number of therapeutic effects on the human organism. However, the benefit of wine consumption is an extremely complex topic, since it is, after all, alcoholic beverages. Therefore, it is important to ensure that wine consumption is moderate. Most of the beneficial health effects are attributed to polyphenols, which are contained in wine regardless of the alcohol content [6]. Based on in vitro and in vivo studies, it has been found that daily consumption of a specific moderate amount of wine can prevent various chronic diseases [7]. It is also stated in the professional literature that thanks to its substances, wine is a suitable prevention against cancer, reduces the risk of senile dementia, improves blood flow in the brain and supports digestion [8,9].
For the purposes of this study, wines originating from integrated and ecological (biodynamic) production were analyzed, specifically made from the same grape vine cultivar from the Kutná Hora wine region, and the wines were also from the same vintage. The selected wine region of Kutná Hora is known for the fact that the first mentions of the cultivation of vines appeared already in Kosm’s Chronicle in 1001. These mentions refer to the winery in Malín near Kutná Hora (now a suburb of Kutná Hora). In 1143, a Cistercian monastery was founded in Kutná Hora, which also led to the creation of new vineyards in the area. These were vineyards in Neškaredice, Perštejnec, Kaňk, Sukov and also vineyards under the Jesuit college. With the advent of the Thirty Years’ War, there was a radical decline and decrease in the number of vineyards. In 1910, they covered approximately 1 hectare. The renewal of the vineyards in this area in 1977 is due to Mr. Múček, who in the following years planted several hectares of vineyards consisting of the Tramín, Muller Thurgau, Pinot Noir and Pinot Noir varieties. The area of vineyards was 4.64 hectares in 1984. Another boom in vineyards came in 1993 with the founding of the Vitamína fruit growers cooperative. They planted another 2.38 hectares with Riesling, Moravian Muscat, Hibernal, Cabernet Moravia and table varieties. The current total area of vineyards in Kutná Hora corresponds to 61.76 hectares. If we focus on organic vineyards, the area of certified organic vineyards in Kutná Hora in 2022 was 44.96 hectares. There are 10.16 hectares in transition and 6.64 hectares are conventionally farmed [10,11].
The aim of the work was to compare chemical, physical and sensory profile of organic wines with wines made from non-organic grapes from the Kutná Hora area. This work was focused on determination of the phenolic, antioxidant and sensory profile of wine samples from integrated and organic production and, thanks to these results, to confirm or refute the difference in values based on the type of farming. Another goal was to compare the amount of sulfites of substances that are added to wines during production. The influence of management was also examined from the point of view of the representation of individual vitamins, density values, alcohol and pH.
2. Materials and Methods
Wine samples from integrated and organic production were analyzed in this work (Table 1). All samples came from the Kutnohorsk region and were of the same wine varieties and vintages. We used samples of Rhine Riesling 2018 and Pinot Noir 2019, for which total polyphenols, antioxidant capacity, amount of SO2, pH value, density and alcohol content were determined.

Table 1.
Characteristics of analyzed wine samples.
| Abbreviation | The Name of the Wine | Type of Production | Production Area |
|---|---|---|---|
| RR Z | Rhine Riesling 2018 | integrated | Kutná Hora |
| RR VS | Rhine Riesling 2018 | organic | Kutná Hora |
| RM Z | Pinot Noir 2019 | integrated | Kutná Hora |
| RM VS | Pinot Noir 2019 | organic | Kutná Hora |
2.1. Determination of Total Polyphenols Spectrophotometrically (UV/VIS)
Determination of the concentration of total polyphenols using the FC test using the oxidation-reduction reaction mechanism and subsequent spectrophotometric measurement at a wavelength of 765 nm [12].
2.2. Determination of Antioxidant Activity Using the ABTS Method
The antioxidant activity was determined based on the principle of comparing the antiradical activity of the sample with the antiradical activity of the substance Trolox according to authors Thaipong et al., 2006 [13]. Specifically, the quenching of the ABTS•+ radical by the antioxidant from the sample was monitored using a spectrophotometer. The samples were prepared by putting 0.1 g of the sample and 20 ml of ethanol into dark bottles, followed by 30 min of sample extraction using ultrasound. Next, a reaction solution was prepared (12 - 16 hours before use): 10 ml of ABTS (2,2’-azino-bis(3-ethylbenzothiazoline-6-sulfonic acid)) solution (0.0384 g in a 10 ml volumetric flask, supplemented distilled H2O to the mark) + 10 ml of potassium peroxodisulfate solution (0.0662 g in a 100 ml volumetric flask, supplemented to the mark with distilled H2O). The reaction solution was stored at room temperature and in the dark. Before the actual absorbance using the spectrophotometer, it was necessary to dilute the reaction solution so that its absorbance value was 0.7 at a wavelength of 735 nm after zeroing the spectrophotometer using ethanol. Before the measurement, the necessary preparation of the sample was also carried out: pipette 1980 µl of the diluted reaction solution + 20 µl of the extract into 10 ml test tubes, followed by incubation in the dark for 5 minutes. Absorbance was measured at 735 nm. Calculation according to the formula:
(%) = [(Abs-ABTS-Abs-sample )/Abs-ABTS ]*100
(Abs-ABTS – absorbance of ABTS solution; Abs-sample - absorbance of the sample).
2.3. Determination of Antioxidant Activity by the DPPH Method
The principle of the method was to determine the antiradical activity based on the reaction of the substance and the stable radical DPPH (2,2-diphenyl-1-picrylhydrazyl), where this radical is reduced, which is observed using a spectrophotometer. The DPPH solution was prepared by adding 100 mL of ethanol to 0.0039 g of DPPH. The method was performed according to Brand-Williams et al., 1995 [14]. First, a sample extract was prepared: 0.1 g sample + 20 ml ethanol → extraction using an ultrasonic bath for 30 min, which was further processed: 3 ml extract + 1 ml 0.1 mM ethanol of DPPH solution → shake and incubate in the dark for 30 min. It was also necessary to prepare a comparative solution: 3 ml of ethanol + 1 ml of 0.1 mM DPPH → shake and incubate in the dark for 30 min. Absorbance was measured at 517 nm, blank was ethanol. Calculation according to the formula:
(AbsDPPH – absorbance DPPH solution; Abssample – absorbance of sample)
2.4. Determination of Antioxidant Activity Using the FRAP Method
The determination of antioxidant activity by the FRAP method consists in determining the redox properties of the substance based on the reduction of the Fe3+-TPTZ complex by antioxidants from the sample and in the change in absorbance recorded with a spectrophotometer. To carry out the method, it was necessary to prepare a working solution composed of 50 ml of acetic buffer + 5 ml of TPTZ + 5 ml of FeCl3 → wrap in aluminum foil. A solution of TPTZ (2,4,6-Tripyridyl-S-triazine) was prepared from 0.0312 g of TPTZ in a 10 ml volumetric flask → top up to the mark with diluted HCl (1 ml HCl + 299 ml H2O) → wrap in aluminum foil and for 8 minutes into the ultrasound bath. The FeCl3.6H2O solution was made FeCl3.6H2O: 0.032 g of FeCl3 into a 10 ml volumetric flask → top up to the mark with distilled water → wrap in aluminum foil and place in an ultrasonic bath for 8 minutes. The procedure of the method was carried out according to Behbahani et al., 2017. The first step of this method is the preparation of the extract, where 0.1 g of sample + 20 ml of 75% methanol is placed in a dark bottle → extraction in the dark using an ultrasonic bath for 30 minutes. It is also necessary to prepare a blank sample in advance, again in a dark bottle, 960 µl H2O + 7.2 ml working solution → incubation in the dark for 8 minutes. Next, preparation of the sample in a dark bottle, when 180 µl of sample + 300 µl of H2O + 3.6 ml of working solution are mixed → incubation in the dark for 8 minutes. Measure absorbance at 593 nm after zeroing the spectrophotometer using a blank. The used method was determined according to the methodology Behbahani et al. (2017) [15].
2.5. Determination of Polyphenols by the HPLC Method
The samples are dosed into the mobile phase, in our case substance A (water + 1% phosphoric acid) and B (acetonitrile) in the proportions (80% A and 20% B for 20 minutes, 70% A and 30% B for 20-25 minutes and 60% A and 40% B for 25–40 minutes). The mobile phase carries the individual components of the sample onto an Agilent ZORBAX Eclipse Plus column (4.6 x 250 mm, 5 μm), where analytes are separated according to their physicochemical properties. This is followed by the detection of the analytes in the flow cell of the diode array detector (DAD) at a wavelength of 340 nm, the result of which is the so-called Chromatogram [16].
2.6. Determination of Phenolics by the UHPLC-MS/MS Method
Determination of phenolics using a Nexera X2 UHPLC ultra high performance liquid chromatograph with MS-8050 tandem mass spectrometry using a quadrupole detector and an electrospray ionization (ESI) source. The column was an Acquity BEH C18 (100 x 2.1 mm, 1.7 μm) protected by a pre-column. The column temperature was 40 °C. The dispensed sample volume was 2 μl and the column flow rate was 0.4 ml per minute. The mobile phase consisted of substances A (formic acid with a concentration of 15 mmol.l-1 and pH 3) and B (acetonitrile).
Gradient elution conditions: 0 min 5% B; 0.7 min 5% B; 2 min 15% B; 4.5 min 30% B; 6 min 30% B; 7.5 min 70% B; 7.6 min 100% B; 8.2 min 5% B; 12 min 5% B. Mass spectrometry conditions: capillary voltage 3 kV, interface voltage 4 kV, interface temperature 300 °C, DL 250 °C, heating and drying gas flow 10 l.min-1, fogging gas flow 3 l. min-1, heatblock temperature 400 °C. Individual phenolics were identified based on different retention times, MRM transitions and their relative intensities with authentic standards. Data processing was carried out using the MSD ChemStation E 02.02.1431 software [17].
2.7. Determination of Vitamins by the UHPLC-MS/MS Method
Determination of vitamins using a Shimadzu Nexera X2 UHPLC ultra high performance liquid chromatograph with MS-8050 tandem mass spectrometry using a quadrupole detector and an electrospray ionization (ESI) source. The column was an Acquity BEH C18 (50 x 2.1 mm, 1.7 μm) protected by a pre-column. The column temperature was 40 °C. The dispensed sample volume was 2 μl and the column flow rate was 0.4 ml per minute. The mobile phase consisted of substance A (formic acid with a concentration of 15 mmol.l-1 and pH 3) and B (methanol). Gradient elution conditions for water-soluble vitamins: 0 min 2% B; 3 min 15% B; 4 min 65% B; 4.5 min 65% B; 5 min 2% B; 8 min 2% B. Gradient elution conditions for fat-soluble vitamins: 0 min 40% B; 2 min 100% B; 4.5 min 100%B; 4.6 min 40% B; 7 min 40% B. Conditions for mass spectrometry: capillary voltage 3 kV, voltage at the interface 4 kV, interface temperature 300 °C, DL 250 °C, heating and drying gas flow 10 l.min-1, fogging gas flow 3 l .min-1, heatblock temperature 400 °C. Data processing was performed using the MSD ChemStation E 02.02.1431 software [18].
2.8. Sacharides Determination Using HPLC-ELSD Method
Carbohydrates were separated using a KNAUER liquid chromatograph on a Rezex RCM monosaccharide Ca + column (300 x 7.8 mm, 8 μm) heated to 80°C and protected by a pre-column (50 x 7.8 mm) with the same stationary phase. The mobile phase was Mili-Q water with a flow rate of 0.6 ml.min-1. The sample volume was 10 μl and the analysis took 17 minutes. Detection was carried out with the help of ELSD under the following conditions: gas flow 2 l.min-1 and detector temperature 80°C. Measurements were performed in triplicate and chromatograms were evaluated using the Clarity program (version 6.1). Individual saccharide species were identified based on retention times of standards and subsequently determined using external calibration equations [19].
2.9. Determination of pH Using a Combined Glass Electrode pH Meter
This method consists in determining the activity of oxonium cations in the sample by potentiometric measurement. Standardized calibration solutions of pH 4 and pH 7 were used. The procedure of the method was simple: rinse the electrode with distilled water and dry, then calibrate the pH meter using solutions of known pH (rinse with distilled water and dry between solutions) and measure the pH of individual samples.
2.10. Determination of Sulfur Dioxide Using an IODOLYSER
Sulfur dioxide (its free form and total) was determined by an Iodolyser device, which performs automatic titration. The sample for the determination of free SO2 was prepared before the measurement: 25 ml of wine in a 50 ml measuring beaker + 5 ml of 1/3 H2SO4. The sample intended for measuring total SO2 was prepared with 10 ml of wine in a 50 ml measuring beaker + 2 ml of NaOH 2N → wait 5 minutes and then add 20 ml of 1/10 H2SO4. The instrument automatically performs the titration with constant stirring.
2.11. Determination of Alcohol Content by Ebuloscope
This method is based on the fact that individual liquids have different boiling temperatures. Wine has a lower boiling point than distilled water, and the more alcohol a sample contains, the earlier boiling occurs. An ebuloscope was used in our study to measure the alcohol content. A calibration solution (78.13 ml of ethanol + distilled water in a 500 ml volumetric flask) was required for the measurement, thanks to which the instrument was calibrated. Only then could the individual wine samples be measured one by one [20].
2.12. Determination of Density Pycnometrically
The density of the wine was determined according to the methodology by Cepeda and Villarán [21] based on a defined calculation:
(a - mass of the pycnometer with the wine sample at 20°C; b - mass of an empty pycnometer; M20 - mass of water in pycnometer
2.13. A Sensory Analysis
The samples of wines - RR Z, RR VS, RM Z, RM VS, ORANZ and ONAK were sensory evaluated by a group of 6 amateur evaluators. The wines were evaluated for color, aroma and taste using the most widely used 100-point scale.
2.14. Statistics
We statistically evaluated the analysis values using the IBM SPSS Statistics Substriction program using the oneway ANOVA method. We entered the averages of values from multiple measurements into the program, and subsequently evaluated the homogeneity of variances according to the LEVENE test value. If the value was less than 0.05, we used the Games-Howell test, and if the value was greater than 0.05, we used the Tukey test. The final values of individual analyzes are expressed in the tables as mean ± standard deviation.
3. Results and Discussion
3.1. Determination of Antioxidant Activity and Total Polyphenols Spectrophotometrically
The antioxidant capacity of wine samples was determined by ABTS, DPPH and FRAP methods. ABTS analysis revealed the values of the antioxidant capacity of the wines ranging from 2.53 ± 0.04 to 5.59 ± 0.06% (Table 2). The lowest determined value was for the sample RR VS from organic production, on the contrary, the highest for the sample RM Z from integrated production. In the case of determination of antioxidant capacity by the DPPH method, statistically significant differences were recorded in samples of both red and white varieties. Again, lower values were measured in the organic samples, and the order coincides with the results determined by the ABTS method. The values obtained by the FRAP method range from 20.62 ± 0.22 to 34.22 ± 0.20 µmol/g. Higher values for red wines were also recorded by Jamroz and Bełtowski [22] or Lino et al. [23].
Table 2.
Spectrophotometric determination of the antioxidant capacity and total polyphenols.
| Analyte | Method | Sample | |||
|---|---|---|---|---|---|
| RR Z | RR VS | RM Z | RM VS | ||
| Antioxidant capacity | ABTS (%) | 2.82 ± 0.18d | 2.53 ± 0.04d | 5.59 ± 0.06c | 4.10 ± 0.24a |
| DPPH (%) | 41.63 ± 0.78f | 29.12 ± 0.28e | 87.94 ± 0.46d | 80.50 ± 0.10a | |
| FRAP (μmol/g) | 21.60 ± 0.88c | 20.62 ± 0.22c | 34.22 ± 0.20b | 29.59 ± 0.16a | |
|
Total Polyphenols (Gallic acid) |
UV/VIS mg/g | 0.54 ± 0.00a | 0.40 ± 0.00c | 1.73 ± 0.05b | 1.28 ± 0.02d |
Explanations: Lowercase letters (a, b, c, d, e, f) in superscript indicate statistically significant difference (p <0.05).
Several studies have been devoted to the relationship of the amount of total polyphenols with the value of antioxidant capacity. From the results we obtained (Table 2), it is evident that the order of the individual samples corresponds to the order of the samples in the determination of total polyphenols. From this it can be concluded, that the higher amount of total polyphenols means the higher the value of the antioxidant capacity, which was also reached by Ghiselli et al. [24]. Another study that reports the influence of different flavonoids, but also the synergistic or antagonistic effect of different groups of polyphenols, comes from the collective of authors Di Majo et al. [25]. The high degree of correlation between antioxidant capacity and the total amount of polyphenols, flavonoids and flavan-3-ols is also confirmed by Minussi et al. [26], further Li et al. [27], or Meng et al. [28].
The possible effect between the type of agricultural management and the amount of all polyphenols in the samples was investigated. The total polyphenols results (represented by gallic acid) are shown in Table 2. We observe a statistically significant difference between all of them. Values range from 0.40 to 1.73 ± 0.05 mg/g. A higher amount of gallic acid was measured by this method in wine samples from integrated production. The highest value of 1.73 ± 0.05 (mg/g) was recorded for the RM Z sample and the lowest 0.40 ± 0 (mg/g) for the organic sample RR VS. The amount of polyphenols in red wine samples is multiple. This fact also corresponds to the studies of Haseeb et al. [29], Markoski et al. [30] and Li et al. [27], who report up to 10 times higher quantity due to the fermentation of red wines in the presence of skins and other parts of the berries. Tinttunen and Lehtonem [31] also compared the values of total polyphenols in organic and normal wines within the framework of the study. They analyzed 9 wine samples and in most cases there were more total polyphenols in normal wines without a BIO (organic) declaration.
3.2. Phenolic Profile by HPLC
The phenolic profile was also determined using the HPLC method (Figure 1, Figure 2, Figure 3 and Figure 4). It is clear from the obtained results that a significantly higher amount of polyphenols was recorded in the RR Z sample from integrated production (Figure 1), which also corresponds to the results obtained in the determination of total polyphenols. In the case of red wine samples, a higher amount is also noticeable in integrated production, i.e. in the RM Z sample (Figure 3). The similar representation and number of peaks in both red and white wine samples confirms the theory of the influence of the variety on the phenolic profile, which is in line with, for example Paskvanka et al. ( [32], Shadidi and Naczk [33], Merkyté et al. [34].
Figure 1.
Phenolic profile of RR Z sample.
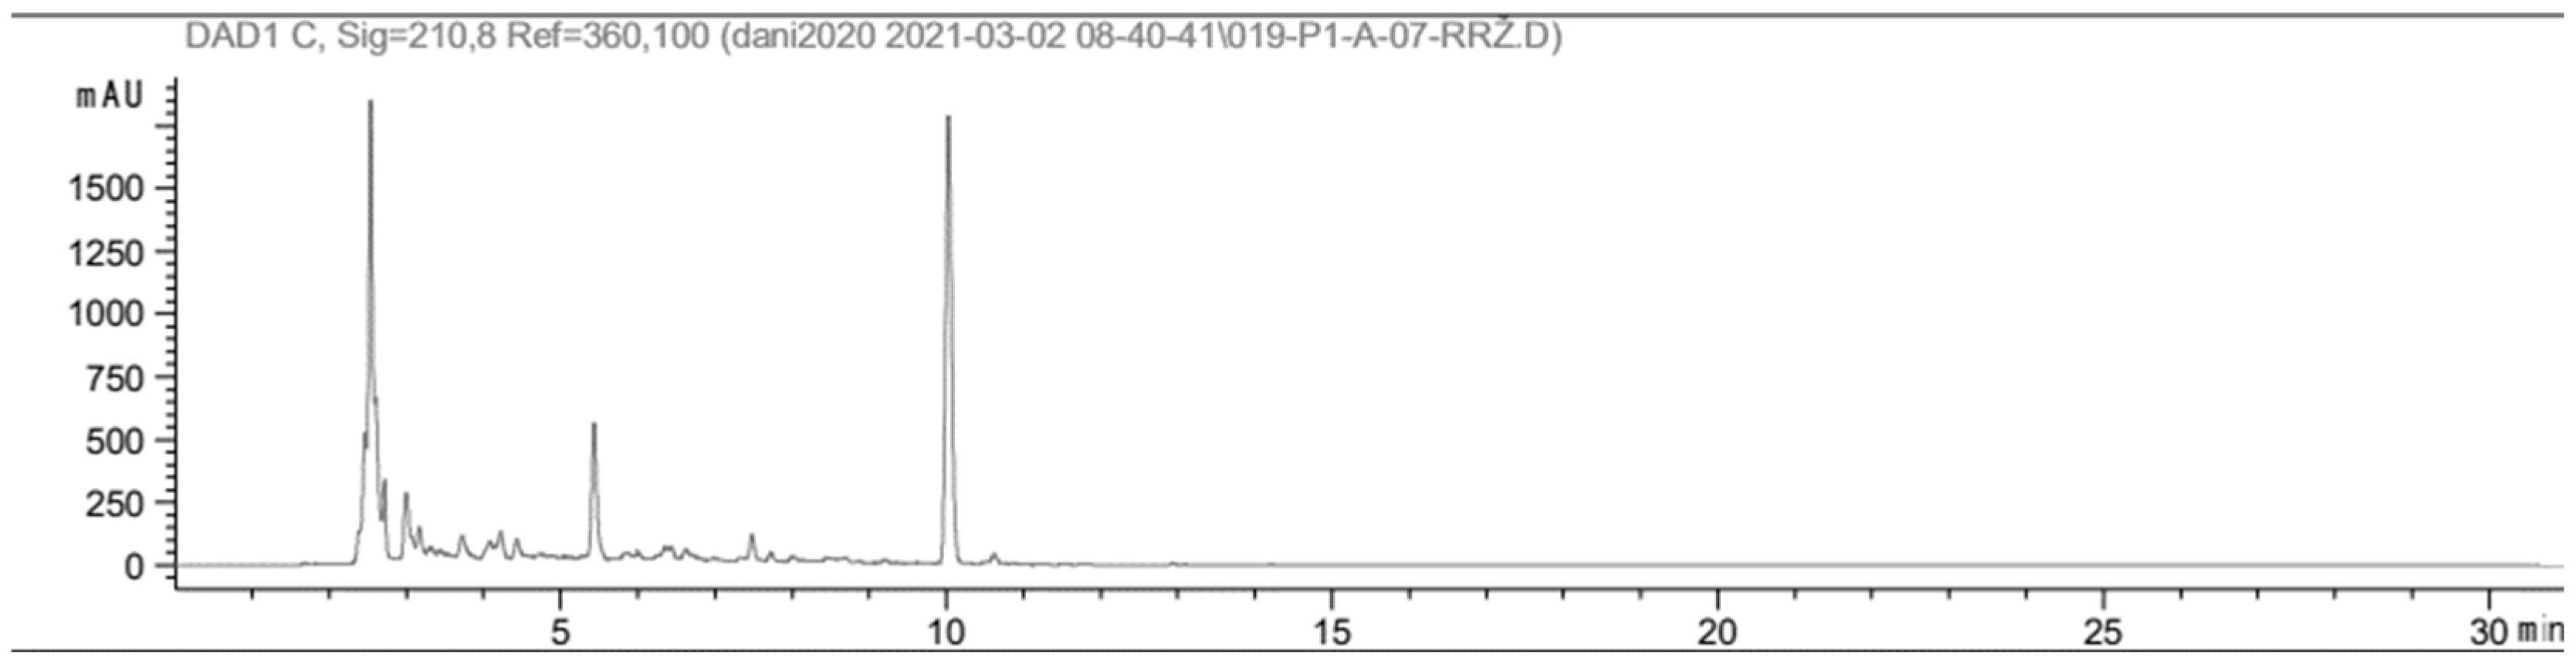
Figure 2.
Phenolic profile of RR VS sample.
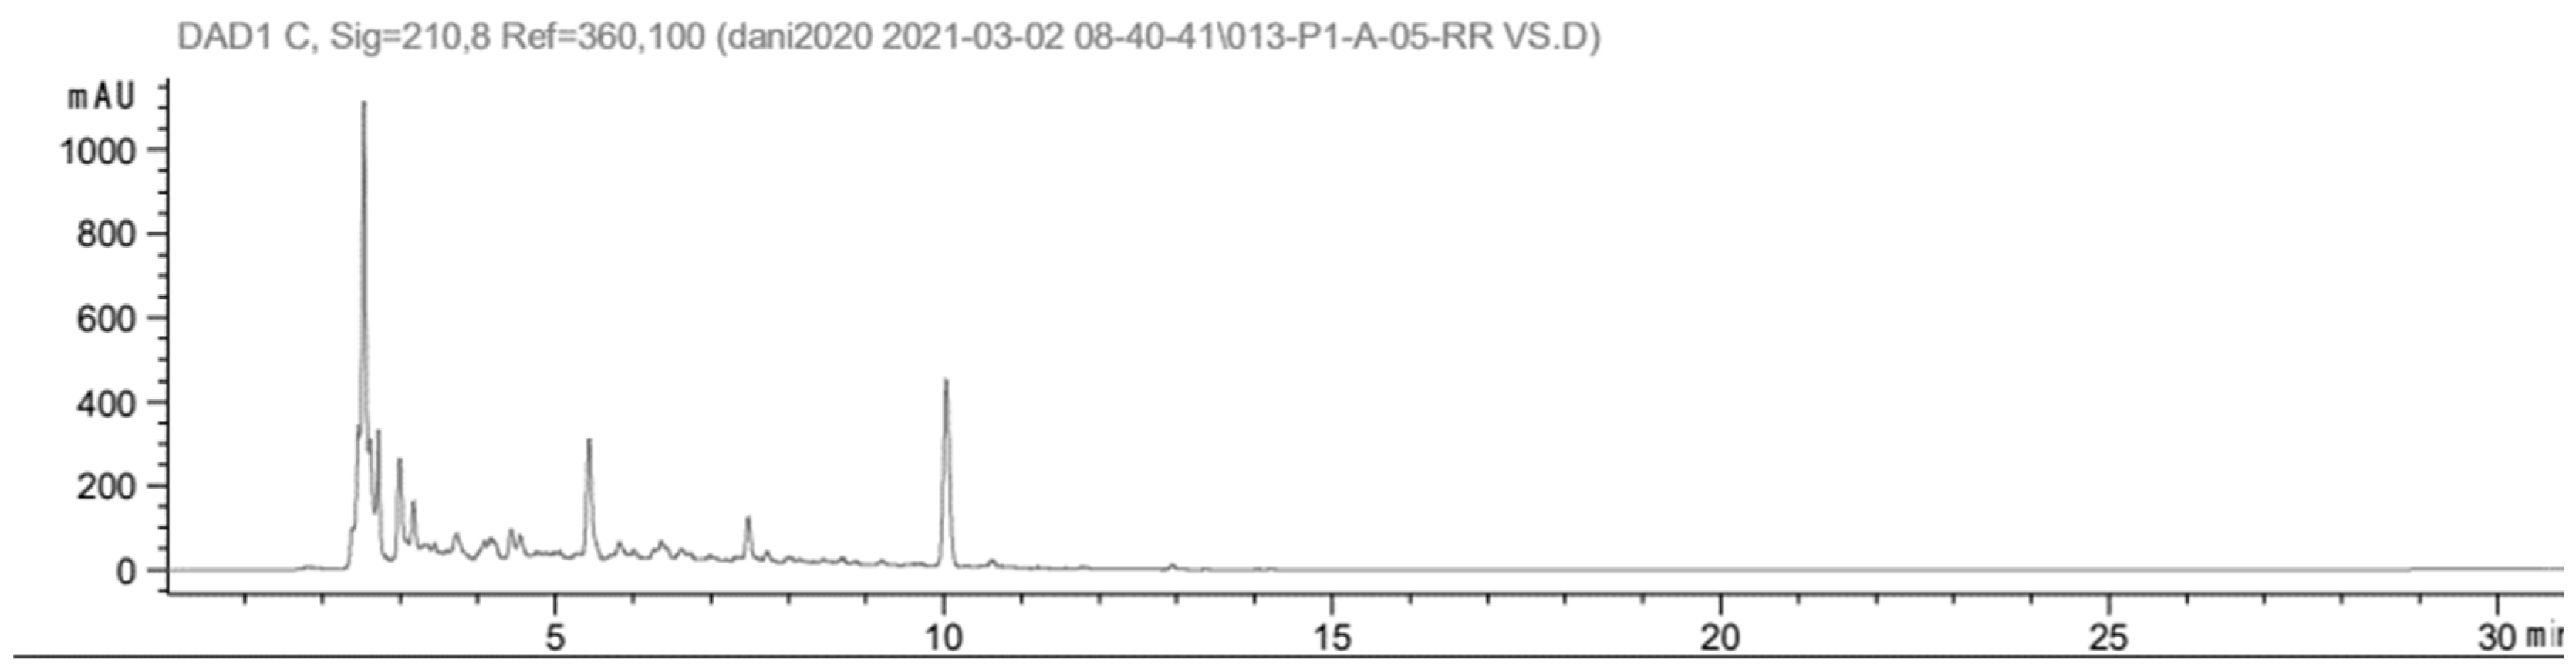
Figure 3.
Phenolic profile of RM Z sample.
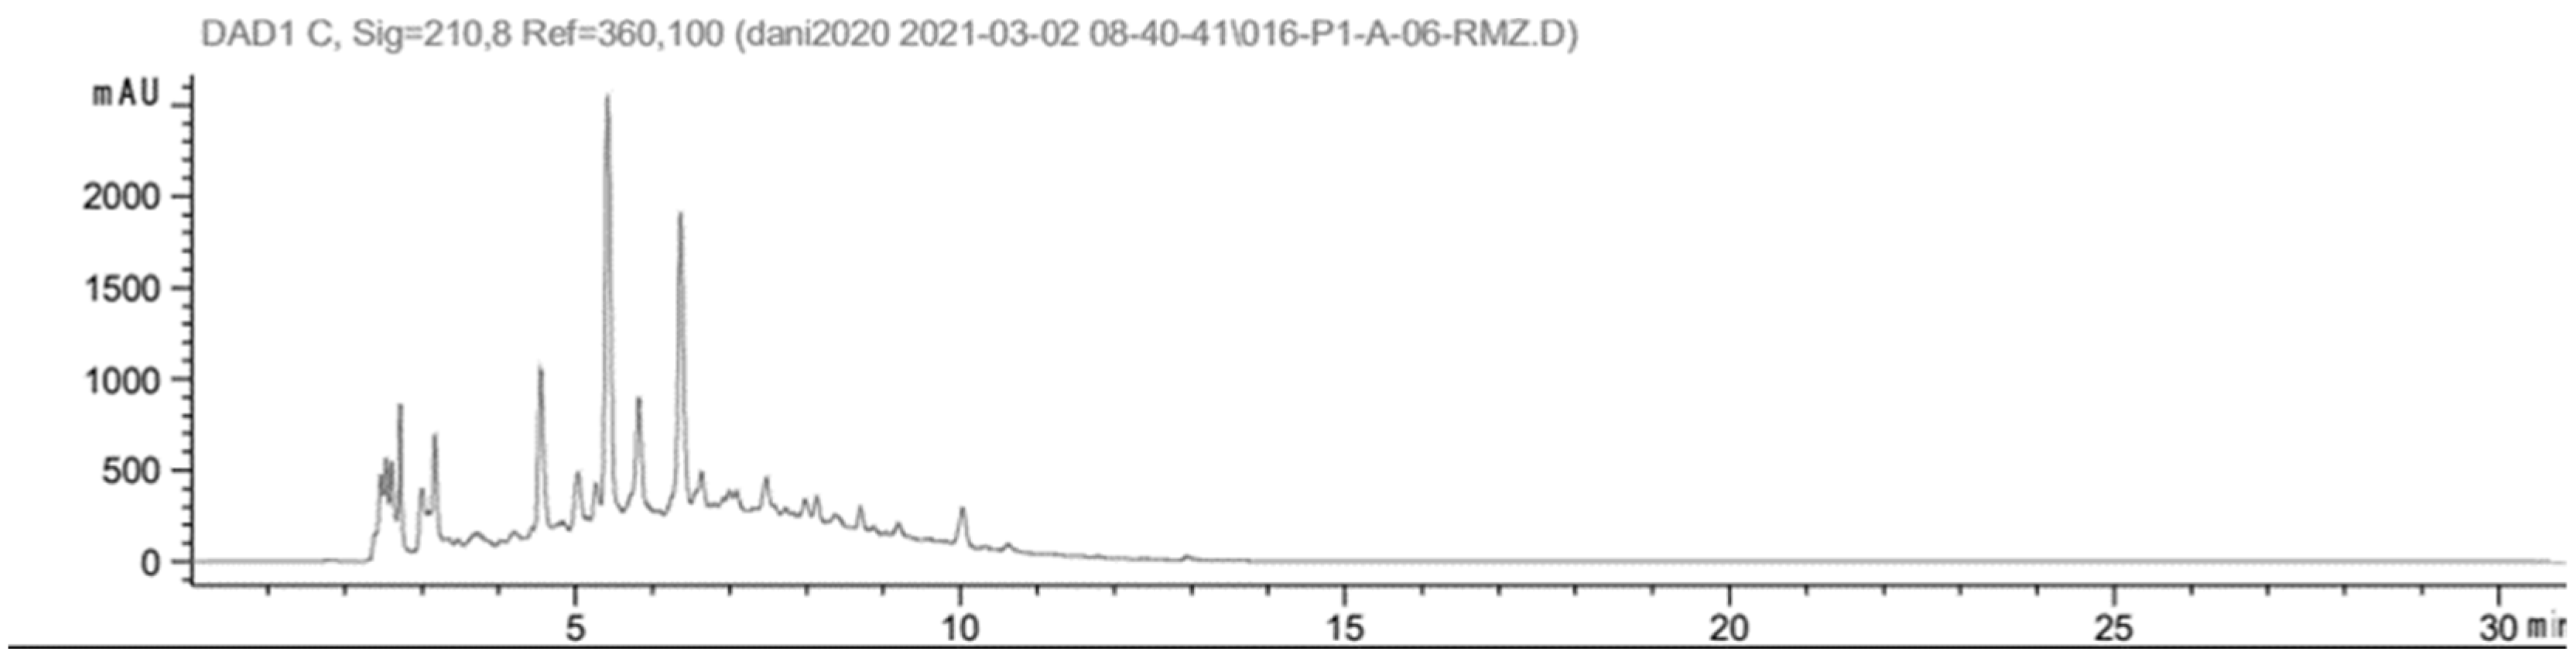
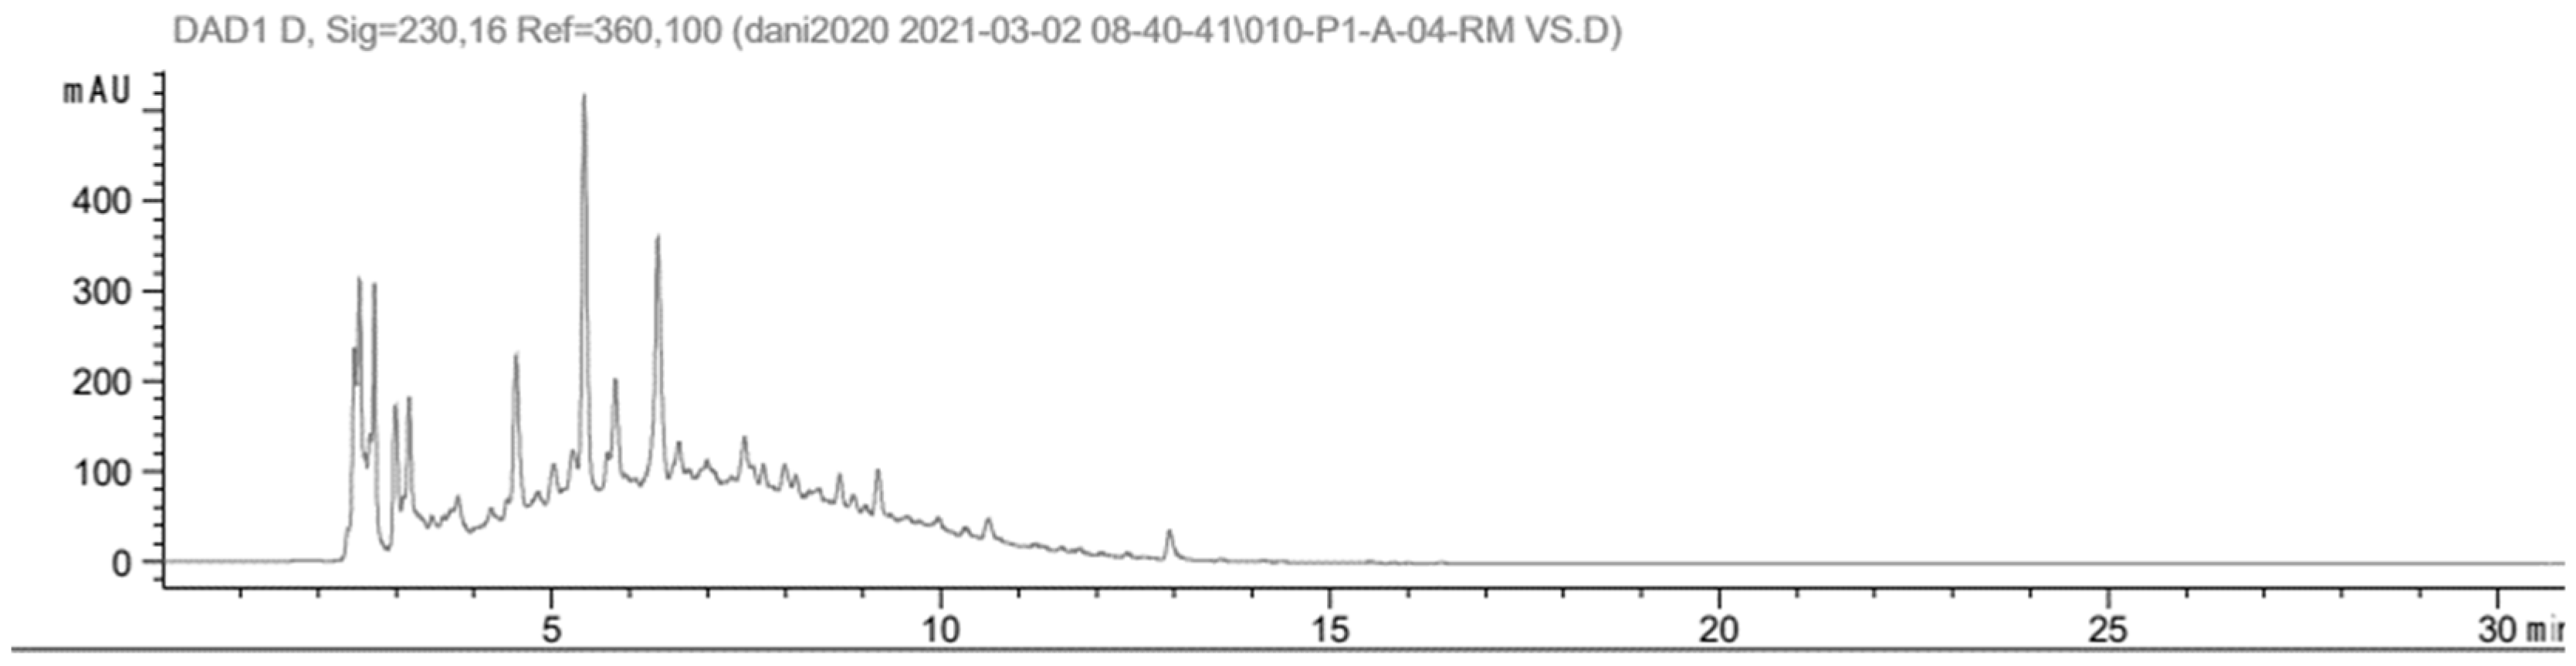
Figure 4.
Phenolic profile of RM VS sample.
The amount of polyphenols can be influenced by the variety, and also by the region in which the grapes were grown. This is also confirmed by Pasvanka et al. [32]. Not only variety and region, but also other external factors such as climatic conditions, production process factors or storage conditions play an important role (Gutiérrez-Escobar et al. [35], Lino et al.[23], Sánchez Arribas et al. [9].
3.3. Determination of Phenolic Substances by the UHPLC-MS/MS Method
Table 3 shows the obtained results of the quantification of individual phenolic substances. Significantly higher values of syringic acid were measured in red wine samples using the UHPLC-MS/MS method. No statistically significant difference was noted between samples of white and red varieties. Nevertheless, slightly higher values were found for samples from integrated production. Statistically insignificant, but slightly lower values for organic production were also measured in the study by Dutra et al. [36].
A statistically significantly higher amount of 2,3-dihydroxybenzoic acid was found in samples from organic production. The determination of the amount of phenolic acids was also dealt with by Kalkan et al. [37], who analyzed 14 samples of red and white wines. The values of 2,3-dihydroxybenzoic acid ranged widely from 0.029 mg/l to 5.89 mg/l. Similar values were recorded by Kilinc and Kalkan ( [38] in a study of Turkish commercial wines.
Gallic acid is considered to be the dominant phenolic acid in wines regardless of vintage and region [39]. The differences in the amount of this acid in the samples of white wines (Rhine Riesling) were statistically insignificant. The amount of gallic acid was also determined by Kumšta et al. [40] in several Riesling samples from different regions. Their study showed that the amount of gallic acid ranged from 430 ± 0.15 µg/l to 5 170 ± 1.19 µg/l. The study by Kumšta et al. [40] confirmed the effect of growing area on the amount of phenolic acids, including gallic acid. Significantly higher values were recorded for red wine samples, which corresponds to the results of Minussi et al. [41]. A higher value of 3 372.99 ± 25.80 µg/l was measured in the RM Z sample from integrated production.
Table 3.
Quantification of phenolic substances by UHPLC-MS/MS.
| Analyte (µg/l) | Sample | |||
|---|---|---|---|---|
| RR Z | RR VS | RM Z | RM VS | |
| Syringic acid | 77..80 ± 6..68a | 65..46 ± 2.87a | 1386.91 ± 15.75b | 1375.27 ± 40.18b |
| 2,3-dihydroxybenzoic acid | 497.16 ± 0.57a | 651.19 ± 20.92b | 291.81 ± 1.34c | 775.48 ± 0.60d |
| Gallic acid | 616.13 ± 3.33a | 638.69 ± 6.65a | 3372.99 ± 25.80b | 2121.39 ± 14.95c |
| 4-hydroxybenzoic acid | 89.96 ± 4.38a | 107.31 ± 2.72bf | 41.15 ± 2.51c | 96.50 ± 3.60ab |
| Chlorogenic acid | 48.06 ± 0.76a | 17.62 ± 1.11b | 1.82 ± 0.20c | 0.30 ± 0.04d |
| Caffeic acid | 714.31 ± 11.18a | 295.14 ± 16.48b | 952.54 ± 6.57c | 755.61 ± 17.71a |
| Vanillic acid | 195.86 ± 15.03ae | 174.29 ± 27.73a | 1280.79 ± 86.08b | 1689.74 ± 111.60c |
| p-Coumaric acid | 342.43 ± 6.57a | 73.56 ± 1.39b | 266.31 ± 10.21c | 205.35 ± 7.19d |
| Ferulic acid | 130.21 ± 4.27a | 63.18 ± 0.93b | 91.27 ± 8.89c | 68.25 ± 2.98b |
| Salicylic acid | 89.91 ± 5.38a | 68.66 ± 5.38b | 26.85 ± 1.02c | 58.27 ± 1.05d |
| Quercetin | 0.09 ± 0.01a | 0.02 ± 0.01b | 3.37 ± 0.10d | 0.13 ± 0.14ab |
| Naringenin | 1.82 ± 0.04a | 1.67 ± 0.06a | 3.12 ± 0.11b | 5.49 ± 0.06c |
| Catechin | 1221.88 ± 61.54a | 1325.81 ± 180.54a | 35402.57 ± 34.13b | 17133.36 ± 458.74c |
| Naringin | 0.13 ± 0.03a | 0.11 ± 0.01ab | 0.22 ± 0.11a | 0.90 ± 0.16b |
| Myricetin | 3.34 ± 0.34a | 2.15 ± 0.12a | 108.31 ± 2.19b | 171.10 ± 2.10c |
| Hesperidin | 0.54 ± 0.05a | 0.26 ± 0.03bc | 0.28 ± 0.03bc | 0.40 ± 0.04ab |
Explanations: Lowercase letters (a, b, c, d, e, f) in superscript indicate statistically significant difference (p <0.05).
Higher amounts of 4-hydroxybenzoic acid (p-hydroxybenzoic acid) were measured especially in samples from organic production. However, in white varieties both in the case of BIO production and in the case of integrated, higher amounts of p-hydroxybenzoic acid were observed. The content of this acid is influenced by the year, but the region also has a significant influence according to the study by Kumšta et al. [40]. The amount and occurrence of this acid varies among some studies. For example, in the analyzes of the study by Franquet-Griell et al. [42], this acid was not detected in Spanish wine samples. In Kumšta et al. [40], the values of this acid in Riesling samples ranged from 300 ± 0.05 µg/l to 1,180 ± 0.15 µg/l, and similar amounts were also measured in Italian wine samples [41].
The highest value of chlorogenic acid, 48.06 ± 0.76 µg/l, was determined in the sample RR Z from integrated production. In the group of red wines, this value was again higher for integrated production than for organic, but these amounts were considerably lower compared to white wines. There have been studies in which this acid was not detected in wine samples at all [43,44]. Amounts greater than 2 mg/l may indicate adulteration with apple juice [45].
Samples from integrated production contain a statistically significantly higher amount of caffeic acid than organic samples. The values of RR Z and RR VS were compared with the values of Rieslings from the study by Kumšta et al. [40] and the values were significantly lower. Minussi et al. [41] analyzed several Italian wines and the amount of caffeic acid in the samples ranged from 500 µg/l to 5000 µg/l.
A significantly higher amount of vanillic acid was found in samples of RM Z and RM VS red wines. In the case of white varieties, no statistically significant difference was noted. The wide range of values of this acid also corresponds to the studies of Minussi et al. and Kiling and Kalkan [38,41]. The amount of vanillic acid was also determined in Ryzlink samples from different regions of the Czech Republic by Kumšta et al. ( [40], whose values ranged from 70 ± 0.02 µg/L to 850 ± 0.45 µg/l and 70 ± 0.03 µg/l to 1030 ± 0.43 µg/l.
The values of p-coumaric acid measured in samples of wines from integrated and BIO production range from 18.23 ± 0.94 µg/l to 342.43 ± 6.57 µg/l, and higher amounts were recorded in both red and white samples from production integrated. Compared to the studies of Kumšta et al. ([40], but also Minussi et al. [41] all values are significantly lower.
In all samples, ferulic acid was recorded and its amount ranged from 63.18 ± 0.93 µg/l to 130.21 ± 4.27 µg/l. The order of the individual samples based on the content of this acid corresponds to the order of the samples in the determination of p-coumaric acid, and even in this case these values are lower than the values obtained in the analyzes by Kumšta et al. [40].
The highest amount of salicylic acid, 89.91 ± 5.38 µg/l, was found in the RR Z sample, and the lowest 26.85 ± 1.02 µg/l in the RM Z sample. Minussi et al. [41] determined salicylic acid in 7 samples of Italian wines and the resulting amount ranged from 200 µg/l to 1,000 µg/l. Pavlovic et al. [46] analyzed 12 wine samples and the salicylic acid content in this case ranged from 350 ± 0.02 µg/l to 1,400 ± 0.01 µg/l. In a study by Nikfardjam et al. [47], this acid was not detected in some samples, and in others it reached values of a maximum of 310 µg/l.
Quercetin was present in minimal amounts in the samples. Only in samples RM Z was its amount higher. In a study by Nikfardjam et al. [48] quercetin was not detected in any of 6 samples of German white wines. This flavonoid is found primarily in the skin of the berries, which explains the higher values in red wine due to fermentation with the skins.
The amount of naringenin in the samples ranged from 1.67 ± 0.06 µg/l to 5.49 ± 0.06 µg/l. No statistically significant difference was recorded between white wines. In red wines a higher amount was measured in the RM VS sample from organic production. The amount of naringenin was also determined by Sergazy et al. [49] within the analysis of two red varieties, and their results ranged from 10 µg/l to 90 µg/l.
The amounts of catechin in the samples are different. The highest value of 35 402.57 ± 34.13 µg/l was measured in the sample of red wine from integrated production. No statistically significant difference was noted between the white wine samples. In an analysis of individual polyphenols by Nikfardjam et al. [48] catechin was not detected in some samples, in others it reached values of up to 6,000 µg/l (6 mg/l). Kupsa et al. [50] confirmed the effect of the region on the catechin content in Riesling wine samples. Sergazy et al. [49] compared the amount of polyphenols of two red varieties. Values ranged from 9.7 mg/l to 68.8 mg/l.
The amounts of naringin are very small in all wine samples. Naringin is most abundant in citrus fruits and is responsible for the bitter taste [51].
Regarding the amount of myricetin, we do not observe a statistically significant difference between the white wine samples. The values of red wines correspond to the values reached by Sergazy et al. [49]. Simonetti et al. [52] determined the amount of polyphenols in 10 samples of red wines and 3 samples of white wines. Even in their case, a higher myricetin content was recorded in red wines.
Hesperidin is the main flavonoid in oranges and lemons [53]. The content of this flavanone is minimal in the determined samples.
3.4. Vitamins Determination by the UHPLC-MS/MS Method
Within the determination of vitamin C, no statistically significant difference was noted between red and white wine samples. The results found also correspond to the studies of Moreno and Peidan [54]. Vitamin C is present in grapes at around 50 mg/l and its amount decreases during the production process, specifically during fermentation [43]. Vitamin C enters the wine from preparations containing ascorbic acid, which are used during production to prevent unwanted oxidation and browning of the wine, while the European limit for added ascorbic acid is 150 mg/l.
It turned out that the amount of vitamin B1 is different for the individual tested samples. A statistically significant difference was found between the samples of white wines, on the contrary, the difference in the amount of thiamine in the samples of red wines is statistically insignificant. According to Schanderl [55], the amount is higher in wines from red varieties due to the higher presence of this vitamin in skins and seeds. However, Michlovský [56] states the same amount of this vitamin in red and white wines, corresponding to 60 µg/l. In grapes, thiamine is most often found in the amount of 0.1 - 1 mg/l [57] and this amount decreases radically during fermentation and the final value corresponds to 3% to 5% of the original amount [58].
The highest amount of riboflavin (vitamin B2) was contained in the RR Z sample from integrated production, namely 129.44 ± 2.50 µg/l. In the case of the white variety, a higher amount was recorded in the integrated production, in the case of the red variety in the BIO sample RM VS. Ribérau-Gayon et al. [43] mention an amount of 8 – 133 µg/l for white wines, which our values correspond to, but for red wines a value in the range of 0.47 – 1.9 µg/l. Other sources report amounts of up to 100 µg/l in white wines and significantly lower in red wines [56]. B2 found in wines is primarily a yeast product [59]. In higher amounts, riboflavin can be the cause of aromatic defects in wines. White and rosé wines tend to be more sensitive to this defect, so yeast with a lower production of riboflavin is often used, or the amount is reduced using preparations [60].
Table 4.
Quantity of selected vitamins.
| Analyzed vitamin (µg/l) | Sample | |||
|---|---|---|---|---|
| RR Z | RR VS | RM Z | RM VS | |
| C | 367.37 ± 71.20a | 439.38 ± 14.42ac | 395.31 ± 38.50a | 418.59 ± 10.97ac |
| B1 | 25.92 ± 1.24a | 6.75 ± 0.25b | 15.00 ± 0.42c | 13.94 ± 0.33c |
| B2 | 129.44 ± 2.50a | 39.49 ± 0.95b | 43.49 ± 1.36c | 69.82 ± 1.10d |
| B3 | 1432.62 ± 121.40ac | 999.06 ± 69.47ab | 1877.03 ± 101.17c | 980.81 ± 31.13a |
| B5 | 596.21 ± 19.77a | 464.93 ± 9.99b | 1159.07 ± 53.16c | 933.60 ± 46.81d |
| B6 | 13.15 ± 0.52a | – | 0.59 ± 0.11b | 2.00 ± 0.14c |
Explanations: Lowercase letters (a, b, c, d, e, f) in superscript indicate statistically significant difference (p <0.05). A dash (–) indicates that the value was not identified.
As part of the comparison of the results for vitamin B3 content, no statistically significant difference was noted between the white wine samples. The amount of niacin in the sample RR VS was 999.06 ± 69.47 µg/l and in RR Z from integrated production 1432.62 ± 121.40 µg/l. The differences between the results regarding the red varieties were statistically significant, with a higher value measured for the RM Z sample, namely 1877.03 ± 101.17 µg/l. In the course of fermentation, niacin in musts is consumed by yeast, its amount decreases, and after its depletion, it is regenerated by yeast. The resulting amount is in the range of 1000 – 2000 µg/l, and this amount tends to be higher in red wines [56].
A higher amount of pantothenic acid (vitamin B5) was found in samples of red varieties. The highest amount of 1159.07 ± 53.16 µg/l was measured in the RM Z sample from integrated production, the lowest amount of 464.93 ± 9.99 µg/l in RR VS from organic production. Hagen et al. [61] reported in their study that grapes contained an average of 8.5 and 6.8 mg/L pantothenic acid in red and white cultivars, however, a large decrease in pantothenic acid content in wine was observed in must during fermentation processes. The vitamin content decreases during fermentation due to consumption by the yeast, but it can also be synthesized by them. The resulting amount in wines corresponds to an average of 1,000 µg/l. During storage, this value decreases [56].
Vitamin B6 value was not identified for RR VS sample. The most of this vitamin was measured in the RR Z sample from the integrated production, namely 13.15 ± 0.52 µg/l. The amount in the grapes is usually higher, but during fermentation there is a significant reduction in this value. Between 50 and 90% of the B6 from the grapes passes into the must, and the resulting amount in the wines represents 40% of this amount in white wines and 60% in red wines [58].
3.5. Determination of Carbohydrates Using HPLC-ELSD Method
Saccharose is the most important transport sugar in the grape vine. Saccharose is contained both in the berries of the vine, where it is enzymatically split into glucose and fructose, but in small quantities it is also found in musts. During fermentation it is easily hydrolyzed to D-glucose and D-fructose, and it should no longer be present in wines [1,56]. Saccharose was not identified in our samples (Table 5). It shows to the no addition of saccharose in the production process [62].
Glucose is one of the residual sugars in wines, based on the amount of which wines are classified into 4 categories. In the fermentation process, glucose is preferentially fermented, so its amount in wines tends to be lower than the amount of fructose [56]. In the RR Z, RM Z and RM VS samples, the glucose content was not proven, which may explain the minimal amount of residual sugar in these wines.
The highest amount of fructose was recorded in the RR Z sample from ingested production. The preferential fermentation of glucose [63] is confirmed by the zero value of glucose in the sample RR Z from integrated production, in which the highest fructose value of 8.05 ± 0.44 g/l was measured. Both samples of the red variety are representatives of dry wines, which is also confirmed by low fructose values.
Table 5.
Quantity of selected types of carbohydrates.
| Analyzed carbohydrate (g/l) | Sample | |||
|---|---|---|---|---|
| RR Z | RR VS | RM Z | RM VS | |
| Saccharose | – | – | – | – |
| Glucose | – | 0.72 ± 0.11a | – | – |
| Fructose | 8.05 ± 0.44a | 4.21 ± 0.53c | 0.41 ± 0.06b | 1.49 ± 0.33bd |
Explanations: A dash (–) indicates that the value was not identified. Lowercase letters (a, b, c, d) in superscript indicate statistically significant difference (p <0.05). There is no statistically significant difference in the data of saccharose.
3.6. Determination of Wine pH
The pH values of the samples range from 3.35 ± 0.01 to 3.83 ± 0.02 (Table 6). A higher pH is observed in samples from integrated production. Keith R. Martin and Kristen K. Rasmussen (2011) [64] conducted a study on pH of 15 samples of wines from conventional and organic production, in which no statistically significant difference was noted between the samples, while for most samples the values were slightly higher for conventional production.
Table 6.
Wine pH.
| Sample | pH |
|---|---|
| RRZ | 3.41 ± 0.01a |
| RR VS | 3.35 ± 0.01b |
| RMZ | 3.83 ± 0.02c |
| RM VS | 3.70 ± 0.02d |
Explanations: Lowercase letters (a, b, c, d, e, f) in superscript indicate statistically significant difference (p < 0.05).
3.7. Sulfur Dioxide
From a technological point of view, sulfur dioxide has fundamental importance, as it ensures the physiological-chemical and biological stability of wine. On the one hand, with antioxidant effects, that it binds molecular oxygen and thereby chemical and enzymatic oxidation. But also a part of the quality of the wine based on its anti-aldehyde effect, when sulfur dioxide binds acetaldehyde, thus spoiling the aroma of the wine. In wine, sulfur dioxide occurs in various forms [65]. Sulfur dioxide can be present in the wine as free (HSO3- or SO2) or linked to carbonyl and unsaturated compounds and phenols [66]. In our study, the free and bound form of sulfur dioxide was determined during the wine analysis (Table 7).
Table 7.
Sulfur dioxide (free form and total) content.
| Analyte (mg/l) |
Sample | |||
|---|---|---|---|---|
| RR Z | RR VS | RM Z | RM VS | |
| SO2 free | 16.45 ± 0.07 | 5.60 ± 1.56 | 11.70 ± 0.57 | 12.65 ± 0.92 |
| Total SO2 | 134.25 ± 0.64a | 50.15 ± 2.90bc | 29.90 ± 0.28b | 41.25 ± 0.78c |
Explanations: Lowercase letters (a, b, c) in superscript indicate statistically significant difference (p <0.05). There is no statistically significant difference in the data of SO2 free.
No statistically significant difference was noted between the free SO2 values. The amount of free sulfur dioxide in wines should not exceed 50 mg/l, which corresponds to the lowest amount that a person can detect in wine. EU and US Directives require food manufacturers to indicate sulfur dioxide content, if it is higher than 10 mg/l at a concentration, because it is potentially toxic to the human body [67]. Sulfur dioxide can cause an asthma attack, allergic reactions of various types in hypersensitive people, or dermatological problems [68].
Small amounts of sulfites occur naturally in wines, but most are added to wine for the purpose of preservation or to prevent oxidation and unwanted browning. European legislation sets limits for individual wines based on color, residual sugar content and the type of farm the wine comes from. A higher amount is allowed for white wines and for wines with a higher residual sugar content. All measured values listed in the table of legislative requirements, and in all cases the limit value is not even close. Tinttunen and Lehtonen [31] also compared SO2 content in a study of 9 samples representing normal and organic production. In most of their samples, a higher amount was recorded for wines from normal production. However, in the case of the red variety, as in our case, a higher amount was produced organically.
3.8. Alcohol Content
The ethanol content of the selected wine samples (values obtained using the ebuloscope) ranges from 12.81 ± 0.01% to 14.75 ± 0.06%, which corresponds to the label values (Table 8). As reported by Dutra et al. [36], wines from organic production often have a lower amount of alcohol, which is also observed in this case. The higher amount of alcohol in wines from integrated production could have been influenced by the higher sugar content of the grapes, the later harvest or the different length of fermentation.
Table 8.
Alcohol content.
| Sample | Alcohol (%) |
|---|---|
| RR Z | 13.55 ± 0.04a |
| RR VS | 12.84 ± 0.07b |
| RM Z | 14.75 ± 0.06c |
| RM VS | 12.81 ± 0.01b |
Explanations: Lowercase letters (a, b, c) in superscript indicate statistically significant difference (p <0.05).
3.9. Determination of Density Pycnometrically
No statistically significant difference was observed between the densities of the tested wine samples (Table 9). The density of red wines, including the Pinot Noir variety, was determined by Giosana et al. (2011) [69] and the resulting sample values ranged from 0.981 ± 0.001 to 0.986 ± 0.001. With a higher amount of alcohol, the density decreases, which was also confirmed for red wine samples.
Table 9.
Determination of density pycnometrically.
| Sample | Density (g.cm3) |
|---|---|
| RR Z | 0.993 ± 0.001 |
| RR VS | 0.991 ± 0.001 |
| RM Z | 0.989 ± 0.001 |
| RM VS | 0.992 ± 0.001 |
Explanations: There is no statistically significant difference in the data.
3.10. Sensory Analysis
The Table 10 shows the sums of sensory evaluation points of individual samples. In evaluators No. 1, 2 and 4, we see a preference for samples from integrated production, on the other hand, evaluator No. 6 preferred BIO samples. The average values in the last row of the Table 10 show a minimal difference between the white wine samples and a significantly higher number of points for the red RM Z sample from integrated production. Sensory analysis of wines from integrated, BIO and biodynamic production was also carried out by Fritz et al. [70], who came to the conclusion that wines from biodynamic farming have a statistically significantly higher intensity of aroma. In other properties such as freshness, fruitiness, bitterness and acidity, no statistically significant difference between individual samples was recordeds.
Table 10.
Results of the sensory evaluation.
| Evaluator | Sample | ||||
|---|---|---|---|---|---|
| RR Z | RR VS | RM Z | RM VS | ||
| 1 | 96 | 78 | 87 | 68 | |
| 2 | 74 | 92 | 64 | 55 | |
| 3 | 88 | 79 | 84 | 78 | |
| 4 | 87 | 79 | 84 | 72 | |
| 5 | 83 | 83 | 88 | 91 | |
| 6 | 64 | 84 | 82 | 86 | |
| x̄ | 82 | 82.5 | 81.5 | 75 | |
4. Conclusions
Wines originating from biodynamic and integrated production were analyzed for phenolic profile. A statistically significant difference between the values of total polyphenols prevailed between all samples and higher amounts were measured in both samples from the integrated production. These results were also confirmed by the HPLC method. Analysis of individual phenolic substances also shows a statistically significant difference in some species. For most of the determined substances, higher values were found in integrated production, in some cases the differences between samples from organic and integrated were not statistically significant. Only for 2,3-dihydroxybenzoic acid and 4-hydroxybenzoic acid a higher amount was recorded in the white and red wine samples in organic quality.
The results of the antioxidant capacity analyses obtained by the ABTS and FRAP methods were in agreement. When comparing white wine samples, no statistically significant difference was noted. A higher antioxidant capacity within red wines was measured in the RM Z sample from integrated production. The DPPH method also confirmed the higher activity of the sample from the integrated production of the red variety. However, in contrast to ABTS and FRAP, there was also a statistically significant difference between the white wine samples, with a higher value being determined for the RR Z sample from integrated production.
The sensory analysis of the wines did not reveal defects affecting the quality of the wines. The results show that some evaluators preferred wine samples from organic production only, while others, on the contrary, from integrated production. Most labeled organic wines as lighter and less alcoholic, which is also confirmed by the alcohol values that were given on the label or obtained by measuring with an ebuloscope.
It is known that organic wines have a minimum content of sulfites. A lower amount for organic wines was confirmed for white wines, in the case of reds, the RM Z sample from integrated production contained less total SO2.
The analysis of phenolic substances in wines using the HPLC method confirmed the influence of processing technology - red wines achieved higher values than white wines.
Most of the analyzes carried out as part of this work did not confirm the studies of some experts and the claim that organic wines contain more bioactive body beneficial substances. The same conclusions were reached by many other experts who devoted themselves to comparing different types of farming. Integrated production is a kind of intermediate stage between conventional and ecological production. Minimal or no differences between samples can thus indicate a high degree of careful management in integrated winemaking.
Author Contributions
Conceptualization, D.D. and L.K.; methodology, A.Z. and S.D.; software, L.K.; validation, D.D., L.K. and A.Z.; formal analysis, A.Z. and S.C.Z.; investigation, L.K.; resources, B.T.; data curation, S.D. and S.C.Z.; writing—original draft preparation, L.K. and D.D.; writing—review and editing, L.K., D.D. and S.C.Z.; visualization, L.K.; supervision, B.T.; project administration, B.T.; funding acquisition, B.T. All authors have read and agreed to the published version of the manuscript.
Funding
This research was funded by project FVHE/Tremlová/2023ITA23 from the University of Veterinary Sciences Brno, Czech Republic and by project MZE-RO0423 funded by the Ministry of Agriculture, Czech Republic.
Conflicts of Interest
The authors declare no conflict of interest.
References
- Pavloušek, P. Výroba vína u malovinařů, 2nd ed.; Grada Publishing a. s.: Praha, Czech Republic; 2010, 128 p., ISBN 978-80-247-3487-3.
- Šarapatka, B., Urban, J. Ekologické zemědělství v praxi, PRO-BIO: Šumperk, Czech Republic, 2006; 502 p., ISBN: 80-87080-00-9.
- Hradil, R., Pavloušek, P., Muška, F., Rudolfský, L. Biodynamické vinohradnictví a vinařství, 1st ed; Grada Publishing a. s.: Praha, Czech Republic, 2018; 144 p., ISBN 978-80-271-0418-5.
- Domin, J., Furdíková, K., Báleš V. et al. Hrozno a víno ekologicky, VÍNO NATURAL Domin & Kušický s.r.o: Bratislava, Slovakia, 2017; 352 p., ISBN: 978-80-972706-1-2.
- Lippi, Giuseppe, Franchini, M. And A Guidi, G. C., Red wine and cardiovascular health: the “French Paradox ” revisited. International Journal of Wine Research. 2010, Vol. 2, pp.1-7. https://doi.org/10.2147/IJWR.S8159. [CrossRef]
- Guilford, Jacquelyn M.; Pezzuto, John M. Wine and health: A review. American Journal of Enology and Viticulture, 2011, Vol. 62(4), 471-486. DOI: 10.5344/ajev.2011.11013. [CrossRef]
- Snopek, L., Mlcek, J., Sochorova, L., Baron, M., Hlavacova, I., Jurikova, T., Kizek, R., Sedlackova, E. & Sochor, J. Contribution of red wine consumption to human health protection. Molecules. 2018, Vol. 23(7), doi:10.3390/molecules23071684. [CrossRef]
- Farkaš, Ján. Všetko o víne. Neografie: Martin, Slovakia, 1998, ISBN: 80-88892-16-3.
- Arribas, A. S., Martinez-Fernandez, M., Chicharro, M. The role of electroanalytical techniques in analysis of polyphenols in wine. TrAC Trends in Analytical Chemistry, 2012, Vol. 34, pp. 78-96.
- Kraus, V. et al. Encyklopedie českého a moravského vína. 1st ed.; Mystica: Praha, Czech Republic; 2007, 306 p., ISBN 80-86-67-00-0.
- Lipský, Z. Biovíno z Kutné Hory, Veronica. 2012, Vol. 4, p. 20, http://www.casopisveronica.cz/clanek.php?id=738 .
- Tomadoni, B., Cassani, L., Ponce, A., Moreira, M. D. R., & Agüero, M. V. Optimization of ultrasound, vanillin and pomegranate extract treatment for shelf-stable unpasteurized strawberry juice. LWT-Food Science and Technology. 2016, Vol. 72, pp. 475-484, https://doi.org/10.1016/j.lwt.2016.05.024 . [CrossRef]
- Thaipong, K., Boonprakob, U., Crosby, K., Cisneros-Zevallos, L., & Byrne, D. H. Comparison of ABTS, DPPH, FRAP, and ORAC assays for estimating antioxidant activity from guava fruit extracts. Journal of food composition and analysis. 2006, Vol. 19(6-7), pp. 669-675, https://doi.org/10.1016/j.jfca.2006.01.003 . [CrossRef]
- Brand-Williams, Wendy, Cuvelier Marie-Elisabeth And Berset C. L. W. T. Use of a free radical method to evaluate antioxidant activity. LWT-Food science and Technology. 1995, Vol. 28(1), pp. 25-30.
- Behbahani, B.A.; Shahidi, F.; Yazdi, F.T.; Mortazavi, S.A.; Mohebbi, M. Use of Plantago major seed mucilage as a novel edible coating incorporated with Anethum graveolens essential oil on shelf life extension of beef in refrigerated storage. Int. J. Biol. Macromol. 2017, Vol. 94, pp. 515–526.
- Gómez-Estaca, J., Bravo, L., Gómez-Guillén, M. C., Alemán, A., & Montero, P. Antioxidant properties of tuna-skin and bovinehide gelatin films induced by the addition of oregano and rosemary extracts. Food Chemistry. 2009, Vol. 112(1), pp. 18-25 https://doi.org/10.1016/j.foodchem.2008.05.034 . [CrossRef]
- Ćavar Zeljković, S., Komzáková, K., Šišková, J., Karalija, E., Smékalová, K., & Tarkowski, P. Phytochemical variability of selected basil genotypes. Industrial Crops and Products. 2020, Vol. 157(1), 112910. https://doi.org/10.1016/j.indcrop.2020.112910. [CrossRef]
- Ćavar Zeljković, S.; Štefelová, N.; Hron, K.; Doležalová, I.; Tarkowski, P. Preharvest Abiotic Stress Affects the Nutritional Value of Lettuce. Agronomy 2023, 13, 398. https://doi.org/10.3390/agronomy13020398. [CrossRef]
- O’Donoghue, E. M., Somerfield, S. D., Shaw, M., Bendall, M., Hedderly, D., Eason, J., & Sims, I. Evaluation of carbohydrates in Pukekohe Longkeeper and Grano cultivars of Allium cepa. Journal of Agricultural and Food Chemistry. 2004, Vol. 52(17), pp. 5383-5390. https://doi.org/10.1021/jf030832r . [CrossRef]
- Balík J.: Vinařství, návody do laboratorních cvičení. 3rd ed., Mendelova zemědělská a lesnická univerzita v Brně: Brno, Czech Republic, 2006. 98 p., ISBN 80-7157-933-5.
- Cepeda, E., Villaran, M. C. Density and viscosity of Malus floribunda juice as a function of concentration and temperature. Journal of Food Engineering. 1999, Vol. 41(2), pp. 103-107, https://doi.org/10.1016/S0260-8774(99)00077-1. [CrossRef]
- Jamroz, A., Bełtowski, J. Antioxidant capacity of selected wines. Medical Science Monitor. 2001, Vol.7(6), pp. 1198-1202, https://www.medscimonit.com/abstract/index/idArt/508047.
- Lino, F. M. A., De Sá, L. Z., Torres, I. M. S., Rocha, M. L., Dinis, T. C. P., Ghedini, P. C., ... & Gil, E. S. Voltammetric and spectrometric determination of antioxidant capacity of selected wines. Electrochimica Acta. 2014, Vol.128, pp. 25-31. https://doi.org/10.1016/j.electacta.2013.08.109. [CrossRef]
- Ghiselli, A., Nardini, M., Baldi, A., Scaccini, C., Antioxidant activity of different phenolic fractions separated from an Italian red wine. Journal of agricultural and food chemistry. 1998, Vol. 46(2), pp. 361-367, https://doi.org/10.1021/jf970486b. [CrossRef]
- Di Majo, D., La Guardia, M., Giammanco, S., La Neve, L., Giammanco, M.. The antioxidant capacity of red wine in relationship with its polyphenolic constituents. Food Chemistry. 2008, Vol. 111(1), pp. 45-49, https://doi.org/10.1016/j.foodchem.2008.03.037. [CrossRef]
- Minussi, R. C., Rossi, M., Bologna, L., Cordi, L., Rotilio, D., Pastore, G. M., Durán, N., Phenolic compounds and total antioxidant potential of commercial wines. Food chemistry. 2003, Vol. 82(3), pp. 409-416, https://doi.org/10.1016/S0308-8146(02)00590-3. [CrossRef]
- Li, H., Wang, X., Li, Y., Li, P., Wang, H. et al. Polyphenolic compounds and antioxidant properties of selected China wines. Food chemistry. 2009, Vol. 112(2), pp. 454-460, https://doi.org/10.1016/j.foodchem.2008.05.111. [CrossRef]
- Meng, J. F., Fang, Y. L., Qin, M. Y., Zhuang, X. F., Zhang, Z. W. Varietal differences among the phenolic profiles and antioxidant properties of four cultivars of spine grape (Vitis davidii Foex) in Chongyi County (China). Food Chemistry. 2012, Vol. 134(4), pp. 2049-2056, https://doi.org/10.1016/j.foodchem.2012.04.005. [CrossRef]
- Haseeb, S., Alexander, B., Baranchuk, A. Wine and cardiovascular health: A comprehensive review. Circulation. 2017, Vol. 136(15), pp. 1434-1448, https://doi.org/10.1161/CIRCULATIONAHA.117.030387. [CrossRef]
- Markoski, M., Garavaglia, J., Oliveira, A., Olivaes, J., Marcadenti, A. Molecular properties of red wine compounds and cardiometabolic benefits. Nutrition and metabolic insights. 2016, Vol. 9, pp. 51-57, https://doi.org/10.4137/NMI.S32909. [CrossRef]
- Tinttunen, S., Lehtonen, P. Distinguishing organic wines from normal wines on the basis of concentrations of phenolic compounds and spectral data. European Food Research and Technology. 2001, Vol. 212(3), pp. 390-394 https://doi.org/10.1007/s002170000265. [CrossRef]
- Pasvanka, K., Tzachristas, A., Proestos, Ch. Quality tools in wine traceability and authenticity. In: Quality Control in the Beverage Industry. Academic Press, 2019. pp. 289-334.
- Shahidi, F., Naczk, M. Foods phenolics. Sources, Chemistry, Effects, Application. Tecnnomic, Publishing CO. Inc Eds. Lancaster: Pennsylvania, USA, 1995.
- Merkyté, V. et al. Phenolic Compounds as Markers of Wine Quality and Authenticity. Foods, 2020, Vol. 9(12), 1785, https://doi.org/10.3390/foods9121785. [CrossRef]
- Gutiérrez-Escobar, R., Aliaño-González, M. J., Cantos-Villar, E. Wine polyphenol content and its influence on wine quality and properties: A review. Molecules. 2021, Vol. 26(3), 718, https://doi.org/10.3390/molecules26030718. [CrossRef]
- Dutra, M. D. C. P., Rodrigues, L. L., de Oliveira, D., Pereira, G. E., dos Santos Lima, M. Integrated analyses of phenolic compounds and minerals of Brazilian organic and conventional grape juices and wines: Validation of a method for determination of Cu, Fe and Mn. Food Chemistry, 2018, Vol. 269, pp. 157-165, https://doi.org/10.1016/j.foodchem.2018.07.014. [CrossRef]
- Kalkan, H., Kilinç, E., Özsöz, M. Identification and Quantification of some Wine Phenolic Acids by High-Performance Liquid Chromatography Equipped with Electrochemical Detector. Acta Pharmaceutica Sciencia. 2003, Vol. 45(2), pp. 111-124.
- Kilinc, E., Kalkan, H. High-performance liquid chromatographic determination of some phenolic acids of Turkish commercial wines: an electrochemical approach. Journal of Wine Research. 2003. Vol. 14(1), pp. 17-23, https://doi.org/10.1080/0957126032000114982. [CrossRef]
- Rentzsch, M., Wilkens, A., Winterhalter, P. Non-flavonoid Phenolic Compounds. In: Moreno-Arribas, M.V., Polo, M.C. (eds) Wine Chemistry and Biochemistry. Springer, New York, NY, 2009, https://doi.org/10.1007/978-0-387-74118-5_23. [CrossRef]
- Kumšta, M., Pavloušek, P., Kupsa, J. Phenolic profile in Czech white wines from different terroirs. Food Science and Biotechnology. 2012, Vol. 21(6), pp. 1593-1601 https://doi.org/10.1007/s10068-012-0212-0. [CrossRef]
- Minussi, R. C., Rossi, M., Bologna, L., Cordi, L., Rotilio, D., Pastore, G. M., & Durán, N. Phenolic compounds and total antioxidant potential of commercial wines. Food chemistry. 2003, Vol. 82(3), pp. 409-416, https://doi.org/10.1016/S0308-8146(02)00590-3. [CrossRef]
- Franquet-Griell, H., Checa, A., Nunez, O., Saurina, J., Hernandez-Cassou, S., & Puignou, L. Determination of polyphenols in Spanish wines by capillary zone electrophoresis. Application to wine characterization by using chemometrics. Journal of agricultural and food chemistry. 2012, Vol. 60(34), pp. 8340-8349, https://doi.org/10.1021/jf302078j. [CrossRef]
- Ribéreau-Gayon, P., Lafon-Lafourcade,S. and Bertrand A. Le débourbage des moûts de vendange blanche. Journal international des sciences de la vigne et du vin, 1975, Vol. 9(2), pp. 117-139, https://doi.org/10.20870/oeno-one.1975.9.2.1807. [CrossRef]
- Singleton, V. L., Timberlake, C. F., Lea, A. G. H. The phenolic cinnamates of white grapes and wine. Journal of the Science of Food and Agriculture. 1978, Vol. 29(4), pp. 403-410, https://doi.org/10.1002/jsfa.2740290416. [CrossRef]
- Burda, K., Collins, M. Adulteration of wine with sorbitol and apple juice. Journal of food protection. 1991, Vol. 54(5), pp. 381-382, https://doi.org/10.4315/0362-028X-54.5.381. [CrossRef]
- Pavlović, A. et al. The determination of salicylic acid in wines using a ligand-exchange reaction. Savremene tehnologije, 2014, Vol. 3(1), pp. 11-15, https://doi.org/10.5937/savteh1401011P. [CrossRef]
- Nikfardjam, M. P., Patz, C. D., Kauer, R., Schultz, H., & Dietrich, H. A modified HPLC method to detect salicylic acid in must and wine after its application in the field to induce fungus resistance. VITIS-Journal of Grapevine Research. 1999, Vol. 38(4), pp. 179-182, https://doi.org/10.5073/vitis.1999.38.179-182. [CrossRef]
- Nikfardjam, M. S. P., Koler, H. J., Schmitt, A., Patz, C. D., & Dieter, C. L. A. U. S. Polyphenolic composition of German white wines and its use for the identification of cultivar. Mitteilungen Klosterneuburg. 2007, Vol. 57, pp. 146-152.
- Sergazy, S. et al. Comparison of phenolic content in cabernet Sauvignon and Saperavi wines, Journal of Microbiology, Biotechnology and Food Sciences. 2019, Vol. 9(3), pp. 557-561, https://doi.org/10.15414/jmbfs.2019/20.9.3.557-561. [CrossRef]
- Kupsa, J., Pavloušek, P., Kumšta, M., Lampíř, L. Phenolic profiles of Riesling wines originating from different terroirs of the Czech Republic. Mitt. Klosterneubg. 2017, Vol. 67(3), pp. 182-193, http://weinobstklosterneuburg.at/.
- Alam, M. A., Subhan, N., Rahman, M. M., Uddin, S. J., Reza, H. M., & Sarker, S. D. Effect of citrus flavonoids, naringin and naringenin, on metabolic syndrome and their mechanisms of action. Advances in Nutrition. 2014, Vol. 5(4), pp. 404-417, https://doi.org/10.3945/an.113.005603. [CrossRef]
- Simonetti, P., Pietta, P., Testolin, G. Polyphenol content and total antioxidant potential of selected Italian wines. Journal of Agricultural and Food Chemistry. 1997, Vol. 45(4), pp. 1152-1155, https://doi.org/10.1021/jf960705d. [CrossRef]
- Wilmsen, P. K., Spada, D.S., Salvador, M. Antioxidant activity of the flavonoid hesperidin in chemical and biological systems. Journal of agricultural and food chemistry. 2005, Vol. 53(12), pp. 4757-4761, https://doi.org/10.1021/jf0502000. [CrossRef]
- Moreno, J., Peinad, R. Enological chemistry. USA: Academic Press, 2012, ISBN: 978-0-12-388438-1.
- Schanderl, H. Die Mikrobiologie des Weines. 1950, Vol. 2. Eugen Ulmer.
- Michlovský, M. Lexikon chemického složení vína. Vinselekt Michlovský: Rakvice, Czech Republic, 2014, ISBN: 978-80-905319-2-5.
- Evers, M. S., Roullier-Gall, C., Morge, C., Sparrow, C., Gobert, A., Alexandre, H. Vitamins in wine: Which, what for, and how much?. Comprehensive Reviews in Food Science and Food Safety. 2021, Vol. 20(3), pp. 2991-3035. https://doi.org/10.1111/1541-4337.12743. [CrossRef]
- Hall, A. P., Brinner, L., Amerine, M. A., & Morgan, A. F. The B vitamin content of grapes, musts and wines. Food Research. 1956, Vol. 21(3), pp. 362-371, https://doi.org/10.1111/j.1365-2621.1956.tb16932.x. [CrossRef]
- Ournac, A. Les vitamines du vin. Annales de la Nutrition et de l’Alimentation. Centre National De La Recherche Scientifique, 1970, Vol. 24, pp. B333-B365, https://www.jstor.org/stable/45124514.
- Light-Struck Defect, 2014. Enartis Vinquiry ,pp. 1-3. Online: https://www.enartis.com/wp-content/uploads/2019/05/151218161644.pdf.
- Hagen, K. M., Keller, M., Edwards, C. G. Survey of biotin, pantothenic acid, and assimilable nitrogen in winegrapes from the Pacific Northwest. American Journal of Enology and Viticulture. 2008, Vol. 59(4), pp. 432–436, http://www.ajevonline.org/content/59/4/432.
- Moreno-Arribas, M. et al. Wine chemistry and biochemistry. Springer: New York, NY, USA, 2009, ISBN: 978-0-387-74116-1.
- Berthels, N. J. et al. Discrepancy in glucose and fructose utilisation during fermentation by Saccharomyces cerevisiae wine yeast strains. FEMS yeast research, 2004, Vol. 4(7), pp. 683-689, https://doi.org/10.1016/j.femsyr.2004.02.005. [CrossRef]
- Martin, K. R., Rasmussen, K. K. Comparison of sensory qualities of geographically paired organic and conventional red wines from the southwestern US with differing total polyphenol concentrations: A randomized pilot study. Food and Nutrition Sciences. 2011, Vol. 2(10), pp. 1150-1159, https://doi.org/10.4236/fns.2011.210154. [CrossRef]
- Furdikova, K., Malik, F. Sulfur Cycle of Wine. Chemické listy. 2009, Vol. 103(2), pp. 154−158.
- Barbe, J. Ch., et al. Role of carbonyl compounds in SO2 binding phenomena in musts and wines from botrytized grapes. Journal of agricultural and food chemistry, 2000, Vol. 48(8), pp. 3413-3419.
- Spricigo, R., et al. Electrocatalytic sulfite biosensor with human sulfite oxidase co-immobilized with cytochrome c in a polyelectrolyte-containing multilayer. Analytical and bioanalytical chemistry. 2009, Vol. 393, pp. 225-233.
- Vally, H., Misso, N. L., Madan, V. Clinical effects of sulphite additives. Clinical & Experimental Allergy. 2009, Vol. 39(11), pp. 1643-1651.
- Giosanu, D., Vîjan, L.E. The appreciation of red wines quality in terms of chemical and chromatic parameters. The contribution of ethanol, density and glycerol on the viscosity of wines. Annals of “Dunărea de Jos”, University of Galati, Mathematics, physics, theoretical mechanics. 2011, Vol. 34(2), pp. 1-4.
- Fritz, J. et al. Wine quality under integrated, organic and biodynamic management using image-forming methods and sensory analysis. Chemical and Biological Technologies in Agriculture. 2021, Vol. 8(62), pp. 1-15, https://doi.org/10.1186/s40538-021-00261-4. [CrossRef]
Disclaimer/Publisher’s Note: The statements, opinions and data contained in all publications are solely those of the individual author(s) and contributor(s) and not of MDPI and/or the editor(s). MDPI and/or the editor(s) disclaim responsibility for any injury to people or property resulting from any ideas, methods, instructions or products referred to in the content. |
© 2023 by the authors. Licensee MDPI, Basel, Switzerland. This article is an open access article distributed under the terms and conditions of the Creative Commons Attribution (CC BY) license (http://creativecommons.org/licenses/by/4.0/).
Copyright: This open access article is published under a Creative Commons CC BY 4.0 license, which permit the free download, distribution, and reuse, provided that the author and preprint are cited in any reuse.


