Submitted:
28 July 2023
Posted:
01 August 2023
You are already at the latest version
Abstract
AgW materials exhibit excellent properties and are widely used as contact materials in low- and medium-voltage switches. In this study, a pre-sintering and infiltration method was employed to pre-sinter W powder with Cu, Ni, and (Cu+Ni) addition in the low temperature range of 950–1050 °C. The low-temperature sintering behaviours of W skeletons with different additives were investigated. Subsequently, AgW70, AgW75, AgW80, and AgW85 materials were prepared through infiltration at 1050 °C. The microstructure morphology and physical properties of high-W contact materials were investigated using a metallographic microscope and scanning electron microscope. The mechanism of low-temperature sintering-infiltration of high-W contact materials was elucidated. The results indicated that pure W and 1% Cu-added W skeletons experience minimal linear shrinkage within the temperature range of 950–1050 °C. The linear shrinkage curves of W skeletons with different additives coincided under the conditions of 950–1000 °C/90 min. At 1050 °C, after sintering for 150 min, the particle boundaries in the W skeleton were fully spheroidised, with a dihedral angle of 120°. At 1050 °C and after 150 min of infiltration, cross-sectional micrographs of the AgW material revealed the presence of irregular Ni layers, where Ni spatially enveloped/encapsulated Ag. With an increase in the W content, the electrical conductivity and relative density of AgW(70–85) materials decreased, whereas the hardness of the materials increased.
Keywords:
W skeleton
; pre-sintering and infiltration method
; linear shrinkage
; dihedral angle
; AgW contact material
1. .Introduction
Because of its high melting point of 3422 °C, W has become the preferred material in applications such as heating, electrical, and welding [1]. Pure W requires a sintering temperature as high as 2700 °C to be sintered to full density. Such high temperatures impose limitations on the fabrication/preparation of W materials that are sintered to full density. Low-temperature sintering techniques for W have been investigated extensively. German [2] investigated low-temperature sintering of W in the temperature range of 1050–1400 °C. The study demonstrated that the addition of Group VIII transition metals such as Ni, Pd, Pt, Co, and Fe can enhance the sintering kinetics of W powder, reducing its sintering temperature. Notably, Pd was found to be the most effective activated sintering additive. Boonyongmaneerat [1] utilised Ni and Fe as additives for activated sintering of W in the temperature range of 1177–1250 °C. As the Ni content increased, the activation energy decreased, and the diffusion coefficient increased, indicating that Ni-doped W exhibited superior sintering kinetics compared with Fe and (Fe+Ni) doping. Hwang [3] studied the microstructure of pure W and Ni-doped W at a sintering temperature of 1200 °C. The microstructure of pure W exhibited a polycrystalline grain boundary and multiphase surface structure, whereas the Ni-doped grains exhibited reduced polycrystalline grain boundaries and a more rounded surface. This indicates that the Ni-induced grain boundary structural transition can lead to the activated sintering of W.
The combination of W and Ag offers the advantages of W’s high melting point, arc corrosion resistance, high oxidation resistance, and high hardness, along with Ag’s high electrical and thermal conductivity, as well as its excellent ductility. AgW materials exhibit excellent comprehensive performance and can serve as substitutes for pure Ag or Ag alloy contact materials in switch applications, reducing the consumption of Ag. Consequently, AgW has become an indispensable key material in low-voltage electrical switches [4,5,6,7]. AgW materials’ ‘self-spontaneous sweating cooling’ mechanism allows their utilisation at temperatures exceeding 3000 °C, making them useful in fields such as aerospace, electronic engineering, and metallurgy. The preparation methods include the mixed-pressing sintering method [8], the infiltration method [9,10,11,12,13,14], the activated liquid-phase sintering method [15,16], mechanical alloying [17,18,19], the chemical co-precipitation-hydrogen reduction method [20,21], and the sol-gel method [22,23]. The infiltration method is one of the primary techniques for producing AgW composite materials. Owing to the immiscibility of W and Ag, their sintering performance is relatively poor, making it challenging to sinter them to full density and form a homogeneous microstructure. Compared with conventional powder metallurgy methods, the infiltration method has advantages such as a high density, good sintering performance, and excellent electrical and thermal conductivity. However, in most studies, the infiltration temperature ranged from 1150 to 1350 °C, and the W content of the prepared AgW materials was in the range of 50%–75%. There is a scarcity of literature on low-temperature sintering-infiltration below 1100 °C.
In this study, the sintering of W with the addition of Cu and Ni was investigated at temperatures ranging from 950 to 1050 °C. The optimal sintering parameters were determined through shrinkage-rate, density, and morphology analyses to obtain excellent W skeletons. Subsequently, AgW(70–85) materials were prepared through infiltration at 1050 °C, and a comprehensive analysis was conducted to investigate the physical properties, morphologies, energy spectra, and metallographic microstructures of the high-W contact materials. This study provides theoretical guidance and reduced costs for the preparation of AgW materials through low-temperature sintering-infiltration.
2. Materials and Methods
2.1. Experimental Materials and Equipment
In the experiment, W-Ag materials were prepared using the infiltration method with W powder (grade: FW-1; model: FSSS:3.0; manufacturer: Zhuzhou Jincheng Hard Alloy Co., Ltd.). The particle size of the W powder was 200 mesh. The morphologies of the W, Cu, and Ni powders are presented in Figure 1 and Figure 2.
In Figure 1, the pure W powder particles have a gradient distribution, exhibiting a polyhedral morphology with sharp boundaries and distinct edges. In Figure 2, the Cu and Ni powders exhibit uniform particle sizes and a tendency for particle aggregation.

Table 1.
Experimental equipment and manufacturers.
| Device | Model | Manufacturer |
|---|---|---|
| Electric powder compaction machine | DY-60 | Shanghai Xinnuo Instrument Group Co., Ltd. |
| Vacuum/atmosphere tube furnace | SK-G10123K-3-940 | Tianjin Zhonghuan Furnace Corp. |
| Electronic balance | FA2004 | Shenyang Kerui Yongxing Chemical Glass Instrument Co., Ltd. |
| Digital eddy current metal conductivity meter | Sigma 2008 | Xiamen Tianyan Instruments Co., Ltd. |
| Microhardness tester | HBE-3000 | Shanghai milite Precise Instrument Co., Ltd. |
2.2. Experimental Methodology
Powder mixing: 5 g of W powder was mixed with 1% (relative to the W powder mass) Ni powder, Cu powder, or Ni+Cu (with mass ratios of Ni:Cu = 1:9 and Ni:Cu = 1:1) powder or a small amount of Ag powder. The mixture was ground in a grinding bowl for 30 min to form a composite powder.
Compaction: If the porosity of the W skeleton is too high, the molten Ag cannot fill the pore volume adequately, resulting in excessive residual porosity and a reduced electrical conductivity. Conversely, if the porosity is too low, the molten Ag fills the pores completely, and the excess Ag adheres to the outer surface of the product, leading to an insufficient Ag content within the product. To achieve the desired porosity, the composite powder was compacted into cylindrical preforms using a compaction machine at a pressure of 5–9 MPa.
Sintering: The compacted samples were heated in an H2 atmosphere tube furnace at a rate of 7.5 °C/min. Pre-sintering was conducted at temperatures of 900, 950, 1000, and 1050 °C for 90, 120, and 150 min, respectively, to produce the W skeleton. To remove oxides from the mixed powder, the W powder and additives were uniformly blended and compacted into preforms, which were then subjected to sintering in a tube furnace under an H2 atmosphere. The W skeletons were sintered using the tube furnace illustrated in Figure 3.
A total of 45 samples were co-sintered with different sintering temperatures, times, and additives.
Infiltration: The W skeletons obtained under the optimal conditions were placed in an H2 atmosphere tube furnace. A certain mass of Ag powder was pressed into a Ag disc with the same diameter as the W skeletons and positioned on top of them. As the temperature reached the melting point of Ag, the liquid Ag infiltrated the W skeleton. This process led to the fabrication of contact materials, specifically AgW70, AgW75, AgW80, and AgW85. The infiltration apparatus is depicted in Figure 4.
2.3. Characterisation
The densities of the samples were measured using the Archimedes method, and the electrical conductivities were determined using a digital eddy current metal conductivity meter. The Brinell hardness of the samples was measured using a microhardness tester, and their diameters were measured using a micrometer screw gauge. The microstructure of the AgW material was examined using a Nikon-MA100N metallographic microscope, and the morphology and energy spectrum of the W skeleton and AgW material were examined using a Hitachi S-3400N scanning electron microscope.
3. Results and Analysis
3.1. Sintering Performance of W Skeletons
After the sintering, the sintering performance, including the linear shrinkage () and densification parameters (), was determined according to the measured mass and dimensions, as shown in Figure 5.
As shown in Figure 5(a), both pure W and W powder with 1% Cu addition had minimal shrinkage within the temperature range of 950–1050 °C. The curve at 950 °C for a soaking time of 90 min overlapped the curve at 1000 °C for a soaking time of 90 min, and the maximum shrinkage rate was 0.5%. This indicated that within the temperature range of 950–1000 °C, with an increase in temperature and a constant soaking time, the linear shrinkage of W skeletons with different additive ratios did not vary significantly. However, as the temperature reached 1050 °C with a 90-min soaking time, the shrinkage sharply increased. This indicated that within the temperature range of 1000–1050 °C, with an increase in the temperature and a constant sintering time, the linear shrinkage of W skeletons with different additive ratios increased with the temperature. Furthermore, the linear shrinkage increased with the sintering time and the Ni content. The W skeleton with 1% Ni addition exhibited a maximum linear shrinkage of 2.194% when soaked at 1050 °C for 150 min.
The densification parameter [24] is defined as
where represents the relative density of the compacted sample, represents the relative density after sintering, and is the densification parameter.
As shown in Figure 5(b), no significant differences were observed between the densification parameters for pure W and W with 1% Cu addition. Conversely, when Ni was present in the W powder, the densification parameter increased significantly with an increase in the Ni content. The highest densification parameter was achieved at 39.5% Ni for a soaking time of 150 min at 1050 °C. Pure W sintering requires temperatures as high as 2700 °C to achieve a similar density. Shrinkage was induced by the diffusion of W at the particle boundaries. The addition of a small amount of Ni in the W powder significantly improved the densification of W. According to the results for the sintering performance, W powder with 1% Ni addition exhibited the highest linear shrinkage rate and densification parameter when soaked at 1050 °C for 150 min.
3.2. Morphologies of Sintered W Skeletons
Under the condition of 150-min soaking at 1050 °C, the morphologies of W skeletons with different additive ratios are presented in Figure 6.
As shown in Figures 6(a)–(c), the particle boundaries of W were not fully rounded, and the microstructure consisted of irregular pores and W particles, indicating that the sintering process remained in its initial stage. In contrast, in Figure 6(d), the particle boundaries of W are predominantly rounded, and various sizes of pores exist within the W skeleton. Among the samples examined, the W skeleton with 1% Ni addition had the best morphology and porosity.
To increase the infiltration efficiency of Ag, a small amount of Ag powder was mixed uniformly with W powder, and the mixture was sintered under 150-min soaking at 1050 °C. This process formed W skeletons containing Ag, as shown in Figure 7.
In Figure 7, compared with Figure 1(b), the particle boundaries of W are predominantly rounded, and the sharp edges are blurred. Furthermore, the image shows sintering bonding between large particles, between small particles, and between large and small particles, as well as agglomerates of small particles bonded to large particles. In particular, Figure 7(a) shows noticeable sintering bonding between two W particles, which aligns with the double-sphere model. The dihedral angles between the particles shown in the figure tend to be approximately 120°. The interfacial tension and dihedral angle [25] follow the equation
where represents the solid-phase interfacial tension, represents the liquid–solid-phase interfacial tension, and represents the dihedral angle.
According to Equation (2), as the dihedral angle decreases, the liquid phase can more deeply infiltrate the solid-phase interface. When the dihedral angle is 0°, the liquid phase entirely encapsulates the solid phase. When the dihedral angle is 120°, the liquid phase cannot penetrate the solid-phase interface, resulting in solid-phase sintering only. Solid-phase sintering occurs at the contact surfaces between particles, allowing them to bond and form a strong skeleton. The reduction in the centre-to-centre distance between adjacent particles results in the overall densification and shrinkage of the powder. The strengthening effect of pre-sintering is attributed to the limited densification and inter-particle bonding arising from grain boundary diffusion [26].
3.3. Infiltration of AgW Materials
The results of infiltrating W skeletons with different additives at 1050 °C for 150 min are presented in Figure 8.
Figure 8(a) presents the infiltration with 1% Cu addition (relative to the W powder mass). As shown, the surface contour of the W skeleton disc was clear, whereas the Ag compact on the W skeleton melted and formed liquid droplets during the infiltration process. However, the liquid Ag did not penetrate the W skeleton. Subsequently, upon cooling in the furnace, the liquid Ag solidified into spheres. This suggested that Ag did not infiltrate the W skeleton with Cu addition. Figure 8(b) presents the infiltration with 1% (Cu+Ni) addition (relative to the W powder mass). The results indicated that for the sample with Ni:Cu = 1:9, the surface Ag layer was relatively thick and was convex, suggesting a relatively large wetting angle. This observation implied that during the infiltration process, Ag only partially infiltrated the W skeleton. In comparison, the sample with Ni:Cu = 1:1 had a convex surface with a smaller contact angle, indicating that Ag partially infiltrated the W skeleton, with a higher degree of infiltration compared with the Ni:Cu = 1:9 sample. Figure 8(c) presents the infiltration with 1% Ni addition (relative to the W powder mass). As shown, the surface of the sample was relatively flat, with no Ag on the side surface. However, both the upper and lower surfaces had solidified Ag structures. This indicated that Ag fully infiltrated the W skeleton.
In summary, as the Ni content in the W skeleton increased, the Ag infiltration results exhibited the following transition: no infiltration → partial infiltration → complete infiltration.
3.4. Metallographic Microstructures of AgW Materials
In this study, a small amount of Ag was added to W powder, followed by the addition of 1% Ni (relative to the W powder mass). The mixture was thoroughly blended and then compacted to form samples. Subsequently, the samples were subjected to a pre-sintering process at 1050 °C for 150 min. According to the W content, Ag compacts were prepared, and they were infiltrated at 1050 °C for 150 min to produce AgW70, AgW75, AgW80,AgW85 materials. Cross-sectional images of the metallographic microstructures are presented in Figure 9, and the longitudinal sections are presented in Figure 10.
As shown in Figure 9, Ag filled the pores in the W skeleton and was distributed uniformly. As the W content increased and the Ag content decreased, a noticeable Ag layer was present in the cross sections of AgW70 and AgW75, whereas no Ag layer was observed in the cross sections of AgW80 and AgW85.
As shown in Figure 10, a noticeable Ag layer was present in the longitudinal sections of AgW70, AgW75, and AgW80, whereas no significant Ag layer was observed in the longitudinal section of AgW85. Ag filled the pores in the W skeleton and was distributed relatively uniformly.
3.5. Morphologies and Elemental Distributions of AgW Materials
The cross-sectional and longitudinal morphologies, along with the elemental mapping, of AgW(70–85) are presented in Figure 11, Figure 12, Figure 13, Figure 14, Figure 15, Figure 16, Figure 17 and Figure 18.
Figures 11(a) and (b) present the cross-sectional morphology of AgW70, indicating a uniform distribution of W particles. A noticeable Ag layer is observed in Figure 11(b). From the elemental distribution in Figure 11(c), it is observed that apart from the distinct Ag layer, Ag is uniformly distributed in the interstices between W particles. The overall elemental mapping in Figure 11(c4) reveals that a small amount of Ni was encapsulated on the outer surface of Ag, forming a Ni layer.
Figures 12(a)–(c) present the longitudinal morphology of AgW70. Figure 12(a) shows a uniform distribution of W and Ag, with Ag filling the interstices between W particles. In Figure 12(b), a distinct Ag layer is observed on the upper surface, and the interface between Ag and W exhibits a wavy shape, indicating selective infiltration of Ag into the W skeleton. Ag did not infiltrate at the raised points of the interface; rather, the Ag infiltration points were located in the depressed regions of the interface.
Figures 13(a)–(c) present the cross-sectional morphology of AgW75. In Figures 13(a) and (c), a distinct Ag layer is observed. From the elemental distribution in Figure 13(b), it is observed that Ag was uniformly distributed in the interstices between W particles. In Figure 13(b), there is no noticeable Ag presence. Element surface scanning was performed at this location, which revealed a W content of 75.4% and a Ag content of 24.46%, matching the intended composition of the AgW75 material.
Figures 14(a)–(c) present the longitudinal morphology of AgW75. Figure 14(a) shows a uniform composition, with no noticeable defects. In Figure 14(b), a distinct Ag layer is observed. From the elemental distribution in Figure 14(b), it is observed that Ag was uniformly distributed in the interstices between W particles. The overall elemental mapping in Figure 14(d4) reveals the encapsulation of Ag by Ni, which formed a Ni layer.
Figures 15(a)–(c) present the cross-sectional morphology of AgW80. In Figures 15(a) and (b), a Ag layer is observed. The elemental distribution in Figure 15(c) is consistent with the intended composition of the AgW80 material. Furthermore, Ag was uniformly distributed in the interstices between the W particles.
Figures 16(a) and (c) present the longitudinal morphology of AgW80, which was characterised by a distinct Ag layer. Figure 16(b) shows a uniform composition, with no noticeable defects. No noticeable Ag layer was present, and Ag was uniformly distributed in the interstices between the W particles. The overall elemental mapping in Figure 16(d4) reveals the encapsulation of Ag by Ni, which formed a Ni layer.
Figures 17(a) and (b) present the cross-sectional morphology of AgW85, which was characterised by no significant Ag layer but noticeable voids. The elemental distribution in Figure 17(c) is consistent with the intended composition of the AgW80 material, with Ag uniformly distributed in the interstices between W particles. However, the distribution of Ni exhibited aggregated regions, which appeared to be distributed in patches. In the central area of Ni, no Ag was detected.
Figures 18(a), (b), and (c) illustrate the longitudinal morphology of AgW85, revealing no significant Ag layer but noticeable voids. The elemental distribution in Figure 18(d) is consistent with the intended composition of the AgW85 material, with Ag uniformly distributed in the interstices between W particles. However, the distribution of Ni exhibited aggregated regions, which appeared to be distributed in patches. In the central area of Ni, no Ag was detected. This is attributed to the relatively low Ag content, as Ag penetrated the W skeleton but did not completely fill the voids within the W skeleton, as shown in Figure 17 and Figure 18. In contrast, Ni has a melting point of 1453 °C; therefore, at the experimental temperature of 1050 °C, it did not form a liquid phase with sufficient fluidity. Conversely, the small amount of Ag formed a liquid state, and because of its good wettability with W, it fully penetrated the pores within the W skeleton. Therefore, the phenomenon of Ni encapsulating Ag is not observed in Figure 17 and Figure 18.
3.6. Physical Properties of AgW Materials
The electrical conductivity, relative density, and Brinell hardness of the AgW70, AgW75, AgW80, and AgW85 materials are presented in Figure 19.
Figure 19 indicates that as the W content increased, the Ag content decreased. Meanwhile, the relative density and electrical conductivity of the AgW materials decreased, whereas the hardness increased. Among the samples, AgW70 exhibited the highest Ag content and relative density. This is because the Ag fully infiltrated the pores of the W skeleton, minimising the porosity of the skeleton. As the Ag content decreased, the amount of Ag filling the W skeleton decreased. Thus, the residual porosity increased from AgW70 to AgW85, corresponding to a reduction in the relative density. Ag has a higher electrical conductivity than W; therefore, AgW materials with higher Ag contents exhibited higher electrical conductivity. Conversely, W has a higher hardness than Ag; thus, AgW materials with higher W contents exhibited higher hardness.
3.7. Thermo-Kinetic Analysis of W Skeleton Sintering
The interfacial energy equation is
where represents the total interfacial energy of the powder compaction, represents the specific surface (interfacial) energy, and A represents the total surface (interfacial) area of the compaction.
The total interfacial energy can be divided into two components, where the variation in interfacial energy () is caused by densification, and the variation in interfacial area () is induced by grain coarsening. The reduction in the total interfacial energy leads to the sintering phenomena of densification and grain growth and serves as the thermodynamic driving force for sintering. The addition of a small amount of Ni to the W powder significantly enhanced densification. During sintering, the W skeleton particles grew in size, and the particle boundaries transitioned from sharp corners to more rounded shapes. In this process, the excess surface energy and lattice distortion energy within the W powder compact decreased; thus, the compact had transitioned from a high-energy state to a low-energy state following sintering. Within the temperature range of 1100–1500 °C, grain boundary diffusion was the dominant mechanism for material transport during W sintering. The addition of Ni improves the wetting behaviour of Ag on W surfaces. The driving force of sintering is the reduction in the system’s surface energy [27]. At 1070 °C, the surface energy of the system decreased by 5% during the Ag infiltration.
Other driving forces of sintering include the differences in volume pressure, vacancy concentration, and vapour pressure, which are induced by the variations in particle surface curvature [28]. The pressure difference is given as
The difference in vacancy concentration is given as
The vapour pressure difference is given as
Here, γs represents the specific
surface energy of the solid (solid surface energy), represents the molar volume of vacancies, and represents the molar volume of the solid. r represents the curvature radius of the sintered neck, R is the gas constant (8.3 J/mol·K), and T represents the temperature. In Equations (4)–(6), the pressure difference, vacancy concentration difference, and vapour pressure difference are all inversely proportional to the curvature radius of the sintered neck. A smaller curvature radius leads to a larger sintering driving force, which facilitates material transport. Material transport is induced by the differing curvatures of the sintered neck interfaces. The flow of viscous substances/materials or atomic diffusion from grain boundaries reduces the particle spacing, leading to densification. Therefore, grain boundaries induce the densification and shrinkage of the W skeleton through material transport. The non-soluble sintering additives aggregate at the contact area between W particles, providing high diffusion pathways for W atoms, which reduces the activation energy for W transport. The acceleration of mass transport results in the rapid rounding of pores and grain growth. Gessinger et al. [29,30] attributed the activated sintering to enhanced grain boundary diffusion. Kaysser [31] found that the rate of grain boundary diffusion in Ni-doped W was 500–5000 times higher than that in undoped W. The enhanced grain boundary diffusion is the reason for the activated sintering in Ni-doped W.
2.8. Infiltration Mechanism Analysis
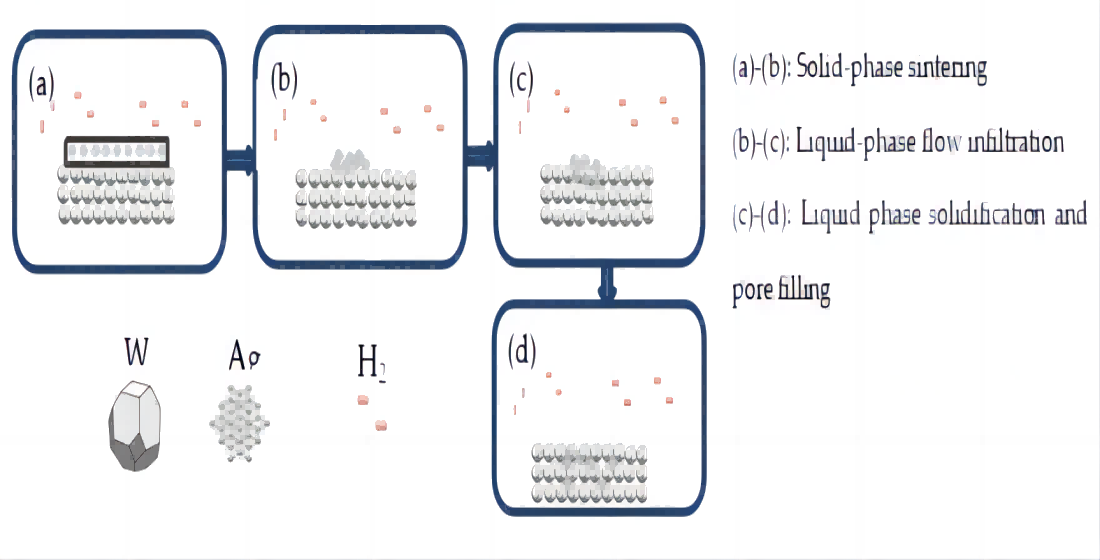
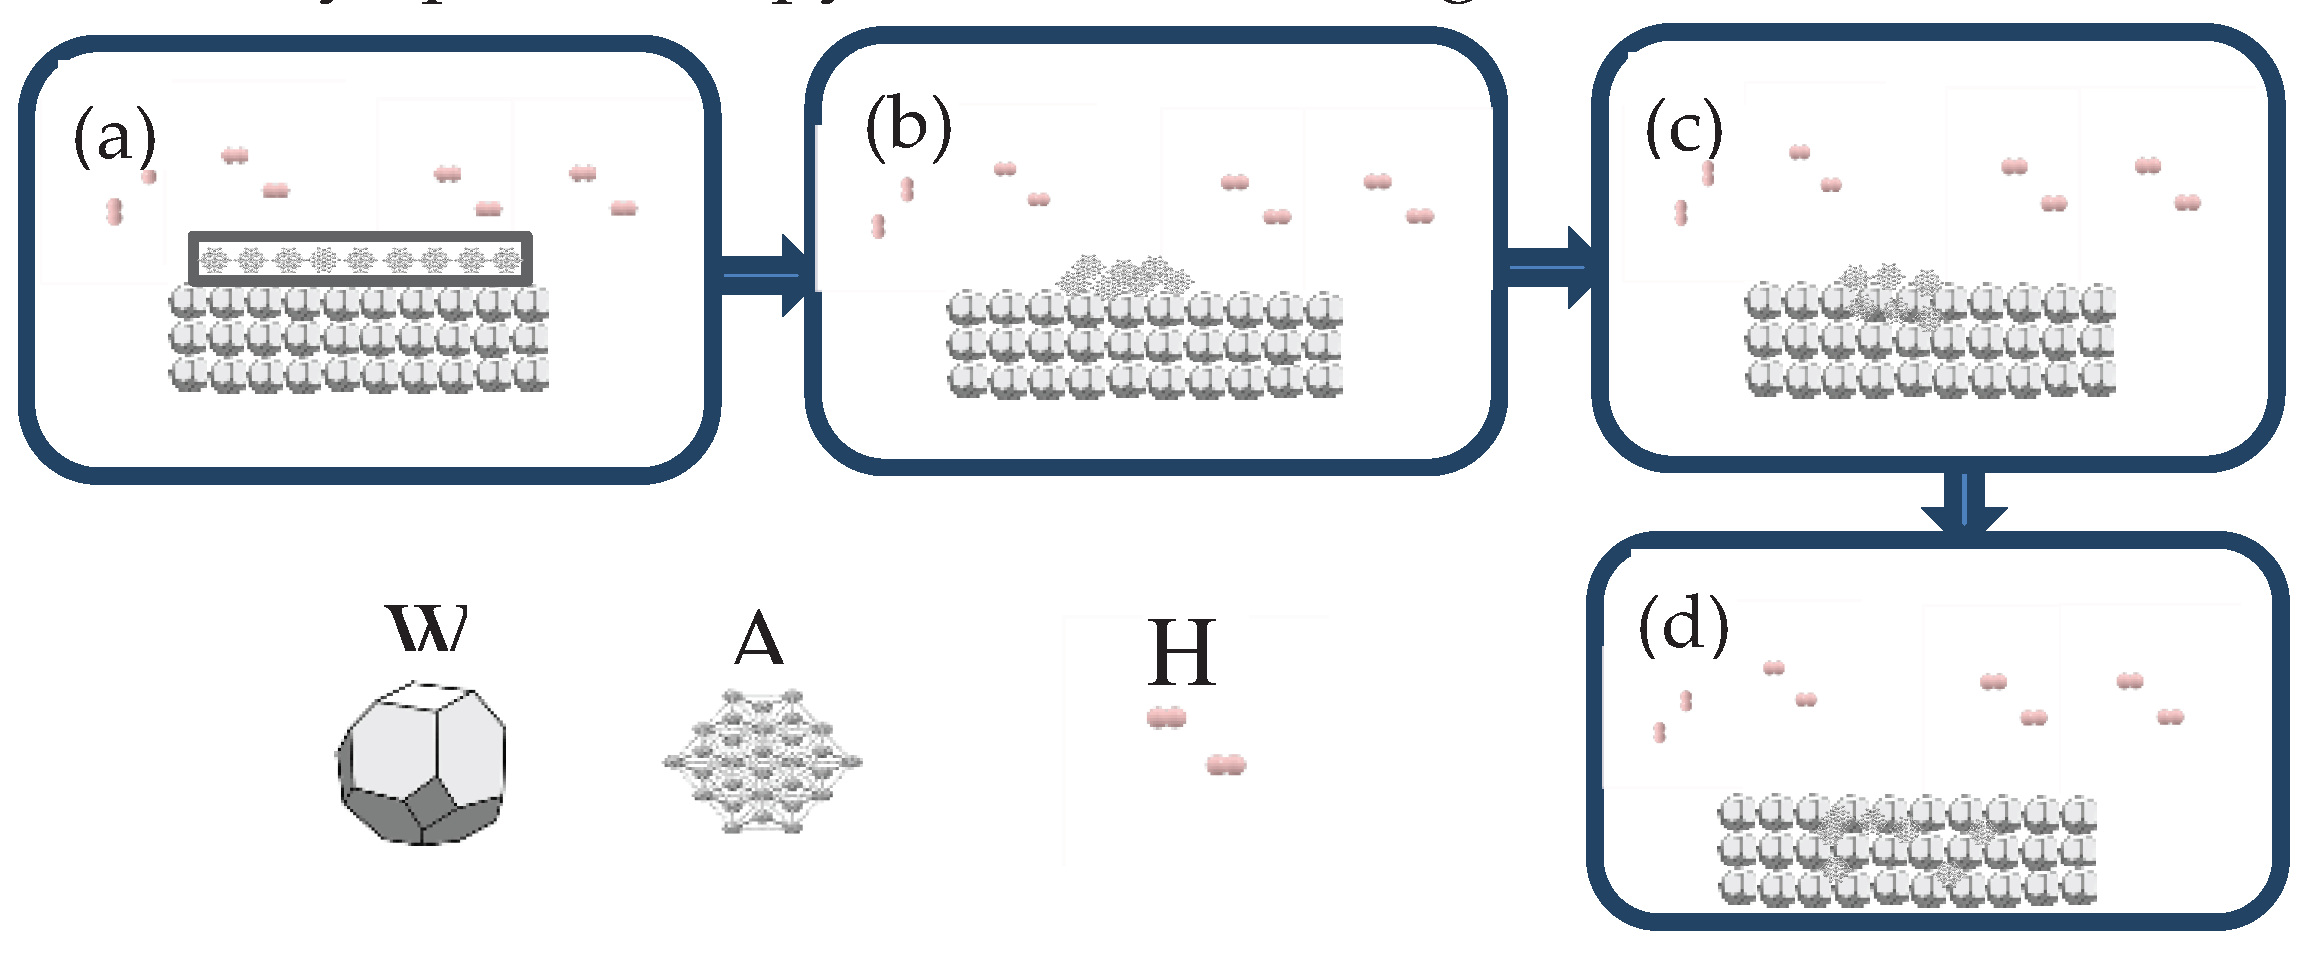
AgW70-85 materials were prepared using the infiltration method, and three stages of the infiltration process were identified through optical microscopy, scanning electron microscopy (SEM), and energy-dispersive X-ray spectroscopy, as shown in Figure 20.
Figures 20(a) and (b): Stage 1 (room temperature–960 °C)—Solid-phase sintering
Ag powder was pressed onto the W skeleton, and the sample was placed in an H2 atmosphere tube furnace for infiltration. No liquid phase was observed in the temperature range of room temperature to 960 °C. However, under Ni activation, secondary sintering of the W skeleton occurred. According to the W-Ni phase diagram, solid-phase diffusion and mutual solubility were present between the W and Ni elements. Additionally, a small amount of Ag existed in the W skeleton. Its atomic diffusion in the W skeleton followed Equations (7) and (8), which describe the diffusion of Ni in Ag and W [32].
According to the magnitude of the frequency factor, it can be inferred that diffusion of Ni in Ag was the dominant mechanism during the solid-phase sintering at this stage. As the temperature increased to 960 °C, the solid-state Ag gradually softened and liquified, reducing the wetting angle.
Figures 20(b) and (c): Stage 2 (960–1050 °C (soaking))—Liquid-phase flow infiltration
Within this temperature range, both the small amount of Ag in the W skeleton and the infiltrating Ag were in a liquid phase. Owing to the fluidity of Ag, the liquid Ag coalesced into a continuous structure, and the small amount of Ag in W functioned as a conductive agent, facilitating conduction. The addition of Ag during the pre-sintering process significantly enhanced the flowability of the infiltrating Ag, promoting densification [14]. The skeleton formed between W particles creates a network of capillaries. Under the capillary forces, the infiltrating Ag flows through/along the channels formed by Ag in the W skeleton, gradually filling the pores, which densifies the material. This process is classified as liquid-phase infiltration. Meanwhile, the Ni-encapsulated Ag particles in the W skeleton remain in the solid phase because the conditions are inadequate for alloy formation. The diffusion of Ni in Ag continues, and its rate increases with the temperature. As the temperature increases, the wettability of Ag to W improves, reducing the wetting angle. The soaking begins at 1050 °C. Ag infiltrates the W skeleton, filling the pores. At the end of this stage, the W skeleton is densified. The combined effects of liquid-phase flow and solid-phase diffusion improve the interfacial condition between particles, increasing the bonding strength of the W skeleton.
Figures 20(c) and (d): Stage 3 (1050 °C–room temperature)—Liquid-phase solidification and pore filling
This stage is known as the furnace cooling stage. After the second stage, the Ag in the W and the infiltrating Ag liquefy and fill the pores in the W skeleton, connecting to form a continuous structure. The liquid Ag solidifies, whereas Ni improves the wettability of Ag to W throughout the infiltration process and facilitates the formation of sintered necks between W particles. Consequently, the material achieves a relative density close to 100%.
4. Conclusion
W skeletons were prepared through a pre-sintering-infiltration method within the low temperature range of 950–1050 °C, followed by AgW(70–85) material preparation through infiltration at 1050 °C. The physical properties, morphologies, energy spectra, and metallographic microstructures of these high-W contact materials were investigated in detail. The following conclusions are drawn:
- (1)
- Pure W and W powder with 1% Cu addition exhibited minimal shrinkage in the temperature range of 950–1050 °C. The linear shrinkage of the sintered skeleton with the addition of (Ni:Cu = 1:9/1:1, 1% Ni) to the W powder remained relatively constant within 90 min of sintering at 950–1000 °C.
- (2)
- At 1050 °C and 150 min of sintering, The densification of the W skeleton was characterized by the complete globalization of the grain boundary with a dihedral Angle of 120°.
- (3)
- The AgW materials obtained through infiltration at 1050 °C for 150 min exhibited irregular Ni layers formed by the spatial encapsulation of Ag.
- (4)
- With an increase in the W content, the electrical conductivity and relative density of the AgW(70–85) materials decreased, whereas the hardness of the materials increased.
Author Contributions
Conceptualization, Z.J.C.; methodology, Z.J.C. and X.M.; validation, Z.J.C., X.M. and L.H.M.; formal analysis, L.H.M.; investigation, Z.J.C.; resources, L.H.M.; data curation, L.H.M.; writing—original draft preparation, Z.J.C.; writing—review and editing, X.M.; supervision, X.M. All authors have read and agreed to the published version of the manuscript.
Funding
This research was funded by This work was funded by the Technology Talent and Platform Project of Yunnan Province, grant number 2018HB110 and The Key research and development plan of Yunnan Province grant number 2022040201.
Informed Consent Statement
Not applicable.
Data Availability Statement
Not applicable.
Conflicts of Interest
The authors declare no conflict of interest. The funders had no role in the design of the study; in the collection, analyses, or interpretation of data; in the writing of the manuscript; or in the decision to publish the results.
References
- Boonyongmaneerat, Y. Effects of low-content activators on low-temperature sintering of tungsten. J. Mater. Process. Technol. 2009, 209, 4084–4087. [Google Scholar] [CrossRef]
- German, R.; Munir, Z. Enhanced low-temperature sintering of tungsten. Metallurgical Transactions A 1976, 7, 1873–1877. [Google Scholar] [CrossRef]
- Hwang, N.; Park, Y.; Kim, D. Activated sintering of nickel-doped tungsten approach by grain boundary structural transition. Scr. Mater. 2000, 42, 421–425. [Google Scholar] [CrossRef]
- Zhang, F.; Hu, Y.; Xu, L. Application and research progress of W-Ag composite materials. Mater. Rev. 2014, 28, 26–30. [Google Scholar]
- Leung, C.; Kim, H. A comparison of Ag/W, Ag/WC, and Ag/Mo electrical contacts. IEEE Trans. Components Hybrids Manuf. Technol. 1984, 7, 69–75. [Google Scholar] [CrossRef]
- Zhang, J. Electric repulsion force between contacts of high power relay based on Ag-W contact material. Electrical Engineering Materials 2021, 15–17. [Google Scholar]
- Liao, Y.; Liu, W.X.; Jiao, L.; Bai, X.P.; Feng, R.X.; Li, Z.B. Experimental study on electrical contact of AgW60, CuW60 and Cu in symmetrical and asymmetric pairing at DC 270 V/200 A. Electrical Engineering Materials 2019, 37–42. [Google Scholar]
- Han, F.; Ma, F.; Cao, Y. Handbook of Powder Metallurgy; Chemical Industry Press: Beijing, China, 2009; pp. 940–942. [Google Scholar]
- Meng, F.; Gao, J.; Wang, Y. The study on process and properties of Ag-W contact material. Mater. Rev. 2006, 20, 321–324. [Google Scholar]
- Xie, J. Powder-metallurgical Ag-W70 contact material. Materials Science and Engineering of Powder Metallurgy 1999, 228–233. [Google Scholar]
- Fan, L. An investigation on the infiltration process of Ag-W series contact material. Journal of Suzhou Institute of Silk Textile Technology 2001, 55–59. [Google Scholar]
- Zhang, D.; Qin, X.; Qin, L. Influence of skeleton preparation technology on microstructures and properties of AgW(65) contact materials. Electrical Engineering Materials 2019, 8–11. [Google Scholar]
- Xue, B. Process research on Ag exudation in preparing AgW(50) contact by filtration. Electrical Engineering Materials 2015, 8–10. [Google Scholar]
- Liu, D.G.; Meng, L.; Zou, J.X.; et al. Microstructure and properties of silver-added W-Cu prepared by infiltration sintering. Int. J. Refract. Met. Hard Mater. 2022, 108, 105947. [Google Scholar] [CrossRef]
- Qureshi, A.H.; Azhar, S.M.; Hussain, N. The effect of cobalt addition on sintering and microstructural behaviour of silver-tungsten (Ag-W) composite. J. Therm. Anal. Calorim. 2009, 99, 203–209. [Google Scholar] [CrossRef]
- Hu, K.; Chen, W. Study of AgW(75) electrical contact material with infiltration technology. Electrical Engineering Materials 2009, 12–14, 24. [Google Scholar]
- Aslanoglu, Z.; Karakas, Y.; Övecoglu, M. Switching performance of W-Ag electrical contacts fabricated by mechanical alloying. Int. J. Powder Metall. 2000, 36, 35–43. [Google Scholar]
- Da Costa, F.A.; Da Silva, A.G.P.; Filho, F.A.; et al. Synthesis of a nanocrystalline composite W-25 wt.%Ag powder by high energy milling. Powder Technol. 2008, 188, 30–33. [Google Scholar] [CrossRef]
- Da Costa, F.A.; Da Silva, A.G.P.; Filho, F.A.; et al. Solid state sintering of a W-25wt% Ag powder prepared by high energy milling16. Int. J. Refract. Met. Hard Mater. 2008, 26, 318–323. [Google Scholar] [CrossRef]
- Salc, F.; Albiston, J. Production and sintering of Ag-W composites containing Ni. Modern Developments in Powder Metallurgy 1988, 19, 75–89. [Google Scholar]
- Zeng, D.; Zhou, H. Preparation of Ag-W composite powders using chemical coprecipitation method. Journal of Central-South China Institute of Mining and Metallurgy 1991, 670–676. [Google Scholar]
- Fan, J.; Liu, J.; Yan, D. Study of process of fine-grained W-Cu composites. Powder Metallurgy Technology 2004, 83–86. [Google Scholar]
- Sahoo, P.; Kamal, S.; Singh, A.; et al. Facile chemical synthesis of W-Ag and W-Cu nanocomposites at low temperature. J. Nanosci. Nanotechnol. 2011, 11, 2506–2513. [Google Scholar] [CrossRef]
- Boonyongmaneerat, Y. Mechanical properties of partially sintered materials. Mater. Sci. Eng. A 2007, 452–453, 773–780. [Google Scholar] [CrossRef]
- Huang, P. Principles of Powder Metallurgy; Metallurgical Industry Press: Beijing, China, 2015; pp. 308–310. [Google Scholar]
- Hayden, H.; Brophy, J. Low-temperature sintering of pure tungsten and tungsten-iridium. J. Less-Common Met. 1964, 6, 214–218. [Google Scholar] [CrossRef]
- Ding, H.; Lin, B. Effects of adding copper and nickel on the sintering process and properties of W-Ag materials. Hunan Metallurgy 1989, 14–17. [Google Scholar]
- Kang, S.-J.L. Sintering: Densification, Grain Growth, and Microstructure, Butterworth-Heinemann, 2005; pp. 39–55.
- Gessinger, G.; Fischmeister, H. A modified model for the sintering of tungsten with nickel additions. J. Less-Common Met. 1972, 27, 129–141. [Google Scholar] [CrossRef]
- Gessinger, G.; Fischmeister, H.; Lukas, H. A model for second-stage liquid-phase sintering with a partially wetting liquid. Acta Metall. 1973, 21, 715–724. [Google Scholar] [CrossRef]
- Kaysse, W.; Hofmann-Amtenbrink, M.; Petzow, G. Activated Sintering, Springer: Boston, MA, USA, 1987; pp. 121–132.
- Brandes, E.; Brook, G. Smithells Metals Reference Book, 7th ed.; Elsevier, 2013.
Figure 1.
Morphology of pure W powder: (a) 20 μm; (b) 5 μm.
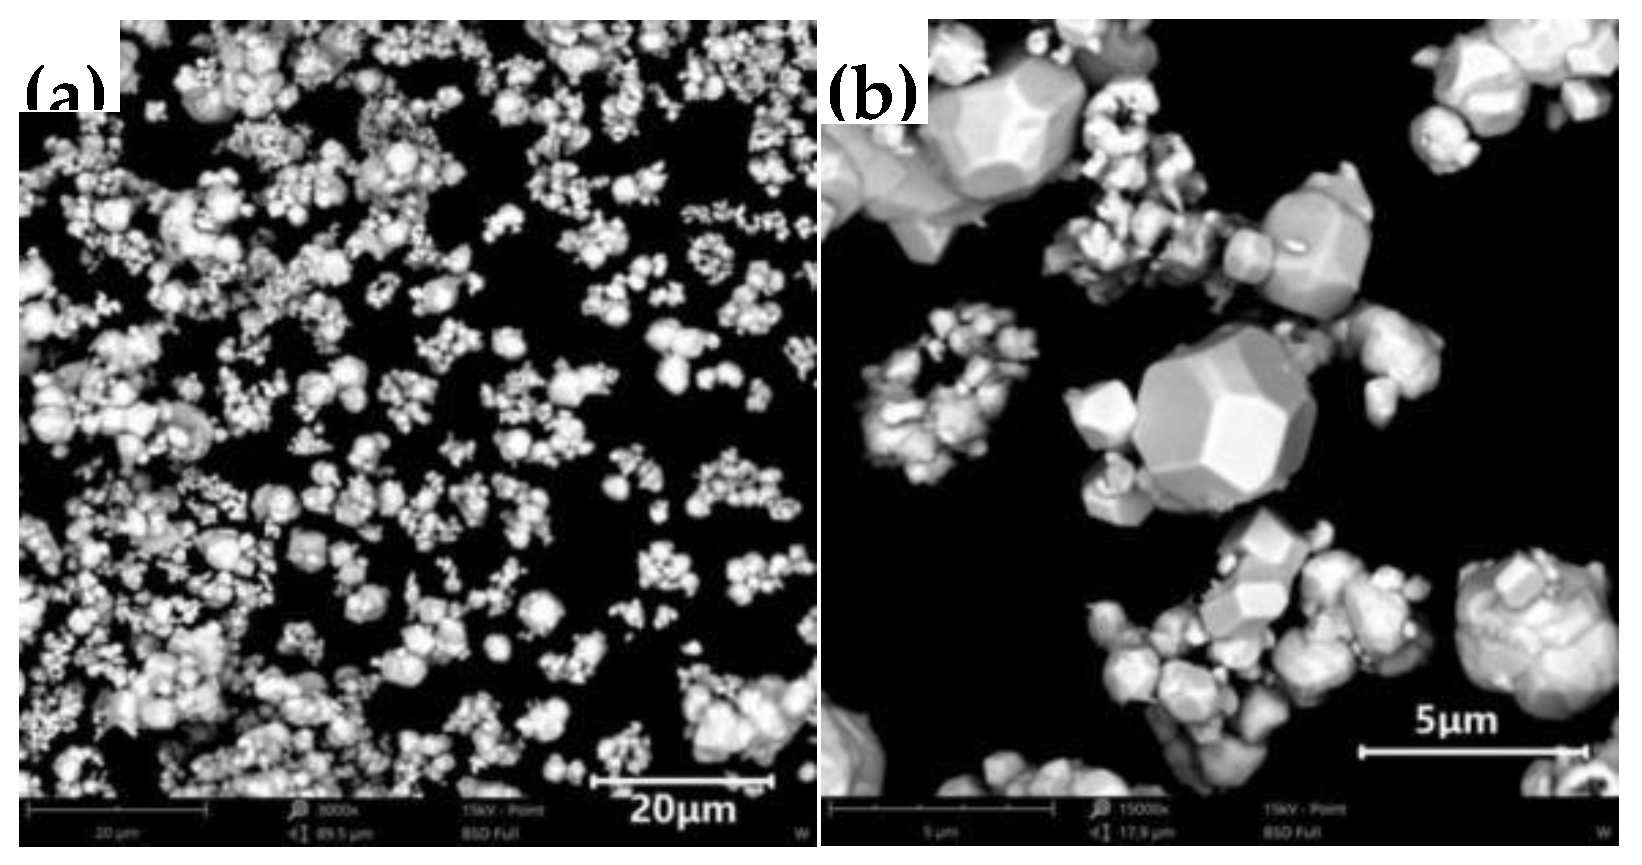
Figure 2.
Morphologies of (a) Cu and (b) Ni powders.
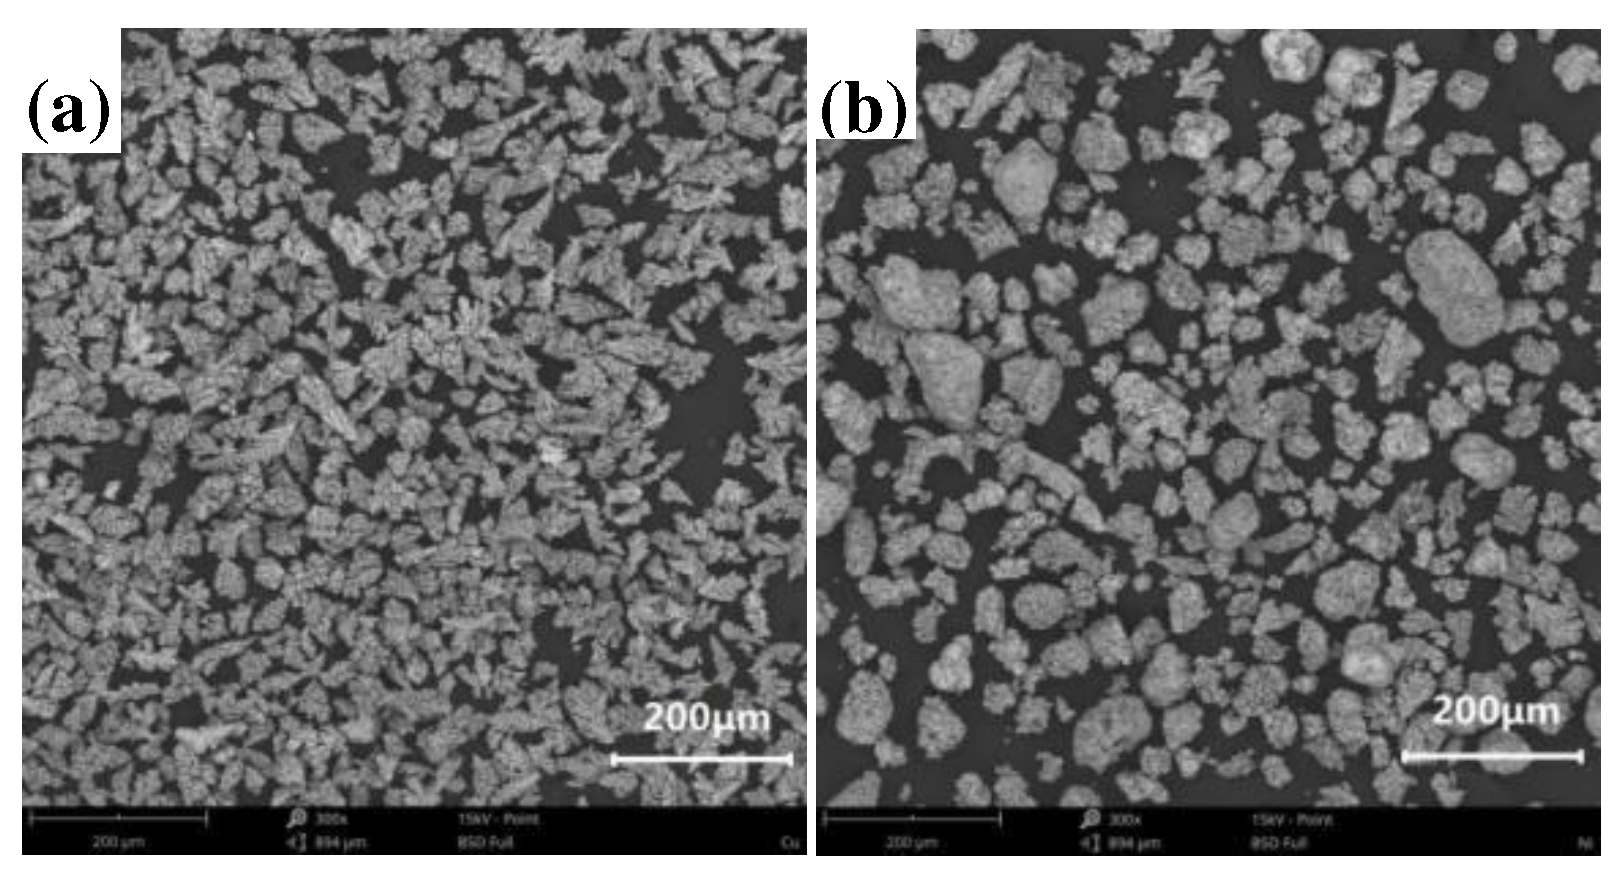
Figure 3.
Schematic of the sintering apparatus.
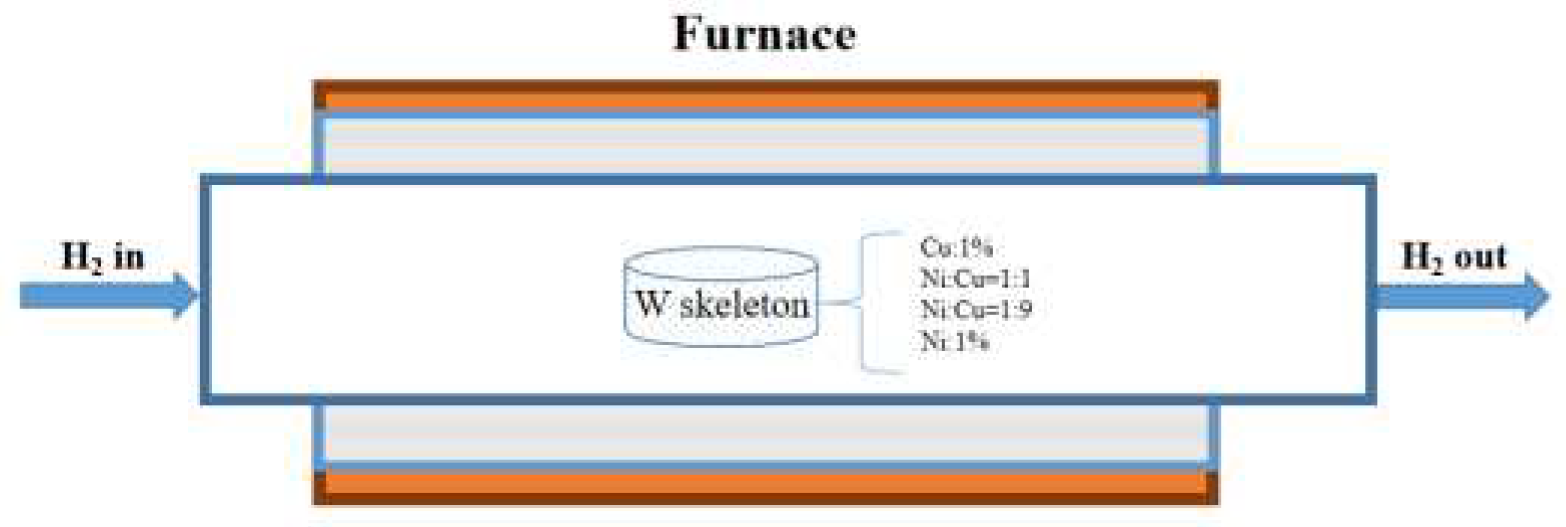
Figure 4.
Schematic of the infiltration apparatus.
Figure 5.
(a) Linear shrinkage and (b) densification parameter curves of W skeletons with different additives.
Figure 5.
(a) Linear shrinkage and (b) densification parameter curves of W skeletons with different additives.
Figure 6.
Post-sintering morphologies of W skeletons with different additive ratios: (a) 1% Cu; (b) Cu:Ni = 1:9; (c) Cu:Ni = 1:1; (d) 1% Ni.
Figure 6.
Post-sintering morphologies of W skeletons with different additive ratios: (a) 1% Cu; (b) Cu:Ni = 1:9; (c) Cu:Ni = 1:1; (d) 1% Ni.
Figure 7.
Morphology of 1% Ni-doped AgW after sintering: (a) 8 μm; (b) 2 μm; (c) 3 μm; (d) 3 μm.
Figure 8.
Infiltration of Ag into the W skeleton: (a) 1% Cu; (b) Ni:Cu = 1:9, Ni:Cu = 1:1; (c) 1% Ni.
Figure 8.
Infiltration of Ag into the W skeleton: (a) 1% Cu; (b) Ni:Cu = 1:9, Ni:Cu = 1:1; (c) 1% Ni.
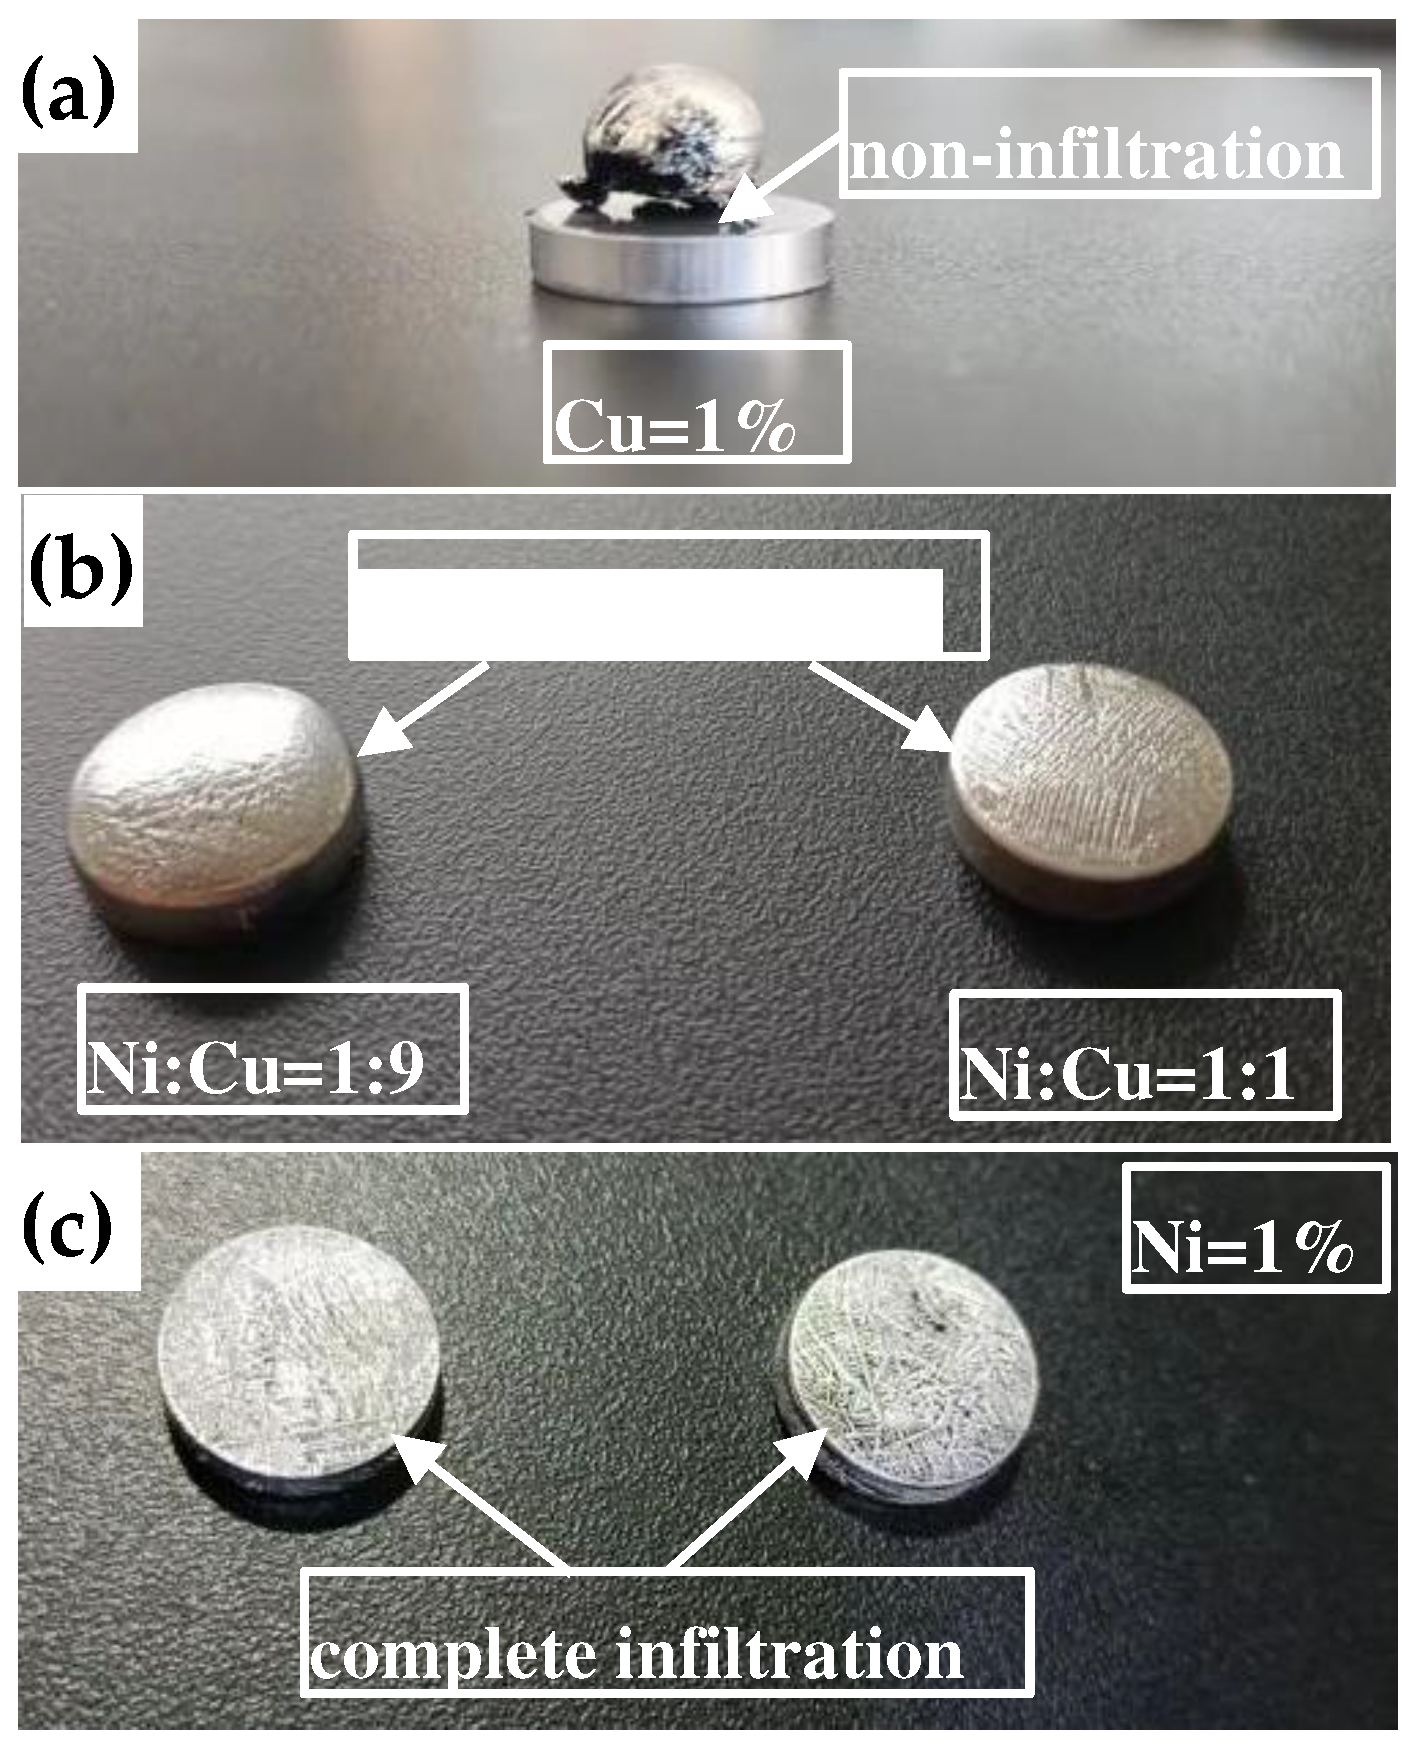
Figure 9.
Cross-section images of the metallographic microstructures of AgW materials: (a) AgW70; (b) AgW75; (c) AgW80; (d) AgW85.
Figure 9.
Cross-section images of the metallographic microstructures of AgW materials: (a) AgW70; (b) AgW75; (c) AgW80; (d) AgW85.
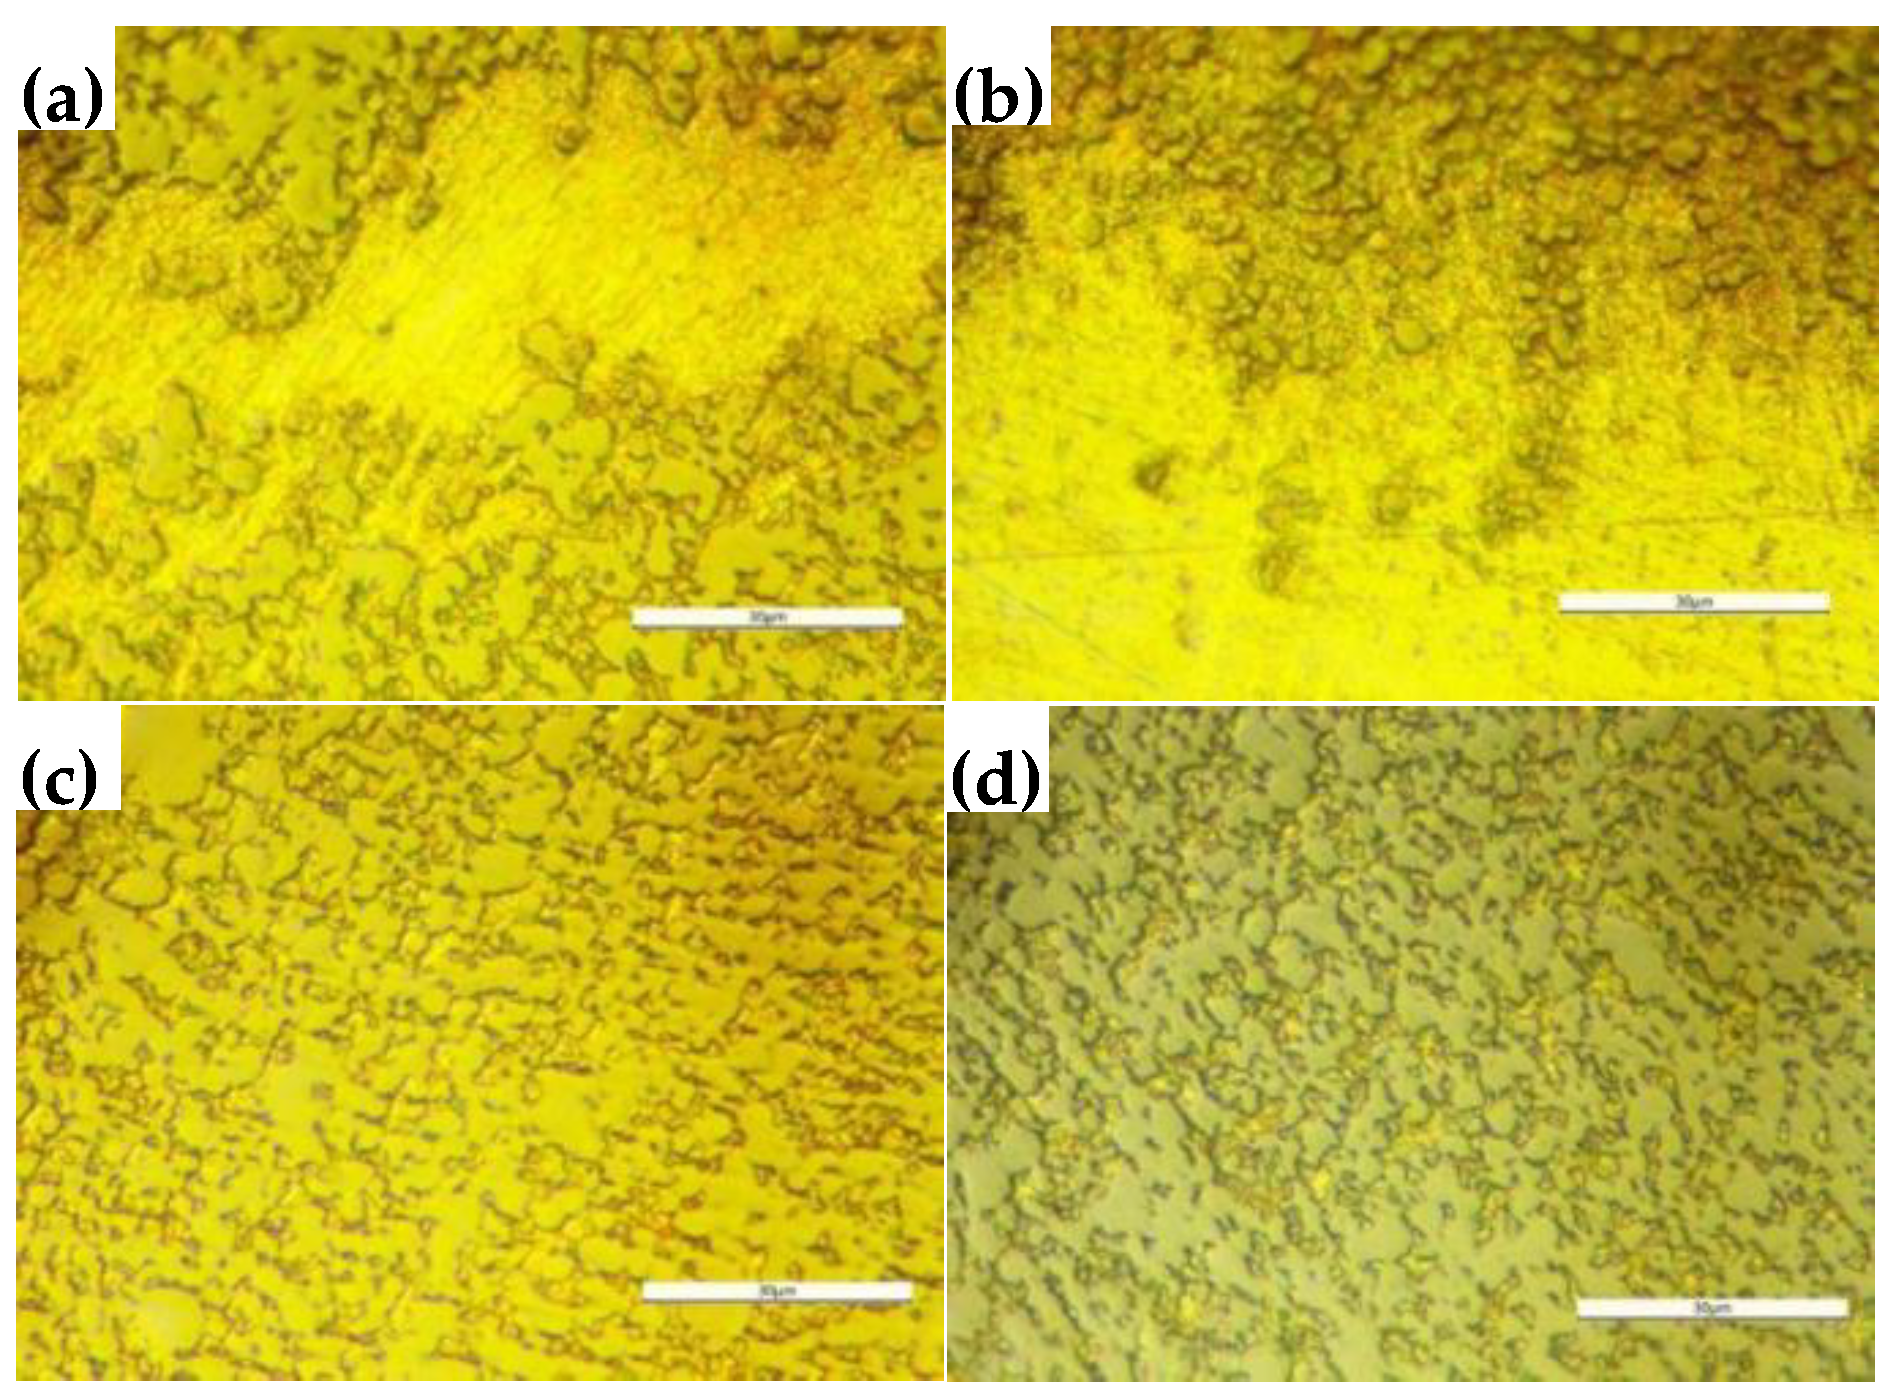
Figure 10.
Longitudinal sections of the metallographic microstructures of AgW materials: (a) AgW70; (b) AgW75; (c) AgW80; AgW85.
Figure 10.
Longitudinal sections of the metallographic microstructures of AgW materials: (a) AgW70; (b) AgW75; (c) AgW80; AgW85.
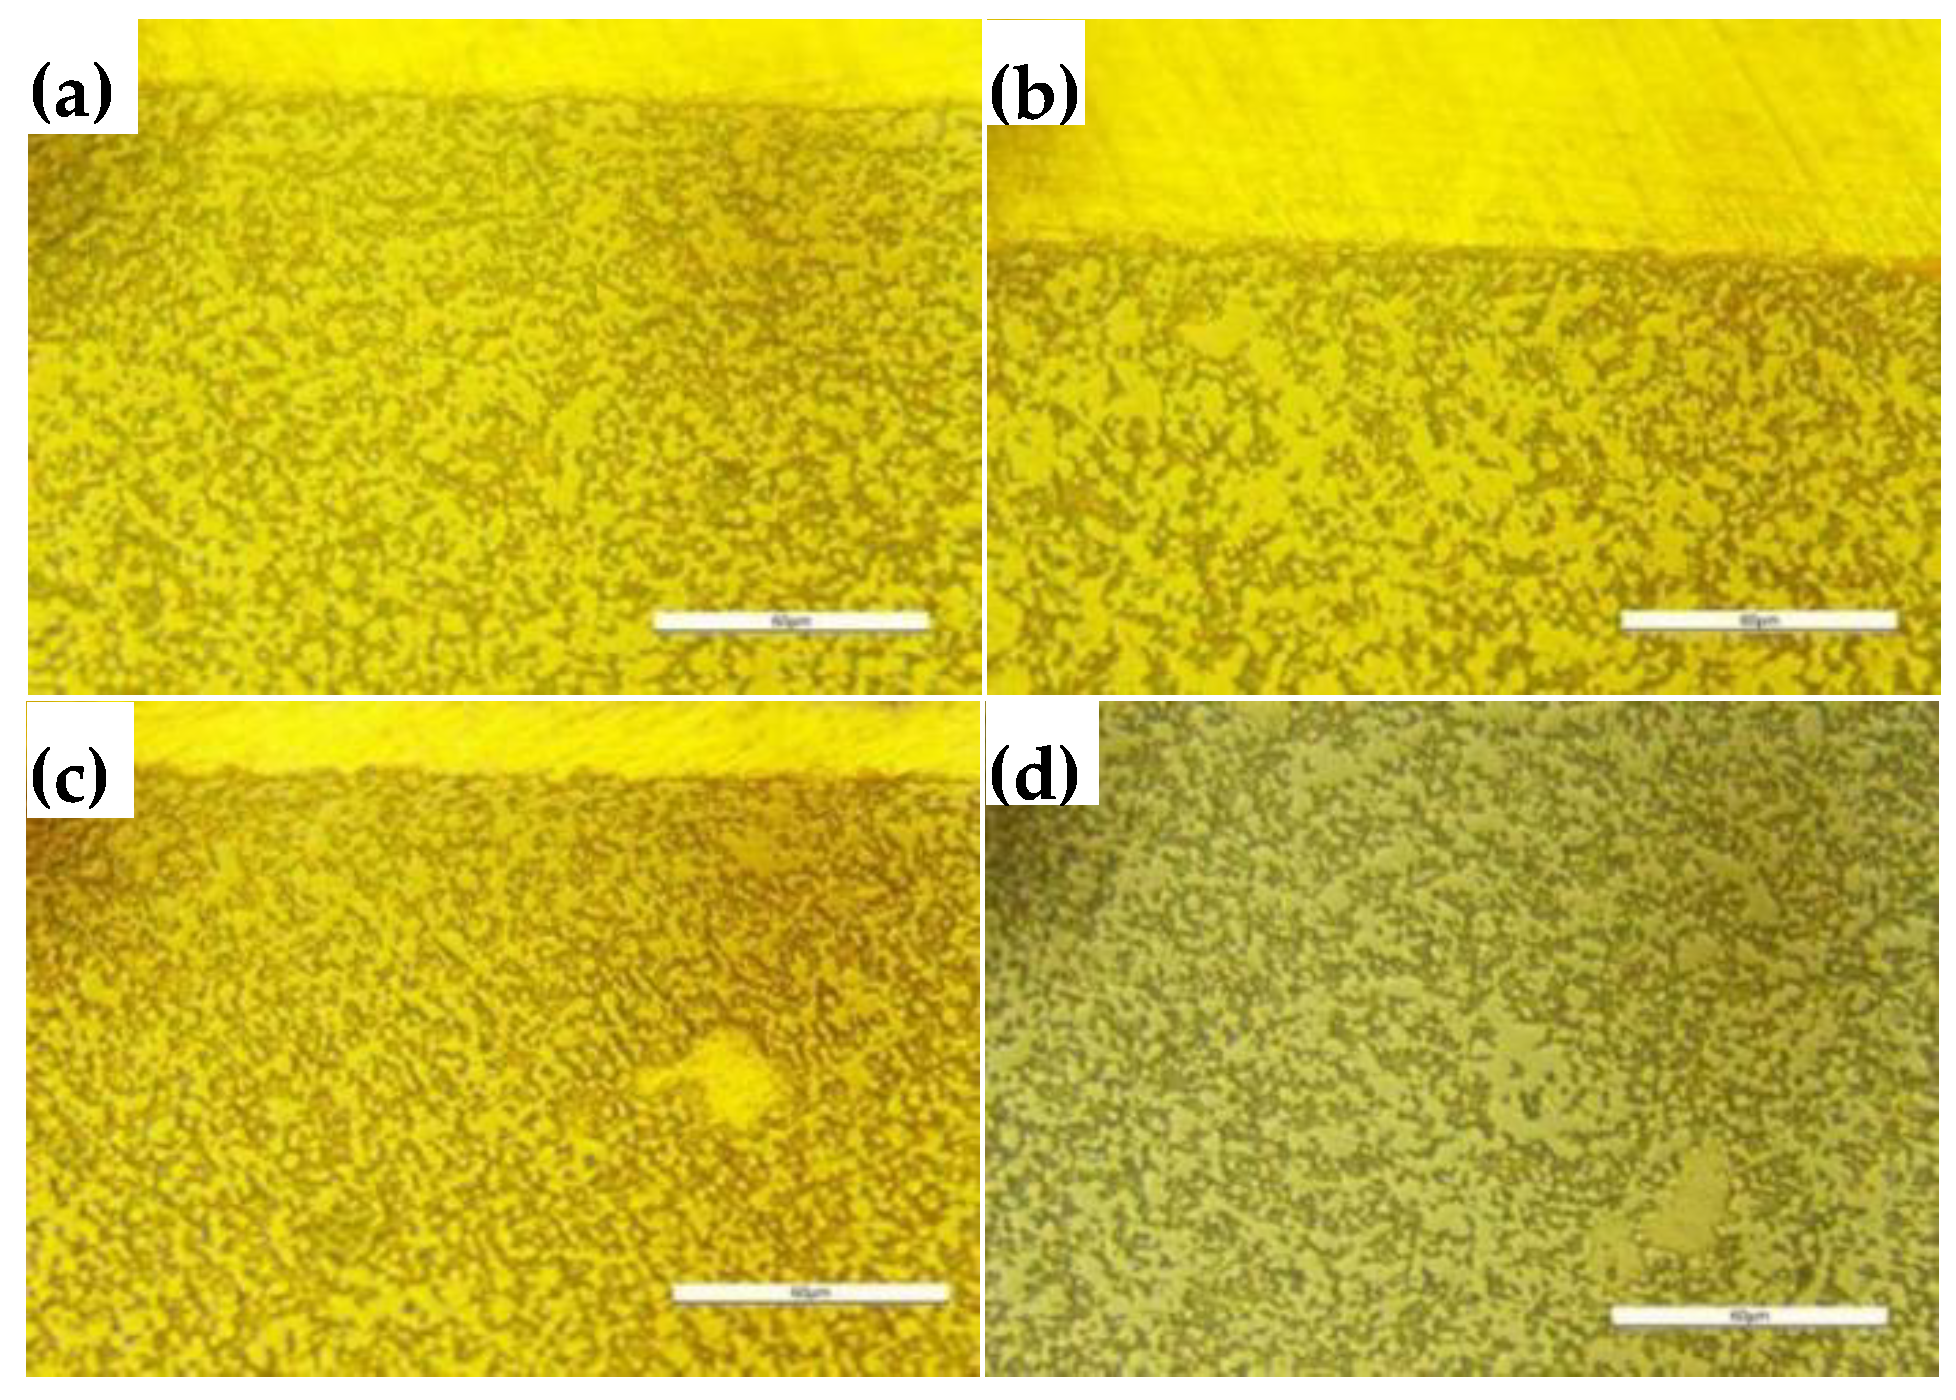
Figure 11.
Cross-sectional SEM images of AgW70: (a) 30 μm; (b) 30 μm. (c) Elemental surface scans corresponding to (b).
Figure 11.
Cross-sectional SEM images of AgW70: (a) 30 μm; (b) 30 μm. (c) Elemental surface scans corresponding to (b).
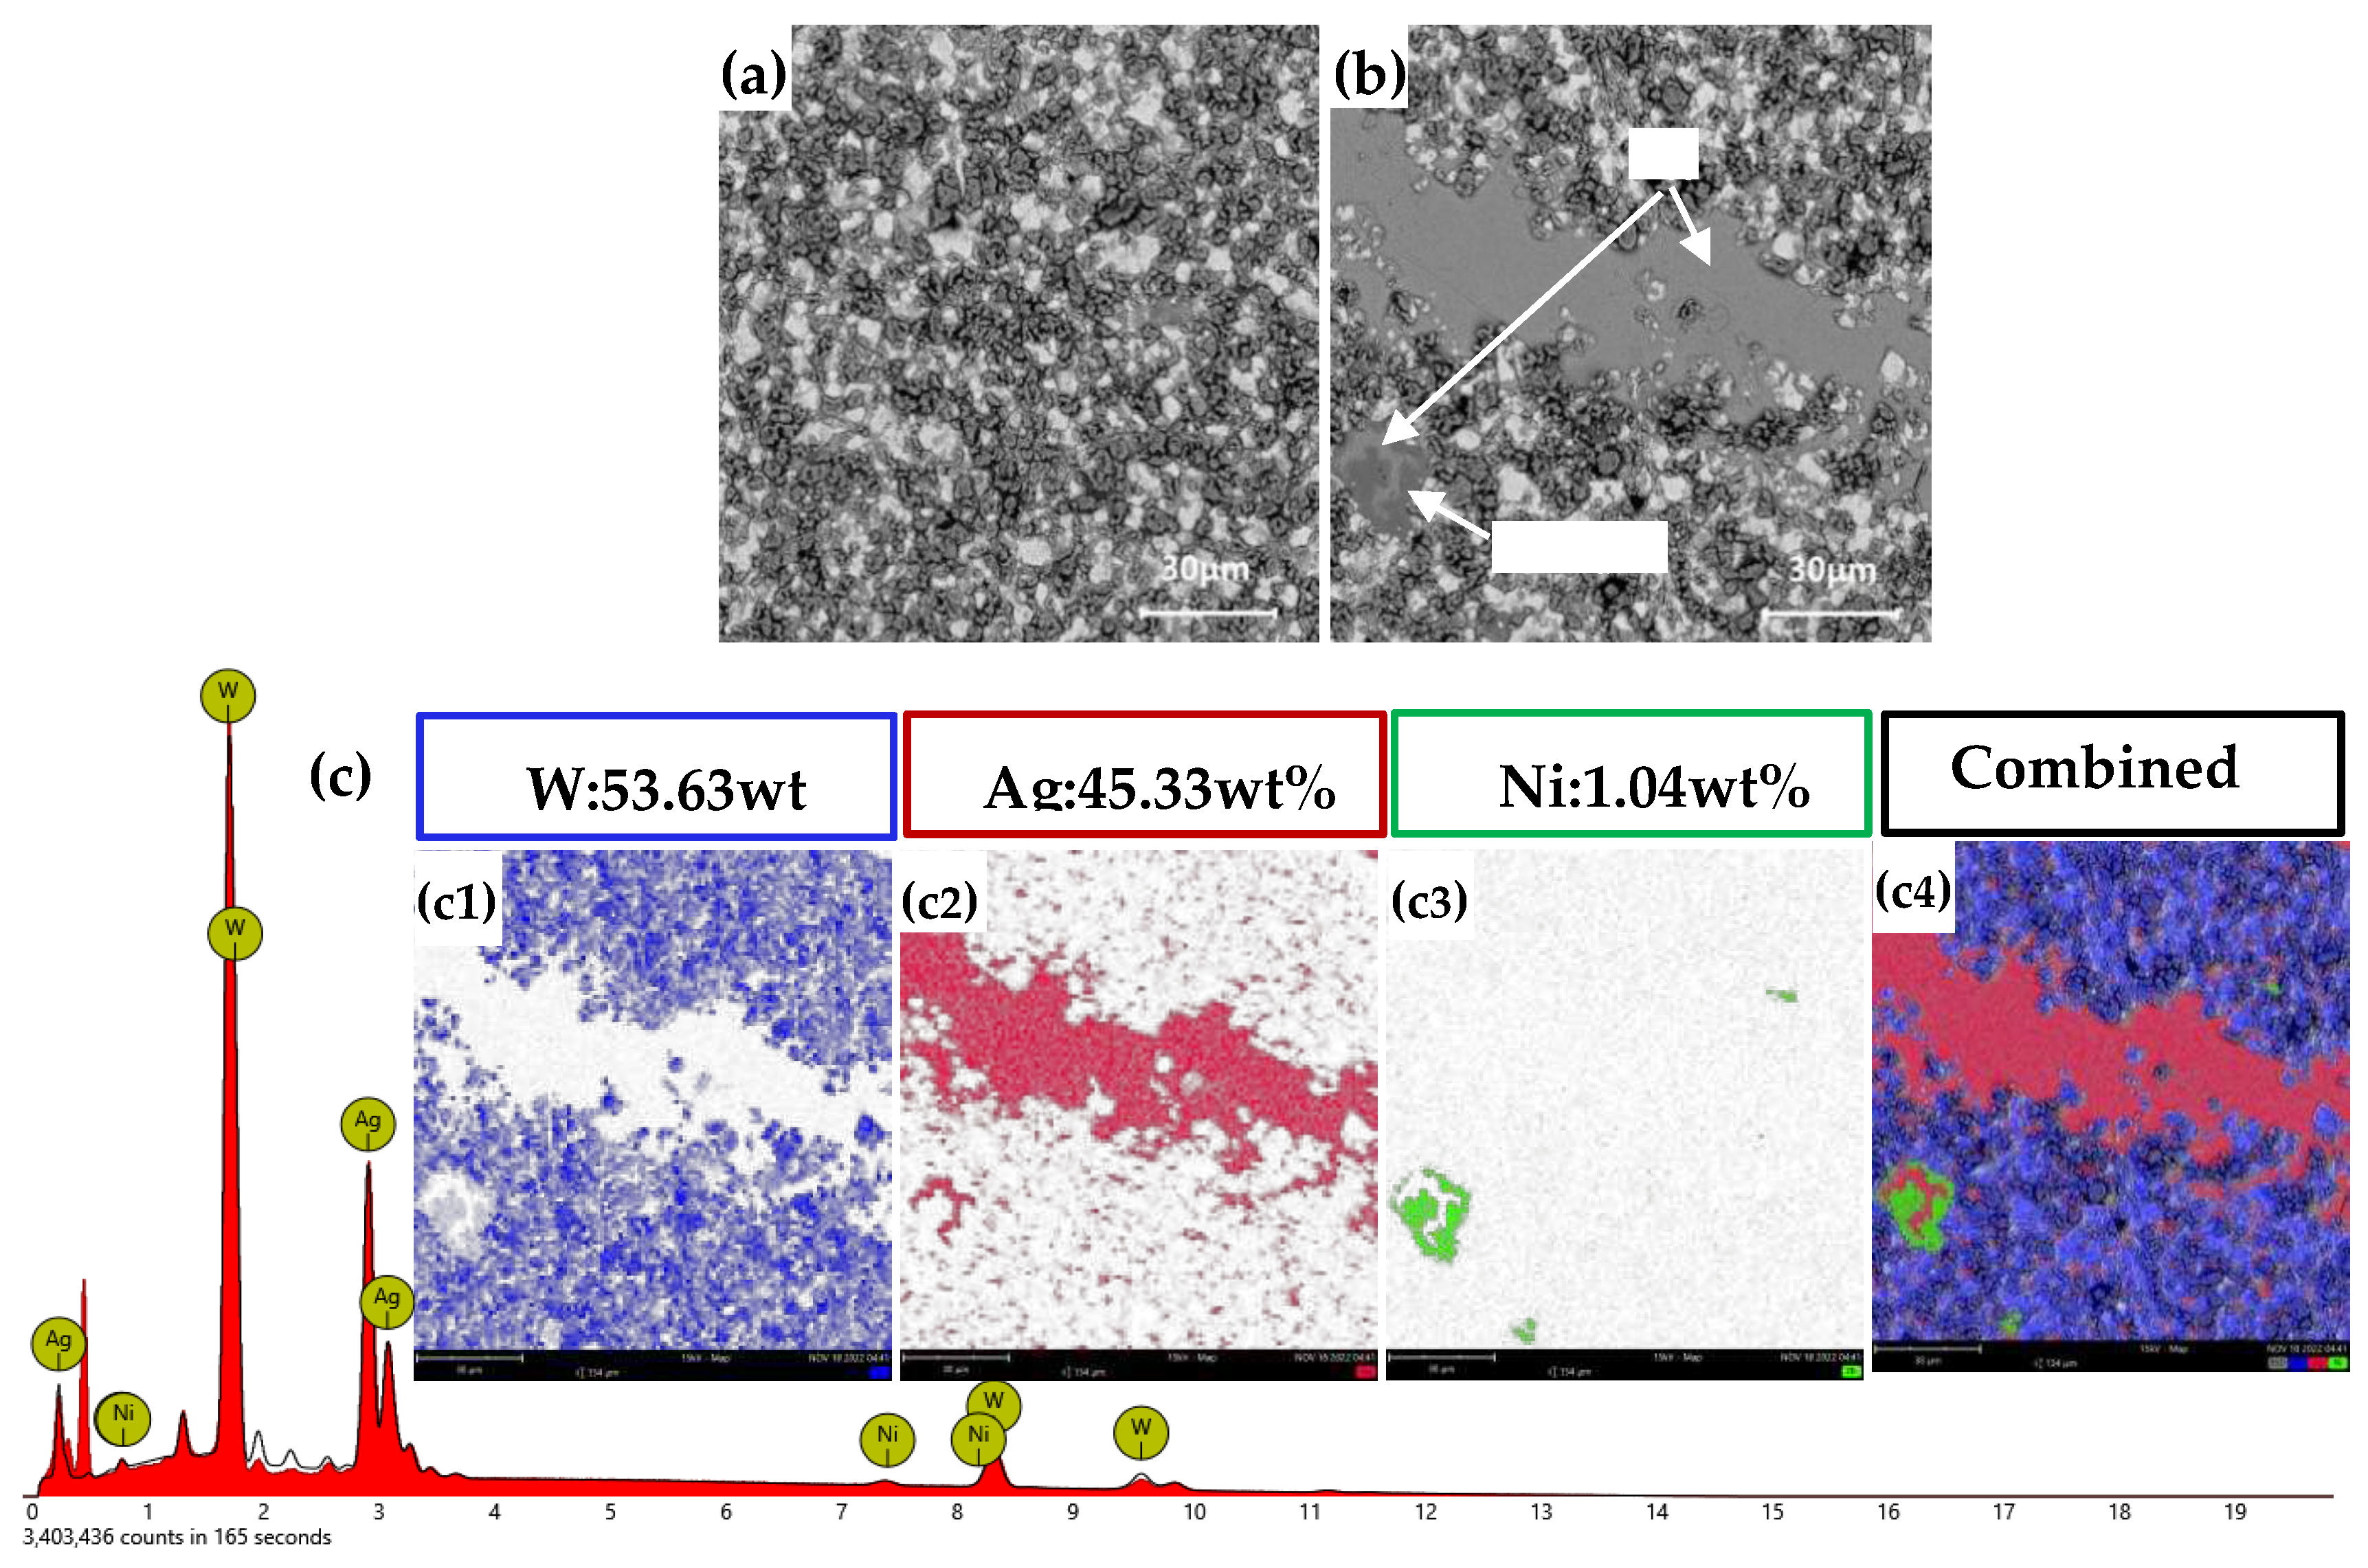
Figure 12.
Cross-sectional SEM images of AgW70: (a) 100 μm; (b) 80 μm; (c) 10 μm. (d) Elemental surface scans corresponding to (b).
Figure 12.
Cross-sectional SEM images of AgW70: (a) 100 μm; (b) 80 μm; (c) 10 μm. (d) Elemental surface scans corresponding to (b).
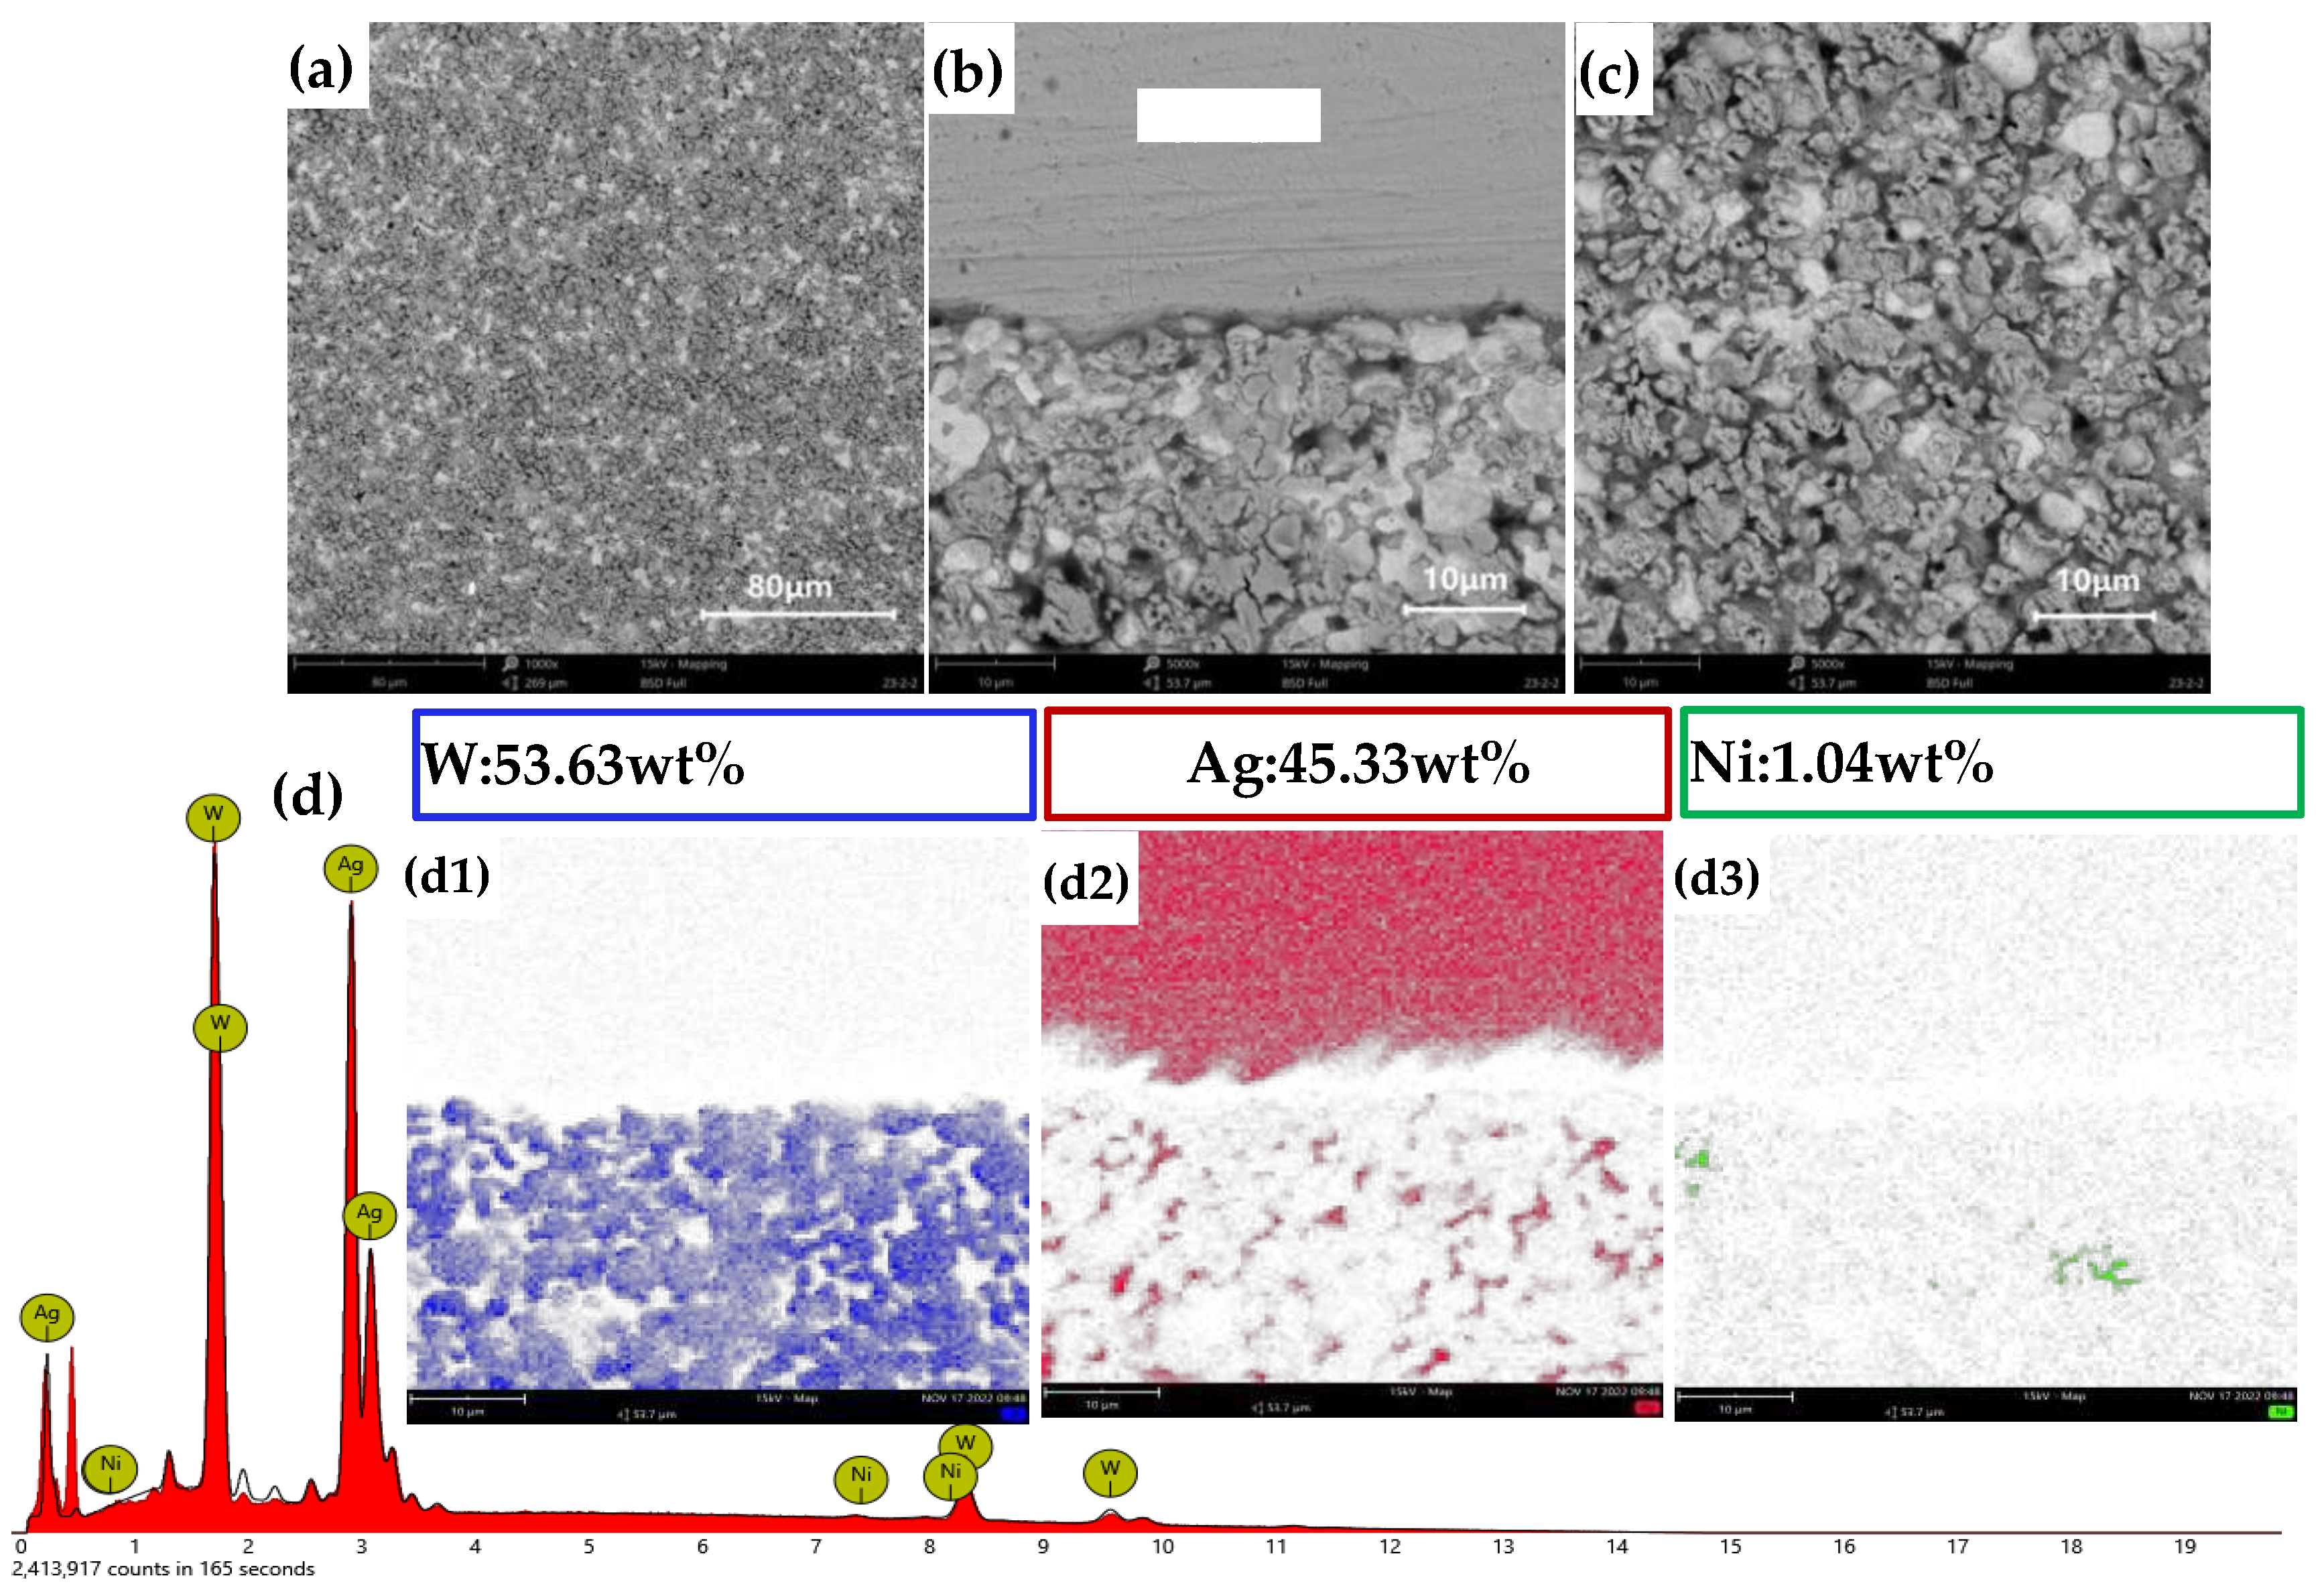
Figure 13.
Cross-sectional SEM images of AgW75: (a) 80 μm; (b) 30 μm; (c) 10 μm. (d) Elemental surface scans corresponding to (b).
Figure 13.
Cross-sectional SEM images of AgW75: (a) 80 μm; (b) 30 μm; (c) 10 μm. (d) Elemental surface scans corresponding to (b).
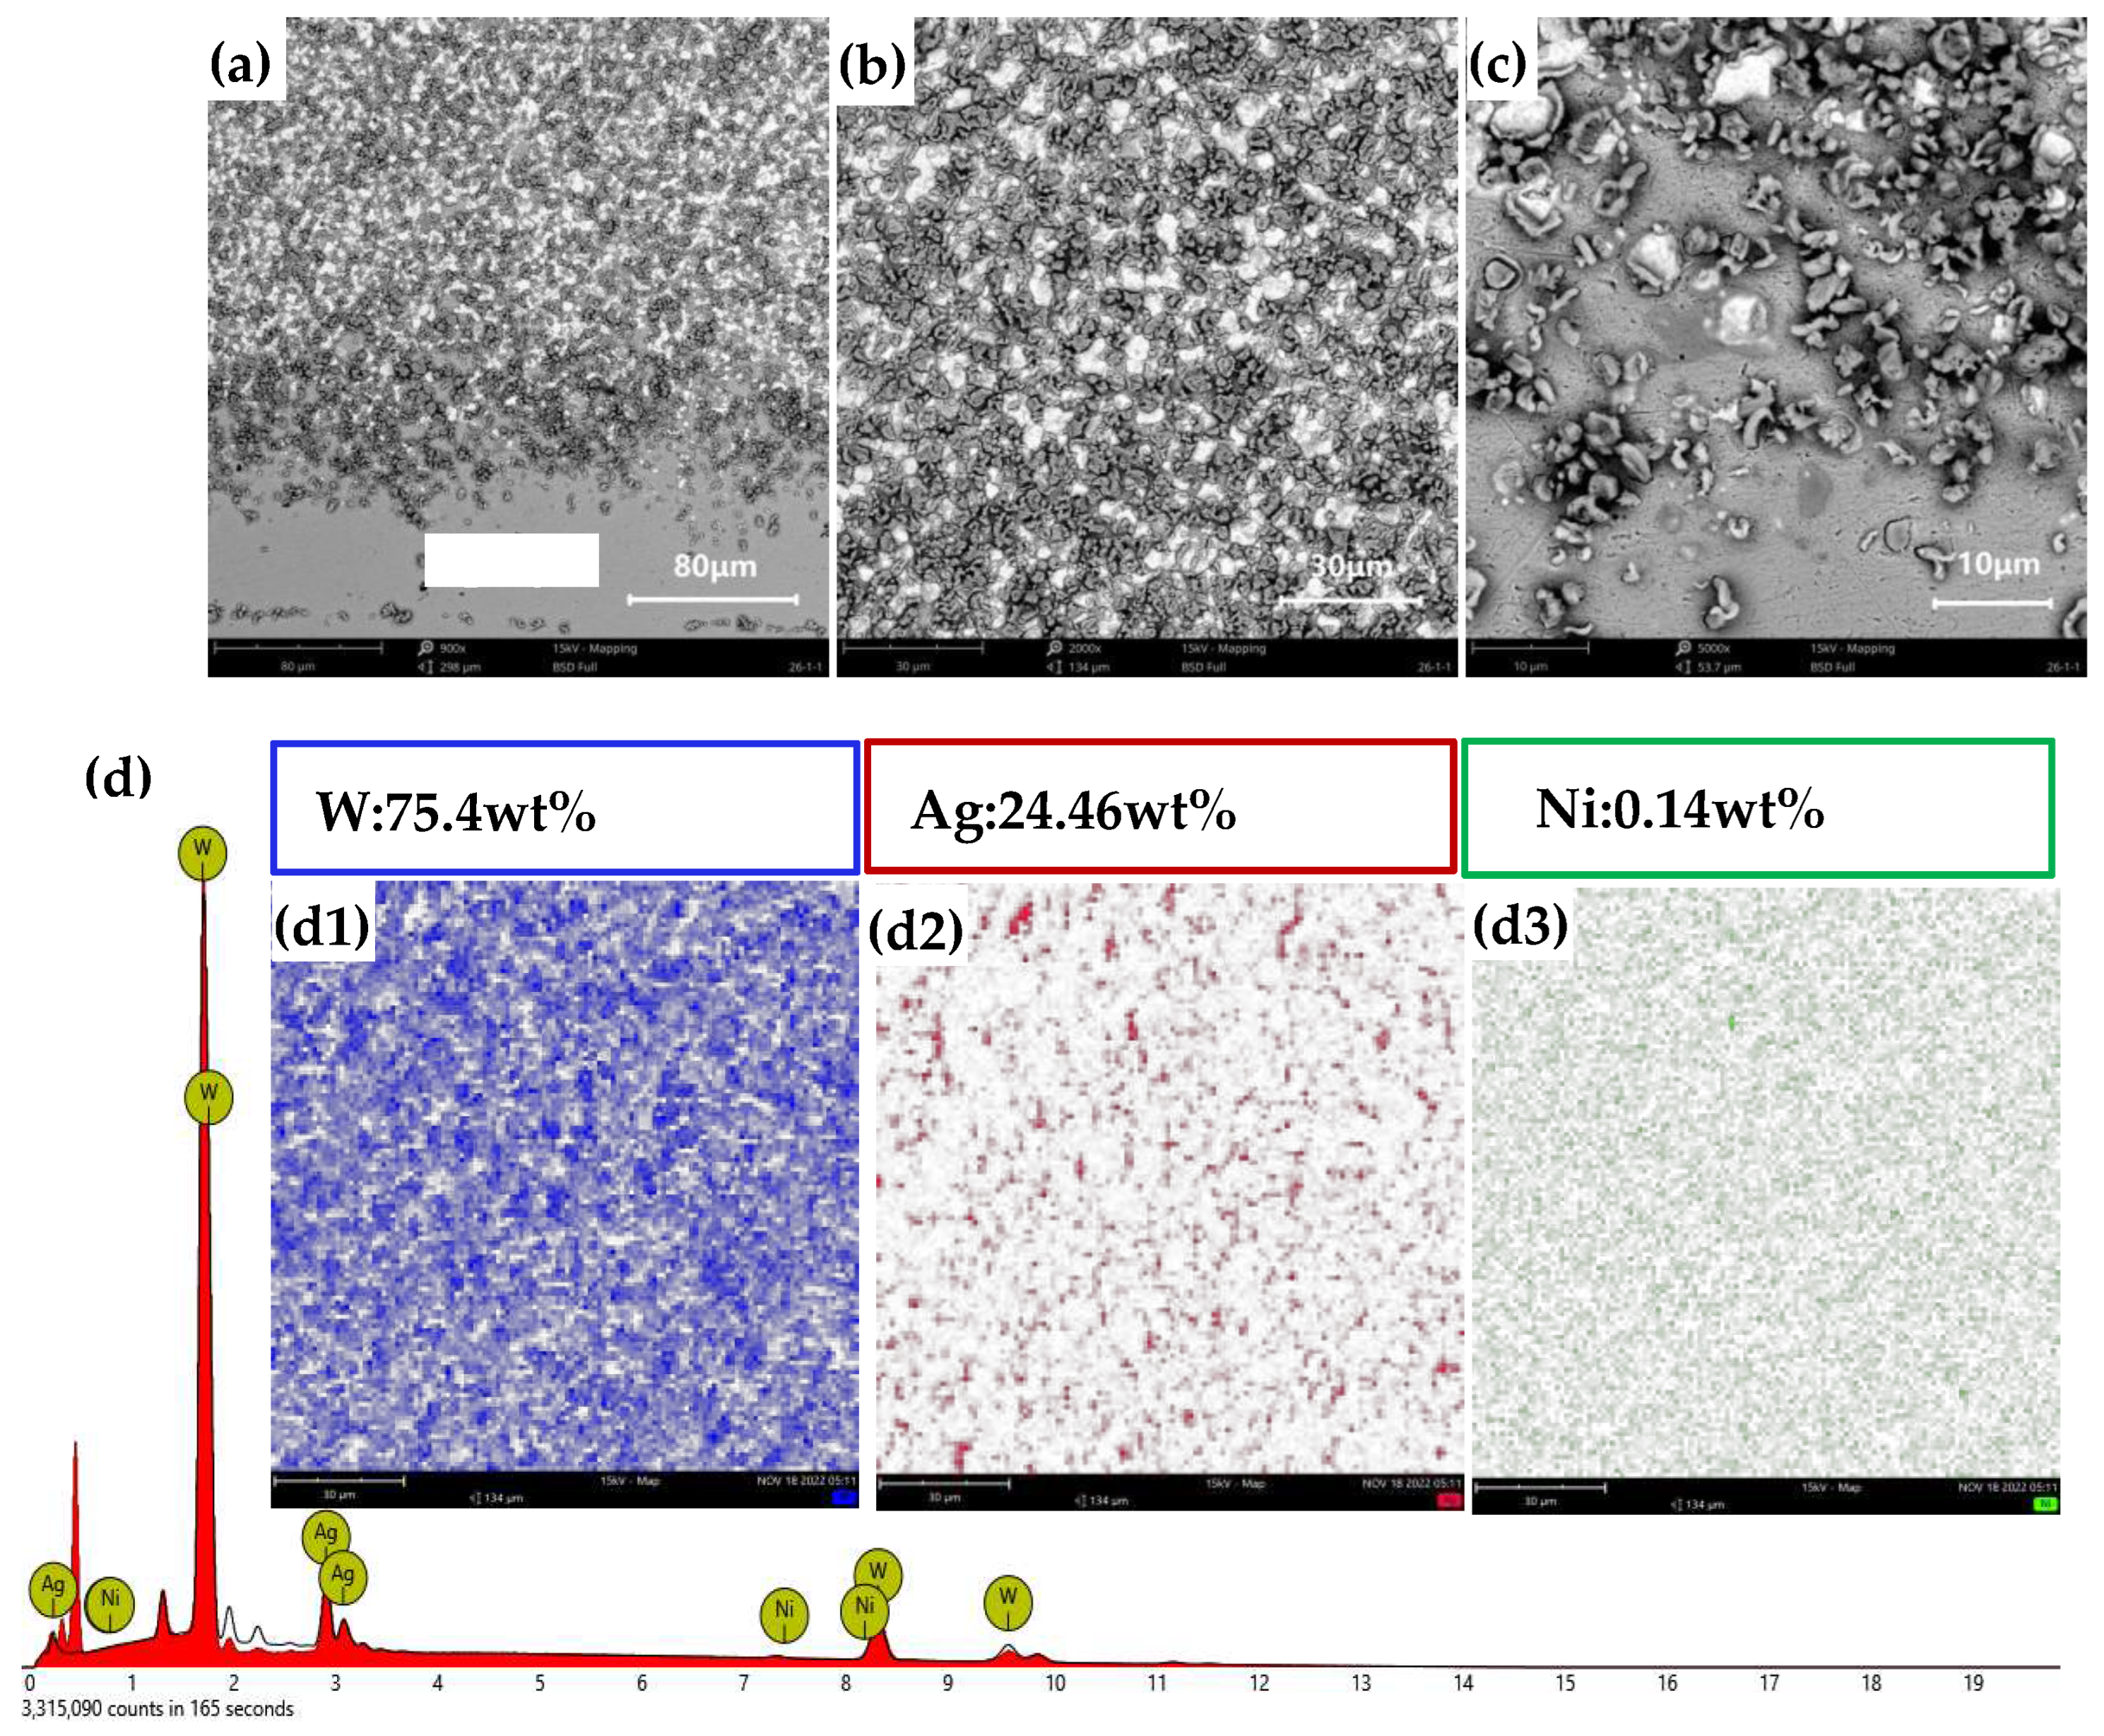
Figure 14.
Cross-sectional SEM images of AgW75: (a) 100 μm; (b) 30 μm; (c) 10 μm. (d) Elemental surface scans corresponding to (b).
Figure 14.
Cross-sectional SEM images of AgW75: (a) 100 μm; (b) 30 μm; (c) 10 μm. (d) Elemental surface scans corresponding to (b).
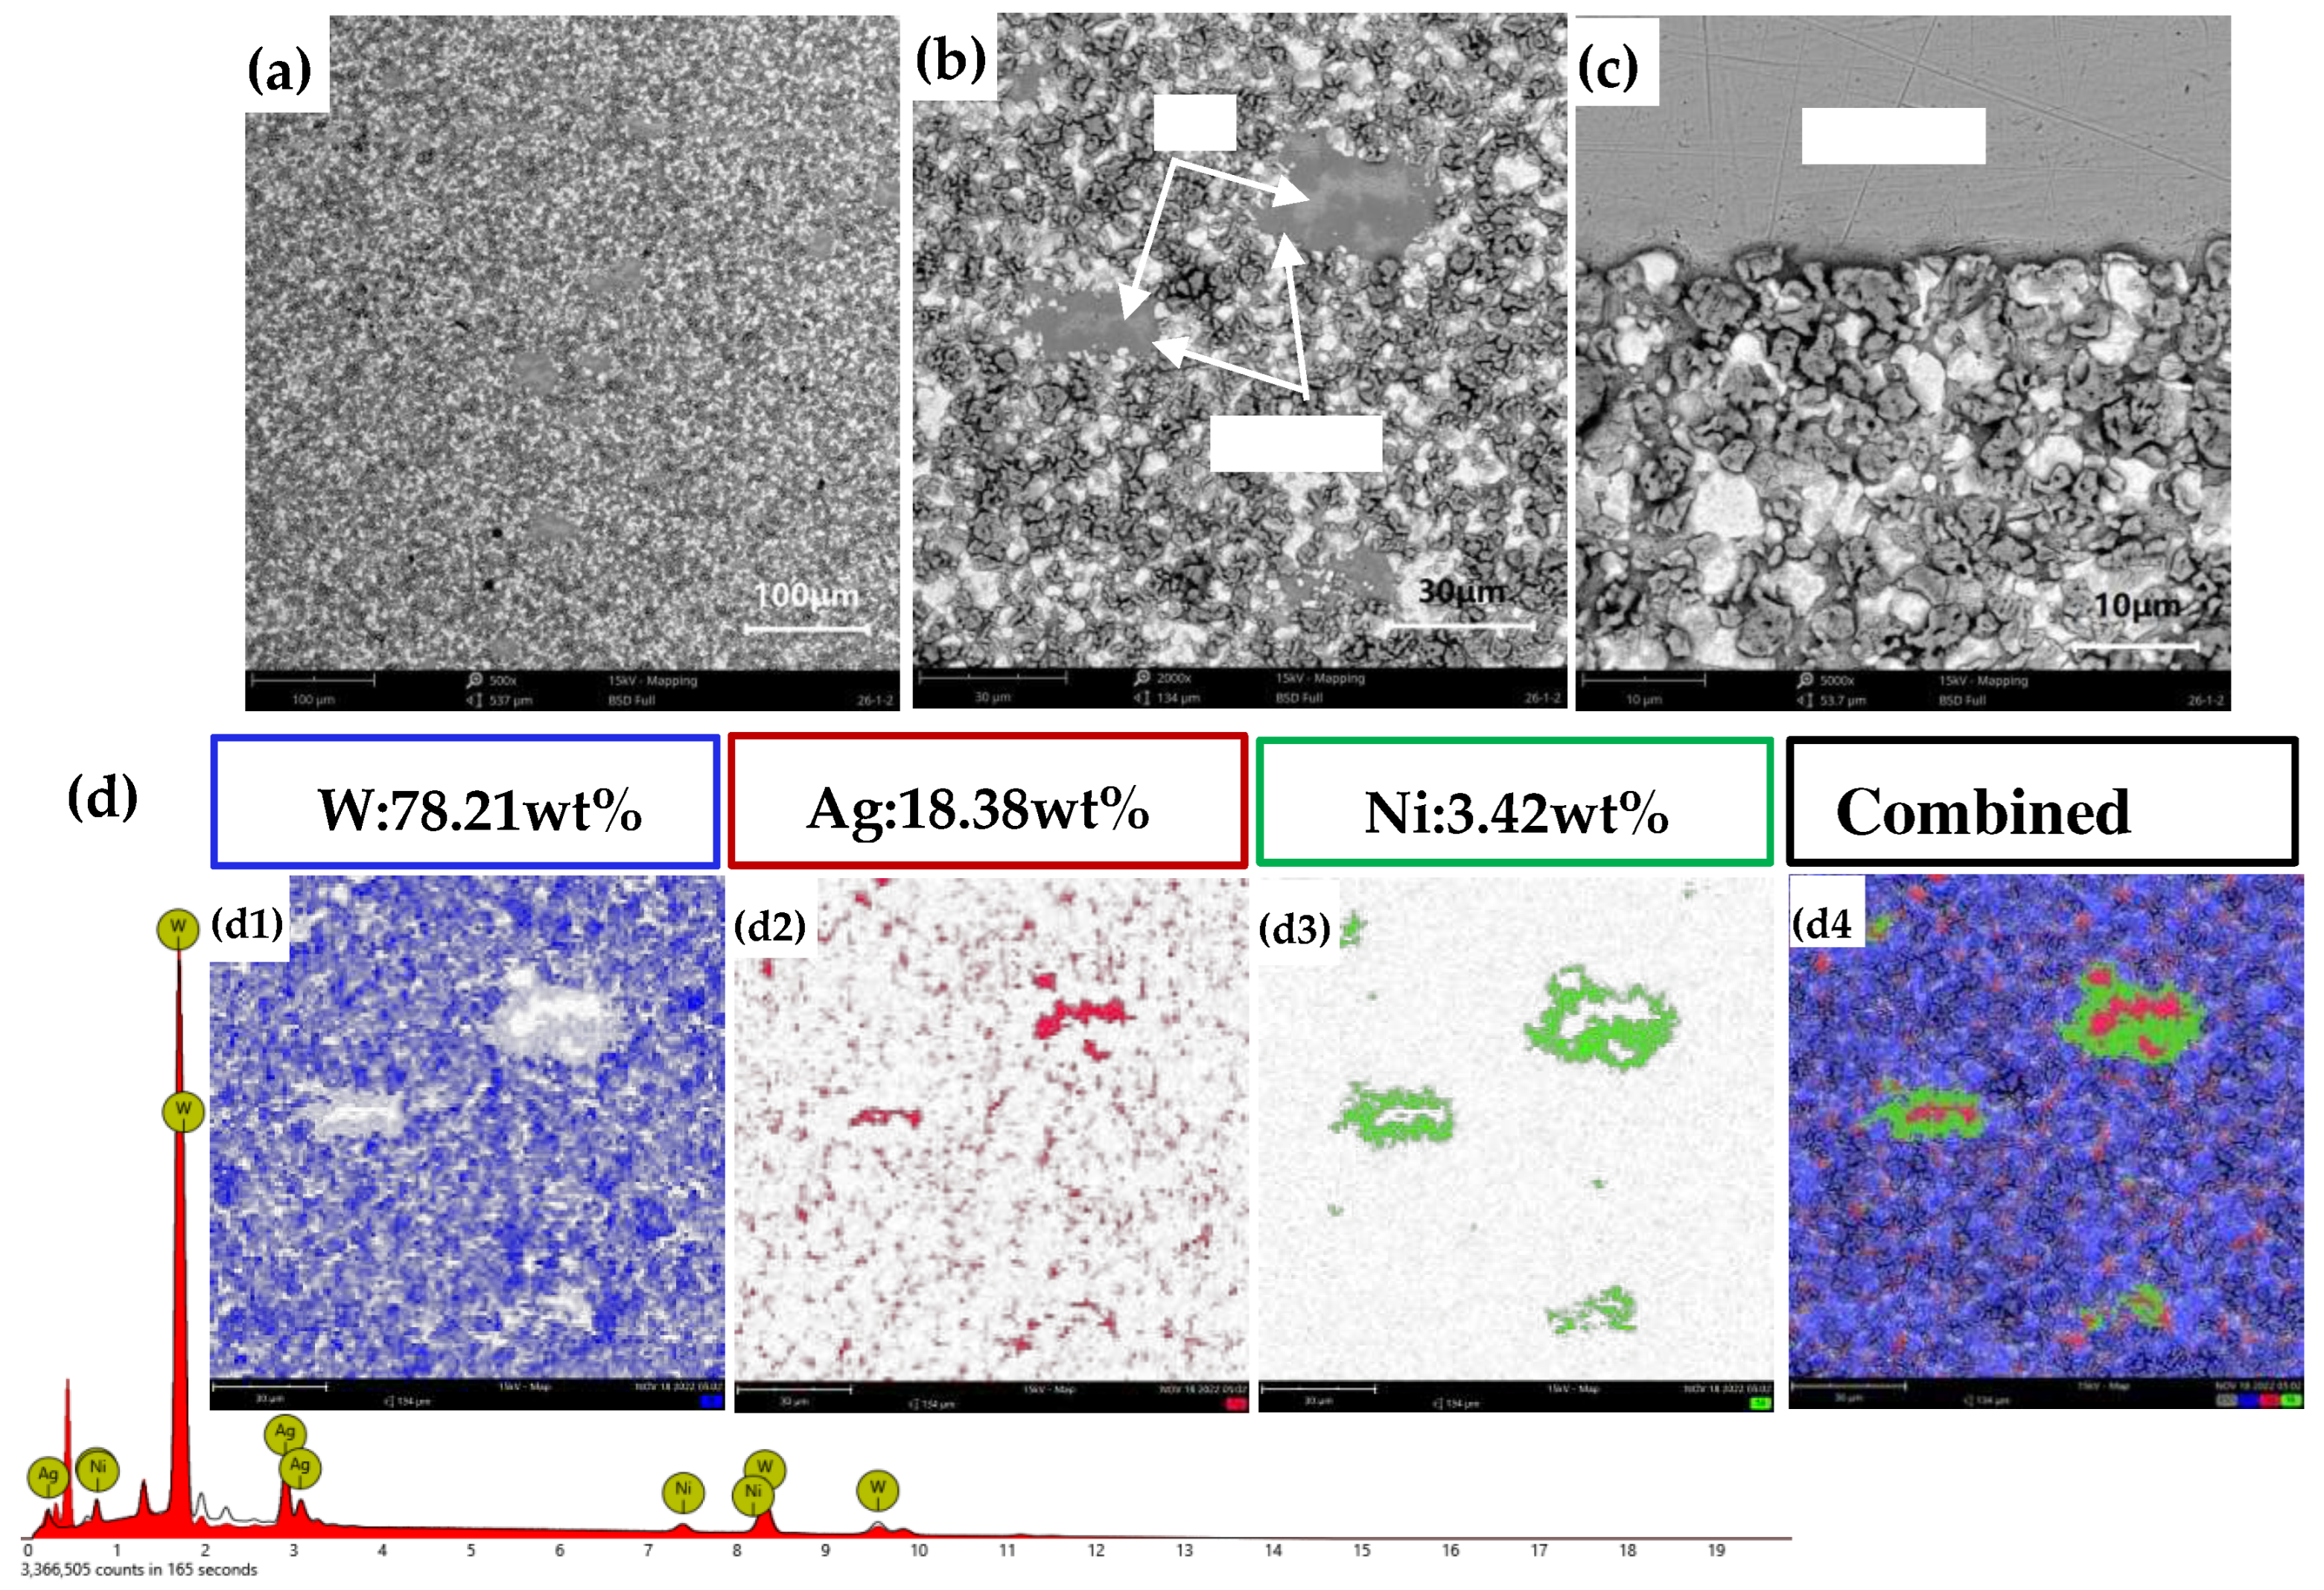
Figure 15.
Cross-sectional SEM images of AgW80: (a) 10 μm; (b) 30 μm; (c) 30 μm. (d) Elemental surface scans corresponding to (c).
Figure 15.
Cross-sectional SEM images of AgW80: (a) 10 μm; (b) 30 μm; (c) 30 μm. (d) Elemental surface scans corresponding to (c).
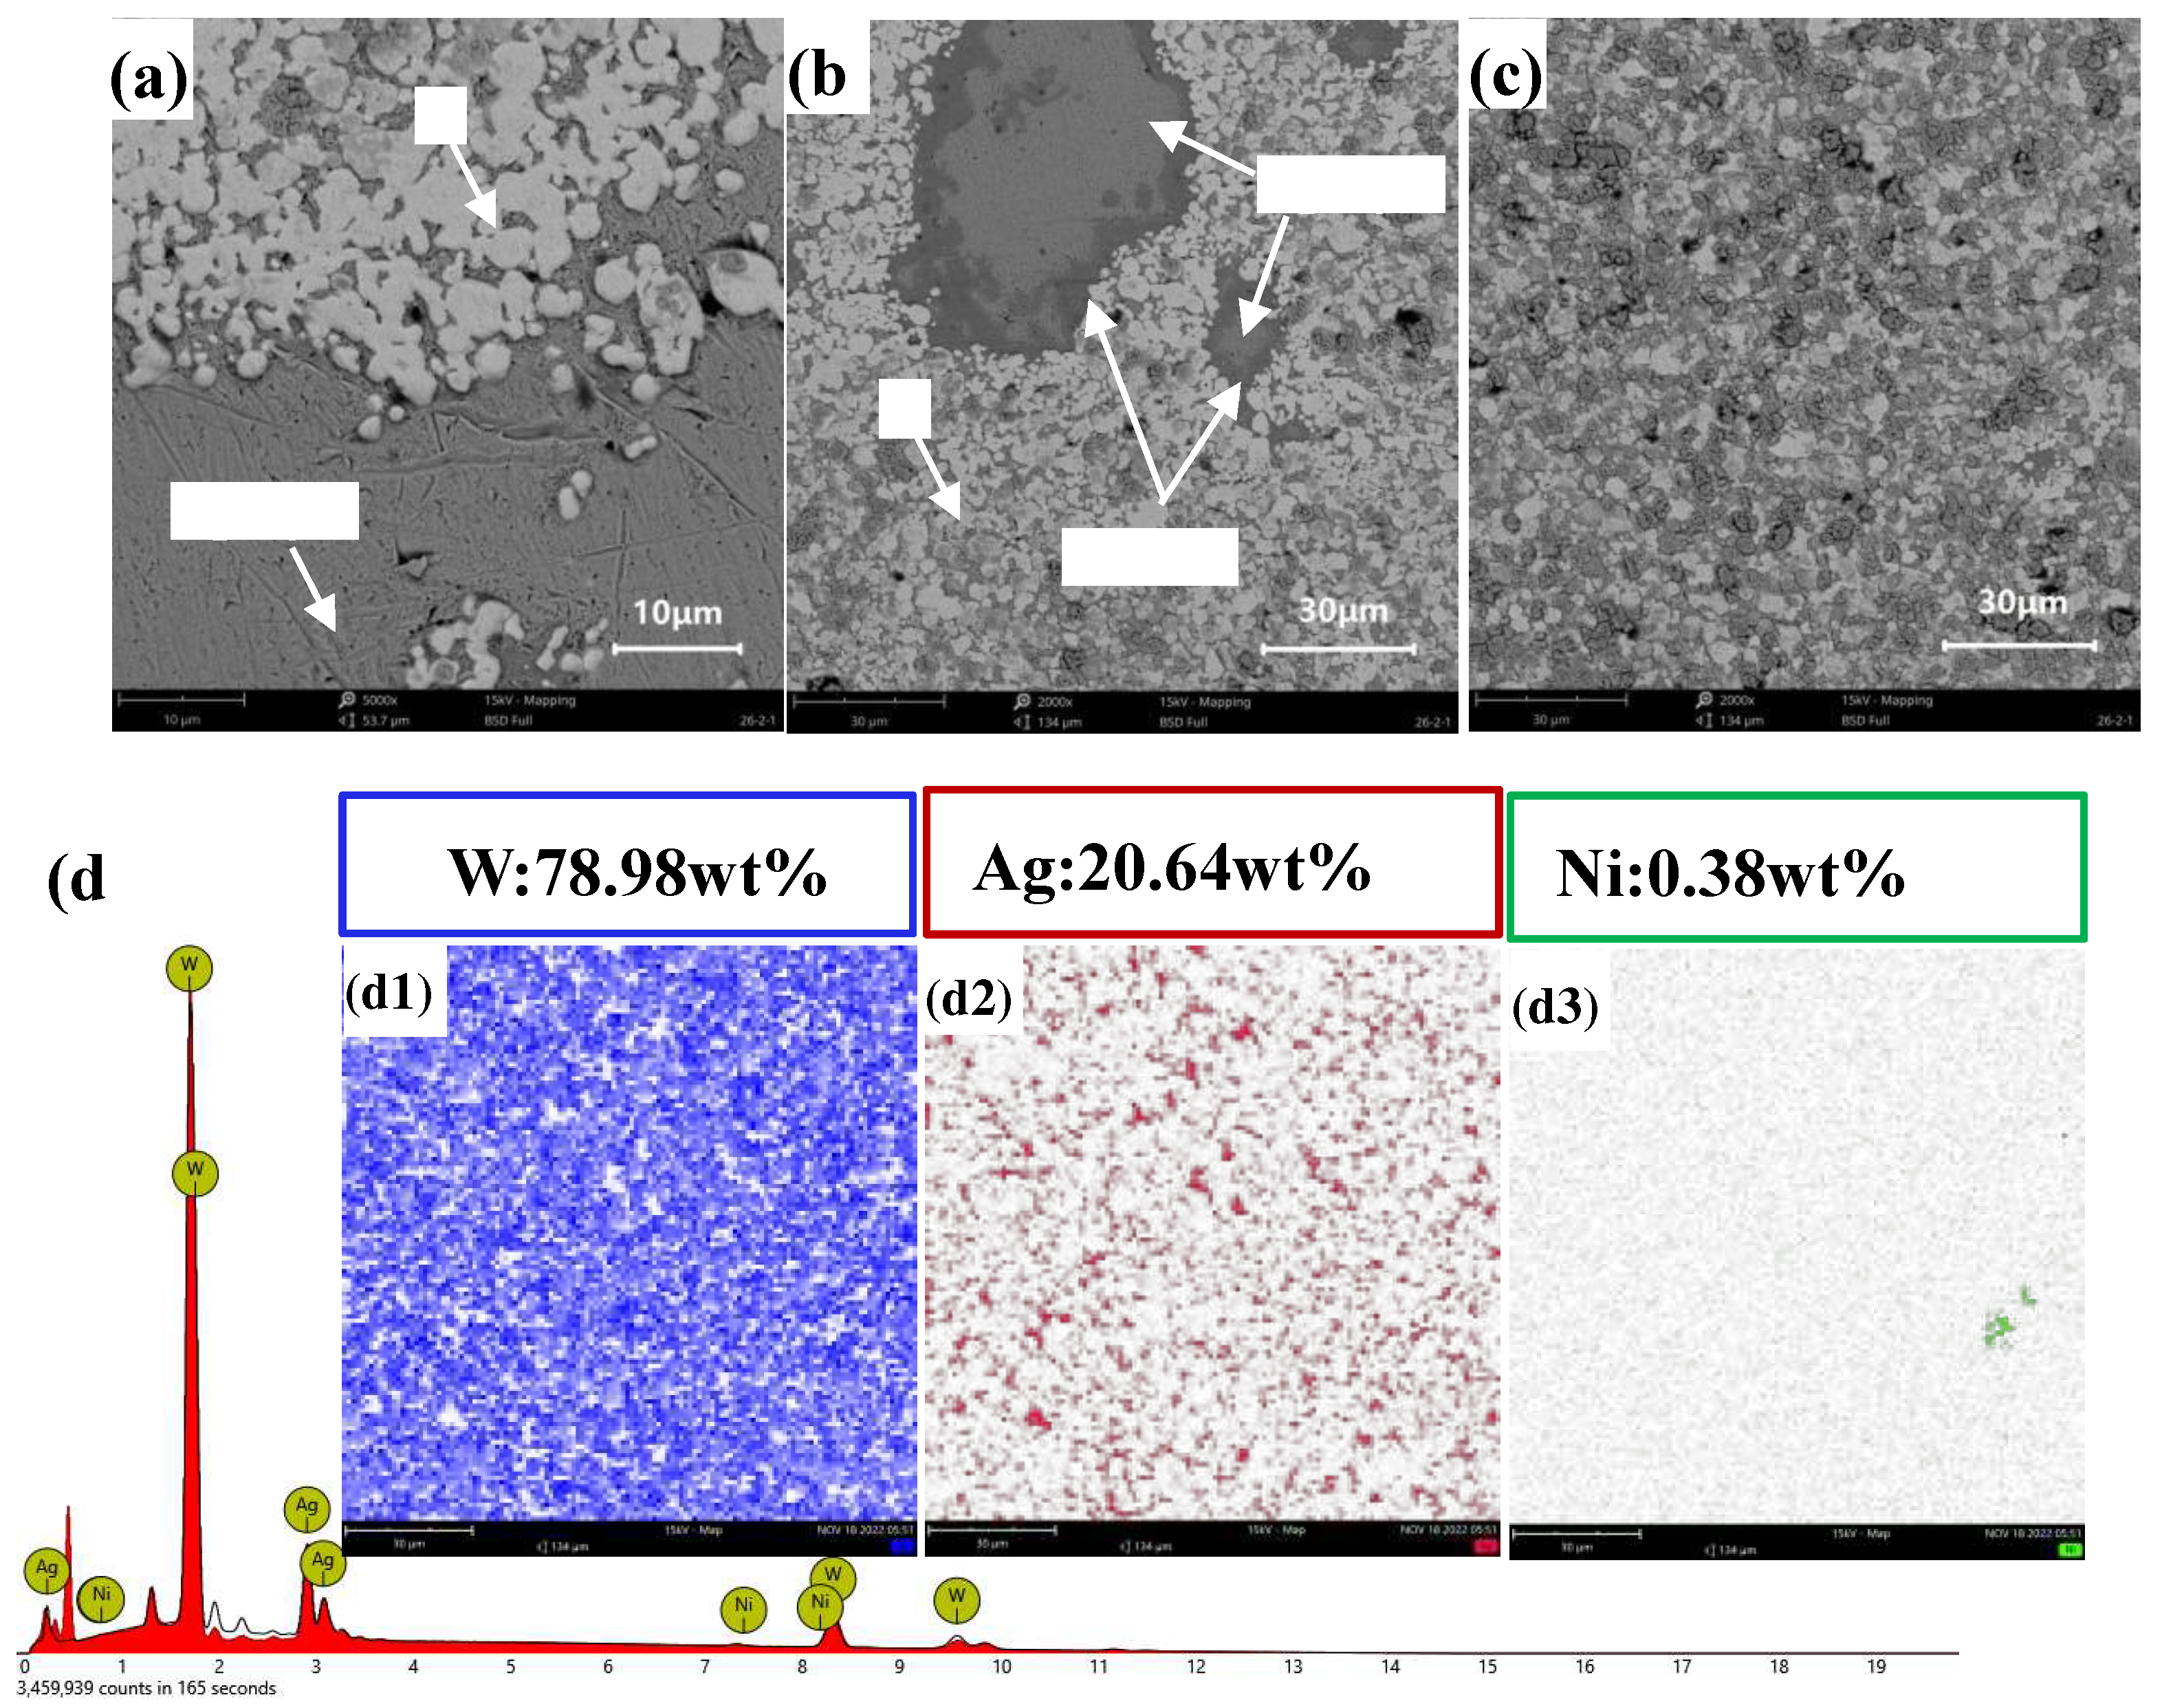
Figure 16.
Cross-sectional SEM images of AgW80: (a) 10 μm; (b) 30 μm; (c) 30 μm. (d) Elemental surface scans corresponding to (c).
Figure 16.
Cross-sectional SEM images of AgW80: (a) 10 μm; (b) 30 μm; (c) 30 μm. (d) Elemental surface scans corresponding to (c).
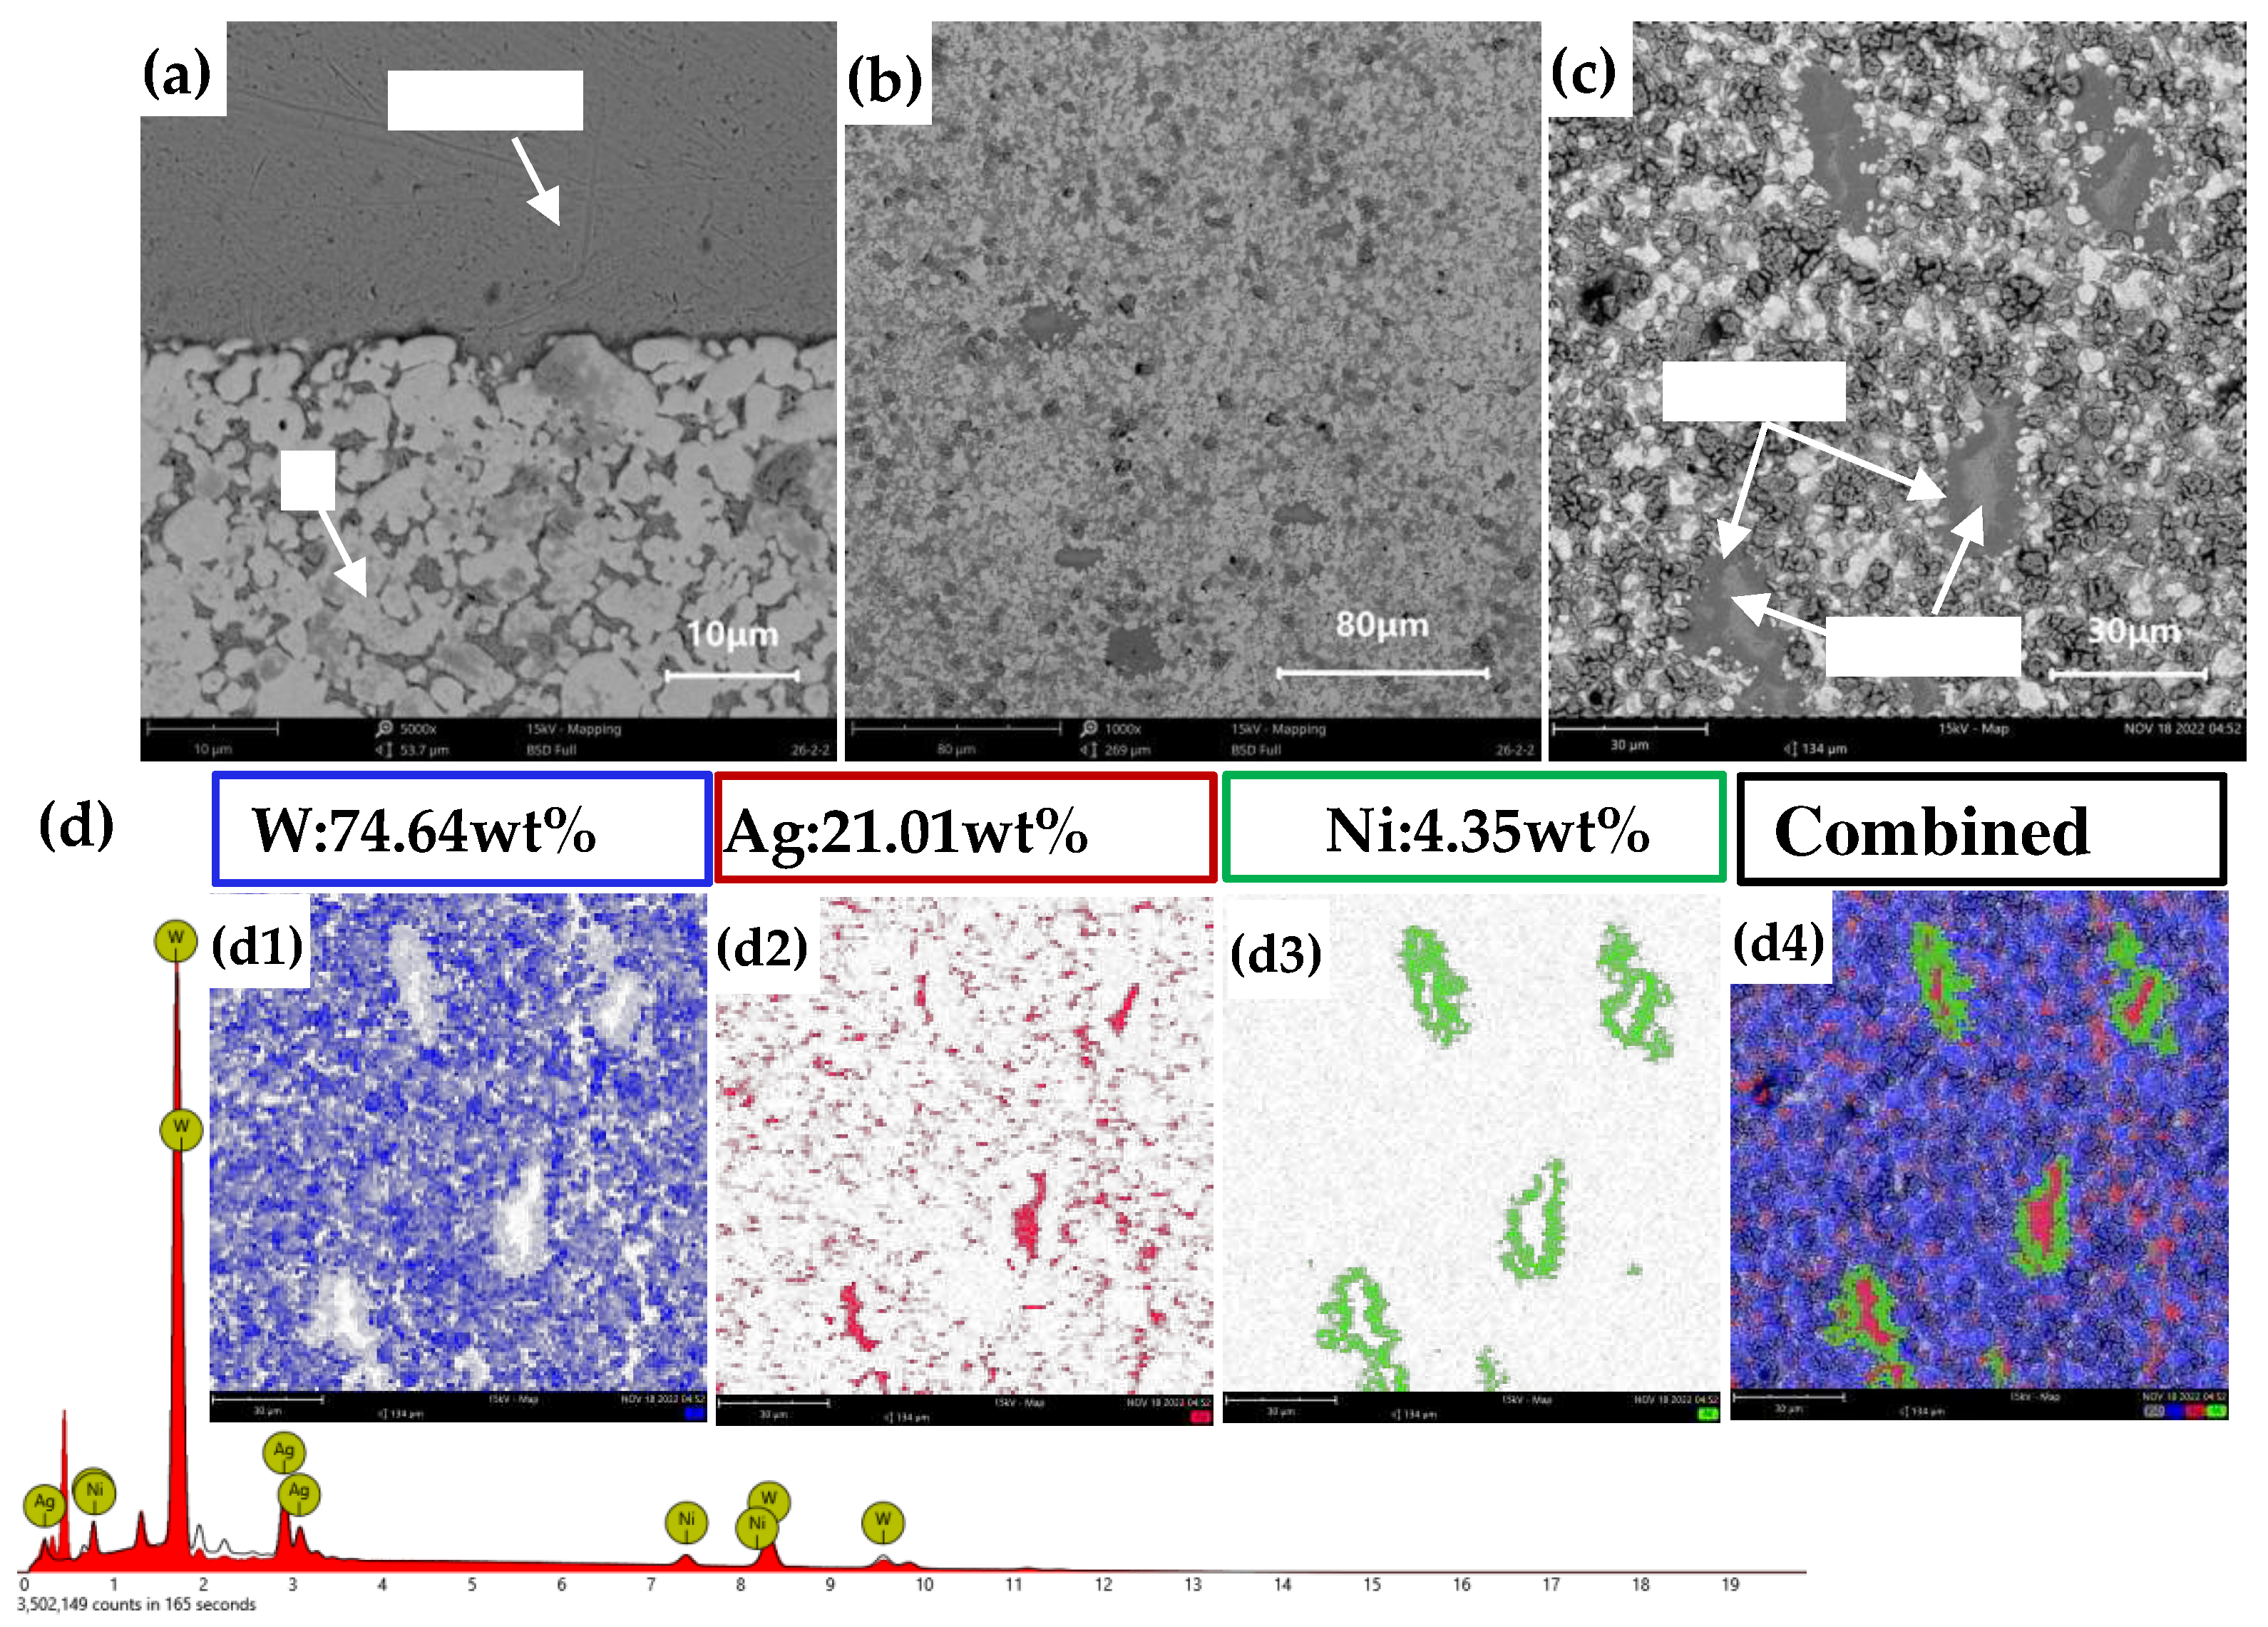
Figure 17.
Cross-sectional SEM images of AgW85: (a) 100 μm; (b) 30 μm. (c) Elemental surface scans corresponding to (b).
Figure 17.
Cross-sectional SEM images of AgW85: (a) 100 μm; (b) 30 μm. (c) Elemental surface scans corresponding to (b).
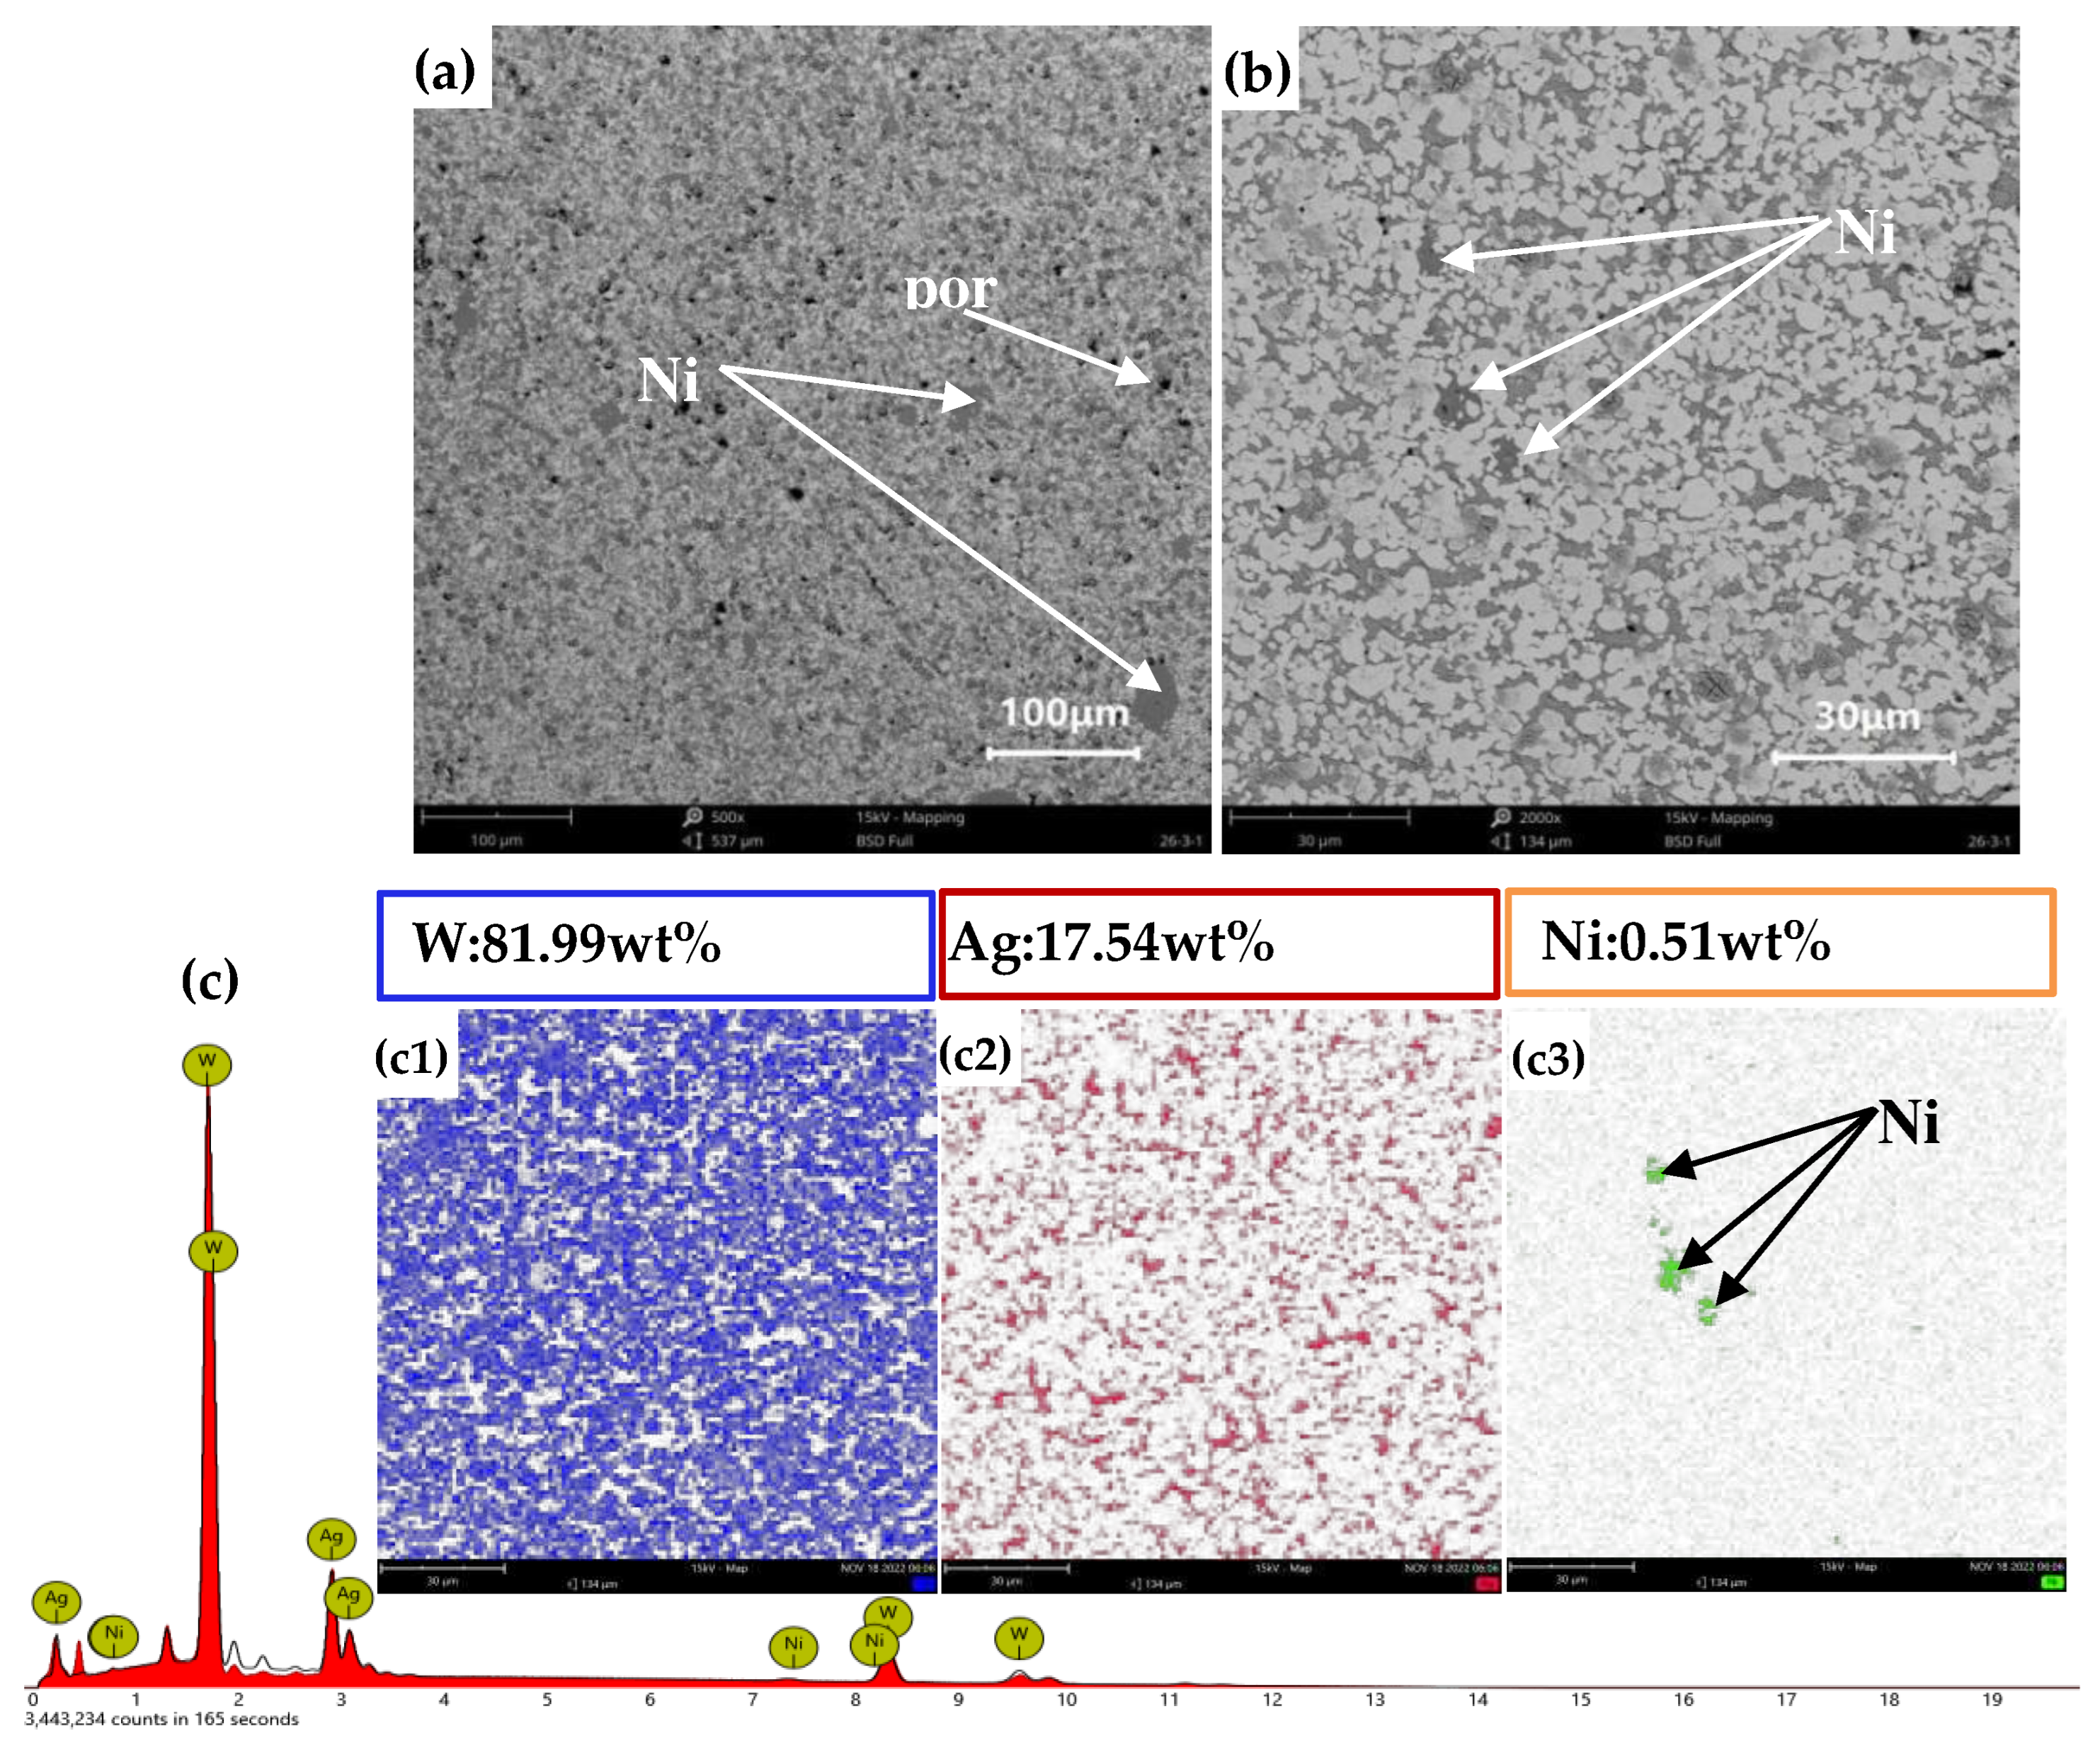
Figure 18.
Cross-sectional SEM images of AgW85: (a) 100 μm; (b) 80 μm; (c) 30 μm. (d) Elemental surface scans corresponding to (c).
Figure 18.
Cross-sectional SEM images of AgW85: (a) 100 μm; (b) 80 μm; (c) 30 μm. (d) Elemental surface scans corresponding to (c).
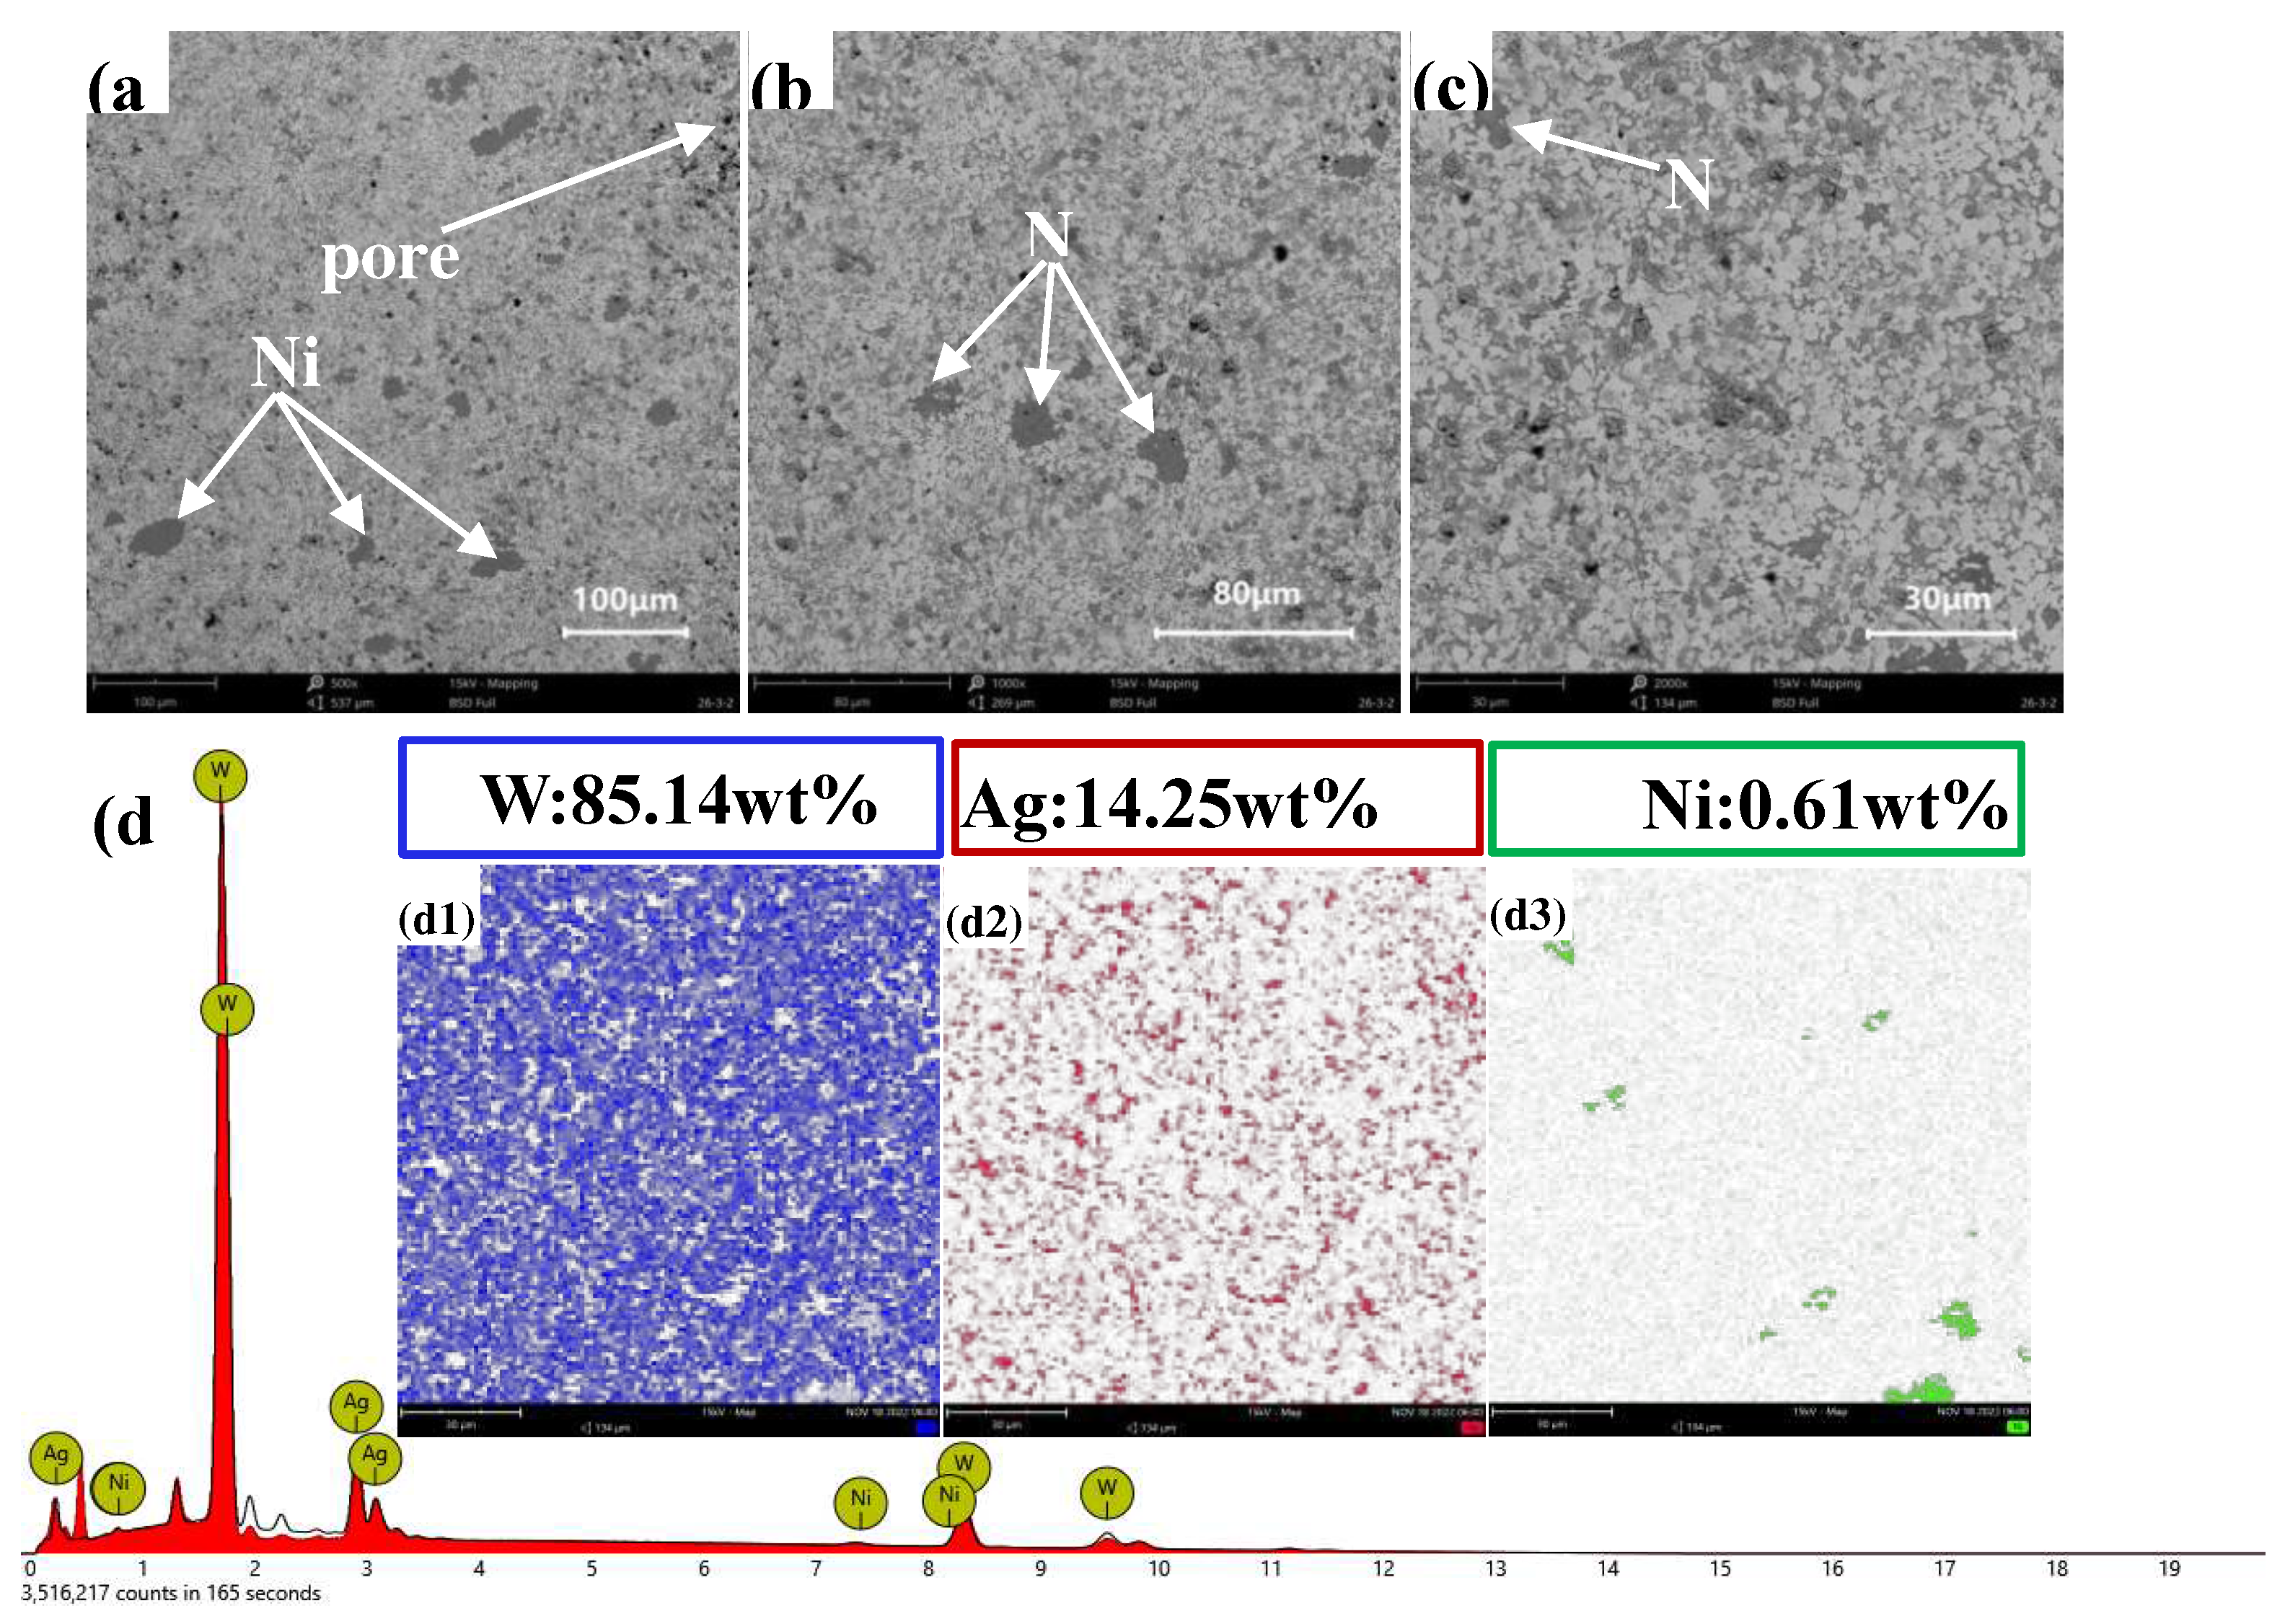
Figure 19.
Physical properties of the AgW materials.
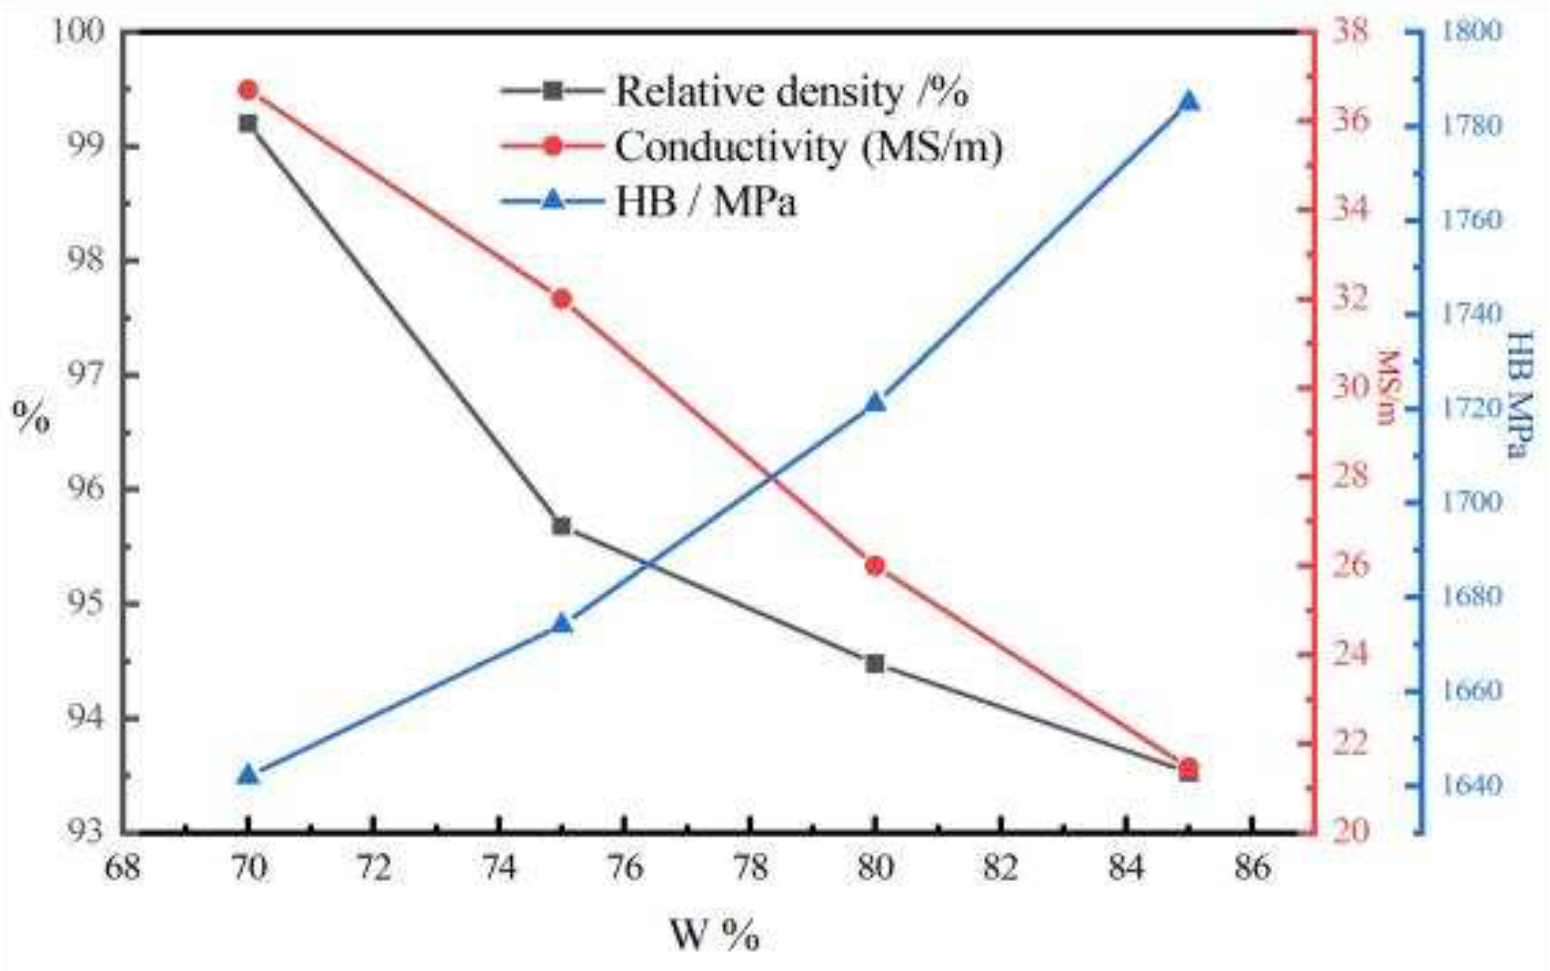
Figure 20.
Schematic of the infiltration mechanism.
Disclaimer/Publisher’s Note: The statements, opinions and data contained in all publications are solely those of the individual author(s) and contributor(s) and not of MDPI and/or the editor(s). MDPI and/or the editor(s) disclaim responsibility for any injury to people or property resulting from any ideas, methods, instructions or products referred to in the content. |
© 2023 by the authors. Licensee MDPI, Basel, Switzerland. This article is an open access article distributed under the terms and conditions of the Creative Commons Attribution (CC BY) license (http://creativecommons.org/licenses/by/4.0/).
Copyright: This open access article is published under a Creative Commons CC BY 4.0 license, which permit the free download, distribution, and reuse, provided that the author and preprint are cited in any reuse.


