
Submitted:
28 July 2023
Posted:
31 July 2023
You are already at the latest version
Abstract
The altimeter-derived ocean currents have been sparsely evaluated against in situ measurements in the Arctic, particularly for extended time periods. This study uses the extensive mooring array situated in the Fram Strait, representing one of the longest ocean current records, to investigate the relationship between in situ and satellite-derived currents in the region. The primary objective of this research is to analyze the vertical structure of the West Spitsbergen Current (WSC), its spatio-temporal coherence, and its association with surface geostrophic currents during the period of 1997-2012. To assess the vertical structure of the WSC, we utilized the Empirical Orthogonal Functions (EOF) and cross-correlation analysis between neighboring moorings. Remarkably, both velocity components exhibited robust vertical coherence, particularly within the waters of the North Atlantic Inflow, at depths exceeding 800 m. These findings underscore the potential for surface measurements to effectively complement data gaps and facilitate the reconstruction of deeper currents with a monthly temporal resolution. Notably, the surface measurements explain approximately 67% of the variance in the top 800 m of the water column.This comprehensive investigation advances our understanding of the West Spitsbergen Current and its vertical characteristics in the Arctic. Moreover, our findings highlight the valuable synergy between in situ and satellite-derived data, providing critical insights for future ocean current studies in this ecologically sensitive region.
Keywords:
satellite altimetry 1
; ocean currents 2
; vertical structure 3
; Arctic 4
1. Introduction
The Arctic region presents unique challenges for obtaining ocean current measurements due to the presence of sea ice. However, satellite altimeters offer a valuable means to infer surface geostrophic currents, even in ice-free areas and through ice-covered ocean leads ([1,2]). While altimeter-derived currents are available, their validation against in situ measurements in most of the Arctic, especially over extended time scales exceeding a decade, remains limited and requires further exploration.
To address this gap, a mooring array has been continuously maintained in the Fram Strait since 1997 by the physical oceanography group of the Alfred Wegener Institute ([3,4]), the Norwegian Polar Institute ([5]), and the Hausgarten Deep-Sea Observatory group of the Alfred Wegener Institute ([6]). This array provides one of the longest ocean current records available in the Arctic. Positioned in the eastern Fram Strait, the moorings (F1-F6, Figure 1) capture the West Spitsbergen Current (WSC), responsible for transporting warm and saline Atlantic Waters (AW) northwards, effectively preventing sea ice intrusion in the eastern part of the Fram Strait mooring array ([3]).
Earlier studies have indicated that the WSC exhibits a primarily barotropic vertical structure upon entering the Arctic Ocean through the Fram Strait ([7,8,9]). However, [10] highlighted the comparability of baroclinic and barotropic components of the WSC. More recently, [11] suggested that approximately 60% of the barotropic transport in the WSC transforms into baroclinic flow along the Arctic shelf upon reaching the Fram Strait. Additionally, [9] demonstrated that specific areas, such as above the continental slope or above the shelf, may experience barotropic currents exceeding baroclinic ones. These findings emphasize the temporal and spatial variability of the WSC's vertical structure.
Despite the significance of understanding the relationship between surface geostrophic currents derived from satellite altimeter SSH data and currents in the ocean interior, this aspect remains unexplored in the Fram Strait. Therefore, the main objectives of this paper are twofold: first, to analyze in situ measured currents and their connection to altimeter-derived currents in the Fram Strait, with particular focus on the WSC region (Figure 1); Second, to investigate the variability in the vertical structure of the WSC and its association with surface geostrophic currents obtained from altimetry measurements.
The manuscript is organized as follows: Section 2 provides a detailed description of the data and methods employed in this study. Section 3 presents the results of the long-term in situ ocean current observations, the analysis of the vertical structure of the WSC, its spatial coherency, and its relationship to surface geostrophic currents derived from altimetry. In Section 4, the findings of the analysis are discussed, and finally, Section 5 summarizes the main conclusions drawn from the study
2. Data and Methods
In Situ Measurements of Ocean Currents
The data utilized in this study were obtained from a comprehensive long-term mooring array situated at 78.83°N in the Fram Strait, spanning from September 1997 to 2012. The data set encompasses ocean current measurements recorded at six distinct locations (F1-F6) within the West Spitsbergen Current (WSC) region, acquired at various depth levels (Figure 1b). These mooring data are accessible through the data publisher PANGAEA ([4]) and can also be accessed via the following FTP sites: ftp://ftp.ifremer.fr/ifremer/oceansites/DATA/ and ftp://data.ndbc.noaa.gov/data/oceansites/DATA/. Detailed descriptions of the data set can be found in the works of [3,12].
The moorings provided temperature and velocity measurements at five standard depths: 75 m, 250 m, 750 m, and 1500 m below the surface, as well as 10 m above the seafloor. The temporal resolution of these data varied from 20 minutes to 2 hours. A suite of reliable instruments, including Aanderaa current meters such as the rotor current meters RCM7 and RCM8, as well as the Doppler current meter RCM11, were employed as primary instruments in the array. These instruments adeptly measured essential parameters such as speed, direction, and temperature, and in some instances, pressure. The data were aggregated on a monthly basis, and the temporal coverage of individual moorings during the period of 1997-2012 ranged from 42% to 93%, as summarized in Table 1. Additionally, monthly time series of WSC volume transport, previously calculated by [3], were acquired from http://www.oceansites.org/tma/fram.html and were integrated into this study to enhance the comprehensive analysis.
Satellite Altimetry data
[14] previously demonstrated the robustness of satellite altimetry gridded products for validating surface ocean geostrophic currents in the Nordic Seas, establishing it as a valuable tool for studying sea level variability and surface circulation in the region. In this study, we employed the latest reprocessing of the Copernicus Marine Environment Monitoring Service (CMEMS) multi-mission combined product L4 gridded (DUACS2018, [15]) to obtain absolute surface geostrophic currents with a spatial resolution of 0.25° and daily temporal resolution, as extensively described by [16]
The absolute surface currents were derived using the principle of geostrophy from the gridded absolute dynamic topography (ADT) (Equation (1)). To capture variability, the long-term temporal mean (1993-2012) of the anomalous geostrophic currents was removed. The quality of these products relies significantly on the accuracy of the ADT field and the methodology used to estimate the derivative. The L4 product generation processing methodology, thoroughly detailed by [17], involves optimal interpolation. The absolute dynamic topography (ADT) represents the sea surface height (SSH) above the geoid and is calculated as follows:
ADT = SLA + MDT
The reprocessing utilizes MDT (Mean Dynamic Topography), extensively described in [18]. The L4 product effectively captures spatial and temporal scales of variability through optimal interpolation mapping; however, its temporal homogeneity is affected by changes in the altimeter constellation during 1997-2012. The blending of the L4 product incorporates observations from multiple orbiting satellites. Nevertheless, in high latitude regions, especially poleward of 66°N (Table 2), the coverage is limited, and most satellites have long repeat cycles of 35 days. In contrast, in polar regions, orbit tracks converge (Figure 1c), resulting in higher spatial resolution and smaller orbit track separation distances, approximately 9-20 km in our study region (Table 2). It is important to note that NASA's ICESat satellite provided SSH measurements up to 86°N between 2003 and 2010 but was not included in the gridded CMEMS product.
Methods
To analyze the vertical structure of the West Spitsbergen Current (WSC), we employed empirical orthogonal functions (EOFs) to decompose both velocity components into modes of variability. Our analysis involved calculating Pearson correlation coefficients, root mean square (RMS) differences, comparing mean values, standard deviations, and amplitudes of the mean seasonal cycles (averaged from all Januaries, Februaries, etc.), as well as determining the seasonal phase (defined as the month of maximum currents).
To assess the significance of the correlations, we utilized the inverse Student's T cumulative distribution function with N-1 degrees of freedom, where N represents the number of monthly observations, assuming their independence from each other. A minimum confidence level of 95% was set for all correlation coefficients, and only significant correlations are reported in the text.
This study relies on L4-derived products encompassing the gridded absolute dynamic topography (ADT) and both absolute and anomalous surface geostrophic currents. Geostrophic currents were calculated using a 9-point stencil width averaging of ADT, as described in[19], applied for latitudes outside the equator (±5° band).
It is important to acknowledge that L4 products have potential sources of error, including the methodologies and parameters used for sea level anomaly (SLA) interpolation on a regular grid. The optimal interpolation applied in the processing restricts the capability of capturing the full dynamical spectrum, limiting the retrieval of small mesoscale motions in L4 products. The Mean Dynamic Topography (MDT) computation methodology, as described by [18], combines information from a first guess MDT solution derived from the mean sea surface (MSS), the Geoid field, and in situ measurements from hydrographic profiles and velocity drifters.
Using the gridded product instead of the along-track data offers the advantage of long-term homogeneity for studying interannual variability, ensuring a consistent reference and processing for all satellite missions. However, it is essential to consider that correlation scales and error budgets may vary regionally and between missions, as discussed by [20].
3. Results
3.1. Spatiotemporal Coherency and Vertical Structure of WSC
In this section, we explore the spatio-temporal coherency across the Fram Strait and investigate the changes in the vertical velocity structure in the West Spitsbergen Current (WSC) region using mooring data. To assess the coherency, we calculated Pearson's correlation coefficients for monthly velocity components, speed, and direction at the two shallowest measurement levels (75 m and 250 m) across the WSC for neighboring pairs of moorings F1-F6 from 1997 to 2012 (Table 3). The correlation coefficients were considered significant at a 95% confidence level.
The investigation of spatiotemporal coherency across the Fram Strait revealed significant correlations, ranging from 0.4 to 0.7, between moorings F1/F2 and F2/F3, which are approximately 7 km apart and situated in the core region of the WSC. This indicates that up to 49% of the monthly variability at these three moorings was coherent during the analyzed period. Notably, the maximum Pearson's correlation coefficient of 0.73 was observed between F2 and F3 at 250 m depth, suggesting that 53% of the monthly variability in the core branch of the WSC exhibited agreement during the years 1997-2012. However, correlations between F3/F4 changed sign, implying frequent opposite flow directions at those locations. For the more offshore moorings, the correlations were not significant for speed but were significant for deeper zonal flow at 250 m depth.
Among the three eastern moorings (F1-F3), high correlations were found for all depth levels, with higher values for the meridional flow, which is the along-slope direction, than the zonal flow. The maximum Pearson correlation of 0.67 was observed between F2 and F3 northward velocities at 75 m and 250 m depths, indicating that 45% of the monthly variability was coherent in the core branch of the WSC during the period 1997-2012.
Furthermore, significant correlations were discovered for the offshore moorings (F4 and F5) for both velocity components, with the highest values observed at 1500 m depth. These findings suggest that the splitting into two WSC branches occurs between the F3 and F4 moorings. Moreover, the results demonstrate that the WSC exhibits coherence in its core branch concerning its speed and direction, as well as in the offshore branch concerning the zonal flow.
The vertical coherence of the WSC was previously explored by [12], who found high correlations (0.65 > R > 0.95 for p < 0.01), but only for the meridional current component in the two highest depth levels (75 m and 250 m) and for shorter time scales (up to a month) using daily averaged in situ data. In this study, we extend the correlations to a longer period (monthly averaging) and a longer duration (1997-2012). As a result, changes in the strength of correlations were observed, depending on the chosen duration of averaging (daily vs. monthly) and on the time-series duration (months, years, and decades). These extended correlations provide valuable insights into the vertical structure and spatiotemporal coherency of the WSC in the Arctic region.
The results of our analysis reveal that the northward flow of the West Spitsbergen Current (WSC) exhibits vertical coherence, not only in its core region but also in its offshore branch. This implies that knowing the northward velocity at one depth can be utilized to estimate the velocity at other depths. However, there is some dependence on depth and spatial location. On average, during the analyzed time period, approximately 64% of the meridional monthly velocity variability can be reconstructed in the top 1000 m using only subsurface (75 m) northward velocity data. Notably, the deep flow observed at mooring F4 (located at 7°E) at 1500 m depth appears to be independent of the surface flow. Conversely, the zonal flow exhibits more vertical coherence offshore. At F6 (situated at 5°W) and a water depth of 1000 m, the correlation coefficient is approximately 0.7. However, between 7°E and 9°E, in the core region of the WSC, the zonal component demonstrates higher vertical coherence (with correlation coefficients exceeding 0.9) for the two upper levels of measurements (75 m and 250 m). This indicates that about 80% of the variance in the zonal flow can be reconstructed using subsurface flow data, but this reconstruction is applicable only in the top 250 m of the water column.
In summary, our findings demonstrate the significant vertical coherence of the northward flow in both the core and offshore branches of the WSC. This knowledge can be valuable for estimating velocities at different depths and gaining insights into the complex dynamics of the WSC in the Arctic region. Additionally, the vertical coherence of the zonal flow shows variation with depth and location, being more pronounced in the core region and diminishing as we move offshore and to greater depths.
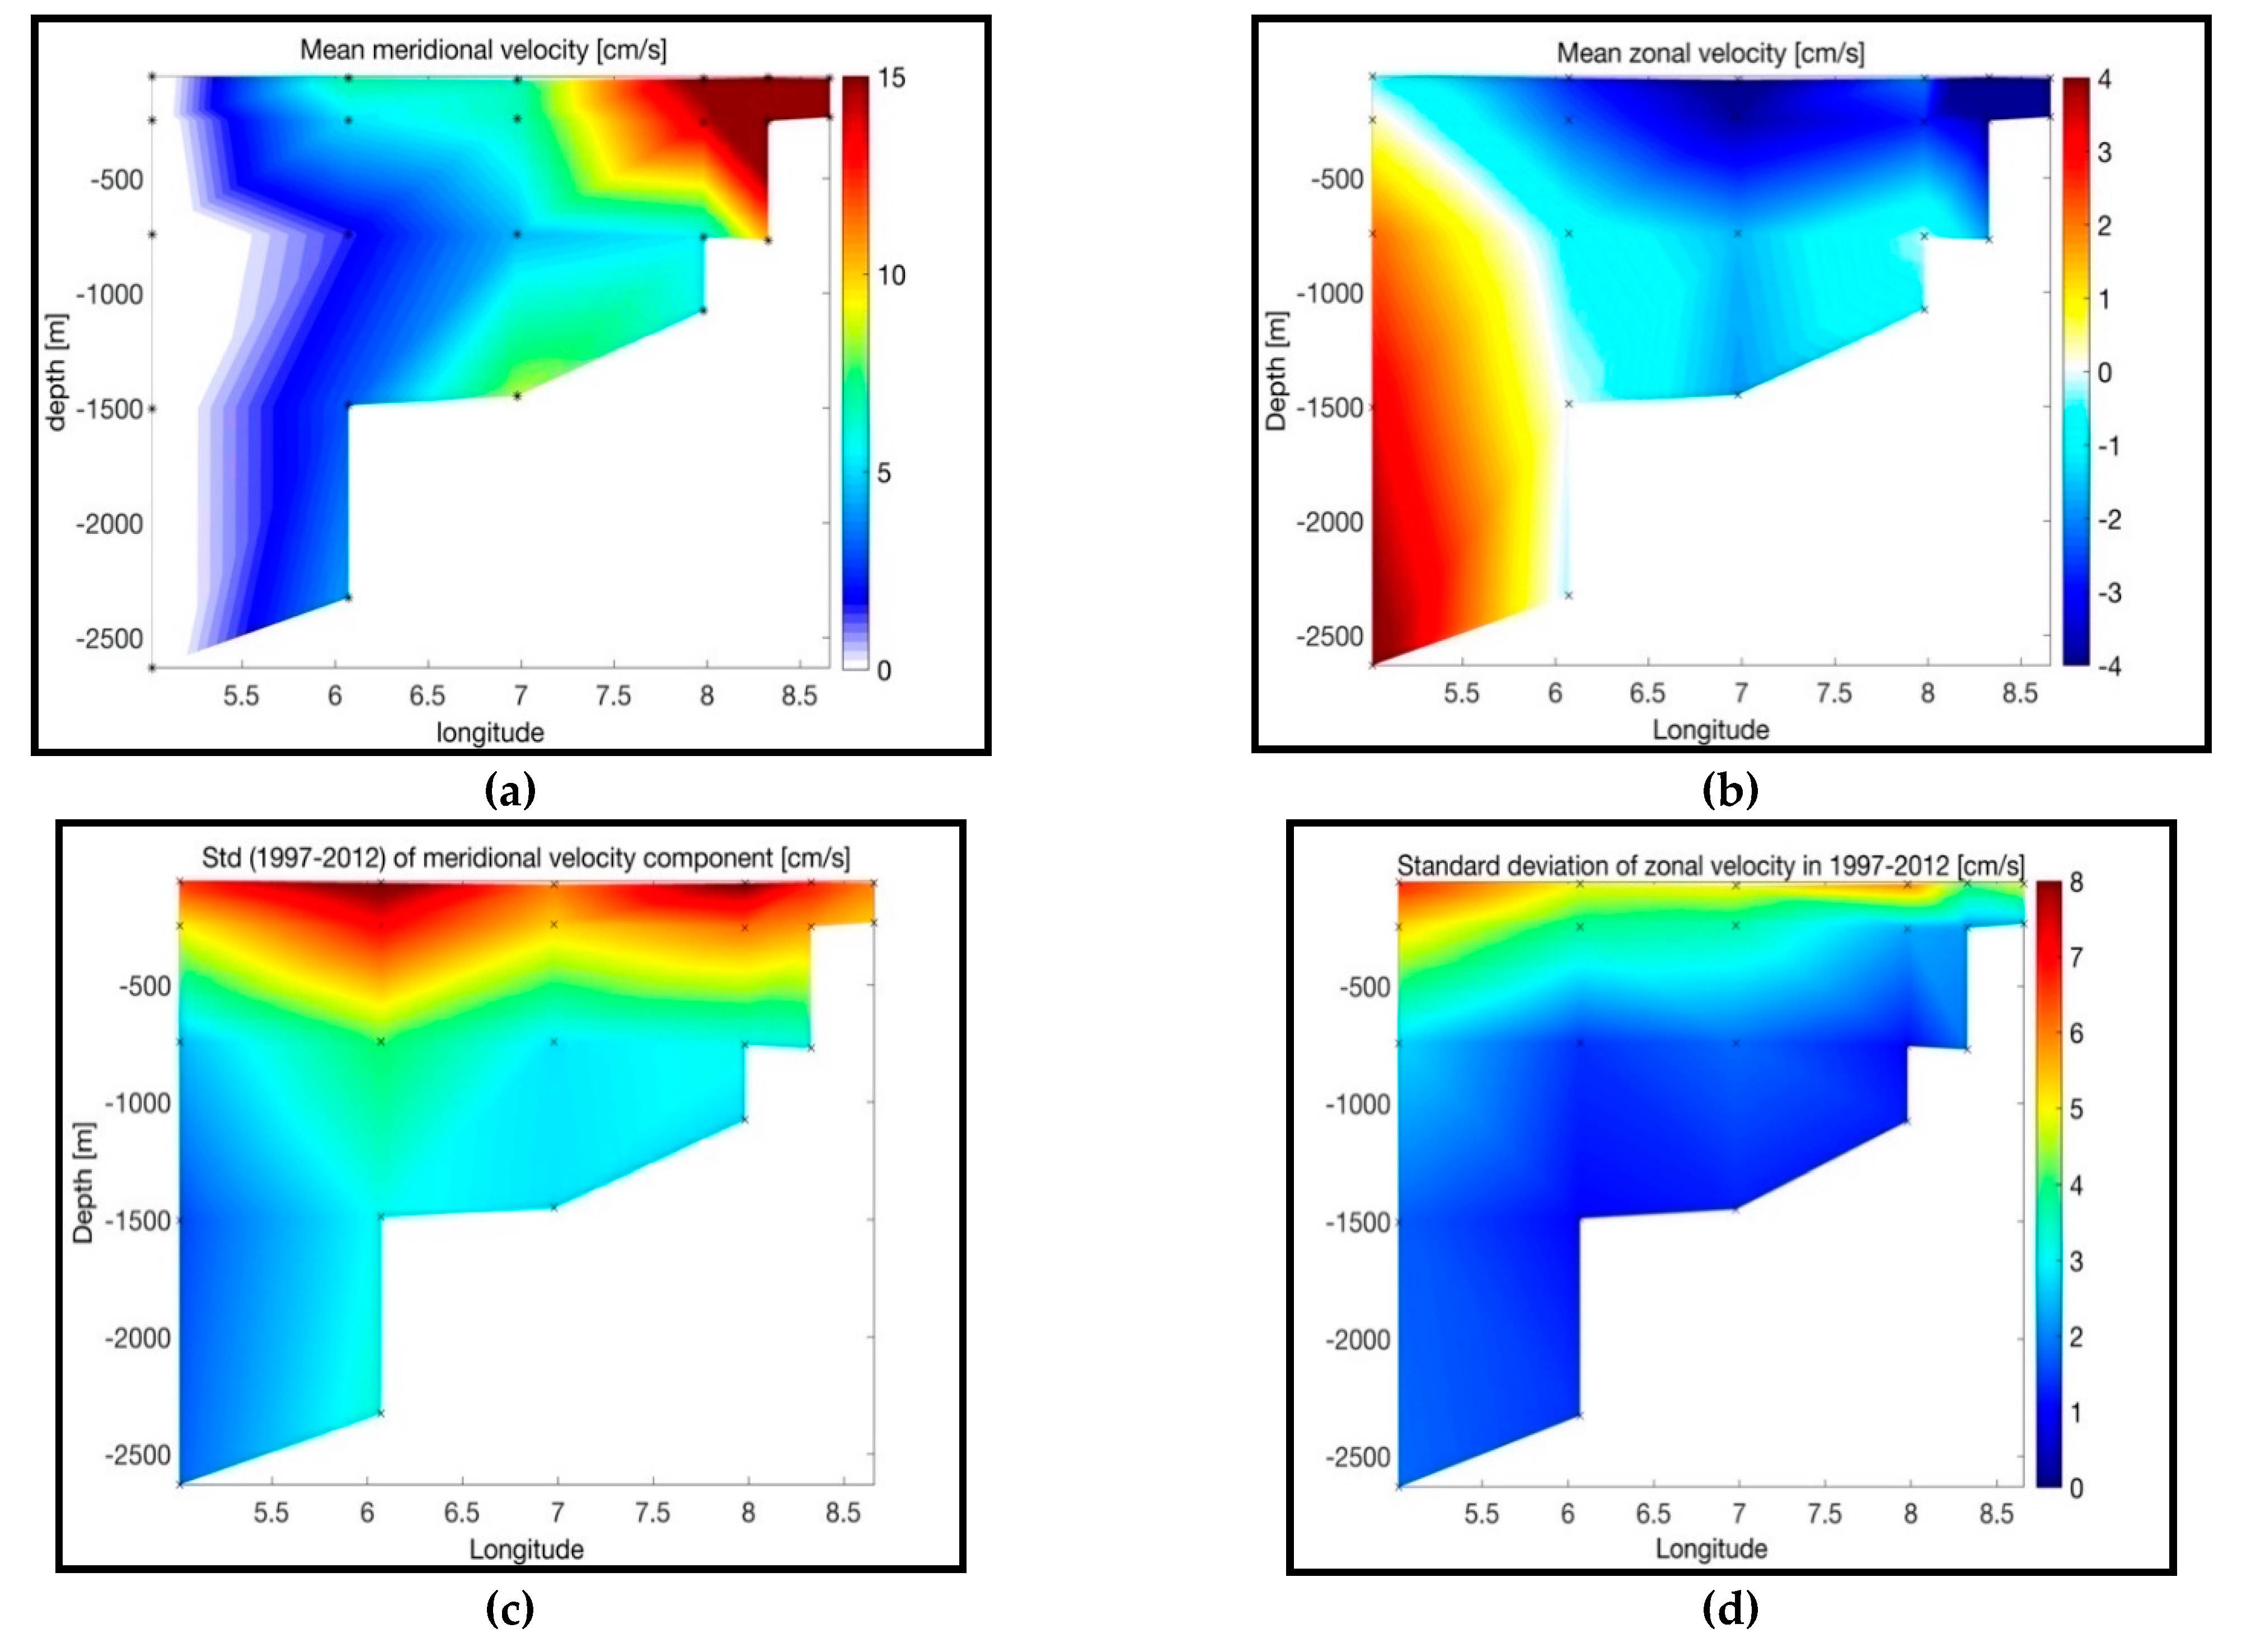
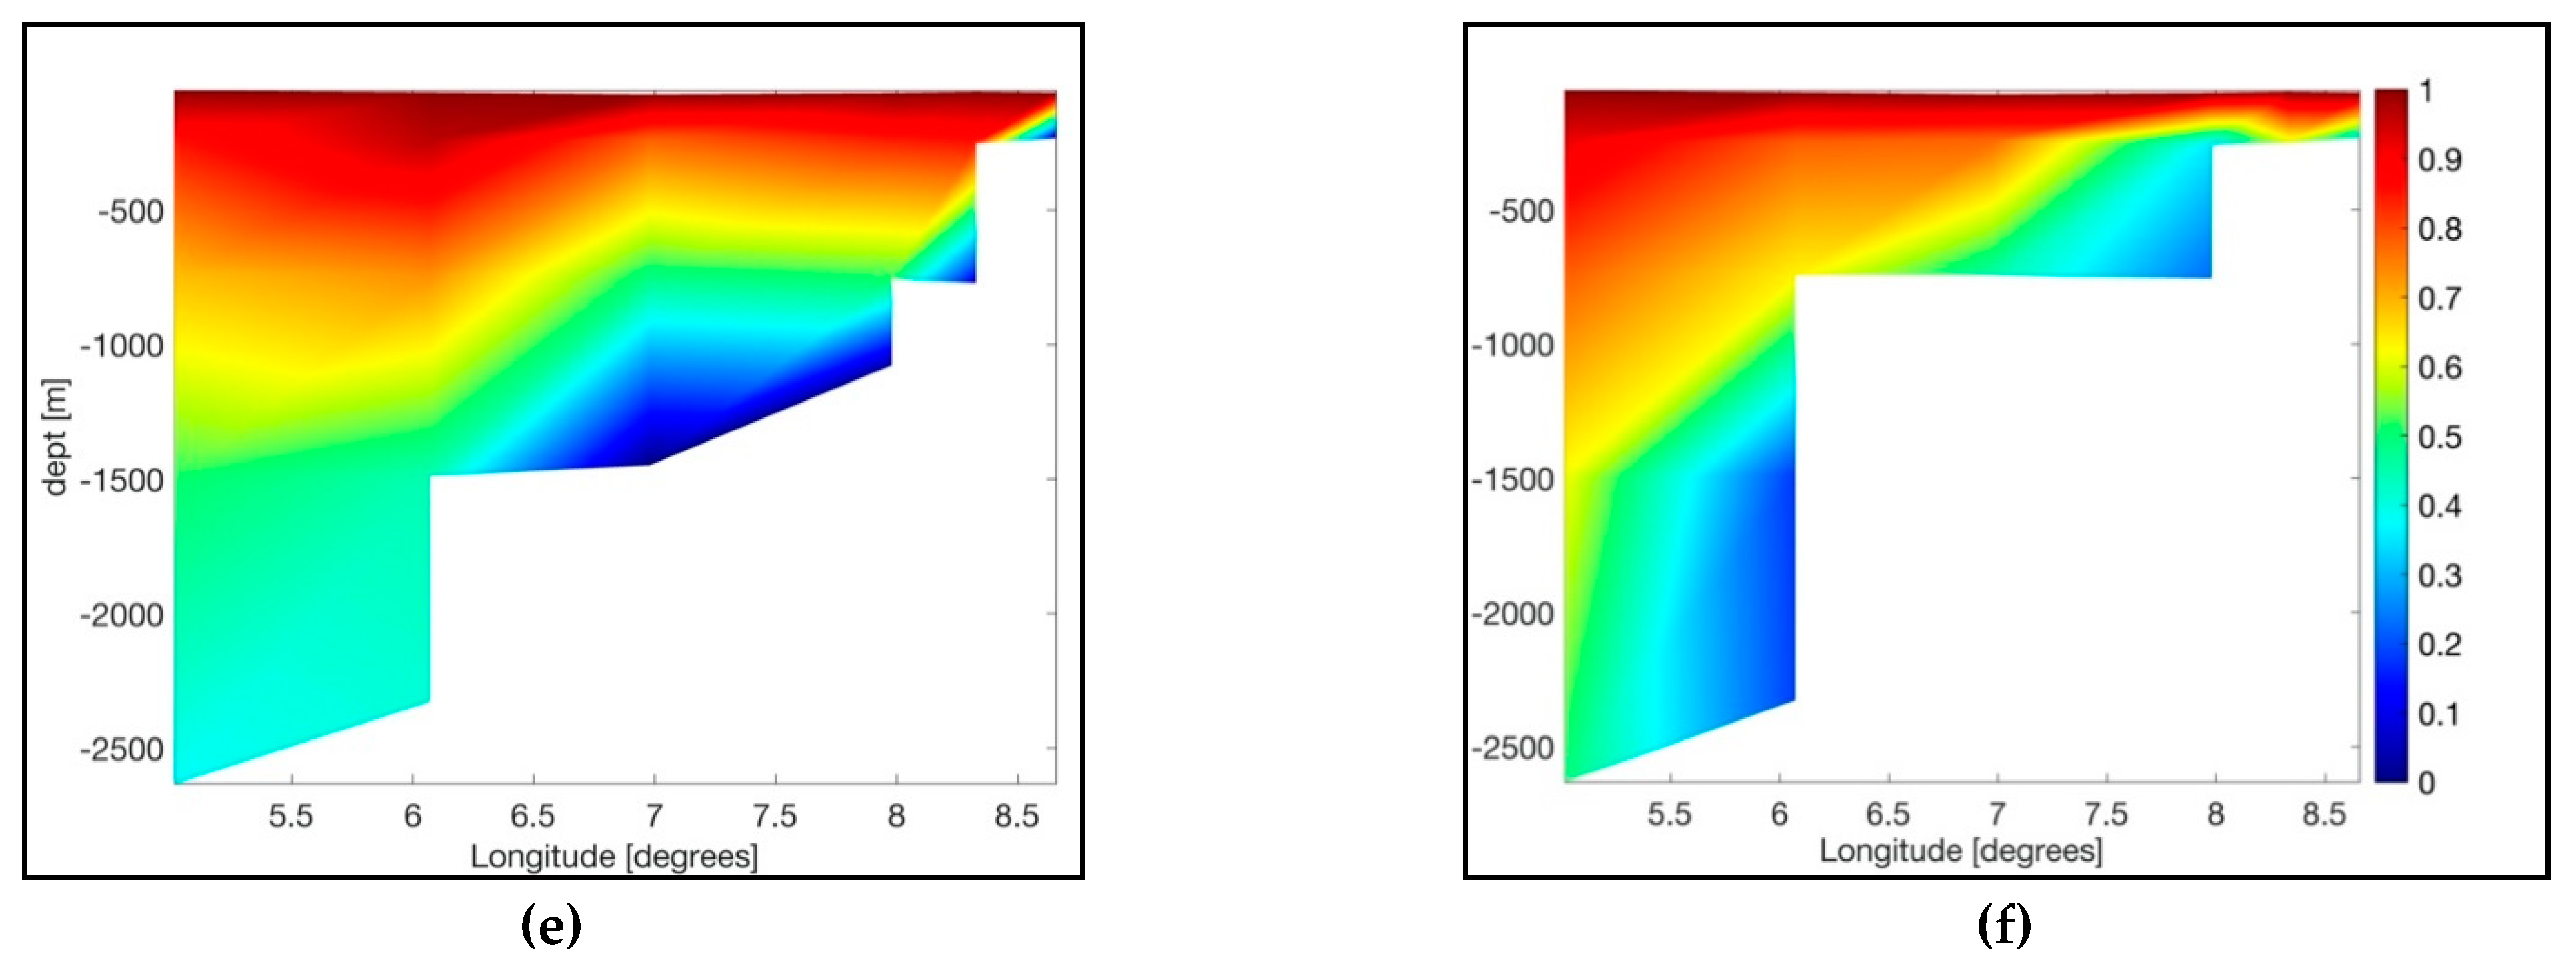
Figure 2.
Main statistics for the Fram Strait long-term measurements: mean currents of (a) meridional velocity component, (b) zonal velocity component, standard deviations of (c) meridional and (d) zonal velocities, and Pearson correlations calculated for the top mooring (75 m) and deeper moorings at the same geographical position in 1997-2012 for (e) meridional and (f) zonal velocities.
3.2. Vertical Structure of WSC
To determine the main vertical structure and its variability in the West Spitsbergen Current (WSC) within the Fram Strait, we employed empirical orthogonal functions (EOFs) for meridional velocities, as the direction of the flow is mainly northward and the zonal flow is more affected by recirculation (Figure 3). The first two EOFs, which account for 53% of the total variance during the analyzed period, were found to be statistically significant following the criteria of North et al. (1982).
The first EOF displays two antiphase oscillations between the two branches of the WSC, with no oscillations observed in between them (around F4 mooring). The offshore branch's center is located at F5, while the core branch is at F3. Notably, these oscillations exhibit significant seasonal variations, aligning with the winter strengthening of the WSC and the increased recirculation reported by Von Appen et al. (2016a). The second EOF reveals a different pattern, characterized by in-phase oscillations of the two WSC branches. The offshore branch remains centered at F5, but the core branch's center shifts eastward to the shallower location of F2. The associated Principal Components (PCs) also exhibit strong seasonal variations.
Both PCs are moderately correlated (0.56 and 0.64) with the core WSC branch, the offshore branch (0.59 and 0.56), and the total transport (0.47 and 0.66). These significant correlations between the WSC transports and the two principal components can be attributed to a strong seasonal signal present in all the data.
To investigate the long-term interannual relationship between WSC transports and the dominant modes of WSC velocity variability, we applied 13-months low-pass filtering to the data before performing EOF calculations. By considering the results of the EOF calculated using the filtered data, the variance explained by the two most important EOF patterns increased to 67%. This enhanced understanding of the dominant modes of variability in the WSC provides valuable insights into the complex dynamics of the current system and its interannual variability in the Fram Strait.
3.3. Comparison of In Situ and Remotely Observed Currents
Figure 4 provides a comparison between the means and standard deviations of absolute altimetry-derived surface geostrophic currents and the in situ currents measured in the Fram Strait, along with their spatial autocorrelation functions calculated for anomalous (detrended) currents. The in situ meridional velocity increases eastward towards the core branch of the WSC, and a similar trend is observed in the altimetry-derived currents, occurring at about 50 km to the south of the mooring array at 78.375°N. This suggests a southward bias in the mean sea surface derived from the altimetry data, however the altimetry-derived currents represent an average over a greater area. The altimetry-derived currents show smaller mean velocities by about 5-10 cm s-1 compared to the in situ-measured currents, and they exhibit a strength more similar to the much deeper flow measured at 750 m depth. However, the mean zonal velocities measured in situ decrease eastward, which is opposite to the pattern observed in the altimetry-derived currents.
Analyzing the spatial autocorrelation functions allows us to determine the effective resolutions of the two data sets. The resolved spatial scales of the altimetry-derived currents are smaller for the meridional velocities and are similar to those observed in situ. However, the zonal velocities have a much larger effective spatial resolution compared to the ones observed in situ. In Table 4, time series of in situ meridional currents are compared with surface geostrophic currents from the nearest grid point to each mooring. This analysis helps to understand the correspondence and differences between the observed and altimetry-derived current measurements at specific locations. Overall, the comparison between altimetry-derived currents and in situ measurements provides valuable insights into the accuracy, biases, and effective resolutions of the different data sets, contributing to a more comprehensive understanding of the ocean currents in the Fram Strait.
The analysis of absolute root mean square (RMS) differences between 1997 and 2012 reveals values ranging from 6 to 18 cm s-1 for absolute currents and between 5 and 8.5 cm s-1 for anomalous currents (after removing the temporal mean in 1997-2012 from both datasets). These significant RMS differences indicate that the mean circulation present in the altimetry-derived product does not accurately capture the mean WSC core branch. Moreover, larger RMS differences obtained for the anomalous currents in the core of the WSC indicate an underestimation of WSC core branch variability in the altimetry-derived data.
The amplitude of seasonal variability in the altimetry-derived surface geostrophic currents is much smaller compared to the in situ currents, and it increases westward. Conversely, the in situ currents show an eastward increase in the seasonal amplitudes. The spatial pattern of the seasonal cycle agrees well in the center of the mooring array, showing an increase in seasonal amplitudes between F3 and F5. However, the altimetry-derived data exhibit maximum currents (phase) occurring 2-3 months earlier at the WSC core, whereas they agree well with the in situ currents for the WSC offshore branch (F3-F5).
Pearson correlation coefficients were calculated for the altimetry-derived and in situ currents, and the results show that the greatest correlations for the meridional velocity occur at the core of the WSC (F3). On the other hand, the greatest correlations between zonal components were found for the offshore branch of the WSC (F5). The correlations are strongest at subsurface depths (250 m) and decrease with depth, indicating that the altimetry-derived currents better align with the in situ measurements at shallower depths.
Overall, the comparison between the altimetry-derived and in situ currents highlights discrepancies in the representation of the mean circulation and seasonal variability in the WSC core branch, with the altimetry data showing larger RMS differences and underestimation of variability. However, the spatial pattern of the seasonal cycle exhibits good agreement in certain areas of the mooring array, and the correlation coefficients reveal a stronger alignment between the datasets at subsurface depths and at specific locations along the WSC.
Figure 5.
Pearson correlations coefficients (R), significant at 95% confidence level, obtained for the monthly in situ measured currents along 78.83°N and altimetry-derived geostrophic currents in 1997-2012: (a) Pearson correlations for the zonal currents, (b) Pearson correlations for the meridional currents.
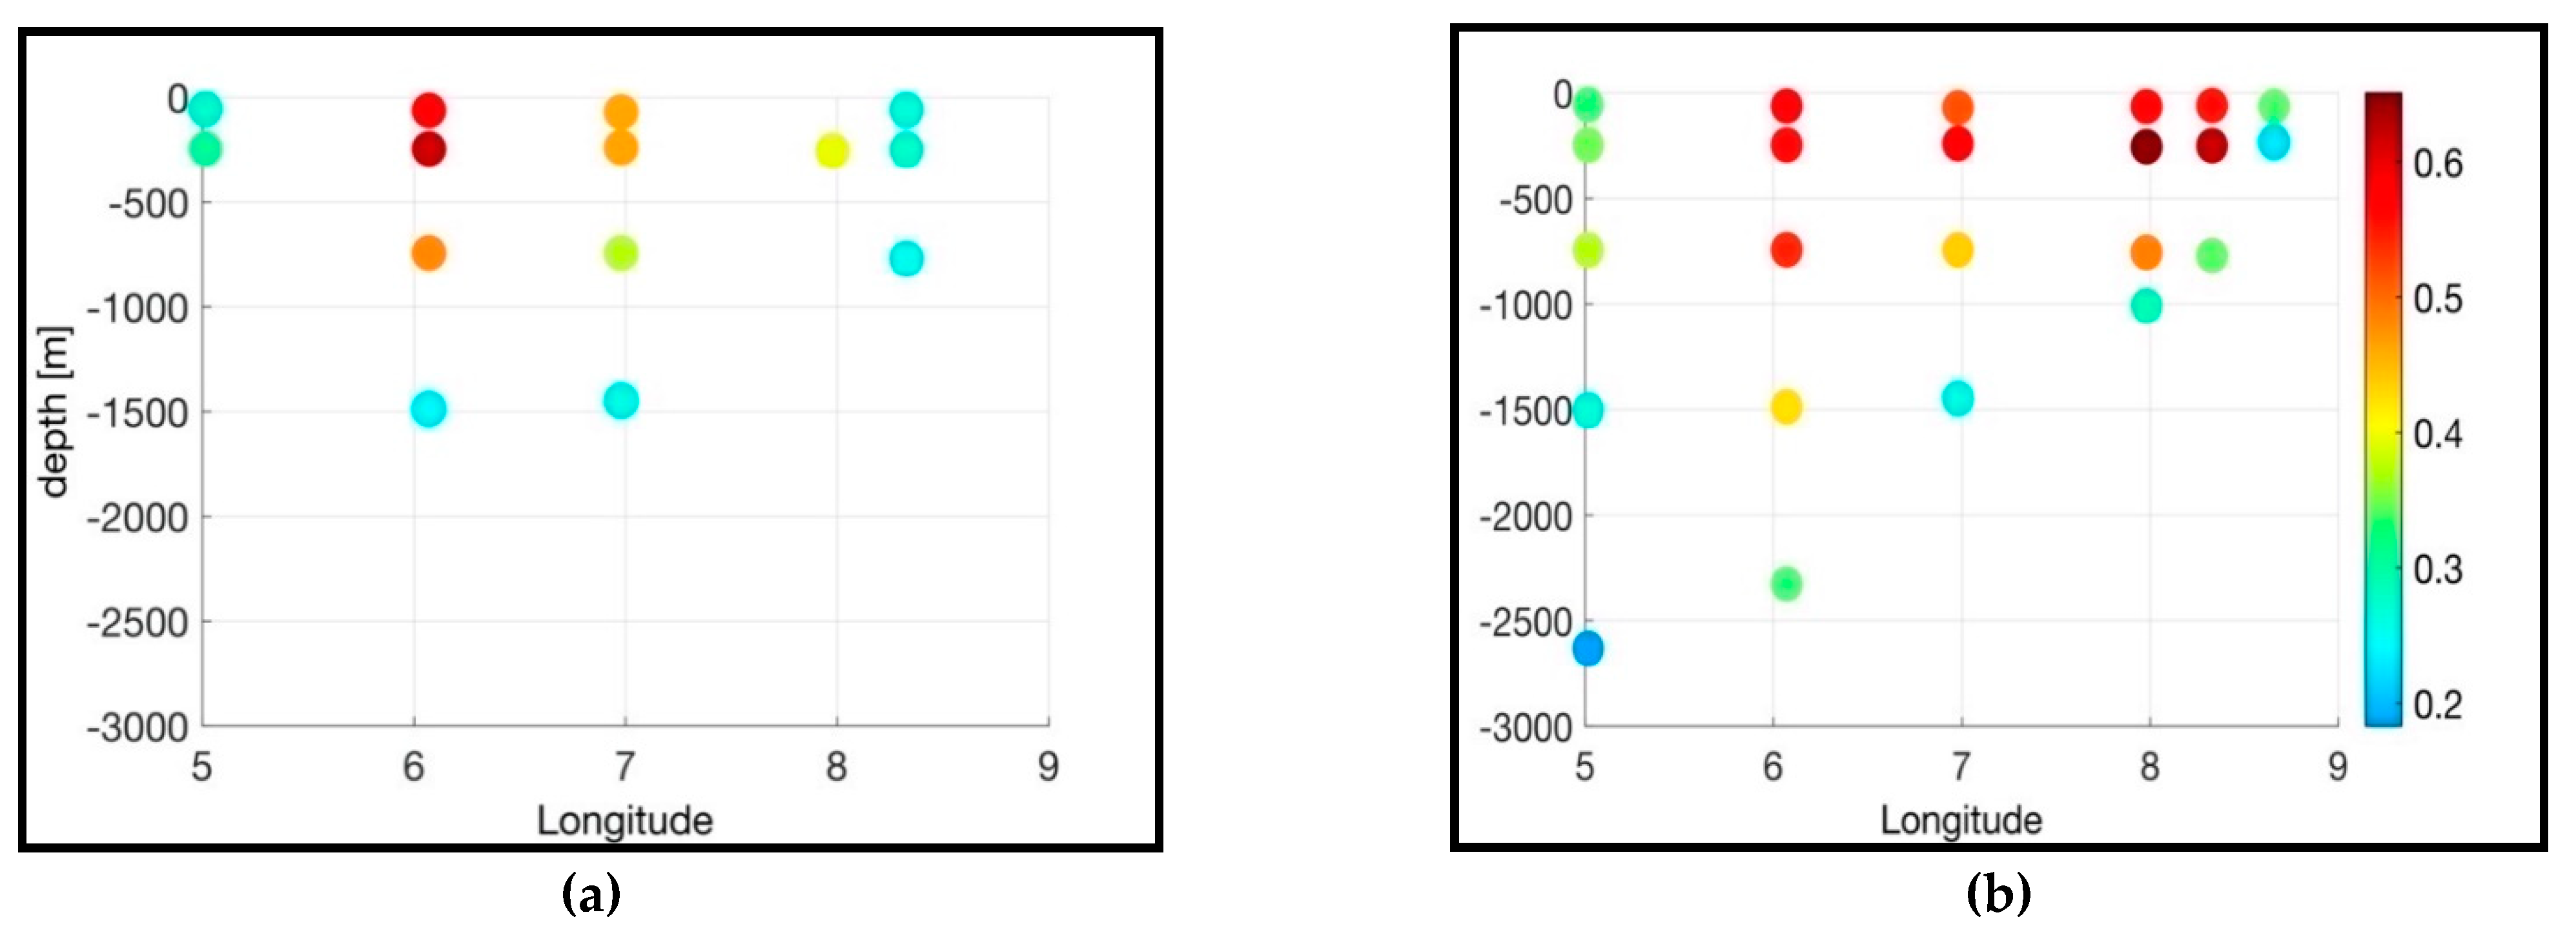
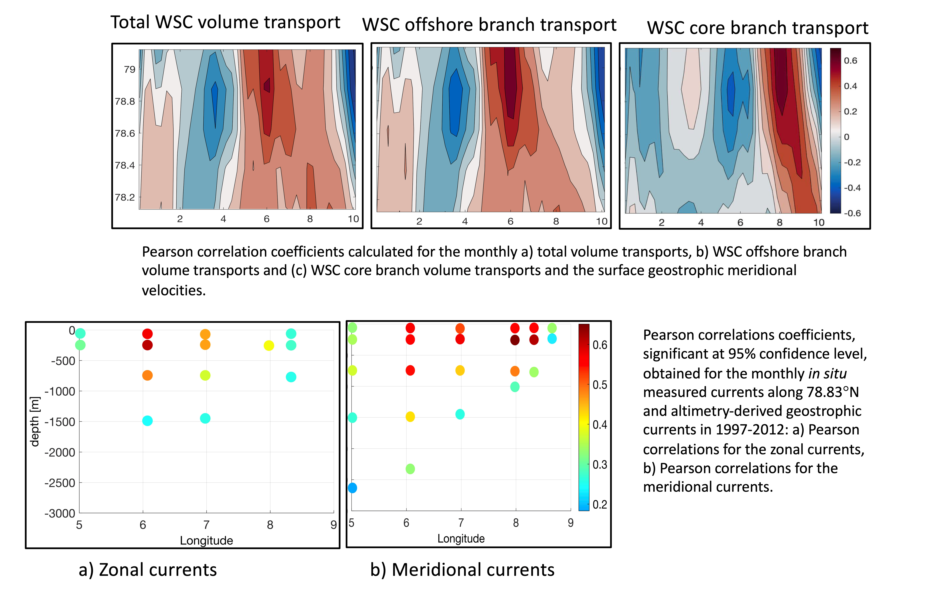
Figure 6 displays Pearson correlation maps between the WSC volume transports and surface geostrophic currents. The highest correlations are observed at 8°E and 6°E for the core, offshore, and total transports. These correlation maps provide insights into the contributions of specific regions to the transports of the individual branches as well as the total WSC transports. The WSC core branch is found to flow between longitudes of 8-10°E, while the offshore branch flows between 5-7°E. The regions around 8°E and 6°E are particularly significant for influencing the volume transports of both the core and offshore branches. Additionally, for the total WSC volume transports, the most crucial areas are found between approximately 5-7°E, indicating the significant importance of the offshore branch for the overall transport estimates of the WSC.
Similar correlation maps were obtained for the two leading principal components (obtained in the previous section) and the surface geostrophic currents, as shown in Figure 6d,e. These correlation patterns further emphasize the relationship between the dominant modes of variability in the WSC and the surface geostrophic currents.
In summary, the correlation maps presented in Figure 6 provide valuable spatial information about the regions contributing to the volume transports of the WSC branches and the total WSC transport. They help to identify key areas of influence and highlight the significance of the offshore branch in the total WSC transport estimates. Moreover, the correlation patterns obtained for the principal components further emphasize the link between the dominant modes of variability and the surface geostrophic currents in the Fram Strait.
The wavelet cross-coherence analysis between the WSC transports of individual branches and surface geostrophic currents (Figure 7) reveals the frequencies and times at which these data exhibit covariance. For the WSC core branch, common variability is observed at periods shorter than 2 years (equivalent to 0.5 cycles per year). The covariability of the offshore branch and total transports, on the other hand, occurs over a broader range of frequencies, ranging from intraseasonal (around 6 months) to multiannual scales (greater than 4 years, or 0.25 cycles per year).
The covariability of the WSC core branch is primarily dominated by higher frequencies of months, except for the period between 2001 and 2004 when the covariability occurred at longer periods, ranging from 2 to 4 years. This indicates a shift in the dominant frequencies during that specific time span. Figure 7d illustrates that zonal currents may contribute to the observed variability of the WSC offshore branch volume transports across temporal scales from monthly to annual. This contribution could be influenced by the westward recirculation of currents in the region.
In summary, the wavelet cross-coherence analysis provides valuable insights into the temporal covariability between the WSC transports and surface geostrophic currents, shedding light on the dominant frequencies and their variations over time. The results indicate varying patterns of covariability for different WSC branches, contributing to a better understanding of the complex dynamics and interactions in the Fram Strait.
4. Discussion
This study uses reprocessed sea level anomaly (SLA) data, absolute dynamic topography, and geostrophic velocities obtained from the Copernicus Marine Environment Monitoring Service (CMEMS) as a gridded product. Two data types were analysed and compared: i) in situ observations of ocean currents and ii) surface geostrophic currents calculated using sea surface height (SSH) measurements from satellite altimeters. In situ observations of ocean currents were collected in the Fram Strait at 78.430°N from 1997 to 2012. These observations revealed two branches of the West Spitsbergen Current (WSC) between 9-5°E: i) a very narrow (about 20 km-wide) and strong (>20 cm/s) WSC core branch flowing above the bathymetric slope at depths ranging from 240 m to 1080 m, and ii) a second (about 55 km-wide) offshore branch located between 8-5°E in deep waters (1100-2640 m). Previous studies of [13] described interannual WSC transport variability, and [12] discussed seasonal variability of the meridional flow but only in the top 250 m of the water column, using the same in situ measurements as analysed in this study. Therefore, our analysis focused on the vertical and horizontal variability of the WSC, its vertical and horizontal coherency, and its relationship to the ocean surface geostrophic currents derived from satellite altimetry.
We found that both velocity components exhibit strong vertical coherency, particularly in the AW inflow region above 800 m depths. The zonal flow was found to be more coherent offshore, whereas the meridional flow was vertically coherent at the cores of the two WSC branches. Our results suggest that subsurface measurements of currents can be used to fill gaps in the mooring data and reconstruct deeper currents with a monthly temporal resolution (65% for the meridional flow) in the top 800 m, which is a direction of future study. However, the horizontal coherency in the across-flow direction was much weaker in the WSC core branch, where it was significant for current speed and direction; and at the offshore branch significant only for the zonal flow.
At small Rossby numbers, without other sources of momentum such as wind and waves, the flow is in geostrophic balance, and surface ocean geostrophic currents can be derived from SSH. Furthermore, in the ocean, geostrophic currents vary with depth due to the thermal wind relation, which results from the hydrostatic and geostrophic balance in the presence of a density gradient along constant-pressure surfaces. Altimetry-derived surface geostrophic velocities were compared with in situ monthly averaged currents at greater depths (75-250 m), where ocean currents are weaker due to vertical shear caused by the thermal wind relationship. Pearson's correlation coefficients obtained for WSC volume transports, mooring measurements of ocean currents, and surface geostrophic velocities demonstrated a large spatial coherence of the WSC current along its path and a smaller coherence across it. The highest correlations were found in the core of WSC (F2/F3) at 250 m for the meridional flow (R2=42%) and in the subsurface waters (250 m) waters of the offshore branch (R2=36%) for the zonal flow.
In regions located to the north of 66°N, the spatial and temporal coverage of satellite altimetry data is much lower due to a smaller number of satellites. However, satellite tracks are converging in the polar regions, affecting the effective spatial and temporal resolutions of the satellite-derived currents. Most satellites orbiting these regions have long repeat cycles of 35 days, resulting in an estimated effective temporal resolution of the gridded product of about 20-30 days during 2009 in the WSC region. The spatial resolution is also limited to larger scales of about 20-30 km, which may be the reason why the CMEMS product has smaller root mean square (RMS) differences in the offshore WSC branch (5-7.5 cm s-1) but does not accurately reflect the core branch of the WSC and underestimates its variability.
The study demonstrated that the two leading empirical orthogonal functions (EOFs) reflect the long-term variability of the two WSC branches, which are concentrated in the top 750 m of the water column and are significantly correlated to altimetry-derived geostrophic currents. These EOFs can reproduce 63% and 77% of the offshore and core branches' transport variability when considering interannual timescales. They are also capable of reproducing most of the velocity variance on the monthly (55%) and interannual (67%) timescales in the analysed period.
The altimetry-derived surface geostrophic currents are found to reflect WSC volume transports quite well (R=0.67), as shown by the analysis of correlations between altimetry-derived geostrophic currents and total, core and offshore branch volume transports. The RMS differences between in situ and satellite-derived currents were found to be smaller (ranging between 5-8.5 cm/s) when considering anomalous currents, in contrast to previous studies comparing long-term averaged meridional velocities. However, correlations between individual moorings in this study were similar to those found in other regions, such as the Beaufort Gyre and Florida Current [21,22], where correlations between 0.3-0.7 were reported. The surface geostrophic currents were found to be weaker and have a smaller variability compared to in situ currents, which is consistent with previous studies in other regions. This discrepancy can be attributed to the effective resolution of the satellite-derived currents, the smoothing applied to reduce residual noise in the along-track data, and the mapping errors caused by gridding of altimetry data. Additionally, the disagreement between the two data could be influenced by vertical shear as a result of the thermal wind relationship.
Ocean currents are a complex combination of different types of oscillations, spanning a continuous spectrum of space and time scales. As a result, any averaged current is a function of the averaging period and location. Current metres measure the actual current speeds, whereas satellite sea surface height is used to estimate only the geostrophic part of total surface currents, and does not account for the ageostrophic part driven by winds, waves, and short temporal and spatial scale fluctuations due to mesoscale and submesoscale ocean processes. The baroclinic Rossby radius of deformation in the Fram Strait is about 4-6 km ([23]). Previous studies of [24,25] have shown strong mesoscale activity in the WSC in winter, dominating the observed variability during this season. Adequate modelling of mesoscale motions and measured eddy kinetic energy in the WSC requires a 1 km model grid ([24]). However, several altimeters are necessary to monitor mesoscale eddies as was demonstrated by [26,27], which was the case for most of the analysed period. Nevertheless, the CMEMS product involves the along-track filtering of SSH, removing smaller scale variations (less than 70 km) in the along-track direction and interpolating height data from multiple tracks, which smooths sharp changes in height. As a result, the derived velocities represent a mean value over a large area, capturing the seasonal and interannual variations of the WSC associated with larger physical scales.
In conclusion, several factors influence the comparison of the two analysed data sets. An investigation of the contribution of each specific factor was not possible in this study, but should be analysed in future research. Using all available satellite missions in the polar regions could significantly improve the quality of gridded altimetry ocean currents. Therefore, it is recommended to use ICESat-NASA SSH data in the production of gridded products, which could improve the historic data from 2003 to 2010 in the polar regions. Fortunately, the number of satellite altimeters in the polar regions has been increasing, and future altimetry products will provide improved spatio-temporal resolution and a better representation of mesoscale oceanic processes.
5. Conclusions
In this study, the following key findings regarding the West Spitsbergen Current were obtained:
- Strong vertical coherency observed in both velocity components of the West Spitsbergen Current highlights the importance of subsurface measurements for deeper current reconstruction. Strong vertical coherency is observed in both velocity components, particularly in the AW inflow region above 800 m depths.
- Horizontal coherency patterns show higher coherence offshore for zonal flow and vertical coherence at the cores of the two WSC branches for meridional flow.
- Pearson's correlation coefficients demonstrate significant vertical coherence of the WSC, indicating potential utility of empirical orthogonal functions (EOFs) in understanding volume transport variability on interannual timescales.
- Limitations in satellite altimetry data, such as lower spatial and temporal coverage, affect the accuracy of current estimations, particularly in the core WSC branch.
- Discrepancies between in situ and satellite-derived currents underscore the need to account for mesoscale ocean processes and small-scale fluctuations.
In summary, this study provides valuable information on the vertical coherence of the WSC and its relationship with satellite-derived surface geostrophic currents. The results highlight the strengths and limitations of using CMEMS gridded products to capture WSC variability and emphasise the importance of considering both in situ and satellite data to obtain a comprehensive understanding of ocean currents in the Fram Strait region. Future efforts to improve the resolution and accuracy of satellite altimetry data in polar regions would enhance our ability to study mesoscale and submesoscale ocean processes, ultimately contributing to a better understanding of the complex dynamics of the WSC.
Funding
This research was funded by by the European Space Agency Postdoctoral Living Planet Fellowship, grant number 4000112786/15/I-SBo.
Data Availability Statement
CMEMS Marine Service provided DUACS L4 altimetry-derived currents. The in situ individual mooring data is a vailable from ftp://ftp.ifremer.fr/ifremer/oceansites/DATA/ and ftp://data.ndbc.noaa.gov/data/oceansites/DATA/ and WSC transport data from http://www.oceansites.org/tma/fram.html.
Acknowledgments
The author thanks Agnieszka Beszczynska-Moller and Wilken von Appen from the Alfred Wegner Institut for providing the long-term daily and monthly Fram Strait in situ data collected between 1997 and 2012.
Conflicts of Interest
The authors declare no conflict of interest.
References
- Armitage, T. W. K., Bacon, S., Ridout, A. L., Petty, A. A., Wolbach, S., & Tsamados, M. (2017). Arctic Ocean geostrophic circulation 2003-2014. The Cryosphere Discussions, March, 1–32. [CrossRef]
- Bulczak, A.I.; Bacon, S.; Garabato, A.C.N.; Ridout, A.; Sonnewald, M.J.P.; Laxon, S.W. Seasonal variability of sea surface height in the coastal waters and deep basins of the Nordic Seas. Geophys. Res. Lett. 2015, 42, 113–120. [Google Scholar] [CrossRef]
- Beszczynska-Möller, A.; Fahrbach, E.; Schauer, U.; Hansen, E. Variability in Atlantic water temperature and transport at the entrance to the Arctic Ocean, 1997–2010. ICES J. Mar. Sci. 2012, 69, 852–863. [Google Scholar] [CrossRef]
- Beszczynska-Moller, A., von Appen, W.-J., & Fahrbach, E. (2015). Physical oceanography and current meter data from moorings F1-F14 and F15/F16 in the Fram Strait, 1997-2012. PANGAEA. [CrossRef]
- de Steur, L.; Hansen, E.; Gerdes, R.; Karcher, M.; Fahrbach, E.; Holfort, J. Freshwater fluxes in the East Greenland Current: A decade of observations. Geophys. Res. Lett. 2009, 36. [Google Scholar] [CrossRef]
- Bauerfeind, E.; Nöthig, E.-M.; Beszczynska, A.; Fahl, K.; Kaleschke, L.; Kreker, K.; Klages, M.; Soltwedel, T.; Lorenzen, C.; Wegner, J. Particle sedimentation patterns in the eastern Fram Strait during 2000–2005: Results from the Arctic long-term observatory HAUSGARTEN. Deep. Sea Res. Part I: Oceanogr. Res. Pap. 2009, 56, 1471–1487. [Google Scholar] [CrossRef]
- Fahrbach, E.; Meincke, J.; Østerhus, S.; Rohardt, G.; Schauer, U.; Tverberg, V.; Verduin, J. Direct measurements of volume transports through Fram Strait. Polar Res. 2001, 20, 217–224. [Google Scholar] [CrossRef]
- Schauer, U., Beszczynska-Möller, A., Walczowski, W., Fahrbach, E., Piechura, J., & Hansen, E. (2008). Variation of measured heat flow through the Fram Strait between 1997 and 2006. In Arctic-Subarctic Ocean Fluxes: Defining the Role of the Northern Seas in Climate. [CrossRef]
- Teigen, S.H.; Nilsen, F.; Gjevik, B. Barotropic instability in the West Spitsbergen Current. J. Geophys. Res. Atmos. 2010, 115. [Google Scholar] [CrossRef]
- Walczowski, W.; Piechura, J.; Osinski, R.; Wieczorek, P. The West Spitsbergen Current volume and heat transport from synoptic observations in summer. Deep. Sea Res. Part I: Oceanogr. Res. Pap. 2005, 52, 1374–1391. [Google Scholar] [CrossRef]
- Aaboe, S.; Nøst, O.A.; Hansen, E. Along-slope variability of barotropic transport in the Nordic Seas: Simplified dynamics tested against observations. J. Geophys. Res. Atmos. 2009, 114. [Google Scholar] [CrossRef]
- von Appen, W.-J.; Schauer, U.; Hattermann, T.; Beszczynska-Möller, A. Seasonal Cycle of Mesoscale Instability of the West Spitsbergen Current. J. Phys. Oceanogr. 2016, 46, 1231–1254. [Google Scholar] [CrossRef]
- Commerce, N. G. D. C. S. D. of. (2011). ETOPO1, Global 1 Arc-minute Ocean Depth and Land Elevation from the US National Geophysical Data Center (NGDC). Research Data Archive at the National Center for Atmospheric Research, Computational and Information Systems Laboratory.
- Volkov, D.L.; Pujol, M.-I. Quality assessment of a satellite altimetry data product in the Nordic, Barents, and Kara seas. J. Geophys. Res. Atmos. 2012, 117. [Google Scholar] [CrossRef]
- Pujol, M., Faug, Y., & Date, A. (2018). Product user manual For Sea Level SLA products. Cmems.
- Taburet, G.; Sanchez-Roman, A.; Ballarotta, M.; Pujol, M.-I.; Legeais, J.-F.; Fournier, F.; Faugere, Y.; Dibarboure, G. DUACS DT2018: 25 years of reprocessed sea level altimetry products. Ocean Sci. 2019, 15, 1207–1224. [Google Scholar] [CrossRef]
- Pujol, M.-I.; Schaeffer, P.; Faugère, Y.; Raynal, M.; Dibarboure, G.; Picot, N. Gauging the Improvement of Recent Mean Sea Surface Models: A New Approach for Identifying and Quantifying Their Errors. J. Geophys. Res. Oceans 2018, 123, 5889–5911. [Google Scholar] [CrossRef]
- Rio, M.-H., Mulet, S., & Picot, N. (2013). New global mean dynamic topography from a goce geoid model, altimeter measurements and oceanographic in-situ data. ESA Living Planet Symposium, Proceedings of the Conference Held on 9-13 September 2013 at Edinburgh in United Kingdom. ESA SP-722. 2-13, p.27.
- Arbic, B.K.; Scott, R.B.; Chelton, D.B.; Richman, J.G.; Shriver, J.F. Effects of stencil width on surface ocean geostrophic velocity and vorticity estimation from gridded satellite altimeter data. J. Geophys. Res. Oceans 2012, 117. [Google Scholar] [CrossRef]
- Ballarotta, M.; Ubelmann, C.; Pujol, M.-I.; Taburet, G.; Fournier, F.; Legeais, J.-F.; Faugère, Y.; Delepoulle, A.; Chelton, D.; Dibarboure, G.; et al. On the resolutions of ocean altimetry maps. Ocean Sci. 2019, 15, 1091–1109. [Google Scholar] [CrossRef]
- Volkov, D.L.; Domingues, R.; Meinen, C.S.; Garcia, R.; Baringer, M.; Goni, G.; Smith, R.H. Inferring Florida Current Volume Transport From Satellite Altimetry. J. Geophys. Res. Oceans 2020, 125, e2020JC016763. [Google Scholar] [CrossRef]
- Armitage, T. W. K., Bacon, S., Ridout, A. L., Petty, A. A., Wolbach, S., & Tsamados, M. (2017). Arctic Ocean geostrophic circulation 2003-2014. The Cryosphere Discussions, March, 1–32. [CrossRef]
- Nurser, A.J.G.; Bacon, S. The Rossby radius in the Arctic Ocean. Ocean Sci. 2014, 10, 967–975. [Google Scholar] [CrossRef]
- Wekerle, C.; Hattermann, T.; Wang, Q.; Crews, L.; von Appen, W.-J.; Danilov, S. Properties and dynamics of mesoscale eddies in Fram Strait from a comparison between two high-resolution ocean–sea ice models. Ocean Sci. 2020, 16, 1225–1246. [Google Scholar] [CrossRef]
- von Appen, W.-J.; Schauer, U.; Hattermann, T.; Beszczynska-Möller, A. Seasonal Cycle of Mesoscale Instability of the West Spitsbergen Current. J. Phys. Oceanogr. 2016, 46, 1231–1254. [Google Scholar] [CrossRef]
- Chavanne, C.P.; Klein, P. Can oceanic submesoscale processes be observed with satellite altimetry? Geophys. Res. Lett. 2010, 37. [Google Scholar] [CrossRef]
- Chelton, D. B., Schlax, M. G., & Samelson, R. M. (2011). Global observations of nonlinear mesoscale eddies. Progress in Oceanography.
Figure 1.
(a) Location of Fram Strait moorings F1-F6 (1997-2012) marked in yellow, together with circulation schematic for the Nordic Seas where blue arrows indicate cold and fresh Arctic outflow transported by the East Greenland Current (EGC) and red arrows show warm and salty Atlantic Inflow transported by the Norwegian Atlantic Slope Current (NwASC), the Norwegian Atlantic Front Current (NwAFC) and the West Spitsbergen Current (WSC); and (b) vertical distribution of the instruments. (c) The moorings (red stars) and the position of the Cryosat-2 (blue stars) and Envisat (triangles) orbit tracks in 35 days together with the location of CMEMS grid points shown as black dots. The bathymetry contour is shown in panels a) and b) and c) was obtained from ETOPO bathymetry ([13])
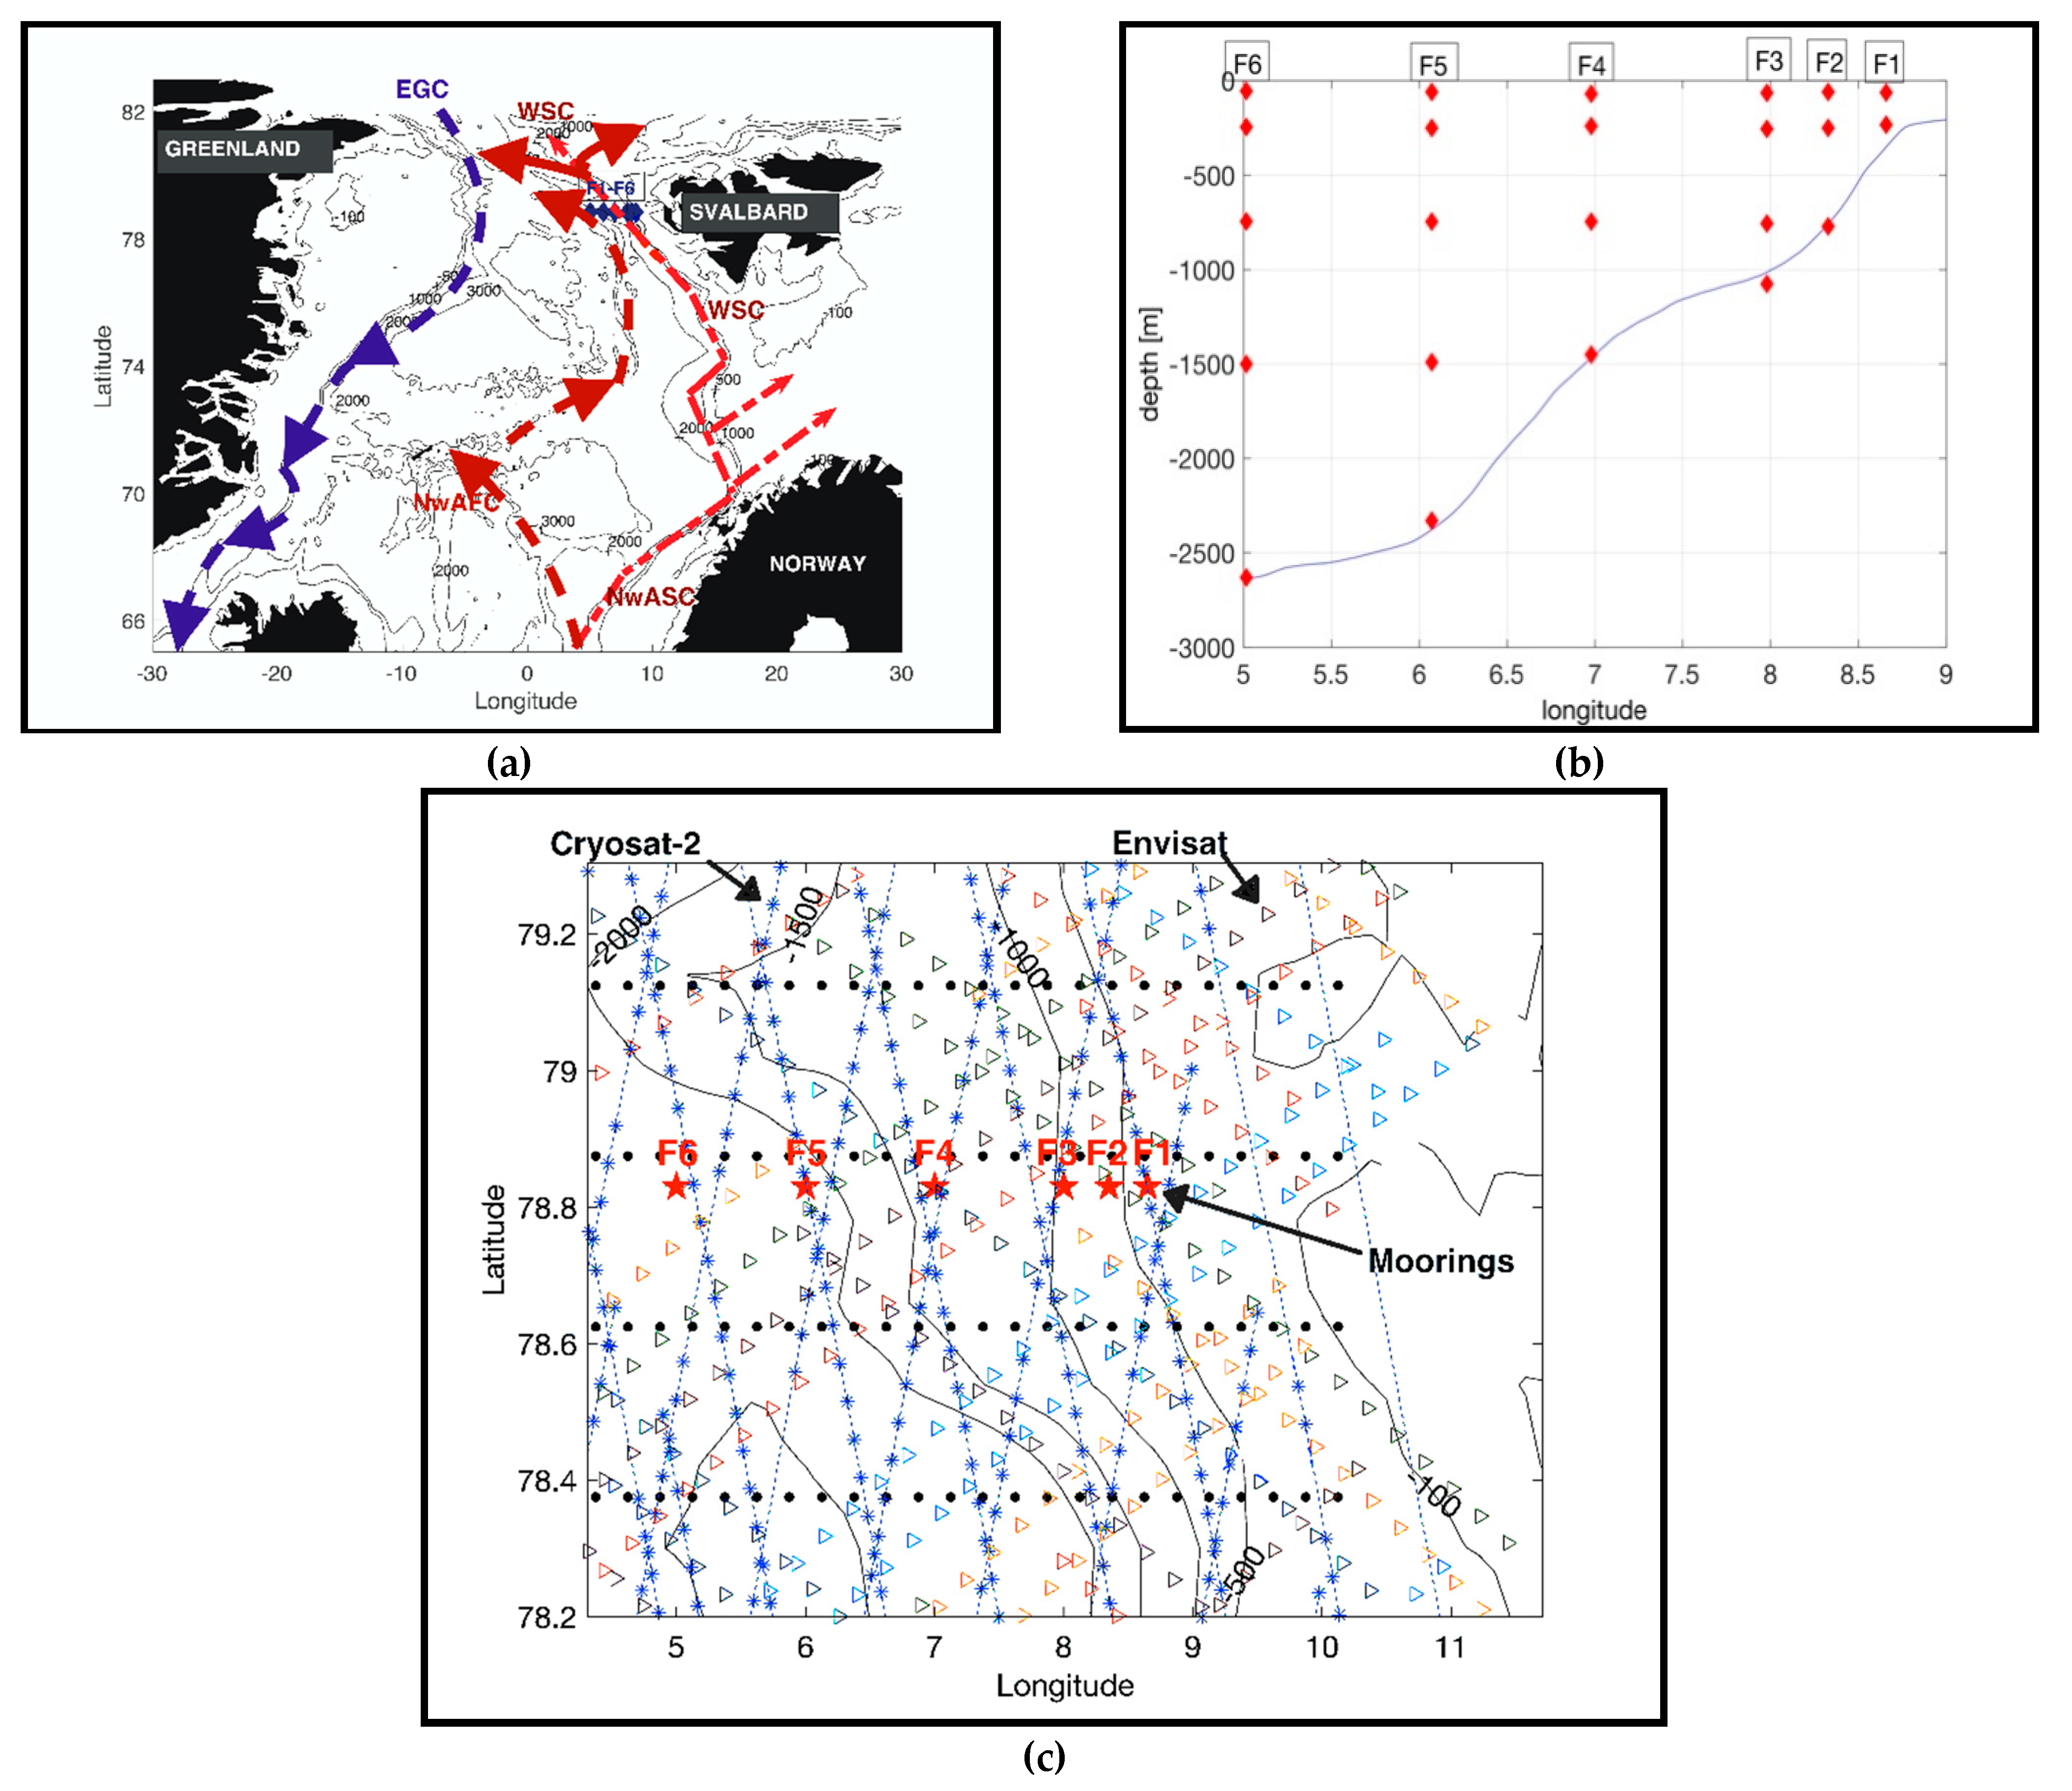
Figure 3.
Two leading Empirical Orthogonal Functions (EOF) for: (a) monthly meridional currents: left: 1st EOF explains 32% of variance , right: 2nd EOF explains 24% of variance, (b) low passed (13-months) monthly meridional currents , left: 1st EOF explains 47% of variance, right: 2nd EOF explains 20% of variance and (c) the corresponding Principal components showing temporal variability of the leading EOFs.
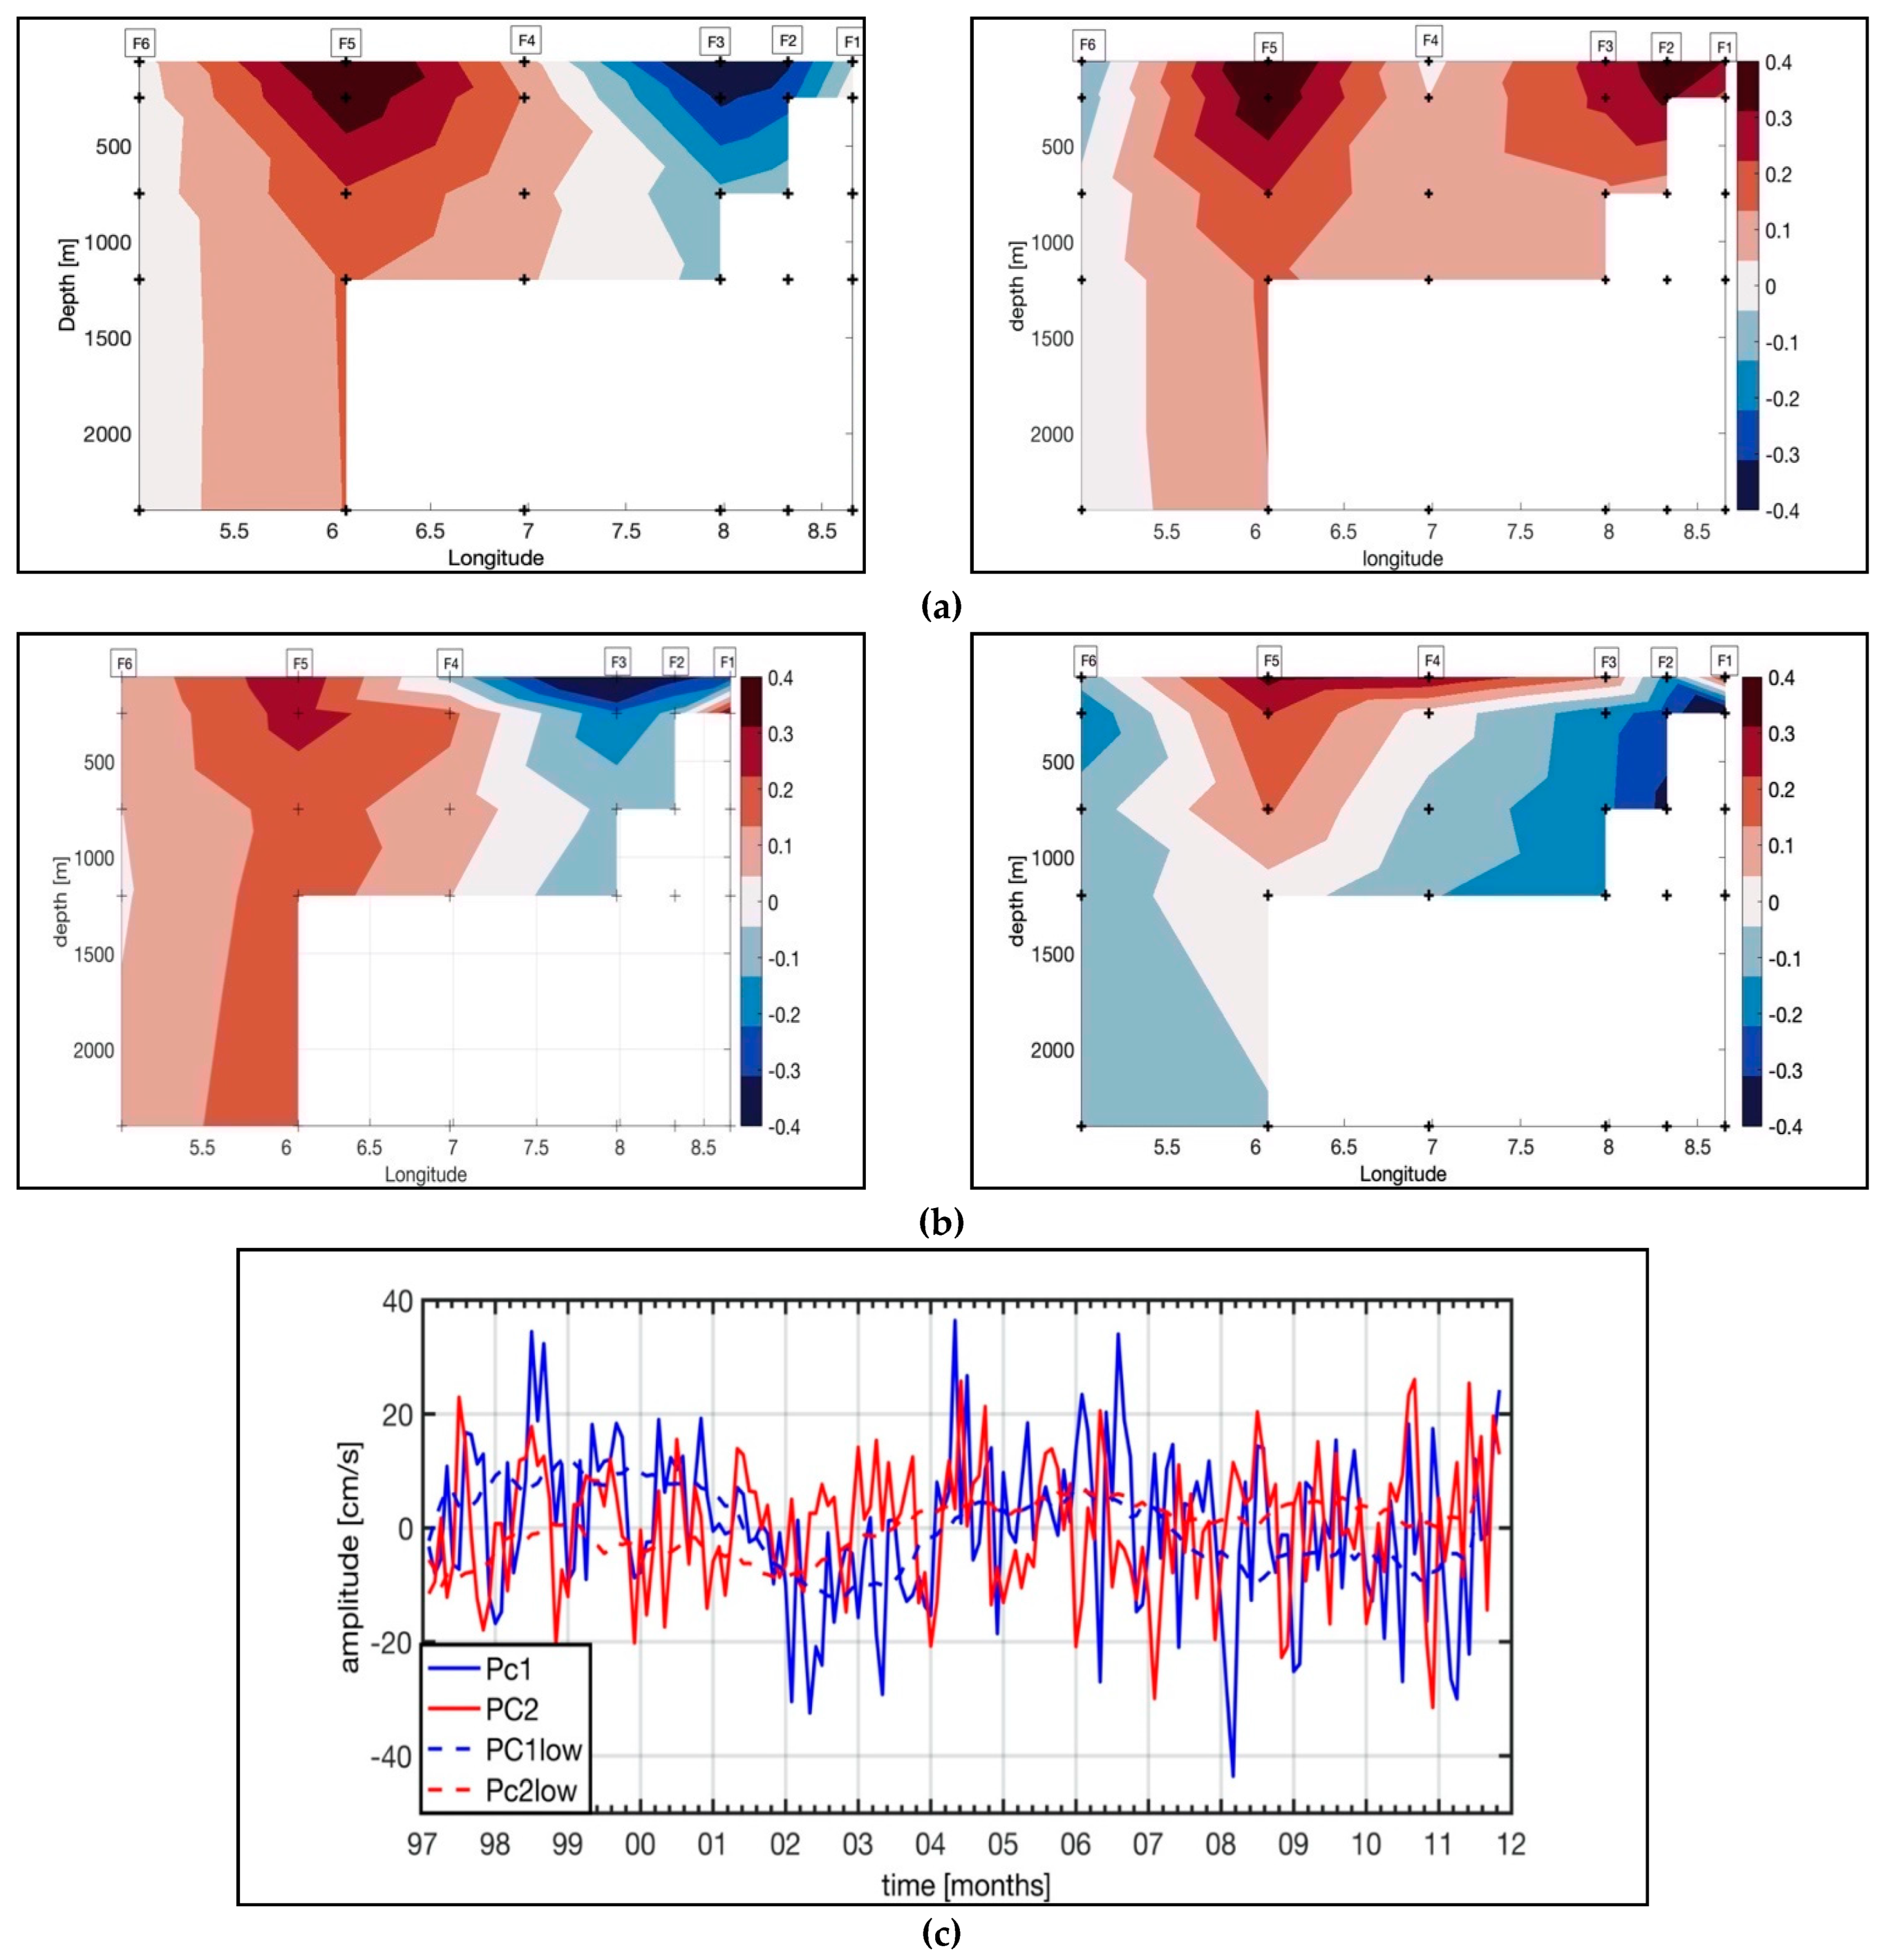
Figure 4.
Comparison of the means (a) and standard deviations (b) for the meridional (left) and zonal (right) velocity components between the in situ observations from moorings located along 78.83°N and altimeter derived geostrophic currents at different latitudes. (c) Mean (1997-2012) autocorrelation functions calculated for the anomalous surface geostrophic currents from CMEMS product (left) and anomalous in situ measured currents (speeds) at two depth levels in the Fram Strait (78.830N) (right). (d) Mean autocorrelation function normalized to one at lag zero calculated for CMEMS absolute detrended currents.

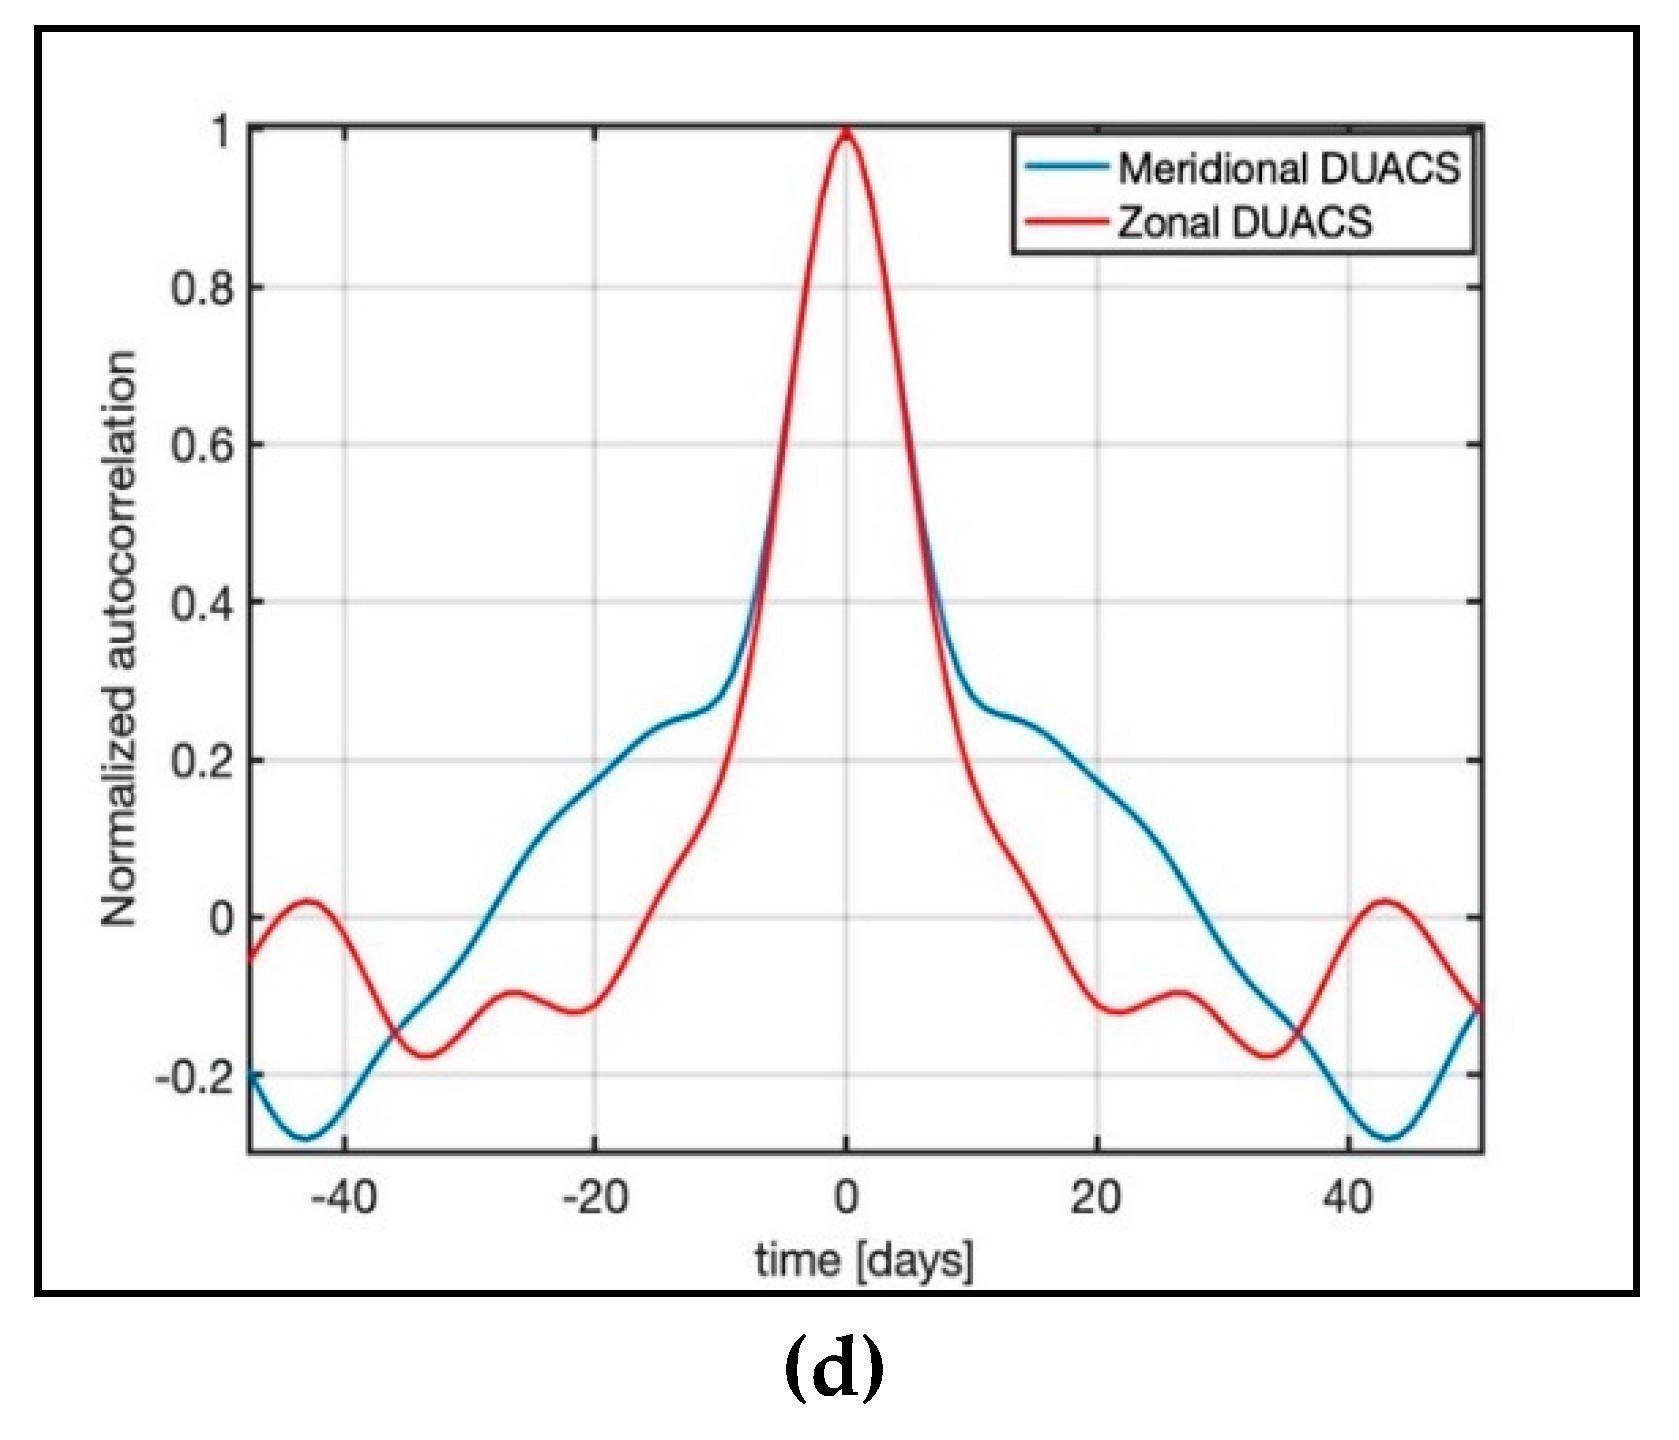
Figure 6.
Pearson correlation coefficient (R) calculated for the monthly (a) total volume transports, (b) WSC offshore branch volume transports and (c) WSC core branch volume transports, (d) 1st Principal component of the in situ measured meridional velocity. (e) 2nd Principal component of the in situ measured meridional velocity and the gridded surface geostrophic meridional velocities.
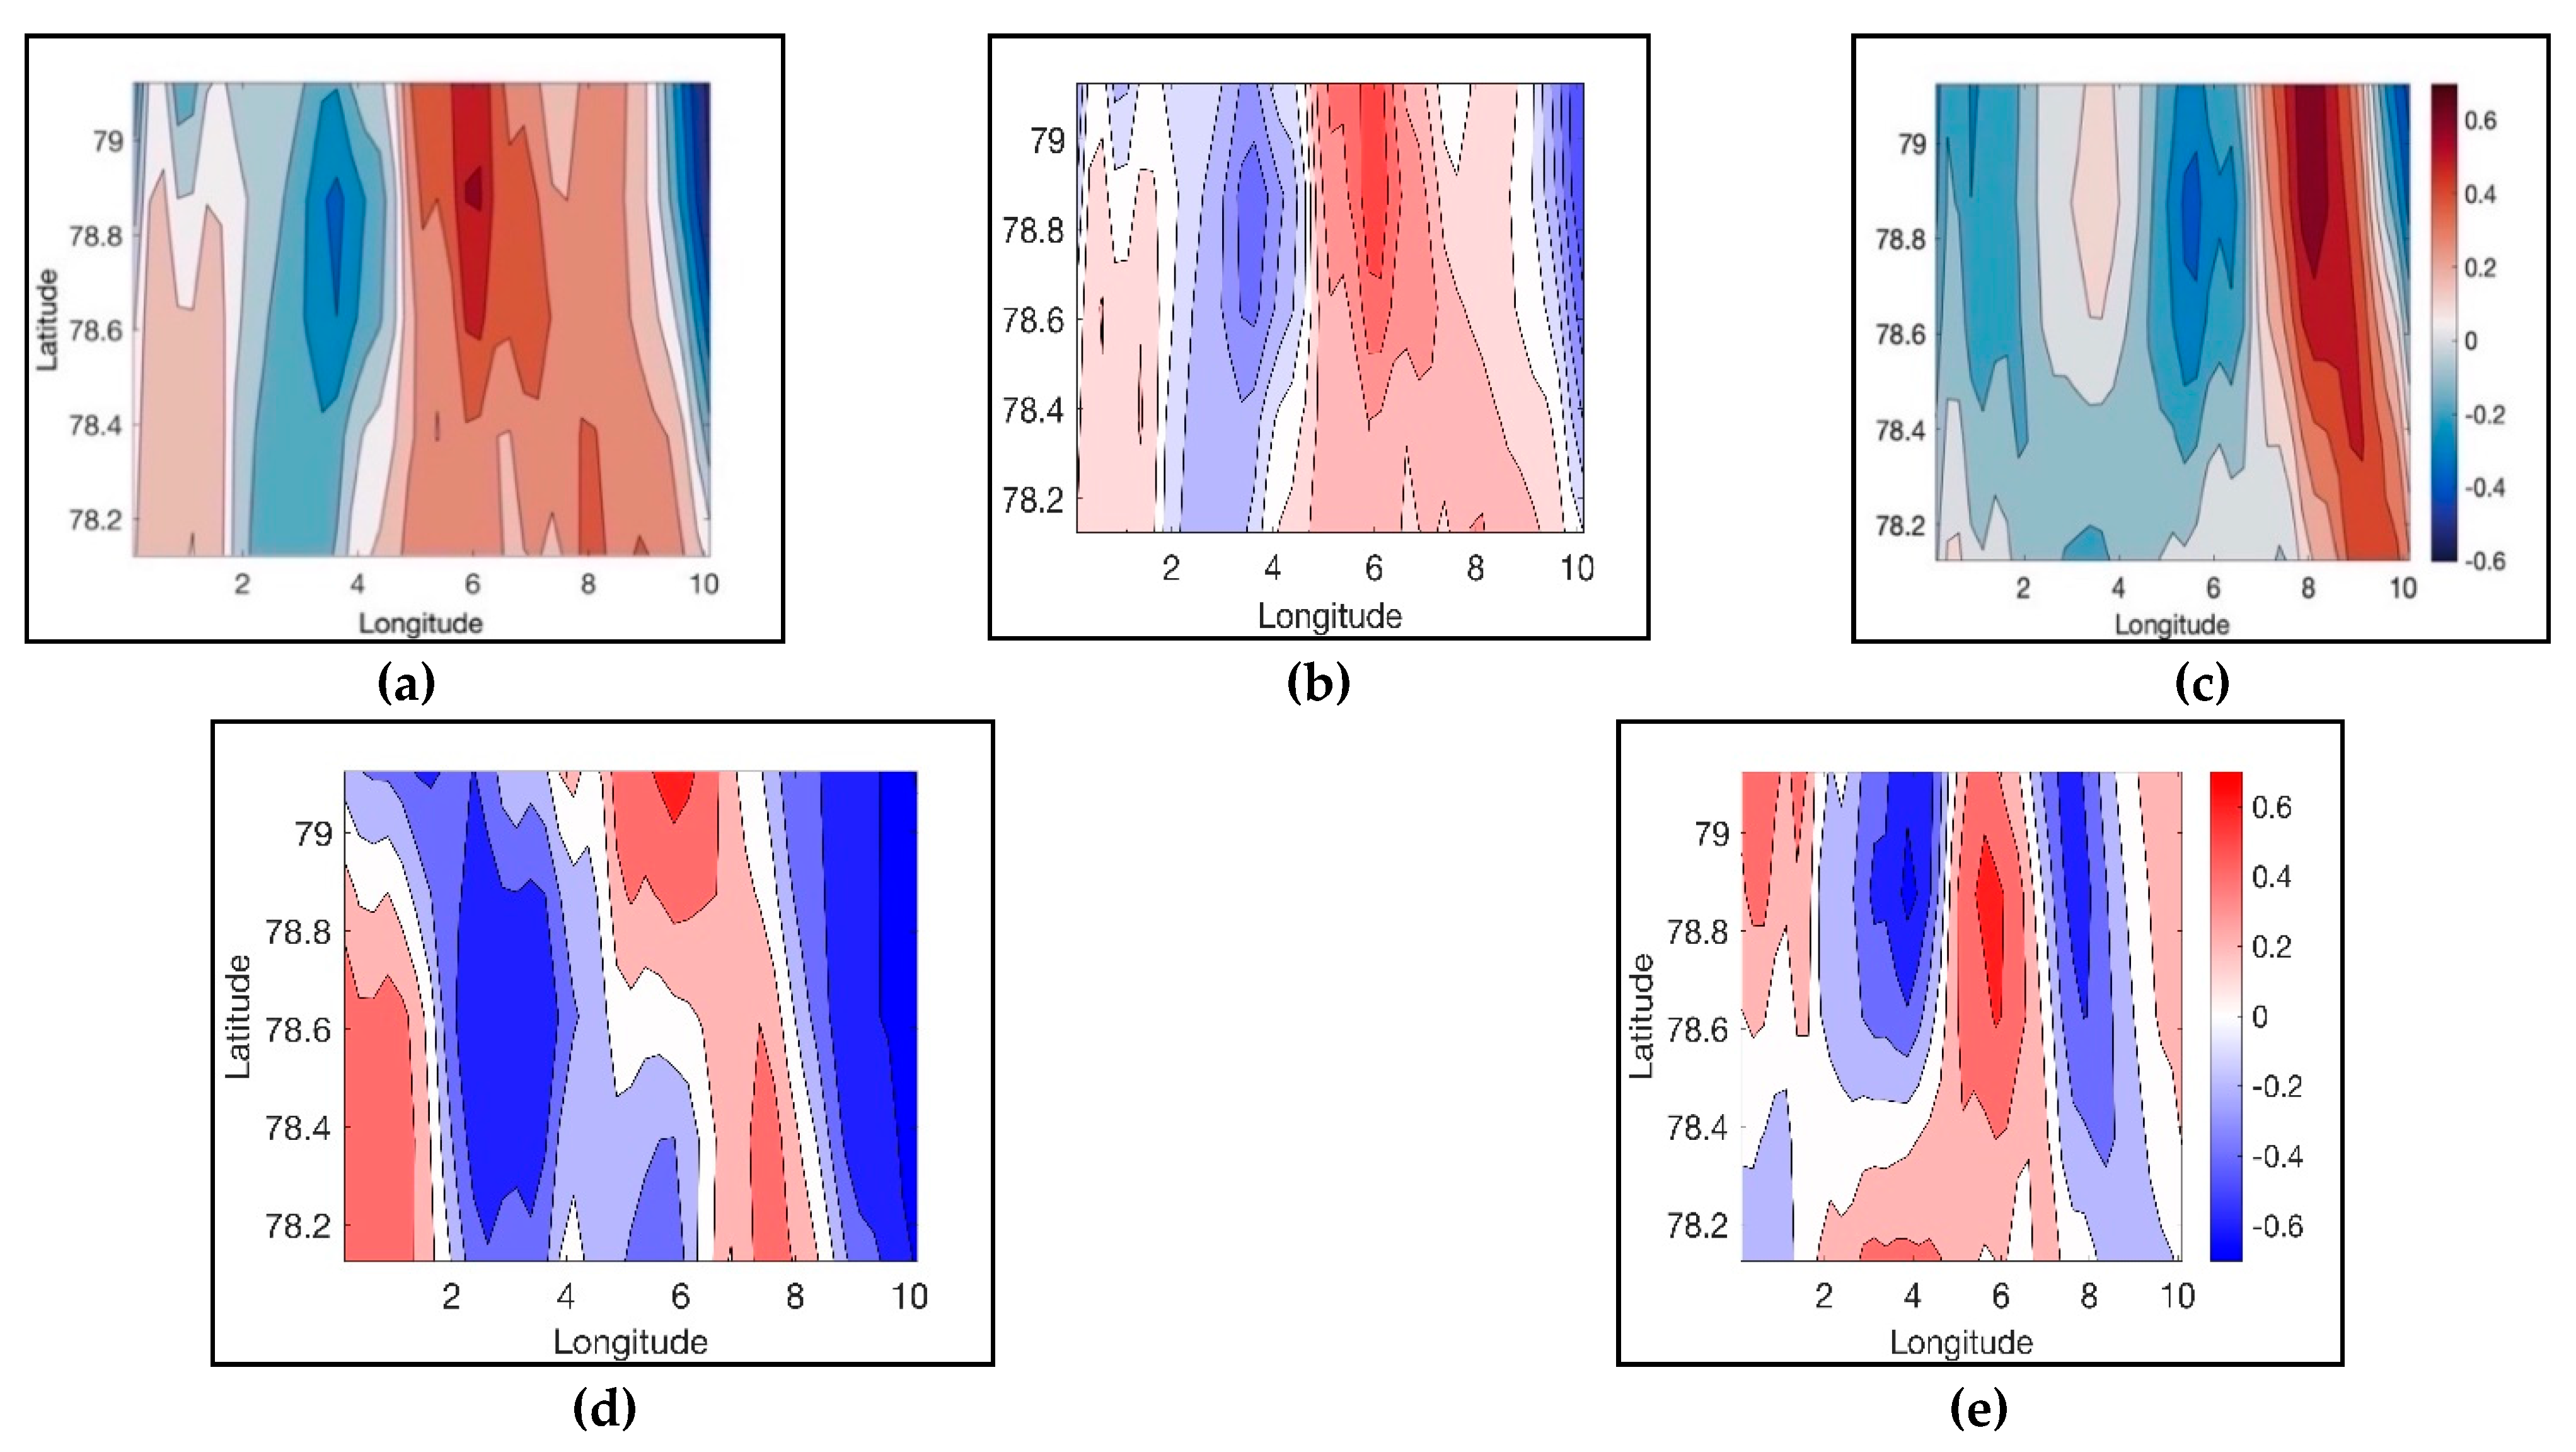
Figure 7.
Wavelet cross coherence between monthly-averaged surface geostrophic velocities and WSC volume transports: (a) meridional altimetry-derived currents at 8.1250 E,78.870N and the monthly-averaged WSC core branch transports (R=0.67), (b) meridional altimetry-derived currents at 6.1250E, 78.870N and the offshore WSC branch volume transports (R=0.57) , (c) meridional altimetry-derived currents at 6.1250E, 78.870N and total volume transports (R=0.40), and (d) Zonal altimetry-derived currents at 6.1250E, 78.870N and the WSC offshore volume transports, (R=-0.30). Phase arrows indicate the relative phase relationship between the series: pointing right: in-phase; left: anti-phase; down: WSC transport leading surface geostrophic velocities by 90°.
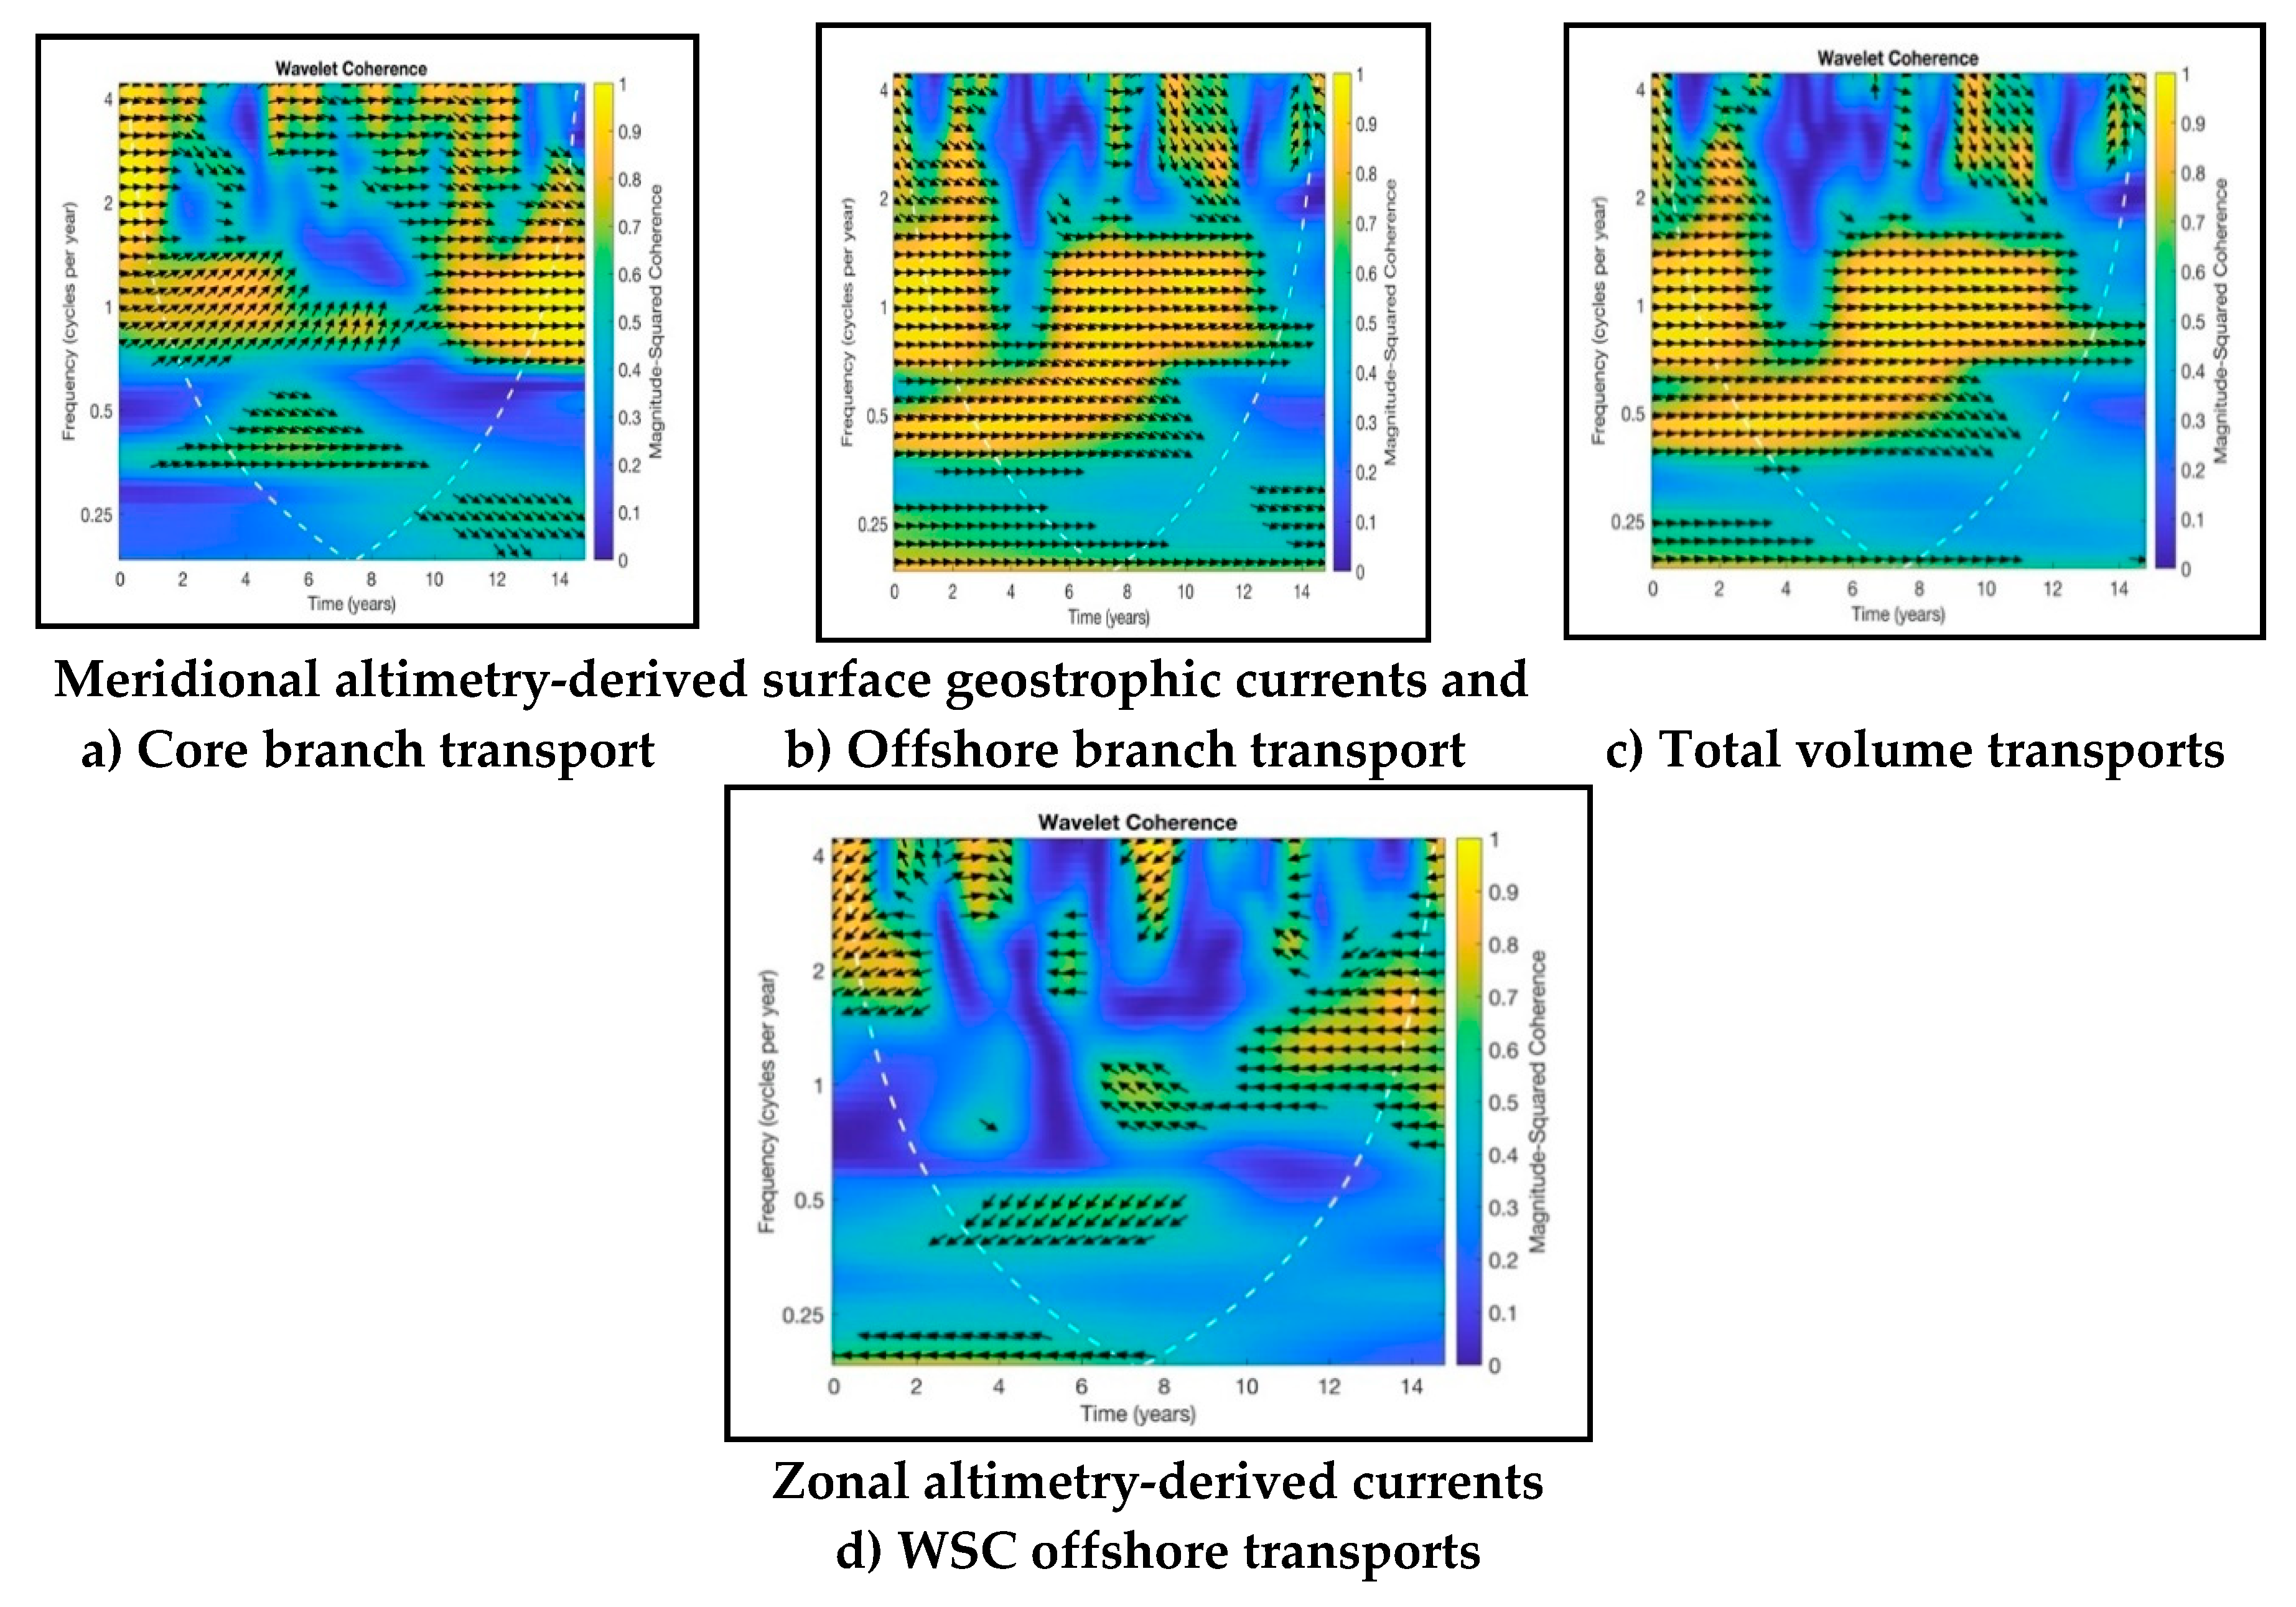

Table 1.
Number of monthly data collected by each mooring and their temporal coverage in 1997-2012.
| Number of data [months] (data coverage [%]) | ||||||
|---|---|---|---|---|---|---|
| Depth level [m] | F1 | F2 | F3 | F4 | F5 | F6 |
| 75 | 130 (73%) | 166 (93%) | 115 (65%) | 154 (87%) | 140 (79%) | 166 (93%) |
| 250 | 130 (73%) | 155 (87%) | 131 (74%) | 166 (93%) | 157 (88%) | 166 (93%) |
| 750 | 123 (69%) | 75 (42%) | 95 (53%) | 98 (55%) | 100 (56%) | |
| 1500 | 140 (79%) | 154 (87%) | 142 (80%) | 143 (80%) | ||
| 10 m above bottom | 155 (87%) | 160 (90%) | ||||
Table 2.
Characteristics of the satellite altimeters measuring sea surface height in 1997-2012 in the WSC region.
Table 2.
Characteristics of the satellite altimeters measuring sea surface height in 1997-2012 in the WSC region.
|
Satellites measuring SSH in the polar regions in 1997-2012 |
Period of operation |
Repeat time [days] |
Separation distance of ground tracks in the Fram Strait |
|---|---|---|---|
| ERS-1 | 1991-2000 | 35 | 9-10 km |
| ERS-2 | 1995-2011 | 35 | 9-10 km |
| Envisat | 2002-2012 | 35 | 9-10 km |
| CryoSat-2 | 2010-present | 369/30* | 18-19km |
Table 3.
Comparison of the Pearson correlation coefficients obtained for in situ measured currents in the Fram Strait between the neighboring pairs of moorings at 75 m (250 m) depths.
Table 3.
Comparison of the Pearson correlation coefficients obtained for in situ measured currents in the Fram Strait between the neighboring pairs of moorings at 75 m (250 m) depths.
| Pearson correlations coefficients Between neighboring moorings at 70m (250m) |
||||
|---|---|---|---|---|
| Speed | Direction | U | V | |
| F1/F2 | 0.43(0.44) | 0.20(0.38) | 0.21(0.38) | 0.45 (0.44) |
| F2/F3 | 0.67(0.73) | 0.37(0.24) | 0.49(0.38) | 0.64 (0.68) |
| F3/F4 | Ns (-0.27) | Ns | Ns(Ns) | Ns(-0.18) |
| F4/F5 | Ns (0.19) | Ns | 0.25(0.34) | Ns(Ns) |
| F5/F6 | Ns | 0.27(Ns) | 0.26(0.30) | Ns(0.18) |
Table 4.
Root mean square differences and Pearson correlations coefficients calculated for the monthly-averaged in situ measured sub-surface moorings (250 m) and altimetry-derived surface geostrophic currents (CMEMS L4 product).
Table 4.
Root mean square differences and Pearson correlations coefficients calculated for the monthly-averaged in situ measured sub-surface moorings (250 m) and altimetry-derived surface geostrophic currents (CMEMS L4 product).
|
F1 (250m) |
F2 (250m) |
F3 (250m) |
F4 (250m) |
F5 (250m) |
F6 (250m) |
|
| Nmonths | 130 |
155 |
131 |
166 |
154 |
166 |
| RMS difference for absolute currents [cm/s] | 16.8 |
18.1 |
13.9 |
5.9 |
7.5 |
6.1 |
|
RMS difference for the anomalous currents’ speeds [cm/s] |
7.7 |
7.6 |
8.5 |
5.0 |
6.4 |
5.8 |
|
Seasonal amplitude Altimetry speed vs. in situ speed [cm/s] |
0.9 / 5.4 | 0.7 / 4.1 | 1.3 / 4.6 | 2.1 / 3.9 | 1.4 / 3.7 | 1.4 / 1.7 |
|
Pearson correlation V/U/speed/direction/ |
0.33/-/ /-/ 0.27/ |
0.56/0.27/ /-/-/ |
0.59/-/ 0.31/-/ | 0.52/0.46/ /0.37/0.39*/ |
0.57/0.57/ /0.41/0.51/ | 0.32/0.27/ /-/0.25/ |
| Phase: Month of max. currents) Altimetry/in situ | Dec/Feb | Oct/Jan | Nov/Nov | Nov/Dec | March/March | March/Jan |
* This correlation was obtained for 75 m depth level because the currents at 250 m were not significantly correlated. /-/ marks not significant correlations.
Disclaimer/Publisher’s Note: The statements, opinions and data contained in all publications are solely those of the individual author(s) and contributor(s) and not of MDPI and/or the editor(s). MDPI and/or the editor(s) disclaim responsibility for any injury to people or property resulting from any ideas, methods, instructions or products referred to in the content. |
© 2023 by the authors. Licensee MDPI, Basel, Switzerland. This article is an open access article distributed under the terms and conditions of the Creative Commons Attribution (CC BY) license (http://creativecommons.org/licenses/by/4.0/).
Copyright: This open access article is published under a Creative Commons CC BY 4.0 license, which permit the free download, distribution, and reuse, provided that the author and preprint are cited in any reuse.


