Submitted:
26 July 2023
Posted:
27 July 2023
You are already at the latest version
Abstract
Momordica charantia is a plant of the Cucurbitaceae family which is known as bitter gourd and grows widely in tropical and subtropical regions of the world. The various properties of bitter gourd are closely related to the substances or compounds they contain. Bitter gourd contains many secondary metabolites including alkaloids, terpenoids, steroids and flavonoids. These chemical compounds are spread in several parts of the plant such as roots, stems, leaves, and fruit. Apart from containing several organic compounds, bitter melon also contains the phytohormone gibberellin which is quite potential and useful as a biostimulant. The aim of the research was to isolate, purify, and determine the content of gibberellin (GA-3) contained in bitter gourd (M. charantia), and to determine its effect on the vegetative and generative growth of soybean plants, as well as the effect of GA-3 application on the nutritional content of soybean seeds. resulting from. Apart from that, it was also observed the effect of GA-3 application on the chlorophyll content of soybean plants, as well as the activity of the alpha-amylase enzyme in treated soybean seeds. The process of isolation and purification of GA-3 was carried out by thin layer chromatography and adsorption column chromatography on Silica Gel G-60. Characterization of GA-3 was carried out by Reversed-Phase High-Performance Liquid Chromatography (RP-HPLC), Fourier Transform Infrared (FT-IR), and Mass Spectroscopy (MS). RP-HPLC and FTIR results from gibberellin GA-3 isolates showed retention times and wave numbers that were relatively the same as GA-3 standards. From the results of the study it was found that the content of the gibberellin GA-3 hormone in bitter gourd was 4.12 mg/g dry weight. The GA-3 isolate had a significant effect on the growth of soybean plants in both the vegetative and generative phases for each parameter observed compared to the control and 1% NPK fertilizer. The protein content in soybean seeds was 38.17%. The chlorophyll content at the end of the vegetative and generative phases were 33.34 and 11.5 CCI, respectively. The addition of GA-3 isolate increased the activity of the α-amylase enzyme in soybean seeds compared to the control with an average of 271.65 U/mL.
Keywords:
Gibberellin
; bitter gourd
; Momordica charantia
; phytohormone
; Oryza sativa
1. Introduction
Indonesia is one of the countries with abundant biological natural resources which has the potential to produce secondary metabolites and the potential to be developed as a source of biostimulants. Its application aims to increase the efficiency of absorption of nutrients, and abiotic stress tolerance improves crop quality [1]. Currently, biostimulants are widely used to increase plant growth, especially horticultural crops and some food crops [2]. The bio-active gibberellins (GAs) commonly found in plants are GA-1 and GA-4 [3]. Phytohormones are a part of the growth and development system in plants which have a role and can affect the physiological response of plants at low concentrations. Naturally, the plant has contained growth phytohormones such as auxin, gibberellins, and cytokinin which are termed endogenous hormones. It is known that there are eight phytohormones, including auxin, gibberellin, cytokinin, abscisic acid, ethylene, jasmonic acid, salicylic acid, and brassinosteroids [4]. Gibberellin is a versatile plant growth regulator involved in a barrage of developmental processes [5]. Gibberellin is a regulator hormone that has an important role in the process of growth and development of plant [5].
The bitter gourd plant (M. charantia L. ) is a horticultural plant known as bitter gourd, bitter melon, and bitter squash which belongs to the Cucurbitaceae family and has a characteristic bitter taste. M. charantia includes vegetables with good nutritional value. In Asia, more than 340,000 hectares of land are used for bitter gourd cultivation each year. Bitter gourd lives in tropical and sub-tropical climates, and is cultivated in several African countries such as Ghana, Zambia, Congo and Madagascar for local consumption, and for export to Europe, and North America. Bitter gourd is also cultivated on a smaller scale in Australia [6]. Behind the bitter taste, bitter gourd plants have many properties and benefit both in terms of health, and as a potential source of food [7]. Bitter gourd can grow well and is widely cultivated in tropical and sub-tropical regions [8]. Bitter gourd is very easy to find and is found in almost all regions in Indonesia, and has many local names, for example in Java it is known as paria or pare, in Sumatra it is known as prieu, fori, prepare, kambeh, pare; while in Sulawesi they are called poya, pudu, pentum [9].
A study conducted by Tang et al. [10], isolated endogenous hormones from bitter gourd plant pistils, showed that 1 gram of dry weight of pistil samples of bitter gourd plants produced auxin 4 x 10⁻⁴ mg /g, gibberellin 1.06 x 10⁻³ mg /g, cytokinins 1.64 x 10⁻⁵ mg /g, and abscisic acid 3.26 x 10 -5 mg /g. Gibberellins promote germination by promoting the secretion of hydrolytic enzymes and weakening the seed coat tissue, as well as promoting cell division and elongation. Gibberellin also recovers seed germination in rice with impaired brassinosteroid signaling [11].
Naturally, plants already contain endogenous hormones such as auxin, cytokinins, and gibberellin which play a role in the normal growth and development of plants [12]. Less intensive cultivation patterns and improper soil management cause the content of endogenous hormones to be less. The addition of exogenous hormones is needed to overcome the lack of endogenous hormones in plants characterized by growth below normal (slow), flower loss, and also small fruit size. By adding exogenous hormones, then the problem of lack of endogenous hormones in plants that are a problem in the agricultural sector can be overcome [13]. Basically, every plant has the ability to synthesize phytohormones in its body (endogenous hormones). Auxin, cytokinin and gibberellin hormones can be used as exogenous hormones for other plants. There have been many studies that have succeeded in isolating various types of plants such as bitter gourd plants, young corn, bean sprouts, and various types of marine algae [13]. Biostimulants can be obtained from plants that contain secondary metabolite compounds or endogenous hormones that are able to stimulate the physiological work of plants [13]. In this study, bitter gourd was used as a source of phytohormones because it was known to contain a class of secondary metabolite compounds that could potentially be developed as a source of biostimulants, namely flavonoids, alkaloids, terpenoids, and derivative compounds. Gibberellin is one of the growth regulators that can regulate the growth and shape of plants in all stages and phases of plant growth. In low concentrations, gibberellin can stimulate cell division and elongation. The plant response due to gibberellin activity is an increase in cell elongation mainly occurs in the stem, Gibberellin is synthesized at the end of the stem and roots, resulting in a fairly wide influence. Gibberellin (GA) is a compound belonging to the terpenoids group formed from isoprene units. Susilo et al. [14] stated that in bitter gourd fruits and seeds contained GA-3 as much as 4,185 mg /g wet weight. Meanwhile, Nindita [15] showed that the gibberellin content from young bitter gourd seeds of 2.58 mg/g dry weight. Pertiwi et al. [10], showed that giving GA-3 of 200 ppm can increase the height of soybean plants and the number of flowers. According to the research of Yennita [11], giving gibberellins (GA-3) to soybean plants during flowering can increase the percentage of flowers turning into pods and the number of fertile nodes, and the number of pods of soybean plants. In some studies, the addition of gibberellins exogenously can also increase the nutritional value or chemical composition of edible plant parts. Graham & Ballesteros [16], showed that gibberellin (GA-3) could increase protein and soluble carbohydrate levels in New Zealand tomatoes, peas and spinach compared to controls. Research by Sardoei & Shahdadneghad [17], showed that the application of GA-3 with a concentration of 250 mg/L on the leaves of Calendula officinalis could increase the content of chlorophyll a and chlorophyll b compared to controls with chlorophyll a content of 7.78 g/L, and chlorophyll b content of 3.53 g/L. Vieira et al. [18], reported there was an increase in the activity of the α-amylase enzyme along with the increase in GA-3 concentration.
In this study, have carried out the isolation, purification, and characterization of gibberellin, GA-3, from the fruit of bitter gourd (M. charantia), the application of the GA-3 isolates for accelerating the growth of Soybean plant, and improving the quality and quantity of soybean production.
2. Materials and methods
2.1. Materials
The research materials used in this study were bitter gourd (M.charantia) from Cipaku Village, Majalengka, West Java_Indonesia. The chemicals used are all PA(Pro-Analysis)-categorized chemicals
2.2. Preparation of extract
M. charantia fruit was cleaned of dirt, then washed and dried in an oven at 40oC. After drying, it is ground and smoothed using a Waring Blender. Furthermore, 200 grams of fine M.charantia fruit was macerated with 1200 mL of 80% methanol, for 4×24 hours at room temperature, to obtain methanol extract. The methanol extract was then concentrated with a vacuum evaporator at a temperature below 40°C to obtain a concentrate, and dissolved with distilled water to a volume of 100 mL, to obtain a crude extract.
2.3. Extraction and partial purification
As much as 25 mL of crude extract was added 5% sodium bicarbonate to a pH of 8.0, then extracted with 2 X 40 mL of ethyl acetate solvent. The aqueous layer was taken and acidified with 3 N hydrochloric acid to a pH of 2.5, then extracted again with ethyl acetate (2 X 20 mL). Furthermore, the ethyl acetate fraction was concentrated with a rotary vacuum evaporator, and dissolved in 5 mL of methanol to obtain methanol extract.
2.4. Analytical Thin Layer Chromatography (ATLC)
Samples of crude extract and methanol extract were analyzed by ATLC on silica gel GF-254 plates (size 6 cm × 2 cm). As much as 3-4 crude extracts and methanol extract were spotted side by side on a silica gel plate and then eluted with a solvent mixture of chloroform : ethyl acetate : acetic acid (6:14:1) until the eluent moved to the upper limit. The stain movement of the crude extract and methanol extract samples was compared with the movement of the standard GA-3 stain, the results were observed under UV light.
2.5. Adsorption column chromatography
For the separation of sample by adsorption column chromatography, amount of 4 mL of the methanol extract was put into a glass column containing the stationary phase Silica Gel G-60, then eluted with a mixture of chloroform : ethyl acetate : acetic acid (6:14:1). As much as 2mL of the column fractions were collected, ATLC. The Rf of fractions were compared with the Rf value of the GA-3 standard. The fractions that have the same Rf value as the Rf of GA-3 standard were combined for PTLC analysis.
2.6. Preparative Thin Layer Chromatography (PTLC)
For the PTLC analysis, 1 mL of the collected fraction was spotted on a GF-254 silica gel plate (20 × 20 cm), as the standard used 1000 ppm of GA-3. Then eluted with the eluent mixture of chloroform : ethyl acetate : acetic acid (6:14:1), until the eluent rose to the upper line. Sample movement was observed, compared with standard movement stains. The stain with the same Rf as the standard was scraped off and then suspended in 2 mL of methanol, then the supernatant was concentrated with a vacuum evaporator. Furthermore, the residue was dissolved in 1 mL of methanol, to obtain GA-3 isolate.
2.7. Identification of gibberellin isolates by Reversed-Phase HPLC, FTIR and MS
For identification of GA-3 isolate which had been purified by PTLC; amount of 10 μL fraction containing gibberellin (GA-3 isolate) was analyzed by Reversed-Phase (RP) HPLC; using Alltec 8011/2 (C-18 Nucleosyl ODS column). The Separation used isocratic elution with 35% methanol in acetate buffer pH 3.5, and the flow of 0.7 mL/minute. The retention time of the GA-3 isolate was compared with the retention time of GA-3 standard. Characterization of GA-3 sample were analyzed by FTIR (Shimadzu 8400), and by Mass Spec. MS (Waters type Xevo Q-Tof MS).
2.8. Sprout making
Soybean seeds are soaked in 0.5% sodium hypochlorite solution (w/v) for 5 minutes then soaked in cold water, and stored in a container with wet cotton wool that had been moistened with the vegetative phase biostimulant and left in a dark place for five days, until the rice seeds sprout (germination).
2.9. Planting and biological assay
For planting and biological assay of GA-3 isolate on soybean plants, it begins with the sprout making, then the sprout were planted in the seeding box. After one week the grown soybean sprouts were transferred into prepared poly-bags, then stored in a greenhouse (a place exposed to sunlight and protected from rain). For the biological assay, there were five treatments: 1. control soybean plants which were only watered with water, 2. soybean plants which were watered with 1% of NPK fertilizer, 3. soybean plants which were watered with crude extract (100 ppm), 4. soybean plants which were watered with 100 ppm of biostimulant (commercial biostimulant for vegetative phase) as a comparison), and 5. soybean plants watered with 100 ppm of GA-3 isolate. In addition, all treatments were also doused with water every day (morning and afternoon). Observation of the growth of soybean plants in the vegetative phase during the first to four weeks, and for the generative phase, in the 5th week until harvest. The process of watering all treatments every two days, and for each treatment there were five repetitions. In observing the growth of the vegetative phase, every week each treatment plant was removed and the shoot length, shoot dry weight, root length, and root dry weight were measured. The observation parameter in the generative phase were the time of flower emergence, time of pod emergence, and harvest time, as well as the number of pods and the dry weight of soybean pods, and seeds were observed.
2.10. Proximate analysis of soybean seeds (G. max Var Demas 1)
2.11. Determination of leaf chlorophyll content
Determination of chlorophyll content of soybean plants using a Konica Minolta 502 chlorophyll meter. Analysis of chlorophyll content was determined using a SPAD (Soil Plant Analysis Development) chlorophyll meter, a tool used to measure leaf chlorophyll relatively. The unit used is the average plant chlorophyll unit in chlorophyll content index (CCI) units. The greenness of the leaves was measured using a SPAD Plus Chlorophyll meter. The principle of this tool is to record the level of greenness of the leaves and the relative amount of chlorophyll molecules present in the leaves in one value based on the amount of light transmitted by the leaves.
2.12. Measurement of α-amylase activity
Activity of the α-amylase enzyme was determined based on a modified Fuwa method [22]. As much as 1 gram of treated G.max (soybean) seed powder was suspended in 10 mL of acetate buffer pH 5.66, then left for 30 minutes at room temperature. After that the mixture was centrifuged at 60,000 rpm for 20 minutes. The supernatant was separated, then 100 μL was taken and 100 μL starch solution 0.1% (w/v) was added. The mixed solution was incubated for 10 minutes at 50°C, then 100 μL of 1 N hydrochloric acid was added to stop the reaction. And after adding 100 μL of iodine solution, then diluted with distilled water to a final volume of 2 mL. For the control (blank solution); the procedure is the same, but the enzyme is replace with water. The absorbance (A) of the sample and control was measured at a wavelength of 600 nm.
3. Results
3.1. Analytical Thin Layer Chromatography
Analytical thin-layer chromatography (ATLC) was performed to determine the standard Rf. This Rf value is used to determine the right solvent mixture to purify Gibberellin compounds. Thin-layer chromatography belongs to solid-liquid chromatography, which in this study silica gel GF-254 was used as the stationary phase and the solvent used was a mixture of chloroform : ethyl acetate: acetic acid (6: 14: 1) as the mobile phase. Silica gel GF-254 is used because gibberellin has a natural chromophore group so that the use of silica gel GF-254 can provide fluorescence at the wavelength of 254 nm [21,22]. After the calculation, it was determined that the standard Rf value was 0,428, which this value stated that the solvent used was good enough. Compared with an GA-3 standard that was indicates that there is GA-3 compound in the methanol fraction. So it is necessary to further purify it by adsorption column chromatography.
The results of the ATLC (Figure 1), show that the crude extract and methanol extract have stains parallel to the GA-3 standard. This shows that the crude extract and methanol extract contain gibberellins (GA-3). However, the stain formed by the ATLC results still contained more than one stain. This is because the sample is not pure, and further separation must be carried out by adsorption column chromatography.
3.2. Adsorption column chromatography
For identification of the fraction from column chromatography result, amount of 2 mL fraction were collected, than analyzed for their content using the analytical ATLC, and the result is presented in Figure 2.
In the Figure 2 show the fractions that have a spot with Rf value similar to Rf of GA-3 standard were the fractions of 6 to 10. This indicates that the fraction contains gibberellin compounds (GA-3). The research was continued with a preparative thin-layer chromatography (TLC) procedure to obtain purer gibberellin compounds.
3.3. Preparative Thin Layer Chromatography (PTLC)
The fractions resulting from the separation by Silica gel G-60 adsorption column chromatography were identified by PTLC on a GF-254 silica plate, and observed under a UV lamp at a wavelength of 254 nm. In the Figure 3 shows the PTLC results of the GA-3 standard (A) and the GA-3 isolate (B). The PTLC results from samples with the same RF and in line with the RF of the GA-3 standard were scraped and suspended in 5 mL methanol. After centrifugation of the suspension, the supernatant was concentrated with rotary vacuum evaporator and redissolved again in 1 mL of methanol for further characterization using RP-HPLC.
The results of the analysis of gibberellin GA-3 isolate using RP-HPLC is showed in Figure 4 below.
The result of the RP-HPLC analysis of gibberellin GA-3 standard (Figure 4A) showed a retention time peak of 5.387 minutes. Meanwhile the RP-HPLC yield curve from the GA-3 isolate sample had a retention time of 5.309 minutes (Figure 4B). The results of the RP-HPLC analysis showed that the retention time of the GA-3 isolate relatively had the same retention time as the standard GA-3. This proves that the isolate sample contains gibberellin type GA-3. As for the slight difference in retention time, it could be caused by the presence of a small amount of impurities (other peaks) which allowed for a shift in the retention time of the GA-3 isolate due to the presence of other components present in the isolate. From the results of calculations by comparing the area of the GA-3 isolate curve compared to the area of the standard GA-3 curve, the concentration of GA-3 found in the bitter melon (M. charantia) isolate is 4.12 mg/g dry weight.
3.4. Identification of gibberellin isolates by FTIR
FTIR spectra for GA-3 isolated from M. charantia in comparison with the standard GA-3 are illustrated in Figure 5. The main characteristic peaks in (A) curve , standard gibberellic acid( GA-3 are 3449.13 cm-1 (OH group) , 2939,65 cm-1 (C-H sp3 ), 1757,28 cm-1 ( C= O) and 1484.81 cm-1 .(C=C) . In Curve (B), isolate GA-3 from M. charantia, there is the same or similar main characteristic absorption bands of the standard GA-3. The absorption at a wave-number of 3444,72 cm-1 , 2927 cm-1, 1810,7 cm-1, 1416,5 cm-1 . To be able to confirm whether the compound is an GA-3 compound, the research is continued with mass spectrometer, to determine the molecular weight of the GA-3 isolate.
3.5. Identification of Gibberellin GA-3 isolates using Mass Spectrometer
The presence of GA-3 in isolate was also confirmed from the mass spectrum measurements (Figure 6). The mass spectrum shows the peak of the molecular ion [M+H]+ at m/z 347.1535 as the measured mass and the calculated mass is 347.1506 with the molecular formula C19H23O6+ and the degree of saturation or DBE is 7. The measured molecular mass and the number of DBE correspond to the molecular mass of GA-3 .
3.6. The Effect of gibberellin (GA-3) isolate on the growth of soybean plant, on the vegetative phase
In the vegetative phase, the parameters observed were shoot length and shoot dry weight, root length and root dry weight. Measurements were carried out for 4 weeks (28 days) from the days after transplanting (DAT) where every week from week 1 to week 4 the shoot elongation and shoot dry weight, root length and root dry weight were measured. The Observation showed that from the 1st week to the 4th week, there are a significant effect compared to 1% NPK fertilizer and control in increasing the shoot and root elongation (Table 1, Table 2).
3.7. The Effect of gibberellin (GA-3) isolate on the growth of soybean plant, on the generative phase
In the generative growth phase, the observation parameter were the time of flower emergence, time of pods emergence, and harvest time, as well as the the average parameters of pods number, pods weight, seeds number and seeds weight. The result of research showed that the time of flower emergence, pods emergence and harvest in plants treated with 100 ppm GA-3 isolate were faster compared to the 1% NPK and control treatments (Table 3). The time of emergence of flowering, pod and harvest plants treated with GA-3 isolate were 39, 52, and 97 days, respectively. While for the observation of the number of pods, pods weight, number of seeds, and seed weight of plants treated with isolate GA-3 were 73, 21.01, 149.6, and 15.48 grams, respectively. The increase in the number of pods is also supported by environmental factors that support photosynthesis. The addition of biostimulant B2 (generative phase biostimulant) and 100 ppm GA-3 crude extract also gave a significant difference compared to the control and 1% NPK fertilizer treatments (Table 4).
Based on the Table 4, it shows that the average number of pods, pods weight, and the number of seeds and seed weight in the plants treated with GA-3 isolate have a significant difference compared to the control and 1% NPK fertilizer treatments. The increase in the number of pods is also supported by environmental factors that support photosynthesis. The addition of biostimulant B2 (Biostimulant for generative phase) and crude extract GA-3 100 ppm also gave a significant difference compared to the control and 1% NPK fertilizer treatments. Besides containing gibberellin, biostimulants (B1 and B2) and crude extracts also contain other types of phytohormones which may have a better effect on plant growth activity in the generative phase compared to the control and 1% NPK fertilizer treatments.
3.8. Proximate Analysis of Soybean Seeds
From the result of the proximate analysis showed that soybean plants of the Demas-1 variety which was treated with 100 ppm isolate GA-3 had total proteins and fats content of 38.17 and 20.04% (Table 5). The result was higher than the total proteins and lipids content data based on Balitkabi [23], namely 36.07% and 19.92%, respectively.
Ash content shows the mineral (macro and micro) contained in the sample The results of ash content in this research on various treatment variations ranged from 4.85% - 5.06%. High total ash content in food ingredients and products is a very strong indicator that these products have a high potential for danger for consumption. It’s the same with water content where the high water content makes it easy for bacteria, mold and yeast to multiply, resulting in changes to food ingredients. Control plants had the lowest level water content compared to plants with other treatments. This may have happened because the plants treated with the hormone had a high water absorption capacity because they had more root fibers (secondary roots) and longer roots compared to the control plants.
3.9. Leaf chlorophyll content of soybean plant
Determination of chlorophyll content was carried out using a chlorophyll meter (CCM-200 plus Opti -Science), where the chlorophyll content was expressed in units of chlorophyll content index (CCI). The means chlorophyll level at the end of the vegetative and generative phases were 33.34 CCI and 11.5 CCI, respectively (Table 6).
During the vegetative growth period, chlorophyll is synthesized in chloroplasts, this will be marked by increasing levels of chlorophyll at the end of the vegetative phase. The quantity and quality of chlorophyll contained in the leaves will determine the level of photosynthesis that occurs. Visually it can be seen that the plant leaves that have a higher chlorophyll content are greener in color than other leaves. Under these conditions the process of photosynthesis will increase. Meanwhile, at the end of the generative growth period, chlorophyll will be degraded, this is indicated by the fading green color of the leaves, and even tends to turn yellow. This is consistent with the results of the research, that the chlorophyll content for all of the treatments were decreased (Table 6)
4. Discusion
Gibberellin is a hormone that functions synergistically with the auxin hormone. Auxin has a role to stimulate cell elongation while gibberellin has an effect on germination and embryo development. Auxin affects the activity of the cambium in cell division and tissue formation while gibberellins causes stem elongation by stimulating cell division and cell elongation. Almost every plant parameter treated with 100 ppm crude extract, isolate GA-3 and commercial biostimulant also had a significant difference compared to 1% NPK and control. This is due to the presence of the gibberellin GA-3 which is found in the crude extract, GA-3 isolate and biostimulants.
The addition of exogenous gibberellin of GA-3 will stimulate and increase the percentage of flower and fruit appearance because gibberellin can stimulate flowering and can reduce premature fruit loss. This is in accordance with the literature which states that gibberellic acid (GA-3) can increase the number of flowers and the number of fruits formed per plant. Biostimulant used in the generative phase contains gibberellins which function to promote bud development, stem elongation, leaf growth, promote flowering and fruit development, and influence root growth and differentiation [5, 9].
From the results of proximate analysis of soybeans treated with 100 ppm of GA-3 isolate, 100 ppm of crude extracts, and 1% of biostimulants (B1+B2) showed a higher total proteins and fats content compared to the soybean plants treated with 1% NPK fertilizer, and controls. This shows that the influence of the hormone gibberellins GA-3 found in GA-3 isolates, crude extracts and biostimulants, makes it possible to induce several major changes in the metabolic processes of the aleurone layer which lead (and possibly to induce) the synthesis and secretion of α-amylase and other enzymes [24]. As the result of the synthesis of those enzymes will increase the total proteins and fats content. Higher activity of the α-amylase enzyme causes higher degradation of carbohydrate for hydrolysis into energy and nutrients needed by plant growth. This is consistent with the research results obtained where the carbohydrate content of soybean plants treated with 1% GA-3 isolate contained lower carbohydrate levels compared to the 1% NPK fertilizer treatment and control, namely 23.62%.
The results of determining chlorophyll content using a chlorophyll meter showed that chlorophyll levels in plants treated with 100 ppm GA-3 isolate, 100 ppm crude extract and biostimulants had significant differences compared to the control plants and plants treated with 1% NPK fertilizer, both in the end of the vegetative phase and in the end of the generative phase. Visually it can be seen that the plant leaves that have a higher chlorophyll content are greener in color than other leaves. This can happen because in the presence of exogenous gibberellin (GA-3) hormones it is possible to work indirectly with cytokinin hormones. In this case, cytokinin hormones have a major role in regulating and mediating chlorophyll content by maintaining its quality and quantity.
5. Conclusion
From the results of the research conducted, it was found that the concentration of gibberellins (GA-3) in bitter gourd extract (M. charantia) was 4.12 mg/dry weight. The treatment of GA-3 isolate from bitter gourd (M. charantia) can affect the vegetative growth phase of the plant (G. max) of Demas-1 variety based on the observed parameters of shoot length and shoot dry weight, as well as root length and root dry weight, compared to the control plants, and the treated plant with 10% NPK fertilizer. The GA-3 isolate also influenced the growth of the generative phase based on observations of the parameters of flower emergence time, pod emergence time, and harvest time. Apart from that, GA-3 isolate treatment on soybean plants can also increase the number of pods and seeds compared to the control and the treated plants with 1% NPK fertilizer.
The nutritional content of soybean seeds treated with GA-3 isolate was significantly different compared to that of 1% NPK fertilizer, and control, with an average content of proteins, fats, ash, water, and carbohydrates were of 38.17; 20.04 ; 4.95; 13.22, and 23.62%, respectively. The GA-3 isolate from bitter gourd fruit can also increase the chlorophyll index on the leaves of soybean variety Demas-1 compared to the 1% NPK fertilizer treatment and control at the end of the vegetative phase, namely 33.34 ± 1.94 CCI. The activity of the α-amylase enzyme increased significantly in soybeans treated with the GA-3 isolate compared to the 1% NPK fertilizer and control, which was an average of 271.65 U/mL.
Author Contributions
D.A. conceived and designed the experiment, performed the experiment, analyzed and interpreted the data, and wrote the manuscript. M.A. conceived and performed the experiment, analyzed and interpreted the data. I.P.M. conceived and designed the experiments, analyzed, and interpreted the data experiment. I.W. conceived and designed the experiments, analyzed, and interpreted the data experiment. R.H. conceived and designed the experiments, analyzed, and interpreted the data experiment. S.I. conceived and designed the experiments, analyzed, and interpreted the data experiment. U. M. S. S. conceived and designed the experiments, analyzed and interpreted the data experiment, wrote the manuscript, compiled and revised the manuscript.
Acknowledgments
The authors are grateful for the laboratory facilities in Padjadjaran University, especially in the Department of Chemistry, Faculty of Mathematics Natural Sciences, and the Central Laboratory of Padjadjaran University.
Declaration of Conflicting Interests
The author(s) declared no potential conflicts of interest concerning the research, authorship, and/or publication of this article.
References
- Du Jardin, P. Plant Biostimulants: Definition, Concept, Main Categories, and Regulation. Scientia Horticulturae. 2015, 196: 3-4. [CrossRef]
- Calco, P.; Nelson, L.; Kloepper, J.W. Agricultural Uses of Plant Biostimulants. Plant Soil. Canada: Departement of Biology, University of British Columbia. (2014). [CrossRef]
- Buchanan, B.B.; Gruissem, W.; Jones, R.L. “Biochemistry & Molecular Biology of Plants”, Second Edition.; John Wiley & Sons, Ltd. Chichester: 2015.
- Soedjanaatmadja, U.M.S.; Ishmayana, S.; Muntari, Z.; Rachman, S.D. Red algae algae: potential source of phytohormones. Book Chapter In: A Closer Look at Hormones, Editor: Alexander V. Knyazev. Nova Science Publishers, Inc. New York. (2020).
- Castro-Camba, R.; Sánchez, C.; Vidal, N.; Vielba, J.M. Plant Development and Crop Yield: The Role of Gibberellins. Plants. 2022, 11(19), 2650. [CrossRef]
- Dhillon, N.P.S.;, Laenoi, S.; Srimat, S.; Pruangwitayakun, S.; Mallappa, A.; Kapur, A.; et al. Sustainable cucurbit breeding and production in Asia using public-private partnerships by the world vegetable center. Agronomy. 2020, 10(8). 1171. [CrossRef]
- Subahar and Tati S.S. Efficacy and Benefits of Disease Exterminator Bitter Gourd: Healthy with Traditional Herb. First ed. PT Agromedia Pustaka, Jakarta. (2004).
- Ipaulle, Q.H.; and Kastono, D. The effects of Main Stem and Primary Branches Pruning on The Yield and Quality of Bitter Gourd (Momordica charantia L.)” Vegetalika. 2020, 9(3), 474-487.
- Susilawati and Hermansyah. “Antiplasmodium Potential Test of Bitter Gourd Extract (Momordica charantia L) against Plasmodium falcifarum”. Molekul. 2014, 9(1), 13-17.
- Pertiwi, P.D.; Agustiansyah; Nurmiaty, Y. Pengaruh Giberelin (GA3) terhadap Pertumbuhan dan Produksi Tanaman Kedelai (Glycine max ( L .) Merrill ). Jurnal Agrotek Tropika. 2014, 2(2), 276–281.
- Yennita. 2007. Respon Tanaman Kedelai (Glycene max) terhadap GA3 (Gibberellic Acid) pada Fase Generatif. Exacta. 2007, 5(1), 16–23.
- Salisbury, F.B. & Ross, C.W. Plant Physiology. Wadsworth Publishing Company, Belmont, Califonia 94002, a division of Wadsworth, Inc. (1992).
- Rachman, S.D; Mukhtari, Z.; Soedjanaatmadja, U.M.S. Alga merah ( Gracilaria coronopifolia) sebagai Sumber Fitohormon Sitokinin yang Potensial. Chimica Natura Acta. 2017, 5(3), 124-131. [CrossRef]
- Susilo, W. A.; Putri, H.M.; Hidayat, A.T.; Soedjanaatmadja, U.M.S. Activity of Gibberellin from Momordica charantia. Proceeding of the International Seminar on Chemistry. Jatinangor, 2008, 697.
- Nindita, A. Isolasi Fitohormon Gibberelin dari Biji Pare (Momordica charantia) sebagai biostimulan terhadap pertumbuhan Tanaman Padi (Oryza sativa). 2014, Universitas Padjadjaran.
- Graham, H.D. and Ballesteros, M. Effect of Plant Growth Regulators on Plant Nutrients. Journal Of Food Science. 1980, 45, 502–205. [CrossRef]
- Sardoei and Shahdadneghad, M. . Effects of Foliar Application of Gibberellic Acid on Chlorophyll and Carotenoids of Marigold ( Calendula officinalis L .) International journal of Advanced Biological and Biomedical Research. 2014, 2(6), 1887–1893.
- Viera, A.R.; Vieira, M.; Fraga, A.C.; Oliveira, J.A.; dos-Santos, C.D. Action of gibberellic acid (GA3) on dormancy and activity of a-amylase in rice seeds. Revista Brasileira de Sementes. 2002, 24, 43–48. [CrossRef]
- AOAC (Association of Official Analytical Chemists). Official Methods of Analysis. Washington DC (1990).
- Zhilan, D.F.; Ishmayana, S.; Hindersah, R.; Soedjanaatmadja, U.M.S. Isolation and Characterization of Gibberellin (GA-3) from Banana Blossom of Musa balbisiana Colla and Effect of The Isolate Addition on The Growth of Soybean (Glycine max) Plant. Res. J. Chem. Environ. 2022, 26(11), 28-37.
- Sari, R.P.; Maksum, I. P.; Hindersah, R.; Ishmayana, S; Soedjanaatmadja, U.M.S. Isolation, purification, and characterization of auxin from red algae (Eucheuma spinosum) and its application in cayenne pepper (Capsicum frutescens L.) plants. Bulgarian Journal of Agricultural Science. 2022, 28(6), 1088-1098.
- Lu, W.; Clasquin M.F.; Melamud, E.; Amador-Noguez, D.; Caudy, A.A.; Rabinowitz, J.D. Metabolomic analysis via reversed-phase ion-pairing liquid chromatography coupled to a stand alone orbitrap mass spectrometer. Anal Chem. 2010, 82(8), 3212-21. [CrossRef]
- Balitkabi . Hasil Penelitian Aneka Kacang dan Umbi. Pusat Penelitian dan Pengembangan Tanaman Pangan. Balai Penelitian dan Pengembangan Pertanian balitkabi@litbang.pertanian.go.id www.balitkabi.litbang.pertanian.go.id (2019).
- Chrispeels, M.J.; and Vaener, J.E. Gibberellic Acid-Enhanced Synthesis and Release of α-Amylase and Ribonuclease by Isolated Barley and Aleurone Layers. Plant Physiol. 1967 Mar; 42(3): 398–406. [CrossRef]
Figure 1.
Analytical Thin Layer Chromatography (ATLC) result of GA-3 standard (S), Crude Extract (E), and Methanol Extract (M) on the silica gel plate, developed using the mixture of chloroform, ethyl acetate and glacial acetic acid (6:14:1 v/v) as mobile phase. The spot was observed under UV light at wavelength of 254 nm.
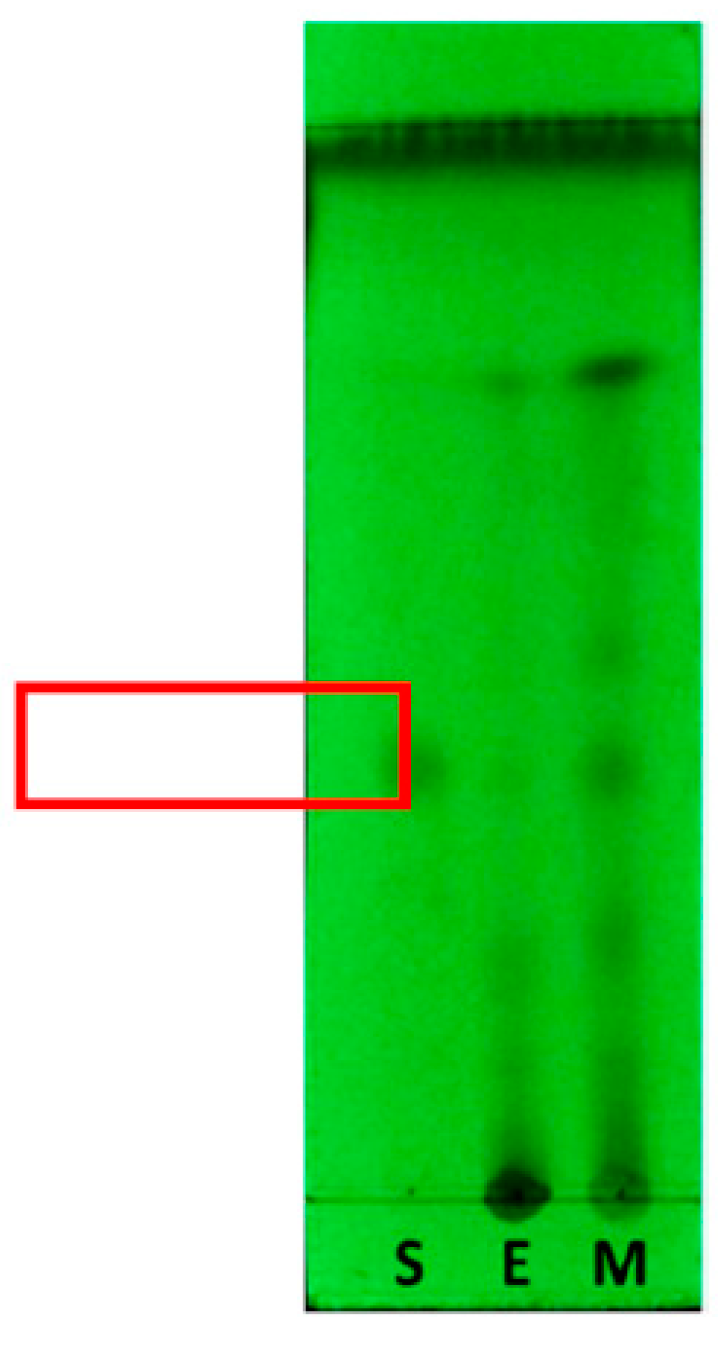
Figure 2.
Analytical Thin Layer Chromatogram (ATLC) result of the fractions from adsorption column chromatography on the silica gel GF-254 plate. As the eluent used the mixture of chloroform, ethyl acetate and glacial acetic acid (6:14:1 v/v). The spot was observed under UV light at wavelength of 254 nm. Note: Line 5: GA-3 Standard, Line 6-9 and 10-15: the fractions from the result of silica gels column chromatography.
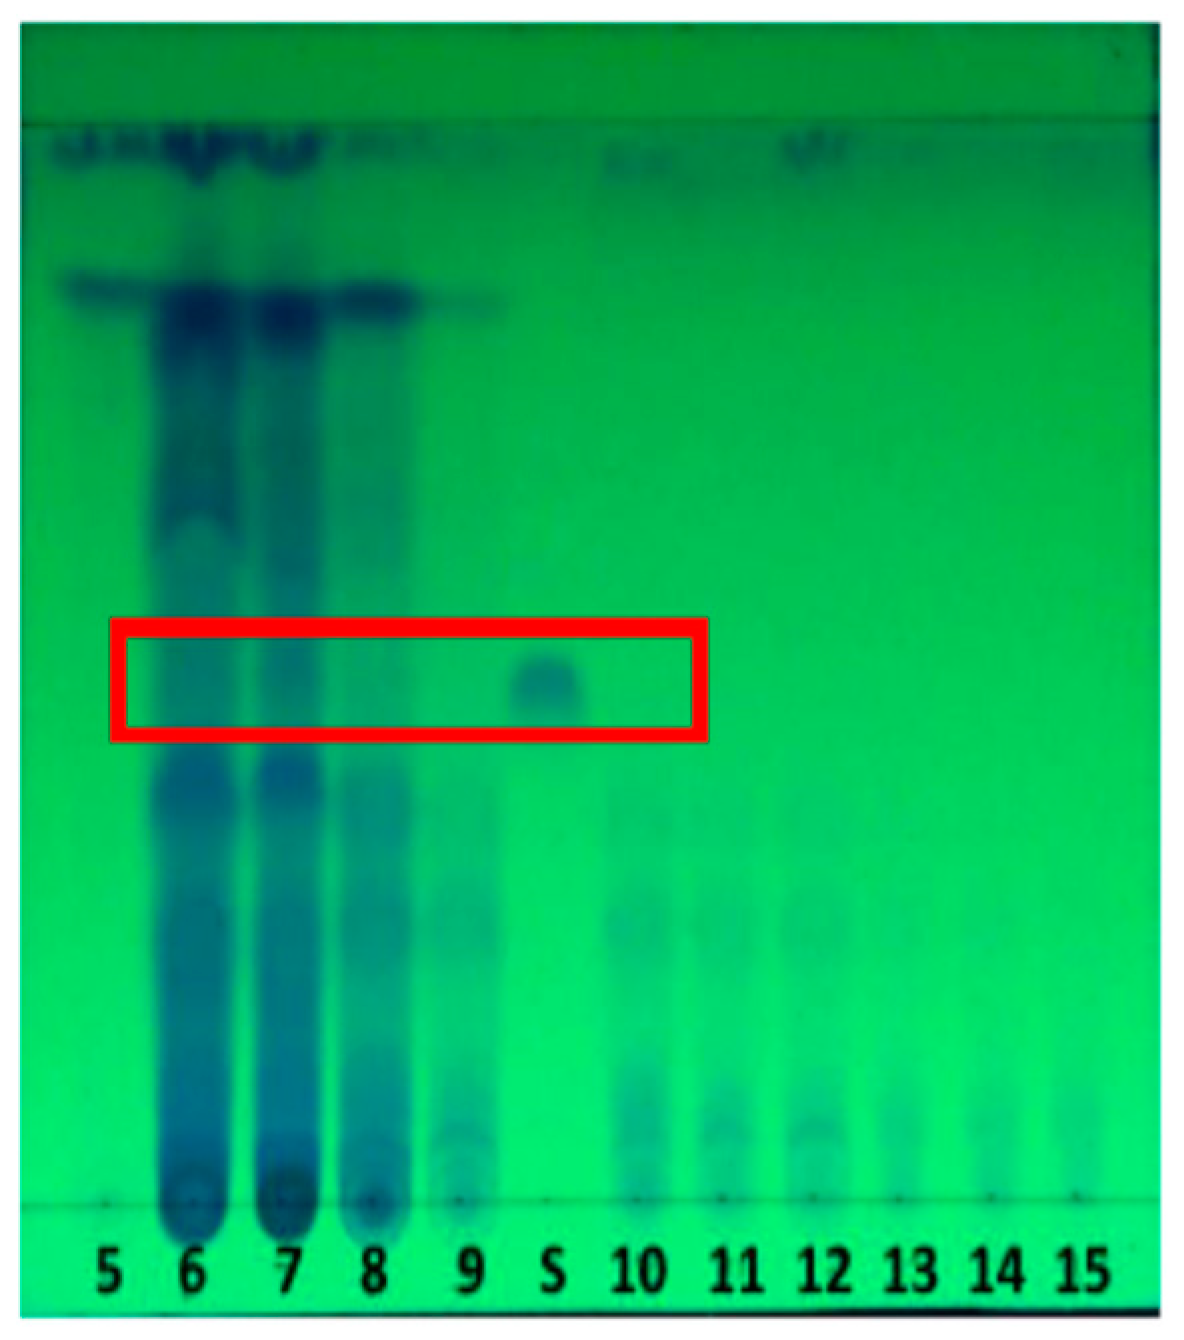
Figure 3.
PTLC result of GA-3 Standard (A), and the fractions of 6-9 from column chromatography(B), on the silica gel GF-254. As the eluent used the mixture of chloroform, ethyl acetate and glacial acetic acid (6:14:1 v/v). The spot was observed under UV light at wavelength of 254 nm3.4. Identification of Gibberellin isolate using RP-HPLC.
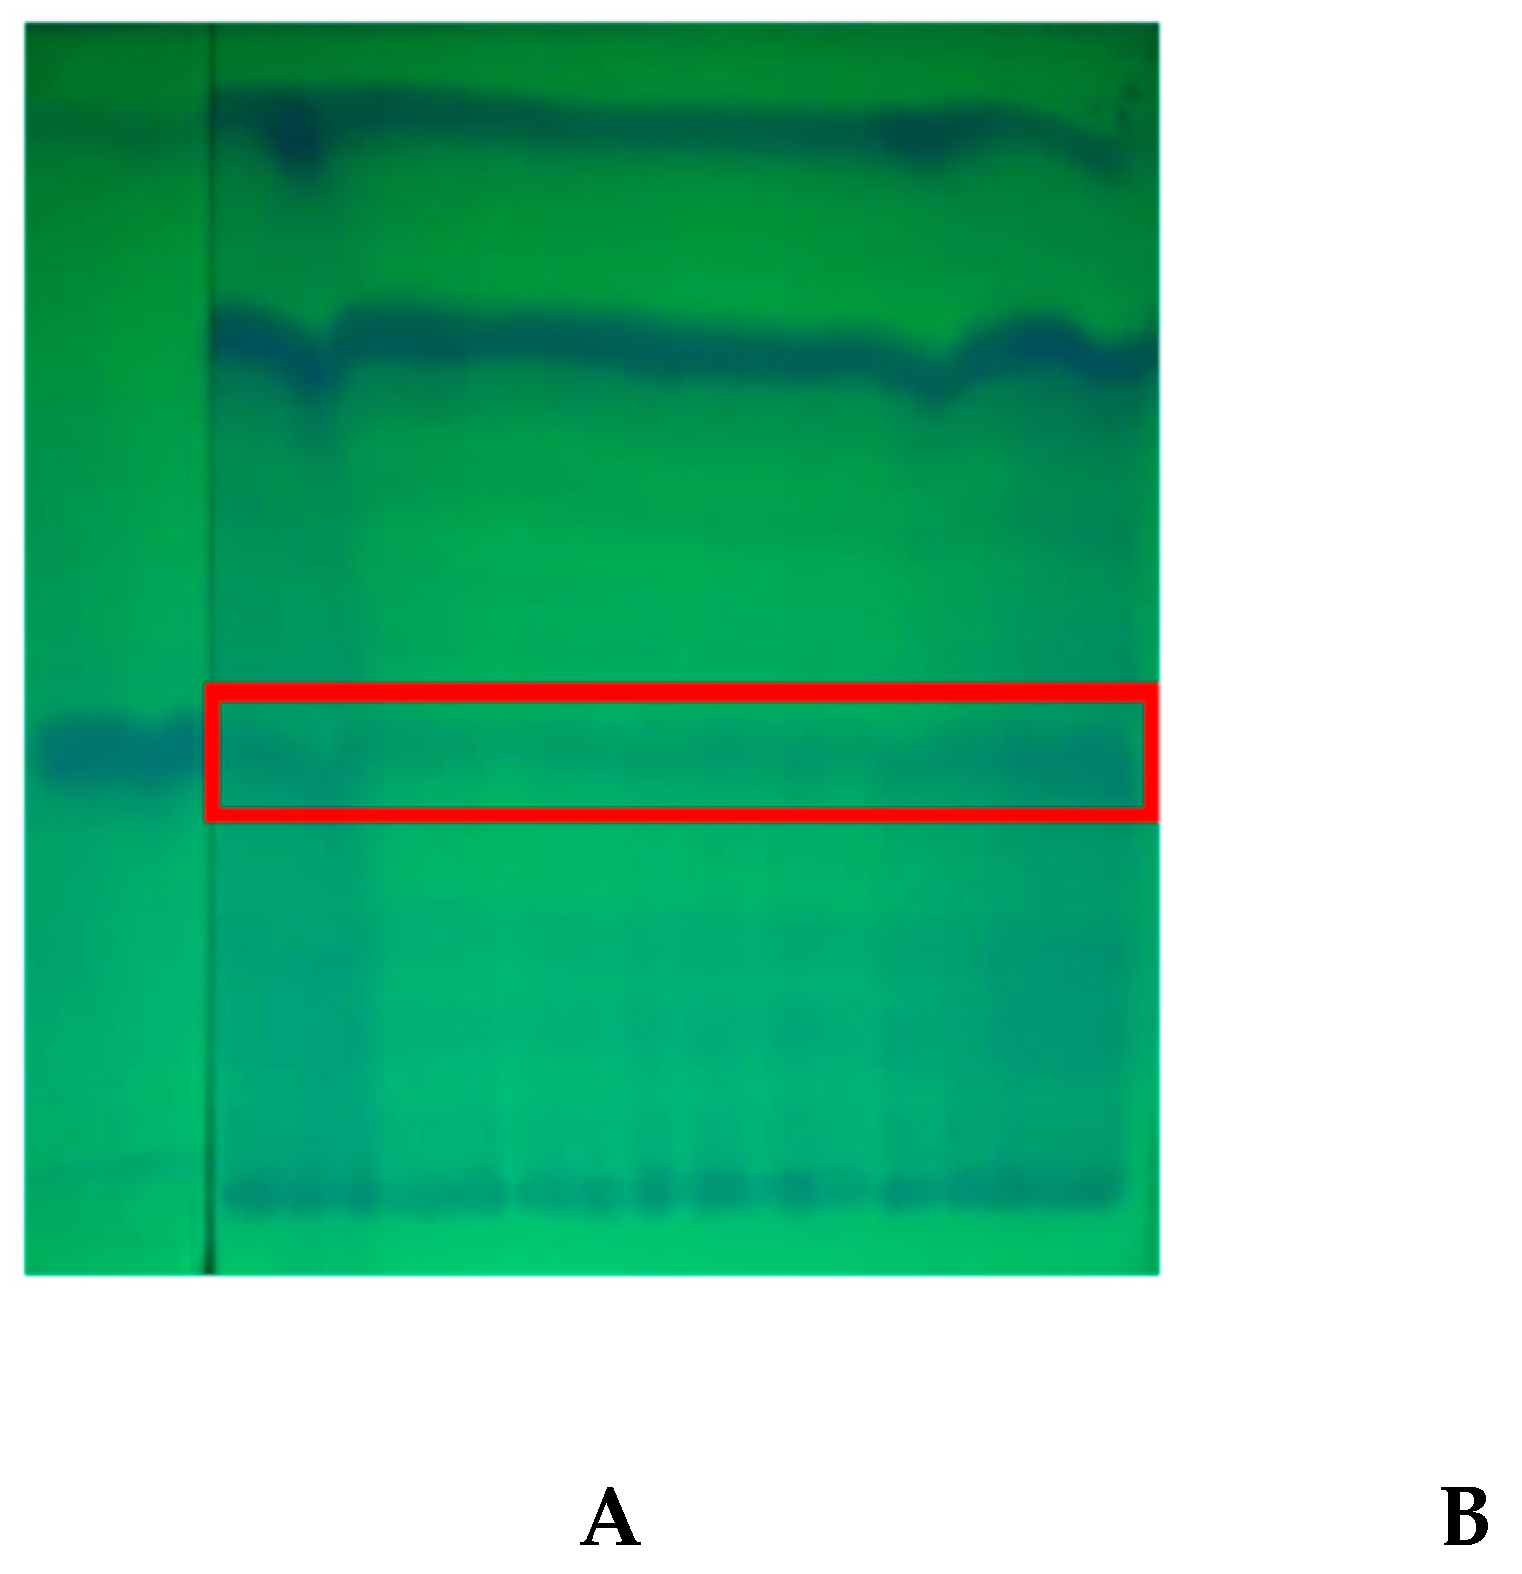
Figure 4.
The result of RP-HPLC of the GA-3 standard (A), and the GA-3 isolates (B). Column used was C-18 Nucleosyl ODS, detector used was UV detector at wavelength of 254 nm. The mobile phase used was 35% methanol in acetate buffer (pH 3.5) with a flow rate of 0.7 mL/minute.
Figure 4.
The result of RP-HPLC of the GA-3 standard (A), and the GA-3 isolates (B). Column used was C-18 Nucleosyl ODS, detector used was UV detector at wavelength of 254 nm. The mobile phase used was 35% methanol in acetate buffer (pH 3.5) with a flow rate of 0.7 mL/minute.
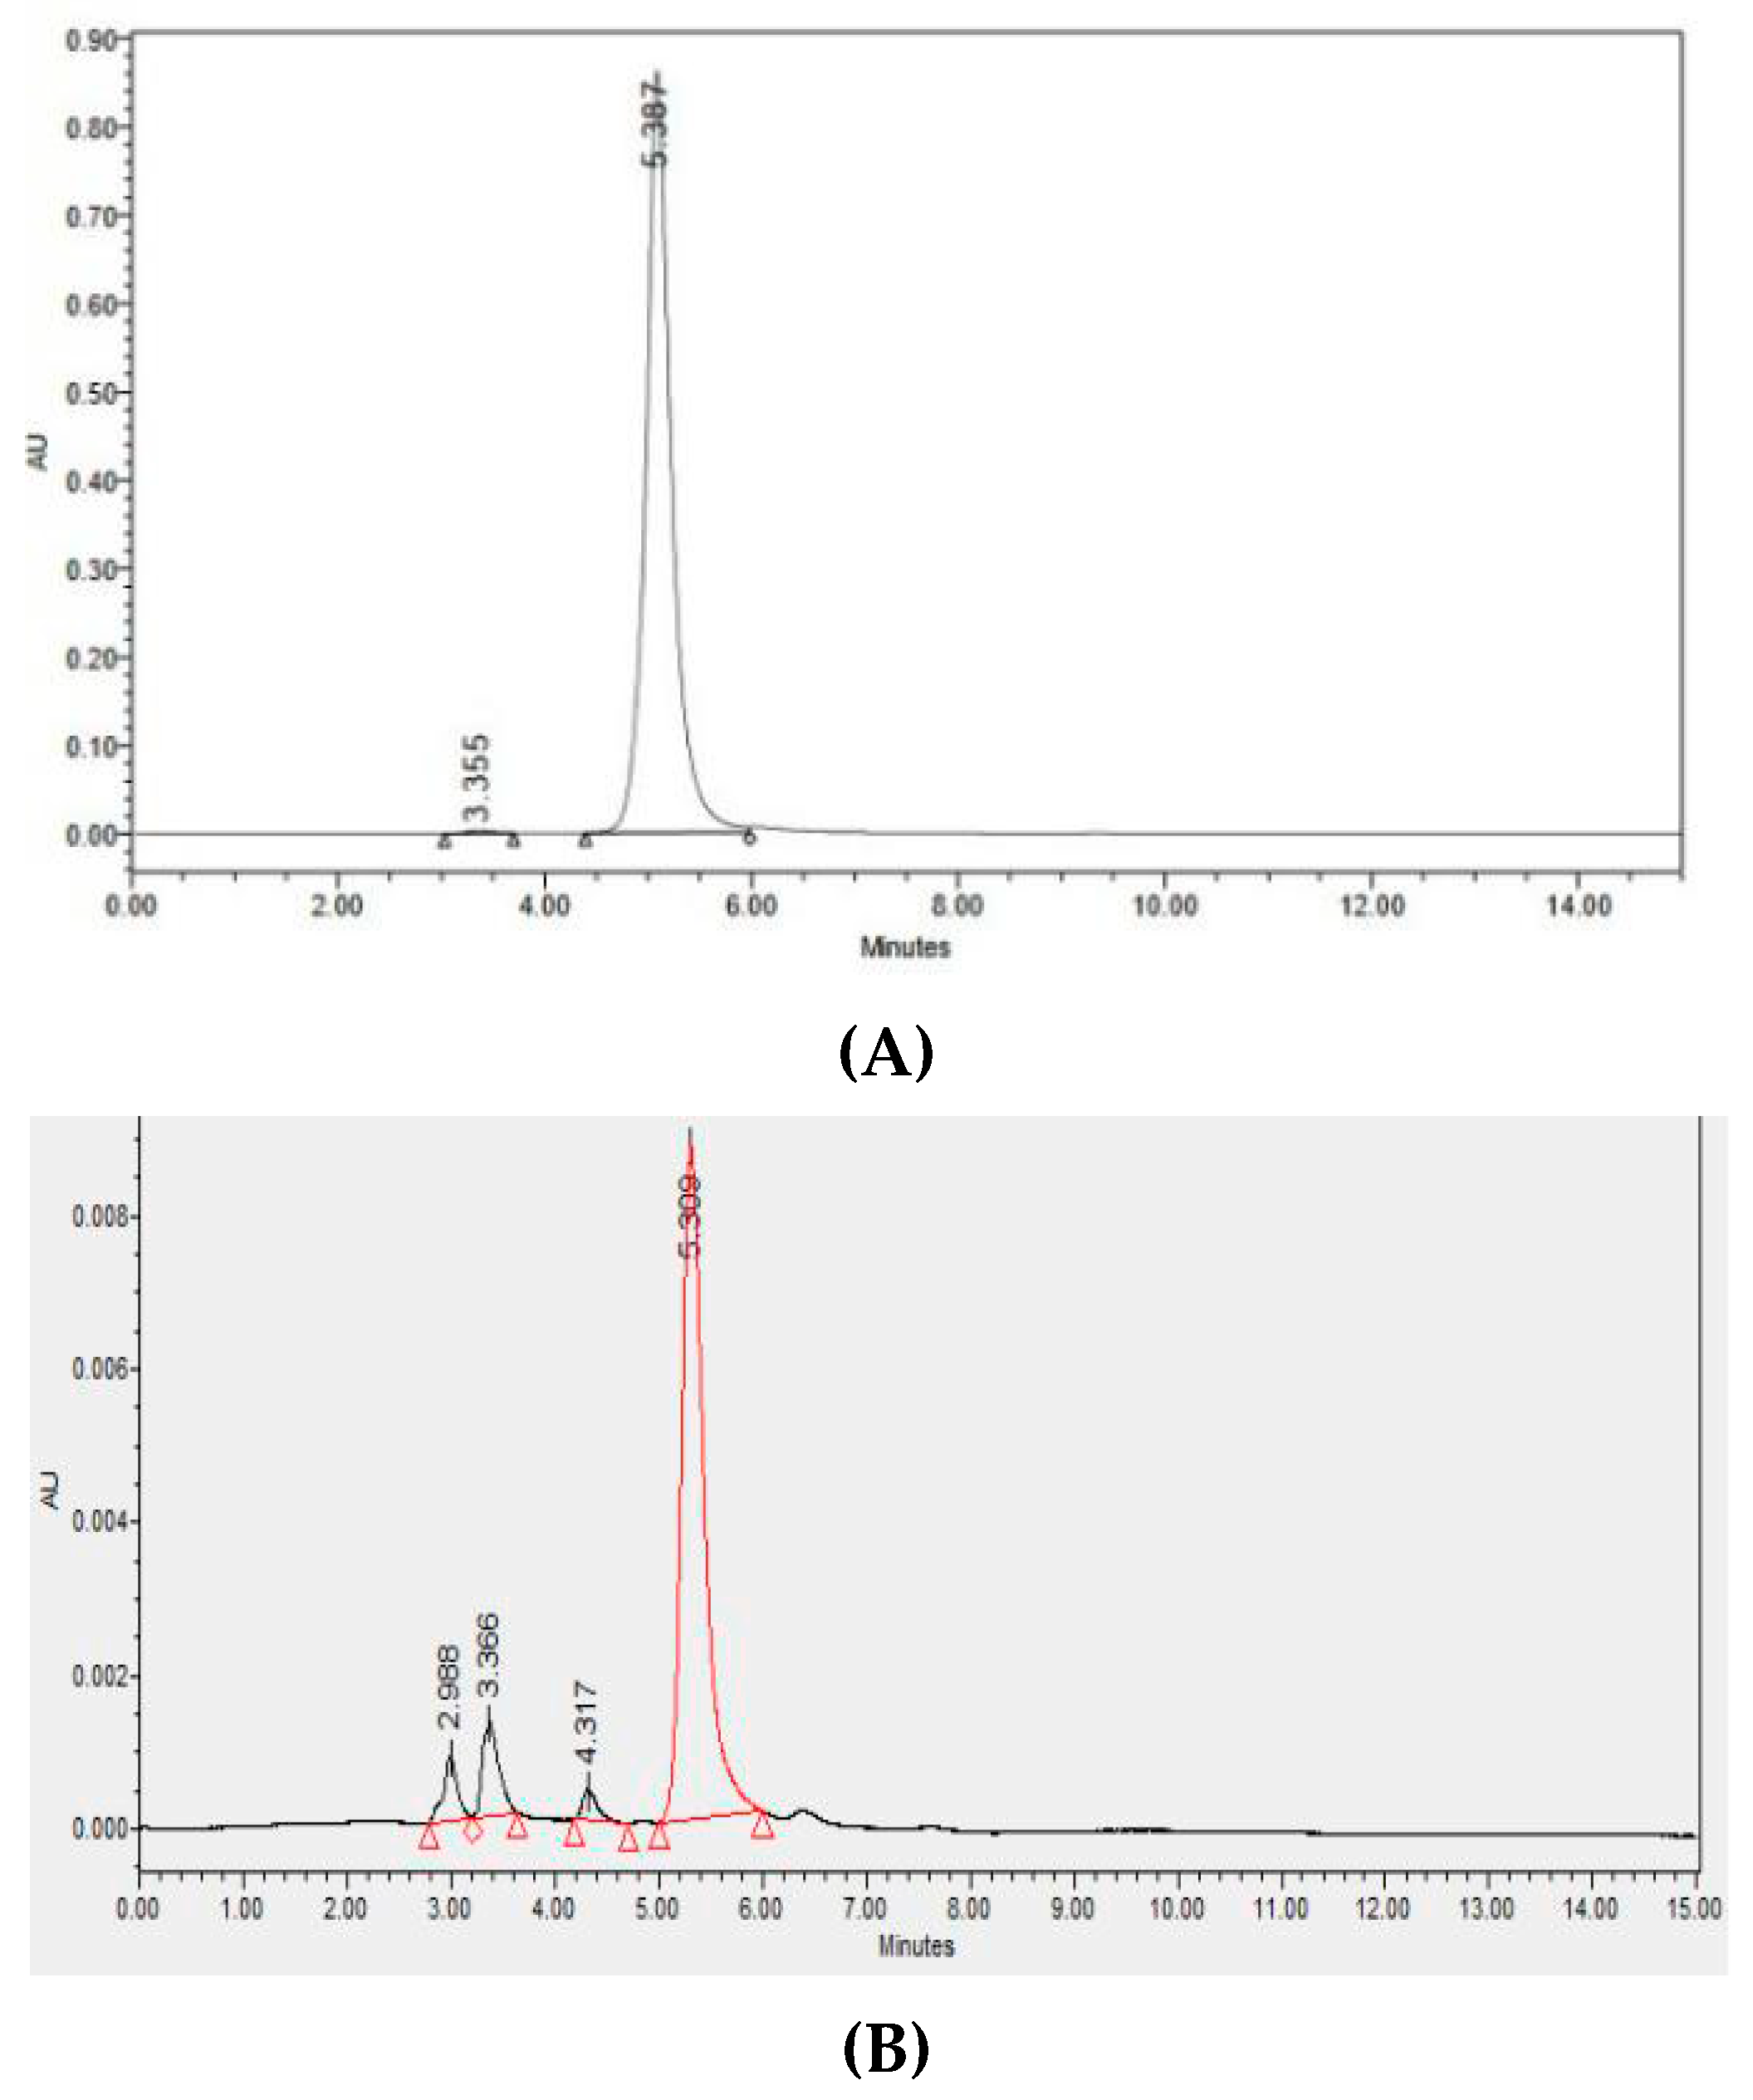
Figure 5.
FTIR spectrum of the GA-3 standard (A), and GA-3 Isolate (B).
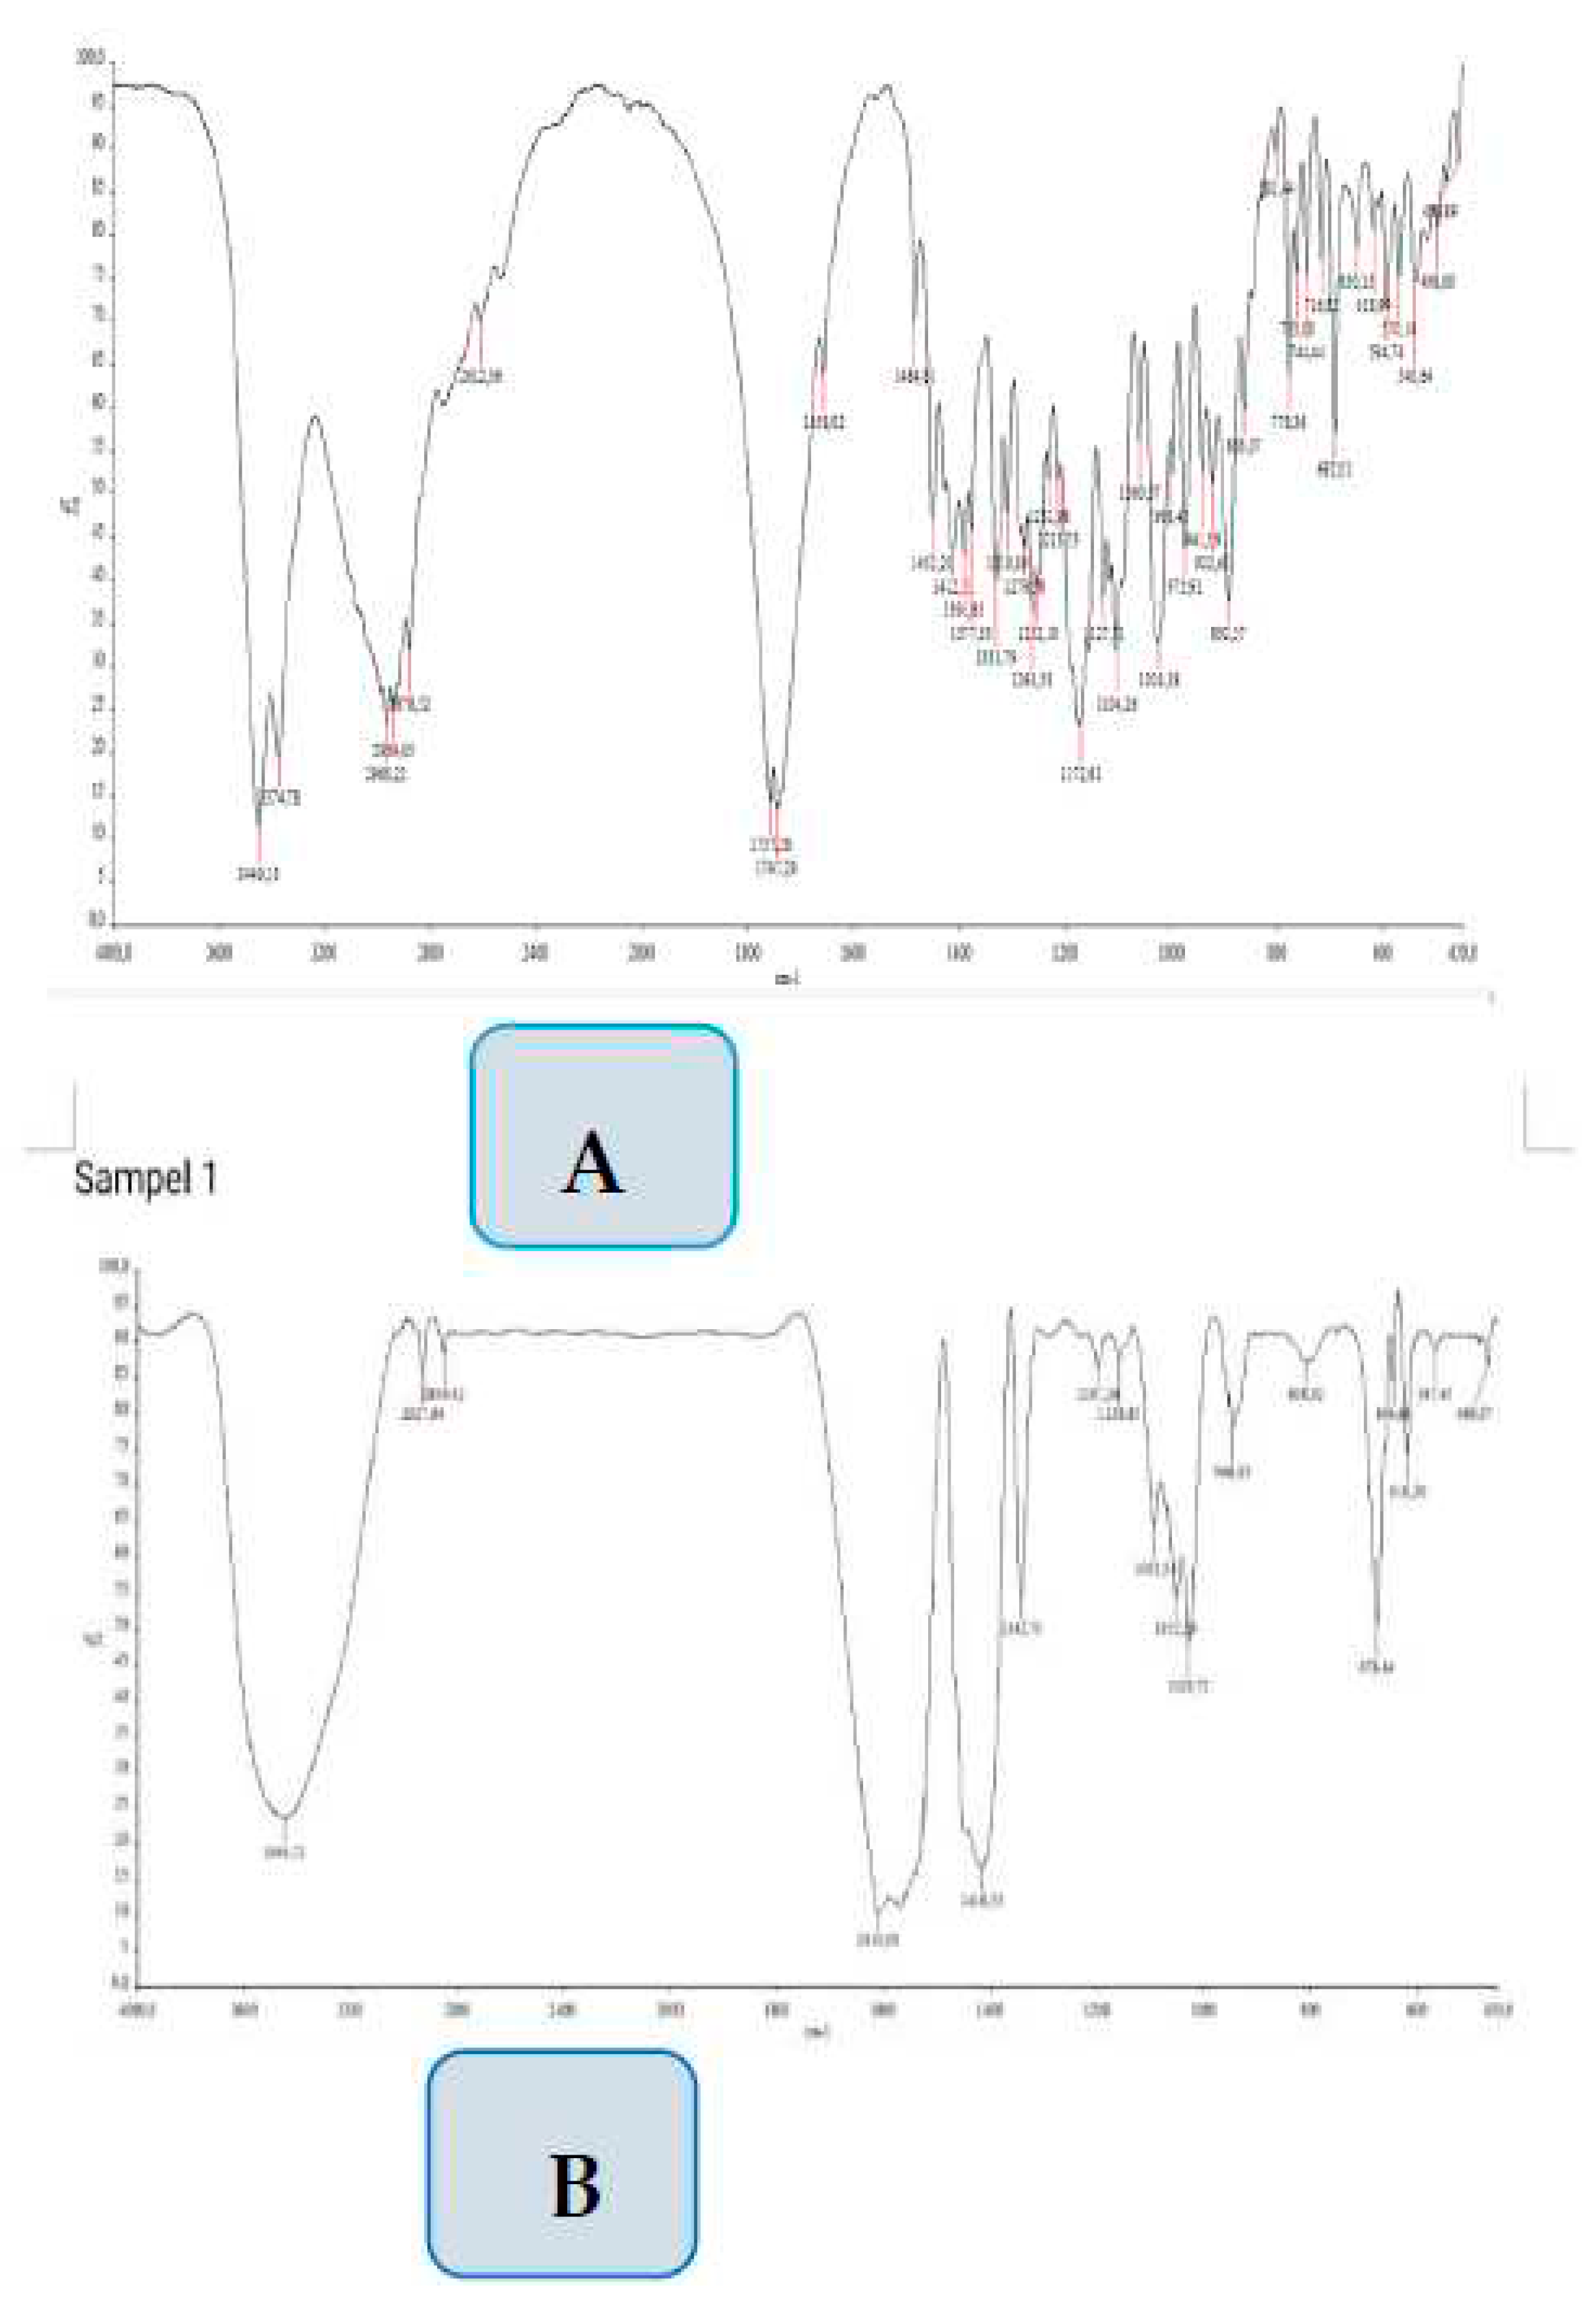
Figure 6.
The mass spectrum of the GA-3 isolate, shows the peak of the molecular ion [M+H]+ at m/z 347.1535, as the molecular weight of GA-3.
Figure 6.
The mass spectrum of the GA-3 isolate, shows the peak of the molecular ion [M+H]+ at m/z 347.1535, as the molecular weight of GA-3.
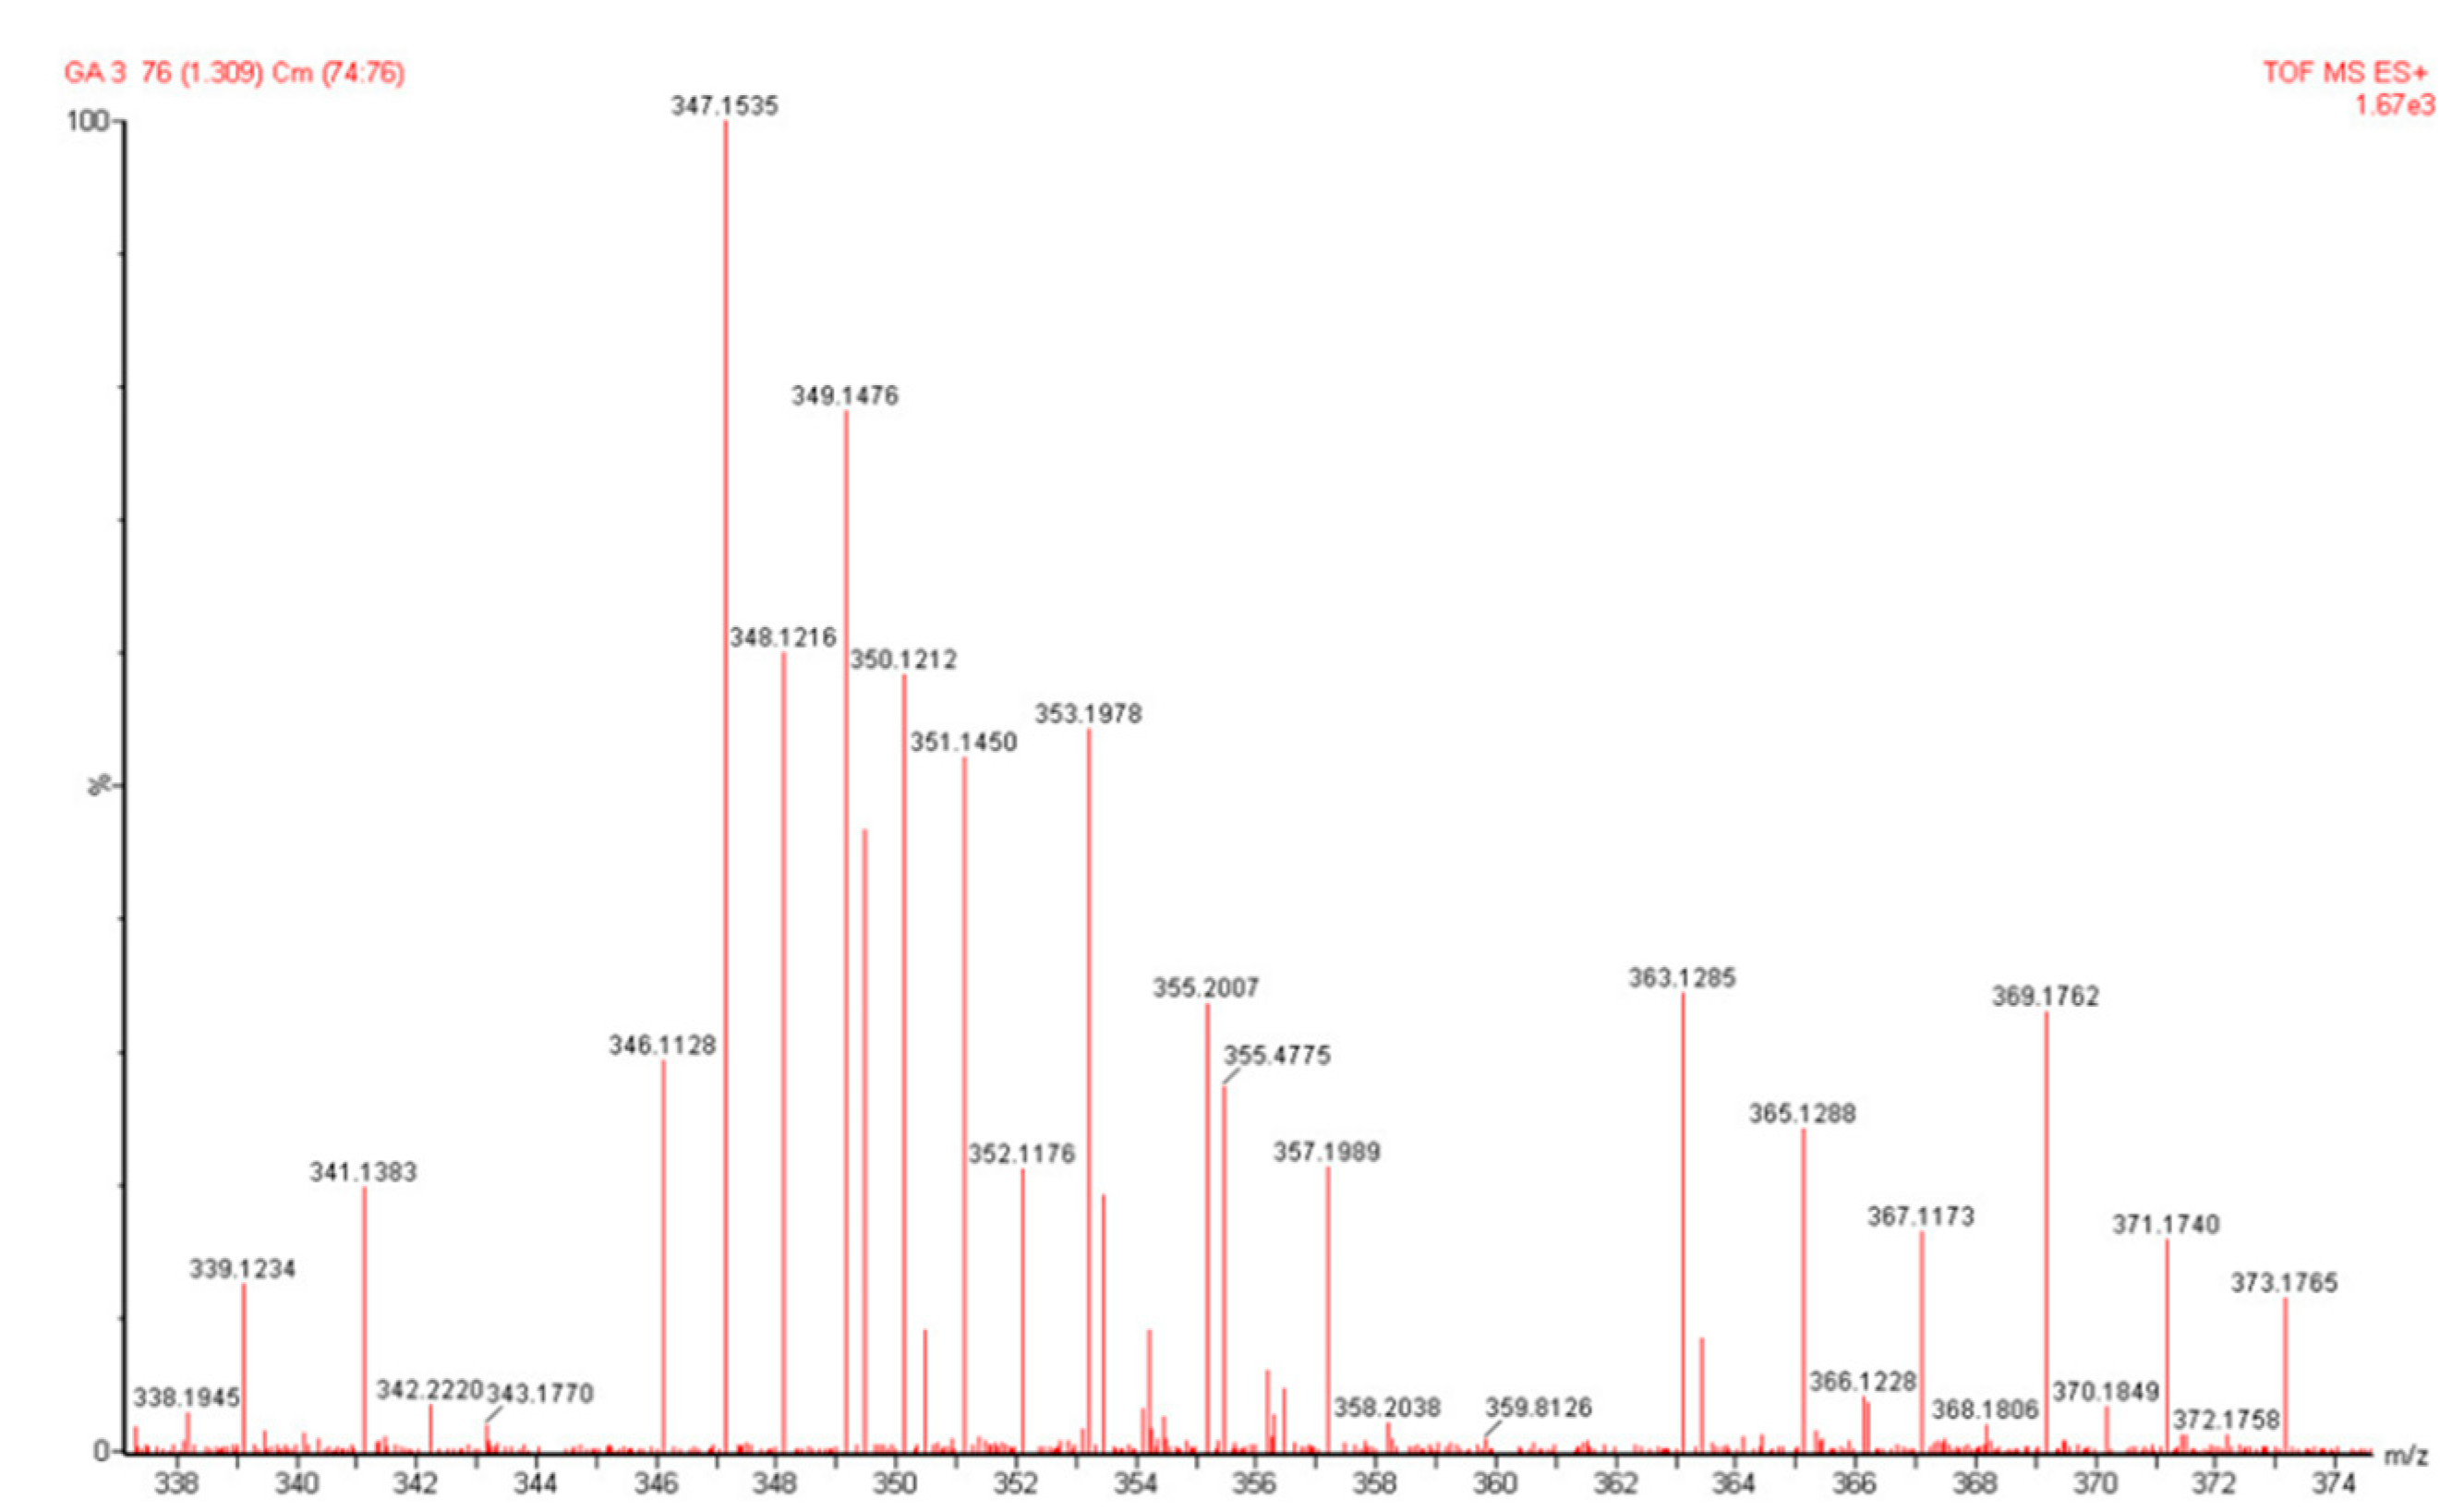

Table 1.
Average of shoot length (A), and root length (B) of soybean plants during four weeks of growth in the vegetative phase growth, for all the treatments.
Table 1.
Average of shoot length (A), and root length (B) of soybean plants during four weeks of growth in the vegetative phase growth, for all the treatments.
| Treatments | First Week | Second Week | Third Wek | Fourth Week |
|---|---|---|---|---|
| Mean ± SD | Mean ± SD | Mean ± SD | Mean ± SD | |
| A. Shoot length (cm) | ||||
| Control | 8,3d± 0,37 | 17,3c± 0,98 | 27,2a±5,31 | 33,8b± 0,4 |
| 1% NPK Fertilizer | 9,6 c± 0,49 | 20 bc±0,4 | 29,5a,b± 1,33 | 35,5 b± 1,12 |
| 1% Biostimulant B1 | 11,2b±0,51 | 23,3a,b± 0,4 | 30,8ab±0,4 | 39,8 a± 3,8 |
| 100 pm Crude Extract | 13,54 a±0,63 | 21,2bc± 0,24 | 35,2 b± 2,48 | 38,8 a± 0,98 |
| 100 ppmGA-3 Isolate | 14 a± 0,55 | 26,2a± 2,11 | 33,1b± 1,96 | 41,2 a ± 0,4 |
| B. Root length (cm) | ||||
| Control | 2,2c± 0,4 | 4,0 c± 0,0 | 7 b±0,55 | 10 c± 0,89 |
| 1% NPK Fertilizer | 2,5bc±0,0 | 5,17 bc±1,62 | 6,63a± 0,41 | 7,7 c± 0,87 |
| 1% Biostimulant B1 | 2,83b± 0,23 | 6 bc ± 0,0 | 7,5b± 0,86 | 13 ab ± 2,76 |
| 100 ppm Crude Extract | 4,25 a± 0,25 | 7,25ab± 0,39 | 9,5 b± 0,5 | 11,4ab± 0,8 |
| 100 ppmGA-3 Isolate | 4,3a± 0,47 | 9,5a± 0,0 | 11,7a± 1,17 | 15,1 a±4,54 |
Different letters a, b, c and d indicate statistically significant differences based on Tukey's post hoc test (P < 0.05).
Table 2.
Average of shoot dry weight length (A), and root dry weight (B) of soybean plants during four weeks of growth in the vegetative phase growth, for all of the treatments.
Table 2.
Average of shoot dry weight length (A), and root dry weight (B) of soybean plants during four weeks of growth in the vegetative phase growth, for all of the treatments.
| Treatments | First Week | Second Week | Third Wek | Fourth Week |
|---|---|---|---|---|
| Mean ± SD | Mean ± SD | Mean ± SD | Mean ± SD | |
| A. Shoot Dry Weight (g) | ||||
| Control | 0,063 c±0,0 | 0,094 ±0,04 | 0,172b±0,00 | 0,491±0,05 |
| 1% NPK Fertilizer | 0,074b±0,00 | 0,122±0,02 | 0,232ab±0,02 | 0,488±0,05 |
| 1% Biostimulant B1 | 0,074 b±0,0 | 0,105 ±0,03 | 0,367a±0,04 | 0,533±0,03 |
| 100 ppm Crude Extract | 0,082a±0,0 | 0,117±0,01 | 0,271ab±0,11 | 0,563±0,17 |
| 100 ppm GA-3 Isolate | 0,067c±0,0 | 0,137±0,04 | 0,367a±0,17 | 0,585±0,16 |
| B. Root Dry Weight (g) | ||||
| Control | 0,0100c±0,0 | 0,02194b±0,01 | 0,03074 b ±0,004 | 0,0607ab±0,03 |
| 1% NPK Fertilizer | 0,01140c±0,01 | 0,02330 b±0,01 | 0,03510 b±0,009 | 0,0465 b ±0,005 |
| 1% Biostimulant B1 | 0,01896b±0,004 | 0,02818 b±0,005 | 0,04044 b±0,01 | 0,0629ab ±0,01 |
| 100 ppm Crude Extract | 0,02436a±0,001 | 0,04958a±0,02 | 0,04428 b±0,02 | 0,0917 a±0,03 |
| 100 ppm GA-3 Isolate | 0,02438a±0,003 | 0,05570a,b±0,02 | 0,10442 a±0,02 | 0,138a±0,04 |
Different letters a, b, c and d indicate statistically significant differences based on Tukey's post hoc test (P < 0.05).
Table 3.
Means of flower emergence time, pod emergence times and harvest time of soybean plant in the generative phase growth, for all of the treatments, base on day after transplanting (DAT).
Table 3.
Means of flower emergence time, pod emergence times and harvest time of soybean plant in the generative phase growth, for all of the treatments, base on day after transplanting (DAT).
| Treatments | Flower emergence time (DAT) | Pod Emergence(DAT) | Harvest time (DAT) | |
|---|---|---|---|---|
| Mean ± SD | Mean ± SD | Mean ± SD | ||
| Control | 46,6 a ± 0,49 | 56,2 a ± 0,40 | 104,8 a ± 0,36 | |
| 1% NPK Fertilizer | 45,4 a± 0,8 | 56,4 a± 0,49 | 104,2 a ± 0,98 | |
| 1% Biostimulant B1+B2 | 46,4 a± 0,8 | 57,4a ± 0,49 | 95,6 c ± 1,96 | |
| 100 ppm Crude Extract | 42,6 b ± 2,05 | 54,4 b± 1,96 | 94,2c ± 0,4 | |
| 100 ppm GA-3 Isolate | 39,4b ± 0,8 | 52,8 b± 0,98 | 97,4b ± 1,09 |
Different letters a, b, c and d indicate statistically significant differences based on Tukey's post hoc test (P < 0.05).
Table 4.
Means of number of pods, pods weight, number of seeds and seed weight per soybean plant in the generative phase growth, for all of the treatments.
Table 4.
Means of number of pods, pods weight, number of seeds and seed weight per soybean plant in the generative phase growth, for all of the treatments.
| Treatments | Number of Pods per Plant (fruits) | Pods weight per plant (g) | Number of seeds per Plant (grains) | Seeds weight per plant (g) |
|---|---|---|---|---|
| Mean ± SD | Mean ± SD | Mean ± SD | Mean ± SD | |
| Control | 61,6 b ± 8,68 | 17,37 b± 2,29 | 125,6 b ± 15,60 | 12,52 ± 1,53 |
| 1% NPK Fertilizer | 67,6 b± 7,90 | 18,49b± 7,90 | 141 b ± 65,23 | 12,13 ± 5,85 |
| 1% Biostimulant B1+ B2 | 80,4 ba± 13,95 | 22,79ab ± 4,48 | 170,6ab ± 35,86 | 17,03 ± 2,50 |
| 100 ppm Crude Extract | 104 a± 16,91 | 29,35 a± 7,07 | 220a ± 35,86 | 17,05± 2,94 |
| 100 ppmGA-3 Isolate | 73b ± 9,88 | 21,01 ab± 2,85 | 149,6 4b ± 23,12 | 15,48 ± 0,93 |
Different letters a, b, c and d indicate statistically significant differences based on Tukey's post hoc test (P < 0.05).
Table 5.
The result of proximate analysis. Means of percentage of total proteins, fats, ash, water, and carbohydrates content of soybean seeds, for all of the treatments.
Table 5.
The result of proximate analysis. Means of percentage of total proteins, fats, ash, water, and carbohydrates content of soybean seeds, for all of the treatments.
| Treatment | Concentration (%) | Proteins | Fats | Ash | Water | Carbohydrates |
|---|---|---|---|---|---|---|
| Control | 34.24 b ± 0.3 | 22,33 ± 1.3 | 4.96 ± 0.0 | 12.28 ±0.6 | 26.19 ± 0.6 | |
| 1% NPK Fertilizer | 37.51 a ± 0.9 | 21.47 ± 1.7 | 4.87 ± 0.1 | 12.50 ± 0.1 | 23.65 ± 2.6 | |
| 1% Biostimulants | B1,B2 38.36 a ± 0.1 | 19.02 ± 1.6 | 5.06 ± 0.1 | 13.21 ± 0.4 | 24.35 ±1.3 | |
| 100 ppm Crude Extract | 38.44 a ± 1.7 | 21.03 ± 2.2 | 4.85 ± 0.3 | 13.83 ± 0.7 | 22.85 ± 1.1 | |
| 100 ppm GA-3 Isolate | 38.17 a ± 0.9 | 20.04 ± 1.3 | 4.95± 0.2 | 13.22 ±0.5 | 23.62 ±1.7 |
Different letters a, b, c and d indicate statistically significant differences based on Tukey's post hoc test (P < 0.05).
Table 6.
The result of the analysis of chlorophyll content at the end of vegetative and generatif phase growth of soybean plant, for all of the treatments.
Table 6.
The result of the analysis of chlorophyll content at the end of vegetative and generatif phase growth of soybean plant, for all of the treatments.
| Treatments The End of The End of |
|---|
| The Vegetative Phase (CCI) The Generative Phase (CCI) |
| Control 26.94a ± 0.5 15.62 a ± 3.34 |
| 1% NPK Fertilizer 30.04 b± 0.26 13.02 a ± 0.46 |
| 1% Biostimulants B1,B2 30,60 b ± 0.66 12,1 ab± 0.47 |
| 100 ppm Crude Extract 32.38 a ± 1.21 9,36 b ±0.16 |
| 100 ppm GA- Isolate 33.34 a ± 2.13 11.5 ab ± 1.0 |
Different letters a, b, c and d indicate statistically significant differences based on Tukey's post hoc test (P < 0.05).
Disclaimer/Publisher’s Note: The statements, opinions and data contained in all publications are solely those of the individual author(s) and contributor(s) and not of MDPI and/or the editor(s). MDPI and/or the editor(s) disclaim responsibility for any injury to people or property resulting from any ideas, methods, instructions or products referred to in the content. |
© 2023 by the authors. Licensee MDPI, Basel, Switzerland. This article is an open access article distributed under the terms and conditions of the Creative Commons Attribution (CC BY) license (https://creativecommons.org/licenses/by/4.0/).
Copyright: This open access article is published under a Creative Commons CC BY 4.0 license, which permit the free download, distribution, and reuse, provided that the author and preprint are cited in any reuse.


