
Submitted:
25 July 2023
Posted:
25 July 2023
You are already at the latest version
Abstract
BRICS-Plus (Brazil, Russia, India, China, South Africa, and 30 other countries) is a group of 35 countries with emerging economies making up more than half of the world’s population. We explored epidemiological trends of cardiovascular disease (CVD) mortality attributable to modifiable risk factors and its association with period and birth cohort effects and sociodemographic index (SDI) across BRICS-Plus by using joinpoint regression and age-period-cohort (APC) modeling from 1990 to 2019. Between 1990 and 2019, the all-ages CVD deaths increased by 85.2% (6.1 million to 11.3 million) across BRICS-Plus. The CVD ASMR attributable to dietary risks and smoking significantly decreased across BRIC-Plus countries, with some exceptions. However, four-fifth of BRIC-Plus countries observed a remarkable increasing trend of high body mass-index (BMI)-related CVD deaths in particular among younger adults (25-49 years). Early birth cohorts and individuals aged greater than 50 years showed a higher risk of CVD mortality. Both China-ASEAN FTA and Mercosur regions stand out for their successful sociodemographic transition, with a significant reduction in CVD mortality over the study period. Singapore and Brazil achieved great progress in CVD mortality reduction and the other BRICS-Plus countries should follow their lead in adopting public health policies and initiatives into practice.
Keywords:
Cardiovascular diseases
; mortality
; modifiable risk factors
; sociodemographic index
; BRICS-Plus
Introduction
Cardiovascular disease (CVD) is the leading cause of premature mortality, responsible for 18.6 million deaths in 2019. Cardiovascular diseases (CVDs), primarily ischemic heart disease (IHD) and stroke, are the top-ranking cause of global mortality accounting for 9.1 million and 6.5 million deaths in the year 2019, respectively [1]. In 2030, the projected CVD-related deaths would be more than 23 million worldwide [2]. According to a World Health Organization (WHO) estimate, low- and middle-income countries account for more than three-quarters of CVDs deaths, which, in recent years, has been seen as a growing epidemic problem [3].
BRICS (Brazil, Russia, India, China, and South Africa) is a group of countries with rapid politico-economic development and comprised nearly half of the world population [4]. BRICS-Plus is the extension of BRICS consisting of 35 developing countries which aims to bring together the regional integration blocks, in which the BRICS economies play a major role, and attempts to provide a new platform for forming regional and bilateral alliances across continents [5]. From 1992 to 2017, the high age-standardized mortality rate (ASMR) for CVD has been reported across the BRICS attributable to cardiometabolic and behavioral risk factors [4, 6-8]. In 2013, the United Nations set a target to reduce 25% premature CVD mortality by 2025, attributable to behavioral and biological risk factors [9]. In 2014, the BRICS reaffirmed their commitment to the prevention and control of non-communicable diseases, particularly CVD [4].
Modifiable risk factors including dietary risks, high body mass index (BMI), and smoking are major drivers of CVD. In the GBD study 2019, dietary risks are either an over-consumed diet (sodium, trans-fatty acids, sugar-sweetened beverages, red meat, and processed meat) or an under-consumed diet (whole grains, legumes, vegetables, fruits, nuts and seeds, milk, fiber, calcium, omega-3 fatty acids from seafood, and polyunsaturated fatty acids) [1, 10]. In 2019, CVDs are the primary consequence of these dietary risks, which cause 7.94 million annual deaths. High BMI (≥25 kg/m2) is considered an epidemic worldwide. High BMI exacerbates CVD risk factors including blood pressure, lipids, blood sugars, and inflammation, and has a linear association with coronary heart diseases. Globally, 5.02 million and 2.7 million CVD deaths are attributed to high BMI and primary smoking in 2019, respectively [1].
A previous study has focused on time trends and age-period-cohort effect on cause-specific CVD mortality across BRICS from 1992 to 2016. However, this study fails to report CVD mortality attributable to modifiable risk factors and its association with socio-demographic transition across BRICS [4]. To the best of our knowledge, no previous study has reported temporal trends of CVD mortality and its association with the sociodemographic index (SDI) across BRICS-Plus. Therefore, this study (GBD 2019) explores epidemiological trends of CVD mortality attributable to modifiable risk factors and its association with SDI across BRICS-Plus. These consistent and comparable analyses of long-term trends and patterns of CVD mortality may provide references to health policymakers and decision-makers to allocate their healthcare resources and specify prevention and control strategies at regional and country levels across BRICS-Plus.
Materials and methods
Data source
In this study, the data were extracted by sex (male, female, and both sex combined) from the GBD free online database (GBD 2019, http://ghdx.healthdata.org/ gbd-results-tool) [11] (accessed on June 6, 2022) from 1990 to 2019. In addition, age-specific data for modifiable risk factors (i.e. 25-49 years, 50-69 years, and 70-89 years) and cause-specific data were extracted for different age groups (i.e. from 25-29 years to 85+ years). GBD is an international cooperative project that estimates the disease burden at regional, national, and global levels. GDB estimates the burden of disease indices including, prevalence, incidence, mortality rate, years of life lost (YLL), years lived with disability (YLD), and disability adjusted-life years (DALYs) for several diseases and injuries. Moreover, the GBD data are provided by different organizations like World Bank Open Data, WHO, and Global Health Observatory for different political and social research. The GBD data is managed by the Institute for Health Metrics and Evaluation (IHME), University of Washington. Therefore, a waiver of informed consent was reviewed and approved by the University of Washington Institutional Review Board [12, 13].
Variables understudy
In the present study, the considered modifiable risk factors were dietary risks, high BMI, and smoking. The dietary risk factor was a composite of an over-consumed diet (sodium, trans-fatty acids, sugar-sweetened beverages, red meat, and processed meat) and an under-consumed diet (whole grains, legumes, vegetables, fruits, nuts and seeds, milk, fiber, calcium, omega-3 fatty acids from seafood, and polyunsaturated fatty acids) [1]. The outcome variables were ASMR and death numbers of CVD, IHD, and IS for the 35 BRICS-Plus countries from 1990-2019. The BRICS-Plus countries were divided into 5 regions including the South African Customs Union (SACU) region (i.e. Botswana, Eswatini, Lesotho, Namibia, and South Africa), South Asian Association for Regional Cooperation (SAARC) region (i.e. Afghanistan, Bangladesh, Bhutan, India, Maldives, Nepal, Pakistan, and Sri Lanka), China-ASEAN Free Trade Area (China-ASEAN FTA) region (i.e. Brunei Darussalam, Cambodia, China, Indonesia, Laos, Malaysia, Myanmar, Philippines, Singapore, Thailand, and Viet Nam), Eurasian Economic Union (EEU) region (i.e. Armenia, Belarus, Kazakhstan, Kyrgyzstan, and Russia), and Mercosur region (i.e. Argentina, Bolivia, Brazil, Paraguay, Uruguay, and Venezuela) [5].
Statistical Analysis
Joinpoint regression for trend analysis (1990-2019)
To assess the temporal trends of CVD, IHD, and IS burden, we estimated the average annual percentage change (AAPC) for CVD, IHD, and IS mortality with joinpoint regression analysis. AAPC represents the trend of CVD, IHD, and IS burden in the whole period from 1990 to 2019. Additionally, AAPC is a weighted average of the yearly percentage change determined by the joinpoint model, with weights corresponding to the duration of the annual percentage change (APC) interval. The APC shows the CVD, IHD, and IS burden trend in each segment determined by using joinpoint regression software. From 1990 to 2019, we produced AAPCs and their 95% confidence intervals (CIs) for each trend segment identified by the model. Furthermore, we estimated AAPCs of CVD, IHD, and IS deaths for both males and females. Based on age groups (i.e. 25-49, 50-69, and 70-89 years), AAPC for CVD, IHD, and IS burden was obtained for both sexes combined from 1990 to 2019. AAPC is considered significant when it is different from 0 at the alpha of 0.05. This analysis was conducted using the joinpoint regression program version 4.9.1.0 (April 2022) from the Surveillance Research Program of the U.S. National Cancer Institute (NCI).
Estimation of Age period cohort effects on CVD mortality
The relationship between mortality of CVD and each of the three main sources of spatial and temporal variability—age, period (year), and cohort (year of birth)—was examined for each BRICS-Plus region/country within the framework of the age-period-cohort (APC) model. Period effects show population-wide exposure at a specific moment, and the period was defined as the survey year. The term "cohort effects" refers to variations in hazards among birth cohorts. Age-specific mortality rates from 25 to 89 years with subsequent 5-year age intervals, calendar time including the consecutive period from 1990 to 2019, and subsequent cohort (period-age) from 1901 to 1994 were taken into consideration for statistical analysis in the age-period-cohort study. The R package (Epi, version 2.44) created by Carstensen et al. was used for the APC analysis [14]. The Maximum Likelihood (ML) of the APC-model Poisson with log (Y) based on the natural-spline function was used to estimate the rate ratio. The reference cohort and reference period were respectively chosen based on the median date of birth and the median date of diagnosis among cases. The estimated models' deviation table was used to assess the goodness of fit. Additionally, the spearman correlation coefficient (r) was used to examine the relationship between Socio-Demographic Index (SDI) and CVD mortality. SDI is a geometric mean value range from 0.0 to 1.0 and is calculated from the total fertility rate under 25 years (TFRU25), lag-distributed income per capita (LDI), and average educational attainment in the population older than 15 years [15]. Two-sided statistical tests were taken into consideration. The threshold for statistical significance of the findings was set at 1% level of significance.
Results
Trends of cause-specific CVD mortality
Table 1 shows trends of cause-specific CVD mortality across BRICS-Plus countries. In 2019, across the BRICS-Plus, there were 11.3 million CVD deaths, accounting for 60.9% of global CVD deaths and the ASMR of CVD was 296 per 100,000. The ASMR of CVD (367 to 296 per 100,000), IHD (169 to 143 per 100,000), and IS (66 to 55 per 100,000) across the BRICS-Plus decreased by 19.3%, 15.3%, and 16.6%, respectively. However, the number of CVD deaths increased by 85.2 % (6.1 to 11.3 million) in BRICS-Plus. The number of IHD deaths (2.4 to 5.3 million) and the number of IS deaths (1.0 to 2.1 million) increased by 120.8% and 110% during 1990-2019 and accounting for 58.3% and 64.4% of global IHD and IS deaths in 2019, respectively.
From 1990 to 2019, despite a 38% reduction in CVD ASMR in China (381 to 276 per 100,000) and 22.8% in India (332 to 256 per 100,000), both countries had a marked increase in the total number of CVD mortality: an increase of 89% in China (2.4 to 4.5 million) and 114.3% in India (1.2 to 2.5 million). Lesotho, Pakistan, Indonesia, and the Philippines were the only BRICS-Plus countries with an increase in ASMR for CVD, IHD, and IS. Singapore had the largest decline in ASMR for CVD (65.6%) and IHD (65.3%) and Brazil (CVD; 50.7% and IHD; 52.8%) from 1990 to 2019 (Table S1-S2, and Figure 1).
Trends of CVD mortality attributable to modifiable risk factors
For both sexes combined, between 1990 to 2019, despite a 25 % reduction in diet-related ASMR for CVD (146 to 109 per 100,000), the dietary risk is the leading attributable risk to high CVD ASMR (109 [95% UI 81-142] than high BMI (53 [95% UI 31-80] and smoking (37 [95% UI 30-45] across BIRCS-plus in 2019. The ASMR for CVD attributable to high BMI increased by 26.2% (42.7 to 53.9 per 100,000). However, the trend of CVD ASMR due to smoking is remarkably decreased by 34.4% (57.3 to 37.6 per 100,000), indicating improvement in smoking-related CVD mortality.
In 2019, among the 35 BRICS-Plus countries, Afghanistan had the highest diet-related CVD ASMR (238 [95% UI 185-294] and BMI-related CVD ASMR (125 [95% UI 75-185], and Belarus had the highest smoking-related CVD ASMR (81 [95% UI 65-102]. However, Singapore had the lowest diet-related ASMR for CVD (31 [95% UI 23-42], high BMI-related ASMR for CVD (13 [95% UI 7-20], and smoking-related ASMR for CVD (9 [95% UI 8-9] (Fig S1A). Moreover, from 1990 to 2019, Singapore had a substantial reduction in CVD ASMR attributable to dietary risks, with an average annual percent change (AAPC) -4.1% (95% CI, -4.3, -3.8), high BMI (AAPC -1.6 % [95% CI, -1.9, -1.4], and smoking (AAPC -5.3% [95% CI, -5.6, -5.0]. Philippines observed a significant increase in CVD ASMR attributable to dietary risks (AAPC 1.1% [95% CI, 0.7, 1.6], high BMI (AAPC 4.3 % [95% CI, 3.5, 5.1], and smoking (AAPC 1.5% [95% CI, 1.2, 1.8] (Table 2, Table S3-S4, Figure 2 & 3, Figure S1-S2).
Across BRICS-Plus, males had 1.5-fold and 5.3-fold higher CVD ASMR than females attributable to dietary risks and smoking, respectively in 2019. The increase in CVD ASMR attributable to high BMI was more striking in males (40.8%) than in females (14.4%) during the study period. Overall, males showed less improvement in CVD ASMR reduction than in females attributable to dietary risks (AAPC -0.9% [95% CI, -1.0, -0.8] verses (AAPC -1.1% [95% CI, -1.2, -1.0] and smoking (AAPC -1.2% [95% CI, -1.4, -1.1] verses (AAPC -2.1% [95% CI, -2.2, -2.0], respectively (Table 3, Table S5-S6, Figure 2, Figure S3-S8).
Age-specific CVD burden attributable to modifiable risk factors
Table S7 through S15 and Figure S9 through S18 show the trend of CVD, IHD, and IS burden with age groups (i.e. 25-49 years, 50-69 years, and 70-89 years) attributable to dietary risks, high BMI, and smoking across the BRICS-Plus countries. The trend of diet and smoking-related CVD, IHD, and IS deaths significantly decreased and high BMI-related deaths markedly increased in the BRICS-Plus across all age groups.
Among all BRIC-plus countries, in the younger population (25-49 years), the highest increasing trends of CVD burden attributable to dietary risks (AAPC 3.8% [95% CI, 3.4, 4.3], high BMI (AAPC 6.2% [95% CI, 5.2, 7.1], and smoking (AAPC 3.5% [95% CI, 3.0, 3.9] were observed in the Philippines. Lesotho and Pakistan had a significantly increasing trend of CVD deaths among younger population attributable to all aforementioned modifiable risk factors during the study period.
Age-period-cohort effects on CVD mortality across the BRICS-Plus
The risk of CVD deaths markedly increased with age across all BRICS-Plus regions and the risk of CVD mortality tends to increase most remarkably in the EEU region with the highest in Russia. The period effect remained consistent during the study period in all BRICS-Plus regions except for EEU and Mercosur regions where moderate fluctuations were observed in CVD deaths from 1990 to 2019. In each of the BRICS-Plus regions, the analysis revealed an increased mortality risk trend in early birth cohorts compared with the median birth cohorts. However, the risk of CVD deaths in the recent birth cohort was the highest in Lesotho in the SACU region and the Philippines in the China-ASEAN FTA region compared with the reference cohort (Figure 4 and Figure S19).
Impact of sociodemographic transitions on CVD mortality across the BRICS-Plus
We found that CVD ASMR declined with the increase of each BRICS-plus country’s SDI but these mortality rates significantly fluctuated during the entire study period. A finite cubic spline with three nodes was used to flexibly simulate the relationship between CVD ASMR and SDI. The estimated relationship between SDI and CVD ASMR is shown as the black line in Figure 5. Countries in the SACU region have shown a quadratic curve for CVD ASMR with the increase in SDI, with a more rapid decline at the highest levels of SDI. Whereas countries in the China-ASEAN FTA, EEU, and Mercosur regions have shown a gradual decline trend of CVD ASMR with the increase in SDI values, specifically countries with a lower level of SDI shown high CVD ASMR than countries with a high level of SDI. The reverse trend in CVD ASMR was found across countries in the SAARC region, decreasing first and then increasing, but this trend was not obvious (Figure 5 and Figure S20 & 21).
Discussion
Our systematic analysis of 2019 GBD data provides a comprehensive picture of epidemiological trends of CVD burden attributable to modifiable risk factors and its association with sociodemographic transition across BRICS-Plus at regional and country levels. Between 1990 and 2019, all-ages CVD mortality nearly doubled across BRICS-Plus. The CVD ASMR attributable to dietary risks and smoking significantly decreased across several BRIC-Plus countries. However, four-fifth of BRIC-Plus countries observed a remarkable increasing trend of BMI-related CVD deaths in particular among younger adults (25-49 years) and ≈3-fold higher CVD mortality in males than in females. In age-period-cohort analysis, the risk of CVD deaths increases with age and the age effect on CVD mortality was more pronounced among individuals aged greater than 50 years. Higher CVD mortality risks were observed in the early birth cohorts compared with the median birth cohorts. Moreover, the ASMR of CVD decreased with increasing SDI across BRICS-Plus.
Overall CVD mortality
CVDs are common and have been considered a growing epidemic problem worldwide [3]. Across the BRICS-plus, the all-ages CVD mortality nearly doubled from 6.1 million in 1990 to 11.3 million in 2019, accounting for 60.9% of global CVD deaths. Although, the ASMR of CVD significantly declined from 367 to 296 per 100,000 in the study period but still higher than the global CVD ASMR of 239 per 100,000 in 2019 [1]. The increase in all-ages CVD mortality and the reduction in ASMR of CVD across BRICS-Plus suggest that population growth and aging play a key role in the overall increase in CVD mortality [1].
At the regional level, the highest ASMR and the lowest ASMR for CVD were observed in the Eurasian Economic Union (EEU) and Mercosur region, respectively. At the country level, the ASMR for CVD were highest in Afghanistan and were lowest (6-fold) in Singapore in 2019. Lesotho, Pakistan, Indonesia, and the Philippines were the only BRICS-Plus countries with an increase in ASMR for CVD. Singapore, Maldives, and Brazil had a pronounced decline in ASMR for CVD from 1990 to 2019. These striking differences at the regional and country level in total CVD rates and temporal trends could attribute to differences in access to effective primary and secondary prevention strategies, health care services, and prevalence of CVD risk factors [16, 17].
CVD mortality attributable to modifiable risk factors
Modifiable risk factors are major drivers of CVD burden [1]. The dietary risk is the leading attributable risk to high CVD ASMR than high BMI and smoking across BIRCS-plus in 2019. The ASMR for CVD attributable to high BMI increased and the CVD ASMR due to smoking remarkably decreased during the study period, indicating improvement in smoking-related CVD mortality. Dietary risks play a vital role in CVDs and the absolute CVD burden due to dietary risk increased over the last 30 years worldwide. Many countries of the world have limited access to whole grains, healthy fresh fruits, and vegetables and adopted policies to reduce consumption of harmful fats, added sugar, and sodium, but these policies have generally been poorly implemented in low- and middle-income countries and the overall impact on global health is limited [1]. Both high BMI and smoking have a linear association with CVDs and adversely affect cardiovascular metabolic risk factors [1, 18, 19]
Among the 35 BRICS-Plus countries, Afghanistan had the highest diet and high BMI-related CVD ASMR, and Belarus had the highest smoking-related CVD ASMR in 2019. The Philippines observed a significant increase in CVD ASMR attributable to the aforementioned modifiable risk factors over the study period. However, Singapore had the lowest age-standardized CVD mortality rate and substantial reduction in CVD ASMR attributable to dietary risks, high BMI, and smoking from 1990 to 2019. The differences in CVD ASMR attributable to modifiable risk factors among BRICS-Plus countries reflect variations in diet quality and levels of exposure to different dietary risks and differences in implementing obesity and smoking-related prevention strategies [1].
Across BRICS-Plus, males had 1.5-fold and 5.3-fold higher CVD ASMR than females in 2019 and showed less improvement in CVD ASMR reduction attributable to dietary risks and smoking, respectively. The increase in CVD ASMR attributable to high BMI was ≈3-fold higher in males than in females during the study period. Globally, men are less adhere to healthy dietary patterns and had lower HEI scores than women [20]. In 2019, the prevalence of smoking is higher in males (33.5%) than in females (6.8%) worldwide [1]. As a result of these differences, higher CVD mortality attributable to modifiable risk factors occurred among men.
Our findings showed that adults aged 25-49 years showed a pronounced increasing trend of BMI-related and slower trend of diet and smoking-related CVD, IHD, and IS deaths compared with the old age group (50-69 years). The marked upward trend of BMI-related CVD deaths among the younger population is alarming and should need proper attention and primary prevention strategies for weight gain across the BRICS-plus. Low physical activity (LPA) could be a significant contributor to CVD premature mortality among younger adults as LPA steadily increased for both sexes at the age of 25 years worldwide [1]. Moreover, low intake of whole grains among young adults (25-50 years) is the leading risk factor for deaths and DALYs [21].
We observed that four fifth of BRIC-Plus countries observed a remarkable increasing trend of BMI-related ASMR of CVD in particular among younger adults. It suggests that a multifactorial approach and interventions are urgently required to improve diet quality, promote exercise and physical activity, and reduce sedentary behavior, particularly among young adults. Governmental-level interventions are needed to regulate food ingredients and control the advertisement of unhealthy diets as observed in the North Karelia Project in Finland [22]. The World Health Organization’s Framework Convention on Tobacco Control measures should be seriously adopted to reduce the smoking-related CVD burden in the BRICS-Plus countries. Controlling modifiable risk factors reduced more than 50% CVD mortality and could prevent or delay cardiometabolic risk factors [23, 24].
Age-period-cohort effects on CVD mortality across the BRICS-Plus
Age effect indicates differences in CVD rates across different age groups, cohort effect shows differences in risks and lifestyles across birth cohorts, and period effect reflects variation in the CVD rates over time that influence all ages and cohorts simultaneously. In age-period-cohort analysis, period and cohort effects assist in determining the success of earlier health-policy interventions and identifying future targets [25, 26]. We observed that the risk of CVD deaths increases with age and the age effect on CVD mortality was more pronounced among individuals aged greater than 50 years across all BRICS-Plus countries. Moreover, the risk of CVD mortality tends to increase with age most remarkably in the EEU region with the highest in Russia. Age is an independent risk factor of CVD in old people and the proportion of CVD incidence linearly increased with aging among both men and women [27, 28]. The highest risk of CVD mortality in the EEU region and Russia could be attributed to poor diet quality, higher prevalence of smoking and alcohol use, and high-level use of the illicit drug [20, 29, 30].
The period effect remained consistent during the study period in all BRICS-Plus regions except for EEU and Mercosur regions where moderate fluctuations were observed in CVD deaths from 1990 to 2019. Mercosur region showed a gradual slope reduction in CVD deaths over the study period. However, in the EEU region, the increasing trend of CVD deaths was observed in the early two decades (1990-2010) and a gradual reduction in the last decade (2010-2019). The Soviet Union’s collapse since the 1990s has significantly influenced population health in the region through conflicts, economic crises, and more porous borders that contributed to increasing NCDs. Moreover, the obsolete inherited healthcare system was unable to cope with existing public health problems and remained underfunded through a prolonged healthcare reform [31, 32]. A gradual reduction in CVD deaths across the EEU region in the last decade could be attributed to the implementation of several nationwide prevention programs for cardiovascular diseases in Russia, Belarus, and Kazakhstan [33, 34].
We observed an increase in CVD mortality risk in the early birth cohorts compared with the median birth cohorts across all BRICS-Plus regions. However, the risk of CVD deaths in the recent birth cohort was the highest in Lesotho in the SACU region and the Philippines in the China-ASEAN FTA region. The highest risk of CVD deaths in recent birth cohorts in Lesotho could be due to an extremely poor healthcare system, inadequate and unequal health resources, and service delivery. The United Nations declared, Lesotho is of the most underdeveloped countries with a higher poverty rate and increasing NCDs burden [35]. Moreover, young adults in Lesotho had a higher prevalence of smoking, high-level use of alcohol, poor diet quality, and low physical activity [36]. Similarly, factors contributing to the highest risk of CVD mortality in young cohorts in the Philippines included poor dietary habits [20, 37], higher prevalence of smoking [38], and high BMI [1] as shown in our findings.
Sociodemographic transitions and CVD mortality across the BRICS-Plus
The socio-demographic index (SDI), a composite indicator of development status, has been used as an effective measure for comparing regional and national disease burdens and evaluating the effectiveness of health policies in countries with socioeconomic transitions [39]. We showed that CVD ASMR decreased with increasing SDI across BRICS-Plus countries. In general, countries with a lower level of SDI had higher CVD ASMR compared with a high level of SDI countries. Afghanistan with the lowest SDI score had a 6-fold higher CVD ASMR than Singapore with the highest SDI score among BRICS-Plus countries in 2019. Across the BRICS-Plus regions, China-ASEAN FTA and Mercosur regions showed a gradual decline trend of CVD ASMR with the increase in SDI values. The socio-demographic transition was associated with a remarkable CVD decline in high-and-middle income countries, but only reflects a gradual decline or no change in several LMICs in the last three decades [40, 41]. Globally, LMICs experienced ~3 times higher CVD deaths than high-income countries [41]. Moreover, regions with high SDI showed ~4-fold CVD deaths reduction than regions with low SDI [42]. Notably, these findings suggest that changes in CVD deaths are strongly related to a country or region’s SDI and should increase investment in the primary and secondary prevention of CVD in countries and regions with low SDI.
Limitations
Our study has certain limitations. First, our analysis is based on GBD secondary data and all GBD limitations are applicable to our findings as mentioned previously [43]. Second, we showed the trend of CVD deaths attributable to overall dietary risks and could not find the trend for the individual dietary risk factor. Third, CVD deaths attributable to modifiable risk factors were investigated among only three age groups and data for those <25 years of age were not included in the age-period-cohort analysis. Fourth, age-period-cohort analysis and SDI association were only conducted for cause-specific CVD deaths and not for modifiable risk factors-related CVD mortality.
Conclusion and Implications
The ASMR of CVD significantly declined however, the all-ages CVD deaths nearly doubled across the BRICS-Plus during the study period. The CVD ASMR attributable to dietary risks and smoking significantly decreased across many BRIC-Plus countries. However, four-fifth of BRIC-Plus countries observed a remarkable increasing trend of BMI-related CVD deaths in particular among younger adults (25-49 years) and ≈3-fold higher CVD mortality in males than in females. The risk of CVD mortality was more pronounced among individuals aged greater than 50 years and in the early birth cohorts. The ASMR of CVD decreased with increasing SDI across BRICS-Plus. These epidemiological trends and patterns of CVD mortality may provide references to health policymakers and decision-makers to allocate their healthcare resources and specify prevention and control strategies for modifiable risk factors at regional and country levels across BRICS-Plus.
Author Contributions
N and SM have done conceptualization, data curation, formal analysis, methodology, software, validation, visualization, writing— original draft. WB, ZL, MS, YL, and JZ contributed in data curation, validation, visualization, and writing—review and editing. YW participated in the investigation, resources, validation, funding acquisition, project administration, and supervision. All authors contributed to the article and approved the submitted version.
Funding
This work is supported by the feasibility study of the ecological follow-up model for a regional collaborative coronary intervention project (Grant No: 2019YFE0113900).
Availability of data and materials
The original contributions presented in the study are included in the article/Supplementary material, further inquiries can be directed to the corresponding author.
Acknowledgments
We would like to thank the funding project for their support financial support.
Competing interests
The authors declare that they have no competing interests.
Ethics approval and consent to participate
Ethical review and approval was not required for the study on human participants in accordance with the local legislation and institutional requirements. Written informed consent for participation was not required for this study in accordance with the national legislation and the institutional requirements.
Consent for publication
Not applicable
Abbreviations
| BRICS-Plus | Brazil, Russia, India, China, South Africa, and 30 other countries |
| WHO | World Health Organization |
| SACU | South African Customs Union |
| SAARC | South Asian Association for Regional Cooperation |
| China-ASEAN FTA | China-ASEAN Free Trade Area |
| EEU | Eurasian Economic Union |
| SDI | Sociodemographic index |
| GBD | Global Burden of Disease |
| APC | Age-period-cohort |
| ML | Maximum Likelihood |
| RR | Rate ratio |
| AAPC | Average annual percentage change |
| ASMR | Age-standardized mortality rate |
| CVD | Cardiovascular disease |
| IHD | Ischemic heart diseases |
| IS | Ischemic stroke |
| BMI | Body mass-index |
References
- Roth Gregory, A.; Mensah George, A.; Johnson Catherine, O.; Addolorato, G.; Ammirati, E.; Baddour Larry, M.; Barengo Noël, C.; Beaton Andrea, Z.; Benjamin Emelia, J.; Benziger Catherine, P.; et al. Global Burden of Cardiovascular Diseases and Risk Factors, 1990–2019. Journal of the American College of Cardiology 2020, 76, 2982–3021. [Google Scholar] [CrossRef] [PubMed]
- Lozano, R.; Naghavi, M.; Foreman, K.; Lim, S.; Shibuya, K.; Aboyans, V.; Abraham, J.; Adair, T.; Aggarwal, R.; Ahn, S.Y.; et al. Global and regional mortality from 235 causes of death for 20 age groups in 1990 and 2010: a systematic analysis for the Global Burden of Disease Study 2010. The Lancet 2012, 380, 2095–2128. [Google Scholar] [CrossRef] [PubMed]
- Roth Gregory, A.; Johnson, C.; Abajobir, A.; Abd-Allah, F.; Abera Semaw, F.; Abyu, G.; Ahmed, M.; Aksut, B.; Alam, T.; Alam, K.; et al. Global, Regional, and National Burden of Cardiovascular Diseases for 10 Causes, 1990 to 2015. Journal of the American College of Cardiology 2017, 70, 1–25. [Google Scholar] [CrossRef] [PubMed]
- Zou, Z.; Cini, K.; Dong, B.; Ma, Y.; Ma, J.; Burgner, D.P.; Patton, G.C. Time trends in cardiovascular disease mortality across the BRICS: an age-period-cohort analysis of key nations with emerging economies using the global burden of disease study 2017. Circulation 2020, 141, 790–799. [Google Scholar] [CrossRef]
- Lissovolik, Y. BRICS-plus: Alternative globalization in the making. Valdai papers 2017, 69, 1–12. [Google Scholar]
- Zhao, D.; Liu, J.; Wang, M.; Zhang, X.; Zhou, M. Epidemiology of cardiovascular disease in China: current features and implications. Nature Reviews Cardiology 2019, 16, 203–212. [Google Scholar] [CrossRef]
- Ribeiro, A.L.P.; Duncan, B.B.; Brant, L.C.; Lotufo, P.A.; Mill, J.G.; Barreto, S.M. Cardiovascular health in Brazil: trends and perspectives. Circulation 2016, 133, 422–433. [Google Scholar] [CrossRef]
- Reddy, P.; Sewpaul, R.; Sifunda, S.; James, S.; Yach, D.; Resnicow, K.; Mthembu, Z.; Mbewu, A. A decade of tobacco control: The South African case of politics, health policy, health promotion and behaviour change. South African Medical Journal 2013, 103, 835–840. [Google Scholar] [CrossRef]
- Chestnov, O. World Health Organization global action plan for the prevention and control of noncommunicable diseases. Geneva, Switzerland, 2013. [Google Scholar]
- Bin, W.; Le, Z.; Mubarik, S.; Fu, G.; Wang, Y. Prediction of cardiovascular diseases mortality-and disability-adjusted life-years attributed to modifiable dietary risk factors from 1990 to 2030 among East Asian countries and the world. Frontiers in nutrition 2022, 9. [Google Scholar]
- Vos, T.; Lim, S.S.; Abbafati, C.; Abbas, K.M.; Abbasi, M.; Abbasifard, M.; Abbasi-Kangevari, M.; Abbastabar, H.; Abd-Allah, F.; Abdelalim, A.; et al. Global burden of 369 diseases and injuries in 204 countries and territories, 1990–2019: a systematic analysis for the Global Burden of Disease Study 2019. The Lancet 2020, 396, 1204–1222. [Google Scholar] [CrossRef]
- Roth, G.A.; Abate, D.; Abate, K.H.; Abay, S.M.; Abbafati, C.; Abbasi, N.; Abbastabar, H.; Abd-Allah, F.; Abdela, J.; Abdelalim, A.; et al. Global, regional, and national age-sex-specific mortality for 282 causes of death in 195 countries and territories, 1980–2017: a systematic analysis for the Global Burden of Disease Study 2017. The Lancet 2018, 392, 1736–1788. [Google Scholar] [CrossRef] [PubMed]
- Kyu, H.H.; Abate, D.; Abate, K.H.; Abay, S.M.; Abbafati, C.; Abbasi, N.; Abbastabar, H.; Abd-Allah, F.; Abdela, J.; Abdelalim, A.; et al. Global, regional, and national disability-adjusted life-years (DALYs) for 359 diseases and injuries and healthy life expectancy (HALE) for 195 countries and territories, 1990–2017: a systematic analysis for the Global Burden of Disease Study 2017. The Lancet 2018, 392, 1859–1922. [Google Scholar] [CrossRef] [PubMed]
- Carstensen, B.; Plummer, M.; Laara, E.; Hills, M. Carstensen MBJApfsaiePoC: Package ‘Epi’. 2013.
- Dicker, D.; Nguyen, G.; Abate, D.; Abate, K.H.; Abay, S.M.; Abbafati, C.; Abbasi, N.; Abbastabar, H.; Abd-Allah, F.; Abdela, J.; et al. Global, regional, and national age-sex-specific mortality and life expectancy, 1950–2017: a systematic analysis for the Global Burden of Disease Study 2017. The Lancet 2018, 392, 1684–1735. [Google Scholar] [CrossRef]
- Gakidou, E.; Afshin, A.; Abajobir, A.A.; Abate, K.H.; Abbafati, C.; Abbas, K.M.; Abd-Allah, F.; Abdulle, A.M.; Abera, S.F.; Aboyans, V.; et al. Global, regional, and national comparative risk assessment of 84 behavioural, environmental and occupational, and metabolic risks or clusters of risks, 1990–2016: a systematic analysis for the Global Burden of Disease Study 2016. The Lancet 2017, 390, 1345–1422. [Google Scholar] [CrossRef] [PubMed]
- Husain, M.J.; Datta, B.K.; Kostova, D.; Joseph, K.T.; Asma, S.; Richter, P.; Jaffe, M.G.; Kishore, S.P. Access to cardiovascular disease and hypertension medicines in developing countries: an analysis of essential medicine lists, price, availability, and affordability. Journal of the American Heart Association 2020, 9, e015302. [Google Scholar] [CrossRef]
- Brunner, H.; Cockcroft, J.R.; Deanfield, J.; Donald, A.; Ferrannini, E.; Halcox, J.; Kiowski, W.; Lüscher, T.F.; Mancia, G.; Natali, A.; et al. Endothelial function and dysfunction. Part II: Association with cardiovascular risk factors and diseases. A statement by the Working Group on Endothelins and Endothelial Factors of the European Society of Hypertension*. Journal of Hypertension 2005, 23. [Google Scholar] [CrossRef] [PubMed]
- Amiri, P.; Mohammadzadeh-Naziri, K.; Abbasi, B.; Cheraghi, L.; Jalali-Farahani, S.; Momenan, A.A.; Amouzegar, A.; Hadaegh, F.; Azizi, F. Smoking habits and incidence of cardiovascular diseases in men and women: findings of a 12 year follow up among an urban Eastern-Mediterranean population. BMC Public Health 2019, 19, 1042. [Google Scholar] [CrossRef]
- Miller, V.; Webb, P.; Cudhea, F.; Shi, P.; Zhang, J.; Reedy, J.; Erndt-Marino, J.; Coates, J.; Mozaffarian, D. Global dietary quality in 185 countries from 1990 to 2018 show wide differences by nation, age, education, and urbanicity. Nature Food 2022, 3, 694–702. [Google Scholar] [CrossRef]
- Murray, C.J. Health effects of dietary risks in 195 countries, 1990–2017: a systematic analysis forthe Global Burden of Disease Study. Lancet 2019, 393, 1958–1972. [Google Scholar]
- Jousilahti, P.; Laatikainen, T.; Salomaa, V.; Pietilä, A.; Vartiainen, E.; Puska, P. 40-year CHD mortality trends and the role of risk factors in mortality decline: the North Karelia project experience. Global heart 2016, 11, 207–212. [Google Scholar] [CrossRef]
- Ford, E.S.; Capewell, S. Proportion of the decline in cardiovascular mortality disease due to prevention versus treatment: public health versus clinical care. Annual review of public health 2011, 32, 5–22. [Google Scholar] [CrossRef] [PubMed]
- Zhang, X.; Devlin, H.M.; Smith, B.; Imperatore, G.; Thomas, W.; Lobelo, F.; Ali, M.K.; Norris, K.; Gruss, S.; Bardenheier, B. Effect of lifestyle interventions on cardiovascular risk factors among adults without impaired glucose tolerance or diabetes: A systematic review and meta-analysis. PloS one 2017, 12, e0176436. [Google Scholar] [CrossRef] [PubMed]
- Wang, Z.; Hu, S.; Sang, S.; Luo, L.; Yu, C. Age–period–cohort analysis of stroke mortality in China: data from the Global Burden of Disease Study 2013. Stroke 2017, 48, 271–275. [Google Scholar] [CrossRef] [PubMed]
- Rosenberg, P.S.; Anderson, W.F. Proportional hazards models and age–period–cohort analysis of cancer rates. Statistics in medicine 2010, 29, 1228–1238. [Google Scholar] [CrossRef]
- Rodgers, J.L.; Jones, J.; Bolleddu, S.I.; Vanthenapalli, S.; Rodgers, L.E.; Shah, K.; Karia, K.; Panguluri, S.K. Cardiovascular Risks Associated with Gender and Aging. J Cardiovasc Dev Dis 2019, 6. [Google Scholar] [CrossRef] [PubMed]
- Yazdanyar, A.; Newman, A.B. The burden of cardiovascular disease in the elderly: morbidity, mortality, and costs. Clinics in geriatric medicine 2009, 25, 563–577. [Google Scholar] [CrossRef]
- Stefler, D.; Azarova, A.; Irdam, D.; Scheiring, G.; Murphy, M.; McKee, M.; King, L.; Bobak, M. Smoking, alcohol and cancer mortality in Eastern European men: Findings from the PrivMort retrospective cohort study. International journal of cancer 2018, 143, 1128–1133. [Google Scholar] [CrossRef]
- Starodubov, V.I.; Marczak, L.B.; Varavikova, E.; Bikbov, B.; Ermakov, S.P.; Gall, J.; Glenn, S.D.; Griswold, M.; Idrisov, B.; Kravchenko, M. The burden of disease in Russia from 1980 to 2016: a systematic analysis for the Global Burden of Disease Study 2016. The Lancet 2018, 392, 1138–1146. [Google Scholar] [CrossRef]
- Nichol J: HEALTH-RELATED ISSUES IN RUSSIA AND EURASIA: CONTEXT AND ISSUES FOR CONGRESS. Russia, China Eurasia 2011, 27, 367.
- Rechel, B.; McKee, M. Health reform in central and eastern Europe and the former Soviet Union. The Lancet 2009, 374, 1186–1195. [Google Scholar] [CrossRef]
- Grigoriev, P.; Meslé, F.; Shkolnikov, V.M.; Andreev, E.; Fihel, A.; Pechholdova, M.; Vallin, J. The recent mortality decline in Russia: beginning of the cardiovascular revolution? Population Development review 2014, 40, 107–129. [Google Scholar] [CrossRef]
- Movsisyan, N.K.; Vinciguerra, M.; Medina-Inojosa, J.R.; Lopez-Jimenez, F. Cardiovascular Diseases in Central and Eastern Europe: A Call for More Surveillance and Evidence-Based Health Promotion. Ann Glob Health 2020, 86, 21. [Google Scholar] [CrossRef]
- World Health, O. WHO country cooperation strategy at a glance: Lesotho. In. Geneva: World Health Organization; 2018.
- Tseole, N.P. Understanding modifiable risk factors for non-communicable diseases among adult men in Maseru, Lesotho. 2018.
- Angeles-Agdeppa, I.; Sun, Y.; Tanda, K.V. Dietary pattern and nutrient intakes in association with non-communicable disease risk factors among Filipino adults: a cross-sectional study. Nutrition Journal 2020, 19, 79. [Google Scholar] [CrossRef]
- Bellew, B.; Antonio, M.; Limpin, M.; Alzona, L.; Trinidad, F.; Dorotheo, U.; Yapchiongco, R.; Garcia, R.; Anden, A.A. Addressing the tobacco epidemic in the Philippines: progress since ratification of the WHO FCTC. Public Health Action 2013, 3, 103–108. [Google Scholar] [CrossRef] [PubMed]
- Lim, S.S.; Allen, K.; Bhutta, Z.A.; Dandona, L.; Forouzanfar, M.H.; Fullman, N.; Gething, P.W.; Goldberg, E.M.; Hay, S.I.; Holmberg, M.; et al. Measuring the health-related Sustainable Development Goals in 188 countries: a baseline analysis from the Global Burden of Disease Study 2015. The Lancet 2016, 388, 1813–1850. [Google Scholar] [CrossRef]
- Omram, A.R. The epidemiologic transition: a theory of the epidemiology of population change. Bulletin of the World Health Organization 2001, 79, 161–170. [Google Scholar]
- Jagannathan, R.; Patel, S.A.; Ali, M.K.; Narayan, K. Global updates on cardiovascular disease mortality trends and attribution of traditional risk factors. Current diabetes reports 2019, 19, 1–12. [Google Scholar] [CrossRef]
- Li, Z.; Lin, L.; Wu, H.; Yan, L.; Wang, H.; Yang, H.; Li, H. Global, regional, and national death, and disability-adjusted life-years (DALYs) for cardiovascular disease in 2017 and trends and risk analysis from 1990 to 2017 using the global burden of disease study and implications for prevention. Frontiers in public health 2021, 9. [Google Scholar] [CrossRef]
- Afshin, A.; Sur, P.J.; Fay, K.A.; Cornaby, L.; Ferrara, G.; Salama, J.S.; Mullany, E.C.; Abate, K.H.; Abbafati, C.; Abebe, Z.; et al. Health effects of dietary risks in 195 countries, 1990–2017: a systematic analysis for the Global Burden of Disease Study 2017. The Lancet 2019, 393, 1958–1972. [Google Scholar] [CrossRef]
Figure 1.
Relative proportion of BRICS-Plus to the global burden of cause-specific CVD deaths in 2019.
Figure 1.
Relative proportion of BRICS-Plus to the global burden of cause-specific CVD deaths in 2019.
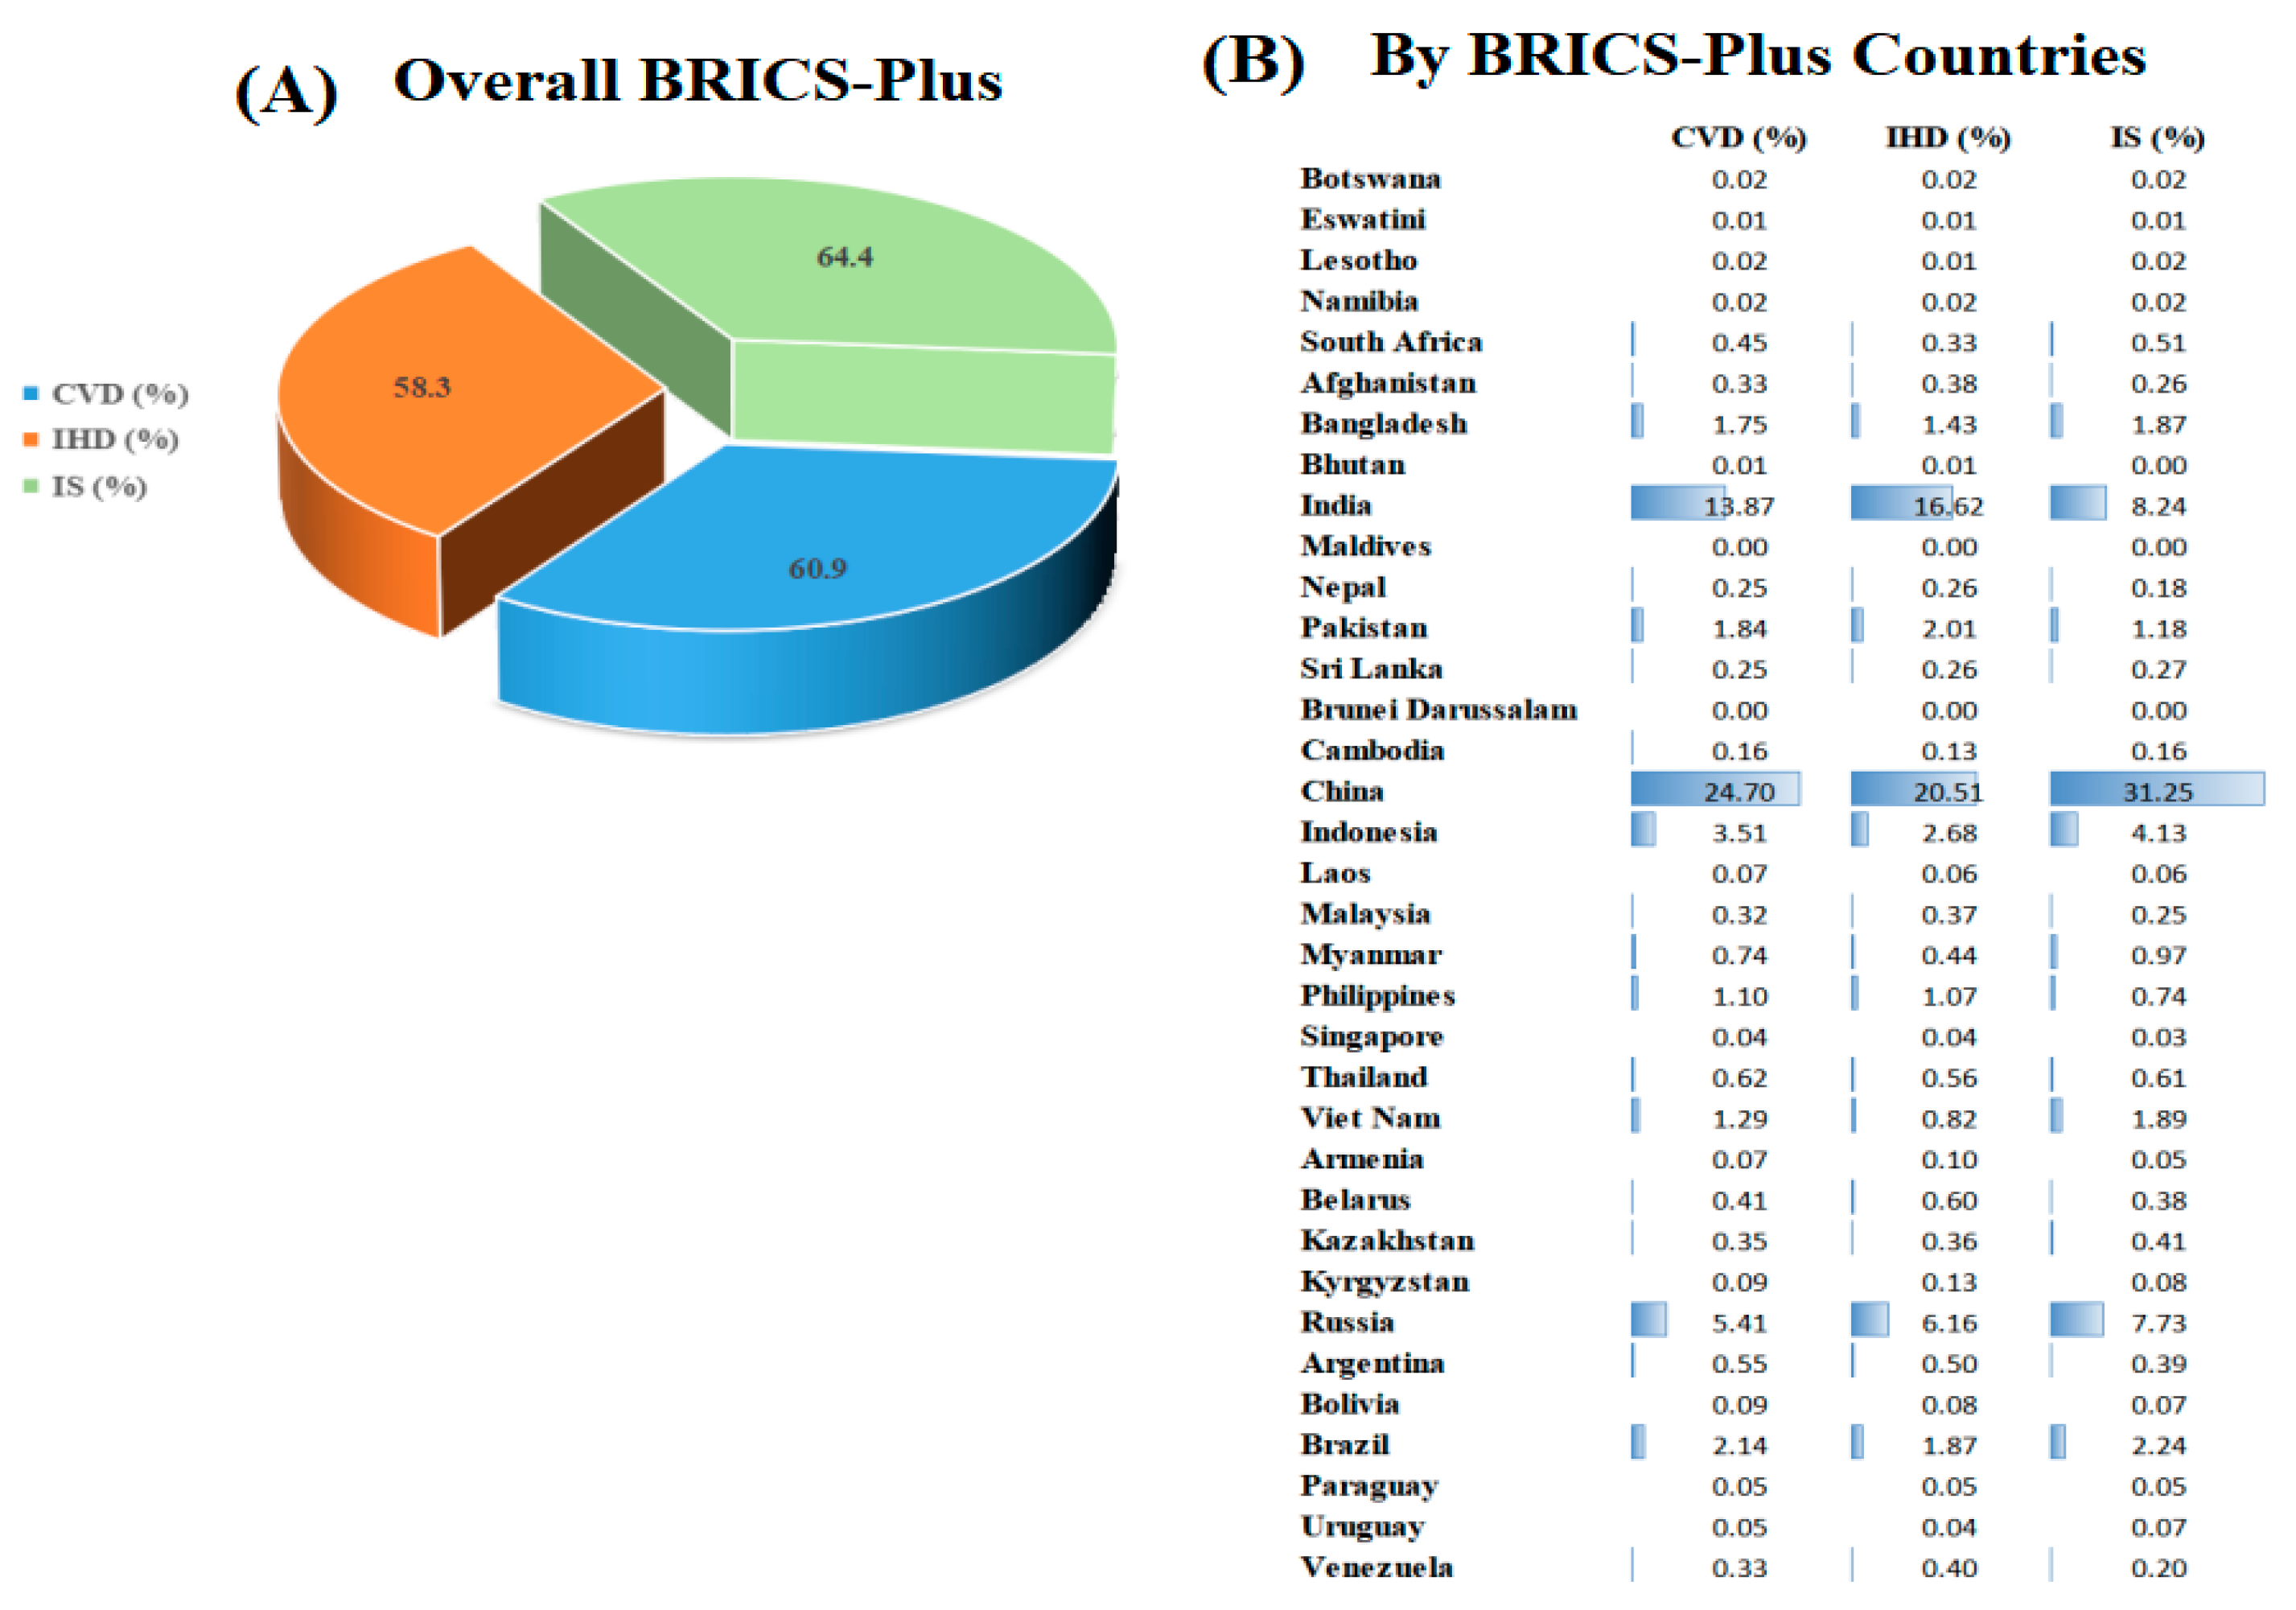
Figure 2.
The temporal trend of CVD burden (age-standardized mortality rate) for different gender attributable to dietary risks (A), high BMI (B), and smoking (C) across BRICS-Plus from 1990 to 2019.
Figure 2.
The temporal trend of CVD burden (age-standardized mortality rate) for different gender attributable to dietary risks (A), high BMI (B), and smoking (C) across BRICS-Plus from 1990 to 2019.
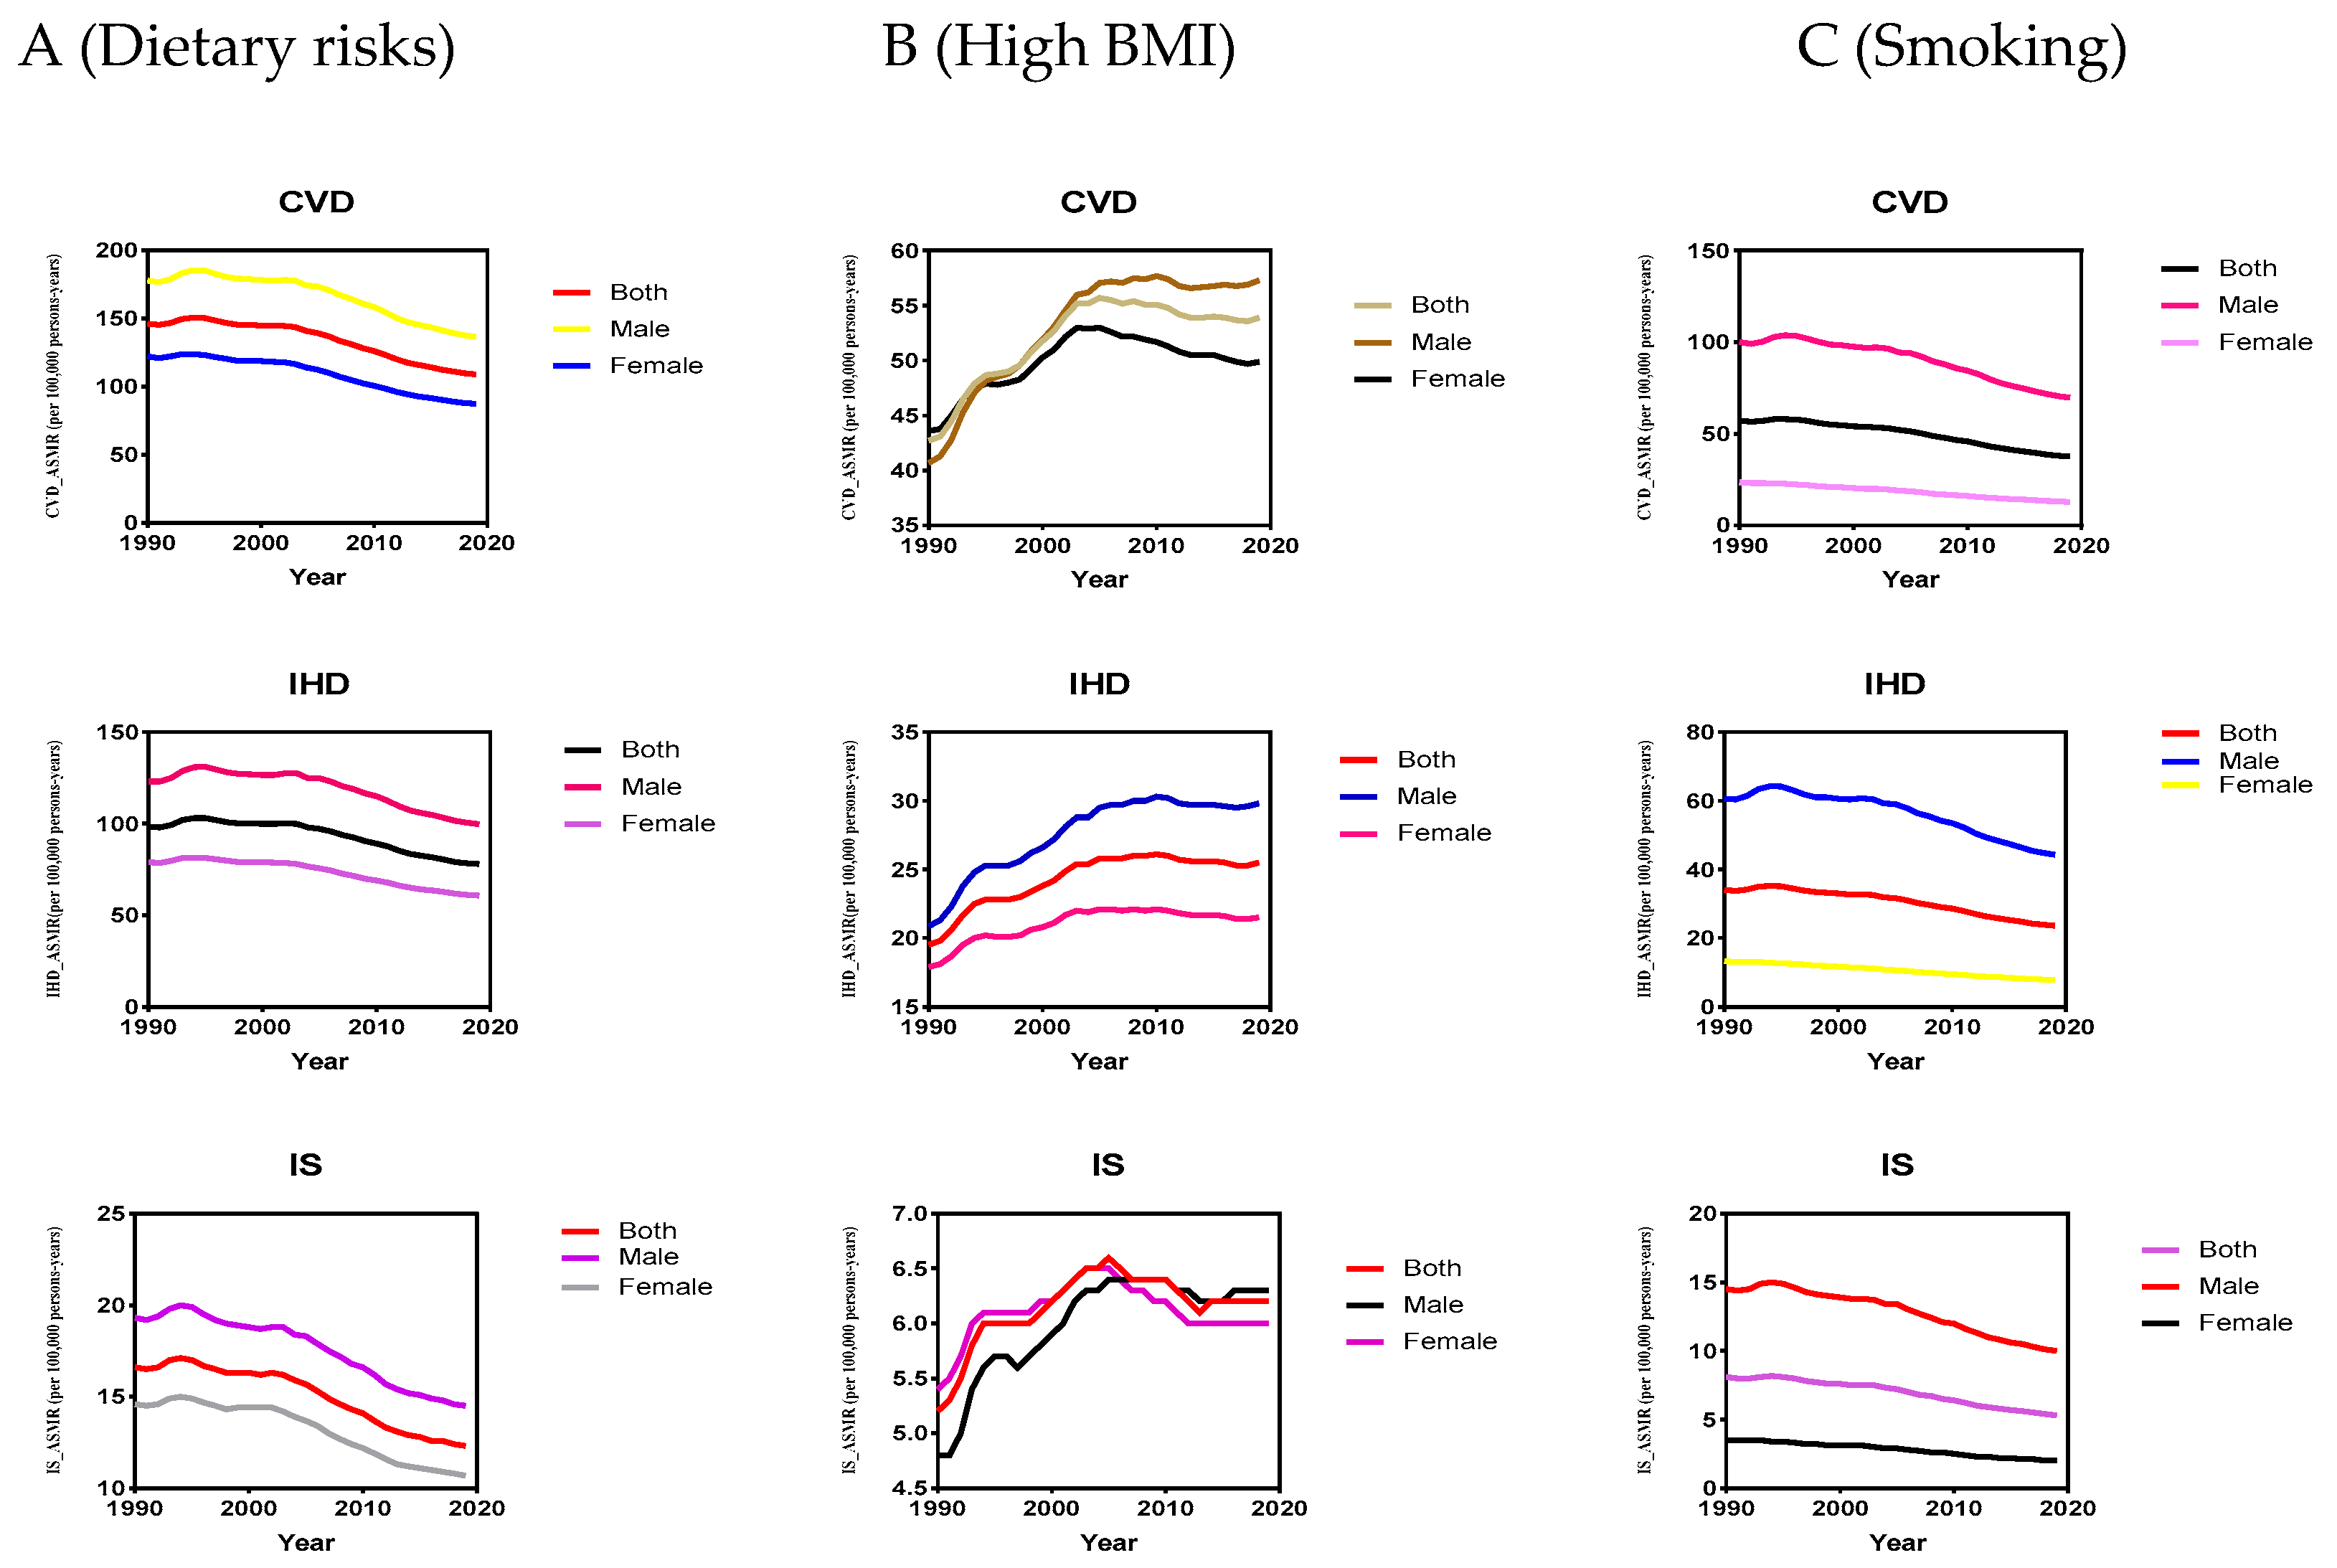
Figure 3.
The temporal trend of CVD_ASMR (age-standardized mortality rate) for both sexes attributable to dietary risks (A), high BMI (B), and smoking (C) across BRICS-Plus countries from 1990 to 2019.
Figure 3.
The temporal trend of CVD_ASMR (age-standardized mortality rate) for both sexes attributable to dietary risks (A), high BMI (B), and smoking (C) across BRICS-Plus countries from 1990 to 2019.
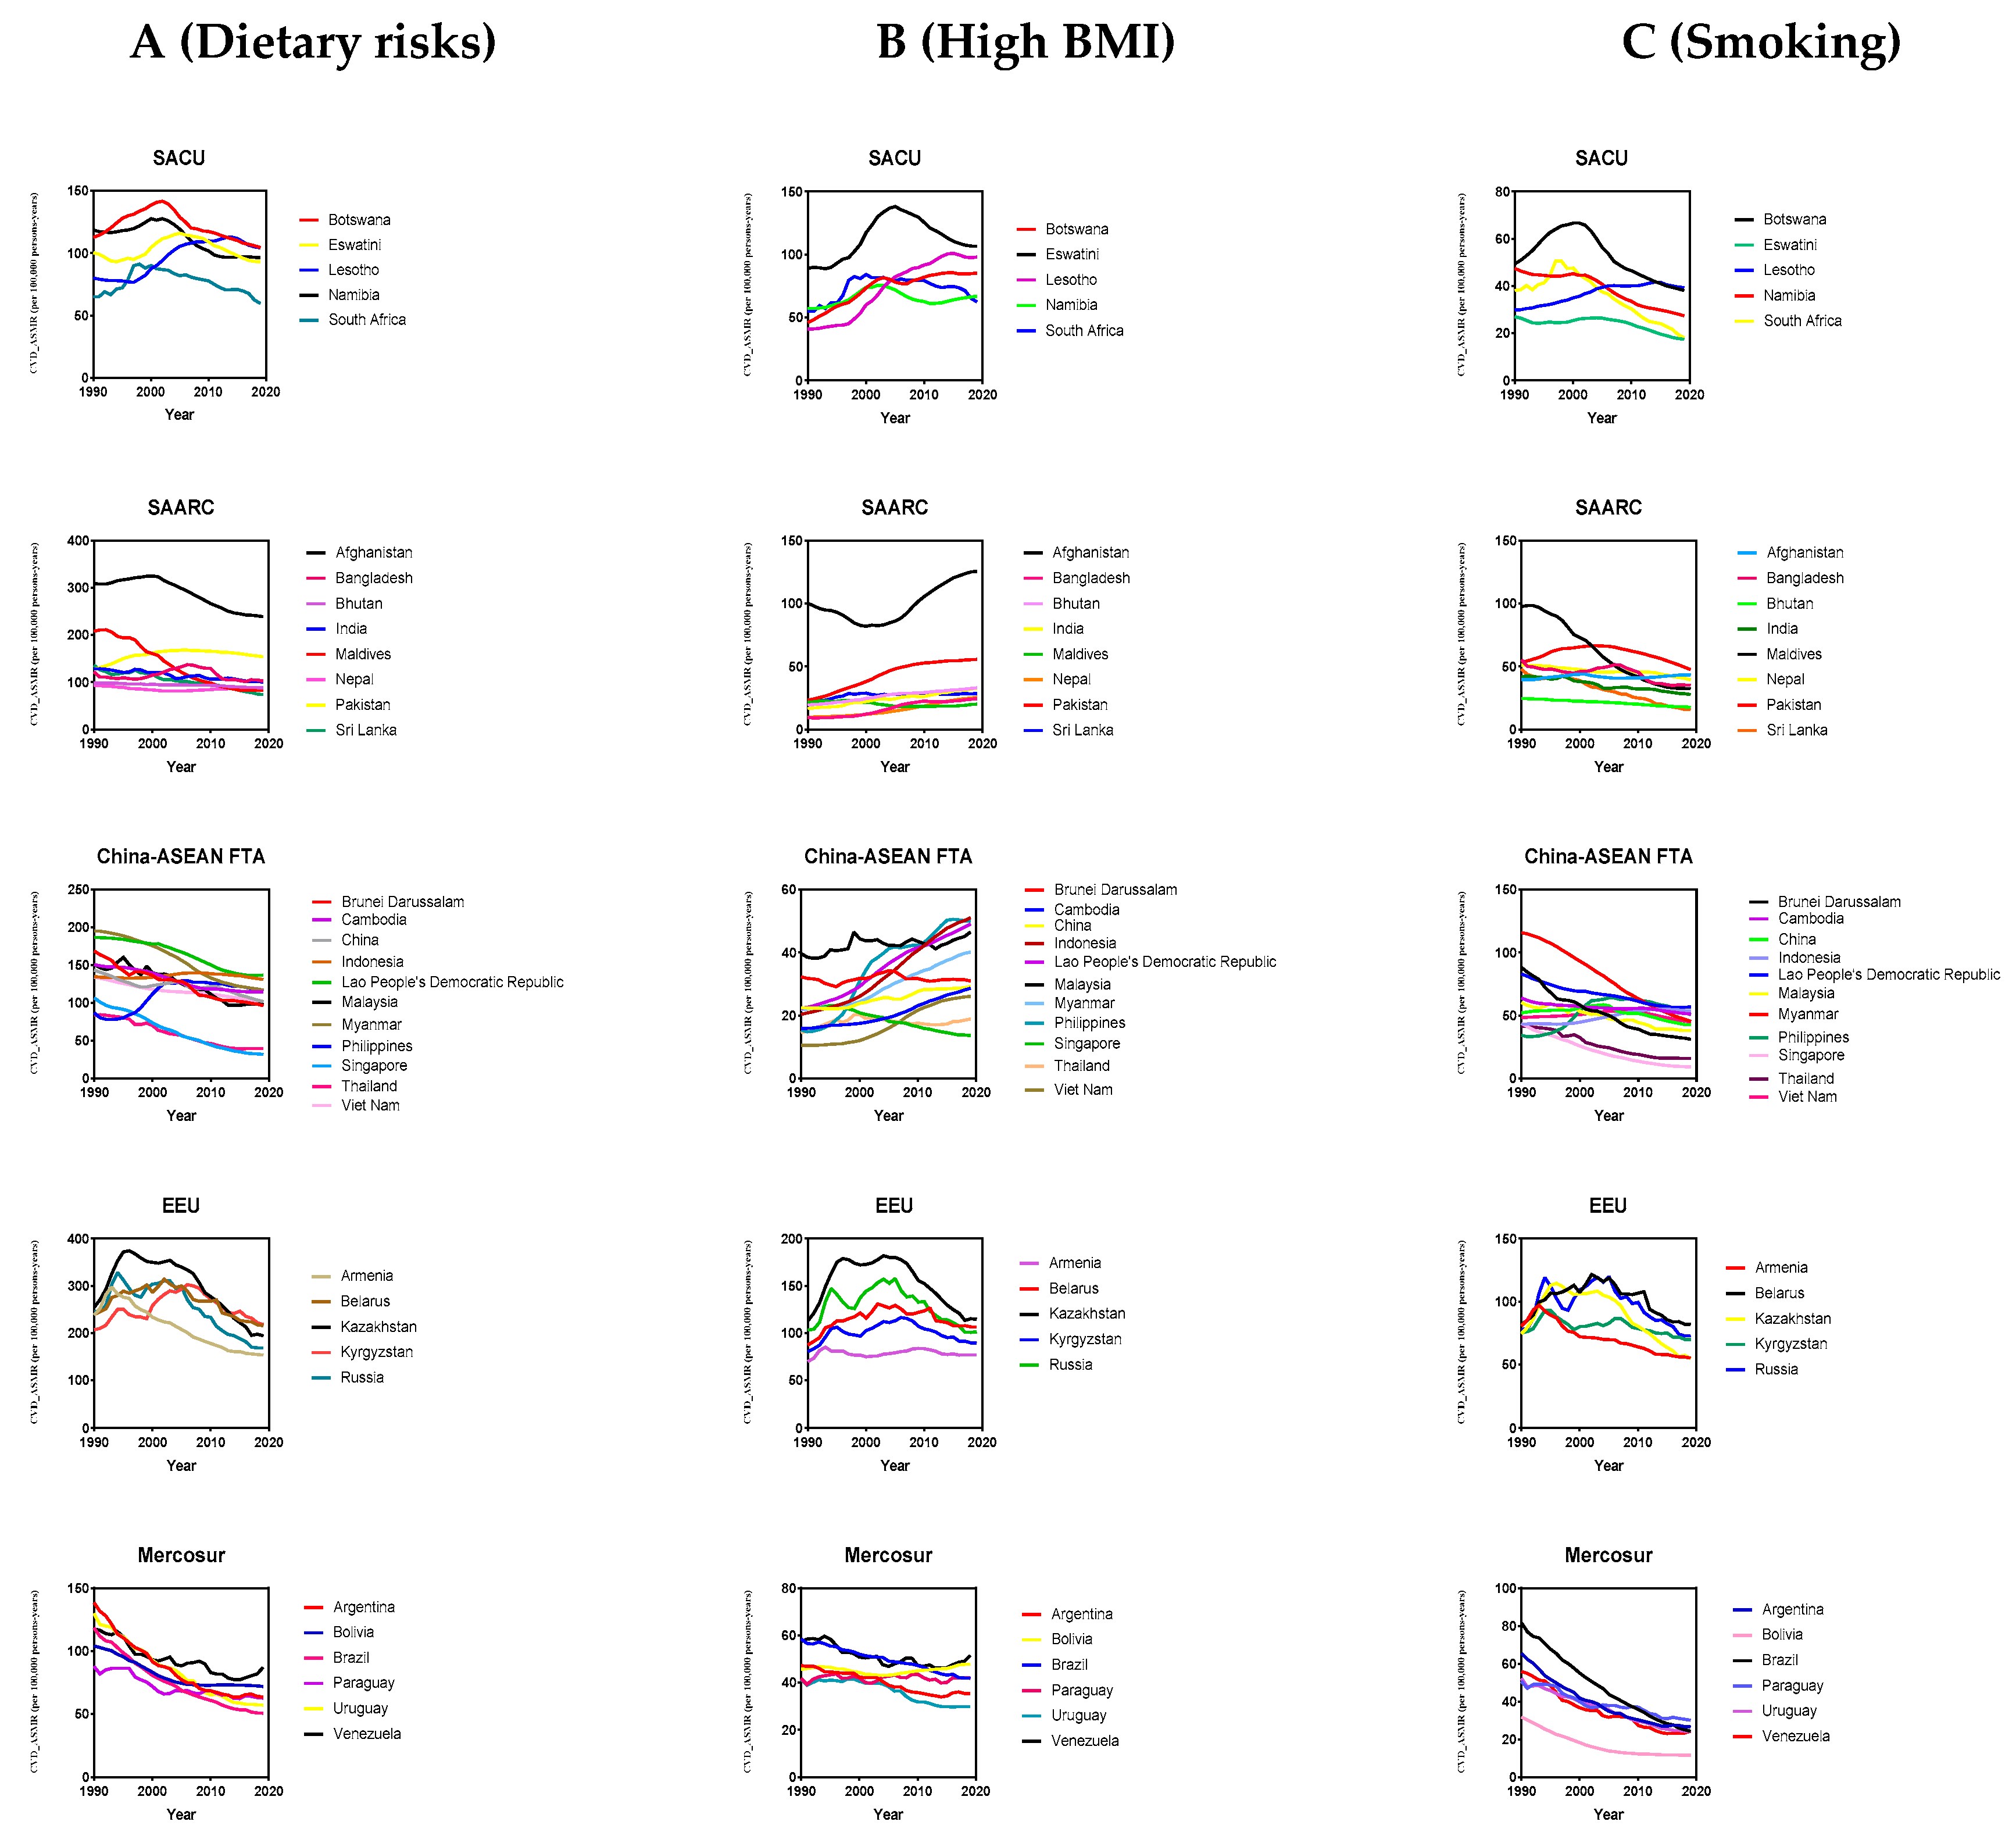
Figure 4.
Age-period-cohort effect on CVD mortality rate across BRICS-Plus regions.
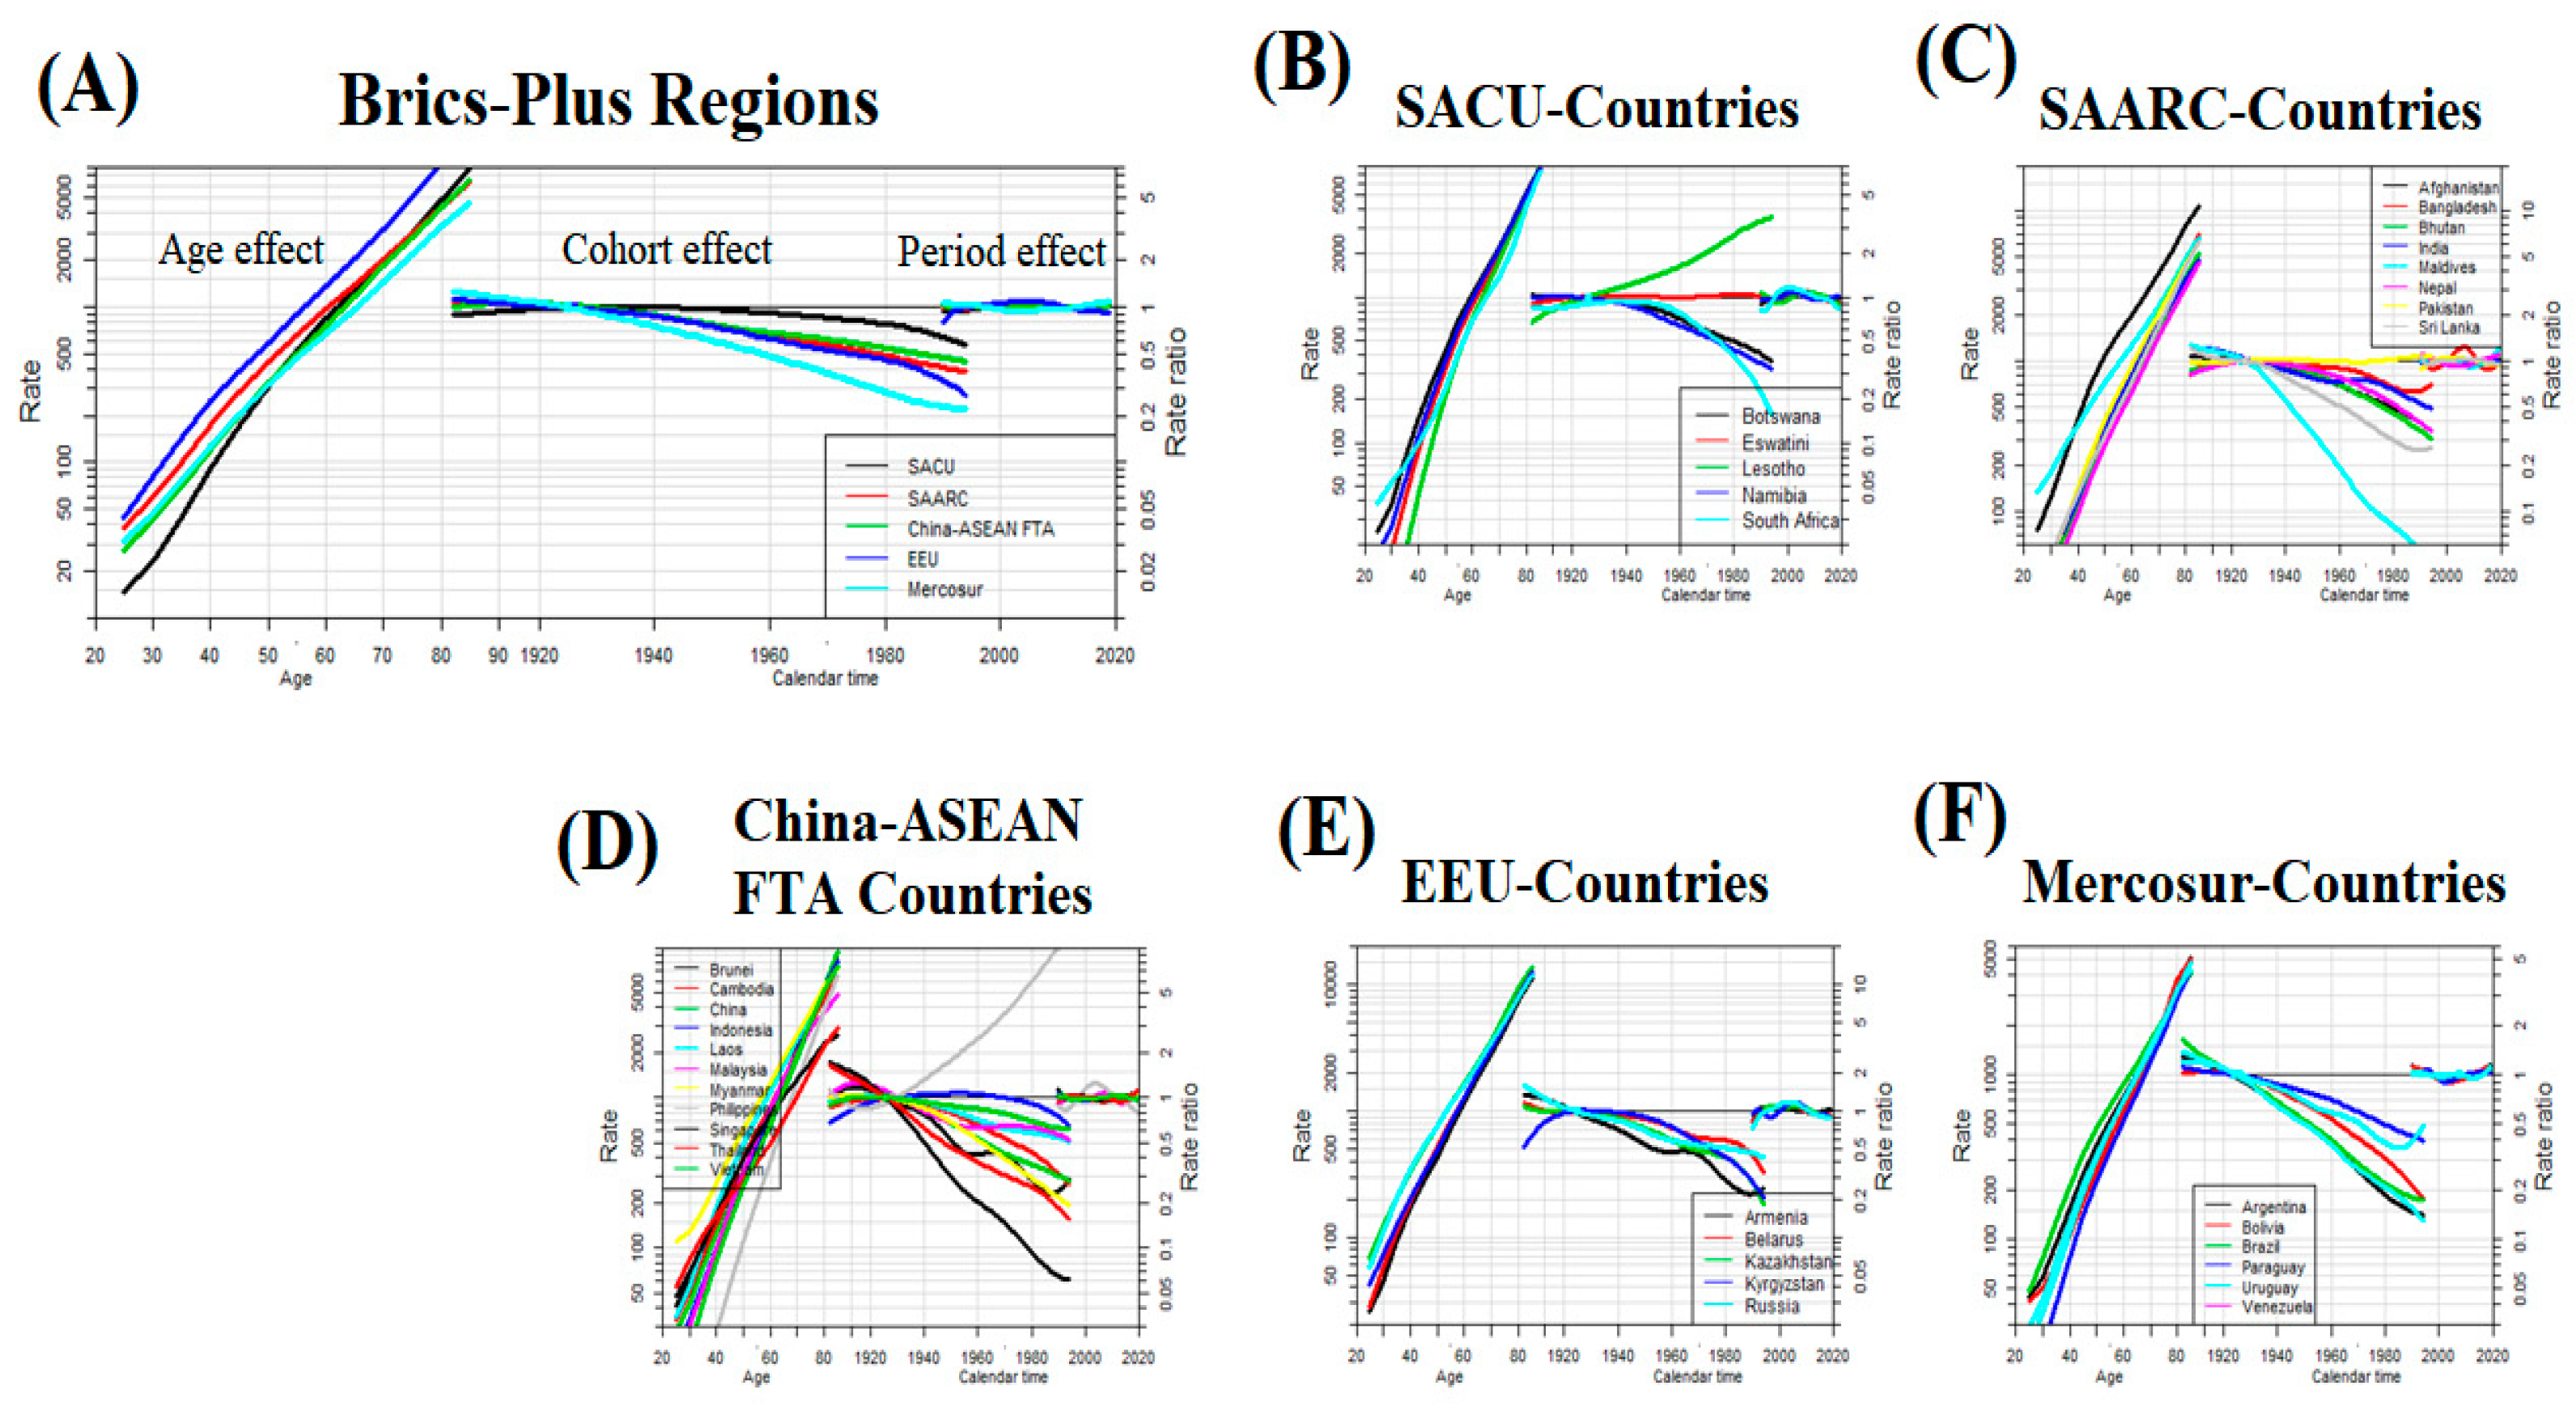
Figure 5.
Relationship between countries’ SDI and CVD ASMR from 1990-2019 across BRICS-Plus regions. Each colored line represents a time trend of the relationship for the specified BRICS-Plus countries. Each point represents a specific year for that country. The black line with 95% confidence band represents the average expected relationship between SDI and ASMR for CVD based on values from all countries from 1990 to 2019. SDI, social-demographic index; SDI ranges from 0 (less developed) to 1 (most developed).
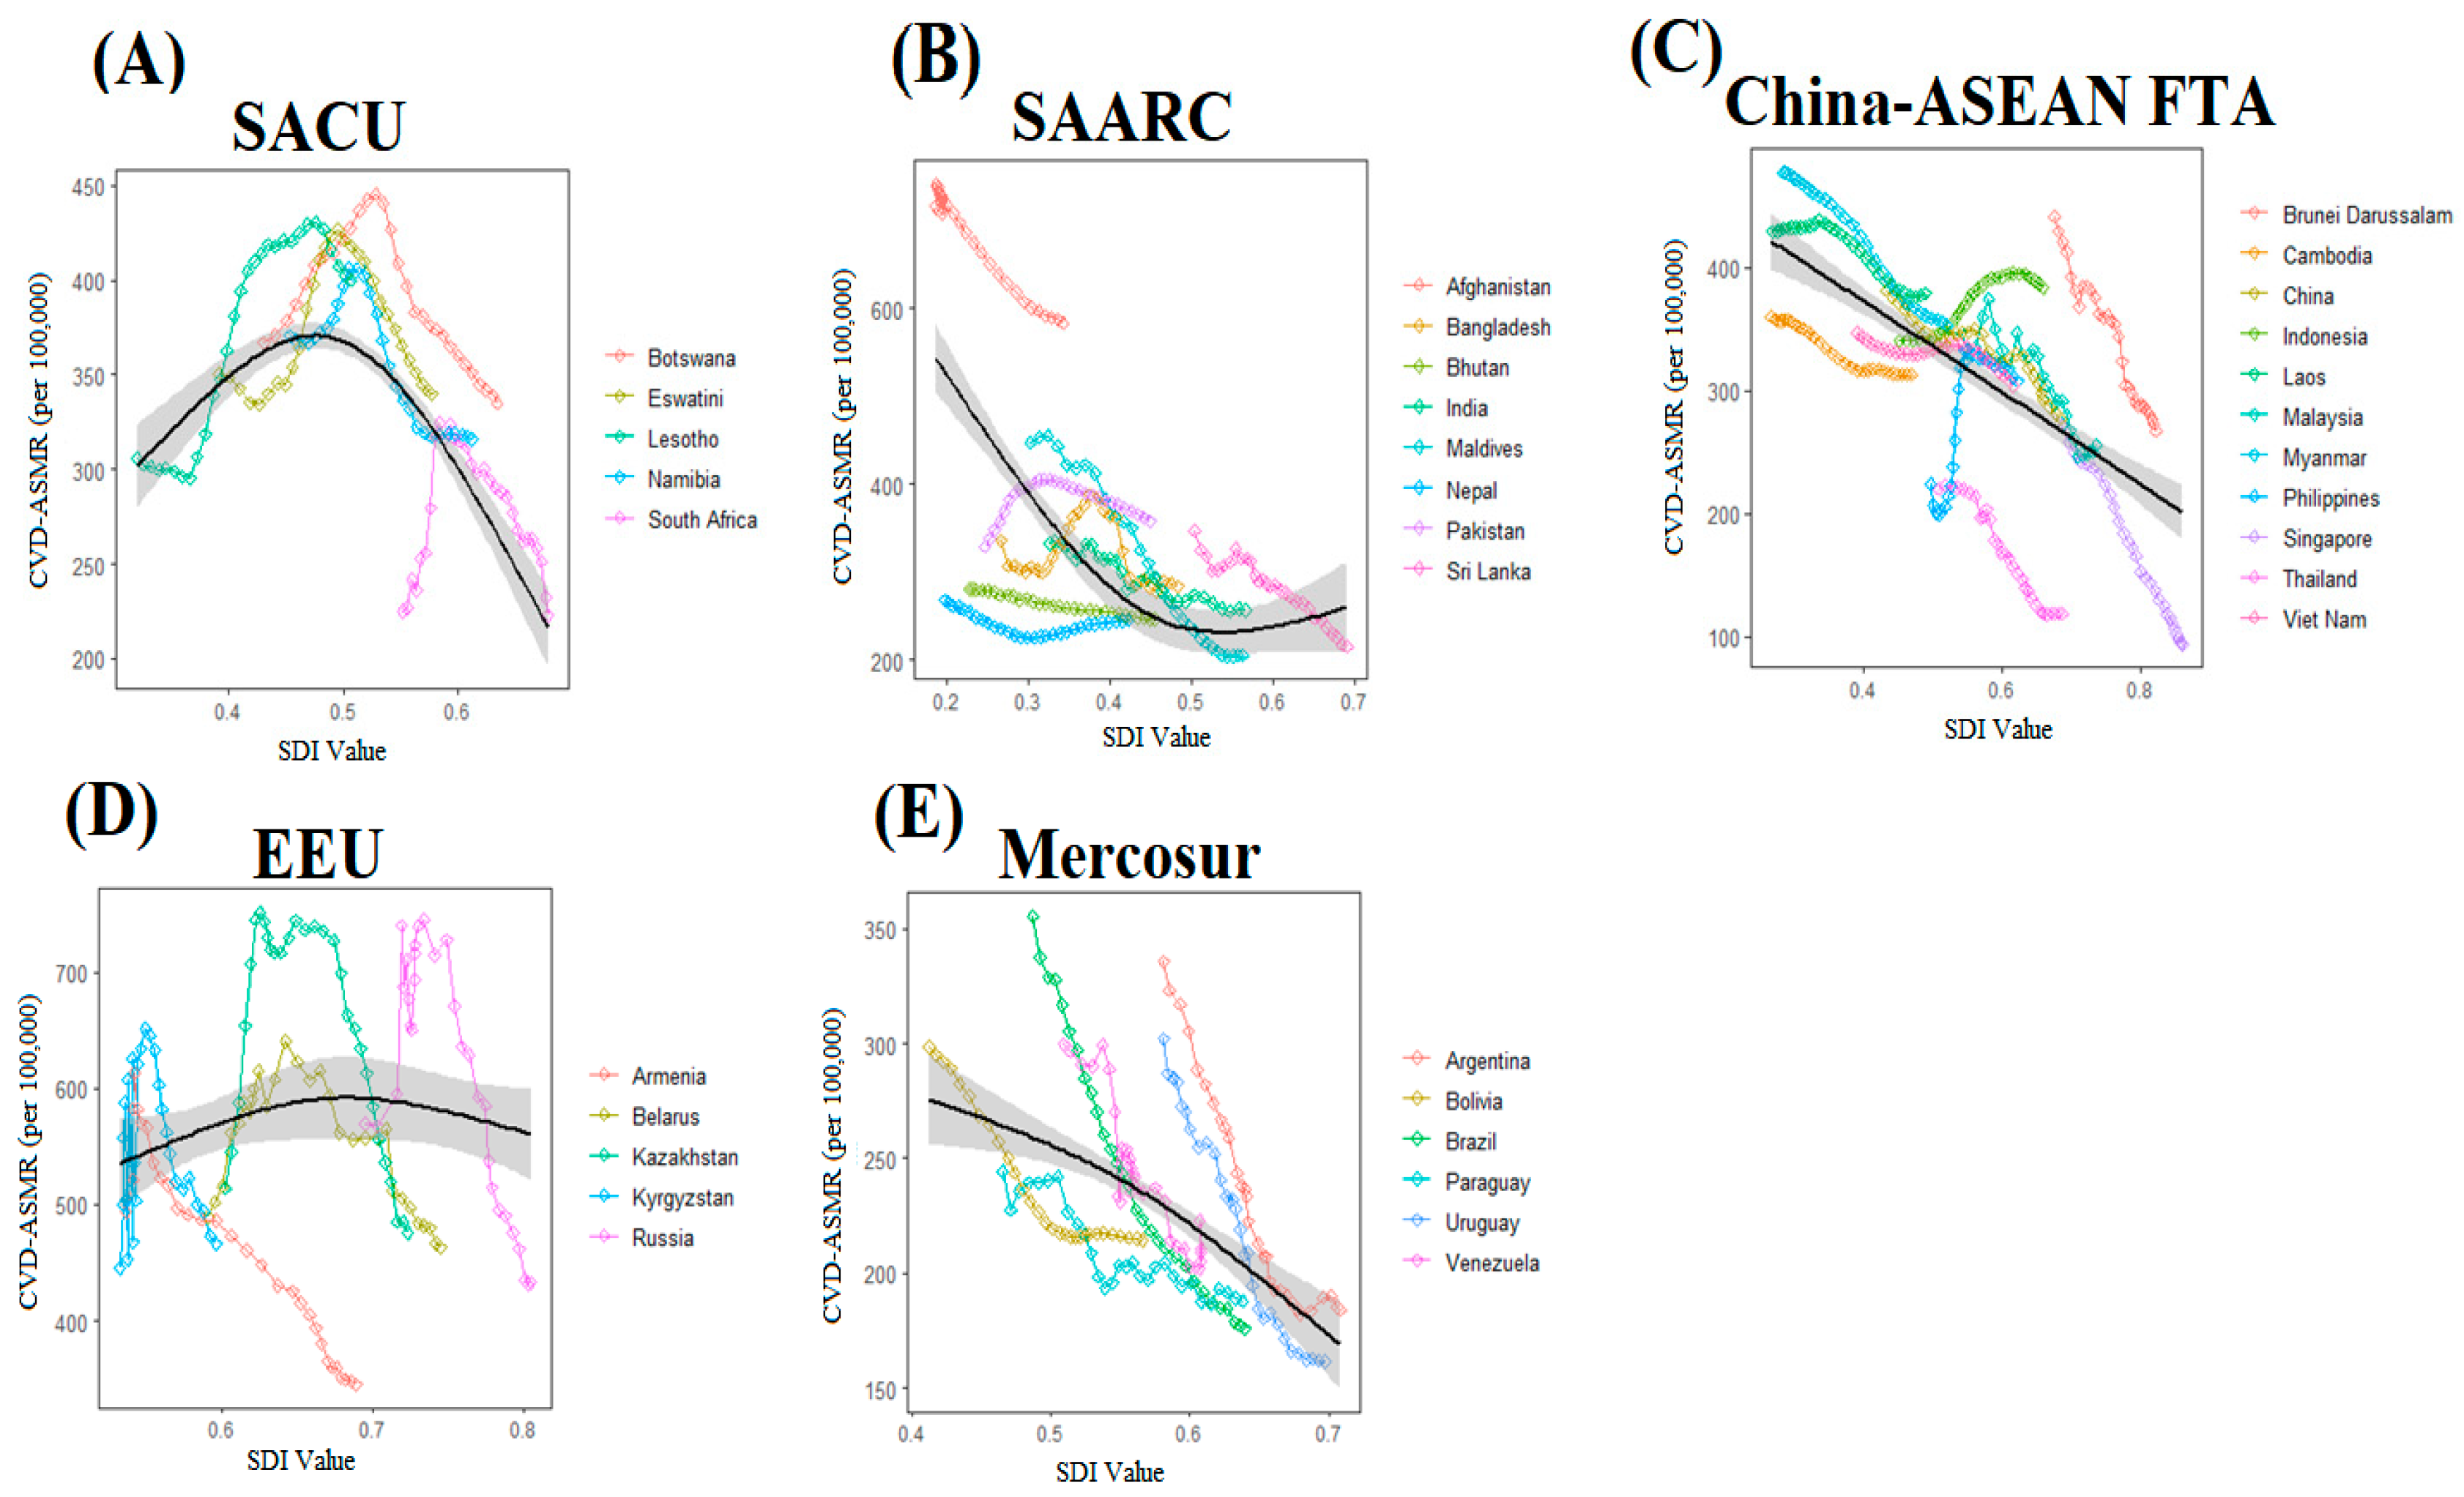

Table 1.
The average annual percent change in the burden of cause-specific CVD mortality for both sexes across BRICS-Plus from 1990 to 2019.
Table 1.
The average annual percent change in the burden of cause-specific CVD mortality for both sexes across BRICS-Plus from 1990 to 2019.
| CVD | ASMR/100,000 | Deaths, n×1000 | ||||
|---|---|---|---|---|---|---|
| 1990 (95%UI) | 2019 (95%UI) | AAPC (95%CI) | 1990 (95%UI) | 2019 (95%UI) | AAPC (95%CI) | |
| BRICS-Plus | 367 (407, 326) | 296 (346, 248) | -0.7 (-0.8, -0.6) | 6197 (6798, 5610) | 11310 (12896, 9704) |
2.1 (1.9, 2.3) |
| SACU | ||||||
| Botswana | 366 (448, 302) | 334 (425, 258) | -0.3 (-0.4, -0.2) | 1.6 (2.1, 1.3) | 3.5 (4.5, 2.6) | 2.6 (2.4, 2.7) |
| Eswatini | 350 (405, 293) | 339 (441, 258) | -0.1 (-0.4, 0.2) | 0.8 (0.9, 0.6) | 1.5 (2.1, 1.1) | 2.0 (1.8, 2.3) |
| Lesotho | 305 (354, 261) | 399 (497, 311) | 0.9 (0.8, 1.0) | 2.5 (2.9, 2.1) | 4.1 (5.1, 3.1) | 1.6 (1.4, 1.7) |
| Namibia | 370 (425, 313) | 316 (381, 263) | -0.5 (-0.7, -0.4) | 2.2 (2.5, 1.8) | 3.7 (4.5, 3.1) | 1.8 (1.6, 2.0) |
| South Africa | 225 (244, 202) | 222 (236, 203) | -0.1 (-0.6, 0.6) | 42 (46, 38) | 82 (87, 76) | 2.3 (1.7, 2.9) |
| SAARC | ||||||
| Afghanistan | 716 (829, 608) | 583 (681, 473) | -0.7 (-0.8, -0.6) | 44 (52, 37) | 61 (75, 49) | 1.1 (1.0, 1.2) |
| Bangladesh | 335 (374, 290) | 283 (341, 220) | -0.4 (-0.9, 0.1) | 138 (154, 119) | 324 (394, 250) | 3.2 (2.8, 3.7) |
| Bhutan | 280 (343, 220) | 246 (286, 198) | -0.5 (-0.5, -0.4) | 0.5 (0.7, 0.4) | 1.2 (1.4, 0.9) | 2.6 (2.5, 2.7) |
| India | 332 (371, 297) | 256 (292, 220) | -1.0 (-1.6, -0.3) | 1201 (1328, 1080) | 2574 (2940, 2215) |
2.7 (1.9, 3.4) |
| Maldives | 446 (481, 414) | 205 (239, 174) | -2.7 (-3.0, -2.4) | 0.3 (0.3, 0.2) | 0.5 (0.6, 0.4) | 1.6 (1.4, 1.9) |
| Nepal | 267 (332, 218) | 245 (286, 199) | -0.3 (-0.4, -0.2) | 21 (26, 17) | 46 (54, 37) | 2.7 (2.5, 2.8) |
| Pakistan | 329 (381, 279) | 357 (423, 307) | 0.3 (0.3, 0.4) | 172 (197, 147) | 341 (405, 291) | 2.4 (2.3, 2.4) |
| Sri Lanka | 346 (372, 318) | 215 (270, 163) | -1.6 (-2.0, -1.3) | 30 (32, 27) | 46 (59, 35) | 1.5 (1.2, 1.9) |
| China-ASEAN FTA | ||||||
| Brunei Darussalam | 441 (475, 404) | 266 (296, 240) | -1.7 (-2.2, -1.2) | 0.3 (0.3, 0.2) | 0.5 (0.5, 0.4) | 1.6 (1.4, 1.8) |
| Cambodia | 359 (412, 313) | 312 (349, 265) | -0.5 (-0.5, -0.4) | 13 (15, 12) | 30 (34, 25) | 2.7 (2.6, 2.8) |
| China | 381 (426, 341) | 276 (312, 239) | -1.1 (-1.4, -0.8) | 2423 (2712, 2165) | 4584 (5209, 3955) |
2.2 (1.9, 2.6) |
| Indonesia | 340 (375, 301) | 383 (418, 328) | 0.4 (0.4, 0.5) | 278 (304, 250) | 651 (721, 554) | 3.0 (2.9, 3.0) |
| Laos | 428 (517, 348) | 379 (440, 318) | -0.4 (-0.5, -0.4) | 7.5 (9.1, 6.1) | 13 (16, 11) | 2.0 (2.0, 2.1) |
| Malaysia | 347 (363, 326) | 255 (309, 207) | -1.0 (-1.7, -0.3) | 28 (29, 26) | 58 (71, 47) | 2.6 (1.7, 3.4) |
| Myanmar | 477 (570, 400) | 352 (401, 313) | -1.1 (-1.1, -1.0) | 96 (116, 79) | 138 (159, 120) | 1.2 (1.1, 1.3) |
| Philippines | 223 (246, 200) | 307 (356, 254) | 1.3 (0.8, 1.7) | 45 (53, 41) | 204 (241, 165) | 5.5 (5.1, 5.8) |
| Singapore | 271 (280, 254) | 93 (100, 81) | -3.6 (-3.9, -3.3) | 5.1 (5.2, 4.8) | 6.8 (7.3, 6.1) | 1.1 (0.9, 1.3) |
| Thailand | 219 (244, 196) | 118 (150, 90) | -2.1 (-2.5, -1.7) | 63 (71, 57) | 115 (147, 88) | 2.0 (1.7, 2.4) |
| Viet Nam | 346 (405, 293) | 303 (348, 258) | -0.4 (-0.5, -0.4) | 124 (145, 104) | 240 (278, 202) | 2.3 (2.3, 2.4) |
| EEU | ||||||
| Armenia | 493 (510, 462) | 345 (396, 295) | -1.3 (-1.7, -0.8) | 10.6 (10.9, 10.1) | 13 (15, 11) | 0.7 (0.3, 1.1) |
| Belarus | 489 (506, 459) | 463 (571, 381) | -0.2 (-0.7, 0.3) | 59 (61, 56) | 75 (92, 62) | 0.8 (0.3, 1.3) |
| Kazakhstan | 513 (534, 485) | 476 (531, 421) | -0.3 (-0.6, 0.1) | 56 (58, 53) | 65 (73, 57) | 0.4 (-0.1, 0.8) |
| Kyrgyzstan | 445 (470, 415) | 466 (517, 416) | 0.2 (-0.4, 0.8) | 12 (13, 12) | 17 (19, 15) | 1.1 (0.3, 1.8) |
| Russia | 569 (584, 540) | 432 (485, 378) | -1.0 (-2.0, 0.1) | 890 (908, 856) | 1004 (1126, 880) | 0.4 (-0.6, 1.4) |
| Mercosur | ||||||
| Argentina | 335 (347, 315) | 183 (194, 168) | -2.0 (-2.5, -1.5) | 98 (101, 93) | 101 (107, 93) | 0.1 (-0.4, 0.6) |
| Bolivia | 298 (354, 244) | 214 (265, 161) | -1.1 (-1.2, -1.0) | 8.2 (9.8, 6.6) | 15 (19, 11) | 2.3 (2.2, 2.3) |
| Brazil | 355 (367, 332) | 175 (184, 158) | -2.4 (-2.6, -2.2) | 269 (277, 257) | 397 (417, 361) | 1.4 (1.1, 1.6) |
| Paraguay | 244 (269, 211) | 187 (235, 147) | -0.8 (-1.4, -0.1) | 5.1 (5.5, 4.3) | 9.9 (12.4, 7.8) | 2.4 (1.8, 3.1) |
| Uruguay | 302 (313, 282) | 161 (170, 146) | -2.1 (-2.5, -1.7) | 11 (11, 10) | 10 (10, 8) | -0.4 (-0.8, -0.1) |
| Venezuela | 299 (312, 279) | 222 (279, 176) | -1.0 (-1.9, -0.1) | 25 (26, 24) | 61 (77, 48) | 3.0 (2.1, 3.9) |
Note: AAPC, average annual percent change; ASMR, age-standardized mortality rate; CVD, cardiovascular diseases; BRICS, Brazil, Russia, India, China, and South Africa; SACU, South African Customs Union; SAARC, South Asian Association for Regional Cooperation; China-ASEAN FTA, China-ASEAN Free Trade Area; and EEU, Eurasian Economic Union.
Table 2.
The average annual percent change in the burden of CVD mortality for both sexes attributable to modifiable risk factors across BRICS-Plus from 1990 to 2019. .
Table 2.
The average annual percent change in the burden of CVD mortality for both sexes attributable to modifiable risk factors across BRICS-Plus from 1990 to 2019. .
| Population | CVD (ASMR/100,000) | ||
|---|---|---|---|
| Dietary risks (AAPC (95%CI) | High BMI (AAPC (95%CI) | Smoking (AAPC (95%CI) | |
| BRICS-Plus | -1.0 (-1.1, -0.9) | 0.8 (0.7, 1.0) | -1.4 (-1.5, -1.3) |
| SACU | |||
| Botswana | -0.2 (-0.3, -0.1) | 2.1 (1.8, 2.5) | -0.9 (-1.0, -0.8) |
| Eswatini | -0.3 (-0.6, -0.1) | 0.6 (0.1, 1.1) | -1.6 (-1.8, -1.3) |
| Lesotho | 0.9 (0.8, 1.0) | 3.1 (2.9, 3.3) | 1.0 (0.8, 1.1) |
| Namibia | -0.7 (-0.8, -0.6) | 0.6 (0.4, 0.8) | -1.8 (-2.0, -1.7) |
| South Africa | -0.3 (-0.9, 0.4) | 0.4 (-0.2, 1.1) | -2.5 (-3.2, -1.8) |
| SAARC | |||
| Afghanistan | -0.9 (-0.9, -0.8) | 0.8 (0.5, 1.0) | 0.4 (0.3, 0.5) |
| Bangladesh | -0.4 (-0.9, 0.1) | 3.2 (2.8, 3.7) | -1.4 (-1.8, -1.0) |
| Bhutan | -0.4 (-0.5, -0.3) | 1.9 (1.8, 2.0) | -1.1 (-1.3, -1.0) |
| India | -0.8 (-1.6, -0.1) | 2.4 (2.0, 2.7) | -1.4 (-2.0, -0.8) |
| Maldives | -3.2 (-3.5, -2.9) | -0.3 (-0.5, -0.1) | -3.8 (-4.1, -3.5) |
| Nepal | -0.2 (-0.4, -0.1) | 3.4 (3.3, 3.5) | -0.9 (-1.0, -0.8) |
| Pakistan | 0.7 (0.6, 0.7) | 3.1 (2.9, 3.2) | -0.4 (-0.5, -0.3) |
| Sri Lanka | -2.1 (-2.5, -1.6) | 0.7 (0.3, 1.0) | -3.8 (-4.3, -3.3) |
| China-ASEAN FTA | |||
| Brunei Darussalam | -1.9 (-2.4, -1.5) | -0.1 (-0.3, 0.1) | -3.6 (-3.9, -3.3) |
| Cambodia | -0.9 (-1.0, -0.9) | 2.1 (2.0, 2.2) | -0.8 (-0.8, -0.7) |
| China | -1.2 (-1.5, -0.9) | 0.9 (0.4, 1.4) | -0.7 (-1.2, -0.3) |
| Indonesia | -0.1 (-0.2, -0.1) | 3.2 (3.2, 3.3) | 0.7 (0.7, 0.8) |
| Laos | -1.1 (-1.2, -1.0) | 2.8 (2.7, 2.9) | -1.3 (-1.4, -1.2) |
| Malaysia | -1.3 (-2.0, -0.7) | 0.6 (0.2, 1.0) | -1.5 (-2.2, -0.7) |
| Myanmar | -1.8 (-1.8, -1.7) | 2.2 (2.0, 2.3) | -3.2 (-3.3, -3.1) |
| Philippines | 1.1 (0.7, 1.6) | 4.3 (3.5, 5.1) | 1.5 (1.2, 1.8) |
| Singapore | -4.1 (-4.3, -3.8) | -1.6 (-1.9, -1.4) | -5.3 (-5.6, -5.0) |
| Thailand | -2.6 (-2.9, -2.2) | 0.9 (0.5, 1.3) | -3.4 (-4.2, -2.6) |
| Viet Nam | -1.0 (-1.0, -0.9) | 3.3 (3.1, 3.5) | -0.3 (-0.3, -0.2) |
| EEU | |||
| Armenia | -1.5 (-1.8, -1.2) | 0.3 (-0.1, 0.6) | -1.4 (-1.7, -1.0) |
| Belarus | -0.3 (-0.9, 0.3) | 0.6 (0.1, 1.2) | -0.1 (-1.2, 1.0) |
| Kazakhstan | -0.9 (-1.2, -0.6) | 0.1 (-0.3, 0.4) | -1.0 (-1.4, -0.5) |
| Kyrgyzstan | 0.3 (-0.4, 0.9) | 0.3 (-0.3, 0.9) | -0.2 (-0.7, 0.2) |
| Russia | -1.3 (-2.4, -0.2) | 0.1 (-1.0, 1.0) | -0.1 (-1.2, 1.1) |
| Mercosur | |||
| Argentina | -2.6 (-2.9, -2.3) | -0.9 (-1.4, -0.5) | -3.0 (-3.3, -2.8) |
| Bolivia | -1.2 (-1.4, -1.1) | 0.2 (0.1, 0.3) | -3.4 (-3.5, -3.3) |
| Brazil | -2.9 (-3.1, -2.7) | -1.1 (-1.4, -0.8) | -4.1 (-4.3, -3.8) |
| Paraguay | -1.1 (-1.8, -0.4) | 0.1 (-0.8, 0.9) | -1.7 (-2.4, -1.1) |
| Uruguay | -2.8 (-3.2, -2.3) | -1.0 (-1.4, -0.7) | -2.6 (-3.1, -2.0) |
| Venezuela | -1.2 (-1.7, -0.6) | -0.4 (-1.0, 0.1) | -3.0 (-3.6, -2.4) |
Note: AAPC, average annual percent change; ASMR, age-standardized mortality rate; CVD, cardiovascular diseases; BRICS, Brazil, Russia, India, China, and South Africa; SACU, South African Customs Union; SAARC, South Asian Association for Regional Cooperation; China-ASEAN FTA, China-ASEAN Free Trade Area; and EEU, Eurasian Economic Union.
Table 3.
The average annual percent change in the burden of CVD ASMR attributable to modifiable risk factors in males and females across BRICS-Plus from 1990 to 2019.
Table 3.
The average annual percent change in the burden of CVD ASMR attributable to modifiable risk factors in males and females across BRICS-Plus from 1990 to 2019.
| Population | Male (AAPC (95%CI) | Female (AAPC (95%CI) | ||||
|---|---|---|---|---|---|---|
| Dietary risks | High BMI | Smoking | Dietary risks | High BMI | Smoking | |
| BRICS-Plus | -0.9 (-1.0, -0.8) | 1.2 (1.0,1.4) | -1.2 (-1.4, -1.1) | -1.1 (-1.2, -1.0) | 0.5 (0.3, 0.6) | -2.1 (-2.2, -2.0) |
| SACU | ||||||
| Botswana | -0.2 (-0.4, 0.1) | 3.2 (2.9, 3.5) | -0.7 (-1.0, -0.5) | -0.2 (-0.8, 0.3) | 1.6 (0.8, 2.6) | -1.1 (-1.9, -0.2) |
| Eswatini | -0.2 (-0.4, -0.1) | 1.3 (0.9, 1.7) | -1.5 (-1.6, -1.3) | -0.4 (-0.7, -0.1) | -0.1 (-0.5, 0.4) | -1.4 (-1.6, -1.2) |
| Lesotho | 0.7 (0.6, 0.8) | 3.7 (3.4, 4.1) | 1.1 (0.8, 1.3) | 1.0 (0.8, 1.3) | 2.6 (2.3, 2.9) | 1.0 (0.7, 1.3) |
| Namibia | -0.4 (-0.5, -0.2) | 1.4 (1.2, 1.6) | -1.6 (-1.7, -1.4) | -1.0 (-1.1, -0.8) | 0.1 (-0.2, 0.2) | -2.1 (-2.3, -1.9) |
| South Africa | -0.3 (-0.8, 0.1) | 1.1 (0.5, 1.6) | -2.2 (-2.8, -1.5) | -0.3 (-1.0, 0.4) | 0.1 (-0.7, 0.8) | -3.1 (-3.9, -2.3) |
| SAARC | ||||||
| Afghanistan | -1.0 (-1.1, -0.9) | 1.1 (0.9, 1.3) | 0.4 (0.3, 0.5) | -0.7 (-0.8, -0.6) | 0.5 (0.2, 0.8) | 0.8 (0.6, 1.0) |
| Bangladesh | -0.2 (-0.7, 0.3) | 3.9 (3.5, 4.3) | -1.2 (-1.6, -0.7) | -0.7 (-1.4, -0.1) | 2.8 (2.4, 3.3) | -1.9 (-2.4, -1.5) |
| Bhutan | -0.2 (-0.3, -0.1) | 2.5 (2.4, 2.7) | -1.1 (-1.2, -1.0) | -0.7 (-0.8, -0.7) | 1.4 (1.3, 1.5) | -1.8 (-2.0, -1.7) |
| India | -0.7 (-1.4, -0.1) | 2.6 (2.1, 3.0) | -1.3 (-1.9, -0.6) | -0.8 (-1.7, 0.1) | 2.1 (1.7, 2.5) | -1.0 (-1.7, -0.3) |
| Maldives | -2.8 (-3.1, -2.6) | 0.4 (0.2, 0.6) | -3.4 (-3.6, -3.1) | -3.7 (-4.3, -3.0) | -1.3 (-2.0, -0.6) | -5.2 (-6.0, -4.3) |
| Nepal | 0.3 (0.2, 0.4) | 4.2 (4.1, 4.3) | -0.3 (-0.5, -0.2) | -1.0 (-1.1, -0.9) | 2.6 (2.4, 2.7) | -1.7 (-1.8, -1.7) |
| Pakistan | 1.0 (0.9, 1.1) | 3.5 (3.4, 3.7) | -0.1 (-0.2, 0.1) | 0.3 (0.3, 0.4) | 2.6 (2.4, 2.7) | -0.9 (-1.0, -0.8) |
| Sri Lanka | -2.0 (-2.5, -1.5) | 0.6 (0.1, 1.1) | -3.4 (-3.9, -2.8) | -1.8 (-2.4, -1.1) | 0.7 (0.3, 1.1) | -3.9 (-4.5, -3.3) |
| China-ASEAN FTA | ||||||
| Brunei Darussalam | -1.7 (-2.6, -0.8) | 0.2 (-0.5, 0.8) | -3.4 (-4.1, -2.6) | -1.9 (-2.3, -1.4) | -0.3 (-0.6, -0.1) | -3.8 (-4.1, -3.6) |
| Cambodia | -0.7 (-0.8, -0.7) | 2.8 (2.7, 3.0) | -0.5 (-0.6, -0.5) | -1.1 (-1.2, -1.1) | 1.5 (1.4, 1.7) | -1.0 (-1.1, -1.0) |
| China | -0.8 (-1.1, -0.5) | 1.5 (1.3, 1.7) | -0.7 (-1.0, -0.5) | -1.7 (-1.9, -1.4) | 0.2 (-0.1, 0.5) | -0.6 (-1.0, -0.2) |
| Indonesia | 0.2 (0.1, 0.2) | 3.6 (3.5, 3.7) | 0.8 (0.7, 0.9) | -0.4 (-0.5, -0.4) | 2.9 (2.8, 3.1) | 0.7 (0.5, 0.8) |
| Laos | -1.1 (-1.2, -1.1) | 3.2 (3.1, 3.4) | -1.3 (-1.3, -1.2) | -1.1 (-1.2, -1.0) | 2.4 (2.3, 2.5) | -1.9 (-2.0, -1.8) |
| Malaysia | -1.2 (-2.1, -0.3) | 1.0 (0.6, 1.5) | -1.5 (-2.3, -0.7) | -1.5 (-2.2, -0.9) | 0.1 (-0.5, 0.5) | -2.3 (-3.1, -1.5) |
| Myanmar | -1.5 (-1.6, -1.4) | 2.3 (2.2, 2.5) | -2.6 (-2.7, -2.5) | -2.0 (-2.0, -1.9) | 1.9 (1.8, 2.1) | -4.1 (-4.2, -4.0) |
| Philippines | 1.5 (1.2, 1.7) | 4.5 (3.4, 5.6) | 1.8 (1.5, 2.1) | 0.7 (0.2, 1.1) | 4.0 (3.4, 4.7) | 0.9 (0.5, 1.3) |
| Singapore | -3.9 (-4.3, -3.6) | -1.3 (-1.5, -1.1) | -5.3 (-5.5, -5.0) | -4.4 (-4.7, -4.0) | -2.2 (-2.6, -1.8) | -6.2 (-6.5, -5.9) |
| Thailand | -2.5 (-3.3, -1.7) | 1.4 (0.9, 1.9) | -3.2 (-4.0, -2.4) | -2.8 (-3.1, -2.5) | 0.3 (-0.1, 0.5) | -5.1 (-5.4, -4.7) |
| Viet Nam | -0.6 (-0.7, -0.6) | 4.1 (3.8, 4.3) | -0.2 (-0.3, -0.2) | -1.5 (-1.5, -1.4) | 2.3 (2.2, 2.4) | -1.3 (-1.4, -1.2) |
| EEU | ||||||
| Armenia | -1.3 (-1.7, -1.0) | 1.1 (0.8, 1.3) | -1.4 (-1.9, -0.9) | -1.7 (-2.0, -1.4) | -0.3 (-0.8, 0.1) | -2.5 (-2.9, -2.1) |
| Belarus | -0.1 (-0.5, 0.4) | 1.4 (0.7, 2.0) | -0.1 (-0.7, 0.6) | -0.6 (-1.1, -0.2) | 0.1 (-0.3, 0.6) | -0.7 (-1.3, -0.1) |
| Kazakhstan | -1.0 (-1.3, -0.6) | 0.4 (-0.1, 0.8) | -1.1 (-1.6, -0.7) | -0.9 (-1.2, -0.6) | -0.2 (-0.5, 0.1) | -1.2 (-1.6, -0.8) |
| Kyrgyzstan | 0.1 (-0.7, 0.8) | 0.7 (0.2, 1.1) | -0.4 (-0.9, 0.1) | 0.3 (-0.3, 0.9) | 0.1 (-0.6, 0.7) | -0.3 (-0.9, 0.3) |
| Russia | -1.4 (-2.4, -0.3) | 0.4 (-0.7, 1.5) | -0.6 (-1.7, 0.6) | -1.5 (-2.6, -0.4) | -0.4 (-1.4, 0.6) | 0.4 (-0.6, 1.4) |
| Mercosur | ||||||
| Argentina | -2.6 (-2.9, -2.3) | -1.0 (-1.4, -0.6) | -3.1 (-3.4, -2.8) | -2.6 (-3.0, -2.3) | -0.9 (-1.3, -0.6) | -2.9 (-3.2, -2.7) |
| Bolivia | -1.4 (-1.5, -1.2) | 0.4 (0.3, 0.5) | -3.4 (-3.6, -3.3) | -1.2 (-1.4, -1.0) | -0.1 (-0.1, 0.1) | -3.8 (-4.0, -3.7) |
| Brazil | -2.7 (-2.9, -2.5) | -0.9 (-1.1, -0.7) | -3.9 (-4.2, -3.6) | -3.0 (-3.2, -2.8) | -1.4 (-1.7, -1.1) | -4.2 (-4.5, -3.9) |
| Paraguay | -0.7 (-1.4, 0.1) | 0.6 (-0.3, 1.5) | -1.4 (-2.1, -0.8) | -1.5 (-2.2, -0.8) | -0.5 (-1.3, 0.3) | -2.4 (-3.0, -1.7) |
| Uruguay | -2.6 (-3.2, -2.0) | -1.0 (-1.4, -0.6) | -2.6 (-2.9, -2.2) | -2.9 (-3.3, -2.4) | -1.1 (-1.5, -0.7) | -2.4 (-2.7, -2.1) |
| Venezuela | -0.9 (-1.7, -0.1) | -0.1 (-1.3, 1.1) | -2.7 (-3.5, -2.0) | -1.6 (-2.0, -1.2) | -0.9 (-1.4, -0.5) | -3.4 (-3.8, -3.0) |
Note: AAPC, average annual percent change; ASMR, age-standardized mortality rate; CVD, cardiovascular diseases; BRICS, Brazil, Russia, India, China, and South Africa; SACU, South African Customs Union; SAARC, South Asian Association for Regional Cooperation; China-ASEAN FTA, China-ASEAN Free Trade Area; and EEU, Eurasian Economic Union.
Disclaimer/Publisher’s Note: The statements, opinions and data contained in all publications are solely those of the individual author(s) and contributor(s) and not of MDPI and/or the editor(s). MDPI and/or the editor(s) disclaim responsibility for any injury to people or property resulting from any ideas, methods, instructions or products referred to in the content. |
© 2023 by the authors. Licensee MDPI, Basel, Switzerland. This article is an open access article distributed under the terms and conditions of the Creative Commons Attribution (CC BY) license (https://creativecommons.org/licenses/by/4.0/).
Copyright: This open access article is published under a Creative Commons CC BY 4.0 license, which permit the free download, distribution, and reuse, provided that the author and preprint are cited in any reuse.


