1. Introduction
Structure; It is a product that has come together with the sub-systems that make it up. The emergence of the structure takes place by building (making). Together with the subsystems that make up the structure, it has a share of 13% of the world economy. The world construction sector economy reached the level of 11 trillion dollars in 2020 [
1]. In Turkey, although the budget of the construction sector is around 200 billion dollars, the share of the construction sector in the Gross National Product (GNP) is around 5%; Together with the 250 sub-sectors it is associated with, it constitutes 35% of the GNP [
2]. Undoubtedly, the largest share of the construction sector in this economic size is residences. Houses are buildings built to shelter, sleep, and provide privacy, and their history is parallel to the history of humanity. Houses that meet the minimum shelter and protection needs in the early days of history have started to have an important share in non-renewable energy consumption in light of the invention of electricity and developments in electronics and informatics in recent centuries [
3,
4,
5,
6]. Energy consumption has reached its peak, with the tools and equipment for lighting, heating, cooling, electrical appliances, electronic appliances, smart systems, etc. So; The energy use of the global construction sector is at the level of 35% of the total energy consumption [
3,
4,
5,
6,
7]. Global warming, rapid consumption and reduction of non-renewable energy resources, drying of dams, droughts, etc. balance changes also cause the search for effective, efficient, and sustainable use of energy in the construction sector [
8]. These requirements have led to a century in which new materials and new systems have emerged in the sector, intensive R&D activities both in Turkey and in the world, and solution alternatives have been discussed intensively [
9]. Now both the world and Turkey agree on the production of high-performance, environmentally friendly, sustainable, and energy-efficient buildings. Therefore, green building certification systems have been developed in the last 20 years by many organizations and organizations to implement and disseminate sustainable architectural measures in construction projects, to evaluate and monitor building performance, and to gather information to support designer decision-making at different stages of the project [
10,
11]. Green building certification systems are a kind of rating system that reveals the effects of projects on the environment and scores according to various criteria to protect the environment [
12] Some of these systems were developed for use all over the world, while others were developed or adapted to suit the environmental, economic and socio-cultural characteristics of a particular region [
10]. certification systems such as SBTOOL, HK-BEAM, CEPAS, SBAT, GREEN STAR, and CASBEE, apart from BREEAM emerged in the UK, and LEED emerged in the USA, which is popularly used in the world [
13] Certification systems aim to define and promote sustainable green architecture by creating common standards and developing methods [
14]. In our country, there are some legal regulations such as "Energy Efficiency Law", "Energy Performance Regulation in Buildings" and "Energy Identity Certificate" that can initiate and evaluate the design of buildings with sustainable architectural principles, but still, there is no national green building certificate in Turkey yet. no system [
15]. It is extremely important that this new understanding and production model be applied in the existing building stock as well as in the new buildings. Because newly constructed buildings (especially residences) are at a very low level compared to the existing stock. For this reason, reducing the energy consumption of existing housing stocks with optimum solutions and renewals, even making them sustainable, is of great importance in reducing the energy share on a global and national scale.
The construction industry does not have a laboratory. The only environment in which the construction and the result of the construction are tested is the situation in which the product is physically revealed, which is also irreversible. At this point of insolvency, the "Building Information Modeling" technology, which has been offered to the construction industry through technological developments in recent years, offers us the opportunity to test and analyze in a virtual environment without making the building [
16]. In a sense, it is the digital expression of both the physical and functional properties of the building, both during the construction phase and in its life cycle [
17]. With the cooperation of smart object-based parametric models that can be made with BIM and add-on software tools that can be used with this software, it is possible to make smart models of existing building stocks, make energy performance analyses and establish different scenarios with alternative suggestions [
17,
18] In an advanced stage, it is possible to compare the alternative scenarios created with the existing structure and to evaluate the positive and negative results [
19,
20]
In this research, the usability of existing housing stocks to improve energy performance with the help of BIM technology and add-on software has been investigated and the most appropriate solutions have been revealed. A sample residential building was selected for the study and the current parameters and location data of the house were modeled with the BIM software Revit. The current state of the created model was analyzed with the Green Building Studio (GBS) plug-in software. After the current situation analysis, 192 alternative scenarios were created with 6 variable parameters, energy analyzes were made separately according to each scenario created and comparisons were made. Obtained results; Results were obtained according to annual energy and fuel consumption, annual and lifetime costs, energy use intensities, and carbon emission values. To examine the feasibility of these models under real conditions and conditions, the construction costs were calculated and the amortization periods were determined. While conducting this research, the parameters of the structural and structural features of the existing housing stock, its performance against natural disasters, and whether the building meets the usage needs under current conditions were excluded from the scope.
2. Literature Review
In a study conducted on a three-story residence, the effect of building orientation on energy consumption was investigated with Revit and GBS software, and it was concluded that the correct building orientation provides substantial energy savings in the building life cycle [
21].
Abhinaya et al. After modeling and analyzing the current situation of the two-story house with Revit, it compared it with the existing building by using green material alternatives in its walls, roof, floor, and windows, and observed that its energy performance increased significantly. With this observation, he emphasized the importance of BIM tools in predicting and making decisions and preventing possible errors [
22].
Ahsan et al. investigated the effect of passive cooling on annual energy consumption in an existing university building with Autodesk Ecotect software. Comparisons were made with parameters such as suitable thermal insulation techniques, lighting selection, façade transparency ratio, and selection of alternatives of glass materials. As a result, they concluded that the 38-month energy consumption of the building could be reduced by 35% [
23].
Kim et al. To investigate the effect of the location and size of the windows in the buildings and the direction of the building on the total energy consumption of the building, he researched a two-story residence. With the help of Revit and GBS software, 65 different scenarios were developed over alternative parameters and it was revealed that the facade transparency rate and energy consumption are directly proportional, and the energy consumption of the building is minimized when the windows are located at mid-height in all directions [
24].
Lim et al. investigated two sample buildings in the eastern province of Saudi Arabia as a techno-economic solution research for the renewal of existing housing stocks. In the study, they proposed a 3-stage energy improvement plan with 8 different parameters. With the proposed plans, they concluded that the annual energy consumption in the villa type residence decreased by 13.79%, 19.27% , and 56.9%, respectively, according to the 1st, 2nd, and 3rd energy improvement levels, and 22.84%, 28.85 and 58.5% in the apartment type residence [
25].
Lu et al. They examined more than a hundred articles published from 1999 to 2016 and the 12 most used BIM programs. In the research, the connection between BIM and green structures was investigated in depth. This study focuses on the effectiveness of BIM use in the design, construction, commissioning, and improvement processes of green buildings; The functions of BIM for the analysis of green buildings in terms of energy, emissions, and ventilation and finally the effectiveness of BIM use for green building assessment systems are discussed in 3 main sections [
26].
Edwards et al. They examined the transformation of non-residential buildings into sustainable and energy-efficient structures with the help of BIM software and demonstrated the practicality of decision support tools for obtaining green building certifications such as BREEAM and LEED [
27].
Özarısoy and Altan made suggestions with Revit and GBS software for the improvement and optimization of the energy performance of the existing housing stock on a sample building in the TRNC. In the research, strategies that can increase the energy efficiency of designers, contractors, suppliers, and researchers have been developed by using market data for sustainable building design [
28].
Khaddaj and Srour investigated the relationship between BIM and sustainability concepts and the possibilities of using BIM to reduce energy consumption in existing building stocks and revealed the role of BIM and a BIM-based roadmap in renovation works to increase building energy performance [
29].
Habibi et al. The results of the scenarios created by investigating the effect of the renovation of the building roofs on the building energy consumption have been revealed. The proposed roof alternative is an outside-in photovoltaic panel, EPDM membrane, and insulation layer. The main purpose of the study is to reveal the feasibility of converting an old building to both water resistance and energy generation [
30].
Jalaei and Jrade BIM proposed an integrated method that connects energy analysis and cost estimation tools to the green building certification system. The designers proposed a system that automatically evaluates LCA, energy analysis, LEED, and cost estimations during the concept design phase of the building and demonstrated the feasibility of this proposal through a real building model [
31].
Elnabawi and Hamza compared the energy consumption analyses of three different housing samples in three different locations (Cairo, Alexandria, Asyut) with Revit and Design Builder software, and as a result, the simulation obtained with Design Builder gave more accurate results than Revit. They concluded that their results were very close to the true values [
32].
Chong and Wang examined the contributions of BIM to sustainable development by addressing the concepts of sustainability in the conceptual design of the project, concept design, application projects, and building construction processes. With the study, they established the relationship between 'BIM and green evaluation criteria' and 'BIM and renewable energy' to identify the deficiencies of the specifications, standards, and rules that are decisive in practice and to develop recommendations [
33].
Egwunatum et al. They investigated the way and method of using BIM for solutions that reduce the energy needed in the use of buildings, reduce carbon emissions and increase the quality of building comfort. In this context, they conducted a literature review within the framework of energy consumption, energy performance, and energy evaluation of buildings. As a result of the review, it was concluded that the integrated use of energy analysis software with BIM guides designers in creating an optimized energy model. To confirm the conclusion reached, analyzes were made specifically for the Arboleda Project in the Dominican Republic and showed that it helped the world reach the first 103% positive energy building [
34].
3. Material and Method
This research aims to produce the most suitable scenario that can strengthen the energy performance of existing building stocks with BIM and GBS software. For this purpose, a sample residential building has been selected where data can be easily obtained and access is possible to examine. Contrary to studies in which similar studies were conducted before, investigating the use of BIM in the renewal phase, not in the design phase, is the original value of our study. Increasing energy performance, reducing carbon emissions, and investigating the costs of these targets is not subject that finds a wide place in the literature.
While conducting the research, 192 different scenarios were developed by making combinations with 6 different parameters, and the initial investment costs of the renewal activities and the energy benefit and depreciation calculations were matched. With this overlay, its applicability to existing housing stocks is emphasized.
Figure 1 shows the stages of the study and the flow chart.
3.1. Current Housing Information
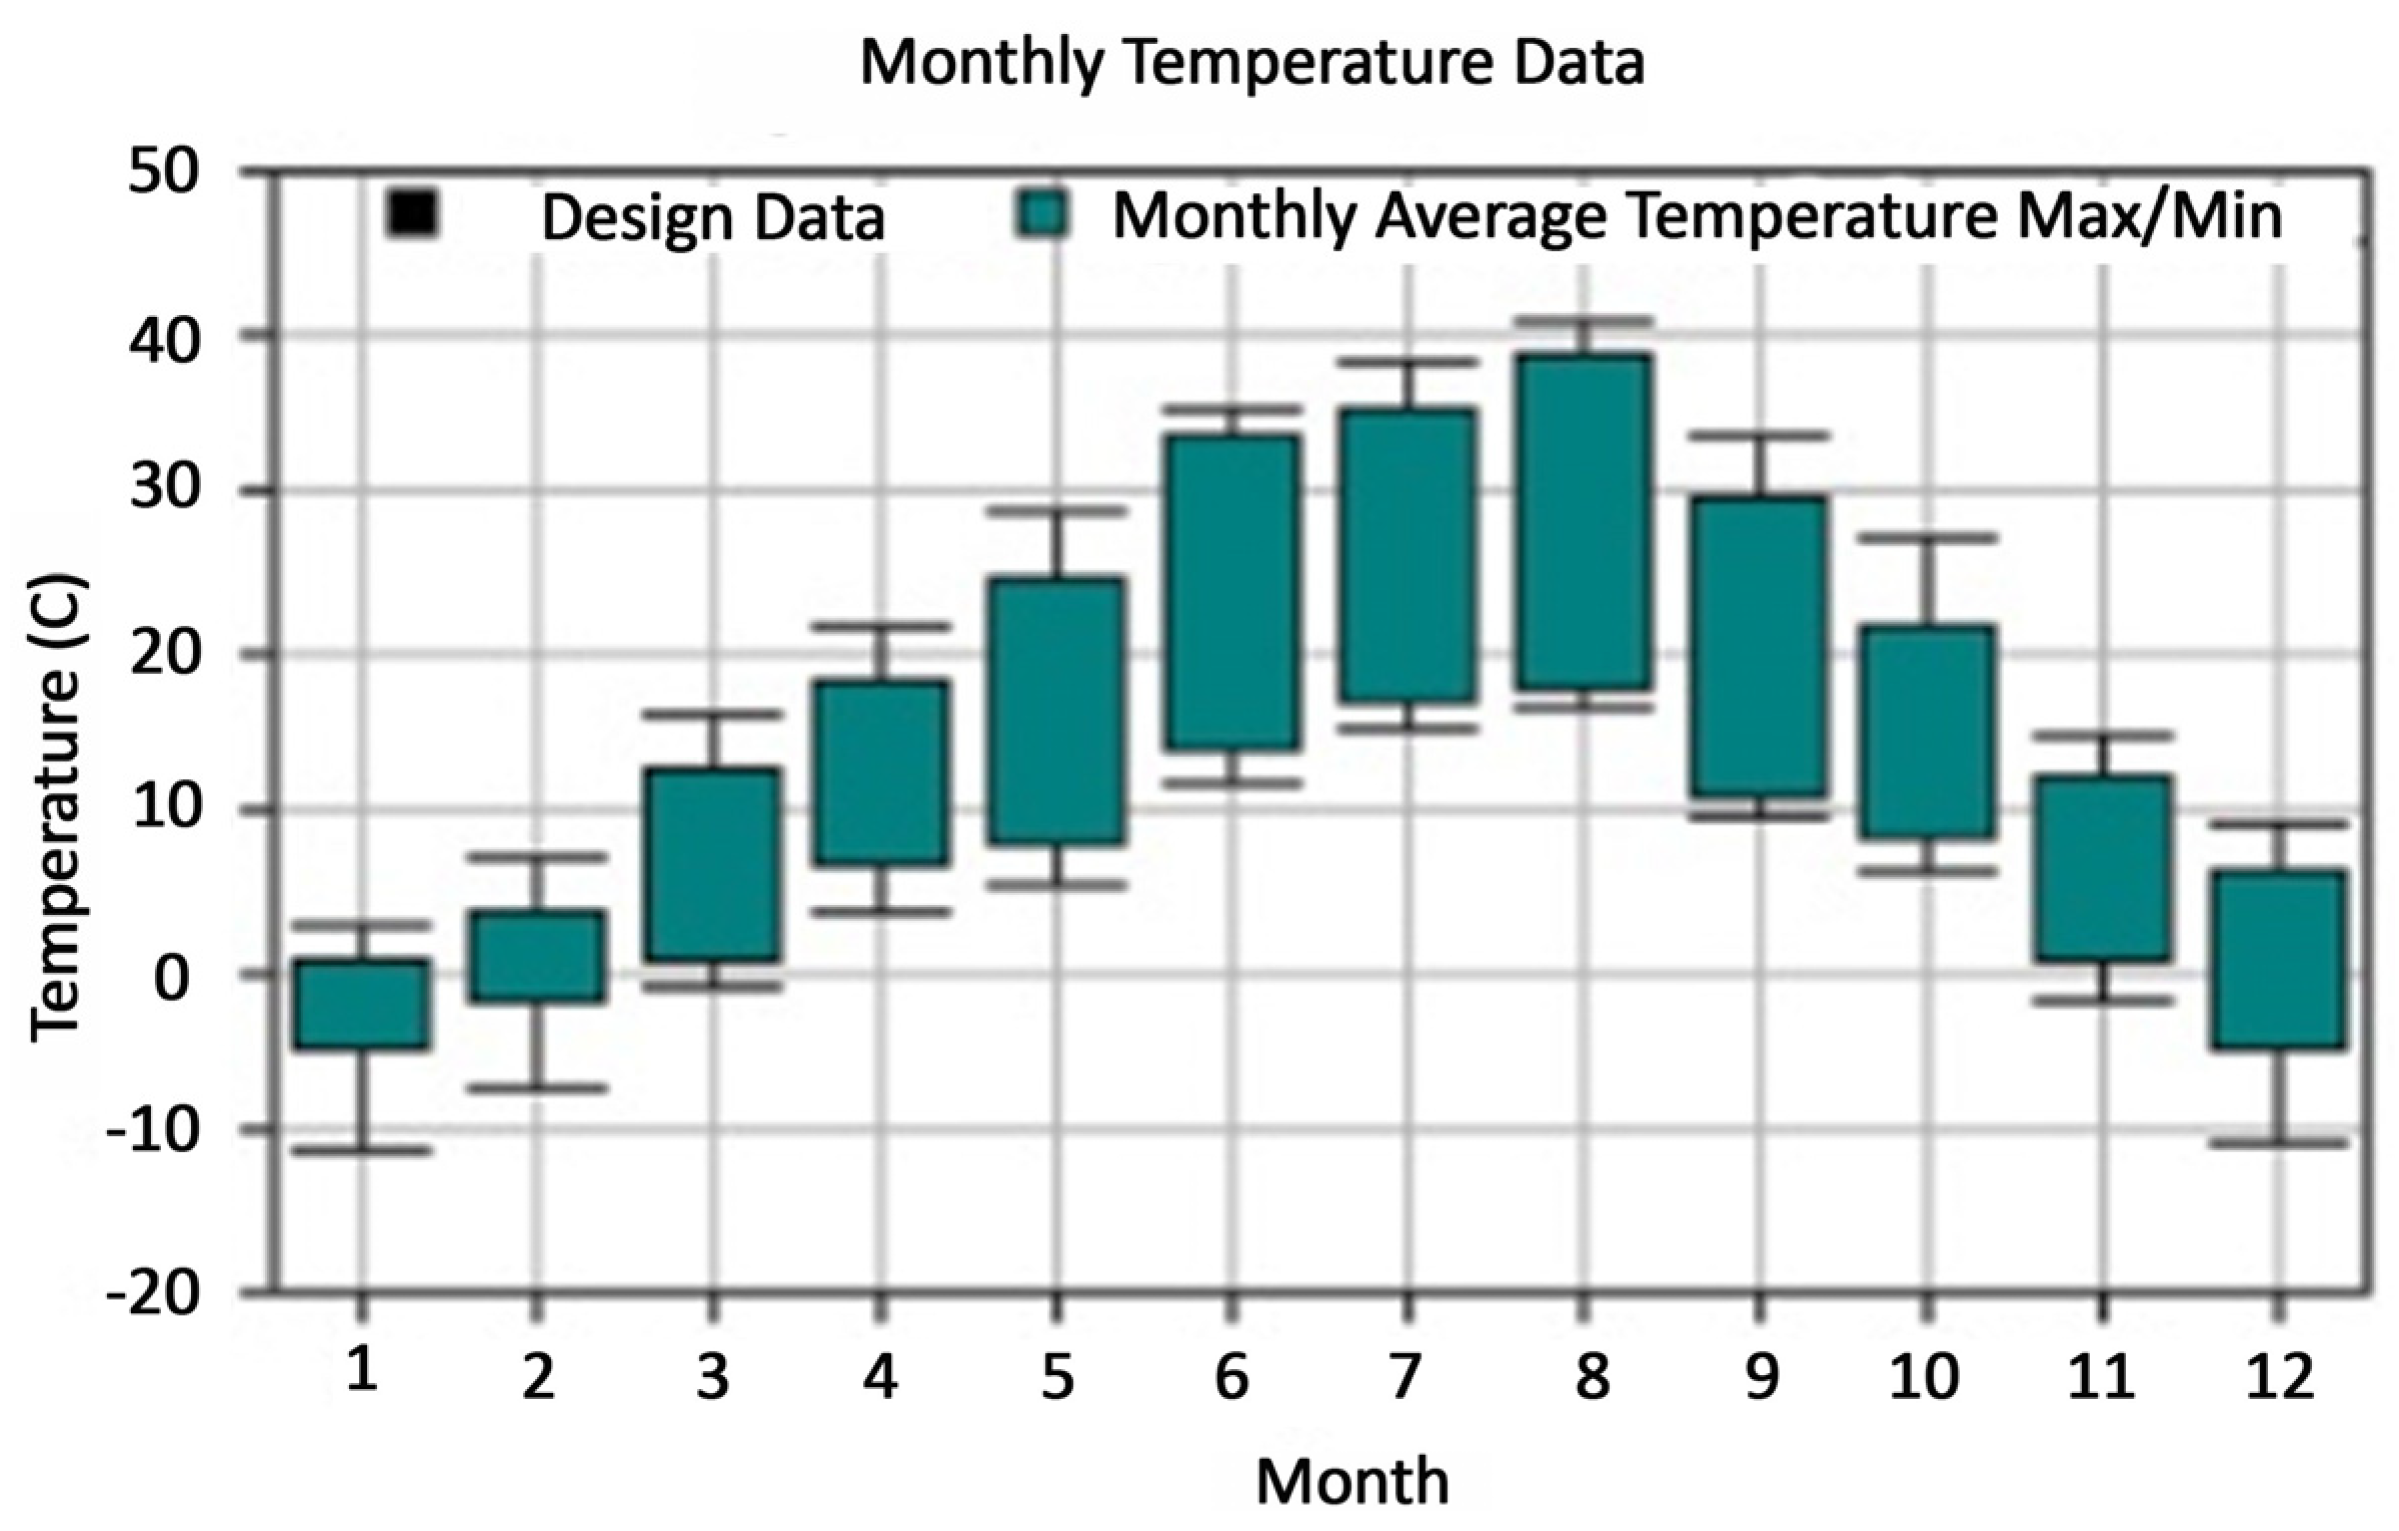
The building where the study was conducted is at 38.7180 latitude and 39.8665 longitude. As a location, it is located in Yazıbaşı in the Kovancılar district of Elazığ province in the east of Turkey. In the location of the building, winters are cold-hard and summers are hot-dry (
Figure 2).
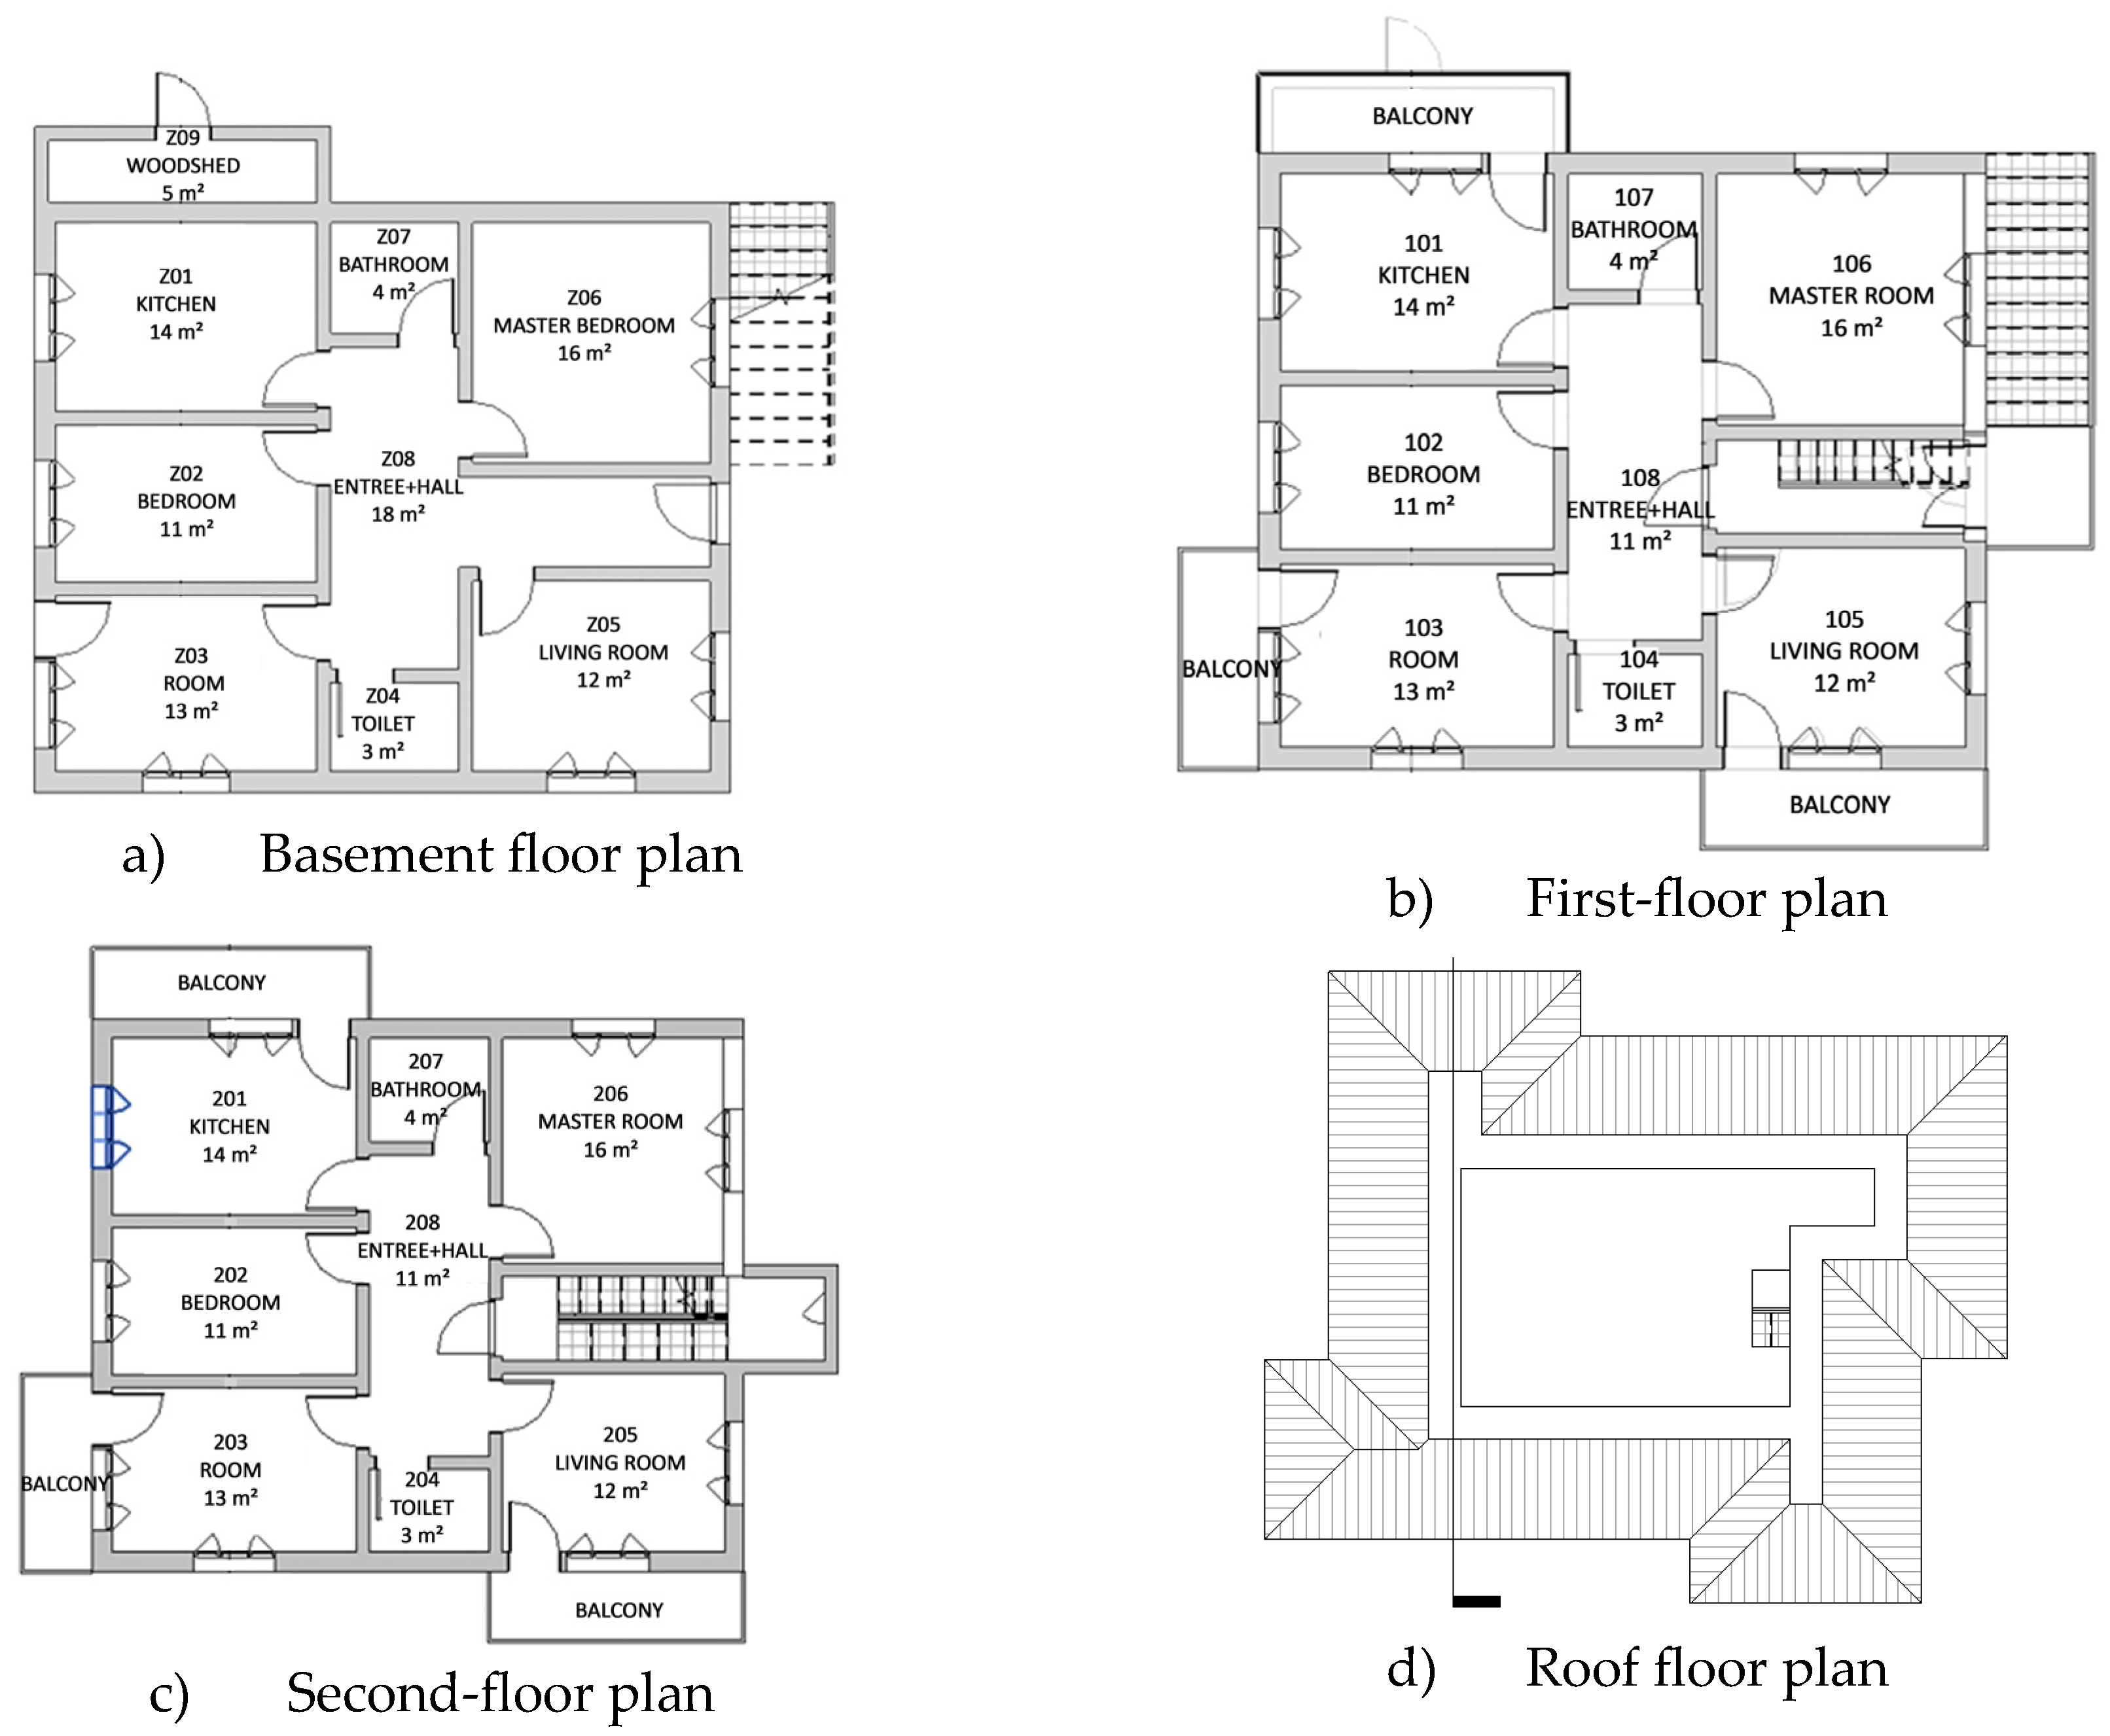
The building has a total of 3 floors and consists of a ground floor and two floors above it. The number of users of the building is 9 people. Each floor consists of independent residences and each floor contains 1 living room, 3 rooms, kitchen, toilet, and bathroom spaces. The roof is cold and is also used as a warehouse. The building usage area is 254 m2 (
Figure 3).
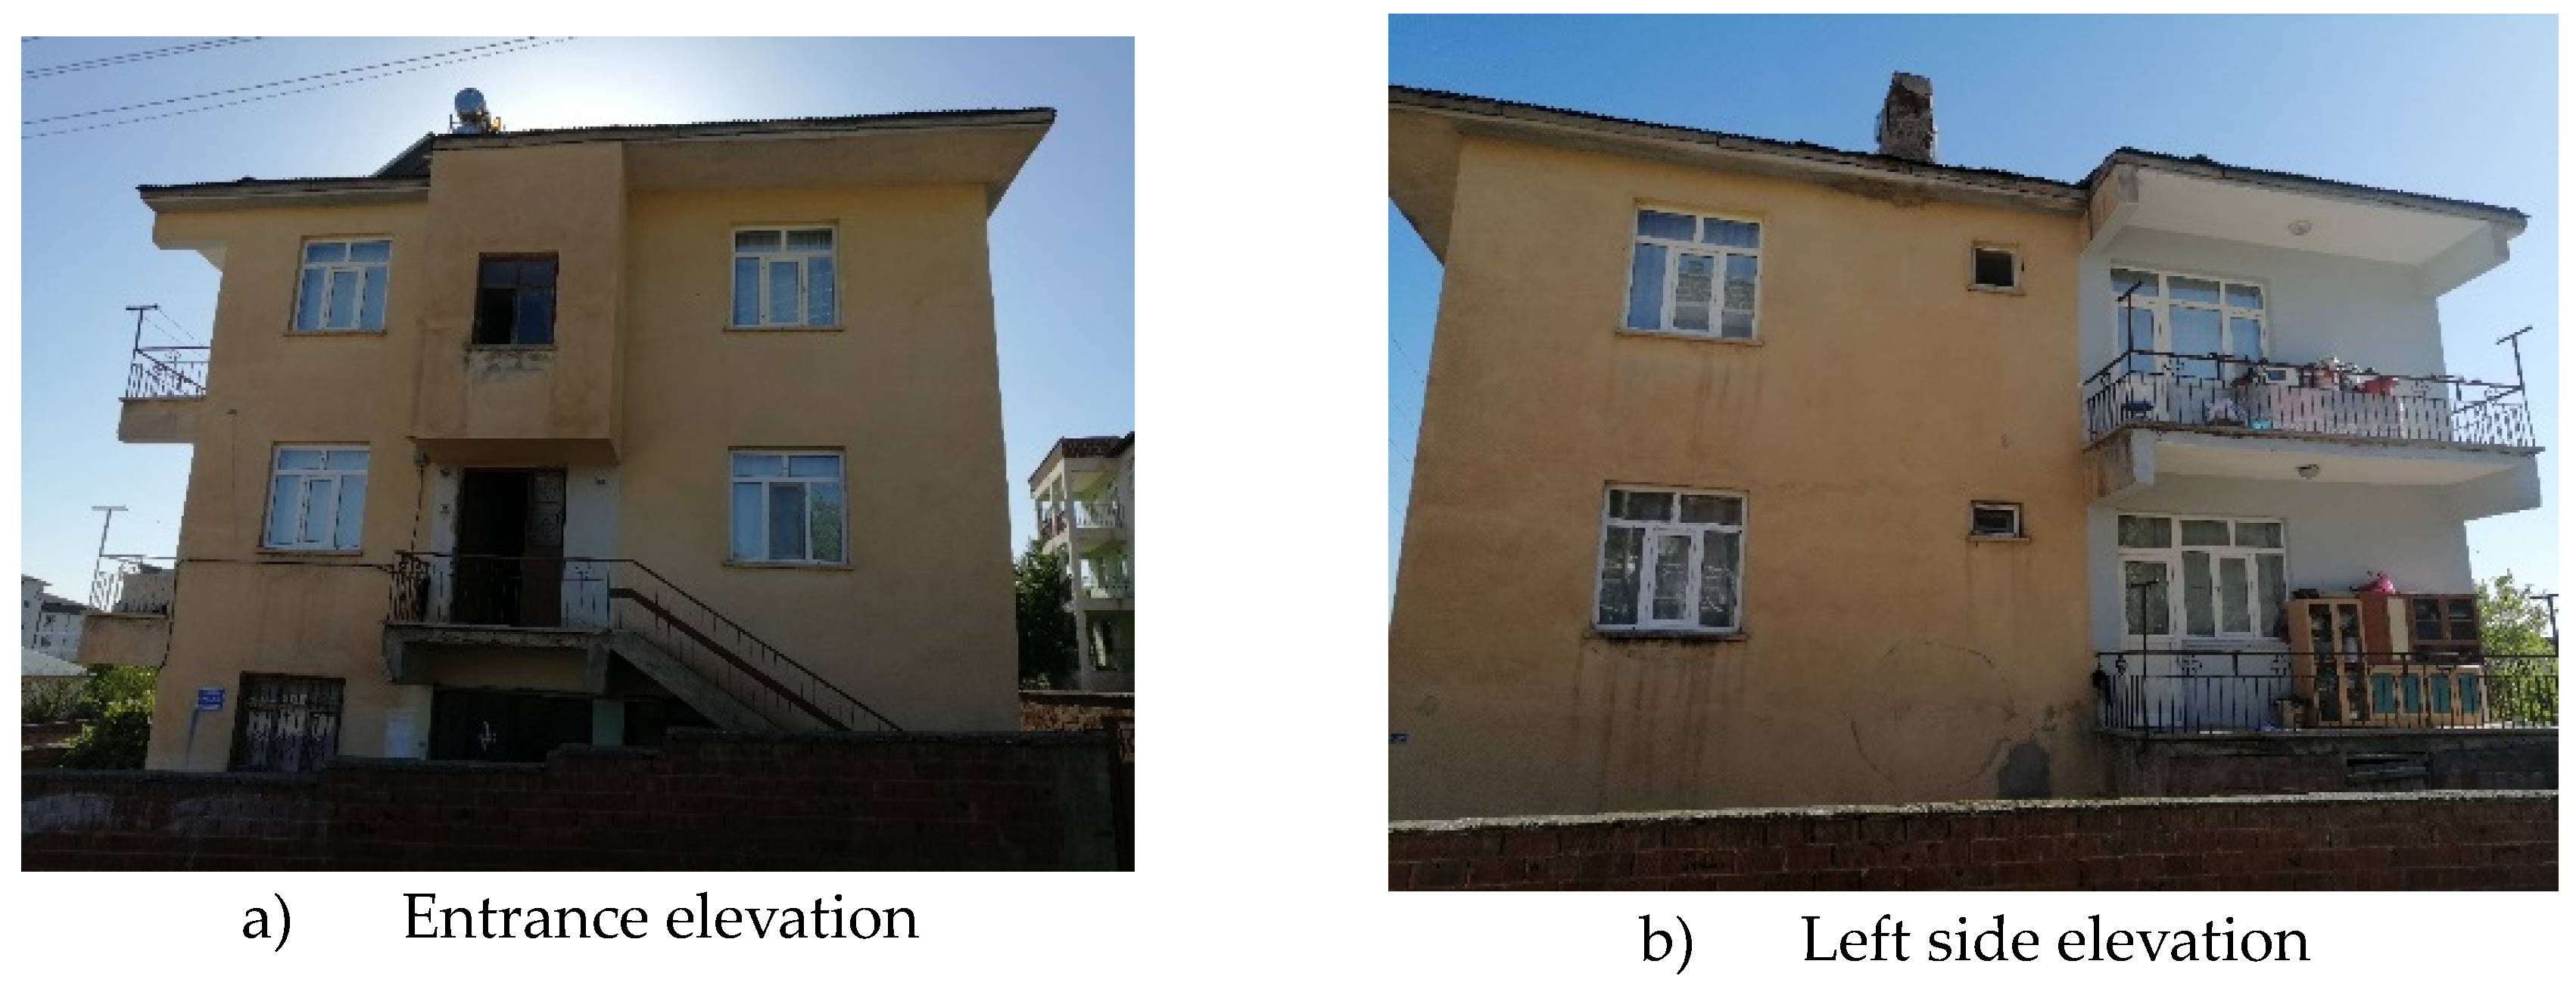
Although the building is oriented in the north-south direction, its four facades are open. The transparency ratios on the facade of the building are 15% south, 11% north, 15% east, and 25% west. (
Figure 4)
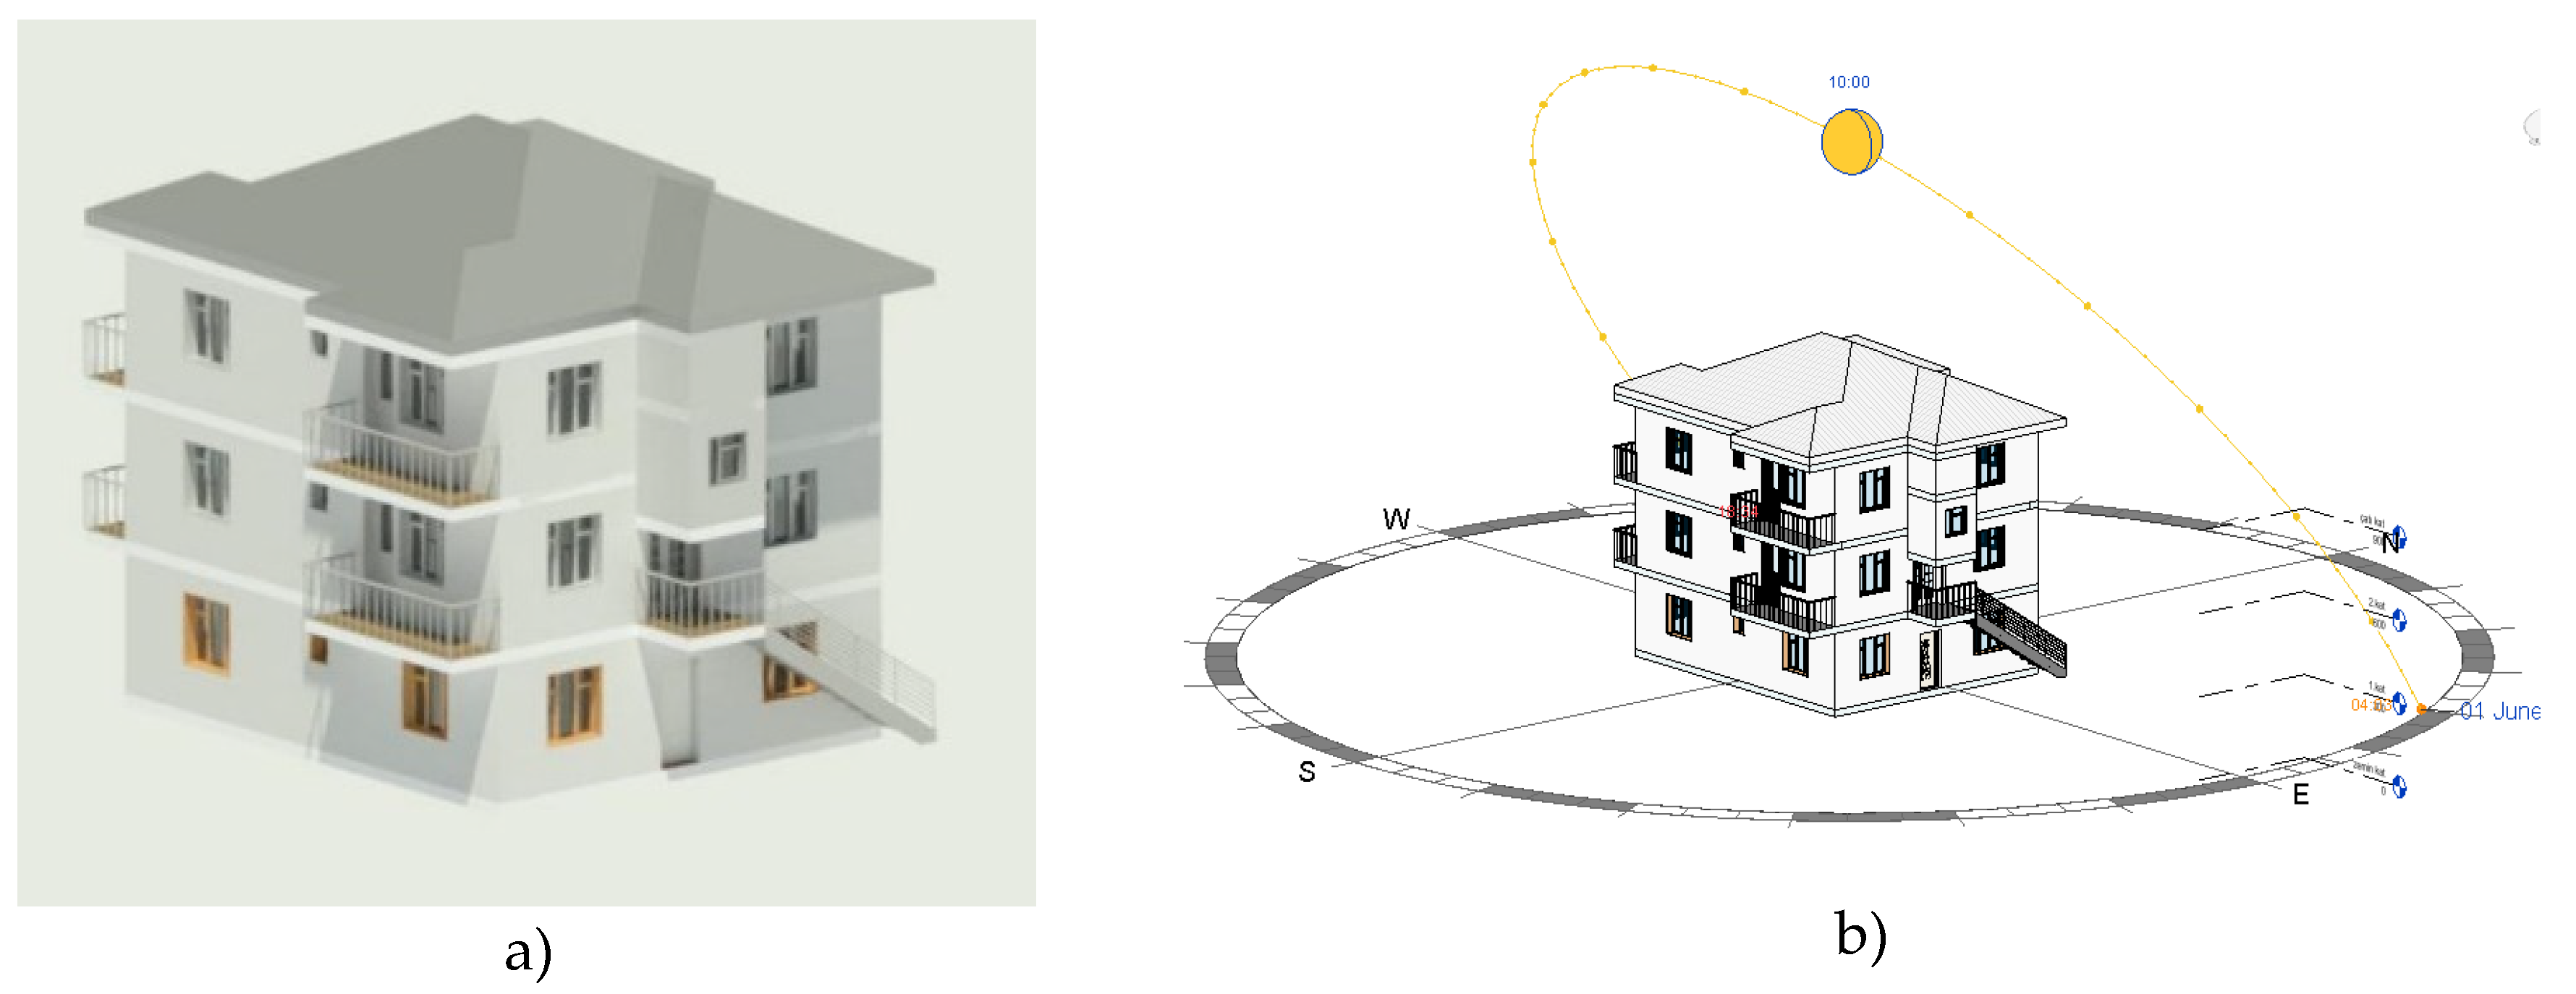
With the data taken from the field, the building was converted into a 3D model in the Autodesk Revit program. While creating the model, care was taken to use the existing materials of the building, the location, and the orientation of the building correctly, and to make it twin with reality (
Figure 5).
The outer shell of the building is brick+plaster+paint (30cm+3cm) and there is no thermal insulation material. (
Figure 6) Mezzanine floors consist of 5cm leveling concrete on 15cm reinforced concrete flooring and 2cm laminate flooring as floor covering. The building roof is metal roofing and the covering material has undergone deformation. Therefore, it leaks water in rainy weather. The windows are double-glazed except for the ground floor and the stair floor (
Table 1).
3.2. Analysing Results of Existing Residential Building Energy Analysis
To perform the energy performance analysis of the existing issue, an energy model was created in the Revit model, and then energy data entries were made. The created energy model was exported in gbxml format and imported into GBS software and made ready for analysis. (
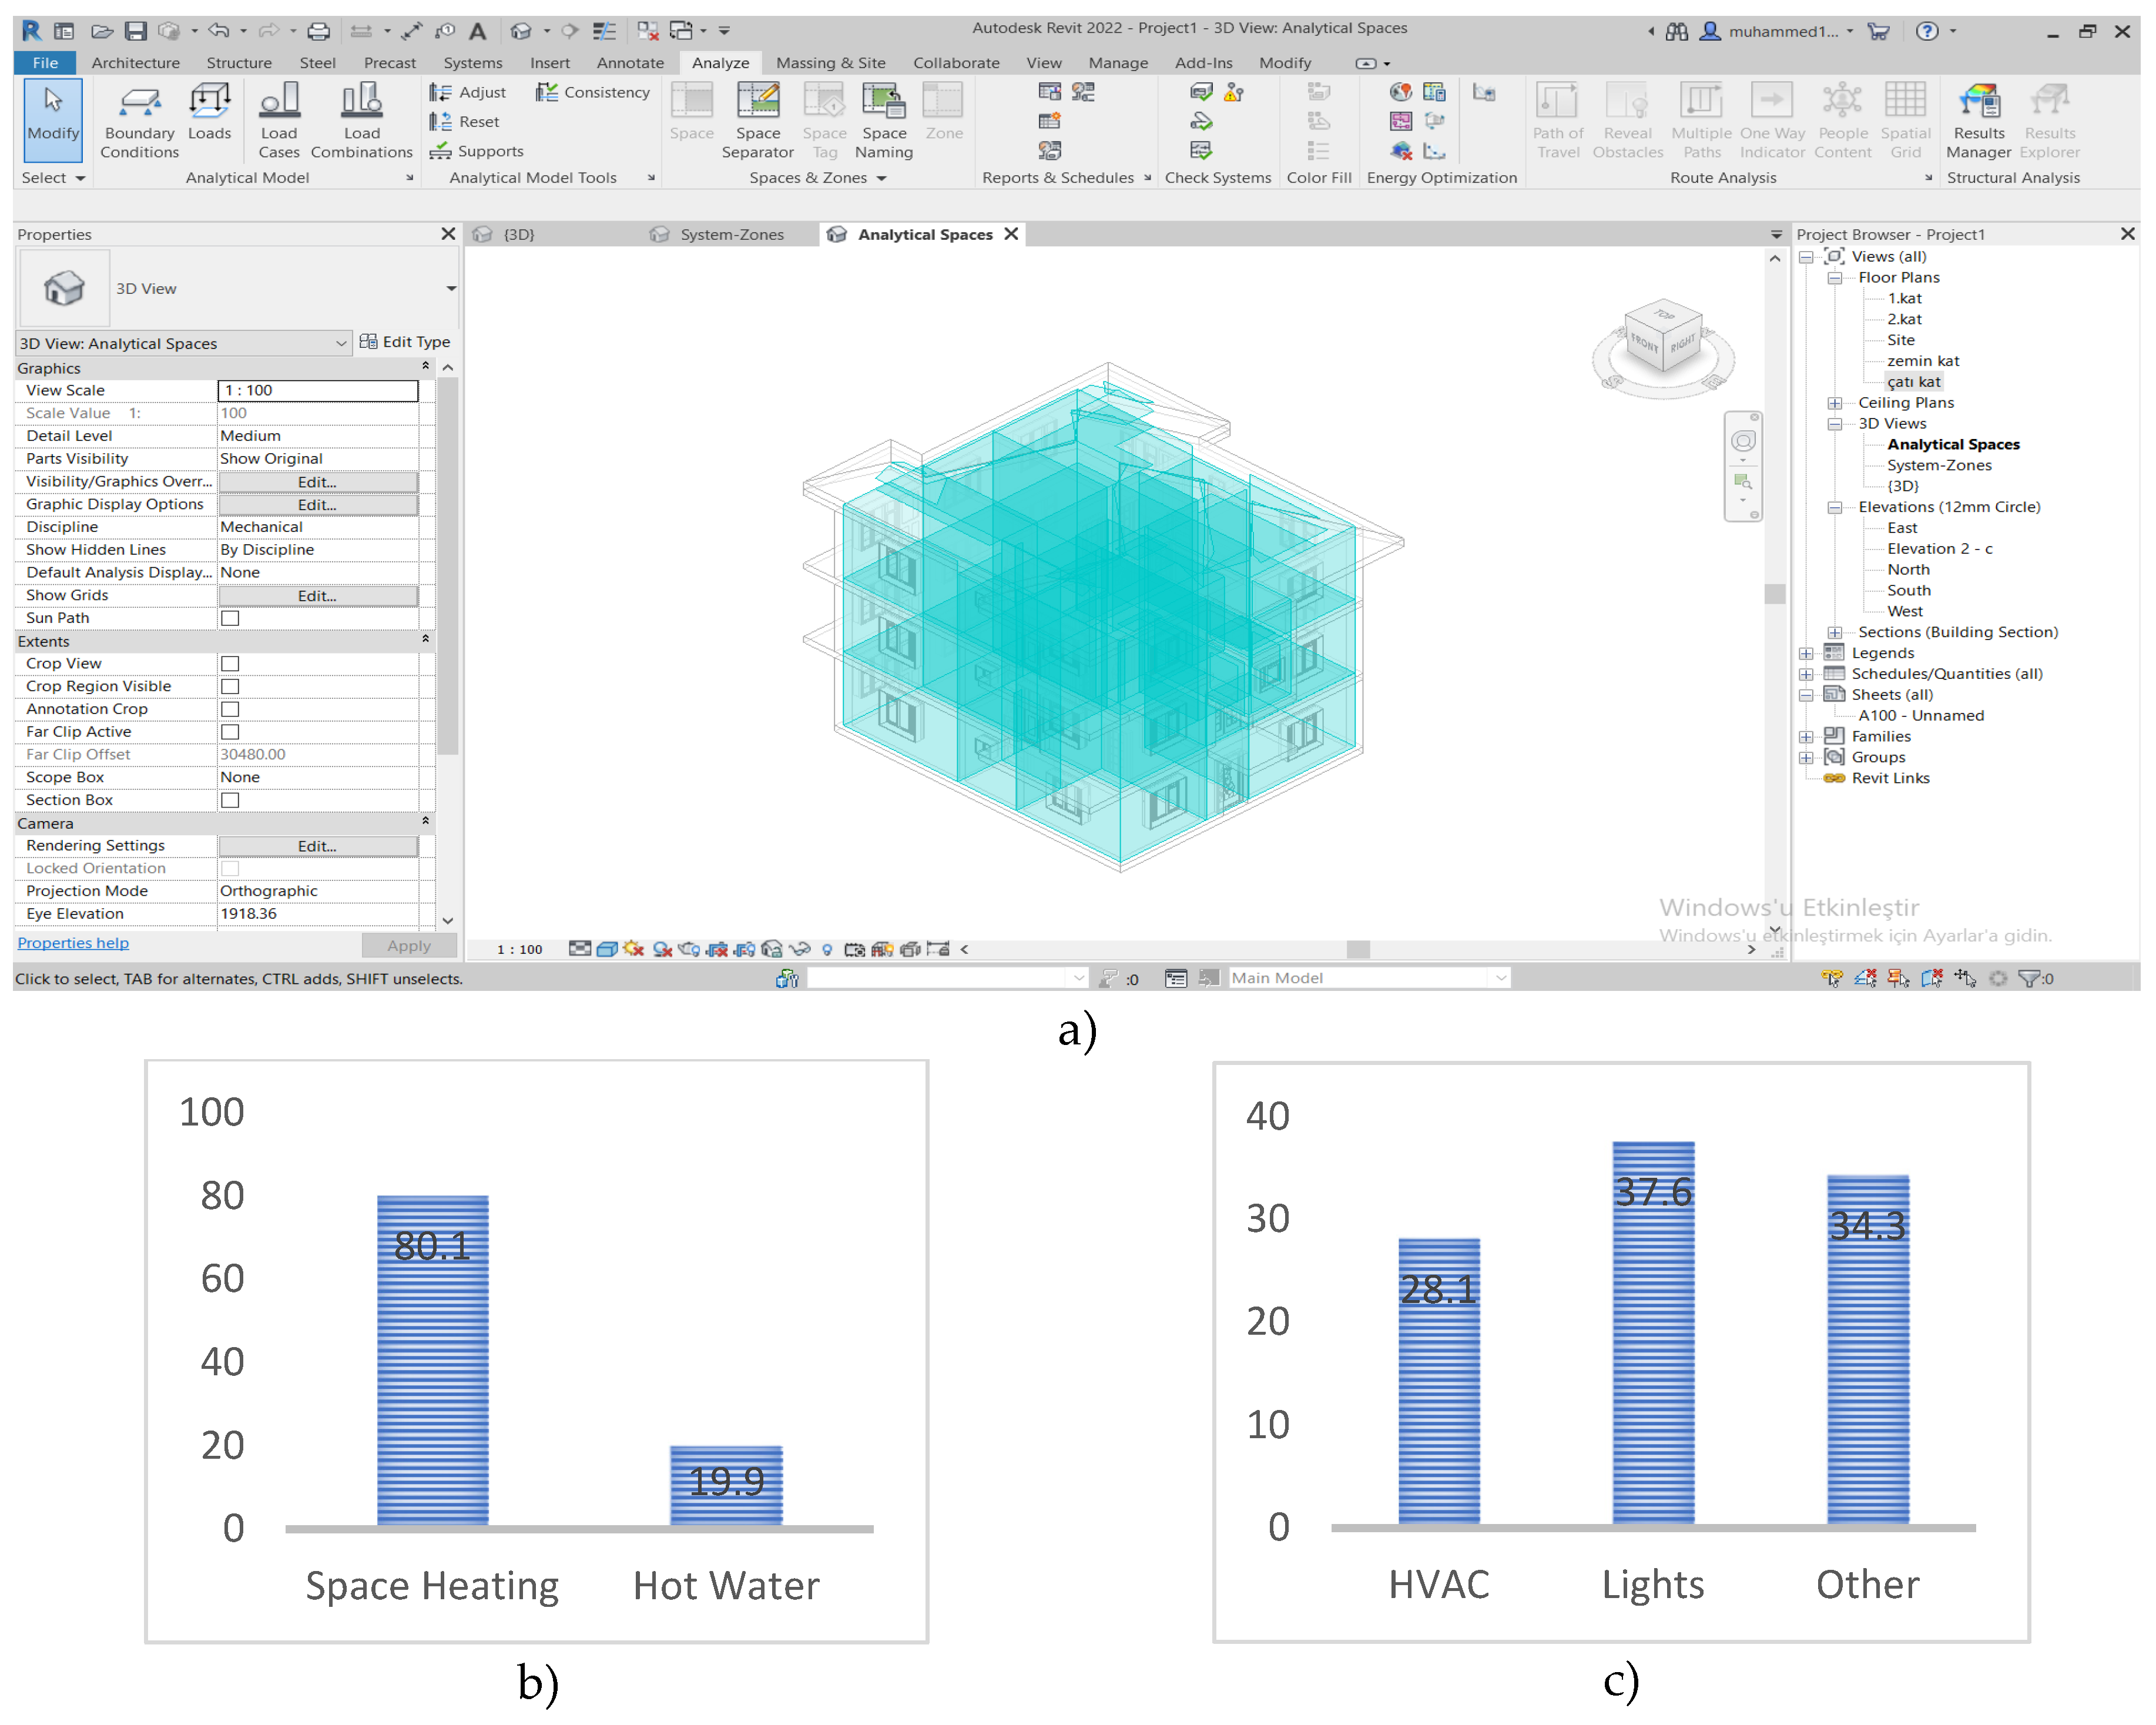
Figure 7. a) With the GBS analysis, it has been seen that the annual fuel consumption is 241,021.00 MJ and this consumption is 80.1%, 19.9% hot water for heating purposes (
Figure 7.b.) The annual electricity consumption is calculated as 26,147.00 kWh and 37.6% of this expenditure is lighting, Calculated for 28.1% HVAC and 34.3% for other purposes (
Figure 7. c). Again, from the calculations obtained, it was seen that the energy expenditure intensity was 1.321.00 MJ/m2/year, and the carbon emission was 12.00 mg.
The analyzes obtained with GBS were calculated according to the unit costs of consumer prices in Turkey, and annual and lifetime costs were calculated. The fuel unit cost is 0.04 TL, electricity unit cost is 0.91 TL. While calculating the lifetime cost, the remaining life of the building is calculated as 30 years. A 6.1% discount was calculated from the calculated lifetime cost (
Table 2).
3.3. Changing Building Parameters
To develop alternative scenarios of the existing building, 6 parameters were determined and 192 different results were obtained as a result of the combinations of these parameters with each other. The selection of the determined parameters was obtained from the literature reviews and the results obtained from the previous studies.
3.3.1. Changing the Building Exterior Wall Material
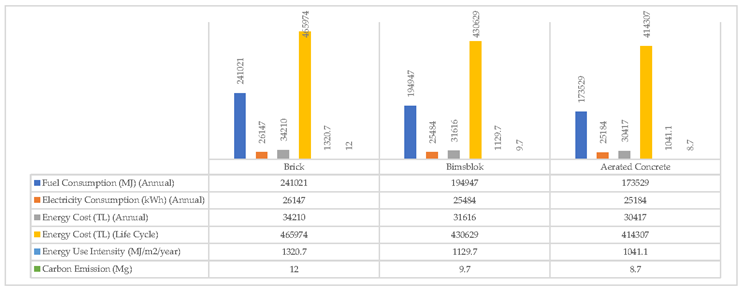
The exterior walls of the building currently consist of 30 cm thick brick material. It is covered with 3 cm plaster and paint on the outside of the brick material, and 1.5 cm on the inside with gypsum plaster and paint material. The interior walls are made of 20 cm brick walls and 1.5 cm gypsum plaster and paint coatings are made on both sides of the wall. For the optimum wall material selection, the most commonly used pumice block and aerated concrete materials were chosen as alternatives, apart from the existing brick material. Alternative results were found with only material change without changing the section thickness with the coatings on the wall section (
Table 3).
The most suitable section type was determined by performing performance analyses based on the existing wall section of the building and the new wall sections created with the newly proposed pumice block and aerated concrete materials (
Table 4).
3.3.2. Results Obtained with Change in Roofing Material
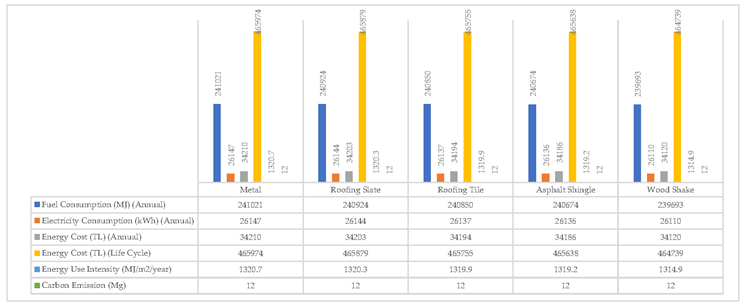
To examine the current state of the building roof and how the building energy performance and carbon emission values change with variable material parameters, 4 more alternative materials to the existing metal material were selected and analyzed. In the selection of alternative materials, commonly used materials were preferred (
Table 5).
Alternative results were obtained by performing building energy performance analysis on alternative roof types created with alternative 4 new materials together with the existing roof covering of the building, metal coating (
Table 6).
3.3.3. Results Obtained with Change in Thermal Insulation Material
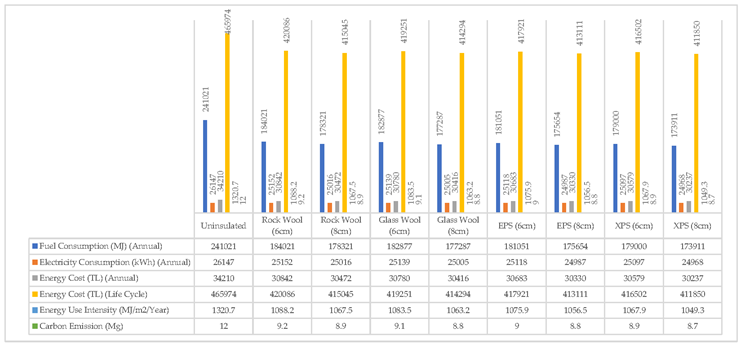
In the current state of the building, there is no thermal insulation layer. Building energy performance analysis by adding the most commonly used 4 different thermal insulation materials (Rockwool, glass wool, EPS, and XPS) and each thermal insulation material in two different section thicknesses (6cm and 8cm), which are the most widely used in terms of thermal insulation of the building. has been made (
Table 7).
The results obtained with the building energy performance analysis made by adding 4 different materials with 2 different section thicknesses to the building exterior walls are as in
Table 8.
3.3.4. Results Obtained with Change in Window Glass Material
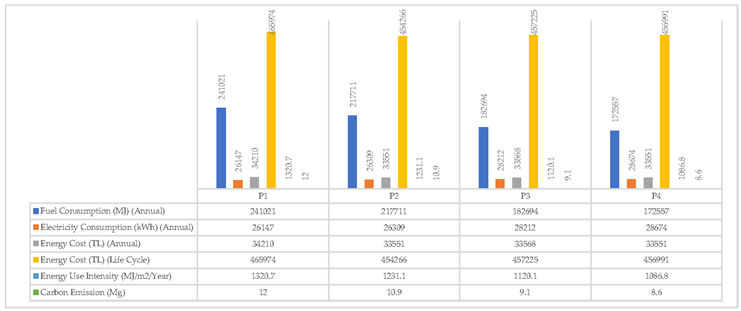
The building's existing glass material (P1) is 4mm single glass. The glasses of the building windows are simulated by replacing them with alternative glass materials such as low E double glazing (P2), uncoated double glazing (P3), and triple glazing (P4) (
Table 9).
The situation and changes that occur when the existing P1 type window of the building is proposed with P2, P3, and P4 materials are shown in the chart in Table
3.3.5. Results Obtained with Change in Lighting
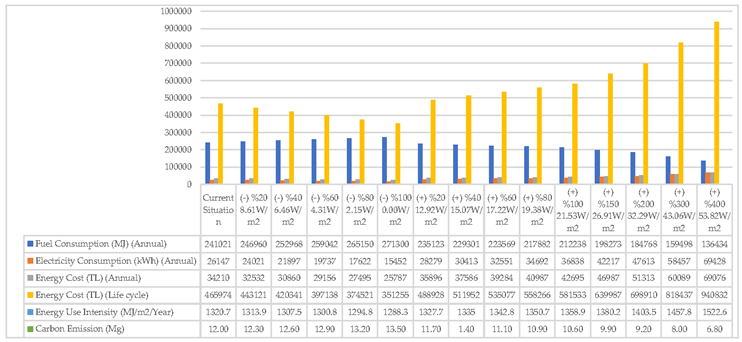
Luminous power intensity (maximum luminous power per unit area) is abbreviated as LPD. To examine the effect of LPD on building energy performance, the LPD value of the existing building (10.76W/m²) was reduced by 20, 40, 60, 80, 100, and 20, 40, 60, 80, 100, 150, 200, 300, 400 by increasing the results were presented by analyzing 14 different scenarios
Table 11.
3.3.6. Results Obtained with Photovoltaic Panel Application
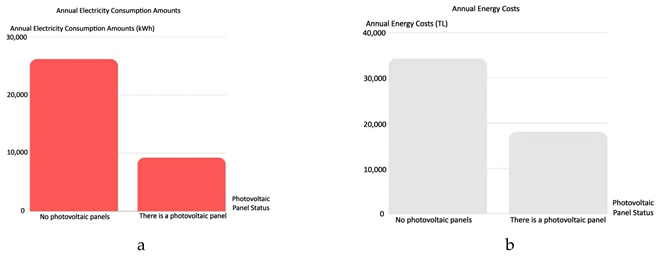
It has been investigated how the building energy consumption changes when a photovoltaic panel (PV) is added to the roof of the building. The roof area of the building is 153 m2. The area where the panel can be installed is 88 m2. A monocrystalline solar panel with an efficiency of 13.8% was chosen for the simulation. The cost of 1 m2 of the panel is 1104.62 TL/1Watt=8 TL. Since the panel area to be built is 88 m², the total cost of the panel is 97,136,89 TL. The graphs of the building energy performance analysis results of the PV panels are shown in
Table 12.
3.3.7. Results Obtained by Evaluation of All Alternative Scenarios
Finally, 192 alternative scenarios were made in combination with the wall (2 types), roof (4 types), insulation (8 types), and windows (3 types) alternatives. In the above studies, each parameter was separately simulated and evaluated. At this stage, the most efficient option by combining all the parameters, and the possibility of combining different parameters was also taken into consideration. In addition, another purpose of simulating all parameters together is to prove the accuracy and reliability of the study. Wall, roof covering, and window glass materials and thermal insulation status of the existing house are not included in these scenarios. Lighting (LPD) and photovoltaic panel (PV) are excluded from this combination. The best results of the combination of Wall, Roof, Insulation, and Window are combined with the best results of LPD and PV simulations. (
Figure 8).
4. Findings and Discussions
According to the simulation results for the wall materials, it has been shown that the changes in the wall material do not have a serious effect on the building's electricity consumption, but cause great changes in the fuel consumption. Among the options, the gas concrete wall section showed higher performance compared to the pumice block and brick. (
Table 13)
In the simulation tests for roofing materials, it is striking that there is no significant change in the performance of alternative materials on the roof. Wood and stone sheet roofing materials were the highest and lowest-performing options, respectively. Shingle was in the 2nd place and the tile was in the 3rd place. However, the values are very close to each other. (
Table 14)
According to the results of the simulation tests performed by changing the thermal insulation materials, applying thermal insulation to the exterior walls of the building significantly reduces the building's fuel consumption. There is no significant reduction in electricity usage. Carbon emission rates are lowest in 8cm XPS material. Significant reduction in fuel consumption; It greatly reduces the lifetime energy cost of the building. The thermal insulation materials that increase the energy performance of the building the most are XPS, EPS, glass wool, and rock wool, respectively. Rock wool and glass wool materials also showed very close values for all parameters (
Table 15).
Window glass type according to building energy performance results for P1, P2, P3, and P4 glass materials; significantly affects the fuel consumption, energy use intensity, and carbon emission of the building. There is no significant change in electricity usage and costs. The glass materials that increased the building energy performance the most were P4, P3, P2, and P1, respectively. Carbon emissions are the lowest in P4. (
Table 16)
When the LPD value is reduced, electricity consumption, cost, and energy usage intensity have decreased. Fuel consumption and carbon emissions are increasing. When the LPD value is increased, electricity consumption has increased, but fuel consumption and carbon emissions have decreased. While the LPD value decreased, fuel consumption increased slightly, while the LPD value increased, costs, energy use intensity, and electricity consumption increased significantly. The alternative (0 W/m²) with an LPD value of 100% less than the current value showed the best performance. Although it caused an increase of 30,279 MJ in annual fuel consumption, the savings of 10,695 kWh in electricity use allowed great reductions in costs and energy use intensity. During its 30-year life cycle, 114,719.00 TL was saved. (
Table 17)
Photovoltaic panel selection and the costs of these choices are explained in the sections above. It has been calculated that the system will generate 16,936 kWh of electricity annually with the monocrystalline solar panel PV panels with 13.8% efficiency installed on an area of 88 m² of the building roof surface. The cost of panel installation is 97,136,89 TL. Considering the current annual electricity consumption of the building, the depreciation period is calculated as 6 years.
According to the simulations made for all alternative scenarios, the best alternative is the alternative from the components D2, C4, I8, and P4. In this scenario, the fuel consumption is 92.287.00 MJ and the energy usage intensity is 767.3 MJ/m2/year. In electricity consumption, the D2, C4, I8, and P2 scenarios give the best results. The annual electricity consumption is 24,912.00 kWh, the annual energy consumption is 28,229.00 TL and the lifetime consumption value is 384,500.00 TL.
4.1. Comparison of Optimum Alternative Scenario and Current Situation
In this part of the study, the energy performance results of the existing building were compared with the optimum alternative scenario where the best options selected for all parameters analyzed were applied together. Energy analysis results of the existing house, all parameters, and alternative scenarios are given (
Table 18).
With the alternative scenario created, the energy performance of the existing house has been significantly increased. 61% savings in annual fuel consumption and 64% in electricity consumption were achieved. While the fuel consumption is 241,021.00 MJ for the existing residence, it is 92,287.00 MJ for the alternative scenario. Electricity usage is 26,147,00 kWh and 11,016,00 kWh for the existing residence and alternative scenario, respectively. Annual and lifetime energy costs were saved by 59%. The lifetime energy cost of the building has been reduced by TL 279,176.00. Similar serious reductions were observed for energy use intensity and CO2 emissions. Triple glass, aerated concrete wall, and 8 cm XPS thermal insulation applications, respectively, are the options that reduce the fuel consumption of the building the most. The triple glazing application in the windows reduced the building fuel consumption from 241,021.00 MJ to 172,557.00 MJ. On the other hand, parameters other than photovoltaic panels and lighting systems did not affect electricity consumption. With the installation of photovoltaic panels on the roof of the building, an annual saving of 16,936.00 kWh was achieved in electricity consumption. With the reduction of the LPD value of the lighting fixtures by 100%, a reduction of 10,695.00 kWh was achieved in annual electricity consumption.
The lowest annual and lifetime energy costs are provided by the photovoltaic panel and lighting system parameters that reduce electricity consumption the most. The most important reason for this result is that the unit price of electricity is much higher than that of fuel. Finally, the low energy costs provided for the photovoltaic panel will make the user feel its effect in the long run due to the high initial investment costs of the application.
4.2. Financial Value of Improvement and Amortization Periods
In this study, the return on investments was calculated considering the effects of the selected renovation works on the energy performance and costs of the sample building, as well as the initial investment costs and the savings in the building. Thus, the relevant institutions, organizations, and individuals were informed about the economic feasibility of building reinforcement works. For the costs of reinforcement techniques, the current unit price list of the Ministry of Environment and Urbanization and the online resources of the manufacturers were used (
Table 19).
The monetary compensation for the proposed improvement works for the existing building is 275,050,00 TL. The annual energy cost of the existing building is 34,210,00 TL. The annual energy cost of the alternative scenario created is 11.016 TL. Therefore, an annual saving of 23,194.00 TL was achieved. As a result, the payback period has been calculated as approximately 12 years, considering the investment cost of retrofitting and the annual savings it provides.
5. Conclusion
The construction industry is one of the largest stakeholders in global energy consumption and offers great potential to reduce the use of fossil fuels and to get rid of the negative effects of global warming. Since existing buildings constitute a very large part of the building stock, it is of great importance to increase the energy performance of existing buildings to minimize greenhouse gas emissions in the construction industry.
BIM technology is a set of technologies, processes, and policies that allow buildings to be collaboratively designed, constructed, and operated in a virtual space. BIM provides the opportunity to analyze the energy performance of existing buildings and simulate and analyze retrofit options through the data-rich, object-oriented, intelligent, and parametric 3D model that can be created in-house, thus creating the best retrofit scenario for existing buildings.
In this study, a sample residential application study was conducted to investigate the effectiveness of BIM in the renovation of existing buildings and to develop suggestions about applicable and optimized retrofitting techniques. The energy performance of the existing house, which was modeled in Revit software and processed with the necessary data, was calculated in the GBS simulation tool. Simulation results; energy consumption (annual / lifetime) (fuel and electricity), cost (annual / lifetime), energy use intensity, and amount of CO2 emissions. To improve the energy performance of the existing building, retrofitting methods have been developed based on 8 parameters determined by using the literature and simulation results: building orientation, building envelope (wall, roof, thermal insulation, window, and facade transparency ratio), lighting and photovoltaic panel. Within the scope of each parameter, different options were developed and energy analyzes were made. Then, to ensure the accuracy and reliability of the data obtained, the effect of 192 alternative scenarios, which emerged as a result of different combinations of a total of 17 scenarios developed for 4 parameters, on the energy performance of the building was tested and comparisons were made. Finally, a comparison was made between the alternative building, which was created by using the most appropriate scenario determined for each parameter, and the existing building. In addition, the initial investment costs of the retrofitting works and the savings in the building were taken into account, and the return on investments was calculated.
The results obtained from the study are as follows:
The energy performance of the sample house has increased significantly with the applied retrofit techniques.
The building's annual fuel consumption was 61%, and electricity consumption was 64%. While the annual fuel consumption of the existing residence is 241,021.00 MJ, it is 92,287.00 MJ for the alternative building. Electricity usage is 26,147.00 kWh and 11,016.00 kWh for the existing residence and alternative scenario, respectively.In annual and lifetime energy cost savings were achieved by 59%. While the annual energy cost of the existing building is 34,210.00 TL, the annual energy cost of the alternative scenario created is 11,016.00 TL. The life cycle cost of the building has decreased from 465,974.00 TL to 186,798.00 TL. The annual CO2 emissions of the building have decreased from 12 Mg to 4.6 Mg. There was a decrease of 801.3 MJ/m2/year in the energy usage intensity of the building. The applications that increase the energy performance of the building the most are triple glazing, aerated concrete wall, and 8 cm XPS thermal insulation. The annual fuel consumption of the building has decreased by 68,464.00 MJ as a result of replacing the existing windows with triple glazing.
Except for the photovoltaic panel installation and the replacement of the lighting system, the renovation works did not affect the building's electricity consumption. With the installation of photovoltaic panels on the roof of the building, an annual saving of 16,936.00 kWh was achieved in electricity consumption. The total cost of the strengthening methods is 275,050.00 TL and the return on investment for retrofitting is approximately 12 years. The reinforcement work with the highest initial investment cost is the replacement of brick wall material with gas concrete, with a price of 99,980.00 TL. Despite the high initial cost of this application, the fact that it saves only 3,793.00 TL per year is an indication that it is not an ideal reinforcement method. The second application with the highest initial investment cost was the installation of photovoltaic panels on the roof of the building for 97,130.00 TL. However, 64% savings in annual electricity consumption provided by this application is an indication that it is a correct retrofit method. Triple glazing and 8 cm XPS thermal insulation applications, on the other hand, significantly reduced building fuel consumption, despite their relatively low investment costs. Thus, these applications have proven to be both economically and environmentally sound reinforcement options. Replacing the metal roofing material of the existing building with wood attracted attention with its high cost compared to the savings it provided and it turned out that it is not an ideal renewal method.
In this study, the use and efficiency of BIM technologies in retrofitting existing buildings were tested. It has been determined that BIM-based programs and auxiliary simulation tools are efficient tools for making energy analyzes of existing buildings, simulating retrofit scenarios, and comparing alternative designs.
Author Contributions
Conceptualization, H.P. and M.Y.; methodology, H.P.; software, M.Y.; validation, H.P., M.Y..; formal analysis, M.Y.; investigation, H.P.; resources, M.Y.; data curation, H.P.; writing—original draft preparation, H.P.; writing—review and editing, M.Y.; visualization, M.Y.; supervision, H.P.; project administration, H.P.; funding acquisition, M.Y. All authors have read and agreed to the published version of the manuscript.
Acknowledgments
This article was obtained from the thesis study called “Sustainable and Energy Efficient Housing Desgn” prepared at Firat University, Institute of Science and Technology.
References
- BANK, A.T. 2021 faaliyet raporu; 2022.
- ÖLMEZ, E. KPMG Perspektifinden İnşaat Sektörüne Bakış Raporu; 2021.
- Ali, K.; YAĞLI, H.; Yıldız, K.; Uğurlu, İ. Dünyada ve Türkiye’de enerji görünümünün genel değerlendirilmesi. Mühendis ve Makina 2018, 59, 86-114.
- Erdem, K.; Kadir, K. Enerji Kaynakları–Yenilenebilir Enerji Durumu. Mühendis ve Makina 2015, 56, 36-47.
- Erdem, K.; Şenel, M.C. Dünyada ve Türkiye’de enerji durumu-genel değerlendirme. Mühendis ve Makina 2013, 32-44.
- Koç, E.; Kaplan, E. Dünyada ve Türkiye’de genel enerji durumu-I Dünya değerlendirmesi. Termodinamik Dergisi 2008, 187, 70–80. [Google Scholar]
- Dean, B.; Dulac, J.; Petrichenko, K.; Graham, P. Global Status Report 2016: Towards zero-emission efficient and resilient buildings. 2016.
- Savaşkan, M.O. Yüksek Enerji Performanslı Konut Yapıları İçin Bım Tabanlı Bir Açık Kaynak Bilgi Sistemi Modeli. Fen Bilimleri Enstitüsü, 2015.
- Energy, B. Statistical Review of World Energy globally consistent data on world energy markets and authoritative publications in the field of energy. BP Energy Outlook 2021, 70, 8–20. [Google Scholar]
- Carvalho, J.P.; Bragança, L.; Mateus, R. Optimising building sustainability assessment using BIM. Automation in Construction 2019, 102, 170–182. [Google Scholar] [CrossRef]
- Zimmermann, R.K.; Skjelmose, O.; Jensen, K.G.; Jensen, K.K.; Birgisdottir, H. Categorizing building certification systems according to the definition of sustainable building. Proceedings of IOP Conference Series: Materials Science and Engineering; 2019. IOP Publishing. p. 092060.
- Çelik, E. Yeşil bina sertifika sistemlerinin incelenmesi Türkiye’de uygulanabilirliklerinin değerlendirilmesi. Fen Bilimleri Enstitüsü, 2009.
- Erdede, S.B.; Erdede, B.; Bektaş, S. Sürdürülebilir yeşil binalar ve sertifika sistemlerinin değerlendirilmesi. Uzaktan Algılama-Cbs Sempozyumu (UZAL-CBS 2014) 2014, 14, 17.
- Şimşek, E.P. Sürdürülebilirlik Bağlamında Yeşil Bina Olma Kriterleri “Kağıthane Ofispark Projesi Örneği”. Fen Bilimleri Enstitüsü, 2012.
- Erdede, S.B.; Bektaş, S. Türkiye için yeşil bina sertifika sistemi gerekliliği. Proceedings of 2nd International Symposium on Innovative Approaches in Scientific Studies, November 2018; pp. 138–143.
- Azhar, S.; Nadeem, A.; Mok, J.Y.; Leung, B.H. Building Information Modeling (BIM): A new paradigm for visual interactive modeling and simulation for construction projects. Proceedings of Proc., First International Conference on Construction in Developing Countries; 2008. pp. 435–446.
- Azhar, S. Building information modeling (BIM): Trends, benefits, risks, and challenges for the AEC industry. Leadership and management in engineering 2011, 11, 241–252. [Google Scholar] [CrossRef]
- Glick, S.; Guggemos, A. IPD and BIM: benefits and opportunities for regulatory agencies. In Proceedings of Proc., 45th Associated Schools of Construction National Conference, 2009.
- Ahmed, W.; Asif, M. BIM-based techno-economic assessment of energy retrofitting residential buildings in hot humid climate. Energy and Buildings 2020, 227, 110406. [Google Scholar] [CrossRef]
- Scherer, R.J.; Katranuschkov, P. BIMification: How to create and use BIM for retrofitting. Advanced Engineering Informatics 2018, 38, 54–66. [Google Scholar] [CrossRef]
- Taha, F.F.; Hatem, W.A.; Jasim, N.A. Utilizing BIM technology to improve sustainability analyses for Iraqi Construction Projects. Asian Journal of Civil Engineering 2020, 21, 1205–1215. [Google Scholar] [CrossRef]
- Abhinaya, K.; Kumar, V.P.; Krishnaraj, L. Assessment and remodelling of a conventional building into a green building using BIM. International Journal of Renewable Energy Research (IJRER) 2017, 7, 1675–1681. [Google Scholar]
- Ahsan, M.M.; Zulqernain, M.; Ahmad, H.; Wajid, B.A.; Shahzad, S.; Hussain, M. Reducing the operational energy consumption in buildings by passive cooling techniques using building information modelling tools. International Journal of Renewable Energy Research (IJRER) 2019, 9, 343–353. [Google Scholar]
- Kim, S.; Zadeh, P.A.; Staub-French, S.; Froese, T.; Cavka, B.T. Assessment of the impact of window size, position and orientation on building energy load using BIM. Procedia Engineering 2016, 145, 1424–1431. [Google Scholar] [CrossRef]
- Lim, Y.-W.; Chong, H.-Y.; Ling, P.C.; Tan, C.S. Greening existing buildings through Building Information Modelling: A review of the recent development. Building and Environment 2021, 200, 107924. [Google Scholar] [CrossRef]
- Lu, Y.; Wu, Z.; Chang, R.; Li, Y. Building Information Modeling (BIM) for green buildings: A critical review and future directions. Automation in Construction 2017, 83, 134–148. [Google Scholar] [CrossRef]
- Edwards, R.E.; Lou, E.; Bataw, A.; Kamaruzzaman, S.N.; Johnson, C. Sustainability-led design: Feasibility of incorporating whole-life cycle energy assessment into BIM for refurbishment projects. Journal of Building Engineering 2019, 24, 100697. [Google Scholar] [CrossRef]
- Ozarisoy, B.; Altan, H. Corrigendum: Low-energy design strategies for retrofitting existing residential buildings in Cyprus. In Proceedings of Proceedings of the Institution of Civil Engineers-Engineering Sustainability; 2019. Thomas Telford Ltd.; pp. 459–459.
- Khaddaj, M.; Srour, I. Using BIM to retrofit existing buildings. Procedia Engineering 2016, 145, 1526–1533. [Google Scholar] [CrossRef]
- Habibi, S.; Obonyo, E.A.; Memari, A.M. Design and development of energy efficient re-roofing solutions. Renewable Energy 2020, 151, 1209–1219. [Google Scholar] [CrossRef]
- Jalaei, F.; Jrade, A. Integrating BIM with green building certification system, energy analysis, and cost estimating tools to conceptually design sustainable buildings. Proceedings of Construction Research Congress 2014: Construction in a Global Network; 2014. pp. 140–149.
- Elnabawi, M.H.; Hamza, N. Investigating building information model (BIM) to building energy simulation (BES): interoperability and simulation results. Proceedings of IOP Conference Series: Earth and Environmental Science; 2019. IOP Publishing.. p. 012013.
- Chong, H.-Y.; Wang, X. The outlook of building information modeling for sustainable development. Clean Technologies and Environmental Policy 2016, 18, 1877–1887. [Google Scholar] [CrossRef]
- Egwunatum, S.; Joseph-Akwara, E.; Akaigwe, R. Optimizing energy consumption in building designs using building information model (BIM). Slovak Journal of Civil Engineering 2016, 24, 19–28. [Google Scholar] [CrossRef]
Figure 1.
Stages of the study and flow chart.
Figure 1.
Stages of the study and flow chart.
Figure 2.
Kovancilar / Elazig monthly temperature data .
Figure 2.
Kovancilar / Elazig monthly temperature data .
Figure 3.
Residential Floor Plans a) ground floor plan, b) 1st floor plan, c) 2nd floor plan d) roof floor plan.
Figure 3.
Residential Floor Plans a) ground floor plan, b) 1st floor plan, c) 2nd floor plan d) roof floor plan.
Figure 4.
Images of the existing house; a) entrance façade, b) left side elevation.
Figure 4.
Images of the existing house; a) entrance façade, b) left side elevation.
Figure 5.
a) 3D model, b) render image of the sample house.
Figure 5.
a) 3D model, b) render image of the sample house.
Figure 6.
Existing building exterior and interior wall section.
Figure 6.
Existing building exterior and interior wall section.
Figure 7.
Existing Building Energy Performance Analysis a) Revit energy model b) Existing residential fuel use c) Existing residential electricity use.
Figure 7.
Existing Building Energy Performance Analysis a) Revit energy model b) Existing residential fuel use c) Existing residential electricity use.
Figure 8.
Parameters and combination simulations.
Figure 8.
Parameters and combination simulations.
Table 1.
Thermal permeability coefficients of building components.
Table 1.
Thermal permeability coefficients of building components.
| Component |
Material |
Measurement |
Unit |
Thermal Permeability Coefficient (U) |
| Outer wall |
Brick + Plaster + Paint |
36 |
cm |
1,58 |
| Interior wall |
Brick + Plaster + Paint |
21 |
cm |
2,33 |
| Roof |
Metal |
0,5 |
cm |
0,70 |
| Floor |
Reinforced concrete + leveling + Parquet |
23 |
cm |
2,48 |
| Window |
single glass / double glazing |
4/4+12+4 |
cm |
3,13 / 6,70 / 2,86 |
Table 2.
Expenditure costs.
Table 2.
Expenditure costs.
| Explanation |
Unit |
Amount |
Unit price (TL) |
Cost
(Year) (TL) |
Cost
(Lifetime) (TL) |
| Fuel (Natural Gas) |
MJ |
241,021.00 |
0.04 |
9,640.84 |
271,582.46 |
| Electric |
kWh |
26,147.00 |
0.91 |
23,793.77 |
670,270.00 |
Table 3.
U-values of the exterior and interior walls of the building according to the wall materials.
Table 3.
U-values of the exterior and interior walls of the building according to the wall materials.
Table 4.
Energy analysis results according to wall materials.Table 5. Roof U values according to roofing materials.
Table 4.
Energy analysis results according to wall materials.Table 5. Roof U values according to roofing materials.
Table 5.
Roof U values according to roofing materials.
Table 5.
Roof U values according to roofing materials.
Table 6.
Building energy performance analysis according to roofing materials.
Table 6.
Building energy performance analysis according to roofing materials.
Table 7.
Wall U values according to thermal insulation materials.
Table 7.
Wall U values according to thermal insulation materials.
Table 8.
Energy analysis results according to thermal insulation materials.
Table 8.
Energy analysis results according to thermal insulation materials.
Table 9.
Window U and HCG values according to Glass Materials.
Table 9.
Window U and HCG values according to Glass Materials.
| |
Available Glass |
Low-E Double Glazing |
Uncoated Double Glazing |
Triple Glazing |
| U Value |
3.13/6.70/2,86 |
2.10 |
1.99 |
1.53 |
| SHGC |
0.21/0.19/0.76 |
0.24 |
0.62 |
0.68 |
Table 10.
Energy analysis results by glass materials.
Table 10.
Energy analysis results by glass materials.
Table 11.
Energy analysis results according to the LPD value of the lighting system.
Table 11.
Energy analysis results according to the LPD value of the lighting system.
Table 12.
Annual electricity and energy consumption by PV panel status a) electricity b) energy.
Table 12.
Annual electricity and energy consumption by PV panel status a) electricity b) energy.
Table 13.
Wall materials available and alternative scenario analysis results.
Table 13.
Wall materials available and alternative scenario analysis results.
| wall material |
Annual fuel consumption (MJ) |
Annual electricity consumption (kWh) |
Annual energy cost (TL) |
Life cycle energy cost (TL) |
Energy usage intensity (MJ/m2/year) |
CO2 emissions (Mg) |
| Brick |
241021 |
26147 |
34210 |
465974 |
1320.7 |
12.0 |
| Bimsblok |
194947 |
25484 |
31616 |
430629 |
1129.7 |
9.7 |
| Aerated concrete |
173529 |
25184 |
30417 |
414307 |
1041.1 |
8.7 |
Table 14.
Roof materials available and alternative scenario analysis results.
Table 14.
Roof materials available and alternative scenario analysis results.
| Roofing material |
Annual fuel consumption (MJ) |
Annual electricity consumption (kWh) |
Annual energy cost (TL) |
Life cycle energy cost (TL) |
Energy usage intensity (MJ/m2/year) |
CO2 emissions (Mg) |
| Metal |
241021 |
26147 |
34210 |
465974 |
1320.7 |
12.0 |
| Stone Slab |
240924 |
26144 |
34203 |
465879 |
1320.3 |
12.0 |
| Tile |
240850 |
26137 |
34194 |
465755 |
1319.9 |
12.0 |
| Shingle |
240674 |
26136 |
34186 |
465638 |
1319.2 |
12.0 |
| Wood |
239693 |
26110 |
34120 |
464739 |
1314.9 |
12.0 |
Table 15.
Heat insulation materials available and alternative scenario analysis results.
Table 15.
Heat insulation materials available and alternative scenario analysis results.
| heat insulation material |
Heat insulation material thickness |
Annual fuel consumption (MJ) |
Annual electricity consumption (kWh) |
Annual energy cost (TL) |
Life cycle energy cost (TL) |
Energy usage intensity (MJ/m2/year) |
CO2 emissions (Mg) |
| non-insulated |
X |
241021 |
26147 |
34210 |
465974 |
1320.7 |
12.0 |
| Rock wool |
6 cm |
184021 |
25152 |
30842 |
420086 |
1088.2 |
9.2 |
| 8 cm |
178321 |
25016 |
30472 |
415045 |
1067.5 |
8.9 |
| Glass wool |
6 cm |
182877 |
25139 |
30780 |
419251 |
1083.5 |
9.1 |
| 8 cm |
177287 |
25005 |
30416 |
414294 |
1063.2 |
8.8 |
| EPS |
6 cm |
181051 |
25118 |
30683 |
417921 |
1075.9 |
9.0 |
| 8 cm |
175654 |
24987 |
30330 |
413111 |
1056.5 |
8.8 |
| XPS |
6 cm |
179000 |
25097 |
30579 |
416502 |
1067.9 |
8.9 |
| 8 cm |
173911 |
24968 |
30237 |
411850 |
1049.3 |
8.7 |
Table 16.
Existing glass materials and alternative scenario analysis results.
Table 16.
Existing glass materials and alternative scenario analysis results.
| Roofing material |
Annual fuel consumption (MJ) |
Annual electricity consumption (kWh) |
Annual energy cost (TL) |
Life cycle energy cost (TL) |
Energy usage intensity (MJ/m2/year) |
CO2 emissions (Mg) |
| P1 |
241021 |
26147 |
34210 |
465974 |
1320.7 |
12.0 |
| P2 |
217711 |
26309 |
33551 |
454266 |
1231.1 |
10.9 |
| P3 |
182694 |
28212 |
33568 |
457225 |
1120.1 |
9.1 |
| P4 |
172557 |
28674 |
33551 |
456991 |
1086.8 |
8.6 |
Table 17.
Results of LPD values available and alternative scenario analysis.
Table 17.
Results of LPD values available and alternative scenario analysis.
| LPD |
Annual fuel consumption (MJ) |
Annual electricity consumption (kWh) |
Annual energy cost (TL) (TL) |
Life cycle energy cost (TL) |
Energy usage intensity (MJ/m2/year) |
CO2 emissions (Mg) |
| Current Situation |
241021 |
26147 |
34210 |
465974 |
1320.7 |
12.0 |
|
(-) %20--8.61 W/m²
|
246960 |
24021 |
32532 |
443121 |
1313.9 |
12.3 |
|
(-) %40---6.46 W/m²
|
252968 |
21897 |
30860 |
420341 |
1307.5 |
12.6 |
|
(-) %60---4.31 W/m²
|
259042 |
19737 |
29156 |
397138 |
1300.8 |
12.9 |
|
(-) %80---2.15 W/m²
|
265150 |
17622 |
27495 |
374521 |
1294.8 |
13.2 |
| (-) %100---0 W/m² |
271300 |
15452 |
25787 |
351255 |
1288.3 |
13.5 |
|
(+) %20---12.92 W/m²
|
235123 |
28279 |
35896 |
488928 |
1327.7 |
11.7 |
|
(+) %40---15.07 W/m²
|
229301 |
30413 |
37586 |
511952 |
1335.0 |
11.4 |
|
(+) %60---17.22 W/m²
|
223569 |
32551 |
39284 |
535077 |
1342.8 |
11.1 |
|
(+) %80---19.38 W/m²
|
217882 |
34692 |
40987 |
558266 |
1350.7 |
10.9 |
|
(+) %100---21.53 W/m²
|
212238 |
36838 |
42695 |
581533 |
1358.9 |
10.6 |
|
(+) %150---26.91 W/m²
|
198273 |
42217 |
46987 |
639987 |
1380.2 |
9.9 |
|
(+9 %200---32.29 W/m²
|
184768 |
47613 |
51313 |
698910 |
1403.5 |
9.2 |
|
(+) %300---43.06 W/m²
|
159498 |
58457 |
60089 |
818437 |
1457.8 |
8.0 |
|
(+) %400---53.82 W/m²
|
136434
|
69428
|
69076
|
940832
|
1522.6
|
6.8
|
Table 18.
Energy analysis results of the existing building, all parameters, and the alternative scenario created.
Table 18.
Energy analysis results of the existing building, all parameters, and the alternative scenario created.
| Parameter |
Annual fuel consumption (MJ) |
Annual electricity consumption (kWh) |
Annual energy cost (TL) |
Life cycle energy cost (TL) |
Energy usage intensity (MJ/m2/year) |
CO2 emissions (Mg) |
| Current residence |
241021 |
26147 |
34210 |
465974 |
1320.7 |
12.0 |
| Optimal alternative scenario |
92287 |
11016 |
13715 |
186798 |
519.4 |
4.6 |
Table 19.
Quantity, material + labor price, and total cost of selected renovation works.
Table 19.
Quantity, material + labor price, and total cost of selected renovation works.
| Strengthening method |
Unit |
Amount |
Material + labor price |
Total cost |
| Wall |
wall demolition |
m² |
558 |
20 TL |
11.160,00 TL |
| masonry |
m² |
558 |
80 TL |
44.640,00 TL |
| Gypsum plaster + paint |
m² |
690 |
26 TL |
17.940,00 TL |
| Rough plaster + paint |
m² |
320 |
82 TL |
26.240,00 TL |
| Total (Wall) |
99.980,00 TL |
| Roof |
roof removal |
m² |
153 |
32 TL |
4.900,00 TL |
| roof installation |
m² |
153 |
150 TL |
22.950,00 TL |
| Total (Roof) |
27.850,00 TL |
| Window |
window removal |
m² |
55 |
14.5 TL |
800,00 TL |
| window suit |
m² |
55 |
310 TL |
17.050,00 TL |
| Total (Window) |
17.850,00 TL |
| Thermal insulation |
m² |
320 |
92 TL |
29.440,00 TL |
| Lighting |
piece |
56 |
50 TL |
2.800,00 TL |
| photovoltaic panel |
m² |
88 |
1104 TL |
97.130,00 TL |
| Total of All Manufacturing (excluding taxes) |
275.050,00 TL |
|
Disclaimer/Publisher’s Note: The statements, opinions and data contained in all publications are solely those of the individual author(s) and contributor(s) and not of MDPI and/or the editor(s). MDPI and/or the editor(s) disclaim responsibility for any injury to people or property resulting from any ideas, methods, instructions or products referred to in the content. |
© 2023 by the authors. Licensee MDPI, Basel, Switzerland. This article is an open access article distributed under the terms and conditions of the Creative Commons Attribution (CC BY) license (http://creativecommons.org/licenses/by/4.0/).

