Submitted:
21 July 2023
Posted:
24 July 2023
You are already at the latest version
Abstract
Social media platforms are increasingly enabling the propagation of content from groups related to drug use, thus posing risks for the wider population and, in particular, individuals who are amenable to drug use and drug addiction. The detection of drug use content on social media platforms is a priority for governments, technology companies, and drug law enforcement organizations. To counter this issue, various techniques have been developed to identify and promptly remove drug use content, while also blocking its creators from network access. In this paper, we introduce a manually annotated Twitter dataset, comprising 156,521 tweets published between 2008 and 2022, specifically compiled for the purpose of drug use detection. The dataset underwent annotation by several group of expert annotators who classified the tweets as either drug use or non-drug use. Exploratory data analysis was conducted to comprehend the dataset's characteristics. Various classification algorithms, including SVM, XGBoost, RF, NB, LSTM, and BERT were employed using the dataset. Among the traditional machine learning models, SVM utilizing term frequency-inverse document frequency features achieved the highest F1-Score (0.9017). However, BERT with textual features concatenated with numerical and categorical features in ensemble method surpassed the performance of traditional models, attaining F1-Score of 0.9112. To facilitate future research and enhance English online drug use classification accuracy, the dataset will be made publicly available.
Keywords:
deep learning
; transformer
; drug use detection
; exploratory data analysis
; natural language processing.
1. Introduction
Social media platforms, also known as online social networks (OSNs), have enabled social interactions and communication to take place remotely and instantaneously at the global level. However, along with their strengths, social media platforms suffer from disadvantages [1]. As of first quarter of 2023, the number of social media users amounted to approximately 4.8 billion, with 150 millions of these being new users who gained online access only in the previous 12 months. The main social media platforms of the present day are Twitter, YouTube, and Facebook; together, these technology companies are used by nearly 60% of the global population for an average daily use time of 2 hours and 24 minutes [2]. Evidently, these social media networks have become integrated remarkably closely into people’s lives, often offering diverse benefits. Nevertheless, the large user bases that social media networks are currently accommodating has given rise to obstacles in terms of monitoring user-generated content, all the while retaining a competitive edge and innovating to keep users engaged.
The fact that social media networks create opportunities for illicit or illegal activities has been well-documented in the literature and elsewhere. For example, certain social media users use the functionality of these platforms (e.g., direct messaging on Twitter) to engage in criminal acts, such as drug use or drug trafficking. Also, it has been widely reported that a strong and positive correlation exists between excessive social media use and drug addiction in adolescents [3]. Other findings indicate that the availability of alcohol-related content in social media, particularly when shared and posted among young people and adolescents, can increase a mean ability to drug use, as well as drug addiction and drug use. As a reflection of these trends, Saudi Arabia’s General Directorate of Narcotics Control (GDNC) was reported to have arrested and charged eight social media users after they were found using OSNs to smuggle drugs. Notably, each of the social media users was a male aged 30-39 years living across Saudi Arabia, and between themselves, they were operating seven Twitter accounts and exploiting female profiles to attract and trap younger men [4].
Both the World Health Organization (WHO) and the United Nations Office on Drugs and Crime (UNODC) have constitutional authorizations to address problems related to drug use and dependence. At the core of WHO’s contribution to drug demand reduction are its activities in the prevention of drug use and the treatment of drug use disorders by collecting, analyzing and disseminating evidence-based policy in primary prevention, early intervention, treatment and rehabilitation, as well as by supporting efforts in monitoring and providing relevant information and technical support to reduce the burden of drug use at all levels [5]. In Saudi Arabia, the activities of the GDNC are not limited to physical space; that is to say, in addition to combatting the illegal narcotics trade as it takes place between real-world actors, there are also counter-drug initiatives that extend into the virtual world. Almost immediately after the emergence of social media platforms, it is notable that these platforms were exploited by actors in the illegal narcotics trade to engage and interact with members of the younger generation [1]. All these efforts are reflective of the significance of the proposed research, where its purpose is to examine the use of machine learning (ML) and natural language processing (NLP) techniques to promote the accurate detection of drug use content and influential users on social media platforms [6]. Although a satisfactory artificial intelligence (AI) application has been designed that leverages machine learning (ML) techniques to achieve this goal, as shown in Section 2’s literature review, the complexity of the problem is known widely, and various researchers have sought to develop knowledge in this field.
In January 2023, the total number of active Twitter users was recorded at 556 millions [7], establishing it as a significant data source for researchers. Twitter serves as a real-time public platform utilized by individuals from diverse social backgrounds, encompassing regular users, celebrities, and international organizations. Starting from November 2017, Twitter users have had the ability to share brief 280-character text messages known as tweets, which can be engaged with by other users. Detecting drug use on Twitter poses a challenge due to the concise nature of these text messages, as it becomes arduous to establish contextual meaning from short sentences.
Upon reviewing existing scientific resources [8,9,10,11,12,13,14,15,16], it becomes evident that there are relatively few publicly available datasets specifically designed for studying the dissemination of drug use on Twitter. Most datasets are available from diverse sources, including open government datasets, surveys, and medical reports from healthcare organizations. As of now, a limited number of datasets from Twitter have been released. In 2017, two datasets comprising 267,215 and 688,757 posts respectively, focusing on drug-related activities, were made available [17,18]. Additionally, Lokala et al. published a dataset in 2021 containing 9888 annotated tweets related to cannabis and depression lexicon [19]. As well as, in 2020, a dataset was published by [20] consisting of tweets gathered using 157 keywords associated with drug use. However, the extensive use of these keywords led to the inclusion of a significant amount of noisy and unrelated content, including jokes, sarcasm, and news articles. Out of the dataset's 3,696,150 rows, only 2661 tweets were manually labeled. To enhance the dataset and improve the accuracy of the CNN-based classifier, the authors employed synthetic data generation techniques. It is worth noting that synthetic data might not capture the natural language patterns and diverse expressions found in real tweets. Based on our analysis, there is a scarcity of datasets suitable for studying online drug use detection. Furthermore, some of the existing datasets are incomplete and biased due to unclear or low-quality annotation processes. Therefore, it is crucial to acquire and annotate additional data to ensure the continuous progress of research on online drug use.
In the context of classification between drug use content and non-drug use content, machine learning techniques have demonstrated high effectiveness. Several widely used methods in this regard include random forest (RF), support vector machines (SVM), and long short-term memory (LSTM) networks. These approaches are trained using various features such as tweet text, user profile, and timestamp. While these methods have achieved moderate success, accurately identifying drug use tweets with up to 85% accuracy, they still have a significant margin of error that limits practical application. This study makes significant contributions, which are as follows:
Creation of a new dataset for detecting online drug use in the English language. This dataset comprises 112,057 labelled tweets and underwent expert annotation and validation using different techniques to ensure data quality. Conducting exploratory data analysis to gain insights into and visualize the proposed online drug use dataset. Presenting different classification models for online drug use detection. To enhance accuracy, N-gram features and various feature sets were evaluated.
The remainder of this paper is organized as follows: Section 2 provides an overview of related work, including existing datasets. Section 3 presents the proposed methodology for detecting drug use content. Section 4 explains the implementation setup for evaluating the proposed method, while Section 6 concludes the paper, discussing potential avenues for future research.
2. Related Work
In recent years, interdisciplinary experts, including those from computer science, social science, and psychology, have come together to address the issue of online misbehavior by leveraging artificial intelligence technology. There has been a growing focus on the research area dedicated to the development of systems aimed at detecting drug use and associated behaviors particularly in the context of social media networks. This section presents the outcomes of a literature review focusing on the automatic detection and classification of drug use on social media platforms.
Multidisciplinary research in the field of online drug use detection has primarily focused on analyzing online drug use processes [21,22], studying the spread of addiction online [23], and developing systems for automatic detection of drug use content and related events [24]. Researchers have employed both traditional machine learning techniques and deep learning techniques to detect drug use on social media platforms. Notably, Support Vector Machine (SVM), Random Forest (RF), and Long Short-Term Memory (LSTM) are the most commonly implemented algorithms. SVM achieved accuracy rates exceeding 90% in studies such as [25,26], while RF outperformed SVM in terms of F-measure in [27,28]. Deep learning techniques, specifically Convolutional Neural Networks (CNN) partially utilized in [24], and Recurrent Neural Networks (RNN) proposed in [23], have also demonstrated promising results. LSTM networks have been utilized to develop systems for detecting drug use content on social media, alongside techniques such as SVM, RF, and BERT [28], achieving a precision rate of 85%.
Machine learning techniques, particularly those leveraging textual features, have gained popularity in recent years. Textual features, involving techniques like Term Frequency-Inverse Document Frequency (TF-IDF), N-gram, Part-Of-Speech (POS), and Bag-Of-Words (BOW), were primarily used in classification tasks. Most prior studies on drug use detection have examined a restricted number of feature types that affected the accuracy rates in online drug use detection, such as textual [6,21,24,25,26,29,30,31,32,33,34] or contextual/categorical features [35,36,37], as shown in Table 1 (with the associated performance metrices). In the research undertaken by Nasralah et al. [21] the authors employed various drug use terms related to opioids as textual features in the evaluation matrix. The terms were adapted from an opioid ontology, leading to the acquisition of substantial quality data that produced the highest accuracy rates of up to 96% in online drug use detection (which, to the best of our knowledge, is the most accurate system proposed to date), but the rate of false positives was high. Moreover, this study encountered manual work limitations due to the inherent nature of the ontology employed, rendering it non-automated and incompatible with accepting new rules. Moreover, the authors in [27] used personal attributes and Social Network Analysis (SNA) measures, such as degree centrality, betweenness centrality, and clustering coefficient, to describe the co-offender network and the individual network. However, they didn’t provide any quantitative or qualitative evaluation of the validity or reliability of the SNA measures.
Features and different combinations of features perform a key function in creating a successful detection system for drug use in text content. It can be a substantial obstacle to identify the optimal features in a classification problem. One of the reasons for this is because there are different types of features, along with opportunities to use varying degrees of complexity. Therefore, it is clear that there are opportunities for further developments, and the purpose of this research is to introduce refinements in terms of data quality that maximize the framework’s applicability and the performance of the machine learning model. In this research, to be specific, an innovative machine learning model that uses multi-level features (here, text/NLP features, numerical features, and categorical features) is proposed to account for the current gap, where up to this point, lexicon-based and categorical features are considered exclusively. However, to the best of our knowledge, no comparative study in the literature has identified the features and classification models that exhibit superior accuracy over others.
3. Methodology
The proposed drug use detection module's architecture comprises four parts depicted in Figure 1. This section explains the structure. The initial part involves gathering data from Twitter via the Twitter API. Subsequent to this, standard NLP preprocessing techniques are performed. Thereafter, the tweets are manually labelled as either drug use or non-drug use.
To gain a better understanding of the dataset, exploratory data analysis (EDA) is conducted in this study. Various traditional machine learning models with different NLP features are then used to evaluate the dataset. Additionally, the dataset is evaluated using the bidirectional encoder representations from transformers (BERT) deep learning model. The performance of the model is assessed using metrics such as accuracy, F1-score, precision, recall ,and area under the receiver operating characteristic curve (AUC).
The key stages of our module, which include data collection and preparation, feature extraction, exploratory data analysis (EDA), and predictive model development, are outlined in the following subsections.
3.1. Data Collection and Preparation
The methodology utilized to collect and create the corpus is illustrated in Figure 2. This approach consists of three main phases: corpus collection, corpus cleaning, and data annotation, which are explained in depth in the following subsections.
3.1.1. Corpus Collection
In the first quarter of 2023, Twitter had an average of 436 million monthly active users, resulting in approximately 500 million tweets published daily, each limited to 280 characters [42]. While Twitter allows researchers to access its public data through the Twitter API, there are some restrictions. Due to the limited availability of online drug use datasets, we gathered new data from Twitter using the API. The collected data contained the text of tweets and user information such as username, location, number of friends, followers, likes, and user description. We compiled a list of search terms based on popular Twitter topics in the world to aid in data collection.
3.1.2. Corpus Cleaning
Prior to annotation, it is necessary to perform a cleaning step on the corpus to prepare the tweets for further processing. This step involved eliminating duplicate and empty tweets, as well as excluding non-English tweets and tweets that are less than 10 words. As a result, the total number of tweets was reduced to roughly 150,000.
3.1.3. Data Preprocessing
Text preprocessing is a critical step in text processing as it helps to transform a sequence of characters into a more structured and meaningful format that can be further analyzed. This can include words, sentences, and paragraphs. To prepare text data for machine learning algorithms, various preprocessing techniques are used to improve the quality of the data. The NLTK library [43] in Python provides a comprehensive set of text preprocessing techniques, including removing emojis and mentions, cleaning up punctuation and white spaces, converting text to lowercase, removing stop words. The tokenization is performed using regular expressions, based on the Penn Treebank tagset. The Part-Of-Speech tagging is done using the Penn Treebank tagset, and tweets are tokenized into sentences and words. Additionally, lemmatization is performed to reduce words to their valid base form. These preprocessing steps help to remove noise from the text data and make it more suitable for use in natural language processing algorithms.
3.1.4. Manual Annotation
Annotation is a crucial because it directly influences model accuracy that involves assigning labels or tags to text data for various purposes such as information retrieval, sentiment analysis, and text classification. Although manual annotation can be time-consuming and labor-intensive, it offers high-quality data that can be used to improve the accuracy of machine learning models compared to automated annotation. In addition, manual annotation allows for the incorporation of human expertise and context, which can be difficult to capture through automated methods. In the context of drug use classification, annotation is very subjective and plays a vital role in identifying and categorizing tweets based on specific criteria. To classify a tweet as drug use or non-drug use, certain traits such as using, smuggling, promoting, encouraging, selling, or buying any kind of illicit drugs should be present. If a tweet does not contain any of these practices, it should be classified as non-drug use, even if it contains themes related to religion, politics, ethnicity, or social issues, or if its topic is unrelated to drug use such as sports or fashion. By using annotation to classify tweets, researchers and practitioners can better understand drug use patterns and develop effective prevention and intervention strategies.
In our study, we utilized two quality filters to ensure the accuracy of our results. The first filter involves an annotator working alongside a validator. The second filter serves as an evaluator. We took great care to minimize any potential biases by establishing clear guidelines and validating our findings using various techniques.
3.1.5. Feature Extraction
Our proposed system operates on tweets in the form of vectors prior to classification, which allows the classification models to carry out statistical operations. The first step involves implementing an NLP pre-processing technique, which includes tasks such as stop word removal, lowercasing, tokenization, and lemmatization to obtain unigrams. Various feature extraction techniques were utilized in this study to generate feature vectors:
- N-grams: These are fundamental elements in detection problems, where a sequence of n words can be denoted as a unigram (single word), bigram (two words), trigram (three words), and so on, depending on the value of n.
- BERT (Bidirectional Encoder Representations from Transformers): BERT is a vectorization method that generates high-quality vector representations of words or sentences. When used for vectorization, BERT takes in a text input and generates a fixed-size vector representation of the input that can be used for downstream tasks such as text classification or sentiment analysis. BERT embeddings have been shown to outperform traditional methods like TF-IDF and word2vec in a variety of natural language processing tasks.
- Sentiment Analysis: Flair sentiment analysis is a powerful tool for analyzing the sentiment of text data and can be useful in a wide range of applications, from social media monitoring to customer feedback analysis. We used a famous flair model to classify the sentiment , it's known for its good accuracy on general and specific domains.
- NER (Named Entity Recognition): NER is a natural language processing (NLP) task that involves identifying and classifying named entities in a text. Named entities are typically proper nouns that refer to specific people, places, organizations, dates, times, or other types of entities.
- POS (Part of Speech): POS refers to the grammatical category to which a word belongs based on its function and its relationship with other words in a sentence. There are eight main parts of speech in English: noun, pronoun, adjective, verb, adverb, preposition, conjunction, and interjection. Each part of speech has its own set of rules and characteristics that dictate how it can be used in a sentence. By understanding the different parts of speech, one can improve their ability to communicate effectively and accurately in written and spoken language.
3.2. Exploratory Data Analysis (EDA)
Exploratory Data Analysis (EDA) is a valuable technique employed to delve into datasets with the aim of extracting useful and actionable information, identifying relationships among explanatory variables, detecting errors, and making preliminary model selections. By utilizing descriptive statistics and graphical tools, EDA facilitates the development of a comprehensive understanding of the data [44]. Its primary objective is to maximize insights into the dataset, identify outliers and anomalies, and validate underlying assumptions [45]. In the context of this study, EDA was conducted using graphical methods to provide visual and diagrammatic summaries of the data. For univariate analysis, we examined one variable at a time, utilizing techniques such as histograms, boxplots, or pie charts for categorical data. In the case of multivariate analysis, we employed graphical methods to explore relationships among two or more variables. Specifically, correlation analysis was employed as a technique to measure the overall correlation between two or more numerical variables. In Section E, we elaborate on how categorical and numerical features were explored and visualized using various Python libraries, including the Plotly Python graphing library, NumPy, and pandas. By employing EDA, we gained detailed insights into the dataset, acquiring meaningful information about its characteristics and properties.
3.3. Classification Models
3.3.1. Baseline Models
There exists a plethora of classification models, and their efficacy is contingent on the problem domain. It is of paramount importance to select the appropriate model for constructing a resilient detection system. In the context of our problem, we assessed the following algorithms:
-
SVM (Support Vector Machine)The SVM is a supervised learning model that distinguishes between two distinct classes within a high-dimensional space. This model boasts several advantages, including high speed, scalability, and the ability to identify intrusions in real-time and update training patterns dynamically. There are also variations of SVM such as kernel SVM, which allows the hyperplane to be non-linear, and nu-SVM, which allows for more flexibility in controlling the number of support vectors.
-
XGBoost (eXtreme Gradient Boosting)XGBoost is a popular and powerful machine learning algorithm used for supervised learning tasks such as regression, classification, and ranking problems. It is an implementation of the gradient boosting decision tree algorithm. Moreover, it is particularly effective when working with large datasets, and can handle missing values and noisy data. Some of the key features of XGBoost include: regularization techniques to prevent overfitting and improve generalization performance and ability to handle both sparse and dense data.
-
RF (Random Forest)The RF is an ensemble learning method that combines multiple decision trees and uses their collective output to make predictions. The name "random" forest comes from the fact that the algorithm creates a forest of decision trees, where each tree is constructed using a random subset of the training data and a random subset of the features. The general idea behind Random Forest is to use the diversity of the trees in the forest to reduce overfitting, which is a common problem in decision tree algorithms, the classifier achieves high prediction accuracy.
-
NB (Naive Bayes)NB is a classification algorithm that is based on Bayes' theorem. Despite its simplification, Naive Bayes is a powerful and popular algorithm, especially in natural language processing and text classification tasks. The Naive Bayes algorithm is relatively fast and can handle high-dimensional data with ease. However, it may not perform as well as more complex algorithms when the independence assumption is not met, or when the data has a lot of noise or missing values.
-
LSTM (Long Short-Term Memory)LSTM stands for Long Short-Term Memory, which is a type of recurrent neural network (RNN) architecture that was introduced to overcome the problem of vanishing gradients in traditional RNNs. LSTM networks have been widely used for sequence modeling tasks, such as speech recognition, natural language processing, and time series prediction. They are particularly useful when dealing with long-term dependencies in sequential data, where traditional RNNs struggle due to the vanishing gradient problem.
-
BERT (Bidirectional Encoder Representations from Transformers)BERT model is a deep learning model for natural language processing (NLP) tasks. It is a transformer-based model that uses a technique called self-attention to capture the context of a given word or phrase within a sentence or document. BERT is pre-trained on large amounts of text data using a masked language modeling (MLM) task and a next sentence prediction (NSP) task, which allows it to learn the relationships between words and phrases in a given text. BERT has achieved state-of-the-art performance in many NLP tasks and has become a standard model for natural language processing. Its ability to generate highly informative embeddings of text has made it a popular choice for a wide range of applications in industry and academia.
3.3.2. Ensemble Method
We propose a model for classifying drug-related text samples. The model follows the following flow:
- Tokenization: The input texts are tokenized using the BERT (Bidirectional Encoder Representations from Transformers) tokenizer. This step breaks down the texts into smaller units called tokens, which are later used as input for the BERT model.
- BERT Model: The tokenized texts are passed through the BERT model. BERT is a pre-trained language model that captures contextual information from the input text. It encodes the tokens by considering their surrounding context, which helps in understanding the meaning of the text.
- Dropout Layer: The output from the BERT model is passed through a dropout layer. Dropout is a regularization technique that randomly deactivates some of the neural network units during training. This helps prevent overfitting by reducing the reliance on specific features.
- Feature FC Layer: The additional features associated with the text samples are processed through a fully connected (FC) layer. This layer applies linear transformations to the feature tensor to extract relevant information.
- Concatenation: The outputs from the BERT model and the feature FC layer are concatenated. This merging of information allows the model to incorporate both the contextualized representations from BERT and the additional features.
- Ensemble FC Layer: The concatenated output is passed through another FC layer specifically designed for the ensemble. This layer further processes the concatenated information, enabling the model to capture complex relationships between the BERT output, categorical and numerical features.
- Sigmoid Activation: Finally, a sigmoid activation function is applied to the output of the ensemble FC layer. This activation function maps the value to a probability between 0 and 1, indicating the likelihood of the input text being drug-related or not.
Inputs to the model include a list of text samples and a tensor of categorical and numerical features. The model output is a probability value between 0 and 1, which serves as an indication of the likelihood of the input text being drug-related. The structure of this proposed model is shown in Figure 3.
3.4. Performance Evaluation
The classifier's performance was assessed using various performance metrics. The most commonly used and straightforward metric is accuracy.
It takes into account the number of correctly classified tweets that are either drug use (TP) or non-drug use (TN) as well as the number of falsely classified drug use (FN) and non-drug use (FP) tweets.
Another performance metric is precision, which is calculated by dividing the number of true positives by the total number of tweets identified as positive.
Recall is defined as the ratio of correctly classified positives to total positives. In our study, recall serves as a measure of the proportion of drug use tweets detected.
To balance the trade-off between recall (false negatives) and precision (false positives), we use the F1-measure, which is a weighted average of both recall and precision. This metric is commonly used for evaluating classification performance as it combines both precision and recall into a single value.
Additionally, we obtain the receiver operating characteristic curve by plotting the true positive rate versus the false positive rate. The AUC measure, which ranges between zero and one, typically exceeds 0.5.
Lastly, a confusion matrix was derived which is a commonly used evaluation metric in classification tasks. It allows visualization of the performance of a classification model by displaying the counts of true positive (TP), true negative (TN), false positive (FP), and false negative (FN) predictions.
4. Experiments
The implementation of the framework involved three main stages. Firstly, data collection and data preparation were carried out. Secondly, manual data annotation was conducted. Lastly, classification models were developed and evaluated using the newly proposed dataset.
4.1. Data Collection
Once we registered as developers on the Twitter developer platform, we were able to access user status data containing over 28 attributes. To collect real-time tweet data, we utilized both the Twitter Streaming API and Search API. By applying specific filters, such as keywords the English language, we gathered a substantial amount of data. The collected tweets spanned from October 2008 to May 2022, resulting in a dataset of 156,521 tweets along with their associated metadata. To collect relevant tweets from public Twitter profiles, we conducted searches using English search terms, with a particular emphasis on formal, slang terms and names used to deceive. Our query included a specific list of search terms, such as cocaine, arak, codeine, drunk, weed, opium, to target and gather the desired tweets.
4.1.1. Data Cleaning
Prior to labeling the dataset, we performed data cleaning procedures to ensure its quality. This involved removing empty tweets and tweets with fewer than ten words. Additionally, non-English tweets were eliminated. Following the data cleaning process, the dataset was refined to contain 150,000 tweets.
4.1.2. Data Preprocessing
After conducting an initial examination of the dataset, we identified several crucial steps to perform as a preliminary stage:
- Map the target classes to "drug use" and "non-drug use".
- Introduce a new feature that captures the length and word count of each tweet text.
- Remove irrelevant columns such as ConversationId, Coordinates, Tcooutlinks, etc.
- Check for any missing values in the dataset.
- Remove of all tweets less than 10 words.
- Removal of all emojis and mentions.
- Removal of all whitespaces and cleaning punctuation.
- Splitting attached words: after removal of punctuation or white spaces, words can be attached. This happens especially when deleting the periods at the end of the sentences. The corpus might look like: “I need another drugdealer show”. So, there is a need to split “drugdealer” into two separate words.
- Convert the text to lowercase and remove stop words: stop words are basically a set of commonly used words in any language. By removing the words that are very commonly used in each language, we can focus only on the important words instead, and improve the accuracy of the text processing.
- Lemmatization for all words to reduce inflectional word forms to linguistically valid lemmas.
- Removing short words, where the length of the word less than 3 characters.
- Tokenize the text and pull out only the verbs, nouns and adjectives with using the part of speech tagging (POS_tag) with using python Natural Language Toolkit (NLTK) library.
- Stemming — reducing words to their root form.
By implementing these steps, we ensure the dataset was appropriately formatted, relevant features were extracted, and any inconsistencies or redundancies were resolved.
4.1.3. Data Annotation
As explained in Section 3, manual annotation is considered to be more dependable and precise compared to automatic annotation methods. Hence, for this study, we adopted the data annotation technique employed by Wosom [46]. Wosom is specifically designed to facilitate data annotation and offers support for annotating various types of data, including text, audio, images, and videos, among others. By utilizing this technique, we ensured accurate and reliable annotation of the data.
The annotation process involved the meticulous efforts of several groups of dedicated annotators (about 30 members) who spent six months to assign the appropriate labels to each tweet. To maintain the quality and consistency of the annotations, a validation system was implemented at specific predetermined intervals. This system introduced a second validation layer after every 10,000 tweets, providing additional quality control throughout the annotation process.
This collaborative approach, encompassing both annotators and validators, culminated in the creation of a comprehensive and accurately labeled dataset. The resulting dataset promises to serve as a valuable resource for future research and analysis in the field of social media and drug use, offering insights and facilitating a deeper understanding of the subject matter. Our dataset will be made publicly available on Kaggle.
4.1.4. Feature Extraction
To prepare the text data for further analysis, a series of NLP pre-processing steps were conducted. This included lemmatization, stop word removal, and tokenization. Additionally, to generate word vectors, diverse feature extraction techniques were employed. These techniques encompassed the utilization of unigrams, bigrams, and trigrams, in combination with BERT and Sentiment methodologies. The application of these techniques allowed for effective representation of the text data in vector form, facilitating subsequent analysis and modeling tasks.
4.2. Exploratory Data Analysis (EDA)
4.2.1. Metadata Analysis
To uncover important features, we conducted a thorough analysis of the tweet metadata. Within the drug use dataset, we found a total of 112,057 tweets originating from 90,621 unique users. Figure 4 provides an overview of the dataset, showcasing the percentage of drug use and non-drug use tweets identified. Out of the total tweets, 48,080 (43%) were classified as drug use, while 63,977 tweets (57%) were labeled as non-drug use.
In order to assess the balance of the dataset, we applied Shannon's entropy measure, resulting in a value of 0.985. This entropy measure indicates that the dataset is well balanced, reflecting a relatively even distribution between drug use and non-drug use tweets. By examining these statistics and utilizing Shannon's entropy, we gained valuable insights into the composition and balance of the dataset, providing a foundation for further analysis and model development.
In our analysis, we conducted a thorough examination of the correlations among numerical variables to identify any existing relationships. Figure 5 demonstrates a robust correlation between retweet count, and like count, indicating that these variables are closely interconnected. Furthermore, we discovered a discernible relationship between quote count and like count, suggesting a potential association between these two variables.
Based on these correlations, we can leverage this information to construct new features that could enhance our analysis. For instance, we can consider developing features such as retweet/like distribution and quote/like distribution, which can provide valuable insights into the distribution patterns and interactions between these variables.
4.2.2. NLP Analysis
For a comprehensive analysis of the English language online drug use dataset, we conducted an in-depth investigation of the top 10 unigrams and bigrams using TF-IDF (Term Frequency-Inverse Document Frequency) after removing English stop words. TF-IDF assigns numerical weights to words, reflecting their importance within a specific document compared to a corpus of documents.
Figure 6 and Figure 7 present the highest-ranked unigrams based on TF-IDF for both drug use and non-drug use tweets. Notably, the word "Overdose" was present in both types of tweets, but it appeared more frequently in drug use tweets. Moreover, the most prevalent terms in drug use tweets exhibited a tendency towards names of drugs and the method of using them, distinguishing them from non-drug use tweets.
To further explore the dataset, Figure 8 and Figure 9 illustrate the bigrams ranked by TF-IDF values in drug use and non-drug use tweets, respectively.
By analyzing these linguistic patterns, we gained deeper insights into the characteristics of drug use and non-drug use tweets in the English language online drug use dataset. These findings shed light on the prevalence of certain words and the distinctive language used in drug use discourse compared to non-drug use content.
4.3. Classification Models
4.3.1. Baselines Models
To classify tweets as either drug use or non-drug use, various classification algorithms were employed. The dataset utilized TF-IDF features. All tweets in the dataset were pre-labeled with their respective class labels. Six classifiers were considered for the classification task: SVM, XGBoost, RF, NB, LSTM, and BERT. Each classifier model was trained in a supervised setting using binary labeled tweets, allowing them to learn patterns and make predictions based on the provided class labels.
To perform supervised classification, we divided the dataset into training and test sets. This approach was feasible because the dataset was sufficiently large, allowing us to have an independent test set to assess the models' performance. Adequate data remained available for training and validation purposes. During the process, we fine-tuned the hyperparameters using the validation set. Once optimal results were achieved, we evaluated the actual performance of the models on the test set. We employed six machine learning models, namely SVM, XGBoost, RF, NB, LSTM, and BERT. All experiments were conducted using textual feature set extracted from our Twitter dataset. To determine the most accurate and effective model, we utilized a TF-IDF feature set with N-gram vectorization. In addition, we employed the BERT model, a widely adopted language model that can be fine-tuned for specific natural language processing (NLP) classification tasks.
4.3.2. Ensemble Method
In this section, we introduce our innovative ensemble method with transformer for detecting drug use by integrating multiple kind of features extracted from tweets into one model. Our ensemble model incorporates the outputs of two prediction models: ‘stemmed’ text from tweets and numerical and categorical features such as: ‘replyCount', 'retweetCount', 'likeCount', 'quoteCount', 'outlinks', 'inReplyToUser', 'mentionedUsers', 'hashtags', 'verbs', 'nouns', 'adjectives', 'num_words', 'followers', 'following’.
The proposed model follows a specific flow for classifying drug-related tweets. Firstly, the input texts are tokenized using the BERT tokenizer. Next, the tokenized texts undergo processing by passing through the BERT model, which extracts contextualized representations. To prevent overfitting, a dropout layer is applied to the BERT output. Simultaneously, the categorical and numerical features are fed into a feature fully connected (FC) layer for processing. Subsequently, the outputs from the BERT model and feature FC layer are concatenated. This concatenated output is then passed through the ensemble FC layer, combining the representations from both the text and feature inputs. Finally, a sigmoid activation function is applied to the ensemble output, generating a probability value between 0 and 1. The inputs to the model consist of a list of text samples and a tensor of additional features. The output is a probability value indicating the likelihood of the input text being drug-related or not. The experimental results revealed that the optimal hyperparameters for BERT consisted of a batch size of 64, 5 epochs, and a learning rate of 2e-5. The BERT_Base model employed 12 layers of transformers blocks with a hidden size of 768 and 12 self-attention heads, resulting in approximately 110 million trainable parameters.
4.4. Results
This section presents the performance evaluation results of our models, in terms of correct classification of drug use and non-drug use tweets. Table 2 lists the obtained values for accuracy, F1-score, and AUC. As our dataset was balanced, accuracy, F1-score, and AUC measures are considered optimal for evaluating our models.
For the detection of drug use tweets using traditional machine learning algorithms, Table 2 shows that SVM with TF-IDF features achieved the highest F1-score, and recall score with values of 0.9017, and 0.9225, respectively. Notably, the BERT model with textual features concatenated with numerical and categorical features outperformed the traditional machine learning models and achieved values of 0.9112, 0.9166, and 0.9133 for the F1-score, accuracy, and recall score, respectively.
Table 3 and Table 4 present evidence that the BERT model combined with textual features, concatenated with numerical and categorical features, achieves higher accuracy and outperforms the BERT model that solely utilizes textual features. By incorporating additional numerical and categorical features, the model gains access to complementary information that enhances its understanding and predictive capabilities. This combination enables the model to capture a broader range of contextual cues, resulting in improved accuracy and performance. The inclusion of these diverse features expands the model's ability to make more informed and accurate predictions, thereby demonstrating the advantage of incorporating a wider range of features in the BERT model.
The experimental results revealed that the optimal hyperparameters for BERT consisted of a batch size of 64, 5 epochs, and a learning rate of 2e-5. The BERT_Base model employed 12 layers of transformers blocks with a hidden size of 768 and 12 self-attention heads, resulting in approximately 110 million trainable parameters. Additionally, to reduce training time, we used a GPU from Google Colab for model training.
Through an analysis of the performance of each individual model and the corresponding ensemble model, we observed that our ensemble strategy demonstrates effective results for deep learning models. In most cases, the ensemble model outperforms its individual components across various measures. However, this effect was only sporadically observed for traditional machine learning models. We anticipate that by employing more sophisticated ensemble strategies, deep learning models have the potential to achieve even higher performance levels.
5. Conclusions
The accessibility and widespread use of social media networks have granted drug use individuals, groups, and organizations a convenient platform to attract large audiences, disseminate propaganda, and recruit members. The primary objective of this study was to curate a dataset comprising English language tweets collected from Twitter and employ machine learning algorithms for the automated detection of drug use content. While existing literature has proposed numerous online drug use detection systems, often achieving accuracies around 85%, there remains a shortage of publicly available drug use datasets.
In this research, we present an English Twitter dataset specifically designed for online drug use detection. The dataset comprises 89,816 tweets along with associated metadata. Our analysis consisted of two steps: first, Exploratory Data Analysis (EDA) was conducted to gain insights into the dataset and its features, and second, the classification modeling process was performed, involving the utilization of 6 different classification models. Among the traditional machine learning models, SVM achieved the highest F-score (0.9017) when utilizing TF-IDF features extracted from the tweet content. Notably, the BERT deep learning model with textual features concatenated with numerical and categorical features in ensemble method surpassed the performance of SVM, attaining F1-Score of 0.9112.
This research leverages advancements in Natural Language Processing (NLP) to address a critical social issue and aims to develop tools that researchers and stakeholders can utilize to combat the spread of drug use behavior. Our data collection and pre-processing procedures were carried out systematically, while the annotation process was meticulously performed manually, ensuring a comprehensive understanding of the contextual nuances. This meticulous approach has yielded a highly reliable dataset that is anticipated to serve as a robust foundation for future endeavors, specifically in the rapid and accurate detection of drug use content on social media platforms. Notably, it is imperative to continue constructing similar datasets and making them publicly available to other researchers. This collaborative approach strengthens the digital defenses against criminal ideologies, as well as dangerous individuals and organizations.
Additionally, this research conducted a comparative analysis of various machine learning classification algorithms, alongside a more sophisticated deep learning approach utilizing the BERT model. The results obtained highlight the advantages of the deep learning approach over simpler methods. Experimental evaluation of the classification methods employed metrics such as accuracy and F1-score to assess their effectiveness in detecting drug use content.
It is crucial to emphasize that monitoring drug use tweets and users can establish early warning systems and provide opportunities for predictive and preventive actions against drug use. In future research endeavors, different features and combinations of features will be explored to enhance the performance of our model. The intention behind this study is to serve as a valuable foundation for future investigations, particularly in the development of transformer models for online drug use detection in the English language.
Author Contributions
All authors have read and agreed to the published version of the manuscript.
Funding
The authors would like to thank the Deanship of scientific research in King Saud University for funding and supporting this research through the initiative of the DSR Graduate Students Research Support (GSR).
Conflicts of Interest
The authors declare no conflict of interest.
References
- T. Alsulimani, “Social Media and Drug Smuggling in Saudi Arabia,” Journal of Civil & Legal Sciences, vol. 07, no. 02, 2018. [CrossRef]
- D. Chaffey, “Global social media statistics research summary 2023,” Smart Insights, Jun. 07, 2023.
- R. Prieto Curiel, S. Cresci, C. I. Muntean, and S. R. Bishop, “Crime and its fear in social media,” Palgrave Commun, vol. 6, no. 1, Dec. 2020. [CrossRef]
- M. Al-Otaibi, “8 held for drug dealing through social media,” Saudi Gazetti, Mar. 13, 2018.
- “UNODC/WHO Program on Drug Dependence Treatment and Care,” World Health Organization. https://www.who.int/initiatives/joint-unodc-who-programme-on-drug-dependence-treatment-and-care (accessed Jul. 07, 2023).
- E. Bigeard, N. Grabar, and F. Thiessard, “Detection and analysis of drug misuses. A study based on social media messages,” Front Pharmacol, vol. 9, no. JUL, Jul. 2018. [CrossRef]
- “Most popular social networks worldwide as of January 2023, ranked by number of monthly active users,” Statista, Jan. 2023.
- “Kaggle.” https://www.kaggle.com/ (accessed Jul. 07, 2023).
- “Substance Abuse and Mental Health Services Administration.” https://www.samhsa.gov/ (accessed Jul. 07, 2023).
- “Google Dataset Search.” https://datasetsearch.research.google.com/ (accessed Jul. 07, 2023).
- “An official website of the United States government.” https://catalog.data.gov/dataset (accessed Jul. 07, 2023).
- “UC Irvine Machine Learning Repository”, Accessed: Jul. 07, 2023. [Online]. Available: https://archive.ics.uci.edu/datasets.
- “IEEE Data Port”, Accessed: Jul. 07, 2023. [Online]. Available: https://ieee-dataport.org/.
- “Harvard Dataverse”, Accessed: Jul. 07, 2023. [Online]. Available: https://dataverse.harvard.edu/.
- “University of California, Riverside (UCR) Library Search”, Accessed: Jul. 07, 2023. [Online]. Available: https://search.library.ucr.edu/discovery/search?vid=01CDL_RIV_INST:UCR.
- “THE DATALAB”, Accessed: Jul. 07, 2023. [Online]. Available: https://thedatalab.com/.
- Sarker and G. Gonzalez, “A corpus for mining drug-related knowledge from Twitter chatter: Language models and their utilities,” Data Brief, vol. 10, pp. 122–131, Feb. 2017. [CrossRef]
- H. W. Meng, S. Kath, D. Li, and Q. C. Nguyen, “National substance use patterns on Twitter,” PLoS One, vol. 12, no. 11, Nov. 2017. [CrossRef]
- U. Lokala, R. Daniulaityte, R. Carlson, F. Lamy, and A. Sheth, “Social Media data for exploring the association between Cannabis use and Depression.” figshare, 2021.
- J. Tassone, P. Yan, M. Simpson, C. Mendhe, V. Mago, and S. Choudhury, “Utilizing deep learning and graph mining to identify drug use on Twitter data,” BMC Med Inform Decis Mak, vol. 20, Dec. 2020. [CrossRef]
- T. Nasralah, O. El-Gayar, and Y. Wang, “Social Media Text Mining Framework for Drug Abuse: An Opioid Crisis Case Analysis,” 2020. [CrossRef]
- S. J. Kim, L. A. Marsch, J. T. Hancock, and A. K. Das, “Scaling up research on drug abuse and addiction through social media big data,” J Med Internet Res, vol. 19, no. 10, Oct. 2017. [CrossRef]
- J. Xie, Z. Zhang, X. Liu, and D. Zeng, “Unveiling the Hidden Truth of Drug Addiction: A Social Media Approach Using Similarity Network-Based Deep Learning,” Journal of Management Information Systems, vol. 38, no. 1, pp. 166–195, 2021. [CrossRef]
- Roy, A. Paul, H. Pirsiavash, and S. Pan, “Automated Detection of Substance Use-Related Social Media Posts Based on Image and Text Analysis,” 2017. [Online]. Available: https://www.drugabuse.gov/drugs-abuse/commonly-abused-drugs-charts.
- F. Jenhani, M. S. Gouider, and L. Ben Said, “Hybrid system for information extraction from social media text: Drug abuse case study,” in Procedia Computer Science, Elsevier B.V., 2019, pp. 688–697. [CrossRef]
- H. Hu et al., “An ensemble deep learning model for drug abuse detection in sparse twitter-sphere,” in Studies in Health Technology and Informatics, IOS Press, Aug. 2019, pp. 163–167. [CrossRef]
- F. C. Tsai, M. C. Hsu, C. T. Chen, and D. Y. Kao, “Exploring drug-related crimes with social network analysis,” in Procedia Computer Science, Elsevier B.V., 2019, pp. 1907–1917. [CrossRef]
- S. J. Fodeh, M. Al-Garadi, O. Elsankary, J. Perrone, W. Becker, and A. Sarker, “Utilizing a multi-class classification approach to detect therapeutic and recreational misuse of opioids on Twitter,” Comput Biol Med, vol. 129, Feb. 2021. [CrossRef]
- N. Phan, M. Bhole, S. Ae Chun, and J. Geller, “Enabling real-Time drug abuse detection in tweets,” in Proceedings - International Conference on Data Engineering, IEEE Computer Society, May 2017, pp. 1510–1514. [CrossRef]
- H. Hu, P. Moturu, K. N. Dharan, J. Geller, S. Di Iorio, and H. Phan, “Deep learning model for classifying drug abuse risk behavior in tweets,” in Proceedings - 2018 IEEE International Conference on Healthcare Informatics, ICHI 2018, Institute of Electrical and Electronics Engineers Inc., Jul. 2018, pp. 386–387. [CrossRef]
- M. A. Al-Garadi et al., “Text classification models for the automatic detection of nonmedical prescription medication use from social media,” BMC Med Inform Decis Mak, vol. 21, no. 1, Dec. 2021. [CrossRef]
- H. Hu et al., “An insight analysis and detection of drug-abuse risk behavior on Twitter with self-taught deep learning,” Comput Soc Netw, vol. 6, no. 1, Dec. 2019. [CrossRef]
- T. K. Mackey and J. Kalyanam, “Detection of illicit online sales of fentanyls via Twitter,” F1000Res, vol. 6, 2017. [CrossRef]
- T. K. Mackey, J. Kalyanam, T. Katsuki, and G. Lanckriet, “Twitter-based detection of illegal online sale of prescription opioid,” Am J Public Health, vol. 107, no. 12, pp. 1910–1915, Dec. 2017. [CrossRef]
- Y. Fan, Y. Zhang, Y. Ye, X. Li, and W. Zheng, “Social media for opioid addiction epidemiology: Automatic detection of opioid addicts from Twitter and case studies,” in International Conference on Information and Knowledge Management, Proceedings, Association for Computing Machinery, Nov. 2017, pp. 1259–1267. [CrossRef]
- Safaa. S Al Dhanhani, “Framework for Analyzing Twitter to Detect Community Suspicious Crime Activity,” Academy and Industry Research Collaboration Center (AIRCC), Jan. 2018, pp. 41–60. [CrossRef]
- T. Ding, W. K. Bickel, and S. Pan, “Multi-View Unsupervised User Feature Embedding for Social Media-based Substance Use Prediction,” 2017.
- J. Li, Q. Xu, N. Shah, and T. K. Mackey, “A machine learning approach for the detection and characterization of illicit drug dealers on instagram: Model evaluation study,” J Med Internet Res, vol. 21, no. 6, Jun. 2019. [CrossRef]
- J. Tassone, P. Yan, M. Simpson, C. Mendhe, V. Mago, and S. Choudhury, “Utilizing deep learning and graph mining to identify drug use on Twitter data,” BMC Med Inform Decis Mak, vol. 20, Dec. 2020. [CrossRef]
- S. Al Amin et al., “Data Driven Classification of Opioid Patients Using Machine Learning-An Investigation,” IEEE Access, vol. 11, pp. 396–409, 2023. [CrossRef]
- J. T. Prieto et al., “The detection of opioid misuse and heroin use from paramedic response documentation: Machine learning for improved surveillance,” J Med Internet Res, vol. 22, no. 1, 2020. [CrossRef]
- Aubeer Smith, “23 essential Twitter statistics to guide your strategy in 2023,” Feb. 2023.
- “NLTK Library.” https://www.nltk.org/index.html (accessed Jul. 07, 2023).
- K. Sahoo, A. K. Samal, J. Pramanik, and S. K. Pani, “Exploratory data analysis using python,” International Journal of Innovative Technology and Exploring Engineering, vol. 8, no. 12, pp. 4727–4735, Oct. 2019. [CrossRef]
- Kulkarni and A. Shivananda, Natural Language Processing Recipes. Apress, 2019. [CrossRef]
- “Wosom.” https://wosom.ai/ (accessed May 26, 2023).
Figure 1.
Proposed architecture.
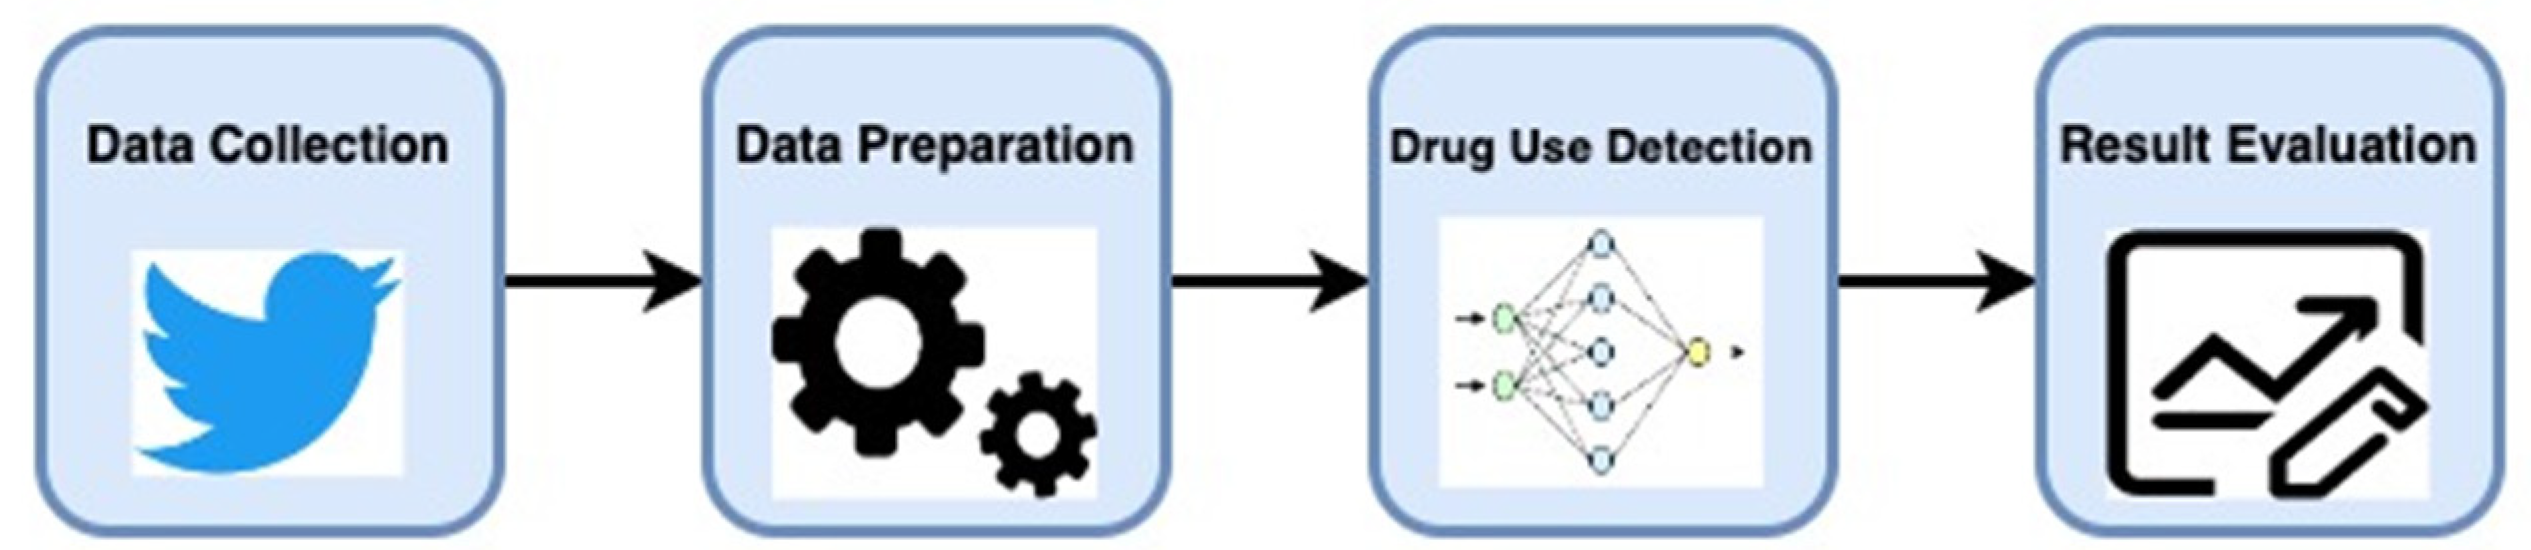
Figure 2.
Corpus collection methodology.
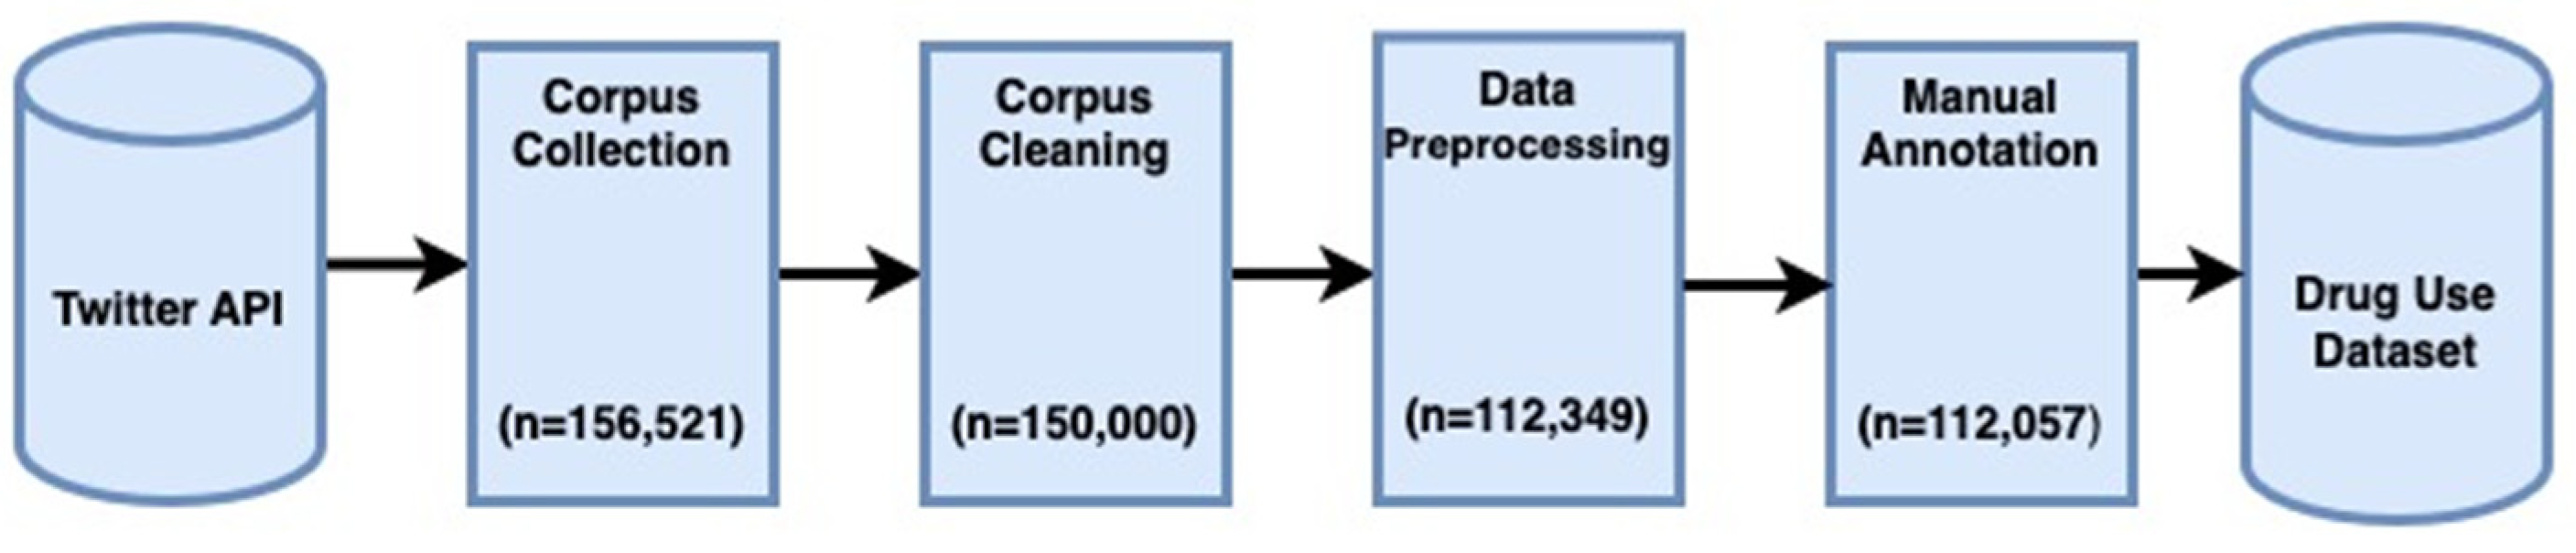
Figure 3.
The structure of proposed model.
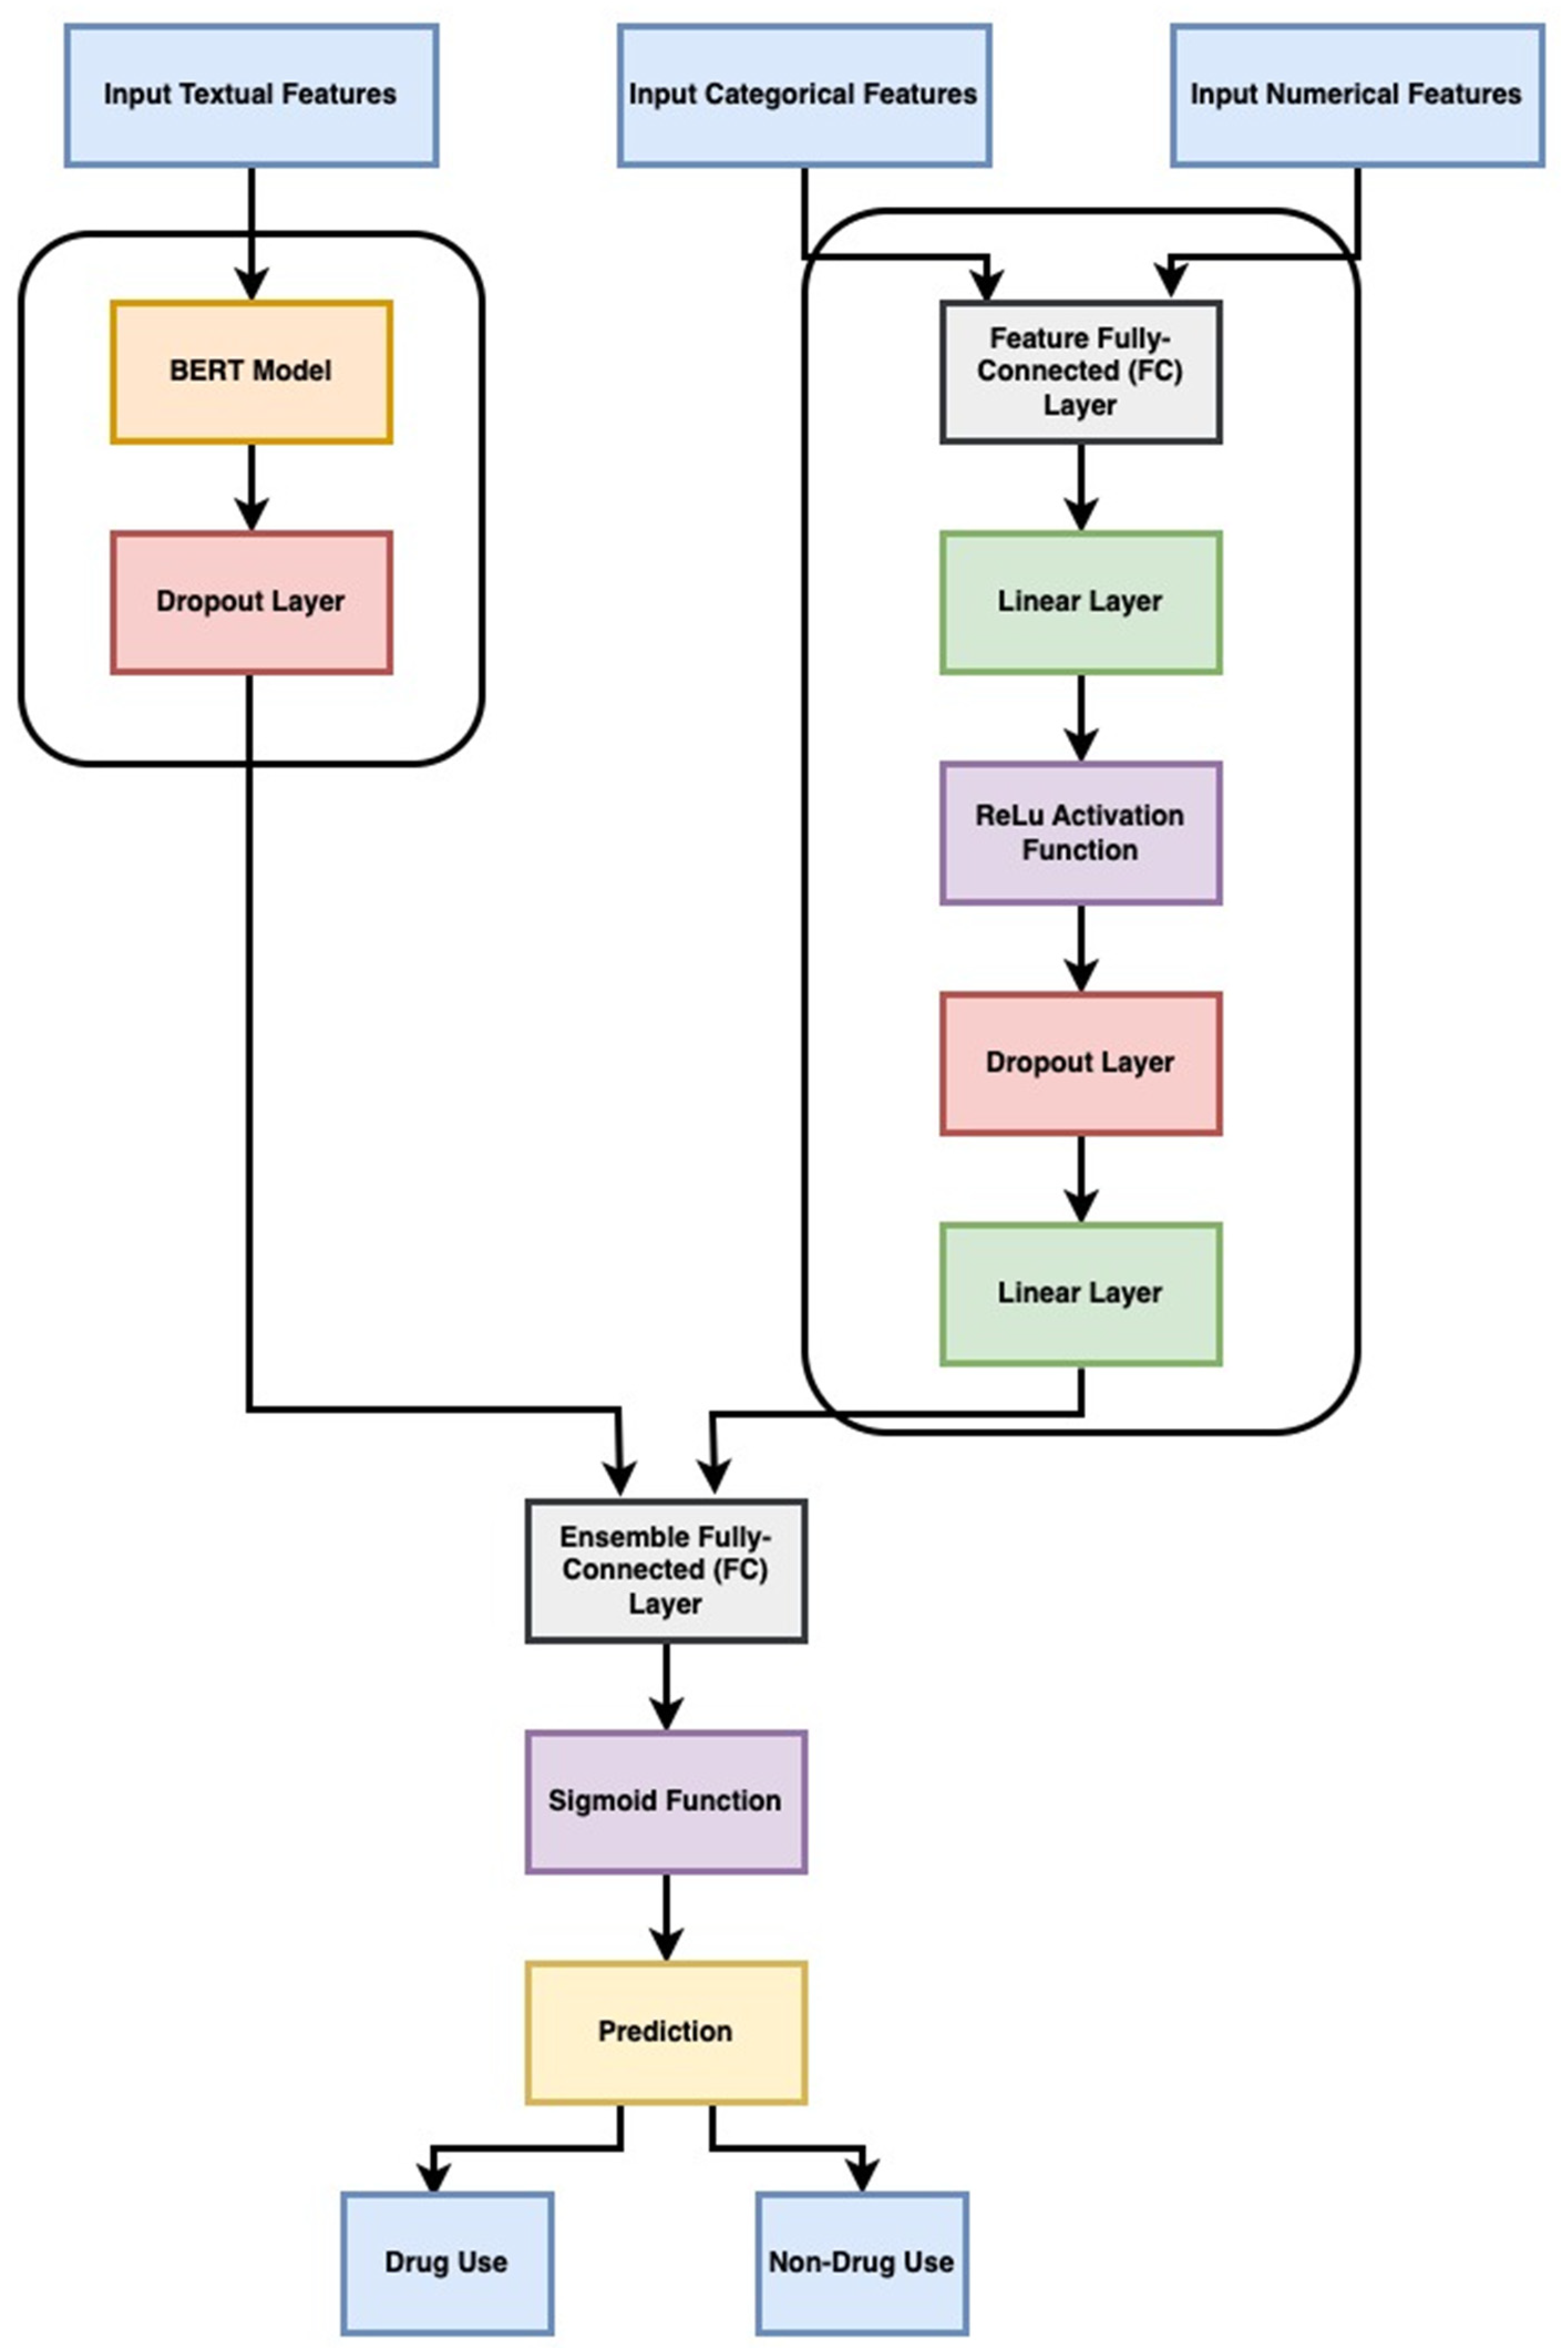
Figure 4.
Dataset class distribution.
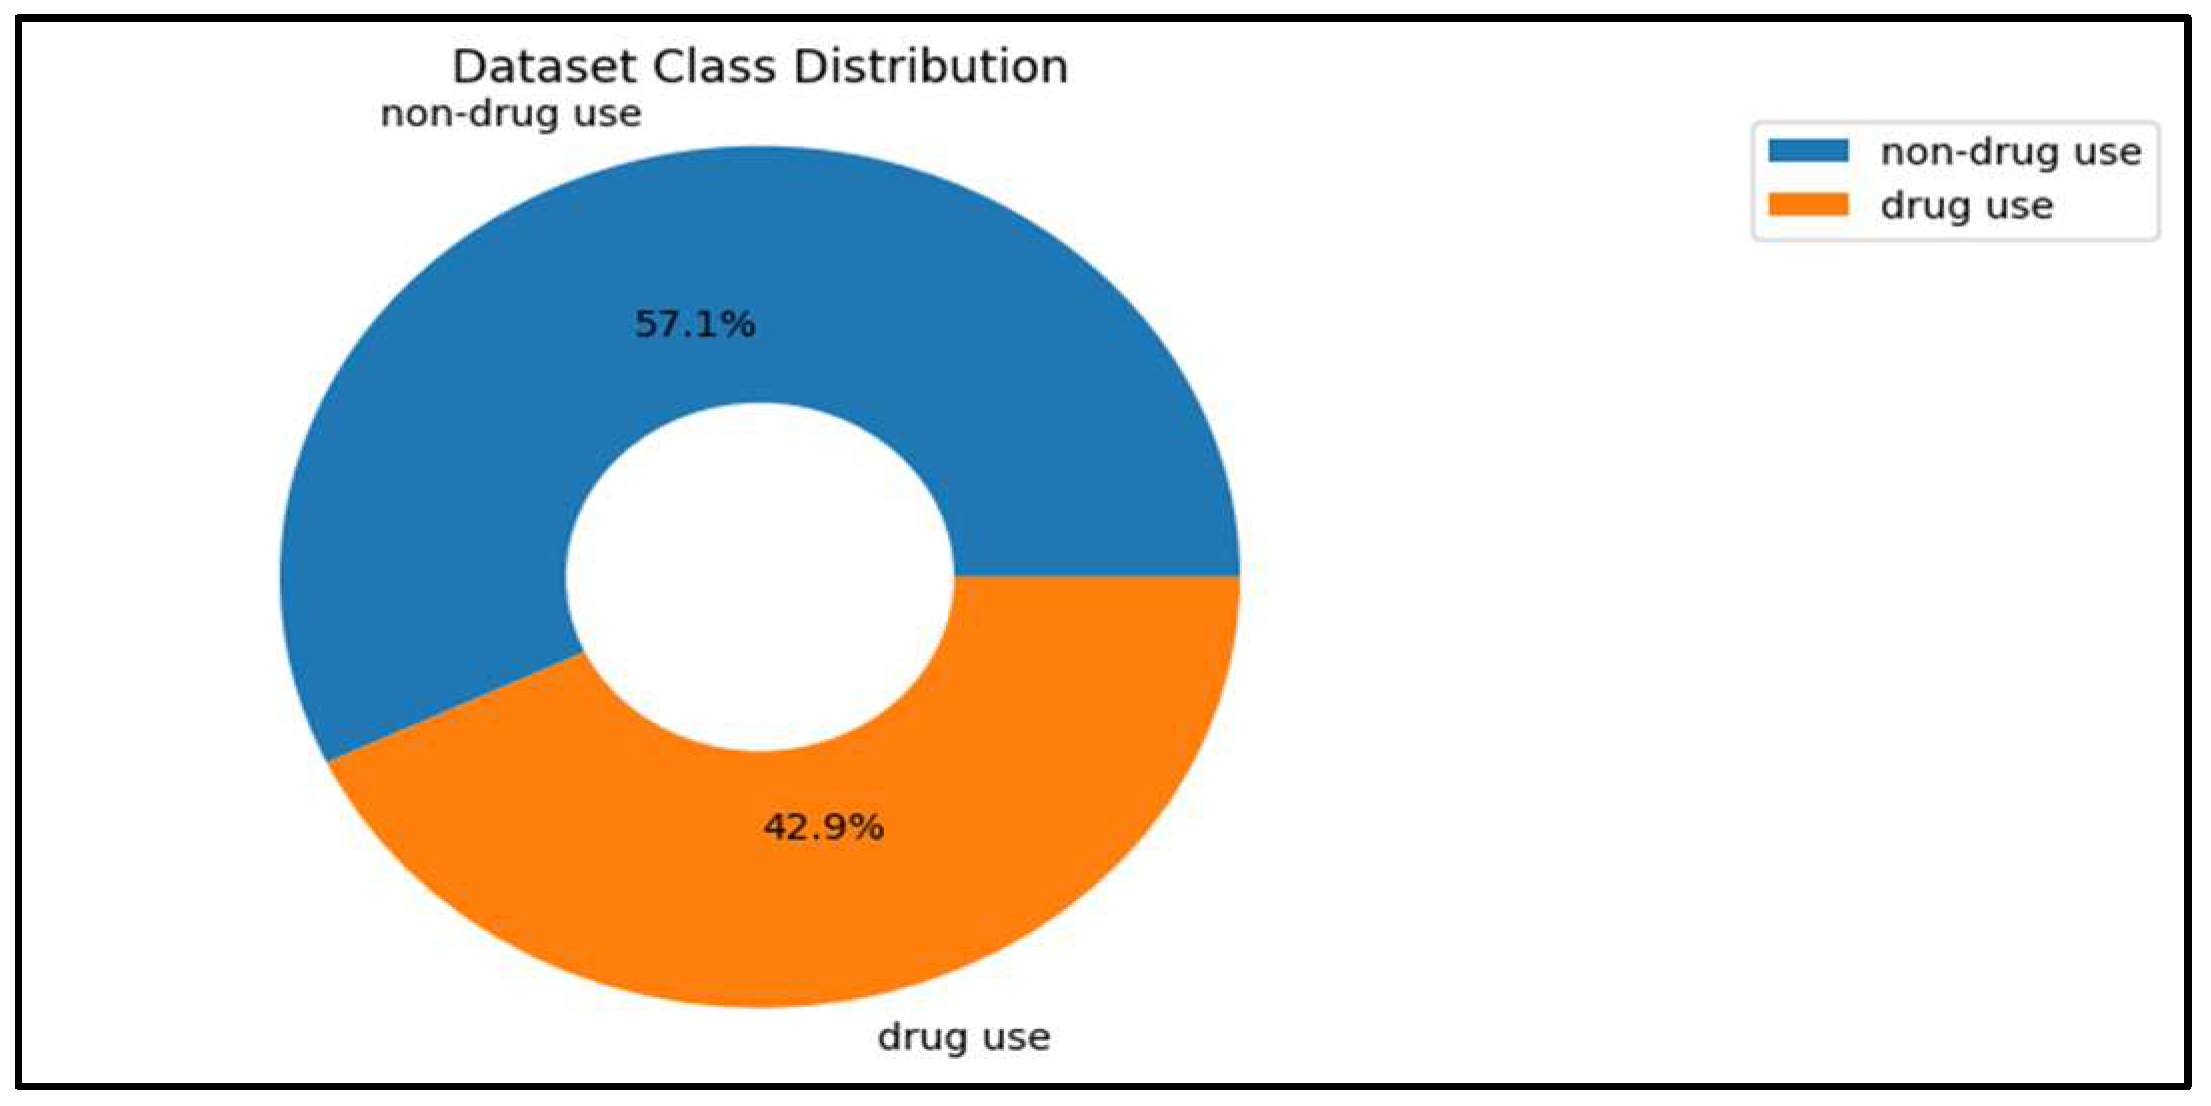
Figure 5.
Correlations between numerical variables.
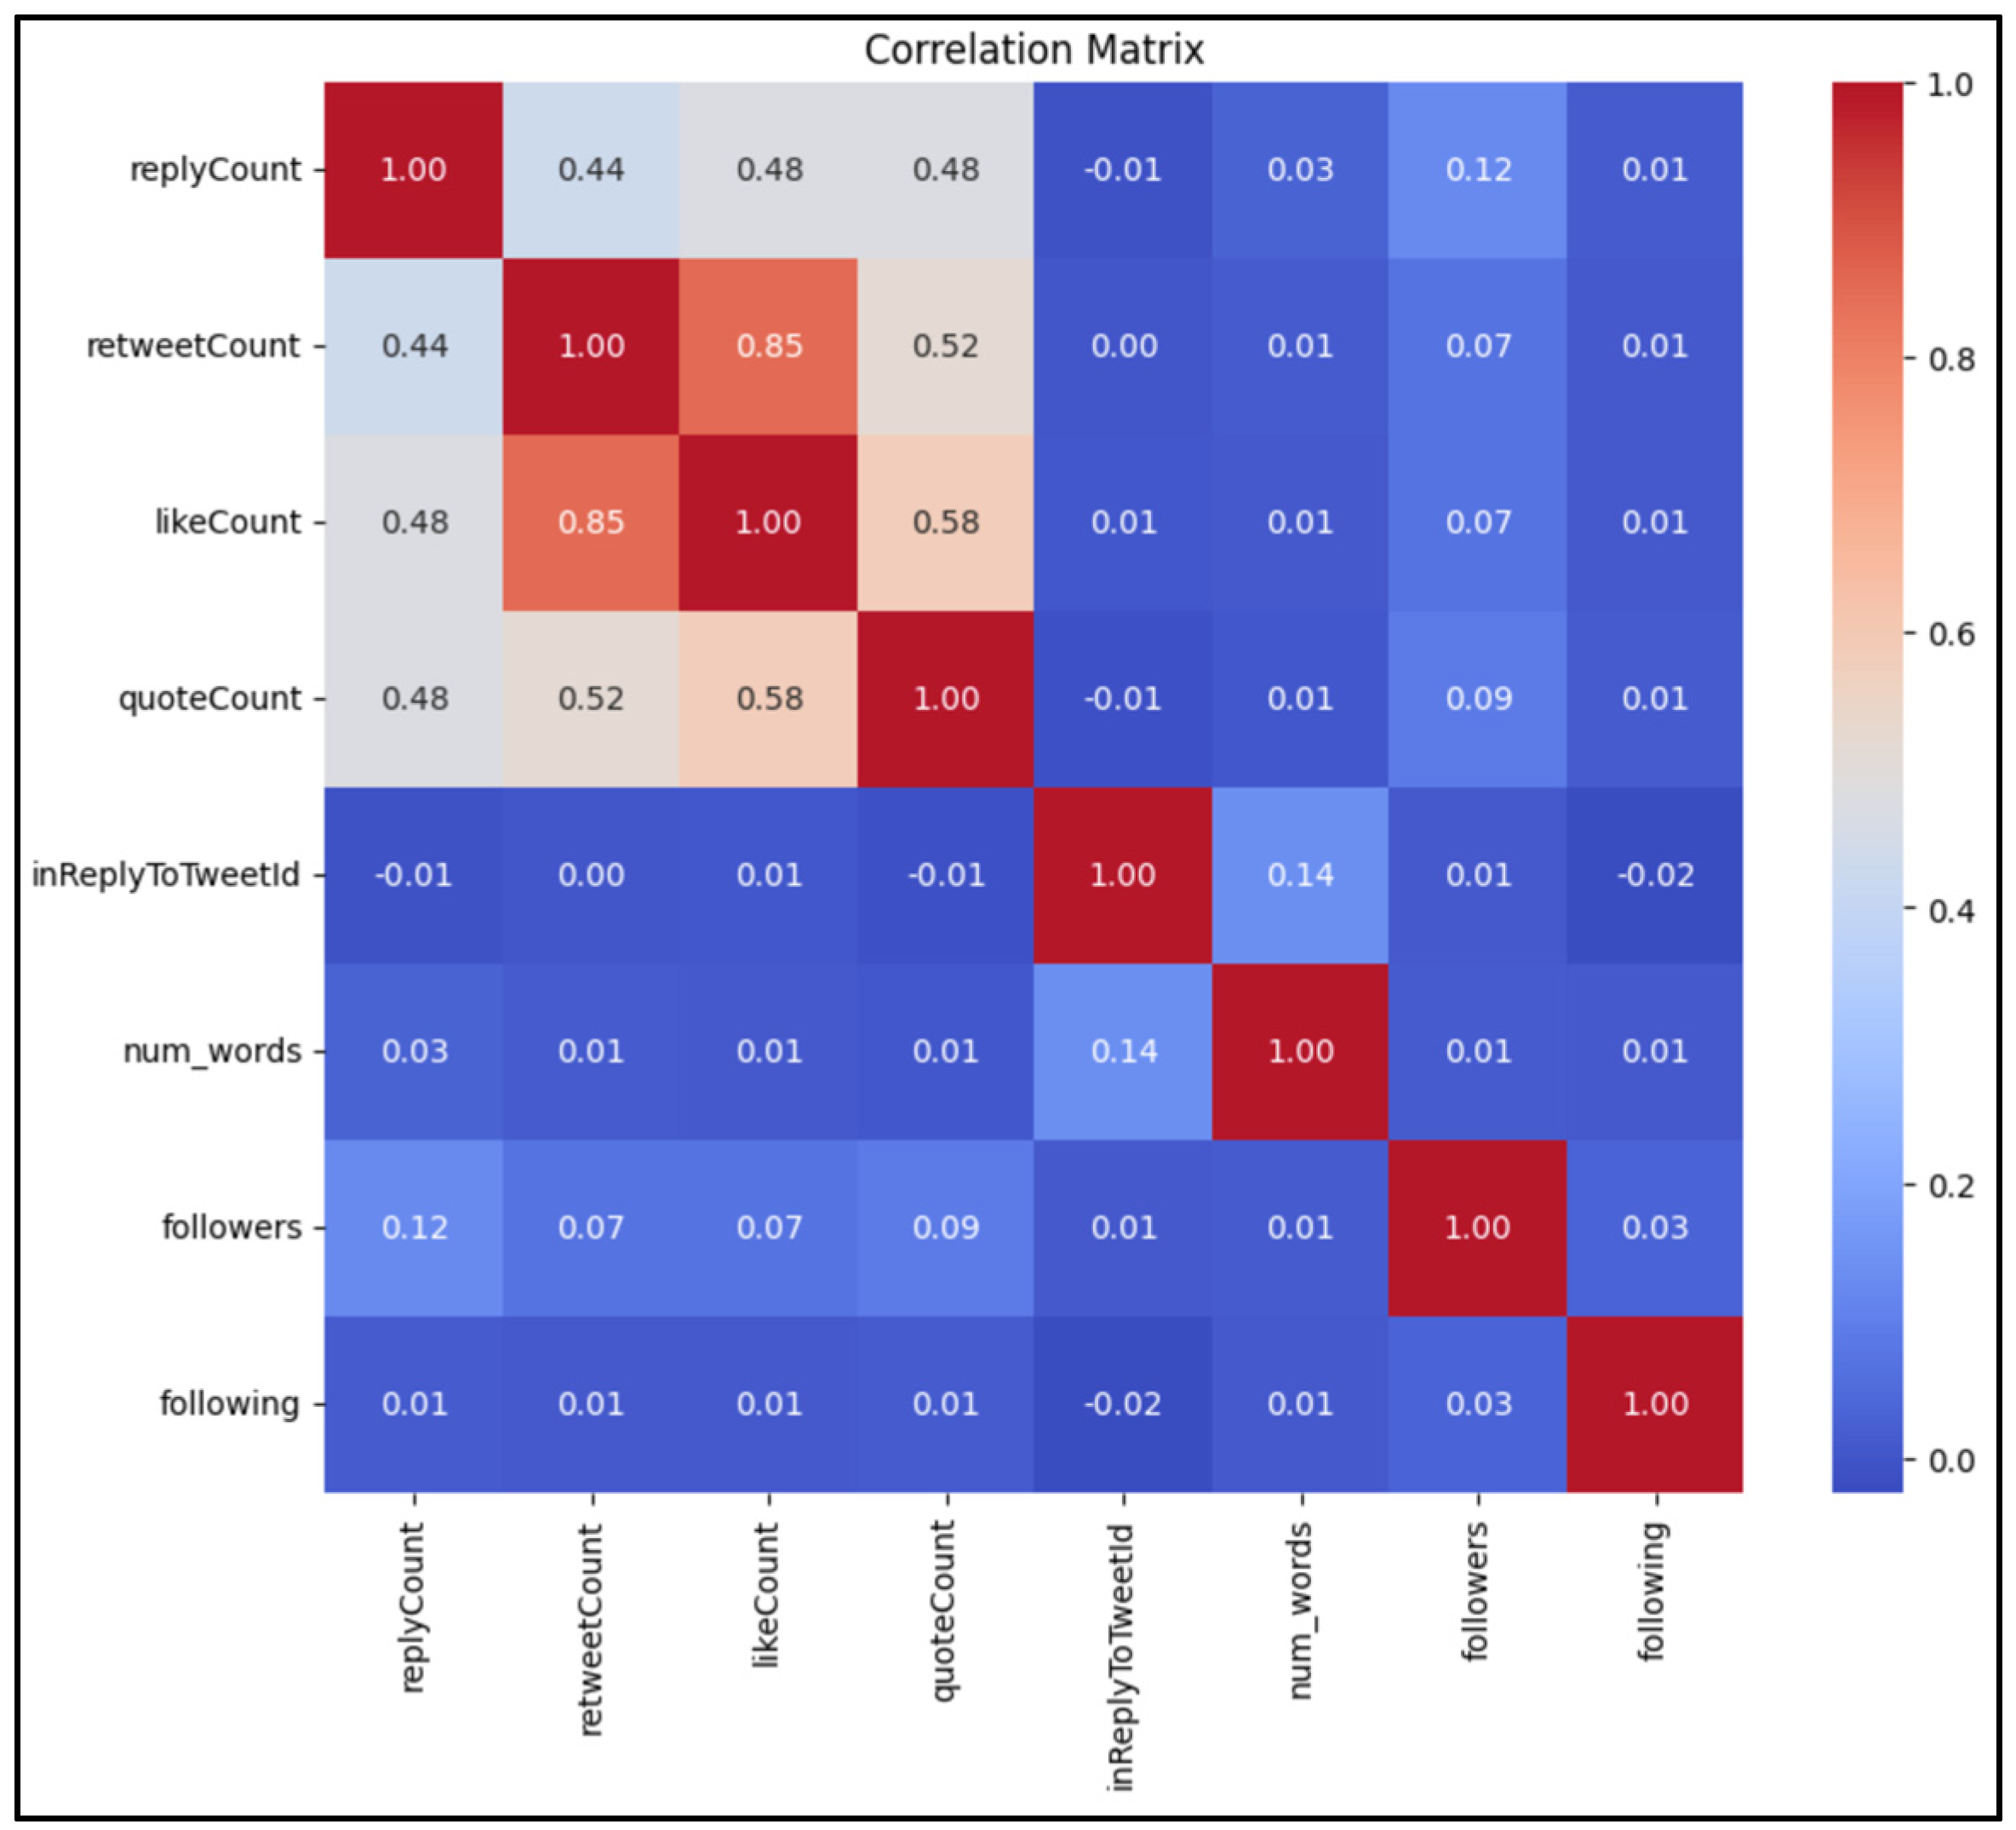
Figure 6.
Top 10 unigrams for drug use.
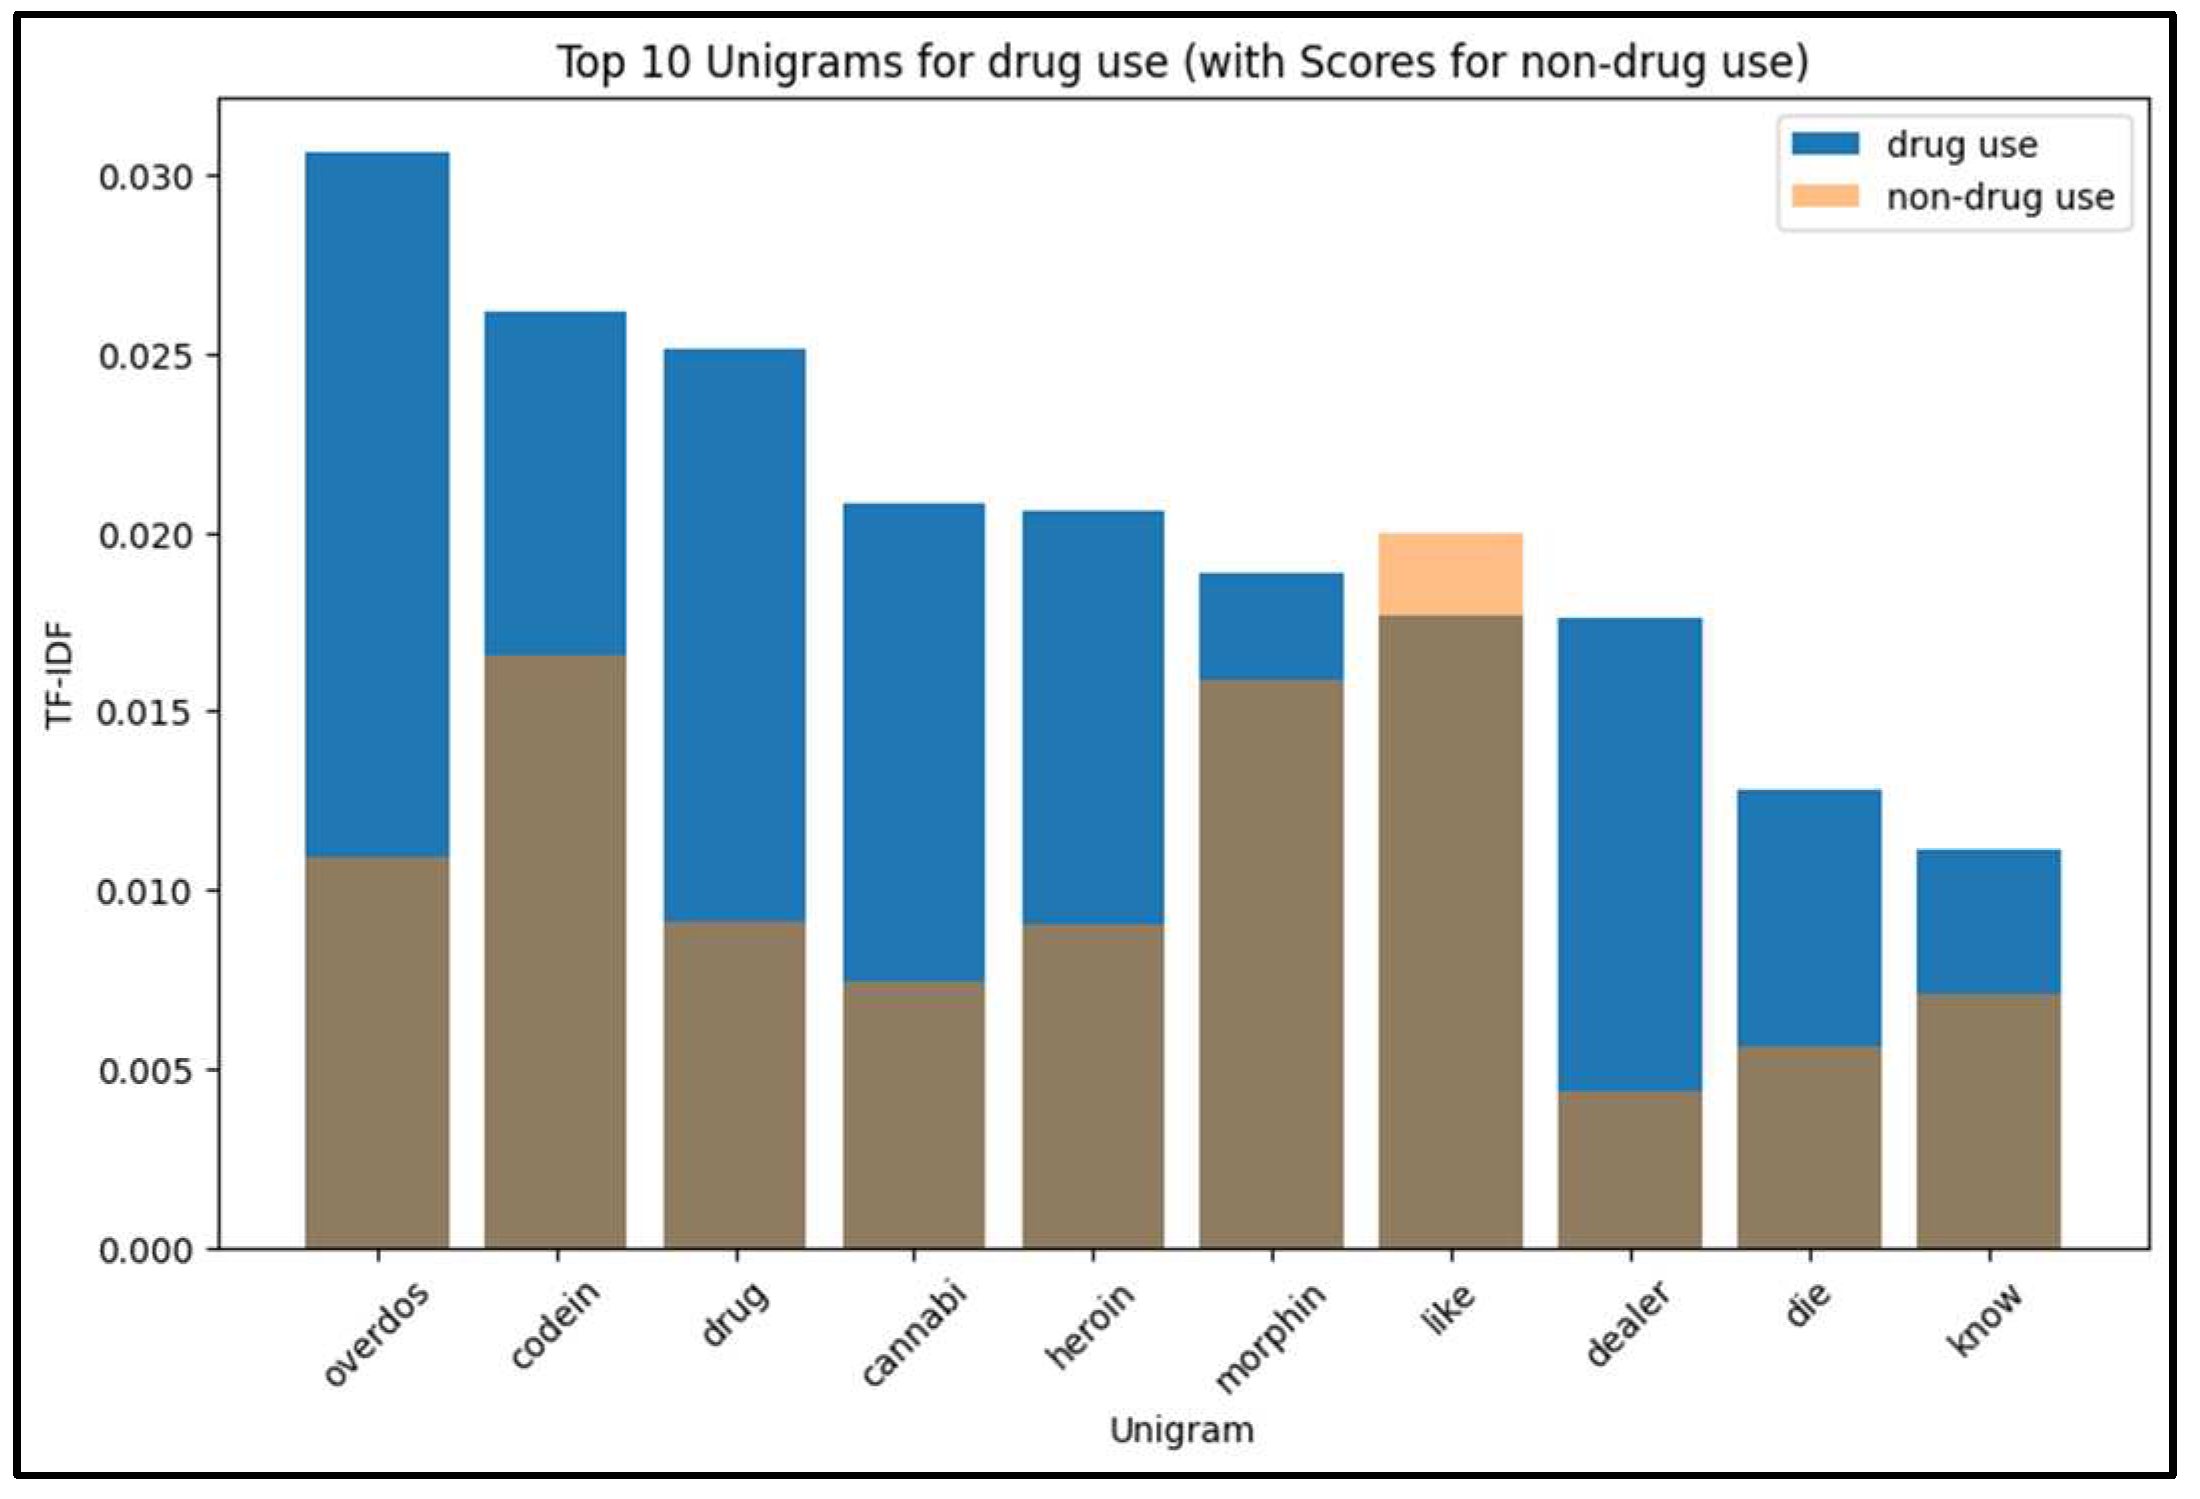
Figure 7.
Top 10 unigrams for non-drug use.
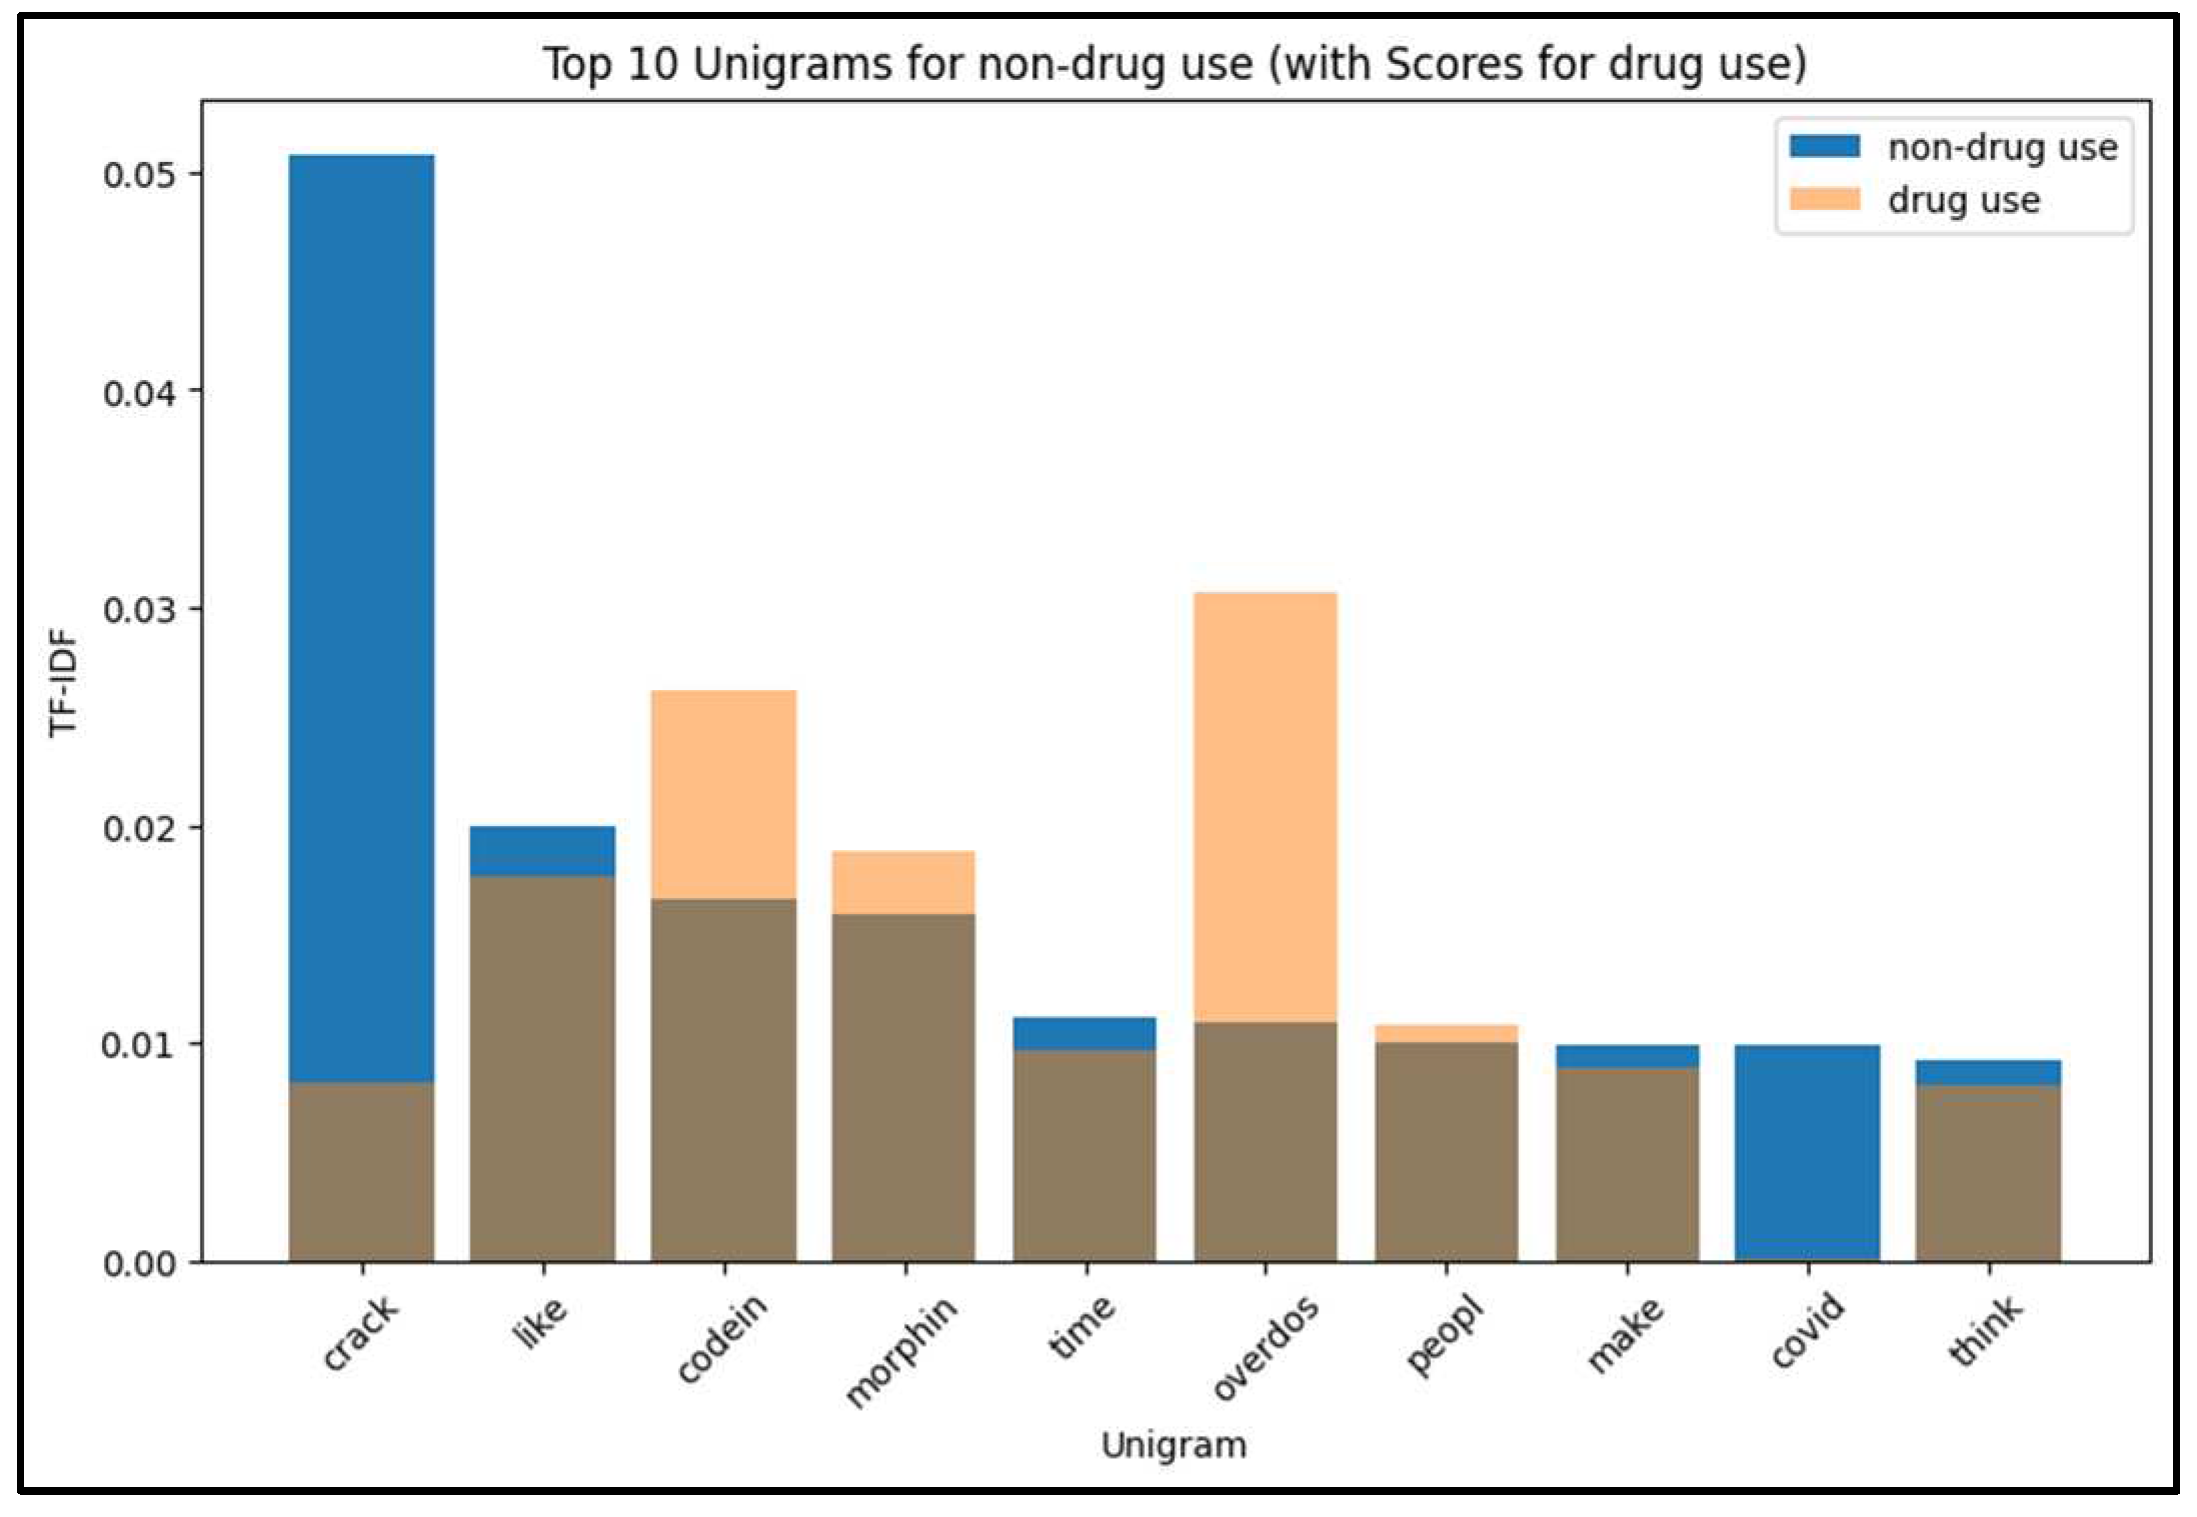
Figure 8.
Top 10 bigrams for drug use.
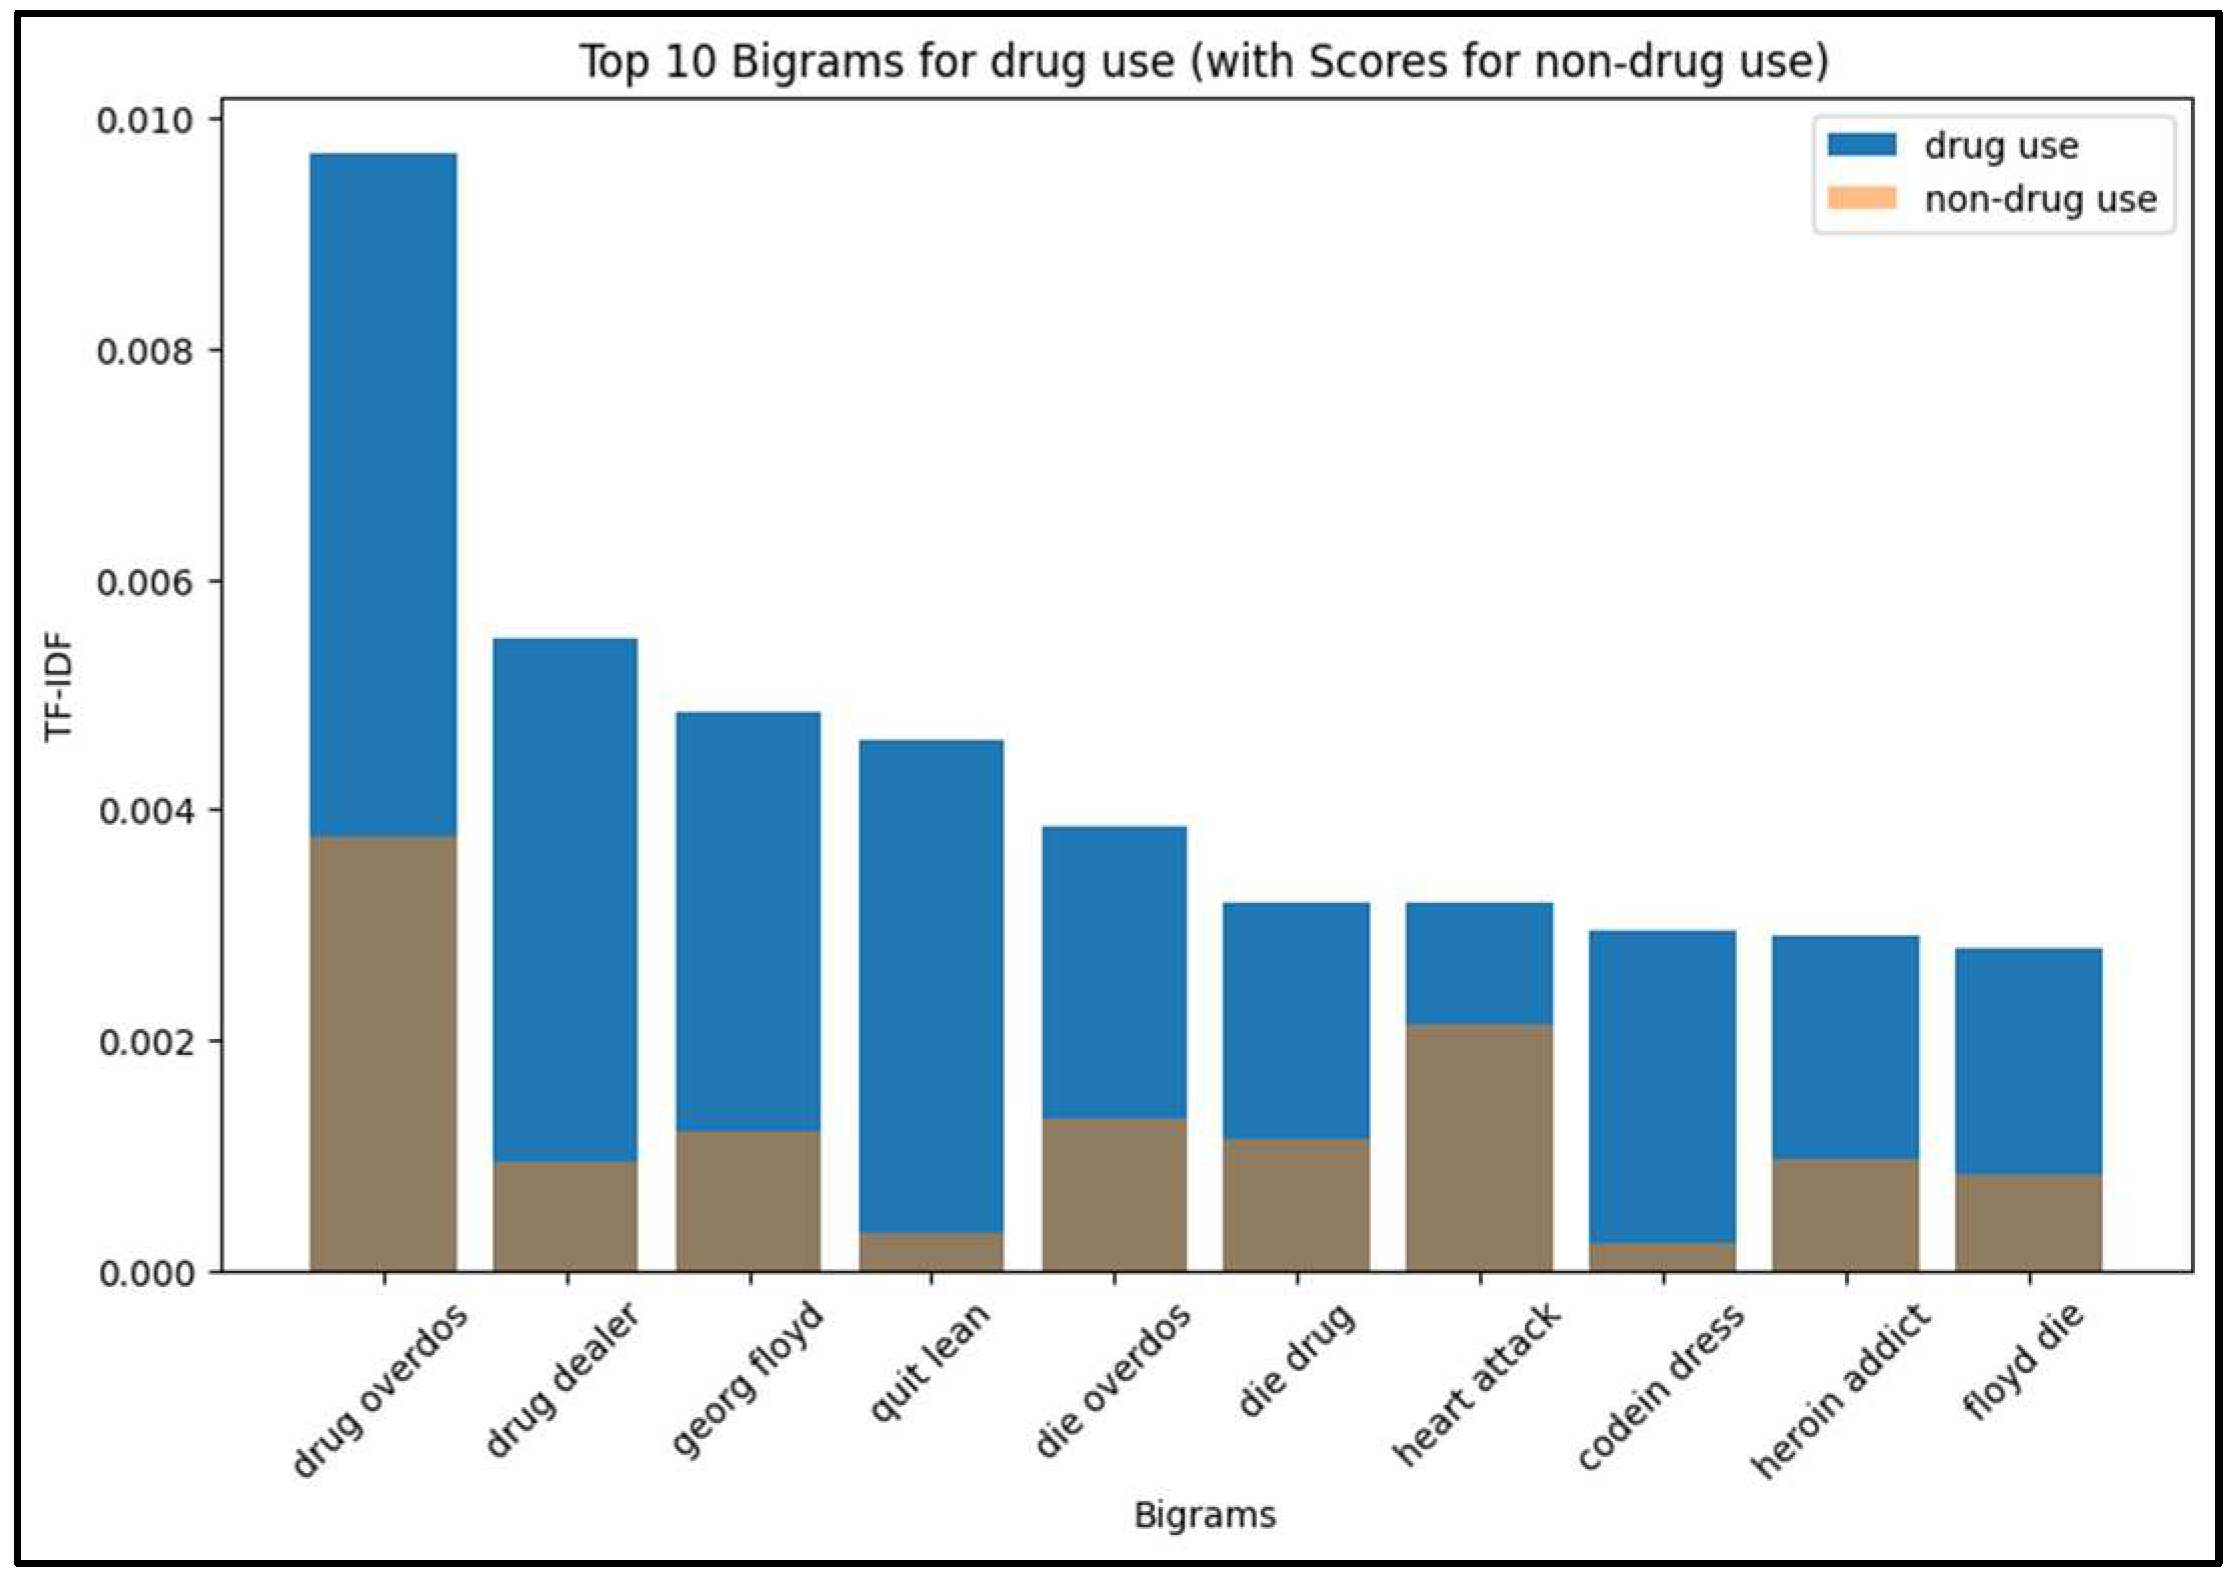
Figure 9.
Top 10 bigrams for non-drug use.
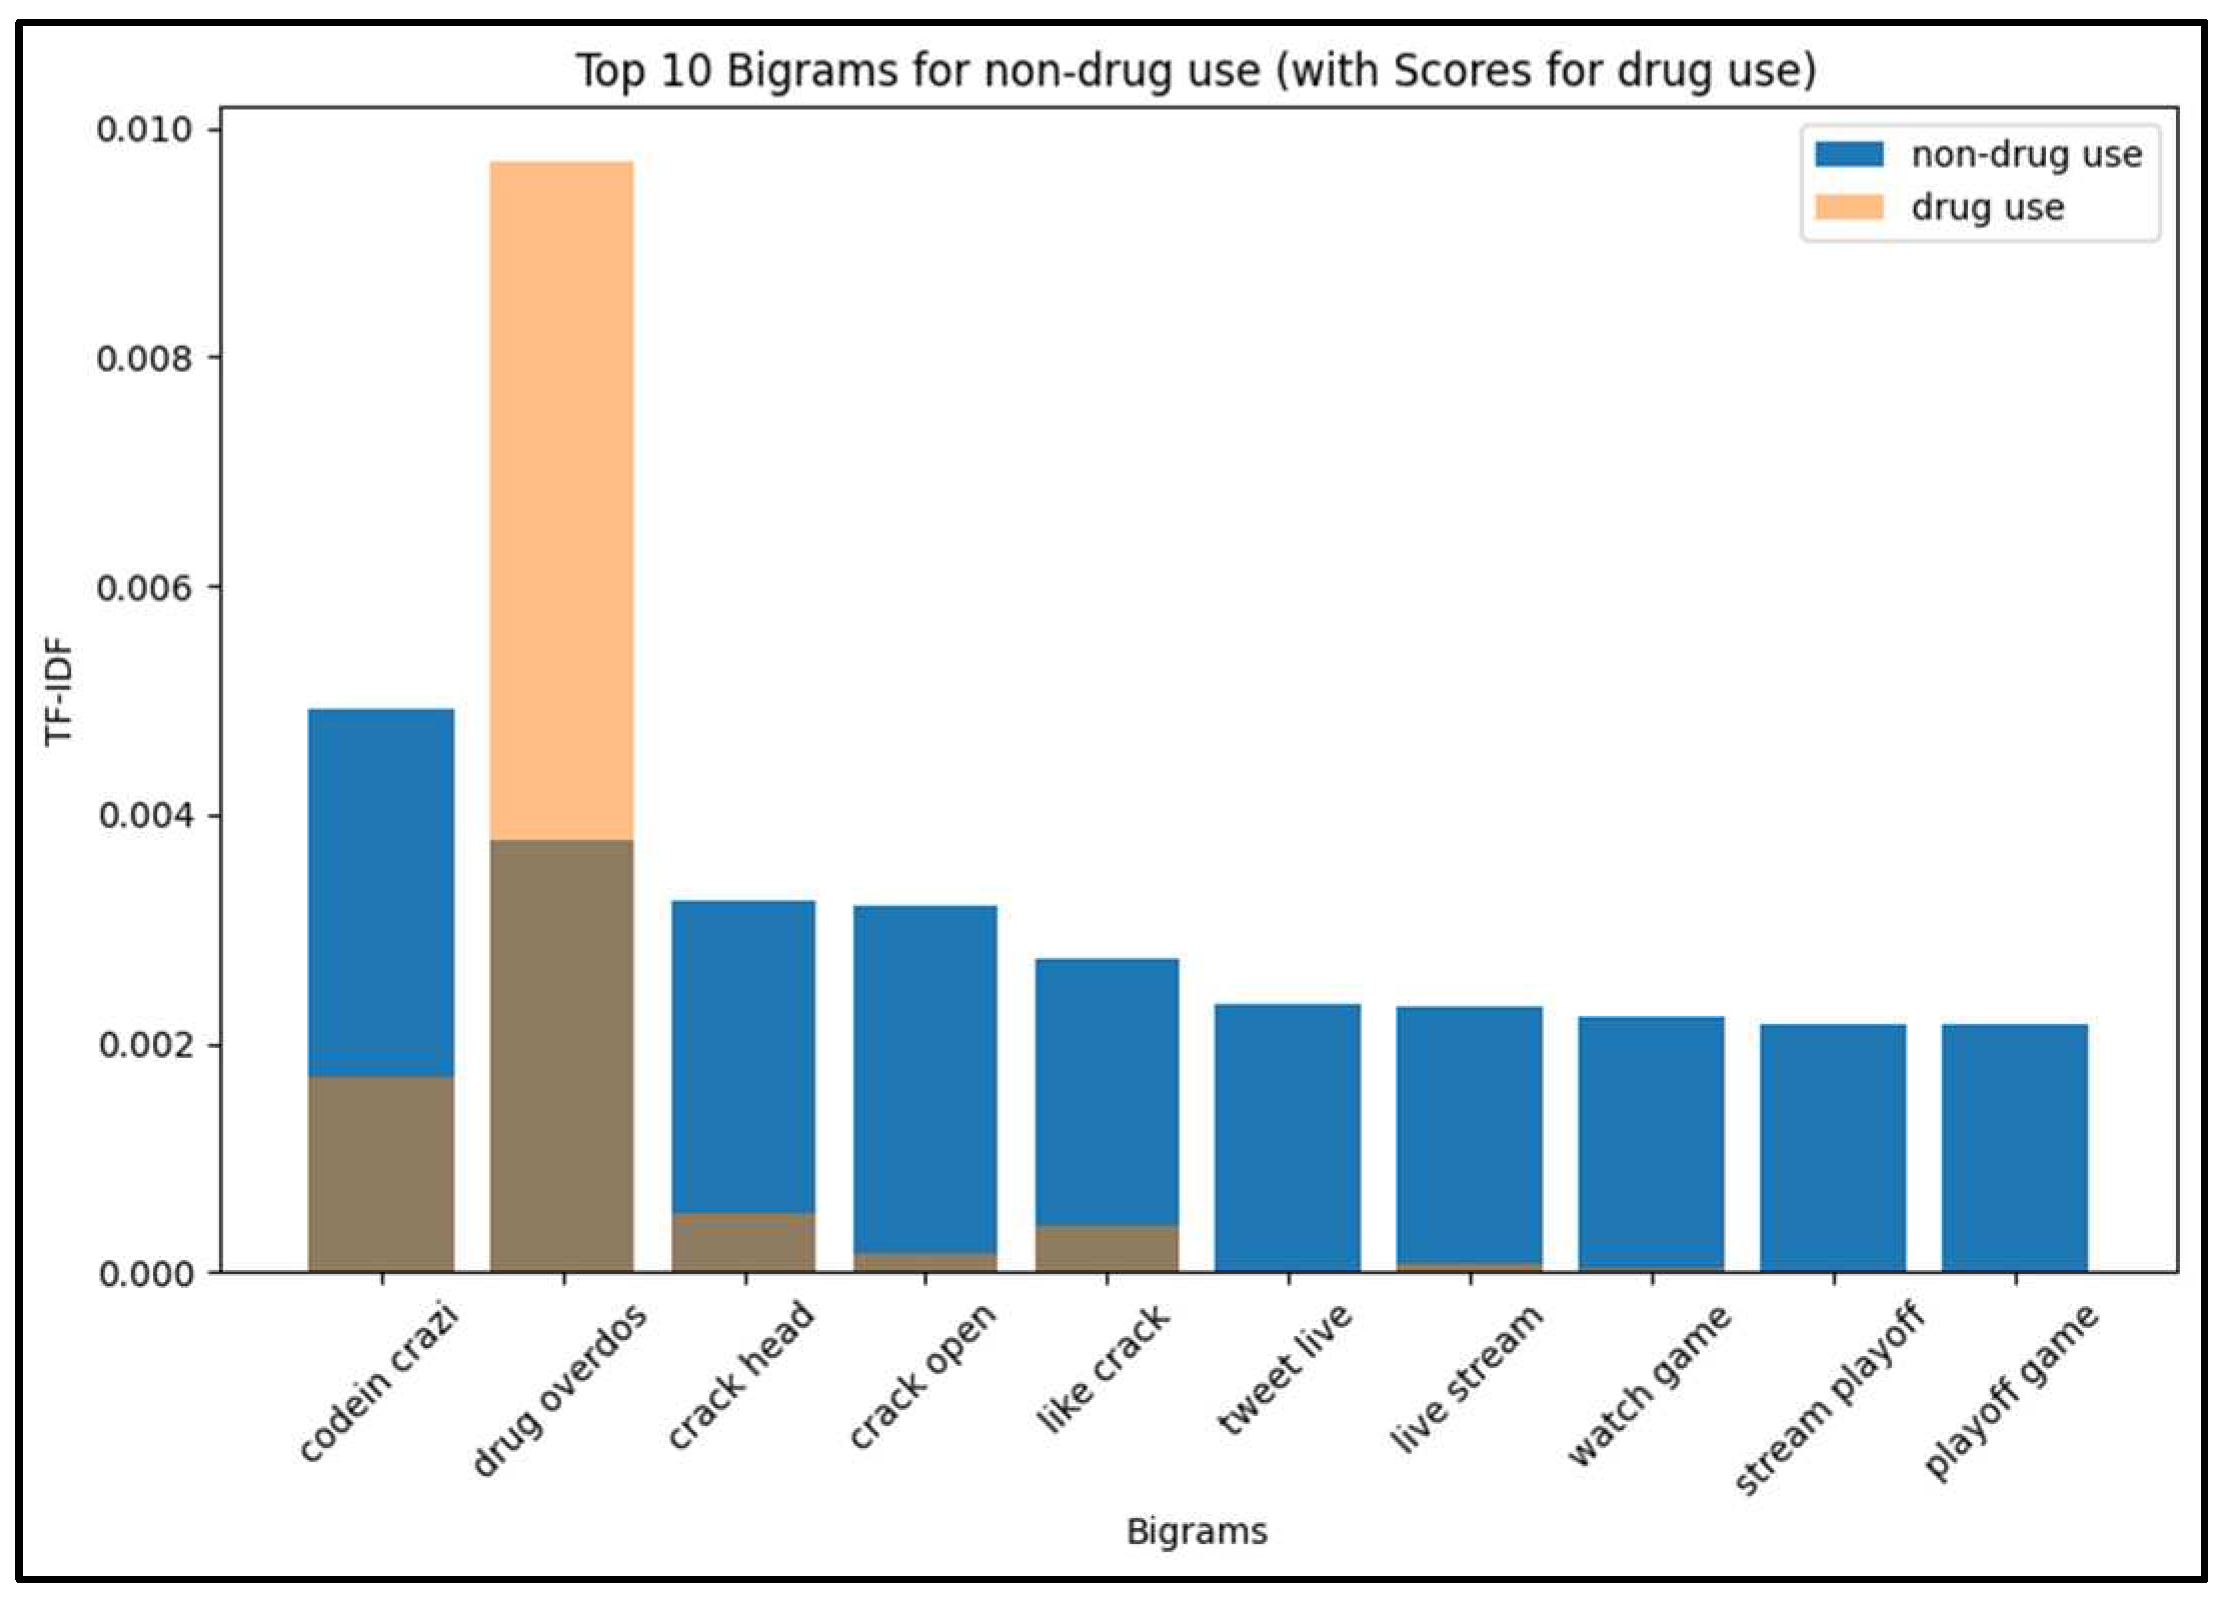

Table 1.
Studies on machine learning and deep learning.
| Ref | Year | Algorithm | Feature Selection | SN | Dataset Size | Performance Metric |
|---|---|---|---|---|---|---|
| [29] | 2017 | DT, RF SVMs, NB | String2WordVector, TF-IDF | 300 tweets | P= 0.748 R= 0.757 F= 0.746 | |
| [24] | 2017 | CNN | Image feature learning with CNN, Textual feature learningwith Doc2Vec | 100,500 posts | Acc= 0.9 F= 0.75 | |
| [30] | 2018 | SVM, CNN | Word2Vec | 3M tweets | Acc= 0.865 R= 0.886 F1= 0.866 | |
| [36] | 2018 | NA | Content features, sentiment analysis, user profile | 10% of random tweets | ||
| [6] | 2018 | NB, RF, Simple Logistic | Brown clustering, Word2Vec | Doctissimo website Forum | 119,562 messages | P= 0.778 R= 0.772 F= 0.773 |
| [25] | 2019 | J48, LR, Libsvm for SVM and NB | named entity (NE), semantic links (SL) and lexical features (LF) |
1M tweets | P= 0.95 | |
| [31] | 2021 | SVM, RF, Gaussian NB, Shallow NN, KNN, CNN, BiLSTM | BERT | 16,443 tweets | F1= 0.95 | |
| [26] | 2019 | CNN, SVM, RF, NB | Word2Vec, Glove | NA | Acc= 0.857 (ML) P= 0.846 (CNN) R=0.891 (ML) F1= 0.862 (ML) | |
| [38] | 2019 | DT, RF, SVM, RNN-LSTM | Text | 12,857 posts | F1= 0.95 | |
| [33] | 2017 | Biterm Topic Model (BTM) | Text | 28,711 tweets | ||
| [32] | 2019 | SVM, Naive Bayes, CNN, LSTM |
Tf, Tf-idf, Word2Vec |
1,794 tweets | Acc= 0.865 R= 0.886 F1= 0.866 | |
| [34] | 2017 | BTM | URL | 619,937 tweets | ||
| [21] | 2020 | Text mining | TF-IDF | 10,000 tweets | P= 0.941 R= 0.966 F= 0.953 Acc= 0.928 | |
| [37] | 2017 | SVD, LDA, D-DM, D-DBOW | User feature embedding | 22M posts | AUC=0.86 for predicting tobacco use, AUC=0.81 for alcohol use and AUC=0.84 for illicit drug use |
|
| [35] | 2017 | LLGC | BOW, users’ profiles | 19,722 tweets, 2,312 users | Acc= 0.8336 F1= 0.8215 | |
| [39] | 2020 | SVM, XGBoost and CNN-based classifier | word2vec embedding | 3,696,150 tweets | Acc= 0.823 P= 0.893 Recall= 0.784 F1= 0.835 AUC=0.91 | |
| [17] | 2017 | data and language models | word representation, n-gram | 267,215Twitter posts | ||
| [40] | 2022 | AdaBoost, LR, SVM, XGB, RF, LSTM, ANN and CNN | Dataset attributes, tabular data | Database | 37,127 distinct cases | |
| [41] | 2020 | RF,KNN, SVM and L1-regularized LR | NLP features | free-text narratives, impressions, list of medications |
54,359 trip reports | AUC=0.94 |
| [23] | 2021 | Similarity Network-based Deep Learning (SINDEL) | word embedding and a network of words | Drugs-Forum | 27,154 posts | F1=0.767 |
| [28] | 2020 | RF, SVM, BiLSTM, BERT | Woed2Vec | 5,523,588 tweets | F1=0.71 for the Pain-misuse class, and 0.79 for the Recreational-misuse class | |
| [27] | 2019 | DT, NB, LR, SVM, RF, k-NN | Personal Feature Set and Social feature Set | Criminal Warehouse | 5,780 records with 4,561 unique individuals | F1=0.622 |
| [18] | 2017 | Text classifier and analytical approach | sentiment scores, substanceuse variables, and underage variables | 79,848,992 tweets |
* Precision (P), Recall (R), F-measure (F1), Accuracy (Acc), Area Under Cover (AUC), Singular Value Decomposition (SVD), Latent Dirichlet Allocation (LDA), Document Embedding with Distributed Memory (D-DM), Document Embedding with Distributed BOW (D-DBOW), Learning with Local and Global Consistency Algorithm (LLGC), Biterm Topic Model (BTM), Adaptive Boosting (AdaBoost).
Table 2.
Performance evaluation.
| No. | Algorithm | Features | Metrics | ||||
|---|---|---|---|---|---|---|---|
| F1-Score | Accuracy | Precision | Recall | AUC | |||
| 1 | SVM | Textual | 0.9017 | 0.8995 | 0.8819 | 0.9225 | 0.8995 |
| 2 | XGBoost | Textual | 0.9000 | 0.8982 | 0.8803 | 0.9206 | 0.8984 |
| 3 | RF | Textual | 0.8693 | 0.8662 | 0.8459 | 0.8940 | 0.8664 |
| 4 | NB | Textual | 0.8216 | 0.8087 | 0.7641 | 0.8886 | 0.8094 |
| 5 | LSTM | Textual | 0.8939 | 0.9074 | 0.8790 | 0.9094 | 0.9077 |
| 6 | BERT | Textual | 0.9005 | 0.9018 | 0.8922 | 0.9133 | 0.9041 |
| 7 | Ensemble method | Textual Categorical Numerical |
0.9112 | 0.9166 | 0.8953 | 0.9341 | 0.9133 |
Table 3.
BERT model performance for both classes.
| Precision | Recall | F1-score | Support | |
|---|---|---|---|---|
| Non-drug use | 0.92 | 0.88 | 0.90 | 12794 |
| Drug use | 0.88 | 0.92 | 0.90 | 9618 |
| accuracy | 0.90 | 22412 | ||
| macro avg | 0.90 | 0.90 | 0.90 | 22412 |
| weighted avg | 0.90 | 0.90 | 0.90 | 22412 |
Table 4.
Ensemble method with BERT model performance for both classes.
| Precision | Recall | F1-score | Support | |
|---|---|---|---|---|
| Non-drug use | 0.93 | 0.89 | 0.91 | 2028 |
| Drug use | 0.89 | 0.93 | 0.91 | 1972 |
| accuracy | 0.91 | 4000 | ||
| macro avg | 0.91 | 0.91 | 0.91 | 4000 |
| weighted avg | 0.91 | 0.91 | 0.91 | 4000 |
Disclaimer/Publisher’s Note: The statements, opinions and data contained in all publications are solely those of the individual author(s) and contributor(s) and not of MDPI and/or the editor(s). MDPI and/or the editor(s) disclaim responsibility for any injury to people or property resulting from any ideas, methods, instructions or products referred to in the content. |
© 2023 by the authors. Licensee MDPI, Basel, Switzerland. This article is an open access article distributed under the terms and conditions of the Creative Commons Attribution (CC BY) license (http://creativecommons.org/licenses/by/4.0/).
Copyright: This open access article is published under a Creative Commons CC BY 4.0 license, which permit the free download, distribution, and reuse, provided that the author and preprint are cited in any reuse.


