2. Materials and Methods
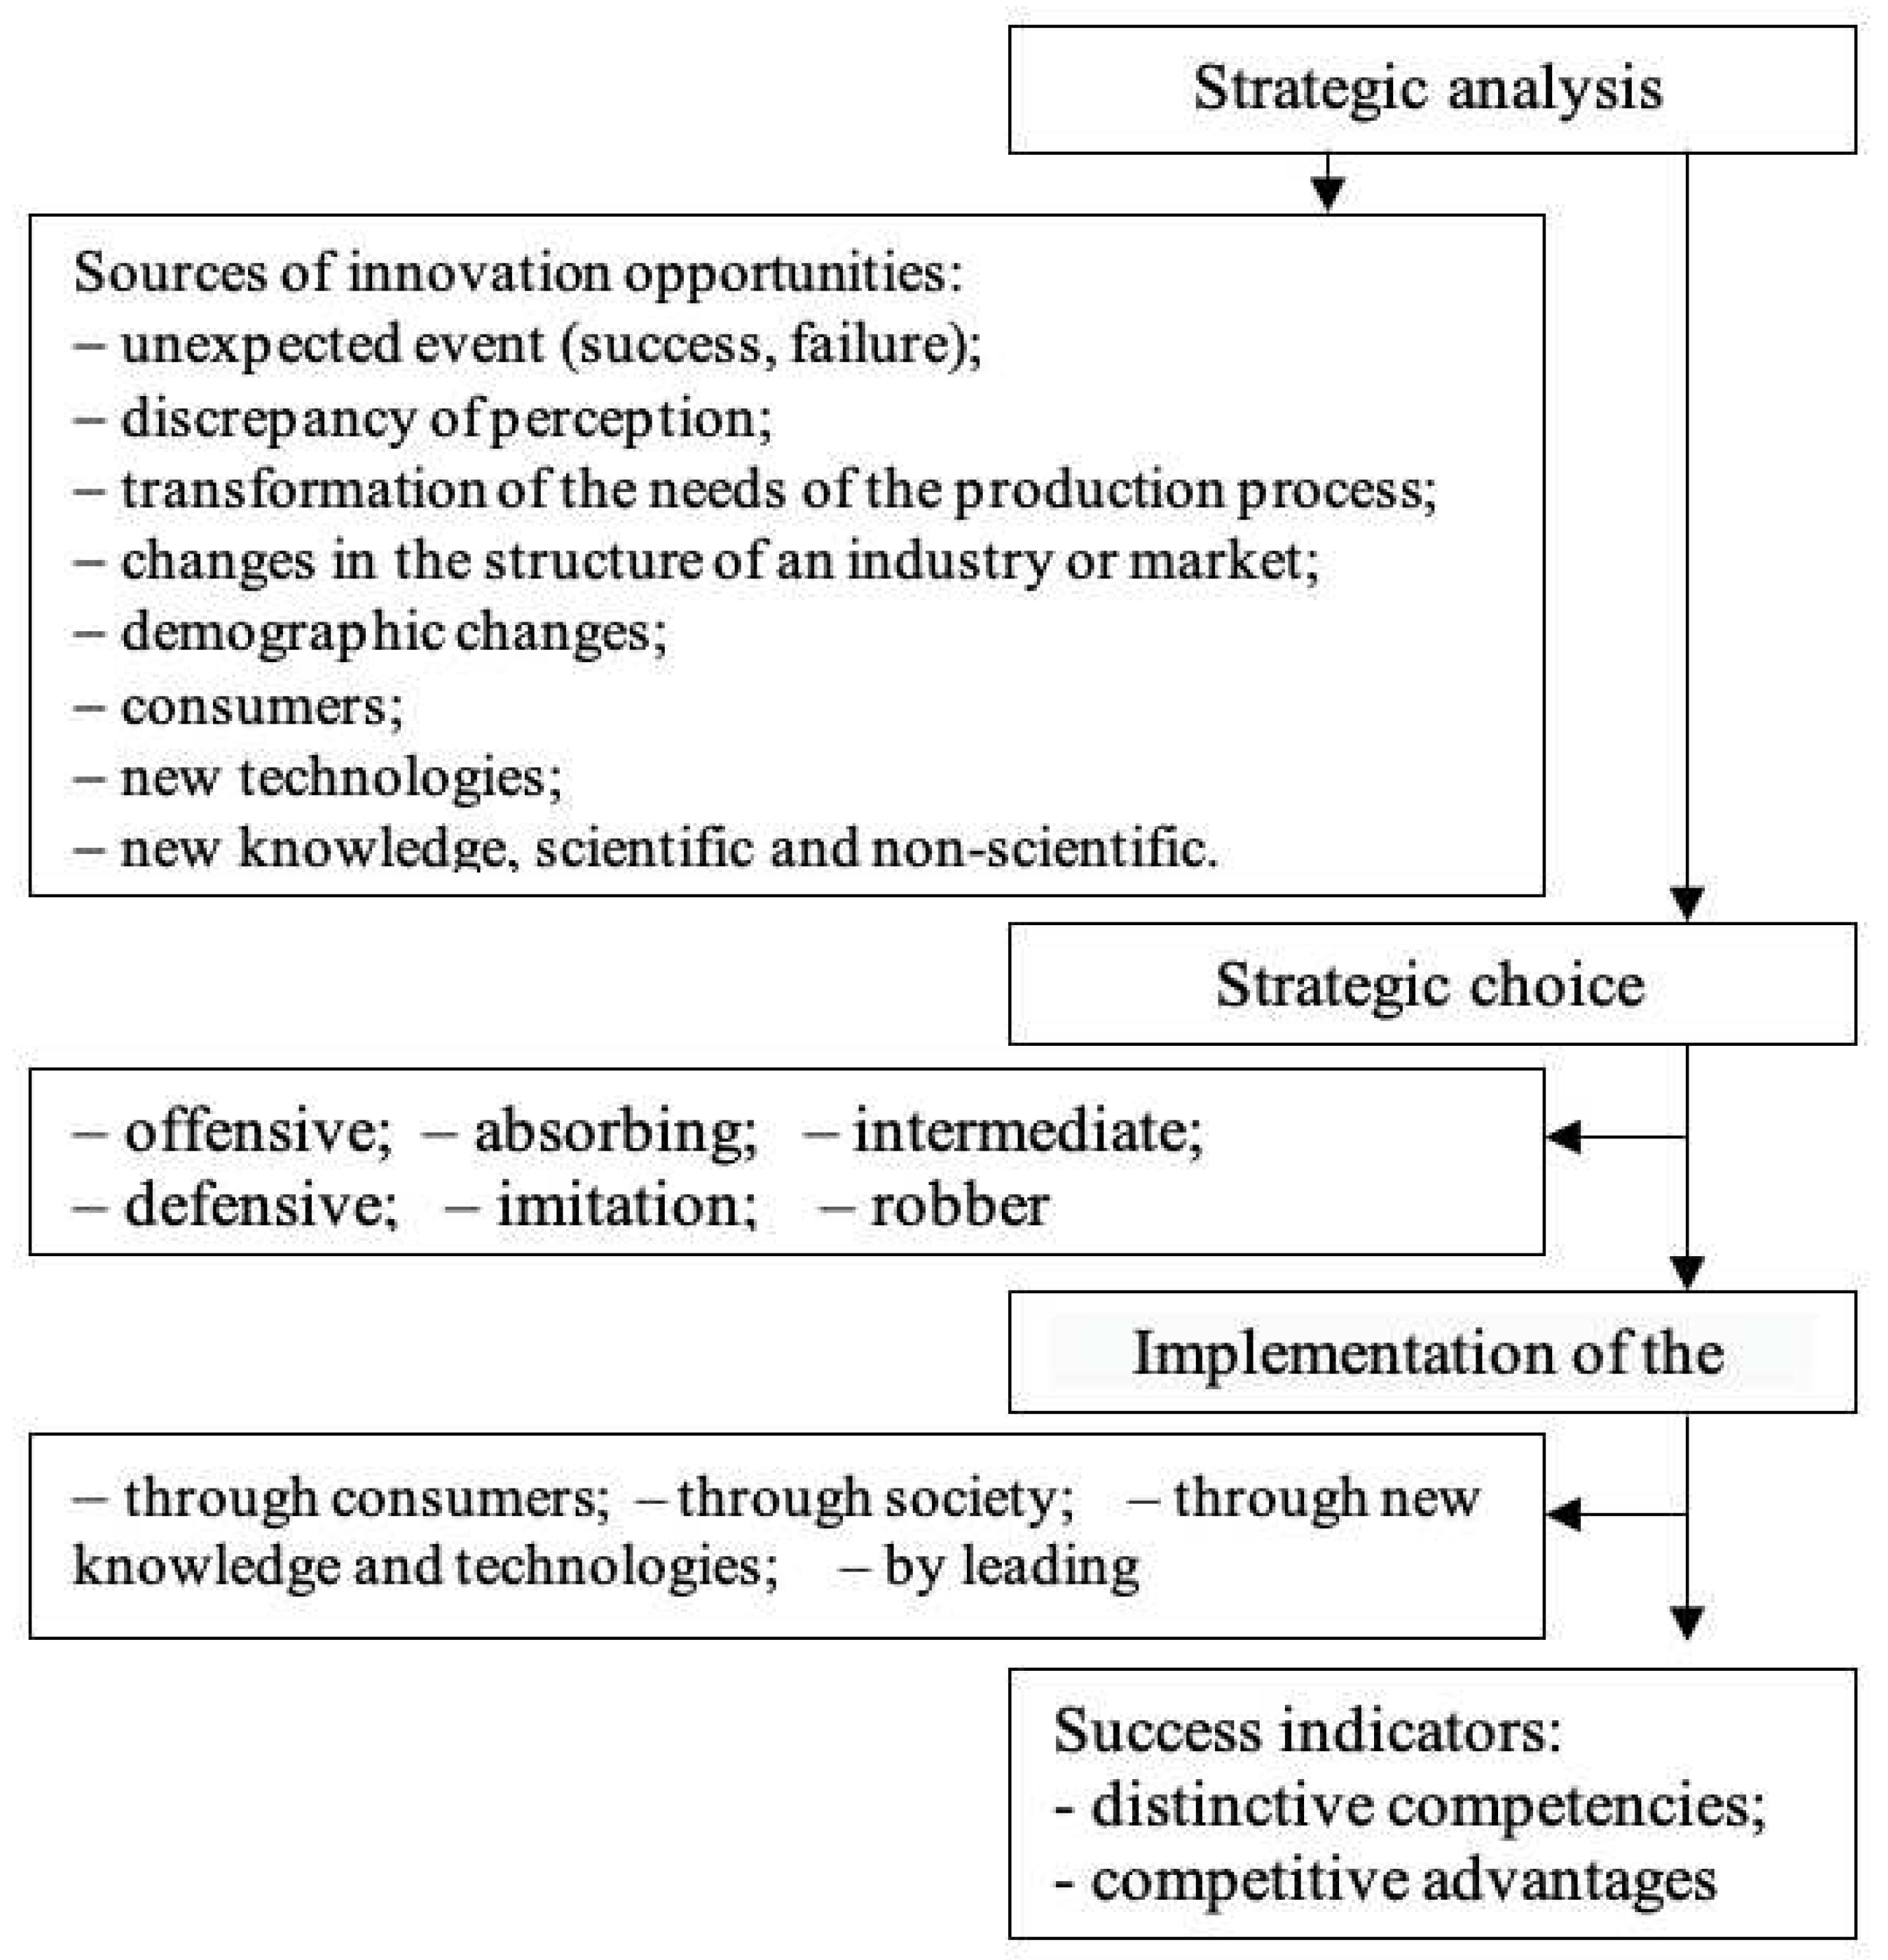
In the process of planning innovations, the main focus is on making a reasonable choice of the main directions of innovation. Strategy, in the context of innovation management, refers to a conscious and thoughtful set of norms and rules that underlie the development and adoption of strategic decisions affecting the future state of the enterprise. It serves as a means of connecting the enterprise with the external environment. The development of measures and plans, such as programs and projects, is an essential aspect of strategy to achieve the intended goals. These plans should consider the scientific, technical, and production potential of the enterprise, as well as its market and sales opportunities. The management of the innovation process entails the crucial task of developing and implementing the innovation strategy of the economic entity, which is subordinate to the general strategy. The innovation strategy establishes the goals of innovation, determines the means to achieve them, and identifies the sources of funds for innovation. (
Figure 1) [
6,22].
An economic unit engaging in innovative activities can apply various types of strategies, depending on its goals, the theory of the product life cycle, market position, and ongoing scientific and technical policies.
The methodology for strategic planning of innovative changes enables the determination of the development goals of the object of strategic planning, approaches to solving problems, and a system of indicators that optimize strategic plans for innovative changes. An innovative strategic development plan typically consists of a set of innovative projects or a "portfolio" of projects. The selection of promising projects, resource allocation, and determination of final results based on specific criteria are crucial in this process.
Projects involving innovative changes are characterized by significant information complexity and a high degree of uncertainty in the initial stages. Effectively managing such projects requires well-structured information about the upcoming work stages.
At this stage, it becomes necessary to establish permissible sets of elementary processes and their combinations that lead to the emergence of innovative products of appropriate quality. From these permissible sets, a realized set of innovations is selected, forming an innovative change. When considering an individual enterprise as the object at the first level, it becomes part of a higher-level set with specific characteristics at the subsequent level.
The degree of achievement of innovative goals for enterprises depends significantly on the optimality of the organizational form of the innovator.
The innovative behavior of socio-economic systems (CES) is diverse, and various classification features can be used to analyze it. According to L. G. Ramenskiy, there are four types of innovative behavior for enterprises based on their goals: violets, commutants, patents, and explorents.
Socio-economic systems are classified as complex systems. Planning complex systems in the economy requires considering several properties to ensure the adequacy of the constructed plans.
Table 1 presents the most important properties and characteristics of complex systems in the economy.
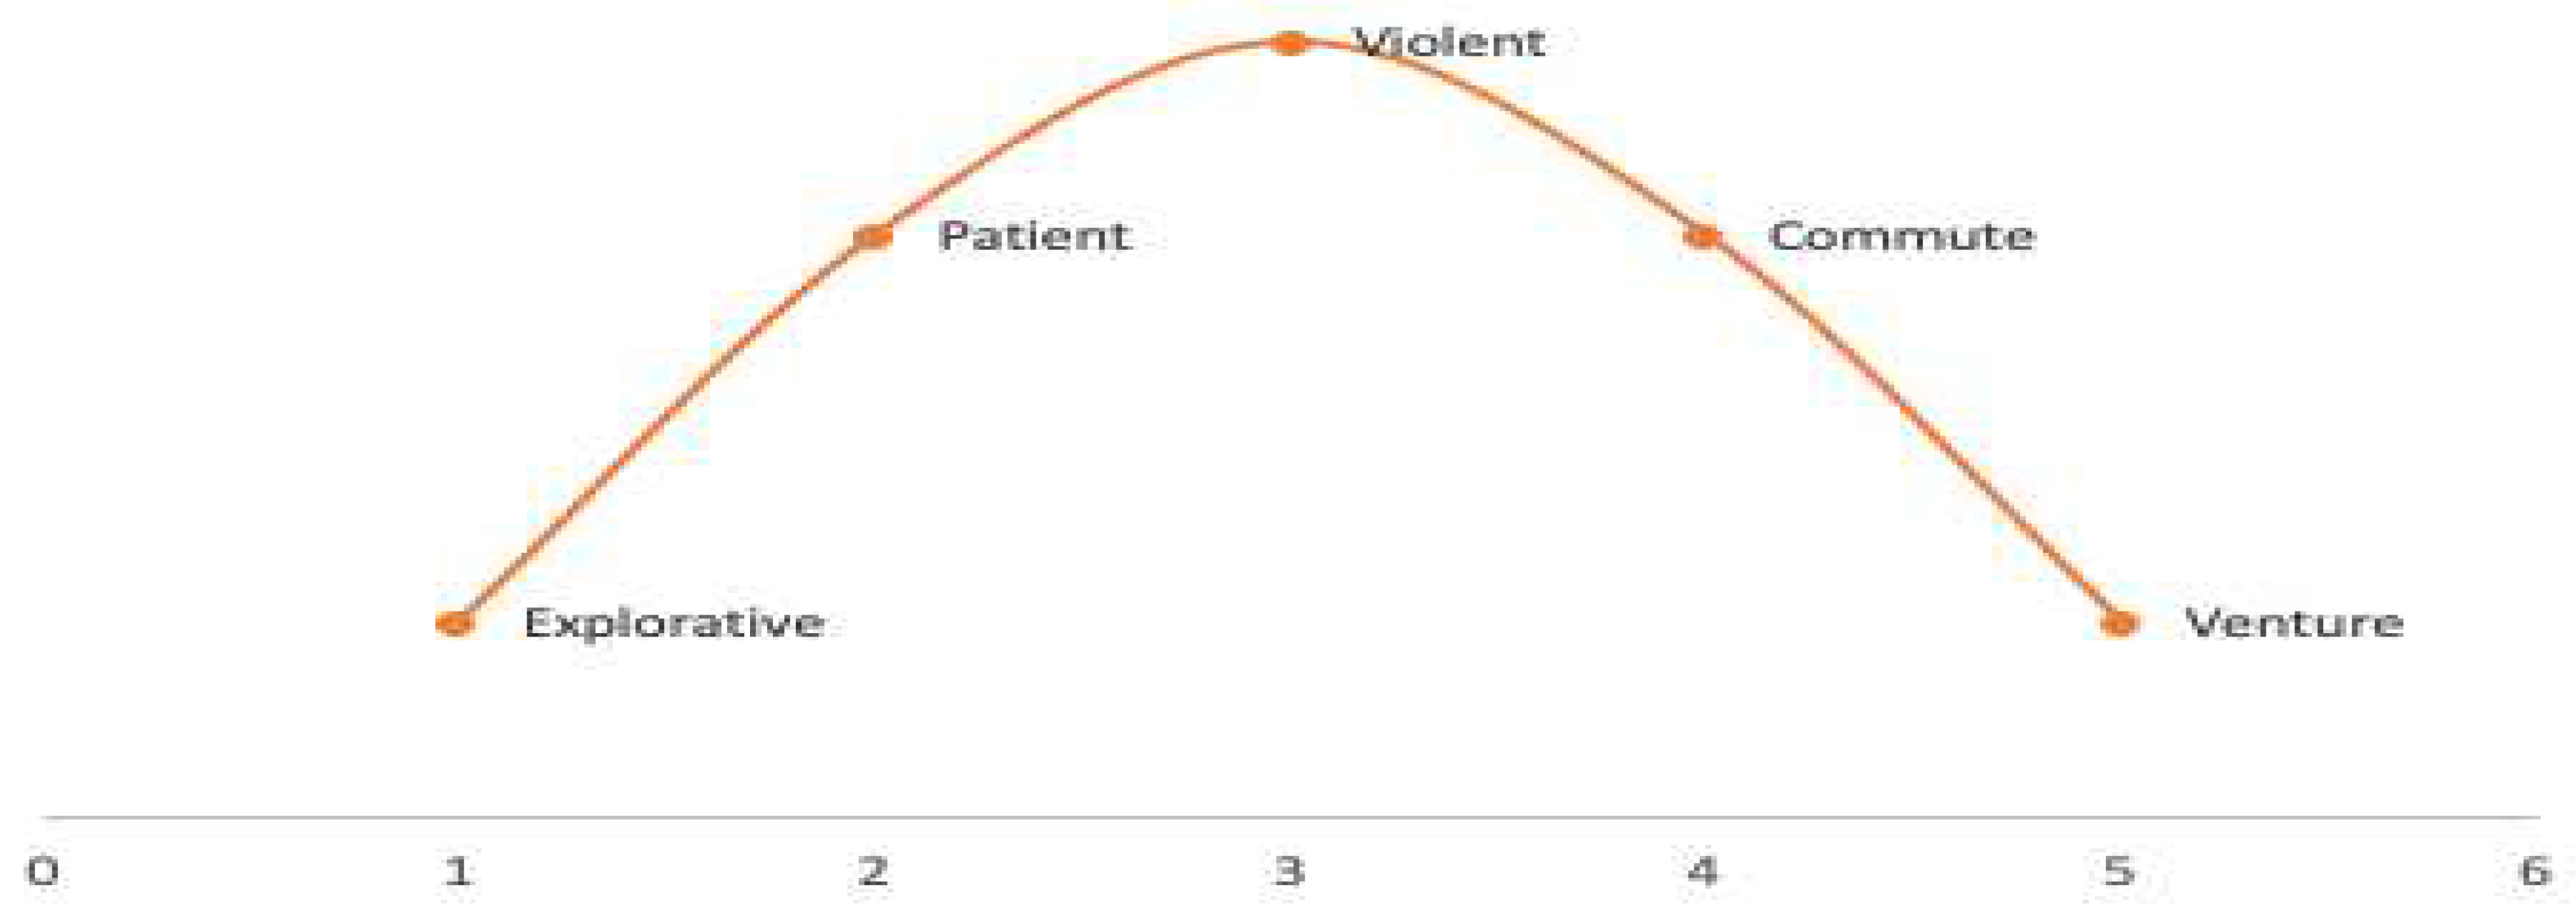
Each stage of the planning process corresponds to specific features of the state of the socio-economic system, which in turn characterize the type and strategy of the innovation system (
Figure 2).
These characteristics provide insights into the nature and behavior of complex systems in the economy, highlighting their interconnectedness, adaptability, and inherent unpredictability.
According to the approach mentioned, strategic behavior in complex systems can be categorized into the following types:
Exploitative Stage: This stage involves the emergence of a system in a market economic environment and the formation of its initial structure. These are small systems characterized by dedication, a strong commitment to the idea, highly skilled employees, and competent leadership. These systems allocate significant resources to research and development (R&D).
Patent Stage: Patent systems, also referred to as "sly foxes," can vary in size. The strategy at this stage is to differentiate products and focus maximum effort on a narrow market segment. Patents leverage differences in product quality, services, and advertising. The primary focus is to determine and deliver consumer value. Development in this stage can take two directions:
- -
stagnation or moderate growth within the occupied market segment. If the market segment's volume stagnates, the system's growth stops; otherwise, it expands in size;
- -
change of strategy and transformation into a larger violet system.
Violet Stage: Systems exhibiting innovative violet behavior are characterized by a large number of employees, multiple branches and subsidiaries, and a wide range of products. These systems make significant investments in R&D and maintain extensive marketing networks. Violet products are known for their excellent quality, standardization, unification, and manufacturability, resulting in lower prices due to mass production. Typical representatives of this type are multinational companies that create oligopolistic markets. Violets can further evolve into "proud lions," "mighty elephants," and "hulking hippos" based on their evolutionary development stages.
Proud lions focus on a narrow but massive range of highly demanded goods, displaying the most dynamic pace of development, large-scale production, and R&D expenditures.
Mighty elephants exhibit average dynamic development and extended diversification to compensate for a potential loss of a leader's position in the region, aiming for stability. This type prefers implementing successful innovations rather than creating them from scratch.
Hulking hippos comprise small systems oriented towards meeting local and national needs, characterized by wide diversification. They transition smoothly to the commutative behavioral type, actively participating in the routinization of new products through imitative activity, as imitation is cheaper than independent innovation.
Commutative Stage: This stage involves the ability to search for strategic partners through engagement with switching systems. Small firms, which cater to local, narrow-group, or even individual demands, play a unifying and connecting role in the economy. These firms undertake tasks that are not of interest to violets, patents, or exporters, hence the term "commutants." They facilitate the diffusion of innovations while also routinizing them. Small firms actively promote new products, technologies, and services based on innovations, accelerating the diffusion process. The commutative stage also encompasses a venture type of behavior observed in systems with flexible and mobile structures. These systems excel in the speed of new product development, surpassing the capabilities of large enterprises. These ventures often engage in product production and transfer their developments to other systems. Due to their small scale, these systems have a limited number of employees.
Each system type (viola, commutators, patents, ventures, and exporters) possesses unique characteristics and varying degrees of strategy implementation to achieve product competitiveness (refer to
Table 2 for details).
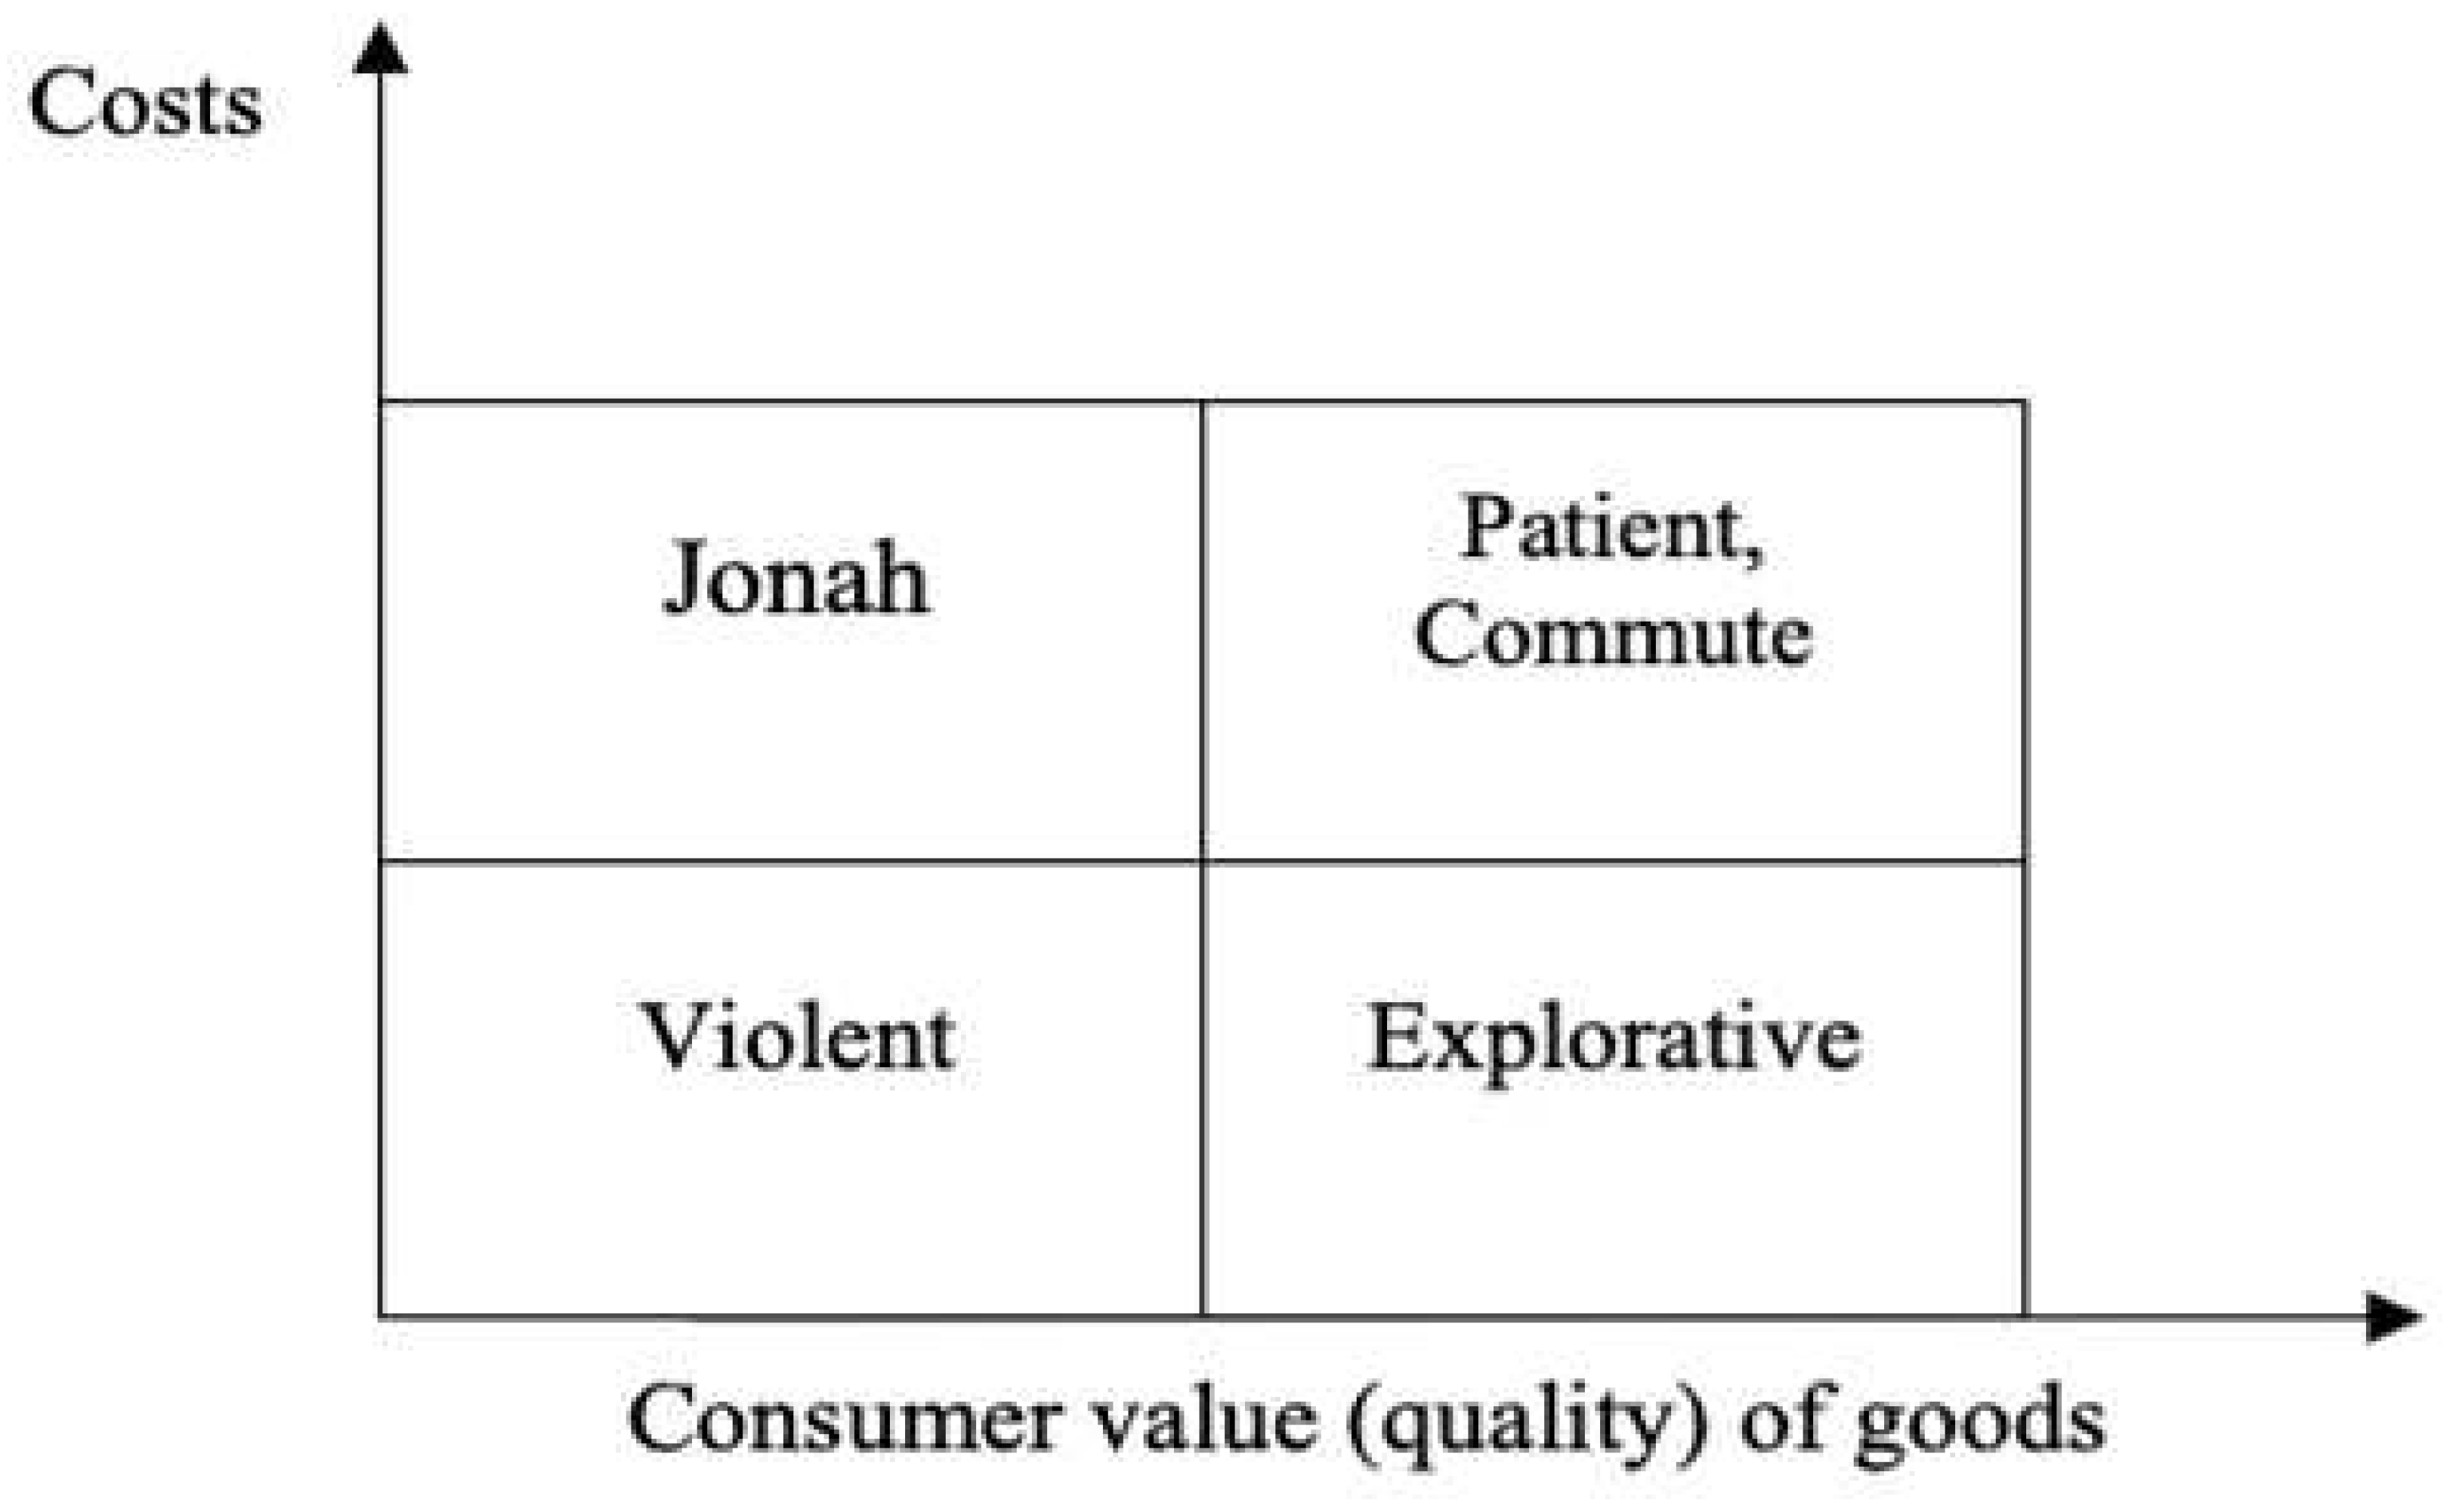
To determine the market segment of an innovator, the "Costs - Use Value" matrix (
Figure 3) can be utilized. This matrix helps analyze the relationship between costs and the value of a product.
The analysis of
Figure 3 reveals that explorative strategies face the greatest challenges. Surviving in the market requires simultaneously improving the quality of goods and reducing their costs. However, relying solely on partial improvements can leave other strategies vulnerable. Research indicates that the improvement of quality is a crucial factor for the success of new products in the market.
To remain competitive in a specific market segment, when technology advancements or production organization improvements are not possible, enterprises often have to reduce the price of their goods and decrease profit margins. Switching enterprises and patents, while maintaining production costs, can enhance the quality of manufactured goods by introducing innovations. Violent strategies involve implementing innovative approaches to enhance technology, production organization, labor, and management. Those who fail to innovate in a timely manner in terms of products and processes are eventually ousted from the market due to the objective law of competition.
Table 3.
Presents a classification of types of innovative behavior [
1,
10].
Table 3.
Presents a classification of types of innovative behavior [
1,
10].
| Indicator |
Type of competitive behavior (classification by L. G. Ramensky) |
| Violent |
Patient |
Explorative |
Commute |
| 1. Level of competition |
Tall |
Low |
Middle |
Middle |
| 2. The novelty of the industry |
Mature |
New |
New |
Mature |
| 3. Types of needs served |
Bulk, standard |
Massive, but non-standard |
Innovative |
Local |
| 4. Production profile |
Massive |
Specialized |
Experimental |
Universal small |
| 5. Company size |
Large |
Large, medium, small |
Medium and small |
Small |
| 6. Stability of the company |
Tall |
Tall |
Low |
Low |
| 7. Expenditure on R&D |
Tall |
Middle |
Tall |
Absent |
| 8. Competitive advantage |
High performance |
Adaptation to a specific market |
Leading the way in innovation |
Flexibility |
| 9. Dynamism of development |
Tall |
Middle |
Tall |
Low |
| 10. Costs |
Low |
Middle |
Low |
Low |
| 11. Product quality |
Middle |
Tall |
Middle |
Middle |
| 12. Assortment |
Middle |
Narrow |
Individual orders |
Narrow |
| 13. Type of R&D |
Improving |
Adaptive |
Breakthrough |
Absent |
| 14. Sales network |
Own or controlled |
Own or controlled |
Absent |
Absent |
The variety of corporate strategies and organizational forms of business entities offers numerous strategic positions and options for selecting competitive strategies with an innovative focus. To navigate this decision space effectively, it is crucial to adequately assess the firm's position in the market and identify its strategic competitive behavior.
3. Results
The effectiveness of managing the organization of innovative activities within business entities is evident through the synergistic interaction of various stages associated with the process of developing, implementing, and promoting innovations. Additionally, these stages are closely connected with changing the mental resource of employees, including the formation of corporate culture, business image, labor motivation system for innovation development and implementation, and corporate social responsibility.
Six stages of organizing innovative activity have been identified, aligned with the mechanism of developing and implementing investment projects:
1) planning of idea carriers; 2) determination of basic and functional strategies, as well as establishing a system of goals for their implementation; 3) assessment of innovative potential; 4) formation of the structure, regulations, and criteria for implementing and controlling innovations; 5) development and examination of innovative projects; 6) preparation of an innovation program and an innovation budget, including an assessment of innovation effectiveness. The success of an innovation project is reflected in the interdependence between technology, operating costs, sales volume, and the price of the new product or service being offered. This is manifested through growth rates of economic value added and financial efficiency. From a societal perspective, the resource intensity of the innovation program decreases.
Table 4 presents a general grouping of the developed system of analytical indicators that enable the assessment of an economic entity's innovation activity. These indicators cover the scientific and technical level of innovation, the specific manifestation of the innovation process, and different aspects of evaluating innovation effectiveness.
The socio-economic system (SES) has been chosen as the subject of research, and it is important to consider multiple levels within the SES:
- -
macro-level: This represents the country as a whole (concept);
- -
meso-level: This refers to regions (plan);
- -
micro-level: This pertains to individual enterprises (program).
Creating a computer-mathematical model for innovation planning in computer science can involve the use of optimization techniques. Optimization techniques are mathematical approaches that aim to find the best solution to a given problem by maximizing or minimizing a specific objective function.
One approach to developing a computer-mathematical model for innovation planning is utilizing linear programming. Linear programming involves optimizing a linear objective function while adhering to a set of linear constraints. In the context of innovation planning, the objective function could represent the expected value or impact of a specific innovation, while the constraints could reflect the available resources and limitations of the organization.
The integral indicator
R, which represents the quality index of the evaluated program, can be defined as the sum of the products of the values of complex criteria (
) and their corresponding weight characteristics
, as shown in formula (1):
Here:
- weight characteristics of the importance of complex criteria ;
- is the number of the complex criterion;
- values of complex criteria
Complex criteria
are typically derived from mathematical operations performed on a group of p initial indicators
,, where
, which describe the object being evaluated. The formulation for complex criteria is given as:
To assess the compliance of programs (plans), a set of complex criteria can be selected based on a system of analytical indicators for assessing innovative activities (
Table 4). Weight characteristics of importance are then assigned to each complex criterion, considering the number of indicators included in each group. The obtained data is as follows:
- scientific and technical level of innovation, ;
- innovation process, ;
- efficiency of innovation activity, ;
To normalize the real assessment according to the b_ij criterion, the formula (2) is used:
Here:
- is an expert assessment set for the particular criterion for assessing on a point scale;
- is the maximum possible value of the expert assessment for a particular criterion for assessing on a point scale;
- is the minimum possible value of the expert assessment for a particular criterion for assessing on a point scale.
Weighting coefficients w_ij are then established for specific assessment criteria, considering their partial contribution to the overall assessment (
Table 5,
Table 6 and
Table 7).
Calculations of particular criteria by types of innovative behavior, with the establishment of appropriate weighting factors, are given in
Table 8.
The normalization of the estimates obtained was carried out by an expert method, the calculations of which are presented in
Table 9. The values of complex criteria for various types of innovative behavior are given in
Table 10.
To assess the complex coefficients of the criteria, the classification of the system of indicators is used, given in
Table 11.
The values of the complex coefficients show that venture capitalists, violets, and exporters have a significant scientific and technical level of innovation (), violets are far superior to all in the innovation process (), switches have the lowest indicator of the innovation process, and the efficiency of innovation () has a spread the least significant by types of behavior.
The calculated integral indicators for various types of innovative behavior are given in
Table 12
The integral indicator, which serves as a comprehensive measure for assessing the level of innovativeness, holds significant importance for violets but is least relevant for commutants (see
Figure 4).
In the field of computer science, there exist several key metrics that organizations can utilize to gauge the effectiveness of their innovation planning endeavors. One such metric is the quantity of new ideas or technologies generated. This metric aids organizations in tracking the output of their innovation planning efforts and evaluating whether they are generating a sufficient volume of ideas. Another metric is the success rate of new ideas or technologies, which enables organizations to assess the quality of their ideas and identify areas for improvement. Additionally, the impact of new ideas or technologies on the organization is a vital metric that involves measuring their financial impact, operational efficiency, and customer satisfaction. Furthermore, the level of employee engagement in the innovation process serves as a fourth metric, which helps organizations evaluate the level of buy-in and support for innovation among employees while identifying potential barriers to innovation. To summarize, organizations can employ several key metrics, including the quantity of new ideas or technologies generated, the success rate of these ideas or technologies, their impact on the organization, and the level of employee engagement, to effectively measure the effectiveness of their innovation planning efforts in computer science. By tracking these metrics, organizations can gain valuable insights and identify areas for improvement.
Through our analysis, we have discovered that the choice of an innovative behavior model for a firm's planning depends on environmental factors. Once a certain level is reached, welfare no longer plays a primary role in determining the model of innovative behavior within the socio-economic system. On the contrary, the endowment of scientific research potential becomes the determining factor for the type of innovative behavior in systems with a sufficient level of welfare. Even against the backdrop of relatively high welfare, a relatively low level of research resources prevents the acquisition of a specific role function. For further calculations, we present an innovative model based on generalized average data, which incorporates all the criteria of the considered socio-economic systems.
The effective utilization of existing potential for innovative development in socio-economic systems is the solution to the key tasks of planning innovative activities.
There exist several key strategies that organizations can employ to effectively implement innovation planning in the field of computer science. One strategy involves establishing an innovation team or task force, comprising a diverse group of individuals responsible for identifying and evaluating potential innovations, as well as developing and implementing plans for their execution. This team should encompass individuals with varying skills and perspectives to ensure a comprehensive approach to innovation planning.
Another strategy is adopting a structured approach to innovation planning, such as roadmapping. As previously mentioned, roadmapping entails creating a visual representation of an organization's innovation goals and plans. This aids organizations in identifying crucial milestones, allocating resources, and understanding dependencies while allowing them to track progress and adjust plans accordingly.
Encouraging a culture of innovation represents a third strategy. This entails providing employees with the necessary resources and support to generate and test new ideas, as well as recognizing and rewarding innovative thinking. Organizations may also consider implementing processes and practices that foster continuous improvement and experimentation, such as design thinking or agile methodologies.
The fourth strategy involves leveraging external sources of innovation, such as partnerships, collaborations, and external research and development. By engaging with external organizations, companies can access a broader pool of ideas and expertise, while also potentially gaining entry into new markets and technologies.
To summarize, there are several key strategies that organizations can employ to effectively implement innovation planning in computer science. These include establishing an innovation team or task force, adopting a structured approach to innovation planning, fostering a culture of innovation, and leveraging external sources of innovation. By following these strategies, organizations can effectively identify and prioritize new ideas and technologies that drive growth and enhance competitiveness.
Now, let us proceed with calculating the potential of socio-economic systems for innovation using Ukraine as an example. The innovative potential of socio-economic systems comprises three main components: financial, material and technical, and personnel.
For the calculation of Ukraine's innovative potential in socio-economic systems, we propose the use of two indicators for each component.
The following indicators characterize the proportion of individuals engaged in innovative activities within the total population:
Number of individuals employed in science and scientific services as a percentage of the total labor force (P).
Employment in medium and high-tech production as a percentage of the total labor force (F).
- 2.
Financial Component:
Indicators within this group characterize the physical volumes of financing in the innovation sphere, such as the share of investments relative to GDP and the share of investments in the total volume:
Total expenditures on research and development (R&D) as a percentage of GDP (E).
Share of the volume of sold innovative products (goods and services) in the total volume of sold products (goods and services) of industrial enterprises, expressed as a percentage (I).
- 3.
Material and Technical Component:
Indicators within this group characterize the number of organizations involved in scientific activities and possessing a material and technical basis for innovation:
Share of industrial enterprises that have introduced innovations (products and/or technological processes) in the total number of industrial enterprises, expressed as a percentage (T).
Number of registered patent applications for inventions and utility models per year, per total workforce (Y).
All data are given for the period 2012-2021 in
Table 13.
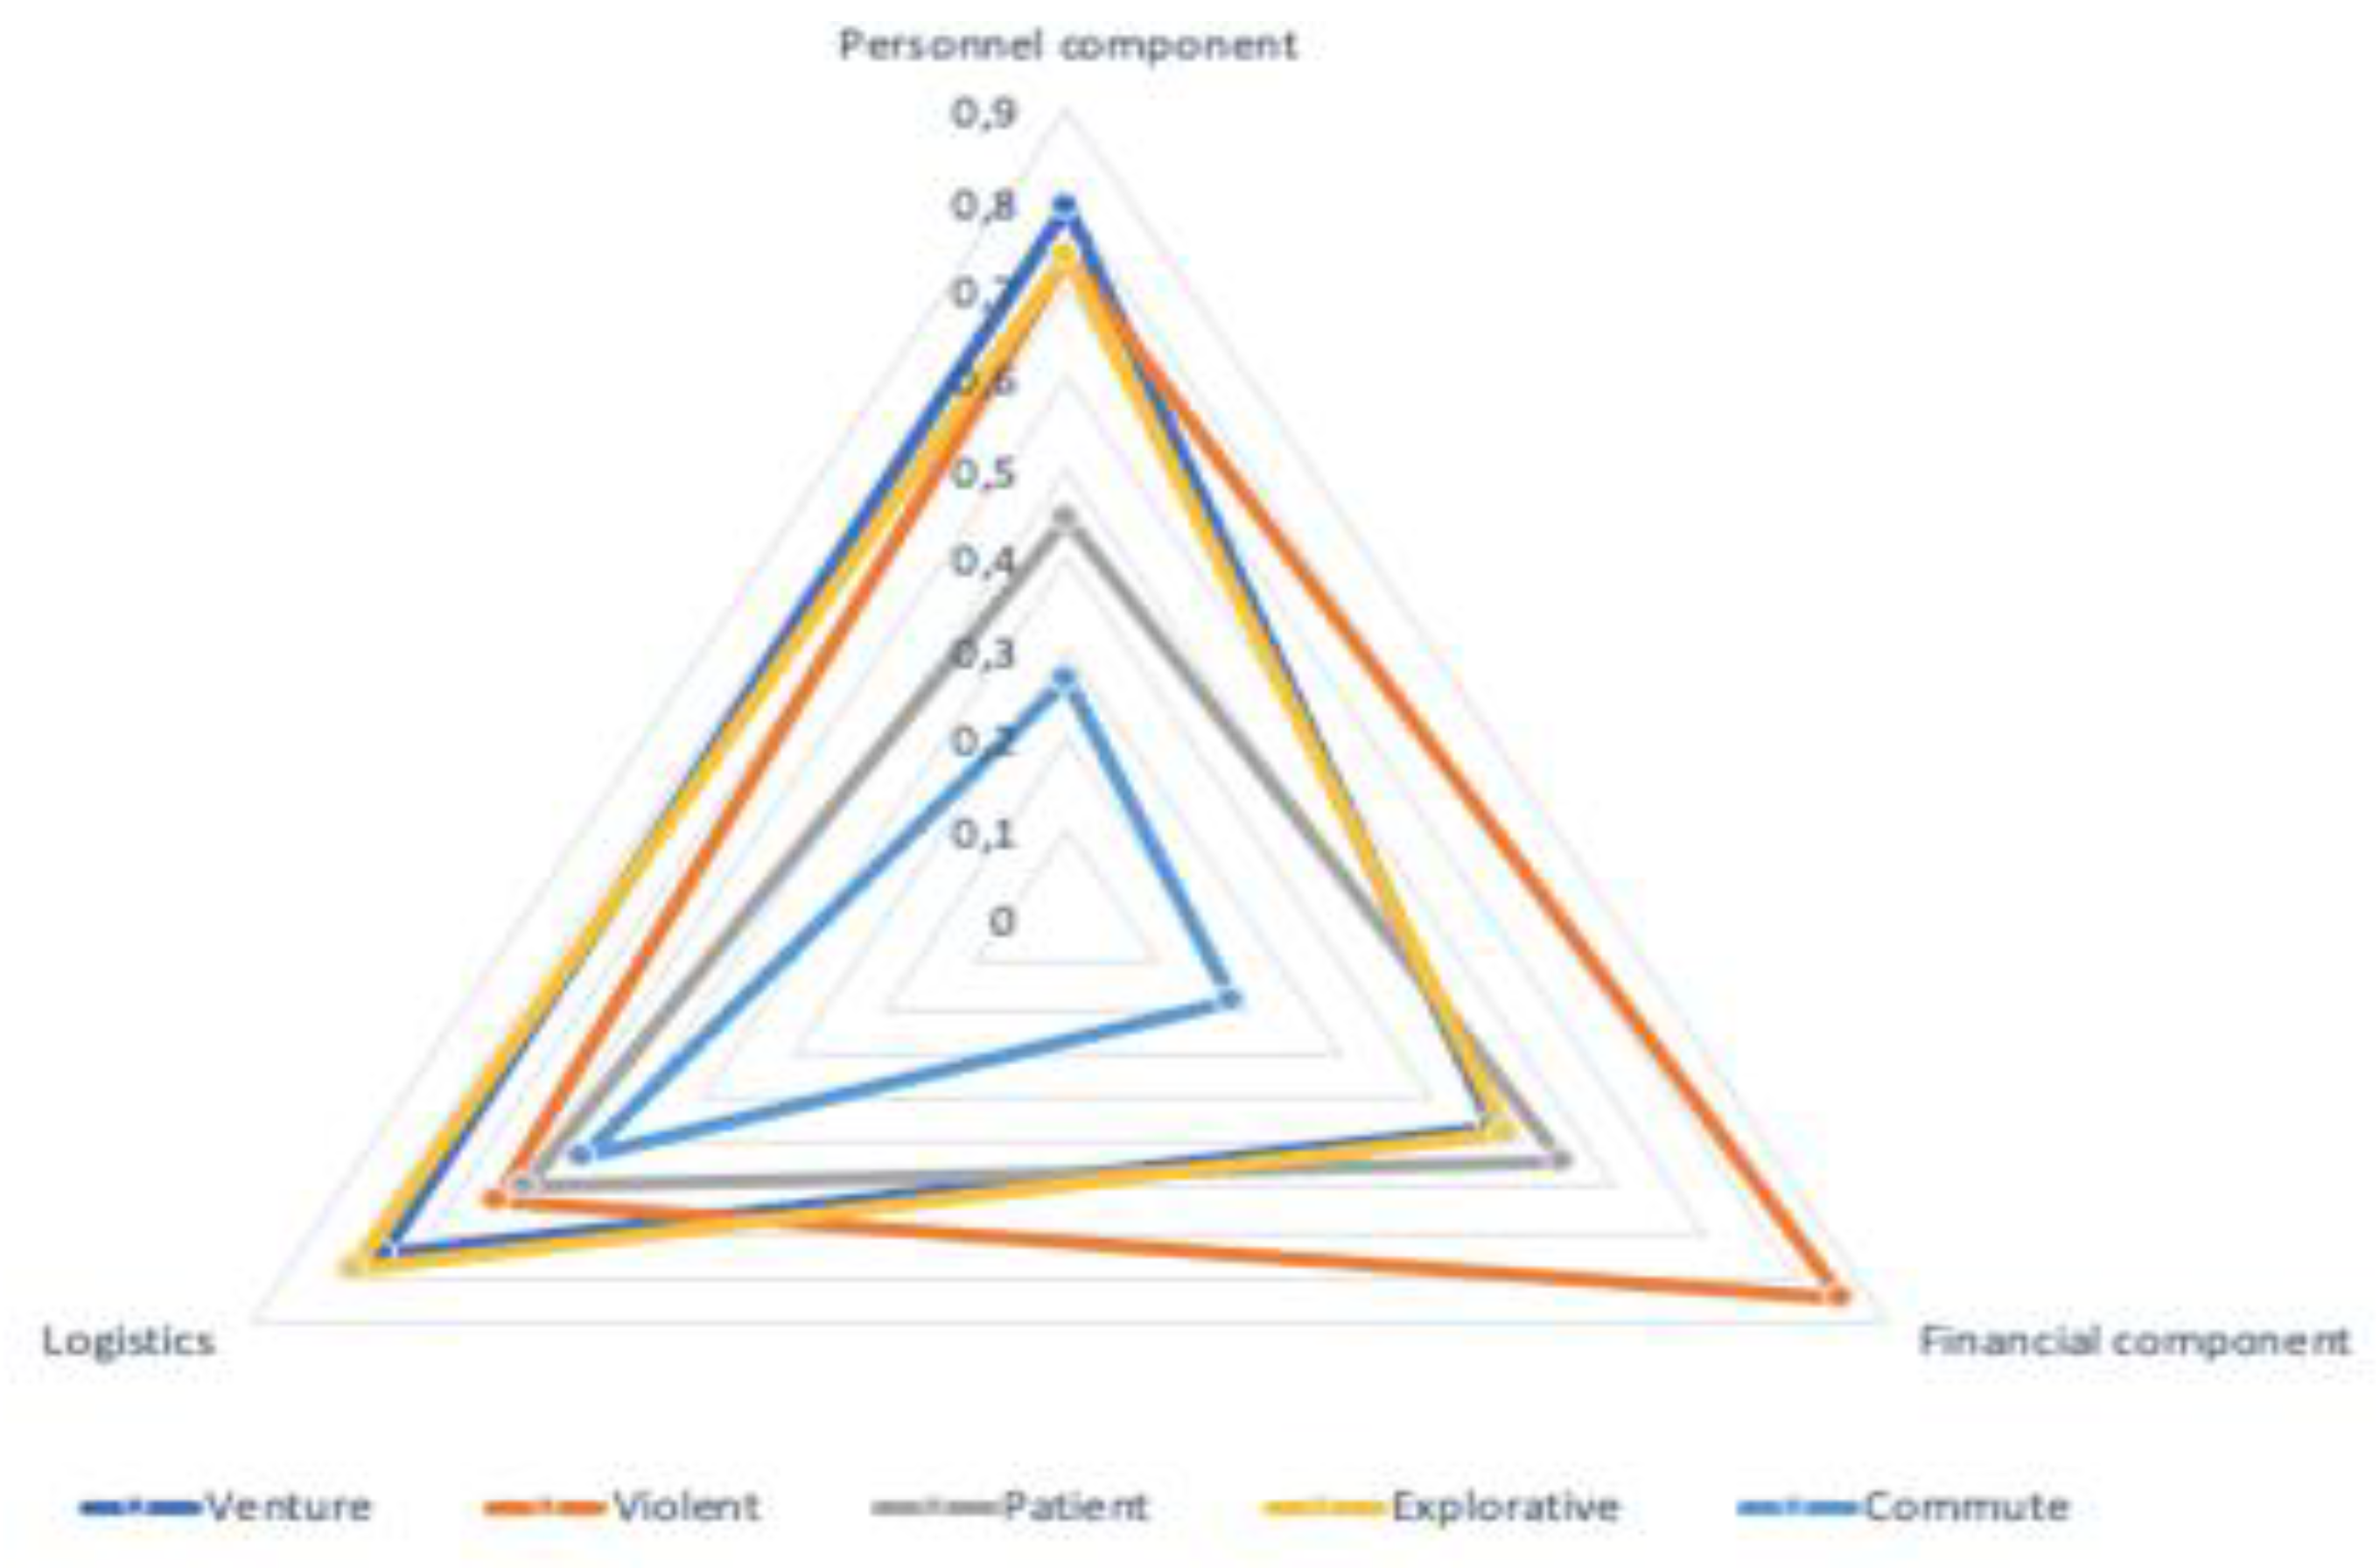
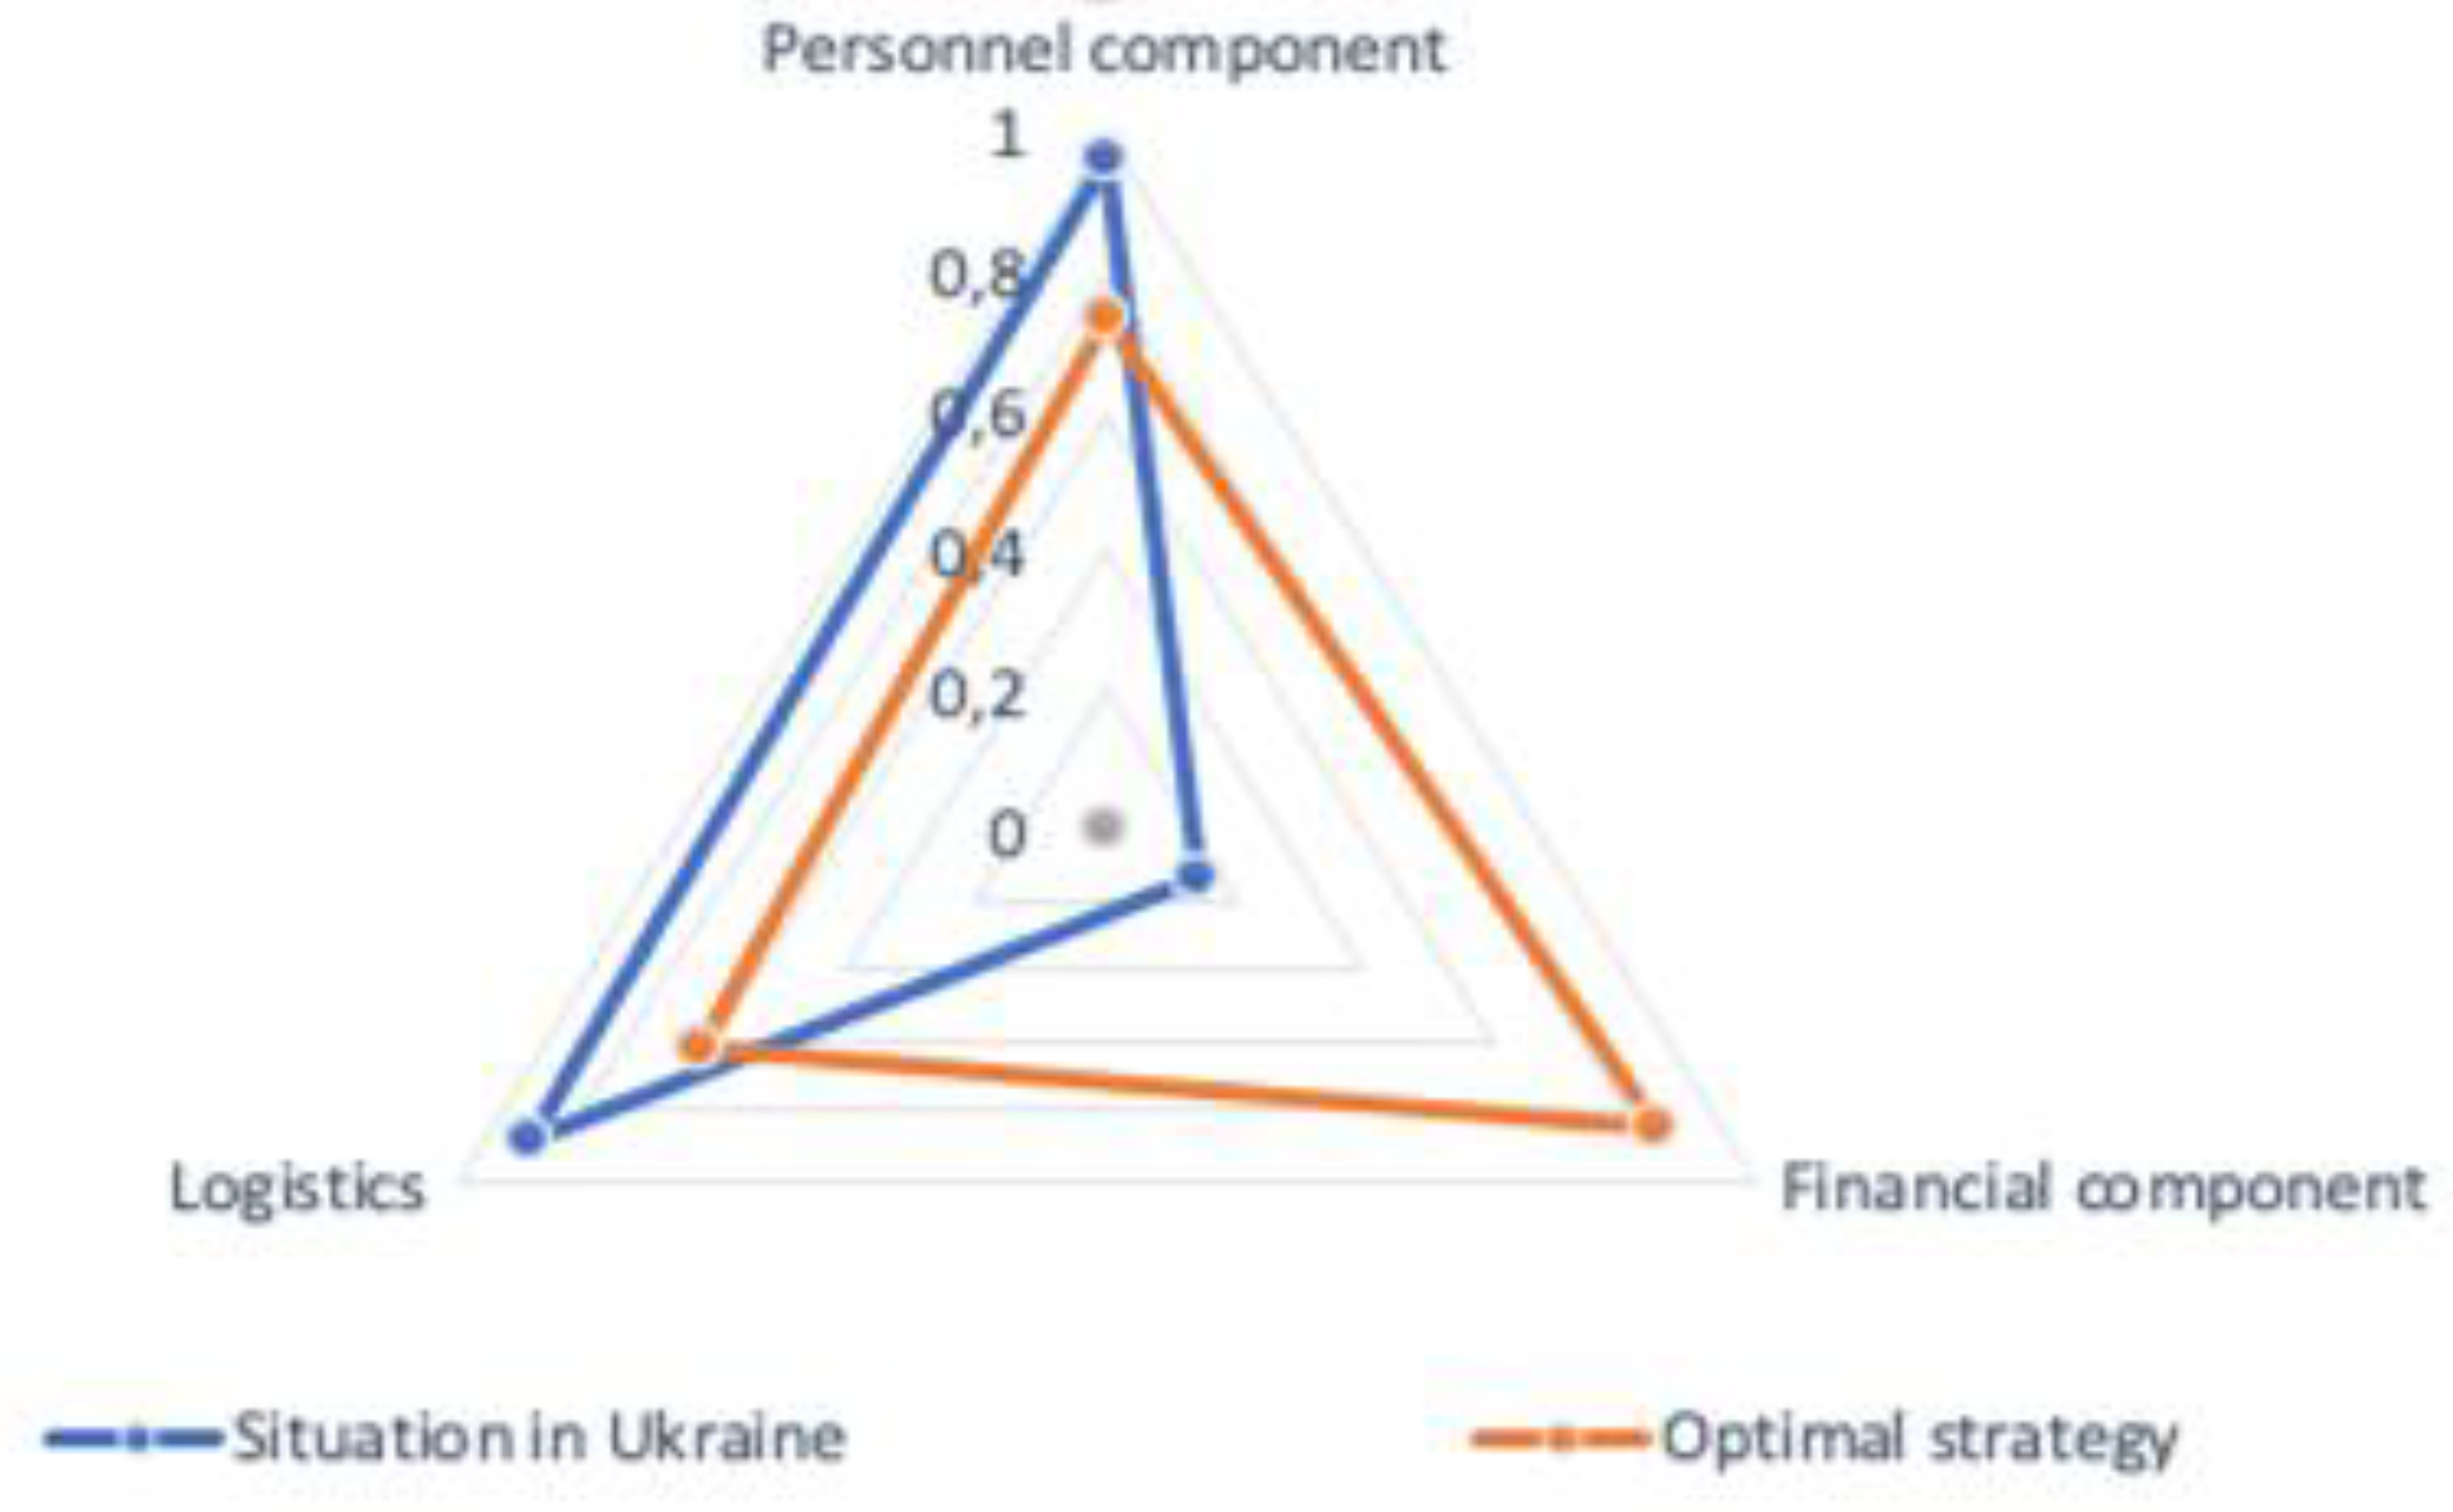
The constructed innovative profile of Ukraine was analyzed using an optimal strategy, which was derived from all considered socio-economic systems based on the highest integral indicator of viability and overall performance, visually resembling the optimal strategy (see
Figure 5).
This approach enables the determination of the type of innovative behavior by considering a set of criteria. It also aids in identifying the diffusion process, which results from the increased production of innovative products consumed by the market.
The strategy for the innovative development of Ukraine, in relation to the potentially optimal state, is characterized by a lag in terms of the financial component and well-being level. In conditions of a low financial component, the innovation process is formally restricted. The absence of a deficit in research resources encourages the active utilization of closed innovations aimed at improving and modernizing already existing products within the domestic market. As prosperity grows, it becomes possible to independently create new innovations not only for the domestic market but also for the international market.
Understanding the growth rate of costs in the R&D cycle and their share in the total investment in technological development for new product production and commercialization is crucial for effective innovation management and planning.
The assessment of the scientific and technical factors pertaining to Ukraine's national security should be conducted with the aim of achieving conditions that would allow the country to secure a prominent position in the global economy.
In order to address this optimization problem, the model can identify a set of innovations that maximize the expected value or impact, taking into account the available resources and limitations. Alternatively, decision analysis techniques like decision trees or expected value analysis can be employed. These techniques involve evaluating potential outcomes associated with different decisions and their corresponding probabilities, ultimately selecting the decision with the highest expected value. Within the context of innovation planning, decision analysis techniques can be used to assess potential outcomes of various innovations and identify those that offer the greatest expected value or impact.
To summarize, a computer-mathematical model for innovation planning in computer science can be created using optimization techniques such as linear programming or decision analysis. By defining an objective function and constraints, and solving the optimization problem, the model can identify a set of innovations that maximize the expected value or impact considering the available resources and limitations.
To formulate the equations for an innovation planning model using optimization techniques, it is necessary to define the objective function and constraints and express them as mathematical equations.
The objective function represents the goal of the innovation planning process, which could involve maximizing the expected value or impact of the innovations. This function needs to be defined in terms of variables that represent the different innovations under consideration. For instance, if the goal is to maximize the expected value of the innovations, the objective function might be expressed as follows:
Here, E is the expected value, p[i] is the probability of success for innovation i, and v[i] is the value of innovation i.
The constraints represent the available resources and limitations of the organization, such as budget, personnel, and time. These constraints should also be defined in terms of variables that represent the innovations. For example, if there is a budget constraint, it can be expressed as:
In this equation, c[i] represents the cost of innovation i, x[i] is a binary variable indicating whether innovation i is selected (1) or not selected (0), and B represents the budget.
Once the objective function and constraints have been defined, a mathematical optimization solver can be employed to determine the optimal solution for the problem at hand.
To construct equations for an innovation planning model using optimization techniques, the objective function and constraints must be explicitly defined and expressed mathematically. The objective function signifies the goal of the innovation planning process, while the constraints represent the available resources and limitations within the organization. Solving these equations enables the identification of the set of innovations that maximizes the expected value or impact, considering the given resources and limitations.
When creating an innovation planning model using optimization techniques, several additional factors should be considered. One such factor is the level of complexity inherent in the model. While more intricate models may encompass greater detail and nuance, they can also pose challenges in terms of solvability and resource requirements. Thus, striking a balance between model complexity and solution tractability is crucial.
Another consideration relates to the data and assumptions utilized in constructing the model. Employing accurate and up-to-date data is vital to ensure the validity and reliability of the results. Additionally, careful consideration of the assumptions made during model construction is necessary, as they can significantly impact the outcomes.
An alternative approach to address the problem of planning random innovations through functional programming involves leveraging a functional programming language such as Haskell or ML. This approach entails implementing a model capable of generating and evaluating random innovations. To achieve this, a set of functions representing different aspects of innovation, such as value, risk, and feasibility, can be defined.
These functions would accept inputs representing the characteristics of an innovation and produce outputs corresponding to the respective values for these aspects. For instance, a function called "value" could be established to take an innovation as input and return a value between 0 and 1, indicating its potential value. Similarly, a function called "risk" could be defined to assess the potential risk of an innovation, also yielding a value between 0 and 1.
To generate and evaluate random innovations, functional programming techniques like recursion and higher-order functions can be utilized. These techniques enable iterating over a substantial number of random samples and assessing their characteristics using the defined functions. Subsequently, statistical or machine learning techniques can be employed to analyze the results, identify emerging patterns and trends, and inform decision-making.
In summary, an alternative solution for planning random innovations through functional programming involves employing a functional programming language to implement a model that generates and evaluates random innovations using functions representing various aspects of innovation. By utilizing functional programming techniques to iterate over a significant number of random samples and analyze the outcomes, patterns and trends can be identified to support decision-making in the field of computer science.
Sure, here's an example of how you might create a mathematical model for innovation planning in MATLAB, taking into account financial, logistics, and human resources criteria.
% Define the objective function
c = [wi_financial*financial_scores wi_logistics*logistics_scores wi_human_resources*human_resources_scores];
% Define the constraints
A = [financial_constraints; logistics_constraints; human_resources_constraints];
b = [financial_constraints_values; logistics_constraints_values; human_resources_constraints_values];
% Define the bounds
x0_bounds = [0, 1];
x_bounds = repmat(x0_bounds, num_options, 1);
% Solve the linear programming problem
options = optimoptions('linprog','Algorithm','simplex');
res = linprog(c, A, b, [], [], x_bounds(:,1), x_bounds(:,2), [], options);
% Print the results
fprintf("Optimal solution: %f\n", res.x);
fprintf("Optimal value: %f\n", res.objval);
In this example, the objective function is defined as a linear combination of financial, logistics, and human resources scores. Each score is multiplied by a weight that represents the importance of the corresponding criterion for the organization. The constraints are defined by matrices A and B, representing the financial, logistics, and human resources constraints, along with the corresponding constraint values.
The variable bounds are specified as lower and upper bounds, and the optimization algorithm employed to solve the problem is the simplex method. The algorithm selection is achieved using the optimoptions function in conjunction with the linprog function. Solving this optimization problem yields the optimal selection of options that maximize the overall score while adhering to the constraints.
It should be noted that this is a simplified example and may require adjustments based on the specific requirements and criteria of the organization. For instance, the financial, logistics, and human resources scores and constraints can be more intricate, and the weights can be tailored to reflect the organization's specific priorities. Moreover, it is essential to consider the possibility of inaccuracies and uncertainties in the available data when interpreting the results.
Additionally, this model assumes linearity between the criteria and the innovation options, which may not always hold true. In cases where the relationship is nonlinear, alternative optimization methods such as nonlinear programming or heuristics may be more appropriate.
Overall, this model offers a framework for organizations to assess and strategize their innovation efforts by considering multiple criteria, including financial, logistics, and human resources. By leveraging this model, organizations can make more informed decisions regarding the pursuit of innovations and enhance resource allocation efficiency.
Now, let's delve into the code and model in greater detail:
The objective function is expressed as a linear combination of the financial, logistics, and human resources scores. Each score is multiplied by a weight, denoted as wi_financial, wi_logistics, and wi_human_resources, respectively. These weights should be positive and sum up to 1.
The model's constraints are defined by matrices A and B. Matrix A encompasses the financial, logistics, and human resources constraints, while the vector b contains the corresponding constraint values. The constraints can include factors like budget limitations, resource availability, or regulatory compliance.
The variables are bounded by lower and upper bounds. In this case, the lower bound is set to 0, and the upper bound is set to 1, reflecting the binary nature of the variables where options are either selected or not.
To solve the optimization problem, the linprog function from MATLAB's Optimization Toolbox is employed. The simplex method, a widely used technique for linear optimization problems, is utilized as the underlying algorithm.
