Submitted:
10 October 2023
Posted:
11 October 2023
Read the latest preprint version here
Abstract
The rapid growth of virtual reality (VR) and augmented reality (AR) services in various industries has stimulated innovation. This study proposes a research framework and theoretical model based on self-determination theory (SDT) to examine consumers’ purchase intentions for VR and AR service technologies. The research scope includes fashion brands that use VR and AR service technologies. The study employs in-depth interviews to identify the key drivers of VR and AR technologies for fashion brands. The research design uses an online survey of 675 fashion brand consumers to collect questionnaire data employing structural equation modeling (SEM) and fuzzy set qualitative comparative analysis fuzzy-set qualitative comparative analysis (fsQCA) to test the research hypotheses and answer the research questions. This study contributes to understanding consumer technology and psychological perceptions about implementing fashion brands with VR and AR service technologies for future service design and marketing. The research findings show that perceived value, perceived enjoyment, perceived informativeness, presence, and consumer experience affect purchase intention positively when using AR/VR service technologies. Further, the results highlight that perceived value, enjoyment, and informativeness affect consumer experience. The results of the FsQCA show that the causal conditions of perceived value, perceived enjoyment, perceived informativeness, presence, and consumer experience are sufficient and necessary for higher purchase intention for consumers in the fashion brand context.
Keywords:
Virtual reality (VR)
; Augmented reality (AR)
; fashion brands
; fsQCA
1. Introduction
Digital transformation has affected our lives and consumption. Virtual reality (VR) and augmented reality (AR) service technologies have grown rapidly in various industries, including real estate, fashion brands, retail, transportation, tourism, education, entertainment, museums, furnishing, jewelry, consumer-packaged goods, and beauty products. Technological advance drives the VR development of computing, motion sensors, digital displays, and computer vision.
Augmented reality (AR) integrates virtual content into reality. The AR has been attracting increasing attention from marketing researchers. A VR creates a perception of virtual information, whereas AR enhances the real world for generating information [1,2]. The AR is defined as a feature of the interactive, real-time, computer-generated, and simultaneous application [3,4,5] enabling consumers to see the real world and its virtual objects by wearing see-through displays[6]. An AR is a 3-D computer-simulated visualization technology supplementing sensory information, including graphics, labels, objects, sounds, and avatars[7,8,9].
An AR delivers an interactive experience and enhances contextual information for appearance, enjoyment, and usability [6,10] Marketing platforms evolve rapidly in AR and enable real-time interactions to enhance customer experiences [7,11]. For example, advancing new technologies, such as Apple AR and 5G glasses, enhances marketers’ ability by employing AR in various industry contexts. [12,13,14] With the increasing number of companies integrating AR into their marketing plans, AR marketing applications have become other forms of digital marketing strategies [15,16,17]. AR in marketing applications provides consumer experiences and demonstrates consumer benefits by integrating digital information and the physical environment [18].
A VR refers to a computer-generated simulation that incorporates vision, hearing, or touch and interacts to be real and is a vehicle with other hardware for simulation [19,20]. Firms use VR marketing tools, including branded VR, to promote their businesses [3,16,21]. Virtual Reality marketing is an effective strategy [22] and an ideal marketing platform for enhancing consumer experiences [23,24,25]. Retailers use VR for service innovation to create new business opportunities and promote economic growth[26,27].
The research scope focuses on fashion brands using VR or AR service technology applications to improve the shopping experiences. With advances in VR and/or AR service technologies, many fashion brands use VR and/or AR service technologies to enhance services for enhanced consumer experience. The fashion brand industry increasingly uses VR or AR technologies to conduct customer service businesses. Firms such as Amazon, ASOS, Nike, and IKEA implement VR and AR service technologies to enhance the consumption experience of their products and help consumers make purchase decisions [15,28]. Consumers often use computer-generated product representations to develop innovative products before making purchasing decisions [20,28]. [22]s’ research find that VR and AR service technologies produce better effects on consumer behaviors than traditional businesses. [5,29,30] examined the effect of VR and AR service technologies in some previous studies. However, limited studies exist that examine AR and VR service technologies for consumer distractive and negative effects on consumer responses [31,32,33]. Few studies have focused on AR and VR service technologies to examine consumers’ psychological mechanisms. Despite the steady growth in VR and AR service technology applications, the literature still lacks empirical research explaining consumers’ psychological factors and perspectives. Therefore, this study addresses how VR and AR service technologies reshape our understanding and conceptualization of consumer purchase intention in the fashion brand context.
This research theme has received little attention in marketing and information management journals. A literature review reveals that studies on VR and AR service technologies for fashion brands are scarce. This study attempts to explain consumer purchase decisions regarding fashion brands using VR and AR service technologies. It employs self-determination theory (SDT) to examine empirical evidence of antecedent variables and purchase intention for fashion brands in the context of VR and AR service technologies. This research aims to understand the factors that facilitate the adoption of VR and AR service technologies by incorporating the SDT.
This study contributes to research on VR and AR service technologies in two ways. First, by examining how VR and AR attributes influence consumer perceptions of fashion brands with their service technologies, fashion brand retailers can improve their VR and AR service technologies. Second, a more thorough conceptualization of consumer purchase intention perception of fashion brands with VR and AR service technologies could help fashion brand retailers learn how to attract consumers to their fashion brands when designing VR and AR service infrastructures. Third, the results contribute knowledge to information management journals. This study seeks to answer three important questions: (1) How do VR and AR service technologies re-evaluate the understanding and conceptualization of consumer purchase intention in the fashion brand context? (2) How do the antecedents of VR and AR service technologies affect consumer experience in the fashion brand context?(3) What are consumers’ cognitive responses to VR or AR service technologies in the fashion brand context?
The research motivation is to study the unique experiential and psychological aspects of VR and AR in fashion brands. However, information management literature lacks an understanding of the role of psychological and experiential factors in examining the antecedents of consumer purchase intention. This research aims to address this gap and add to our theoretical knowledge of VR and AR service innovation technologies by exploring the antecedent variables influencing purchase intention. Therefore, the main objective of this study is to develop a theoretical model with key variables influencing purchase intentions for fashion retailers' VR and AR service technologies based on SDT. The findings have significant managerial implications for firms with VR and AR service technologies for better service innovation performance and purchase intentions of potential customers. Little research has contributed to the theoretical and managerial implications of improving VR and AR service technologies in the fashion brand industry. Further, most studies have focused on VR and AR technical issues, ignoring customer perspectives.
This study highlights a theoretical model for VR/AR service technologies. This research contributes to the literature by advancing the knowledge of consumer experience and purchase decisions based on the SDT. Furthermore, the SDT provides a useful foundation for investigating consumer behavioral intentions and important practical insights for enhancing fashion brand practices. The research outcomes will provide a foundation for firms to invest in and design VR and AR service technologies and examine their context of fashion brands for further studies. A comprehensive determinant of purchase intentions toward fashion brands would enable managers to formulate effective marketing strategies in the digital marketing era.
2. Literature Review
2.1. Theoretical Background- Self-determination theory
The SDT is defined as an individual’s emotion, motivation, and personality and is a theory for examining human psychological and motivational behavior[34]. The SDT conceptualizes the motivational mechanism that directs people’s behavior[35]. According to SDT, motivation, autonomy, competence, and relatedness drive individuals’ psychological and human functions [36,37]. Thus, SDT drives enjoyment, interest, and satisfaction in consumer behavior [34,36]. Therefore, SDT is widely recognized for explaining consumers’ social and environmental behavior [38,39], product engagement [40,41], and service development participation or value co-creation [35,42]. SDT explores how psychological satisfaction in a virtual environment facilitates motivational behavior [43,44]. Thus, SDT examines and predicts consumers’ behavioral intentions [45,46].
2.2. Augmented reality (AR) versus virtual reality (VR)
A VR is a multidimensional service application for end users using graphic and display technology [47,48]. Some industries, including oil, gas, construction, and aerospace, use VR for technological advancements and service innovation to improve service quality [49,50]. Increasingly, retailers can facilitate service innovation, logistics, and business management [8,51,52] and increase customer value [53,54,55]. Amazon’s experiments with VR kiosks represent a new form of customer engagement [56].
A VR plays an important role in customer service [57,58], changing the shoppers, brands and retailers’ behavior and attracts the interest of many researchers [59,60]. Factually, VR enables consumers interaction with various service channels [4,61,62]. Accordingly, the virtual environment affects the virtual store experience quality and users’ behavioral intentions [58,63]. Thus, VR can provide a visual environment that affects individuals’ decision-making [22,64].
[65] define AR as a physical world with interactive media, including video, images, or text. The AR is a virtual object providing consumers with high levels of interactivity and the vividness of an immersive experience compared to traditional media [9,30,66]. However, relatively few studies have examined the potential implications of AR for consumers and other stakeholders in retail environments [9,67]. From a marketing perspective, AR can increase customer satisfaction and loyalty, repeat purchases, and positive WOM and help retailers maximize market share [9,29]. Therefore,AR enables consumers to deliver a more direct product experience during purchase [68,69].
2.3. Perceived alue and consumer experience
Value is defined as a consumer’s perception of the subjective evaluation of some product or service based on benefits and consumption costs [70,71]. In general, perceived quality and price influence value [72,73]. Perceived value is a determinant factor of firm performance [74,75,76]. Value is a fundamental antecedent of behavioral intentions [70,75,77] in the marketing literature. Therefore, higher levels of perceived value yield higher purchase intentions in the virtual environment [70,75,77].
The consumer experience is a key component in brand positioning [78,79]. Experience can be measured through direct or indirect participation or observation [80]. The product/brand choice can come from consumers´ experiences and purchase behaviors in VR [64,81]. The theoretical background of customer experience combines all organization touchpoints and creates an overall experience [28,82]. Re-purchase intention, re-visit intention, satisfaction, trust, and loyalty are conceptualized as outcomes of a positive customer experience [82]. However, researchers must include customer experience in a virtual environment [83,84].
Perceived value is a consumer's assessment of the net derived benefit of a product, service, or brand offering [73,85]. Consumer perceived value is a significant determinant of consumer satisfaction and post-purchase behavior [86]. The perceived value represents a consumer's research towards an external environment and is explained as “the trade-off between quality and price” [85]. Therefore, the relationship between perceived value and consumer experience requires empirical evidence. Thus, the research hypothesis is formulated as follows:
H1.
Perceived value positively affects consumer experience.
2.4. Perceived enjoyment and consumer experience
Enjoyment refers to using a specific system enjoyable for any performance consequences [26,71]. Perceived enjoyment is “the degree to which the activity of using technology is perceived to be enjoyable in its own right apart from any performance consequences that may be anticipated” [86]. In empirical studies, enjoyment is a major factor driving the use [30,87]. Generally, enjoyment plays a significant role in customer engagement with the service system and performance reinforcement [14,43,44]. Enjoyment directs users to use new technologies [26,30].
[39] explored motivated behavior in virtual environments and found that satisfaction contributes to individuals’ experiences of enjoyment, influencing future behavior. [26] and [88] validated the SDT framework to examine the relationship between enjoyment and consumer experience in the virtual environment context. Many researchers have proposed that enjoyment is a major characteristic of consumer experiences and creates hedonic outputs [16,56]. Therefore:
H2.
Perceived enjoyment positively affects consumer experience.
2.5. Perceived Informativeness and consumer experience
Informativeness can enhance consumer confidence in the perceived richness of information or knowledge by providing customer services [30,89]. Informativeness is an important research dimension of the AR/VR brand shopping experience with the deployment of VR/AR in marketing applications [26]. [66] and [86] acknowledge that the marketing potential of VR is to provide extensive sensory information to customers for service innovation.
AR and VR service technologies enable consumers to examine the specific characteristics of a product or brand before making a purchase decision [26,86]. Technological advancement provides useful information, enhances learning, and offers value to consumers [90]. The AR and VR service technologies bring new consumer experiences that interact similarly to the real world and experience a sense of novelty in a virtual world [7,12,28]. Therefore,
H3.
Perceived informativeness affects consumer experience positively
2.6. Perceived value and purchase intention
Purchase intention is the consumer’s response to retailers [30,91]. The relationship between the attitude to online technology and the purchase intention is examined [92,93]. Intention represents the degree to which an individual is willing to use or purchase [72,94]. In marketing and information management research, consumer behavior includes behavioral intentions and actual behavior [95]. Furthermore, behavioral intention refers to people given to behave themselves in particular ways in certain situations [77]. Theoretically, behavioral intention represents an individual engaging in a particular behavior [75,96]. Generally, consumer purchase decisions are based on cognitive reasoning [70,97]. Assessing consumer purchase intentions are crucial for a firm’s success.
[72] and [75] found a significant positive relationship between perceived value and purchase intention. Consumers are willing to purchase products when they perceive the product or service as high value [77,83]. Thus, perceived value affects repurchase intentions and loyalty [94,98]. Perceived value is a more suitable consumer assessment of new technology-based adoption [99,100]. Therefore, AR/VR service technologies are a competitive advantage source for creating consumer value for an organization [39,101,102]. Thus,
H4.
Perceived value influences purchase intention positively.
2.7. Perceived enjoyment and purchase intention
In empirical studies, enjoyment is a major factor driving the use and plays a significant role in customer engagement in the service system and performance reinforcement [30,56,87]. Enjoyment directs users to adopt new technologies [9,26]. Purchase intention is a consumer’s response to e-retailers [91]. The relationship between the attitude to online technology and purchase intention is examined [93,94]. Few studies have focused on the effects of perceived enjoyment on purchase intentions. Therefore,
H5.
Perceived enjoyment influences purchase intention positively.
2.8. Perceived informativeness and purchase intention
Informativeness is an important research dimension for the VR brand shopping experience with the deployment of VR or AR service technologies in marketing and information management applications [26,95]. Consumer behavior includes behavioral intentions and actual behavior [46,93]. Purchase intention is affected by the informativeness of AR/VR service technologies examined in this study. Therefore,
H6.
Perceived informativeness affects purchase intention positively.
2.9. Presence and purchase intention
Presence is defined as “the experience of presence in an environment through a communication medium” and the psychological state in which individuals interact with a technology-mediated environment [50,103]. VR and AR aim to reconstruct a virtual environment for its user; prior work argues that presence is a determinant factor for consumer experiences [1,49,56,104]. [49] and [104] found that presence enhances consumer experience among social media users. Therefore, a sense of presence can be presented through various means, including watching a movie, playing a video game, or reading a book [1]. Accordingly, store environments can be enhanced using VR or AR applications in virtual experiences [35,62].
Presence is regarded as a psychological medium; the user's psychological interpretation of what is in front of them is essential for developing a sense of presence by listening to a song, reading a book, playing a video game, or watching a movie [49,62,105]. Presence is stimulated to an alternative place different from where they are, but they feel they are in a real place [35,62]. Media characteristics of presence are generated from a virtual environment by a sensation of “place illusion” [49,56]. Therefore, VR or AR systems can generate responses in the virtual world by showing images, providing information, tracking user positions and actions [1,49], and stimulating purchase intentions. Therefore,
H7.
Presence influences purchase intention positively.
2.10. Consumer experience and purchase intention
In the consumer experience of VR and AR, service technologies are regarded as the key competitive advantage because they can interact with brands through cognitive, physical, and affective stimulations [37]. Therefore, consumer experiences result from purchase behavior observations through real or virtual environments [17,31]. Satisfaction with consumer experiences is associated with positive word-of-mouth, repeat purchases, customer loyalty and firm success [13,49,105]. This study examined purchase intention outcomes in an AR/VR consumer experience context, an important issue for fashion brands. Therefore,
H8.
Consumer experience influences purchase intention positively.
3. Research Methodology
3.1. In-depth interview
This study focused on purchase decisions and consumer experiences with VR and AR service technologies. An in-depth interview research methodology involving consumer participants was utilized because the exploratory qualitative approach matches the complex character of VR and AR service technologies. This qualitative study aimed to discern the effects of antecedent factors on consumer experience and purchase intention. Moreover, an in-depth interview methodology was implemented during the research process when the real business environment was complex. Participants were recruited based on a preselection criterion with the knowledge of VR and AR consumer experiences in fashion brands. Open-ended semi-structured interviews were conducted; a revised version was refined to improve and develop the questionnaire for further research.
3.2. Research framework
After completing the in-depth interviews and literature review, the research develops the constructs and hypotheses. The study is grounded in the SDT exploring psychological factors in virtual environments and how to facilitate consumer behavior. The SDT theory examines various ranges of relationships for positive and negative attitudes or emotions. Perceived value, enjoyment, informativeness, presence, consumer experience, and purchase intention were derived from the SDT perspective. Therefore, the following research hypotheses were developed and refined in the research framework. Figure 1 is the proposed research framework.
3.3. Questionnaire development and pre-test
A survey questionnaire was used to measure the research constructs and test the research equations and hypotheses. An online survey was conducted to gather data from respondents who used VR and AR service technology in fashion brands. A pilot study examined measurement parameters. A convenience sample of 20 potential Taiwanese respondents was selected. The research constructs of perceived value, enjoyment, informativeness, presence, consumer experience, and purchase intention were revised and improved. The survey instrument was pretested with 20 potential informants who provided comments to improve the survey questionnaire instrument. Research model testing was conducted using a sample of VR/AR service technology users of the fashion brand in the research sample. The questionnaires were pretested before administration to ensure their validity and reliability.
3.4. Measures
The study developed scale items to measure purchase intention for fashion brands using VR/AR service technologies based on SDT. In the measurement method, the research construct captures perceived value, enjoyment, informativeness, presence, consumer experience, and purchase intention. An adaptation of [70]’s and [77]s’ 5-item scale measures value. This research adapts the studies of [26] and [88] to measure enjoyment. A 5-item instrument from [26] and [86] was used to measure informativeness. [8] and [47] 4-item instrument captures the dimensions of presence. To measure consumer experience, [28] and [106]’s eight items were adapted. Finally, three items were adapted from [26] and [104] were used to measure purchase intentions.
A 32-item self-administered questionnaire was developed after the pre-test and a seven-point scale was used to measure the items. The questionnaire operationalized the research constructs and variables by adapting extant and accepted scales from the literature. Six research constructs were measured: perceived value (V), perceived enjoyment (E), perceived informativeness (I), presence (P), consumer experience (CE), and purchase intention (PI). The final questionnaire items were organized as follows.
3.5. Measurement model fit
In the research model, the fit measurements consisted of discriminant validity, internal consistency, and convergent validity. Each research construct was tested for internal consistency composite reliability by calculating Cronbach’s alpha values [107]. Convergent and discriminant validities were tested [108]. The data analysis yielded chi-square values and further assessment of the model fit with computed average variance extracted (AVE) approximation (RMSEA) and comparative fit index (CFI). After testing the measurement model's validity, structural equation modeling (SEM) analysis tested the hypotheses using AMOS 12 software. Confirmatory analysis confirmed the reliability and validity of all research constructs. Statistical analysis tests whether the confirmatory factor analysis (CFA) and the theoretical model fit. The AVE of constructs exceeds the minimum criteria of .50. These results tested and verified the discriminant validity of each research construct.
3.6. Fuzzy-set qualitative comparative analysis (fsQCA)
This study employs SEM and fsQCA to perform empirical analysis and test the research hypotheses. The fsQCA uses the fuzzy set theory and differentiates itself from conventional statistical methods and conducted a statistical analysis by performing calibrations[109]. [110] stress the importance of high consistency over high coverage. Consistency and coverage test results for fsQCA describe these relationships. The fsQCA and SEM were compared with the results of capturing relationships and predictive capabilities.
4. Results
4.1. Descriptive Analysis
The survey was conducted through an online questionnaire platform called Survey Monkey, which distributed questionnaires for three months, from April to June 2022. Taiwans’ fashion market was chosen as the research site because of its overall industrial growth. Descriptive statistics were used to analyze respondents' backgrounds. In this manner, the questionnaire asked the participants about any experience using AR/VR when the fashion brand was in question. Table 1 presents the descriptive statistics of the sample. No AR/VR experience was excluded from the research sample database, and 675 participants were included in the final data analysis. (n = 675). The sample comprised 70.22% female and 29.19% male. Since the main consumer group of fashion brands is female, women are more likely to participate in the questionnaire. The results of the descriptive statistics show that the age distribution of respondents ranges between 16 and 25 years, which means that the consumer groups of fashion brands are mainly younger. Detailed sample characteristic profiles are presented in Table 1.
The final valid sample size was 675 participants based on an online survey. The questionnaire comprised perceived value, enjoyment and informativeness, presence, consumer experience, and purchase intention. Table 2 presents the descriptive statistics of the mean values, standard deviations, and standardized loadings of research constructs.
4.2. Model validation
The SEM was employed to test the research model and examine its validity and reliability. The study examined the reliability of each item by assessing Cronbach's alpha and the composite reliability values of each research construct for model validation [108]. The AVE from each research construct is above 0.50 (p < .01), and the composite reliability coefficient of each variable achieved above 0.7 (p < .01). The analysis of convergent and discriminant validity indicated that high reliability and good convergent validity were acceptable for all the research constructs. Further, the square root of each variable's AVE value is between 0.76 and 0.86, indicating discriminant validity in the measurement model of this research. (see Table 3).
4.3. Measurement model fit
Table 4 shows the measurement of the relevant overall model fit for further analysis. The chi-squared test yielded chi-squared values of 882.64 with 668 degrees of freedom (p = .00.) Model fit indices values show the mean square error of approximation (RMSEA) = 0.057; goodness of fit index (GFI) = 0.92; CFI =0.91; and normed fit index (NFI) =0.93. These values indicated a good fit for the research sample dataset and exceeded the accepted critical values.
4.4. Structural model
This research used CFA and path analysis to test the theoretical model. The proposed structural model supported eight hypotheses (H1). Perceived value positively affects consumer experience (H2). Perceived enjoyment positively affects consumer experience (H3). Perceived informativeness affects consumer experience positively (H4). Perceived value influences purchase intention positively (H5). Perceived enjoyment influences purchase intention positively; (H6). Perceived informativeness affects purchase intention positively (H7). Presence influences purchase intention positively, and (H8). Consumer experience influences purchase intention positively. Table 5 presents the path analysis of the structural model, and the results support all research constructs.
4.5. fsQCA
Before performing the fsQCA, research was conducted to calibrate the data[109,110] . The measurement items were calibrated into fuzzy sets for three cut-off points (0 = no set membership, 0.5 = crossover point, and 1 = full set membership) with values ranging from 0 to 1[111]. The data were calibrated to the values of 0.05, 0.50, and 0.95 as the three thresholds, and transformed the variables into calibrated database sets for full memberships, crossover points, and non-membership. Table 6 presents the calibration results for the research constructs.
The FsQCA examines necessity analysis with a consistency score of above 0.9 [110]. Perceived value, enjoyment, informativeness, presence, and consumer experience are necessary conditions to explain a high level of purchase intention (see Table 7). A low purchase intention analysis confirmed that the absence of perceived value, perceived enjoyment, perceived informativeness, presence, and consumer experience conditions yielded a lower level of purchase intention.
In this study, fsQCA examined how perceived value, perceived enjoyment, perceived informativeness, presence, and consumer experience are necessary or sufficient conditions for the outcome of purchase intention; further, these research constructs appear essential and adequate for predicting purchase intentions. The overall solution coverage indicates that causal conditions account for 92% of the membership in the higher purchase intention solutions, while the outcome condition accounts for 77% of the membership in the low purchase intention solution (see Table 8). The solutions for higher purchase intention samples for consumers exhibit high consistency and solution coverage. Thus, causal conditions, including perceived value, enjoyment, informativeness, presence, and consumer experience, are necessary and sufficient for higher purchase intention. The fsQCA results are presented in Table 8.
5. Discussion
Advances in AR/VR marketing applications have attracted considerable interest. The AR is increasingly deployed in retail settings. This research finding provides empirical support for the SDT as a guiding framework for understanding how to influence purchase intention in the fashion brand context, focusing on the purchase intention effect after an AR/VR usage application. This result is consistent with previous studies that found AR/VR marketing is a driving strategy for improving and increasing consumer purchase intentions [14,18,112,113]. [77] and [87] recognized the psychological and cognitive factors influencing consumers’ acceptance and adoption of innovative marketing technologies and supported the purchase decision from the AR and VR service technologies application. In addition, this study highlights the roles of consumers’ perceived value, enjoyment, informativeness, presence, and experience as important determinants of purchase intentions. The research findings reveal that fashion product purchase intentions are influenced by multiple factors.
The results show that AR and VR service technologies consumer experience positively impacts consumer purchase intentions, such as increased curiosity, interest, inspiration, enthusiasm, surprise, expectation, and satisfaction. Previous researches emphasize the importance of AR/VR service technologies for enhancing the consumer experience for better organizational performance [16,96]. Therefore, the empirical research incorporates some research constructs related to the SDT to develop a research model to examine how AR and VR service technologies influence consumers’ psychological responses to interact with the product and make purchase decisions.
Although AR/VR service technologies are relatively new in Taiwan, the research results suggest that these systems attempt to influence consumers’ attitudes toward value, enjoyment, and informativeness. Taiwanese consumers appreciate innovative service technologies, and the data analysis demonstrates their comfort in using the new technology when perceived value, enjoyment, informativeness, and consumer experience influence their purchase intention. In particular, this study finds that value, enjoyment, and informativeness are antecedents of consumer experience, which, in turn, affect purchase intention. The results show fashion brand retailers in Taiwan with AR/VR applications supporting physical and online shopping influence consumer buying decisions. Taiwanese fashion brand retailers have developed and adopted a new AR/VR application technology that positively influences consumer purchase intentions and decisions. The study of fashion brand retailers considers consumer interactions with AR/VR applications as a shopping experience by focusing on perceived value, enjoyment, and informativeness as the most important elements of the AR/VR application.
Considering it is essential to examine consumers’ perceptions of VR/AR service technology applications, this study investigated the influence of AR/VR service technology usage on fashion brand consumers. It focuses on consumer experience and purchase intention of AR/VR service technologies. The conceptual model examines the research constructs for psychological characteristics (perceived value, enjoyment, informativeness, presence, and consumer experience) rather than the technology acceptance model (TAM), including ease of use, usefulness, attitude, and behavioral intention research constructs and variables. In summary, fashion brand retailers should introduce AR/VR systems to support the consumer experience and enhance purchase intention. Therefore, fashion brand retailers should develop interactive AR/VR service systems as a new marketing strategy.
Perceived value, enjoyment, and informativeness positively affect consumer experience. Consumer experience can enhance consumer value, enjoyment, and informativeness. Consumer experience can facilitate comparing products using AR/VR service technology applications. Therefore, service providers should also suggest customized schemes based on customer needs and highlight the importance of marketing plans for AR/VR service technology applications.
This study combined SEM and fsQCA to examine the proposed research hypotheses. The SEM and fsQCA enrich the understanding of how perceived value, enjoyment, informativeness, presence, and consumer experience explain a consumer's purchase intention. The SEM analysis indicates that perceived value, perceived enjoyment and perceived informativeness, presence, and consumer experience positively affect purchase intention, while the fsQCA findings show that these cognitive factors should always be combined with purchase intention. The results show that perceived value, enjoyment, informativeness, presence, and consumer experience are not individually relevant and must be combined to predict purchase intentions.
This study also provides insights when employing SEM, and the fsQCA complement and contributes to the existing literature. The SEM and fsQCA methods examine the antecedents of purchase intention through a symmetric theory approach [33,81]. The fsQCA provides important and detailed information about higher or lower purchase intention segments for necessary and sufficient conditions. Decision-makers can understand the differences in purchase intention among different consumer segments. The FsQCA operationalization of the SDT model with an adjective semantic differential segmented group offers a better cause analysis of AR/VR service technology applications supporting the validity of the basic SDT model. Hence, SEM combined with the fsQCA model is preferred over the single model. Empirically, this study combines the SEM and fsQCA models for better predictive accuracy[81].
This study examines consumer differences and similarities across segments based on their psychological responses towards AR/VR service technologies application in fashion brand retail using fsQCA. The purchase intention heterogeneity was examined by employing fsQCA. It was found that consumer heterogeneity exists in consumers’ psychological perceptions of AR/VR service technologies. This study identifies the commonalities and differences between low and high purchase intention segments by employing fsQCA to predict consumers’ purchase intentions and examines the combined conditions of perceived value, enjoyment, informativeness, presence, and consumer experience. Consumers with high purchase intentions have a greater positive response towards AR/VR service technologies and higher perceived value, enjoyment, informativeness, and presence. Perceived value, perceived enjoyment, perceived informativeness, presence, and consumer experience are necessary to enhance consumers’ purchase intentions from the fsQCA. Accordingly, the research findings indicate that perceived value, perceived enjoyment and informativeness, presence, and consumer experience are necessary and sufficient conditions to enhance consumers’ purchase intentions. These findings support SDT and reveal that a consumer’s perceived value, enjoyment, informativeness, presence, and experience are necessary and sufficient to predict purchase intention. Consistent with the fsQCA results, firms should focus on understanding consumer attitudes and intentions toward AR/VR marketing. Future AR/VR marketing consumer research should examine consumers’ perceived value, enjoyment, informativeness, presence, and consumer experience as psychographic variables to enhance purchase intention for AR and VR service technology applications.
From a theoretical perspective, the results shed light on the affective factors influencing purchase intention in marketing and information management literature. This study extends the previous research explaining how consumers perceive VR and AR in fashion brands. Despite the application of ARVR service technologies by retailers worldwide, previous studies show that consumer attitudes towards AR/VR service technologies as management and marketing strategies are not always positive [13,87]. However, the research findings indicate that AR/VR service technologies applied to marketing strategies can have positive motivations and attitudes towards consumers’ experiences.
This research identifies relevant variables and adopts them from the AR/VR domain to further understand consumers’ purchase intentions in the fashion brand market. Among the research constructs, perceived value and enjoyment, perceived informativeness, presence, and consumer experience influence were tested as determinants of purchase intention toward fashion brands. Contrastingly, perceived value and enjoyment and perceived informativeness are examined as determinants of enhancing the consumer experience in the fashion brand context. The research findings regarding the significant factors are suggested for future research on purchase intentions toward fashion brands.
This study demonstrates that perceived value, enjoyment, informativeness, presence, and consumer experience positively affect purchase intention. This strengthens the SDT, arguing their satisfaction with psychological characteristics in the virtual environment and how to facilitate purchase intention. The research results are consistent with other studies in the literature, which show that consumers’ attitudes could determine their purchase intention [69,93,104]. The AR/VR service technologies for marketing applications can be coordinated to develop and implement successful marketing programs [17,101]. These results shed new light on previous studies by [18,114], showing that consumers’ psychological factors can influence their purchase intention to stimulate retail AR/VR service technology development. The research found that psychographic factors influence the technological adoption of AR/VR services.
Regarding practical implications, this study considers AR/VR service technologies as a marketing strategy and offers important practical implications for fashion brand retailers. The research segments high and low purchase intention consumer groups to identify the heterogeneity of consumer attitudes toward AR/VR service technologies. The results show that consumers react differently to AR/VR service technologies applications, from low to high purchase intention. Fashion brand retailers can leverage critical resources to communicate the value of AR/VR service technologies and assist consumers. They should ensure that AR/VR service technology is high value, enjoyable, informative, and has a good presence and consumer experience to increase consumers’ purchase intention. These practical implications are important for future AR/VR service technology applications in the fashion brand context.
The results revealed the relative importance of all significant factors identified through research hypothesis testing by employing SEM and FsQCA. Among the significant determinants of the purchase intention of fashion brands, attitude investigation is important for strategic decisions regarding the perceived value, enjoyment, informativeness, presence, and consumer experience. Accordingly, consumer experience is the most critical factor for fashion brands, affected by perceived value, enjoyment, and informativeness. Therefore, fashion brand service providers should consider the important psychological factors of these research results.
This study has practical implications for retailers and marketers to invest in AR/VR service technologies. Since AR/VR service technologies specifically lead to beneficial effects, it is recommended that investors invest in AR/VR service technologies applications to enhance consumer experience and purchase intention. This study demonstrates the positive effects of informativeness as a marketing strategy. The high purchase intention segment significantly and positively affects psychological attitudes toward AR/VR service innovation applications. Hence, fashion brand retailers have opportunities to promote the benefits of AR/VR service technologies to consumers. Purchase intention can be enhanced through consumer perceptions of value, enjoyment, informativeness, and presence in AR/VR service technologies. Consumers have a better experience of their purchase intentions. This research finding supports fashion retailers’ development of necessary AR/VR service technology applications.
The sample data for this research were collected between April and June 2022 in Taiwan. During this period, the COVID-19 pandemic strongly affected the global economy [115,116]. This study demonstrates that consumers’ purchase intentions can be enhanced through perceived value and enjoyment, perceived informativeness, presence, and consumer experience in fashion brands during the COVID-19 pandemic. The research also guides decision-makers to invest in AR/VR service technologies to improve consumers’ purchase intentions. The research findings motivate marketing managers and/or CEO to invest in AR/VR service technologies during and after COVID-19. The results also help us understand that consumers can use AR/VR service technologies and applications for their shopping experience. Consumers can gather information about products from AR/VR service technologies applications, which can be used to strengthen their purchase intentions.
6. Conclusions
The research objectives shed light on AR/VR marketing issues, on which little research exists for AR/VR service technologies application in the information management literature. Therefore, this study obtains findings that answer three key questions: How do the antecedents of VR or AR service technology applications affect consumer experience in the fashion brand context? What are consumers’ purchase intentions using VR or AR service technologies in the fashion brand context? Which factors influence the results of consumers’ purchase intentions for the AR/VR service technologies application in the marketing plan? The research findings show that perceived value, enjoyment, informativeness, presence, and consumer experience positively affect purchase intentions when using AR/VR service technologies. Finally, the results highlight that perceived value, enjoyment, and informativeness affect the consumer experience. Regarding the impact of the AR/VR consumer experience, the results show that AR/VR consumer experience positively impacts consumers’ purchase intention in terms of increased curiosity, interest, inspiration, enthusiasm, amazement, expectation, and satisfaction.
This study had some limitations. First, only fashion brands in Taiwan are examined, limiting industry-wide generalizability because customers may have varying attitudes toward the AR/VR shopping experience. Accordingly, future research should extend to another industry or national context to provide additional perspectives. Second, the research investigates Taiwanese fashion brand consumer samples, mainly focusing on a certain age range (between 16 and 35 years). This range of young respondents answered the questionnaire because of the extensive use of AR/VR service technologies applications; however, this might limit the research performance to a general public sample. Empirical evidence from older consumers with higher incomes should be used in future studies. Third, the sample in this study was sufficiently large for SEM and fsQCA to obtain valid empirical results. However, future research should obtain a larger sample set and collect more data to increase predictive validity. Given the vast diversity of this fashion brand market, future studies should focus on the effect across countries from different consumer cohorts to explore the different segments of AR/VR service technologies applications. Fourth, the research model developed only six research constructs; therefore, this study did not include the impact of other important factors, such as loyalty and technological characteristics. These variables should be considered in future studies. Future studies should examine other research constructs and variables to evaluate indicators impacting consumer purchase intention. Finally, another research limitation of the survey is that the questionnaire is a self-reported measure of consumers’ responses owing to constraints of the survey's administration to respondents from an online survey. Future research could collect open and secondary data sources to obtain the views of AR/VR service technologies consumers.
Funding
Please add: The author acknowledges and is grateful for the financial support the National Science and Technology Council, Taiwan, under grant 110-2410-H-005-015.
Informed Consent Statement
Informed consent was obtained from all subjects involved in the study.
Data Availability Statement
data is unavailable due to privacy and ethical restrictions.
Acknowledgments
The author acknowledges and is grateful for the financial support the National Science and Technology Council, Taiwan, under grant 110-2410-H-005-015. Thank for may administrative and technical support and financial aid.
Conflicts of Interest
The authors declare no conflict of interest.
References
- Caboni, F.; Hagberg, J. Augmented reality in retailing: A review of features, applications and value. Int. J. of Retail. Distrib. Manag. 2019, 47(11), 1125–1140. [Google Scholar] [CrossRef]
- Kandaurova, M.; Lee, S.H.M. The effects of virtual reality (VR) on charitable giving: The role of empathy, guilt, responsibility, and social exclusion. J. Bus. Res. 2019, 100, 571–580. [Google Scholar] [CrossRef]
- Boyd, D.E.; Koles, B. Virtual reality and its impact on B2B marketing: A value-in-use perspective. J. Bus. Res. 2019, 100, 590–598. [Google Scholar] [CrossRef]
- Farah, M. F.; Ramadan, Z.B.; Harb, D.H. The examination of virtual reality at the intersection of consumer experience, shopping journey and physical retailing. J. Retail. Consum. Serv. 2019, 48, 136–143. [Google Scholar] [CrossRef]
- Huang,T. L. Psychological mechanisms of brand love and information technology identity in virtual retail environments. J. Retail. Consum. Serv. 2019, 47, 251–264. [Google Scholar] [CrossRef]
- Cummings, J. J.; Bailenson, J.N. How immersive is enough? A meta-analysis of the effect of immersive technology on user presence. Media Psychol. 2016, 19(2), 272–309. [Google Scholar] [CrossRef]
- Rauschnabel, P.; He, J.; Young, R. Antecedents to the adoption of augmented reality smart glasses: A closer look at privacy risks. J. Bus. Res. 2018, 92, 374–384. [Google Scholar] [CrossRef]
- Smink, A.R.; van Reijmersdal, E.A.; van Noort, G.; Neijens, P.C. Shopping in augmented reality: The effects of spatial presence, personalization and intrusiveness on app and brand responses. J. Bus. Res. 2020, 118(7), 474–485. [Google Scholar] [CrossRef]
- Yim, M.Y.C.; Chu, S. C.; Sauer, P.L. Is augmented reality technology an effective tool for e-commerce? An interactivity and vividness perspective. J. Interact. Mark. 2017, 39(1), 89–103. [Google Scholar] [CrossRef]
- Nanda, A.P.; Banerjee, R. Binge watching: An exploration of the role of technology, Psychol. Mark. 2020, 37(9), 1212–1230. [Google Scholar] [CrossRef]
- Dwivedi, Y. K.; Highes, L.; Kar, A.K.; Baabdullah, A.M.; Grover, P.; Abbas, R…. .; Wade, M. Climate change and COP26: are digital technologies and information management part of the problem or the solution? An editorial reflection and call to action. Int. J. Inf. Manag. 2022, 63, 102456. [Google Scholar] [CrossRef]
- Javornik, A. Augmented reality: Research agenda for studying the impact of its media characteristics on consumer behaviour. J. Retail. Consum. Serv. 2016, 30, 252–261. [Google Scholar] [CrossRef]
- Roggeveen, A.L.; Grewal, D. ; Schweiger; E.B. The DAST framework for retail atmospherics: The impact of in-and out-of-store retail journey touchpoints on the customer experience. J. Retail. [CrossRef]
- Pantano, E. , Pizzi, G., Scarpi, D., & Dennis, C. Competing during a pandemic? Retailers’ ups and downs during the COVID-19 outbreak. J. Bus. Res. [CrossRef]
- Heller, J.; Chylinski, M.; de Ruyter, K.; Mahr, D.; Keeling, D.I. Touching the untouchable: Exploring multi-sensory augmented reality in the context of online retailing. J. Retail. 2019, 95(4), 219–234. [Google Scholar] [CrossRef]
- Rauschnabel, P.A.; Felix, R.; Hinsch, C. Augmented reality marketing: How mobile AR-apps can improve brands through inspiration. J. Retail. Consum. Serv. 2019, 49, 43–53. [Google Scholar] [CrossRef]
- Scholz, J.; Duffy, K. We ARe at home: How augmented reality reshapes mobile marketing and consumer-brand relationships. J. Retail. Consum. Serv. 2018, 44, 11–23. [Google Scholar] [CrossRef]
- Rauschnabel, P. A. Virtually enhancing the real world with holograms: An exploration of expected gratifications of using augmented reality smart glasses. Psychol. Mark. 2018, 35(8), 557–572. [Google Scholar] [CrossRef]
- Gonçalves, L.; Patricio, L.; Teixeira, J. G.; Wunderlich, N.V. Understanding the customer experience with smart services. J. Serv. Manag. 2020, 31(4), 723–744. [Google Scholar] [CrossRef]
- Pizzi, G.; Scarpi, D.; Pichierri, M.; Vannucci, V. Virtual reality, real reactions? Comparing consumers' perceptions and shopping orientation across physical and virtual-reality retail stores. Comput. Human. Behav. 2019, 96, 1–12. [Google Scholar] [CrossRef]
- Caboni, F.; Hagberg, J. Augmented reality in retailing: A review of features, applications and value. Int. J. of Retail. Distrib. Manag. 2019, 47(11), 1125–1140. [Google Scholar] [CrossRef]
- Alcañiz, M.; Bigne, E.; Guixeres, J. Virtual reality in marketing: A framework, review and research agenda. Front. Psychol. 2019, 10, 1530. [Google Scholar] [CrossRef] [PubMed]
- Cheng, X.; Fu, S.; de Vreede, G. J. A mixed method investigation of sharing economy driven car-hailing services: Online and offline perspectives. Int. J. Inf. Manag. 2018, 41, 57–64. [Google Scholar] [CrossRef]
- Dwivedi, Y.K.; Hughes, L.; Ismagilova, E.; Aarts, G.; Coombs, C.; Crick, T. ;... & Williams, M. D. Artificial Intelligence (AI): Multidisciplinary perspectives on emerging challenges, opportunities, and agenda for research, practice and policy. Int. J. Inf. Manag. 1994. [Google Scholar] [CrossRef]
- Loureiro, S.M.C.; Guerreiro, J.; Eloy, S.; Langaro, D.; Panchapakesan, P. Understanding the use of virtual reality in marketing: A text mining-based review. J. Bus. Res. 2019, 100, 514–530. [Google Scholar] [CrossRef]
- Plotkina, D.; Saurel, H. Me or just like me? The role of virtual try-on and physical appearance in apparel M-retailing. J. Retail. Consum. Serv. 2019, 51(7), 362–377. [Google Scholar] [CrossRef]
- Vrechopoulos, A.P.; O’Keefe, R.M.; Doukidis, G.I.; & Siomkos, G.J.; & Siomkos, G. J. Virtual store layout: An experimental comparison in the context of grocery retail. J. Retail. 2004, 80(1), 13–22. [Google Scholar] [CrossRef]
- Mclean, G.; Al-Nabhani, K.; Wilson, A. Developing a mobile applications customer experience model (MACE)-Implications for retailers. J. Bus. Res. 2018, 85, 325–336. [Google Scholar] [CrossRef]
- Hilken, T.; Keeling, D.I.; de Ruyter, K.; Mahr, D.; Chylinski, M. Seeing eye to eye: Social augmented reality and shared decision making in the marketplace. J. Acad. Mark. Sci. 2019, 48, 143–164. [Google Scholar] [CrossRef]
- Yim, M.Y.C.; Park, S.Y. I am not satisfied with my body, so I like augmented reality (AR): Consumer responses to AR-based product presentations. J. Bus. Res. 2019, 100, 581–589. [Google Scholar] [CrossRef]
- Paul, J.; Sankaranarayanan, K.G.; & Mekoth, N.; & Mekoth, N. Consumer satisfaction in retail stores: Theory and implications. Int. J. Consum. Stud. 2016, 40(6), 635–642. [Google Scholar] [CrossRef]
- Sung, E.; Bae, S.; Han, D.I.D.; & Kwon, O.; & Kwon, O. Consumer engagement via interactive artificial intelligence and mixed reality. Int. J. Inf. Manag. 2021, 60, 102382. [Google Scholar] [CrossRef]
- Yang, Y. Understanding consumers’ purchase intention in social commerce through social capital: Evidence form SEM and fsQCA. J. Theor. Appl. Electron. Commer. Res. 2021, 16, 1557–1570. [Google Scholar] [CrossRef]
- Yang, Y.; Gong, Y.; Land, L.P.W.; Chesney, T. Understanding the effects of physical experience and information integration on consumer use of online to offline commerce. Int. J. Inf. Manag. 2020, 51, 102046. [Google Scholar] [CrossRef]
- Chou, C.Y.; Yuan, S.T. Service-driven social community and its relation to well-being. Serv. Ind. J. [CrossRef]
- Ryan, R. , Deci, E. Self-determination theory and the facilitation of intrinsic motivation, social development, and well-being. Am. Psychol. [CrossRef]
- Schmitt, B. Experiential marketing. J. Mark Manage. [CrossRef]
- Bidee, J.; Vantilborgh, T.; Pepermans, R.; Willems, J.; Jegers, M.; Hofmans, J. Daily motivation of volunteers in healthcare are organizations: relating team inclusion and intrinsic motivation using self-determination theory. Eur. J. Work. Organ. Psychol. 2017, 26(3), 325–336. [Google Scholar] [CrossRef]
- Huang, C.H.; Lings, I.; Beatson, A.; Chou, C.Y. Promoting consumer environmental friendly purchase behaviour: a synthesized model from three short-term longitudinal studies in Australia. J. Environ. Plan. Manag. 2018, 61(12), 2067–2093. [Google Scholar] [CrossRef]
- Chen, A.; Lu, Y. Protective behavior in ride-sharing through the lens of protection motivation theory and usage situation theory. Int. J. Inf. Manag. 2021, 61, 102402. [Google Scholar] [CrossRef]
- Yang, Y.; Asaad, Y.; Dwivedi, Y. Examining the impact of gamification on intention of engagement and brand attitude in the marketing context. Comput. Hum. Behav. [CrossRef]
- Shaw, D.; Shiu, E. An assessment of ethical obligation and self-identity in ethical consumer decision-making: A structural equation modelling approach. Int. J. Consum. Stud. 2002, 26(4), 286–293. [Google Scholar] [CrossRef]
- Hoffman, D.L.; Novak, T.P. Toward a deeper understanding of social media. J. Interact. Mark. 2012, 26(2), 69–70. [Google Scholar] [CrossRef]
- 44. Tamborini, R; Bowman, N.D.; Eden, A.; Grizzard, M.; Organ, A. Defining media enjoyment as the satisfaction of intrinsic needs. J. Commun. [CrossRef]
- Roca, J.C.; Gagné, M. Understanding e-learning continuance intention in the workplace: a self-determination theory perspective. Comput. Hum. Behav. 1585. [Google Scholar] [CrossRef]
- Ryan, R. ; Rigby. C.; Przybylski, A. The motivational pull of video games: a self-determination theory approach. Motiv. and Emot. [CrossRef]
- Han, S.L.; An, M.; Han, J.J.; Lee, J. Telepresence, time distortion and consumer traits of virtual reality shopping. J. Bus. Res. 2020, 118, 311–320. [Google Scholar] [CrossRef]
- Caoasa, L.; Zalauf, K.; Wagner, R. Virtual Reality Experience of Mega Sports Events: A Technology Acceptance Study. J. Theor. Appl. Electron. Commer. Res. 2022, 17, 686–703. [Google Scholar] [CrossRef]
- Shin, D. Empathy and embodied experience in virtual environment: To what extent can virtual reality stimulate empathy and embodied experience? Comput. Hum. Behav. 2018, 78, 64–73. [Google Scholar] [CrossRef]
- Tussyadiah, I.P.; Wang, D.; Jung, T.H.; Tom Dieck, M.C. Virtual reality, presence, and attitude change: Empirical evidence from tourism. Tour. Manag. 2018, 66, 140–154. [Google Scholar] [CrossRef]
- Hermes, Q.; Rene, R. Influence of personality traits on choice of retail purchasing channel: literature review and research agenda. J. Theor. Appl. Electron. Commer. Res. 2021, 16, 3299–3320. [Google Scholar] [CrossRef]
- Laurell, C.; Sandström, C.; Berthold, A.; Larsson, D. Exploring barriers to adoption of virtual reality through social media analytics and machine learning—An assessment of technology, network, price and trialability. J. Bus. Res. 2019, 100, 469–474. [Google Scholar] [CrossRef]
- Collins, C.; Dennehy, D.; Conboy, K.; Mikalef, P. Artificial intelligence in information systems research: A systematic literature review and research agenda. Int. J. Inf. Manag. 2021, 60, 102383. [Google Scholar] [CrossRef]
- Kannan, P.K.; Li, H.A. Digital marketing: A framework, review and research agenda. Int. J. Res. Mark. 2017, 34(1), 22–45. [Google Scholar] [CrossRef]
- Toubes, D. R. ; Vila, N; Brea, J. Changes in Consumption Patterns and Tourist Promotion after the COVID-19 Pandemic. J. Theor. Appl. Electron. Commer. Res. 1332. [Google Scholar] [CrossRef]
- Hoffman, D.L.; Novak, T.P. Consumer object experience in the internet of things: An assemblage theory approach. J. Consum. Res. 2018, 44(6), 1178–1204. [Google Scholar] [CrossRef]
- Tang, Y. M.; Lau, Y.; Ho, U. L. Empowering digital marketing with interactive virtual reality (IVR) in interior design: effects on customer satisfaction and behaviour intention understanding antecedents that affect customer evaluations of head-mounted display VR devices through text mining and deep neural network. J. Theor. Appl. Electron. Commer. Res. 2023, 18, 889–907. [Google Scholar] [CrossRef]
- Van Kerrebroeck, H.; Brengman, M.; Willems, K. Escaping the crowd: An experimental study on the impact of a virtual reality experience in a shopping mall. Comput. Hum. Behav. 2017, 77, 437–450. [Google Scholar] [CrossRef]
- Yang, C.; Wu, L.; Tan, K.; Yu, C.; Zhou, Y.; Tao, Y.; Song, Y. Online user review analysis for product evaluation and improvement. J. Theor. Appl. Electron. Commer. Res. 2021, 16, 1598–1611; [Google Scholar] [CrossRef]
- Hermes, Q.; Rene, R. Influence of personality traits on choice of retail purchasing channel: literature review and research agenda. J. Theor. Appl. Electron. Commer. Res. 2021, 16, 3299–3320. [Google Scholar] [CrossRef]
- Cummings, J.J.; Bailenson, J.N. How immersive is enough? A meta-analysis of the effect of immersive technology on user presence. Media Psychol. 2016, 19(2), 272–309. [Google Scholar] [CrossRef]
- Helmefalk, M.; Hultén, B. Multi-sensory congruent cues in designing retail store atmosphere: Effects on shoppers’ emotions and purchase behavior. J. Retail. Consum. Serv. 2017, 38, 1–11. [Google Scholar] [CrossRef]
- Algharabat, R.; Alalwan, A.A.; Rana, N. P.; Dwivedi, Y.K. Three dimensional product presentation quality antecedents and their consequences for online retailers: The moderating role of virtual product experience. J. Retail. Consum. Serv. 2017, 36, 203–217. [Google Scholar] [CrossRef]
- Bigné, E.; Llinares, C.; Torrecilla, C. Elapsed time on first buying triggers brand choices within a category: A virtual reality-based study. J. Bus. Res. 2016, 69(4), 1423–1427. [Google Scholar] [CrossRef]
- Zhao, Z.; Hao, Z.; Wang, G.; Mao, D.; Zhang, B.; Zuo, M.; Yen, J.; Tu, G. Sentiment analysis of review data using blockchain and LSTM to improve regulation for a sustainable market. J. Theor. Appl. Electron. Commer. Res. 2022, 17, 1–19. [Google Scholar] [CrossRef]
- Hilken, T.; de Ruyter, K.; Chylinski, M.; Mahr, D.; Keeling, D.I. Augmenting the eye of the beholder: Exploring the strategic potential of augmented reality to enhance online service experiences. J. Acad. Mark. Sci. 2017, 45(6), 884–905. [Google Scholar] [CrossRef]
- Mäntymäki, M.; Baiyere, A.; Islam, A.N. Digital platforms and the changing nature of physical work: Insights from ride-hailing. Int. J. Inf. Manag. 2019, 49, 452–460. [Google Scholar] [CrossRef]
- Han, X. ; Wang, F; Lv, S, Ed.; Han, W. Mechanism Linking AR-Based Presentation Mode and Consumers’ Responses: A Moderated Serial Mediation Model. J. Theor. Appl. Electron. Commer. Res. 2021, 16, 2694-2707. [Google Scholar] [CrossRef]
- Dacko, S.G. Enabling smart retail settings via mobile augmented reality shopping apps. Technol. Forecast. Soc. Change. 2017, 124, 243–256. [Google Scholar] [CrossRef]
- Babin, B.J.; Attaway, J.S. Atmospheric affect as a tool for creating value and gaining share of customer. J. Bus. Res. 2000, 49(2), 91–99. [Google Scholar] [CrossRef]
- Hamari, J. Why do people buy virtual goods? Attitude toward virtual good purchases versus game enjoyment. Int. J. Inf. Manag. 2015, 35(3), 299–308. [Google Scholar] [CrossRef]
- Chang, T. Z.; Wildt, A.J.R. Price, product information, and purchase intention: an empirical study. J. Acad. Mark. Sci. 1994, 22(1), 16–27. [Google Scholar] [CrossRef]
- Karjaluoto, H.; Shaikh, A.A.; Saarijarvi, H.; Saraniemi, S. How perceived value drives the use of mobile financial services apps. Int. J. Inf. Manag. 2019, 47, 252–261. [Google Scholar] [CrossRef]
- Costa, S.; Zepeda, L.; Sirieix, L. Exploring the social value of organic food: A qualitative study in France. Int. J. Consum. Stud. 2014, 38, 228–237. [Google Scholar] [CrossRef]
- Cronin, J.J.; Brady, M.K.; Hult, G.T.M. Assessing the effects of quality, value, and customer satisfaction on consumer behavioral intentions in service environments. J. Retail. 2000, 76(2), 193–218. [Google Scholar] [CrossRef]
- Ruiz, D.M.; Gremler, D.D; Washburn, J.H.; Carrión, G.C. Service value revisited: specifying a higher-order, formative measure. J. Bus. Res. 2008, 61(12), 1278–1291. [Google Scholar] [CrossRef]
- Papagiannidis, S.; Bourlakis, M. Virtual test-driving: The impact of simulated products on purchase intention. J. Retail. Consum. Serv. 2014, 21(5), 877–887. [Google Scholar] [CrossRef]
- Brakus, J.J.; Schmitt, B.H.; Zarantonello, L. Brand experience: What is it? How is it measured? Does it affect loyalty? J. Mark. 2009, 73(3), 52–68. [Google Scholar] [CrossRef]
- Esmark J., C.L.; Barney, C.; Farmer, A. Appreciating anonymity: An exploration of embarrassing products and the power of blending in. J. Retail. 2018, 94(2), 186–202. [Google Scholar] [CrossRef]
- Maeng, Y.; Lee, K.; Yun, H. Understanding antecedents that affect customer evaluations of head-mounted display VR devices through text mining and deep neural network. J. Theor. Appl. Electron. Commer. Res. 2023, 18, 1238–1256. [Google Scholar] [CrossRef]
- Wang, Y.; Chen, H. The influence of dialogic engagement and prominence on visual product placement in virtual reality videos. J. Bus. Res. 2019, 100, 493–502. [Google Scholar] [CrossRef]
- Verhoef, P.C.; Lemon, K.N.; Parasuraman, A.; Roggeveen, A.; Tsiros, M.; Schlesinger, L. A. Customer experience creation: Determinants, dynamics and management strategies. J. Retail. 2009, 85(1), 31–41. [Google Scholar] [CrossRef]
- Gawron, M.; Strzelecki, A. Consumers’ adoption and use of E-Currencies in virtual markets in the context of an online game. J. Theor. Appl. Electron. Commer. Res. 2021, 16, 1266–1279. [Google Scholar] [CrossRef]
- Yin, J. ; Huang; Y.;Ma, Z. Explore the feeling of presence and purchase intention in livestream shopping: A flow-based model. J. Theor. Appl. Electron. Commer. Res, 18. [CrossRef]
- Yap, S.F.; Xu, Y.; Tan, L. Coping with crisis: The paradox of technology and consumer vulnerability. Int. J. Cosum. Stud. 2021, 45, 1239–1257. [Google Scholar] [CrossRef]
- Rese, A.; Baier, D.; Geyer-Schulz, A.; Schreiber, S. How augmented reality apps are accepted by consumers: A comparative analysis using scales and opinions. Technol. Forecast. Soc. Change. 2017, 124, 306–319. [Google Scholar] [CrossRef]
- Pantano, E.; Rese, A.; Baier, D. Enhancing the online decision-making process by using augmented reality: A two country comparison of youth markets. J. Retail. Consum. Serv. 2017, 38, 81–95. [Google Scholar] [CrossRef]
- Rese, A.; Schreiber, S.; Baier, D. Technology acceptance modeling of Augmented reality at the point of sale: Can surveys be replaced by an analysis of online review, J. Retail. Consum. Serv. 2014, 21(5), 869–876. [Google Scholar] [CrossRef]
- Tang, Z.; Chen, L. An empirical study of brand microblog users’ unfollowing motivations: The perspective of push-pull-mooring model. Int. J. Inf. Manag. 2020, 52, 102066. [Google Scholar] [CrossRef]
- Loureiro, S.M.C.; Guerreiro, J.; Eloy, S.; Langaro, D.; Panchapakesan, P. Understanding the use of virtual reality in marketing: A text mining-based review. J. Bus. Res. 2019, 100, 514–530. [Google Scholar] [CrossRef]
- Kim, D.; Ko, Y.J. The impact of virtual reality (VR) technology on sport spectators' flow experience and satisfaction. Comput. Hum. Behav. 2019, 93, 346–356. [Google Scholar] [CrossRef]
- Mäntymäki, M.; Salo, J. Why do teens spend real money in virtual worlds? A consumption values and developmental psychology perspective on virtual consumption. Int. J. Inf. Manag. 2015, 35(1), 124–134. [Google Scholar] [CrossRef]
- Sarantopoulos, P.; Theotokis, A.; Pramatari, K.; Roggeveen, A.L. The impact of a complement-based assortment organization on purchases. J. Mark. Res. 2019, 56(3), 459–478. [Google Scholar] [CrossRef]
- Tanner, G.; Schümann, M.; Baur, C.; Bamberg, E. Too fatigued to consume (ir) responsibly? The importance of work-related fatigue and personal values for responsible consumption. Int. J. Consum. Stud. 2021, 45(6), 1322–1334. [Google Scholar] [CrossRef]
- Li, H.; Daugherty, T.; Biocca, F. Impact of 3-D advertising on product knowledge, brand attitude, and purchase intention: The mediating role of presence. J. Advert. 2003, 31(3), 43–57. [Google Scholar] [CrossRef]
- Pee, L.G.; Jiang, J.; Klein, G. Signaling effect of website usability on repurchase intention. Int. J. Inf. Manag. 2018, 39, 228–241. [Google Scholar] [CrossRef]
- El-Adly, M.I.; Eid, R. An empirical study of the relationship between shopping environment, customer perceived value, satisfaction, and loyalty in the UAE malls context. J. Retail. Consum. Serv. 2016, 31, 217–227. [Google Scholar] [CrossRef]
- Foroudi, P.; Gupta, S.; Sivarajah, U.; Broderick, A. Investigating the effects of smart technology on customer dynamics and customer experience. Comput. Hum. Behav. 2018, 80(3), 271–282. [Google Scholar] [CrossRef]
- Hudson, S.; Matson-Barkat, S.; Pallamin, N.; Jegou, G. With or without you? Interaction and immersion in a virtual reality experience. J. Bus. Res. 2019, 100, 459–468. [Google Scholar] [CrossRef]
- Pezoa-Fuentes, C.; García-Rivera, D.; Matamoros-Rojas, S. Sentiment and Emotion on Twitter: The Case of the Global Consumer Electronics Industry. J. Theor. Appl. Electron. Commer. Res. 2023, 18, 765–776; [Google Scholar] [CrossRef]
- Manis, K.T.; Choi, D. The virtual reality hardware acceptance model (VR-HAM): Extending and individuating the technology acceptance model (TAM) for virtual reality hardware. J. Bus. Res. 2019, 100, 503–513. [Google Scholar] [CrossRef]
- Chakraborty, D.; Siddiqui, M.; Siddiqui, A. Can initial trust boost intention to purchase Ayurveda products? A theory of consumption value (TCV) perspective. Int. J. Consum. Stud. 2022, 46, 2521–2541. [Google Scholar] [CrossRef]
- Wei, W.; Qi, R.; Zhang, L. Effects of virtual reality on theme park visitors' experience and behaviors: A presence perspective. Tour. Manag. 2019, 71, 71,282–293. [Google Scholar] [CrossRef]
- Thornson, C.A.; Goldiez, B.F.; Le, H. . Predicting presence: Constructing the tendency toward presence inventory. Int. J. Hum. Comput. [CrossRef]
- Mäntymäki, M.; Salo, J. Why do teens spend real money in virtual worlds? A consumption values and developmental psychology perspective on virtual consumption. Int. J. Inf. Manag. 2015, 35(1), 124–134. [Google Scholar] [CrossRef]
- Bustamante, J.C.; Rubio, N. Measuring customer experience in physical retail environments. J. Serv. Manag. 2017, 28(5), 884–913. [Google Scholar] [CrossRef]
- Bagozzi, R P. ; Yi, Y. On the evaluation of structural equation models. J. Acad. Mark. Sci. 1988, 16, 74–94. [Google Scholar] [CrossRef]
- Bagozzi, R.P.; Yi, Y.; Phillips, L.W. Assessing construct validity in organizational research. Adm. Sci. Q. 1991, 36(3), 421–458. [Google Scholar] [CrossRef]
- Woodside, A.G.; Zhang, M. Cultural diversity and marketing transactions: Are market integration, large community size, and world religions necessary for fairness in ephemeral exchanges? Psychol. Mark. 2013, 30(3), 263–276. [Google Scholar] [CrossRef]
- Woodside, A.G. Moving beyond multiple regression analysis to algorithms: Calling for a paradigm shift from symmetric to asymmetric thinking in data analysis and crafting theory. J. Bus. Res. 2013, 66(4), 483–472. [Google Scholar] [CrossRef]
- Fiss, P.C. Building better causal theories: A fuzzy set approach to typologies inorganization research. Acad. Manage. J. 2011, 54(2), 393–420. [CrossRef]
- Erdmann, A.; Manuel Mas, J.; Arilla, R. Value-based adoption augmented reality:a study on the influence on online purchase intention in retail. J. Consum. Behav. 2021, 1–21. [Google Scholar] [CrossRef]
- Qin, H.; Peak, D.A.; Prybutok, H. A. virtual market in your pocket: How does augmented reality (MAR) influence consumer decision making. J. Retail. Consum. Serv. 2021, 58, 102337. [Google Scholar] [CrossRef]
- Schnack, A.; Wright, M.J.; Holdershaw, J.L. An exploratory investigation of shopper behaviour in an immersive virtual reality store. J. Consum. Behav. 2019, 19(2), 182–195. [Google Scholar] [CrossRef]
- Gordon-Wilson, S. Consumption practices during the COVID-19 crisis. Int. J. Consum. Stud. 2022, 46(2), 575–588. [Google Scholar] [CrossRef]
- Kursan Milakovic, I. Purchase experience during the COVID-19 pandemic and social cognitive theory: The relevance of consumer vulnerability, resilience, and adaptability for purchase satisfaction and repurchase. Int. J. Consum. Stud. 2021, 45(6), 1425–1442. [Google Scholar] [CrossRef] [PubMed]
Figure 1.
Research framework.


Table 1.
Demographics of respondents.
| Gender | Responses | Percentage |
|---|---|---|
| Male | 197 | 29.19% |
| Female | 474 | 70.22% |
| Other | 4 | 0.59% |
| Total | 675 | 100% |
| Age | Responses | Percentage |
| 16-25 | 298 | 44.15% |
| 26-35 | 237 | 35.11% |
| 36-45 | 62 | 9.19% |
| 46-55 | 37 | 5.48% |
| 56-65 | 26 | 3.85% |
| 66+ | 15 | 2.22% |
| Total | 675 | 100% |
| Education | Responses | Percentage |
| Below high school | 51 | 7.56% |
| High School | 217 | 32.15% |
| Bachelor’s degree | 246 | 36.44% |
| Master’s degree | 126 | 18.67% |
| PhD. degree | 35 | 5.19% |
| Total | 675 | 100% |
| Using AR/VR experience | Responses | Percentage |
| Under five times | 364 | 53.93% |
| 5-10 times | 172 | 25.48% |
| 11-15 times | 89 | 13.19% |
| 16-20 times | 32 | 4.74% |
| 21+ times | 18 | 2.67% |
| Total | 675 | 100% |
| Income(Monthly) | Responses | Percentage |
| Less than NT$30,000 | 246 | 36.66% |
| NT$30,000-49,999 | 183 | 27.27% |
| NT$50,000-69,999 | 95 | 14.16% |
| NT$70,000-89,999 | 72 | 10.73% |
| NT$90,000-100,999 | 54 | 8.05% |
| More than NT$110,000 | 21 | 3.13% |
| Total | 675 | 100% |
Table 2.
The mean value, standard deviation, and standardized loadings of measures in the measurement model.
Table 2.
The mean value, standard deviation, and standardized loadings of measures in the measurement model.
| Construct and scale items | Mean | SD | Standardized loadings |
|---|---|---|---|
| Value (7-point scales with anchors strongly disagree and strongly agree) | |||
| 1. Fashion brand shopping with VR/AR responds to customer needs. | 4.8 | 1.6 | 0.84 |
| 2. Fashion brand shopping with VR/AR is clear and understandable. | 4.6 | 1.4 | 0.86 |
| 3. Fashion brand shopping with VR/AR are valuable to my shopping. | 4.7 | 1.3 | 0.83 |
| 4. Fashion brand shopping with VR/AR shows a sincere interest in trying it. | 5.1 | 1.7 | 0.82 |
| 5. Fashion brand shopping with VR/AR helps you in making a decision. | 4.9 | 1.6 | 0.89 |
| Enjoyment (7-point scales with anchors strongly disagree and strongly agree) | |||
| 1. Fashion brand shopping with VR/AR is fun to watch and listen to. | 4.6 | 1.3 | 0.84 |
| 2. Fashion brand shopping with VR/AR is entertaining. | 5.1 | 1.5 | 0.79 |
| 3. Fashion brand shopping with VR/AR is enjoyable. | 4.8 | 1.8 | 0.78 |
| 4. Fashion brand shopping is fun to use VR/AR function. | 4.7 | 1.7 | 0.84 |
| 5. Fashion brand shopping does not sell products, but it would entertain me. | 5.2 | 1.6 | 0.83 |
| Informativeness (7-point scales with anchors strongly disagree and strongly agree) | |||
| 1. Fashion brand shopping with VR/AR shows the information I expected. | 5.3 | 1.6 | 0.81 |
| 2. Fashion brand shopping with VR/AR provides detailed information about fashion brands. | 5.4 | 1.5 | 0.78 |
| 3. Fashion brand shopping with VR/AR provides complete information about fashion brands. | 5.2 | 1.6 | 0.74 |
| 4. Fashion brand shopping with VR/AR provides information that helps me understand the products. | 4.8 | 1.4 | 0.82 |
| 5. Fashion brand shopping with VR/AR provides the information to compare products. | 4.9 | 1.5 | 0.78 |
| 6. Fashion brand shopping with VR/AR offers product knowledge. | 4.7 | 1.6 | 0.79 |
| Presence (7-point scales with anchors strongly disagree and strongly agree) | |||
| 1. Fashion brand shopping with VR/AR is similar to experiencing the products in reality. | 5.3 | 1.6 | 0.81 |
| 2. Fashion brand shopping with VR/AR feels real. | 5.4 | 1.5 | 0.83 |
| 3. Fashion brand shopping with VR/AR seems real rather than virtual. | 5.2 | 1.6 | 0.85 |
| 4. Fashion brand shopping with VR/AR is as realistic to me as in the real world. | 4.8 | 1.4 | 0.75 |
| Consumer experience (7-point scales with anchors low and high) | |||
| 1. Fashion brand shopping with VR/AR awakens my curiosity | 4.6 | 1.5 | 0.72 |
| 2. Fashion brand shopping with VR/AR brings interesting ideas to my mind | 5.1 | 1.6 | 0.83 |
| 3. Fashion brand shopping with VR/AR inspires me | 5.2 | 1.4 | 0.82 |
| 4. Fashion brand shopping with VR/AR makes me feel enthusiastic | 4.3 | 1.7 | 0.86 |
| 5. Fashion brand shopping with VR/AR makes me feel amazed | 4.7 | 1.8 | 0.75 |
| 6. Fashion brand shopping with VR/AR makes me feel comfortable | 4.9 | 1.7 | 0.82 |
| 7. The experience of fashion brand shopping with VR/AR is exactly what I need. | 5.1 | 1.6 | 0.75 |
| 8. I am satisfied with the experience of fashion brand shopping with VR/AR | 4.8 | 1.4 | 0.82 |
| Purchase Intention (7-point scales with anchors low and high) | |||
| Please compare your firm's performance to your competitors over the last five years | |||
| 1. After using VR/AR, I would purchase the fashion brand product. | 5.4 | 1.8 | 0.87 |
| 2. After using VR/AR, I would consider buying a fashion brand product that is very high. | 5.1 | 1.7 | 0.91 |
| 3. After using VR/AR, I will be buying a fashion brand product that is very high. | 5.3 | 1.6 | 0.88 |
| 4. After using VR/AR, I intend to buy a fashion brand product that is very high. | 4.9 | 1.4 | 0.79 |
Abbreviations: Mean, Mean value, SD, standard deviation.
Table 3.
Construct measurement in the survey.
 |
Abbreviation: AVE, average variance extracted.
Table 4.
Overall model fit.
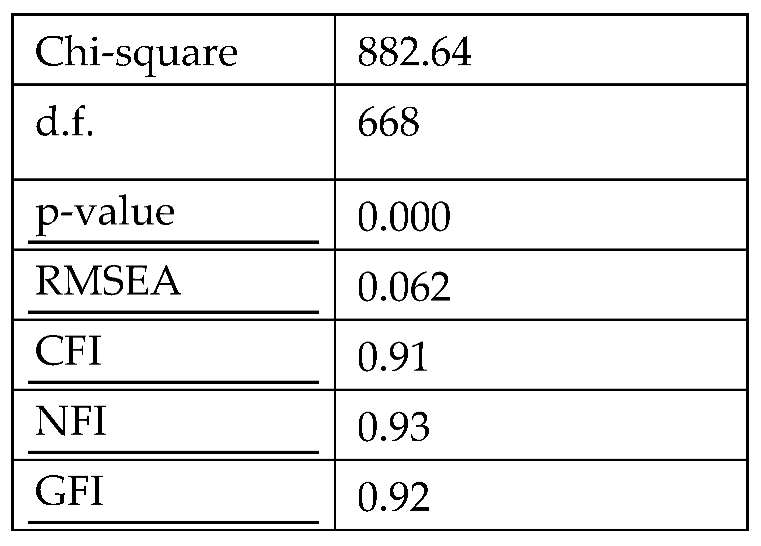 |
Abbreviations: CFI = comparative fit index; GFI = goodness of fit index; NFI = normed fit index; RMSEA = root mean square error of approximation.
Table 5.
Path analysis results.
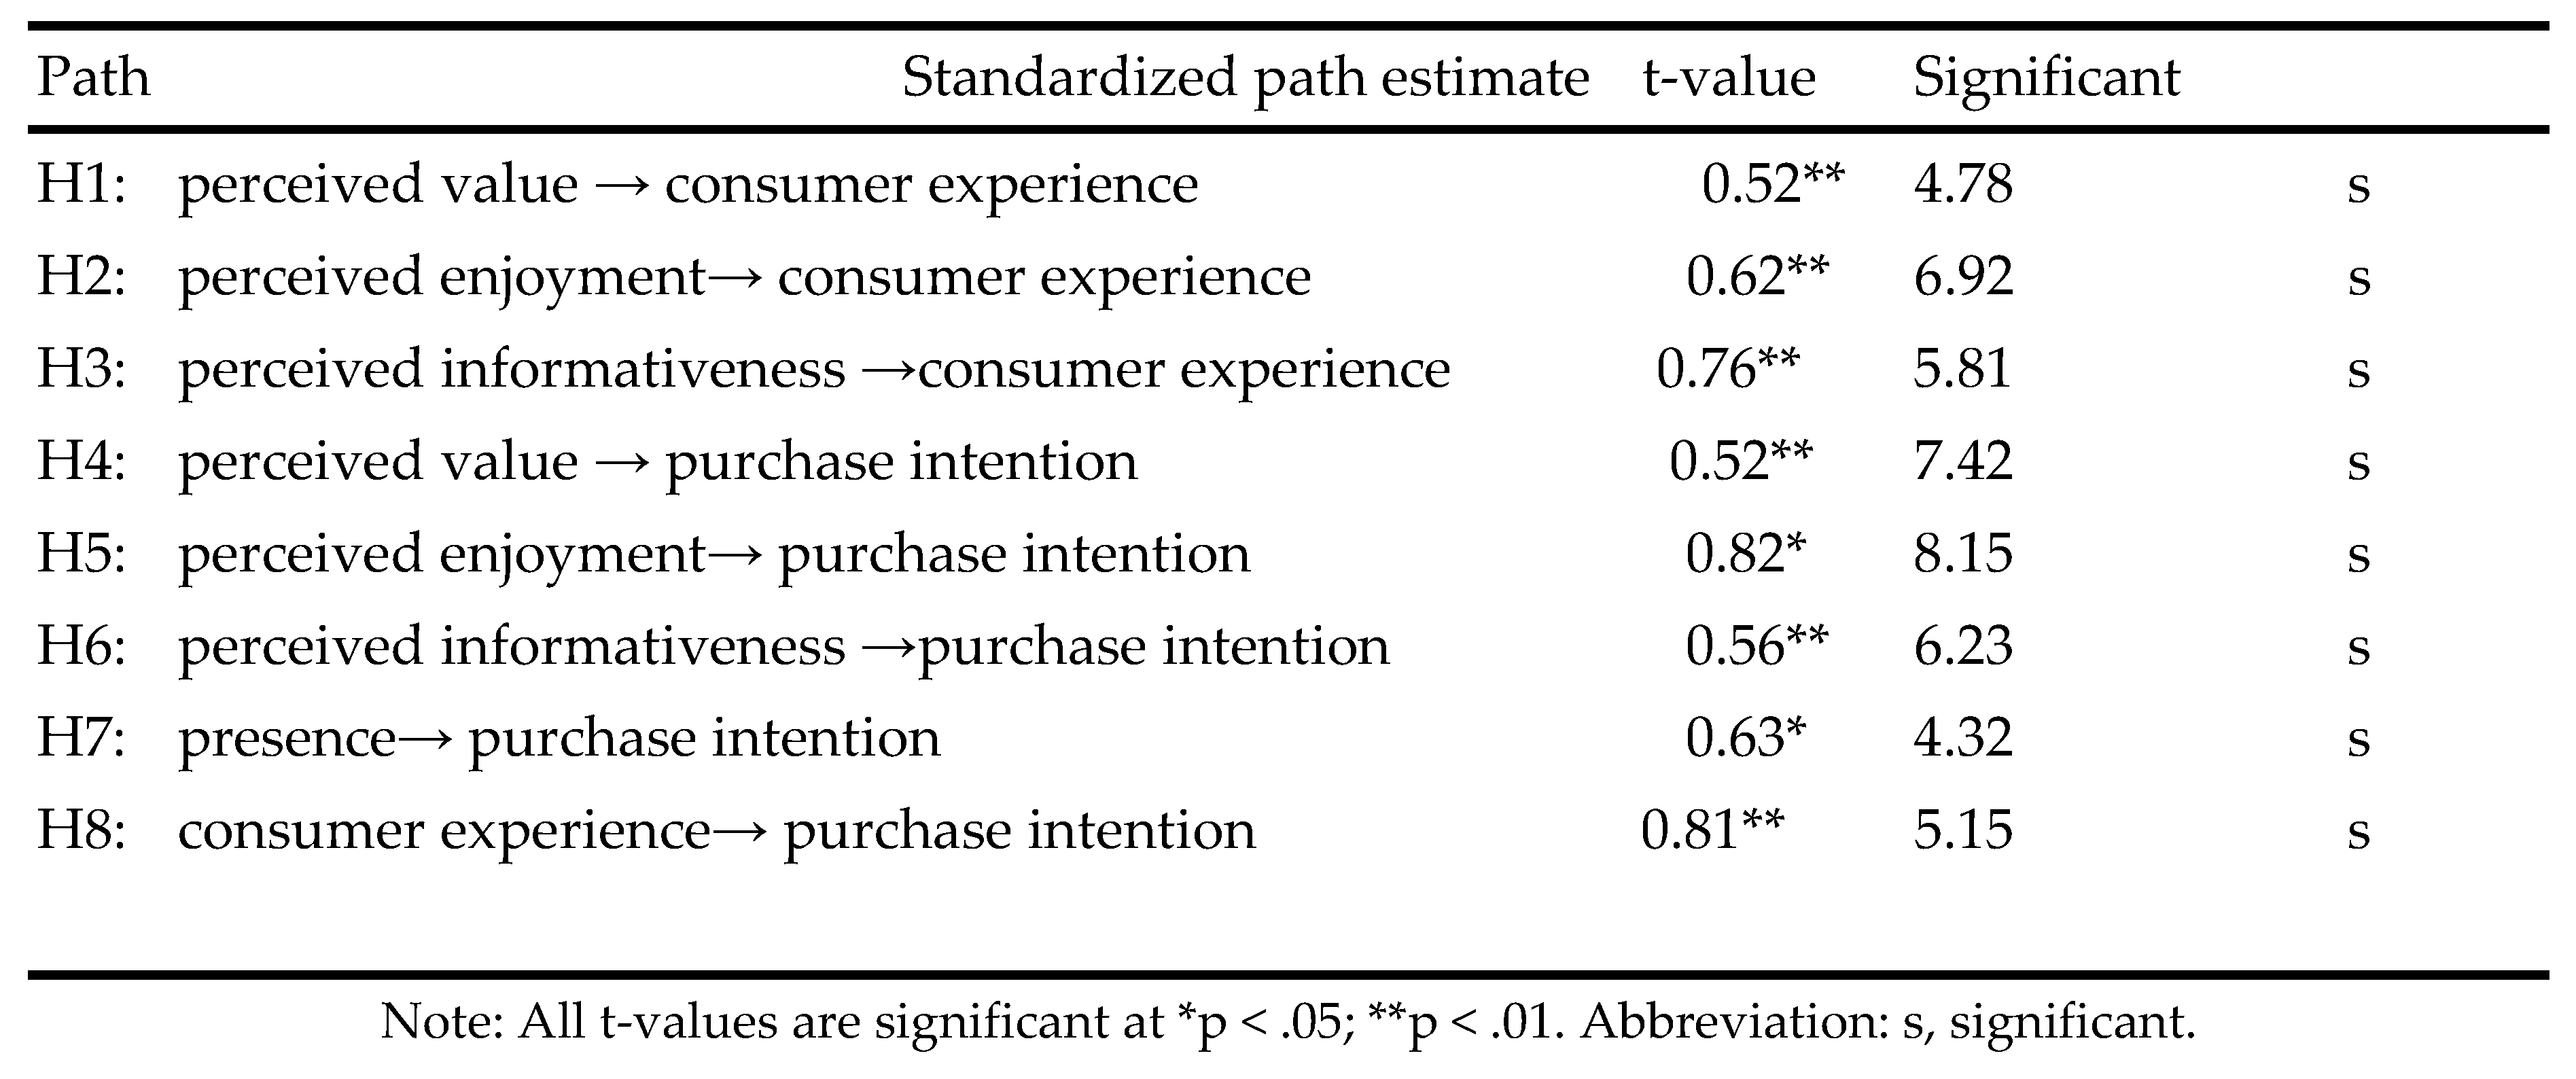 |
Table 6.
Data Calibration.
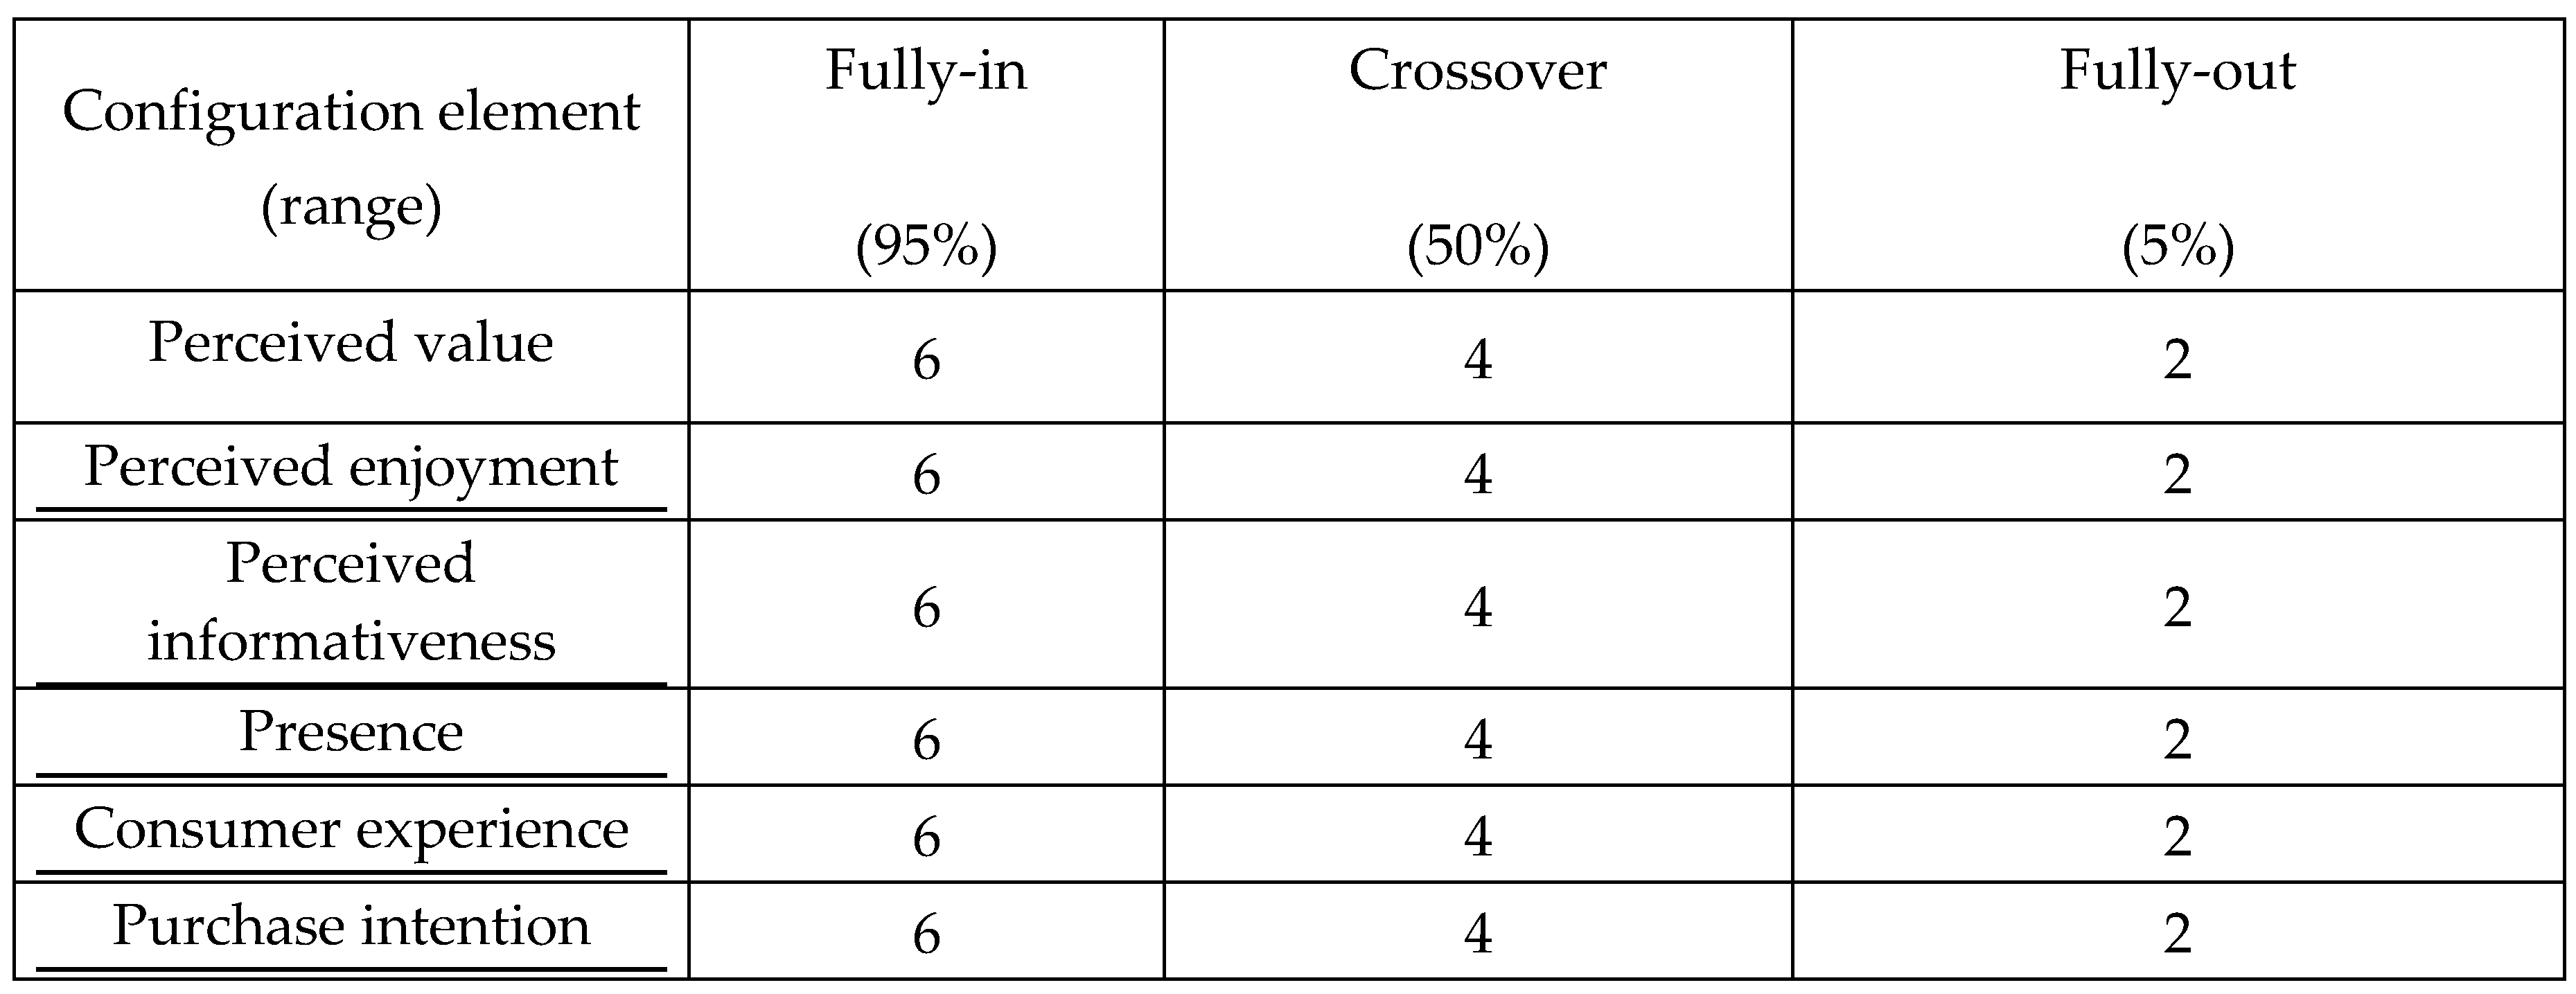 |
Calibration thresholds: fully in=top quartile, crossover=median, and fully out=bottom quartile.
Table 7.
Analysis of necessary conditions for predicting purchase intention.
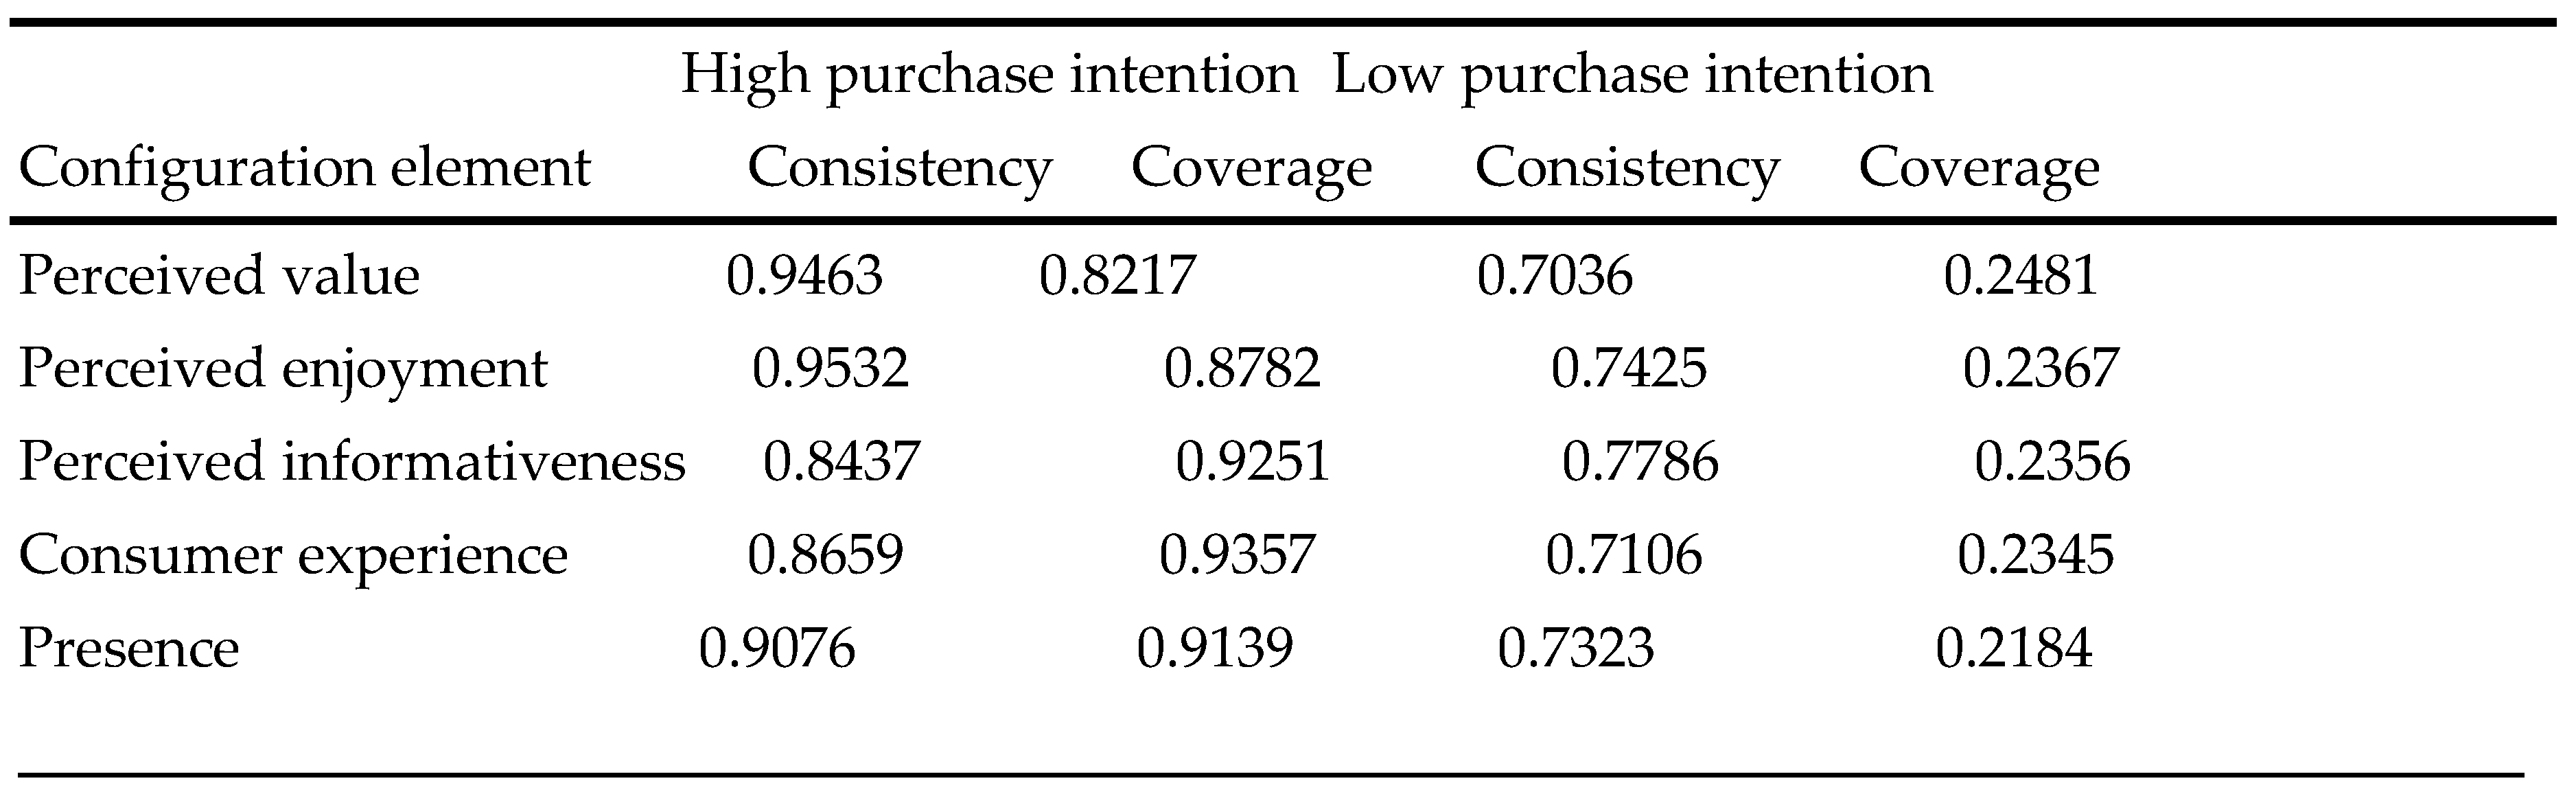 |
Table 8.
Sufficiency analysis for high purchase intention.
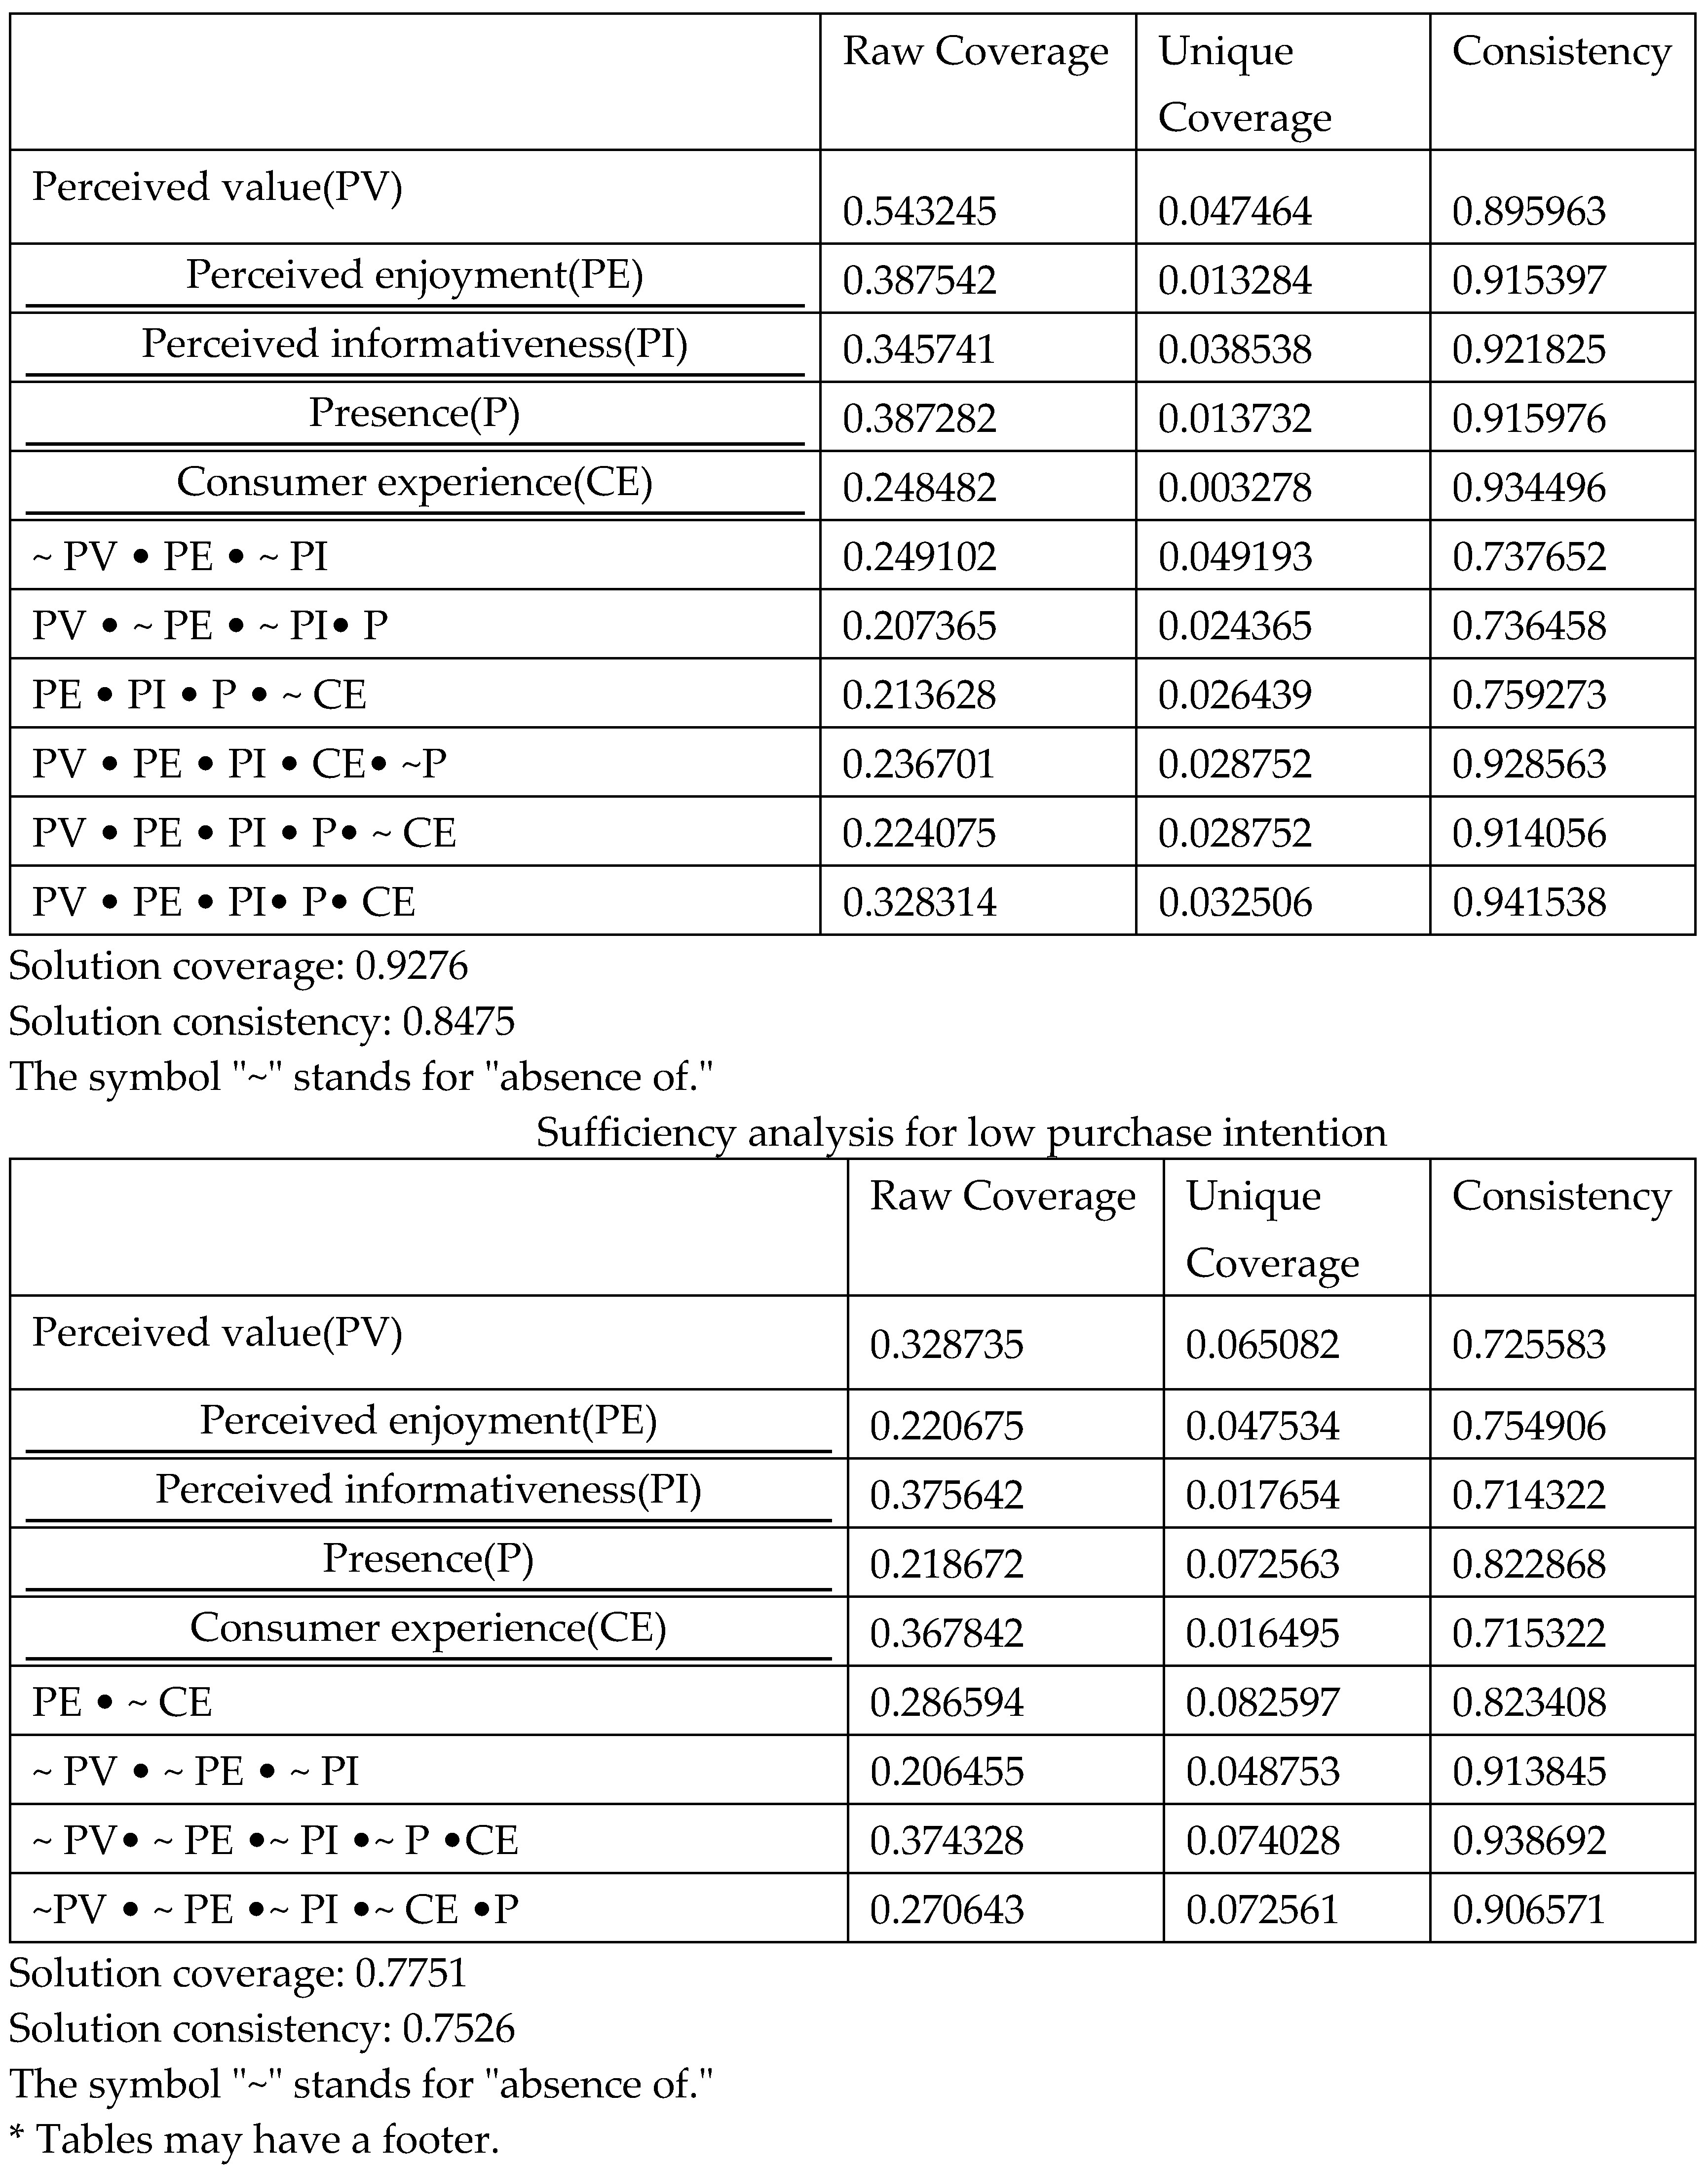 |
Disclaimer/Publisher’s Note: The statements, opinions and data contained in all publications are solely those of the individual author(s) and contributor(s) and not of MDPI and/or the editor(s). MDPI and/or the editor(s) disclaim responsibility for any injury to people or property resulting from any ideas, methods, instructions or products referred to in the content. |
© 2023 by the author. Licensee MDPI, Basel, Switzerland. This article is an open access article distributed under the terms and conditions of the Creative Commons Attribution (CC BY) license (https://creativecommons.org/licenses/by/4.0/).
Copyright: This open access article is published under a Creative Commons CC BY 4.0 license, which permit the free download, distribution, and reuse, provided that the author and preprint are cited in any reuse.


