
Submitted:
16 July 2023
Posted:
18 July 2023
You are already at the latest version
Abstract
Bacteria’s ability to withstand the detrimental effects of antimicrobials may take the form of resistance or tolerance with the minimum inhibitory concentration (MIC), the mutant prevention concentration (MPC), and the mutant selection window as salient concepts. Isolates exposed for 30 days to different concentrations of selected antibiotics, biocides, and heavy metals, singly and in combination, were additionally exposed to very high (15 × MIC) concentrations of ampicillin., and their tolerance was calculated the time to kill 99.9% of the isolate population (MDK99.9). These values were increased by 30 to 50% in test isolates compared to the untreated control. BAC 10-exposed isolates had the highest tolerance increase, and the tolerance appeared to originate from two sources, i.e., stochastic persistence and genetic-induced persistence, involving multiple genes using diverse mechanisms. The mutant selection window of the isolates to ampicillin, amoxicillin, and oxytetracycline also slightly increased compared to the control, indicating the amplification of persister cells during the 30-day exposure. These findings indicate that bacterial exposure to sub-inhibitory concentrations of environmental chemical stressors may not always result in the development of antimicrobial resistance but could initiate this process by selecting for persisters that could evolve into resistant isolates.
Keywords:
environmental stressors
; pharmaceuticals
; antibiotic resistance
; selection pressure
; public health
; tolerant bacteria
; environmental pollution
; mutation
; whole genome sequencing
; single nucleotide polymorphisms
1. Introduction
Bacteria and other microorganisms have continuously adapted to adverse stressors from the natural environment and anthropogenic activities. These adaptations are exhibited phenotypically (persistence, biofilms, resistance, and tolerance) and genotypically through resistance and tolerance genes.
Resistance is the ability of bacteria to survive, grow and replicate in the presence of antimicrobials at concentrations beyond the minimum inhibitory concentrations (MIC) and usually manifests as direct drug inactivation, decreased intake, and increased efflux of the drug, as well as the alteration of the binding sites for the drugs [1,2,3]. Tolerance, on the other hand, is the ability of the bacteria to survive low to extremely high antimicrobial concentrations, usually above bactericidal concentrations but without growth or replication [2]. Tolerance occurs in bacteria through molecular mechanisms such as dormancy, reduced metabolism, oxidative stress, and adenosine triphosphate (ATP) level maintenance. On their part, persisters are a naturally occurring sub-population of bacteria, making up about 0,000001% of the bacteria population. Their lack of growth makes them infallible to attacks by most extraneous effects such as antimicrobials and environmental stressors, and they can survive extremely high pressure from these stressors [4]. Unlike resistance, which involves a one-gene-one phenotype expression, persistence and eventual tolerance are associated with multiple genes [5,6,7,8].
While resistance increases the MIC of the mutant compared with the susceptible parental strain, the MIC remains the same in both the parental and the evolved strain with tolerance. Tolerance is instead observed as an increase in the MDK99, the minimum duration to kill 99% of the bacteria in a culture [9]. Generally, persister cells are genetically similar to parental and non-persister cells in the same population and have the same MIC. However, their presence is responsible for the biphasic killing pattern observed in bacteria, which usually starts exponentially (signifying the killing of the susceptible cells, then increases slightly again, indicating the secondary killing phase of the persister cells [5,9].
Besides resistance and tolerance, another factor of great interest in microbial invulnerability is the mutant selection window (MSW). The MSW represents the concentration range for the emergence of resistant mutants within a bacterial population. It is the range between the minimum inhibitory concentration (MIC) and the mutant prevention concentration (MPC). The MIC is the minimum concentration of antimicrobial that inhibits bacteria growth. The MPC is the MIC of the least susceptible first-step resistant mutant (the most resistant mutant) in a 1010 CFU bacterial population. The length of the MSW plays a huge role in the selection of resistance in bacteria. The shorter the window, the smaller the drug concentration range, and the better the chances of preventing the development of resistant mutants [10].
Environmental discharge points such as hospital and manufacturing effluent can have stressors at concentrations 3 to 10 times the environmental values, especially antibiotics and heavy metals. For example, in Africa, sulfamethoxazole (SMX) has been detected at concentrations of 20.6 µg/L in hospital effluents compared to 6.8-7.8 µg/L in WWTP and surface waters [11]. In addition, ciprofloxacin (CIP) levels detected in industrial effluents were up to 31,000 µg/L, which is over 100 times the toxic level of most bacteria [11,12,13]. Karkman et al. (2019) suggested that these types of concentrations, above the bactericidal levels, were responsible for the emergence of AMR in the environment. The MPC represents the concentration above which bacteria rarely select for resistant mutants [14,15]. However, environmental concentrations of these stressors fluctuate between very low to extremely high, depending on the distance to the source and weather and could contribute to the emergence of cell persistence and subsequent development of tolerance by bacterial populations. Therefore, investigating the effect of prolonged exposure to sub-bactericidal concentrations, as seen in the environment, on the emergence of tolerance to stressors by bacteria is essential.
The standard technique to assess tolerance is through time-kill measurements, with viable colony forming units (CFU) of bacteria exposed to an antimicrobial plotted against time. When the killing is solely exponential, the killing rate can be used to measure tolerance, which is the minimum duration of killing (MDK) at a certain percentile of the population, expressed as an index in the MDK value. Therefore, MDKn is the minimum time required to kill n% of a bacterial population. Conversely, a high MDK suggests bacterial killing requires more time, which eventually corresponds to high tolerance [16]. Hence, tolerance is a bacteria's ability to stay alive despite bactericidal antimicrobial concentration [17].
In our previous experiment, it was observed that the environmental concentrations of oxytetracycline (OXYTET), amoxicillin (AMX), copper (Cu), zinc (Zn), benzalkonium chloride (BAC) 10, dimethylammonium chloride (DADMAC) 12 and a combination of all of them could not elicit phenotypic or genotypic resistance in the bacteria following exposure for 30 days (Data not shown). Therefore, this study looked at the impact of these exposures on the level of persistence and tolerance development in the exposed isolates; using extremely high doses of ampicillin for killing. The current study further assessed the associations with observed mutations by whole genome sequencing (WGS) and Single nucleotide polymorphisms (SNP) and investigated the impact of such exposure to the MSW of these exposed E. coli isolates to ampicillin, oxytetracycline and amoxicillin.
2. Materials and Methods
Two sets of experiments were conducted using the 30-day exposed isolates, first to determine the MSW to amoxicillin, oxytetracycline and ampicillin and their MDK99.9 when exposed to extremely high doses of ampicillin.
2.1. Test Organisms
The test organisms were the 30-days exposed E. coli (ATCC strain 25922) isolates from the earlier experiment, while wholly susceptible E. coli (ATCC strain 25922) were used as control. Bacteria inoculum at a concentration of 1.5 x 10⁸ McFarland standard, was prepared using the 30-day exposed isolates and the wholly susceptible E. coli (ATCC strain 25922).
2.2. Determination of Bacterial Tolerance
For this experiment, the duration for killing 99.99% of the isolates (MDK99.99) was investigated by modifying the method by Fridman et al. [18]. First, the exposed isolates were cultured overnight on nutrient agar at 37 °C to obtain fresh, viable, and concentrated isolates to monitor killing rates adequately. Then, the cultured isolates were scrapped into a 1 mL of Luria-Bertani (LB) broth (Merck Life Science (Pty) Ltd, Johannesburg, South Africa) and cultured overnight for a very concentrated culture. After that, the 1 mL of the concentrated culture was inoculated into 5 mL LB broth supplemented with 100 g/mL ampicillin (about 15 times the E. coli ampicillin MIC value). Each culture mixture was prepared in 2 x triplicate sets for three different time intervals (Ta = 3, 5, and 8 hours), and the culture mixture was then incubated at 37 °C in a shaking incubator at 200 rpm.
Depending on the time intervals (3, 5 and 8 hours), the culture was brought out after the incubation and washed twice in 5 mL of LBL by centrifuging at 1400g for 10 minutes. Next, the pellets were resuspended in 1 mL of LBL and grown again for up to 24 hours (21, 19 and 16 hrs, respectively) at 37 °C in a shaking incubator at 200 rpm. This gave a fresh 24 hr culture for the following day's exposures. After 24 hours, the plate was cell counted and recorded. The overnight culture was then subjected to the same exposure as the previous day for three consecutive days, using the same cyclic periods. To confirm tolerance and not resistance, the surviving E. coli cells were also subjected to AST to ascertain changes in their MICs compared to the original stock [18].
2.3. Mutant Selection Window
The MSW is an antimicrobial concentration range extending from the minimal concentration required to block the growth of wild-type bacteria (MIC) to the concentration needed to inhibit the growth of the least susceptible, single-step mutant (MPC).
The MIC was performed using the European Committee on Antimicrobial Susceptibility Testing (EUCAST) broth microdilution method [19,20,21]. Briefly, two-fold serial dilutions of the test agents (environmentally determined amoxicillin, ampicillin and oxytetracycline) were dispensed into microdilution plates and inoculated with E. coli. The plates were incubated at 37 °C for 24 hours and read visually. The MPC was obtained by determining the MIC of a higher microbial load (≥109 CFU/mL) as previously described [22].
All contiguous sequences for the isolates used in this study have been deposited in GenBank with accession numbers under BioProject PRJNA836107.
3. Results
3.1. Determination of toleance
3.1.1. Tolerance among biocide-exposed isolates
The tolerance of the biocide-exposed isolates was measured as the minimum duration for killing 99.99% (MDK99.99) of the BAC 12 and the DADMAC 10-exposed isolates when treated with a very high ampicillin concentration. There was a decrease in the initial bacterial concentration of 2.5 × 10⁸ CFU/ml to 2.5 × 10⁴ CFU/mL on the second day, giving an MDK99.99 of 30 hours for BAC 12 (Figure 1). For DADMAC 10-exposed isolates, the bacterial count dropped from 1.8 × 10⁸ to 1.5 × 10⁴ CFU/mL, giving an MDK99.99 value is 28 hours (Figure 1). There was no reduction in the bacterial count of the controls.
3.1.2. Tolerance among antibiotics residue exposed isolates
The 30-day amoxicillin-exposed isolates, with an initial concentration of 1 x 10⁸ CFU/mL, when exposed to a very high dose of ampicillin, had an MDK99.99 at 26 hours on the second day, as the concentration decreased to 1 × 10⁴ CFU/mL (Figure 2). The OXYTET-exposed isolates had an MDK99.99 value of 28 hours, with the initial concentration of 2 x10⁸ CFU/mL decreasing to 2 × 10⁴ CFU/mL on the second (Figure 2).
3.1.3. Tolerance among metal-exposed isolates
The 30-day heavy metals (Zn and Cu)-exposed isolates, when subjected to a high ampicillin dose ampicillin had an MDK99.99 of 28 hours and 30 hours with bacterial concentrations reducing from 2 × 10⁸ CFU/mL to 2 ×10⁴ CFU/mL, and 1.5 × 10⁸ CFU/mL to 1.5 × 10⁴ CFU/mL on the second day for Zn and Cu, respectively (Figure 3).
3.1.4. Tolerance for the combined chemicals-exposed isolates
The combined chemicals (ALL)-exposed isolates subjected to a high ampicillin dose treatment expressed an MDK99.99 value of 26 hours with a concentration of 2.5 × 10⁴ CFU/mL on the second day, from an initial concentration of 2.5 × 10⁸ (Figure 4).
3.1.5. Comparison of pollutant-treated isolates to control in the determination of the MDK99.99
The MDK99.99 of all the pollutant-exposed isolates, compared to that of the control, are summarised in Table 1. Compared with the control with an initial concentration of 3.5 x 10⁹ and an MDK99.99 of 20 hours at 3.5 x 10⁵ CFU/ml, BAC 12-exposed isolates showed an increase in duration of killing by 50% while for DADMAC 10-exposed isolated recorded a 40% increase following treatment with a very high ampicillin dose. Also, for the AMX and OXYTET-exposed isolates, the MDK99.99 increased by 30% and 40%, respectively, after high ampicillin exposure. Furthermore, there was a 40% and 30% increase in the MDK99.99 for Zn and Cu-exposed isolated, respectively, compared to the control. Finally, ALL-treated isolates displayed a 30% increased MDK99.99 value compared to the control upon treatment with high antibiotic concentrations.
3.2. Determination of the Mutant Selection Window
The MSW of the isolates exposed for 30 days to the different environmental stressors was obtained by determining the MIC and MPC of these isolates. The results are presented in Table 2. No significant increase in the MSW was observed for OXYTET treatment compared to the control. For the AMX treatment, no significant difference in the MSW of the AMX, OXYTET and Cu-exposed isolates compared with the control. However, there was a 41.67% increase in the MSW of Zn-exposed isolates and a 100% increase in the MSW for the DADMAC, BAC and ALL-exposed isolates. Finally, ampicillin treatment revealed a 100% (Zn-exposed isolates) and 300% (ALL-exposed isolates) increase in the MSW of the test isolates compared to the control (Table 2).
4. Discussion
The present study investigated the impact of exposure to different environmental pollutants on the development of resistance in bacteria, using E. coli as a model organism. Previously exposed isolates were treated with extremely high ampicillin concentrations, and the time to reduce their population by 99.99% was determined. It was observed that exposure to environmental concentrations of biocides, antibiotics and heavy metals induced tolerance in the test organism, demonstrated by an increase in the time to kill 99.99% of the exposed bacterial population and a broadening of the mutant selection window.
4.1. Tolerance in exposed isolates
Tolerance develops from increased persister cells in a population, and these cells can out-compete or be out-competed based on prevailing conditions [2,4,5,9]. This means that the increase in the number of persister cells should translate to an increase in tolerance, indicated by an increase in the MDK99.99 of the isolates, triggered by the expression of genes as seen in the 30-days exposed wholly susceptible E. coli in the current study. This is a sure pathway towards making the population fully tolerant and a first step towards resistance, as further exposure may lead to the development of resistance genes. Furthermore, this shows that tolerance enables the bacteria to survive stress, and if the stress contrinues, the bacterial fitness cost for selecting and expressing resistance genes is lowered [18,23,24].
The current experiment reveals that exposing E. coli to sub-inhibitory concentrations of different chemicals can increase the duration of the killing of the exposed isolates (MDK99.99), indicating that the exposed isolates may have a greater survival ability in the environment compared to unexposed cells (in this case the control). From the results, BAC 12 had the highest MDK99.99, 50% higher than the control, while amoxicillin and copper had the lowest MDK99.99 of 30% higher than the control. In our earlier experiment on these isolates, WGS showed mutations in the isolates after 30 days of exposure, with no phenotypic resistance. However, this study identified more survivors in the exposed isolates compared with control isolates, despite the exposure to a very high concentration of ampicillin (MICx 15), indicating probable adaptation to antimicrobials in the environment in the form of increased persister development and resultant antimicrobial tolerance based on the observed increase in MDK instead of the MIC [18]. Tolerance is reversible with improved favorable conditions and unlike resistance, uses different mechanisms, which we also observed in our study.
Susceptible E. coli ATCC 25922 strains, exposed to sub-MIC concentrations of DADMAC, BAC 12, Zn, Cu, AMX and OXYTET over 30 days, showed no phenotypic or genotypic antibiotics resistance traits (Data not shown). Most of the genes as detected through WGS/SNP (acnB, cusA, degQ, epmA, queG, hsmp, mlc, murP, nudK, ptsG, purH, queG, robA, srlE, tsaB, yddG and yqhH), are involved in repression of oxidative stress, SOS-dependent gene repairs, toxin/antitoxin efflux actions, skin permeability, biofilm formation or cellular physiological processes. These are factors mostly employed by bacteria for tolerance and persister cell production. [25,26].
BAC 12 had the highest MDK99.99, and in addition to the genes above, the BAC12 isolates also had the fliL gene. The fliL gene was only detected in BAC12 and oxytetracycline isolates, and this may have contributed to the high MDK99.99 observed in these two isolates. fliL is one of the seven genes within the flagellar associated flaA locus and works with the rotor and stator proteins associated with the mobility of bacteria by stabilising and increasing the efficiency of the stators, thus enhancing the torque generation, which is essential for swarming over surfaces, increasing bacteria motility [27,28]. Cell motility contributes to bacteria survival and virulence, and survival due to motility does not increase the MIC of the survivors [29]. This result is in agreement with previous studies indicating that exposure of E. coli to sub-MIC concentrations of BAC resulted in the expression of genes associated with efflux, outer membrane porins and motility, which increase BAC tolerance in E. coli [30,31,32,33]. So, the detected filL gene likely contributed to increased tolerance to stressors in the BAC12 and OXYTET-exposed isolates, and this can be confirmed by the increased MDK when compared to control, indicating an increased number of persister cells capable of surviving bactericidal concentrations of antimicrobials.
Oxidative stress, which results from the over-accumulation of reactive oxygen species (ROS) (produced by normal metabolism and essential for cell signalling and homeostasis), leads to DNA damage and cell death. For example, the mutM and Fpg (formamidopyrimidine glycolase) genes were detected in only zinc-exposed isolates (with a 40% increase in tolerance compared to the control). Fpg is a bifunctional DNA glycosylase that cleaves the N-glycoside bond of redox-damaged purines and incises the phosphodiester backbone to yield single-strand breaks with 3' and 5'phosphoryl ends [34]. In repairing oxidative damaged DNA, mutM is the primary DNA glycosylase that removes the oxidised purines and some pyrimidines [34]. As such, it is actively involved in the repair of lesions in the transcription of intermediates. Its involvement has been noted in the molecular mechanism of lesion recognition, formation of productive complex and lesion excision [35,36,37]. Repairs of DNA and genetic materials are part of the SOS response for cell survival. SOS response in E. coli contributes to the transcription of genes involved in DNA repairs, persister production, biofilms and tolerance mechanism [25,38,39].
Another gene only detected in DADMAC isolates was the ompD, a major porin protein in the outer membrane of cells. It constitutes about 50% of the cell wall porins during favourable conditions and increases with increased anaerobiosis and environmental stress. It is involved in the efflux of toxins/antitoxins through the cell membrane, which is very important in persister production and tolerance [40,41,42]. Furthermore, the nudK gene, also known as GDP-mannose hydrolase (which was expressed by other isolates except for DADMAC-exposed isolates), is a member of the ADP-ribose pyrophosphate sub-family of the Nudix hydrolases, whose overexpression suppresses the lapB that encodes the protein involved in lipopolysaccharide (LPS) assembly. This gene promotes biofilm formation, contributing to persister production and tolerance [25,43]. In addition, the hsmP gene, which was also detected in all the isolates, also encodes for biofilm formation [44]. Biofilms are very important for tolerance as it encourages the production of persister cells within the population.
Another gene detected in all the isolates that contributes to tolerance is the murP gene which encodes the permease component of the N-acetylmuramic acid PTS transport system and facilitates the uptake and transportation of anhydrous acetylmuramic (anyMurNAc) acid but not its phosphorylation. In addition, it encodes anmK (anhydro-N-acetyl muramic acid kinase), which is needed to convert imported anhMurNAc to MurNAc-P, a carbon and energy source for E. coli. The cAMP and catabolic response genes in E. coli negatively relay rpoS, so over-expression of rpoS induces stationary phase cells and persisters production and increases tolerance to antimicrobials [25,45,46,47,48]. acnB is also similar [49,50,51].
During exposure to antimicrobials, the few surviving tolerant bacteria can outwait antimicrobial exposure and resume growth and virulence with exposure cessation. Hence, tolerance is the ability of bacteria to stay alive in fluctuating exposure to antimicrobials, especially above the MIC [17]. So, bacteria must acquire the mechanism that should enable them to resume growth and degQ facilitates this. degQ, a serine endoprotease and a homologous member of the HtrA (High-temperature requirement A) protein family with degP and degS, is involved in the degradation of transient proteins, stress sensing, regulation, and protection during unfolded protein responses, especially in isolates exposed to high temperature and nutrient deprivation, which also induces persistence cell formation [25,48,52].
Tolerance mutations are essential for the continued survival of the bacterial population, as the increased number of persisters creates a reservoir of unsusceptible bacteria. This supplies a feeder hedge for the population, which helps bacteria to survive antimicrobials at bactericidal concentrations [18]. So, bacteria can adapt to extended adverse conditions by tolerance, and if conditions continue, they selection for resistance genes with a decreased fitness cost. This can be attributed to the fact that persister cells naturally develop resistance genes. Still, these are lost due to high fitness cost, but with increased persister cells due to tolerance, these genes spread within the population easily, leading to pseudo resistance. So tolerance has been observed as the first step towards resistance in most bacteria, especially those in environments exposed to extended antimicrobial treatments at very high concentrations [53,54,55].
4.2. Effect of exposure on the mutant selection window
The MIC and MPC results showed that of the 30 days Cu and Zn-exposed isolates, only Zn-exposed isolates had an increase in their MSW range to the tested antibiotics, compared to the unexposed control. On the other hand, there was a significant increase in the MSW of amoxicillin and ampicillin for the Zn-exposed isolates, but the MSW of OXYTET remained the same. This signifies that exposure of susceptible bacteria to heavy metals like Zn in the environment, even at sub-MIC concentrations, may contribute to developing more persister cells within the population, capable of surviving current concentrations in wastewater treatment plants (WWTPs). This can lead to the selective amplification of these unsusceptible cells than susceptible cells in the population and the magnification of antimicrobial resistance in bacteria [22,56,57]. This also agrees with Fridman et al. [18] and Levin-Reisman et al. [55], who stated that tolerant strains enhance the population's survival and extend their survival window beyond the MPC, thereby increasing the MSW.
For the biocides, BAC-exposed isolates exhibited the most significant increase in the MSW compared with the control, especially when tested against amoxicillin and ampicillin but not with oxytetracycline. This shows that biocides in the environment, like heavy metals, can also trigger selection pressure for tolerant strains, contributing to further resistance of the isolates against known antimicrobials and facilitating mutation, especially in the WWTPs [22,56,57].
The antibiotics-exposed isolates all had similar results indicating only a slight MSW increase with ampicillin treatment. This suggests that antibiotics in the environment may not be major contributory factors for increased antimicrobial resistance and may not be a factor in changes in the antimicrobial profile of the population [10]. This agrees with a previous study which stated that antibiotics in the environment exert less selection pressure for antimicrobial resistance than other stressors such as heavy metals [58].
5. Conclusions
Exposing E. coli to different chemicals for 3 days triggered increased tolerance in the bacterial population when exposed to a high ampicillin dose. This affected the MSW of the isolates against amoxicillin and ampicillin treatment. The survival in antimicrobials, even above the MIC value, can be attributed to the emergence of more persister cells, hence increased tolerance, and contributed to the observed differences, in the MSW of the exposed isolates, compared with controls that were not exposed to any chemical. These results call for deeper analysis of the mechanisms influencing antimicrobial resistance in the environment. Therefore, studies involving different microbial and chemical pollutants. It should, however, be noted the current study was conducted under static physicochemical conditions and that other factors like temperature, pH and organic substances present in the natural environment were not investigated.
Author Contributions
Conceptualisation, K.B.C., S.Y.E. and A.L.K.A.; methodology, K.B.C., O.A.A., A.I. and A.L.K.A.; software, K.B.C., O.A.A., A.I and A.L.K.A.; validation, S.Y.E., D.G.A., A.I. and A.L.K.A.; formal analysis, K.B.C., O.A.A. and D.G.A.; investigation, K.B.C.; resources, S.Y.E.; data curation, K.B.C. and D.G.A.; writing—original draft preparation, K.B.C.; writing—review and editing, All Authors.; supervision, S.Y.E. and A.L.K.A.; project administration; funding acquisition, S.Y.E. All authors have read and agreed to the published version of the manuscript.
Funding
The research received funding from the South African Research Chair Initiative of the Department of Science and Technology and National Research Foundation of South Africa (Grant No. 98342), the South African Medical Research Council (SAMRC) and the SAMRC Self-Initiated Research Grant. Any opinions, findings, conclusions, or recommendations expressed in this material are those of the author(s) and do not necessarily reflect the views of the organisations or agencies that provided support for the project. The funders had no role in the study design nor the decision to submit the work for publication.
Institutional Review Board Statement
Ethical approval was received from the Biomedical Research Ethics Committee (Reference: BCA444/16) of the University of KwaZulu-Natal.
Informed Consent Statement
Not applicable.
Data Availability Statement
All data have been added to the manuscript. Any further data would be provided by the authors upon responsible request.
Conflicts of Interest
Professor Sabiha Y. Essack is the chairperson of the Global Respiratory Infection Partnership and a member of the Global Hygiene Council, both sponsored by unconditional educational grants from Reckitt, UK. All other authors declare that they have no conflict of interest.
References
- Costa, V.M.D.; King, C.E.; Kalan, L.; Morar, M.; Sung, W.W.L.; Schwarz, C.; Froese, D.; Zazula, G.; Calmels, F.; Debruyne, R.; et al. Antibiotic Resistance Is Ancient. Nature 2011, 477, 457–461. [Google Scholar] [CrossRef]
- Sulaiman, J.E.; Lam, H. Evolution of Bacterial Tolerance Under Antibiotic Treatment and Its Implications on the Development of Resistance. Front. Microbiol. 2021, 12, 1–9. [Google Scholar] [CrossRef]
- Wright, M.S.; Peltier, G.L.; Stepanauskas, R.; McArthur, J.V. Bacterial Tolerances to Metals and Antibiotics in Metal-Contaminated and Reference Streams. FEMS Microbiol. Ecol. 2006, 58, 293–302. [Google Scholar] [CrossRef]
- Bergh, B. Van Den; Michiels, J.E.; Wenseleers, T.; Windels, E.M.; Boer, V.; Kestemont, D.; Meester, L. De; Verstrepen, K.J.; Verstraeten, N.; Fauvart, M.; et al. Frequency of Antibiotic Application Drives Rapid Evolutionary Adaptation of Escherichia Coli Persistence. Nat. Microbiol. 2016, 1, 1–7. [Google Scholar] [CrossRef]
- Sulaiman, J.E.; Lam, H. Application of Proteomics in Studying Bacterial Persistence. Expert Rev. Proteomics 2019, 16, 227–239. [Google Scholar] [CrossRef]
- Song, S.; Wood, T.K. PpGpp Ribosome Dimerization Model for Bacterial Persister Formation and Resuscitation. Biochem. Biophys. Res. Commun. 2020, 523, 281–286. [Google Scholar] [CrossRef]
- Harms, A.; Maisonneuve, E.; Gerdes, K. Mechanisms of Bacterial Persistence during Stress and Antibiotic Exposure. Science (80). 2016, 354. [Google Scholar] [CrossRef]
- Wood, T.K.; Knabel, S.J.; Kwan, B.W. Bacterial Persister Cell Formation and Dormancy. Appl. Environ. Microbiol. 2013, 79, 7116–7121. [Google Scholar] [CrossRef]
- Balaban, N.Q.; Helaine, S.; Lewis, K.; Ackermann, M.; Aldridge, B.; Andersson, D.I.; Brynildsen, M.P.; Bumann, D.; Camilli, A.; Collins, J.J.; et al. Definitions and Guidelines for Research on Antibiotic Persistence. Nat. Rev. Microbiol. 2019, 17, 441–448. [Google Scholar] [CrossRef]
- Drlica, K.; Zhao, X. Mutant Selection Window Hypothesis Updated. Clin. Infect. Dis. 2007, 44, 681–688. [Google Scholar] [CrossRef]
- Ngigi, A.N.; Magu, M.M.; Muendo, B.M. Occurrence of Antibiotics Residues in Hospital Wastewater, Wastewater Treatment Plant, and in Surface Water in Nairobi County, Kenya. Environ. Monit. Assess. 2020, 192. [Google Scholar] [CrossRef]
- Karkman, A.; Pärnänen, K.; Larsson, D.G.J. Fecal Pollution Can Explain Antibiotic Resistance Gene Abundances in Anthropogenically Impacted Environments. Nat. Commun. 2019, 10, 1–8. [Google Scholar] [CrossRef]
- Larsson, D.G.J.; Andremont, A.; Bengtsson-Palme, J.; Brandt, K.K.; de Roda Husman, A.M.; Fagerstedt, P.; Fick, J.; Flach, C.F.; Gaze, W.H.; Kuroda, M.; et al. Critical Knowledge Gaps and Research Needs Related to the Environmental Dimensions of Antibiotic Resistance. Environ. Int. 2018, 117, 132–138. [Google Scholar] [CrossRef]
- Dong, Y.; Zhao, X.; Kreiswlrth, B.N.; Drlica, K. Mutant Prevention Concentration as a Measure of Antibiotic Potency: Studies with Clinical Isolates of Mycobacterium Tuberculosis. Antimicrob. Agents Chemother. 2000, 44, 2581–2584. [Google Scholar] [CrossRef]
- Blondeau, J.M.; Zhao, X.; Hansen, G.; Drlica, K. Mutant Prevention Concentrations of Fluoroquinolones for Clinical Isolates of Streptococcus Pneumoniae. 2001, 45, 433–438. [Google Scholar] [CrossRef]
- Brauner, A.; Shoresh, N.; Fridman, O.; Balaban, N.Q. An Experimental Framework for Quantifying Bacterial Tolerance. Biophys. J. 2017, 112, 2664–2671. [Google Scholar] [CrossRef]
- Kester, J.C.; Fortune, S.M. Persisters and beyond: Mechanisms of Phenotypic Drug Resistance and Drug Tolerance in Bacteria. Crit. Rev. Biochem. Mol. Biol. 2014, 49, 91–101. [Google Scholar] [CrossRef]
- Fridman, O.; Goldberg, A.; Ronin, I.; Shoresh, N.; Balaban, N.Q. Optimization of Lag Time Underlies Antibiotic Tolerance in Evolved Bacterial Populations. Nature 2014, 513, 418–421. [Google Scholar] [CrossRef]
- Wiegand, I.; Hilpert, K.; Hancock, R.E.W. Agar and Broth Dilution Methods to Determine the Minimal Inhibitory Concentration (MIC) of Antimicrobial Substances. Nat. Protoc. 2008, 3, 163–175. [Google Scholar] [CrossRef]
- Clinical and Laboratory Standards Institute. Performance Standards for Antimicrobial Susceptibility Testing; Twenty-Seventh Informational Supplement. CLSI Document M100-S27; 2017; ISBN 1562387855. [Google Scholar]
- EUCAST. Testing Breakpoint Tables for Interpretation of MICs and Zone Diameters; 2020. [Google Scholar]
- Blondeau, J.M. New Concepts in Antimicrobial Susceptibility Testing: The Mutant Prevention Concentration and Mutant Selection Window Approach. Vet. Dermatol. 2009, 20, 383–396. [Google Scholar] [CrossRef]
- Balcázar, J.L.; Subirats, J.; Borrego, C.M. The Role of Biofilms as Environmental Reservoirs of Antibiotic Resistance. Front. Microbiol. 2015, 6, 1–9. [Google Scholar] [CrossRef] [PubMed]
- Levin-reisman, I.; Ronin, I.; Gefen, O.; Braniss, I. Antibiotic Tolerance Facilitates the Evolution of Resistance. 2017, 830, 826–830. [Google Scholar] [CrossRef] [PubMed]
- Trastoy Crossm Gastrointestinal and Respiratory Environments. 2018; 31, 1–46.
- Abdallah, M.; Benoliel, C.; Drider, D.; Dhulster, P.; Chihib, N.E. Biofilm Formation and Persistence on Abiotic Surfaces in the Context of Food and Medical Environments. Arch. Microbiol. 2014, 196, 453–472. [Google Scholar] [CrossRef] [PubMed]
- Tachiyama, S.; Chan, K.L.; Liu, X.; Hathroubi, S.; Li, W.; Peterson, B. The Fl Agellar Motor Protein FliL Forms a Scaffold of Circumferentially Positioned Rings Required for Stator Activation. 2022, 119, 1–9. [Google Scholar] [CrossRef]
- Malakooti, J.; Komeda, Y.; Matsumura, P. DNA Sequence Analysis, Gene Product Identification, and Localization of Flagellar Motor Components of Escherichia Coli. 1989, 171, 2728–2734. [Google Scholar] [CrossRef] [PubMed]
- Stabryla, L.M.; Johnston, K.A.; Diemler, N.A.; Cooper, V.S.; Millstone, J.E.; Haig, S.J.; Gilbertson, L.M. Role of Bacterial Motility in Differential Resistance Mechanisms of Silver Nanoparticles and Silver Ions. Nat. Nanotechnol. 2021, 16, 996–1003. [Google Scholar] [CrossRef]
- Rodríguez-López, P.; Cabo, M.L. Tolerance Development in Listeria Monocytogenes-Escherichia Coli Dual-Species Biofilms after Sublethal Exposures to Pronase-Benzalkonium Chloride Combined Treatments. Food Microbiol. 2017, 67, 58–66. [Google Scholar] [CrossRef]
- Bore, E.; Hébraud, M.; Chafsey, I.; Chambon, C.; Skjæret, C.; Moen, B.; Møretrø, T.; Langsrud, Ø.; Rudi, K.; Langsrud, S. Adapted Tolerance to Benzalkonium Chloride in Escherichia Coli K-12 Studied by Transcriptome and Proteome Analyses. Microbiology 2007, 153, 935–946. [Google Scholar] [CrossRef]
- Moen, B.; Rudi, K.; Bore, E.; Langsrud, S. Subminimal Inhibitory Concentrations of the Disinfectant Benzalkonium Chloride Select for a Tolerant Subpopulation of Escherichia Coli with Inheritable Characteristics. Int. J. Mol. Sci. 2012, 13, 4101–4123. [Google Scholar] [CrossRef]
- Forbes, S.; Morgan, N.; Humphreys, G.J.; Amézquita, A.; Mistry, H.; McBain, A.J. Loss of Function in Escherichia Coli Exposed to Environmentally Relevant Concentrations of Benzalkonium Chloride. Appl. Environ. Microbiol. 2019, 85, 1–14. [Google Scholar] [CrossRef]
- Morland, I.; Rolseth, V.; Luna, L.; Rognes, T.; Bjørås, M.; Seeberg, E. Human DNA Glycosylases of the Bacterial Fpg/MutM Superfamily: An Alternative Pathway for the Repair of 8-Oxoguanine and Other Oxidation Products in DNA. Nucleic Acids Res. 2002, 30, 4926–4936. [Google Scholar] [CrossRef]
- Makasheva, K.A.; Endutkin, A. V; Zharkov, D.O. Requirements for DNA Bubble Structure for Efficient Cleavage by Helix – Two-Turn – Helix DNA Glycosylases. 2019, 1–9. [Google Scholar] [CrossRef] [PubMed]
- Fromme, J.C.; Banerjee, A.; Verdine, G.L. DNA Glycosylase Recognition and Catalysis. Curr. Opin. Struct. Biol. 2004, 14, 43–49. [Google Scholar] [CrossRef] [PubMed]
- Schalow, B.J.; Courcelle, C.T.; Courcelle, J. Escherichia Coli Fpg Glycosylase Is Nonrendundant and Required for the Rapid Global Repair of Oxidized Purine and Pyrimidine Damage In Vivo. J. Mol. Biol. 2011, 410, 183–193. [Google Scholar] [CrossRef] [PubMed]
- Pourahmad Jaktaji, R.; Pasand, S. Overexpression of SOS Genes in Ciprofloxacin Resistant Escherichia Coli Mutants. Gene 2016, 576, 115–118. [Google Scholar] [CrossRef]
- Valat, C.; Hirchaud, E.; Drapeau, A.; Touzain, F.; de Boisseson, C.; Haenni, M.; Blanchard, Y.; Madec, J.Y. Overall Changes in the Transcriptome of Escherichia Coli O26:H11 Induced by a Subinhibitory Concentration of Ciprofloxacin. J. Appl. Microbiol. 2020, 129, 1577–1588. [Google Scholar] [CrossRef]
- Porin, M.; Santiviago, C.A.; Toro, C.S.; Hidalgo, A.A.; Youderian, P.; Mora, G.C. Global Regulation of the Salmonella Enterica Serovar Typhimurium. 2003, 185, 5901–5905. [Google Scholar] [CrossRef]
- Li, M.; Liu, Q.; Teng, Y.; Ou, L.; Xi, Y.; Chen, S.; Duan, G. The Resistance Mechanism of Escherichia Coli Induced by Ampicillin in Laboratory. Infect. Drug Resist. 2019, 12, 2853–2863. [Google Scholar] [CrossRef]
- Gogol, E.B.; Rhodius, V.A.; Papenfort, K.; Vogel, J.; Gross, C.A. Small RNAs Endow a Transcriptional Activator with Essential Repressor Functions for Single-Tier Control of a Global Stress Regulon. Proc. Natl. Acad. Sci. U. S. A. 2011, 108, 12875–12880. [Google Scholar] [CrossRef]
- Boto, A.N.; Xu, W.; Jakoncic, J.; Pannuri, A.; Romeo, T.; Bessman, M.J.; Gabelli, S.B.; Amzel, L.M. Structural Studies of the Nudix GDP-Mannose Hydrolase from E. Coli Reveals a New Motif for Mannose Recognition. 2011. [Google Scholar] [CrossRef]
- Bobrov, A.G.; Kirillina, O.; Perry, R.D. The Phosphodiesterase Activity of the HmsP EAL Domain Is Required for Negative Regulation of Biofilm Formation in Yersinia Pestis. 2005, 247, 123–130. [Google Scholar] [CrossRef] [PubMed]
- Dahl, U.; Jaeger, T.; Tra, B.; Sattler, J.M.; Mayer, C. Identification of a Phosphotransferase System of Escherichia Coli Required for Growth on N -Acetylmuramic Acid. 2004, 186, 2385–2392. [Google Scholar] [CrossRef] [PubMed]
- Heravi, K.M.; Altenbuchner, J. Cross-Talk among Transporters of the Phosphoenolpyruvate- Dependent Phosphotransferase System in Bacillus Subtilis. 2018. [Google Scholar] [CrossRef]
- Ruscitto, A.; Hottmann, I.; Stafford, G.P.; Schäffer, C. Downloaded from Http://Jb.Asm.Org/ on September 9 , 2016 by NYU LANGONE MED CTR-SCH OF MED Identification of a Novel N -Acetylmuramic Acid ( MurNAc ) Transporter in Tannerella Forsythia. 2016. [Google Scholar] [CrossRef]
- van den Bergh, B.; Fauvart, M.; Michiels, J. Formation, Physiology, Ecology, Evolution and Clinical Importance of Bacterial Persisters. FEMS Microbiol. Rev. 2017, 41, 219–251. [Google Scholar] [CrossRef]
- Araujo, J.; Ottinger, S.; Venkat, S.; Gan, Q.; Fan, C.; Werner, C. Studying Acetylation of Aconitase Isozymes by Genetic Code Expansion. 2022, 10, 1–8. [Google Scholar] [CrossRef]
- Brock, M.; Maerker, C.; Schu, A.; Vo, U. Oxidation of Propionate to Pyruvate in Escherichia Coli Involvement of Methylcitrate Dehydratase and Aconitase. 2002, 6194, 6184–6194. [Google Scholar] [CrossRef]
- Cunningham, L.; Gruer, M.J.; Guest, J.R. Transcriptional Regulation of the Aconitase Genes ( AcnA and AcnB ) of Escherichia Coli. 1997, 3795–3805. [Google Scholar] [CrossRef]
- Wilmaerts, D.; Dewachter, L.; De Loose, P.J.; Bollen, C.; Verstraeten, N.; Michiels, J. HokB Monomerization and Membrane Repolarization Control Persister Awakening. Mol. Cell 2019, 75, 1031–1042.e4. [Google Scholar] [CrossRef]
- Kim, J.S.; Cho, D.H.; Heo, P.; Jung, S.C.; Park, M.; Oh, E.J.; Sung, J.; Kim, P.J.; Lee, S.C.; Lee, D.H.; et al. Fumarate-Mediated Persistence of Escherichia Coli against Antibiotics. Antimicrob. Agents Chemother. 2016, 60, 2232–2240. [Google Scholar] [CrossRef]
- Cohen, N.R.; Lobritz, M.A.; Collins, J.J. Microbial Persistence and the Road to Drug Resistance. Cell Host Microbe 2013, 13, 632–642. [Google Scholar] [CrossRef] [PubMed]
- Levin-Reisman, I.; Ronin, I.; Gefen, O.; Braniss, I.; Shoresh, N.; Balaban, N.Q. Antibiotic Tolerance Facilitates the Evolution of Resistance. Science (80-. ). 2017, 355, 826–830. [Google Scholar] [CrossRef]
- Liu, Y.; Cui, J.; Wang, R.; Wang, X.; Drlica, K.; Zhao, X. Selection of Rifampicin-Resistant Staphylococcus Aureus during Tuberculosis Therapy: Concurrent Bacterial Eradication and Acquisition of Resistance. J. Antimicrob. Chemother. 2005, 56, 1172–1175. [Google Scholar] [CrossRef] [PubMed]
- Pasquali, F.; Manfreda, G. Mutant Prevention Concentration of Ciprofloxacin and Enrofloxacin against Escherichia Coli, Salmonella Typhimurium and Pseudomonas Aeruginosa. Vet. Microbiol. 2007, 119, 304–310. [Google Scholar] [CrossRef] [PubMed]
- Xu, Y.; Xu, J.; Mao, D.; Luo, Y. Effect of the Selective Pressure of Sub-Lethal Level of Heavy Metals on the Fate and Distribution of ARGs in the Catchment Scale. Environ. Pollut. 2017, 220, 900–908. [Google Scholar] [CrossRef]
Figure 1.
Figure 1. The minimum duration for killing 99.99% (MDK99.99) of bacterial cells in the population for BAC and DADMAC-exposed isolates compared to the control.
Figure 1.
Figure 1. The minimum duration for killing 99.99% (MDK99.99) of bacterial cells in the population for BAC and DADMAC-exposed isolates compared to the control.
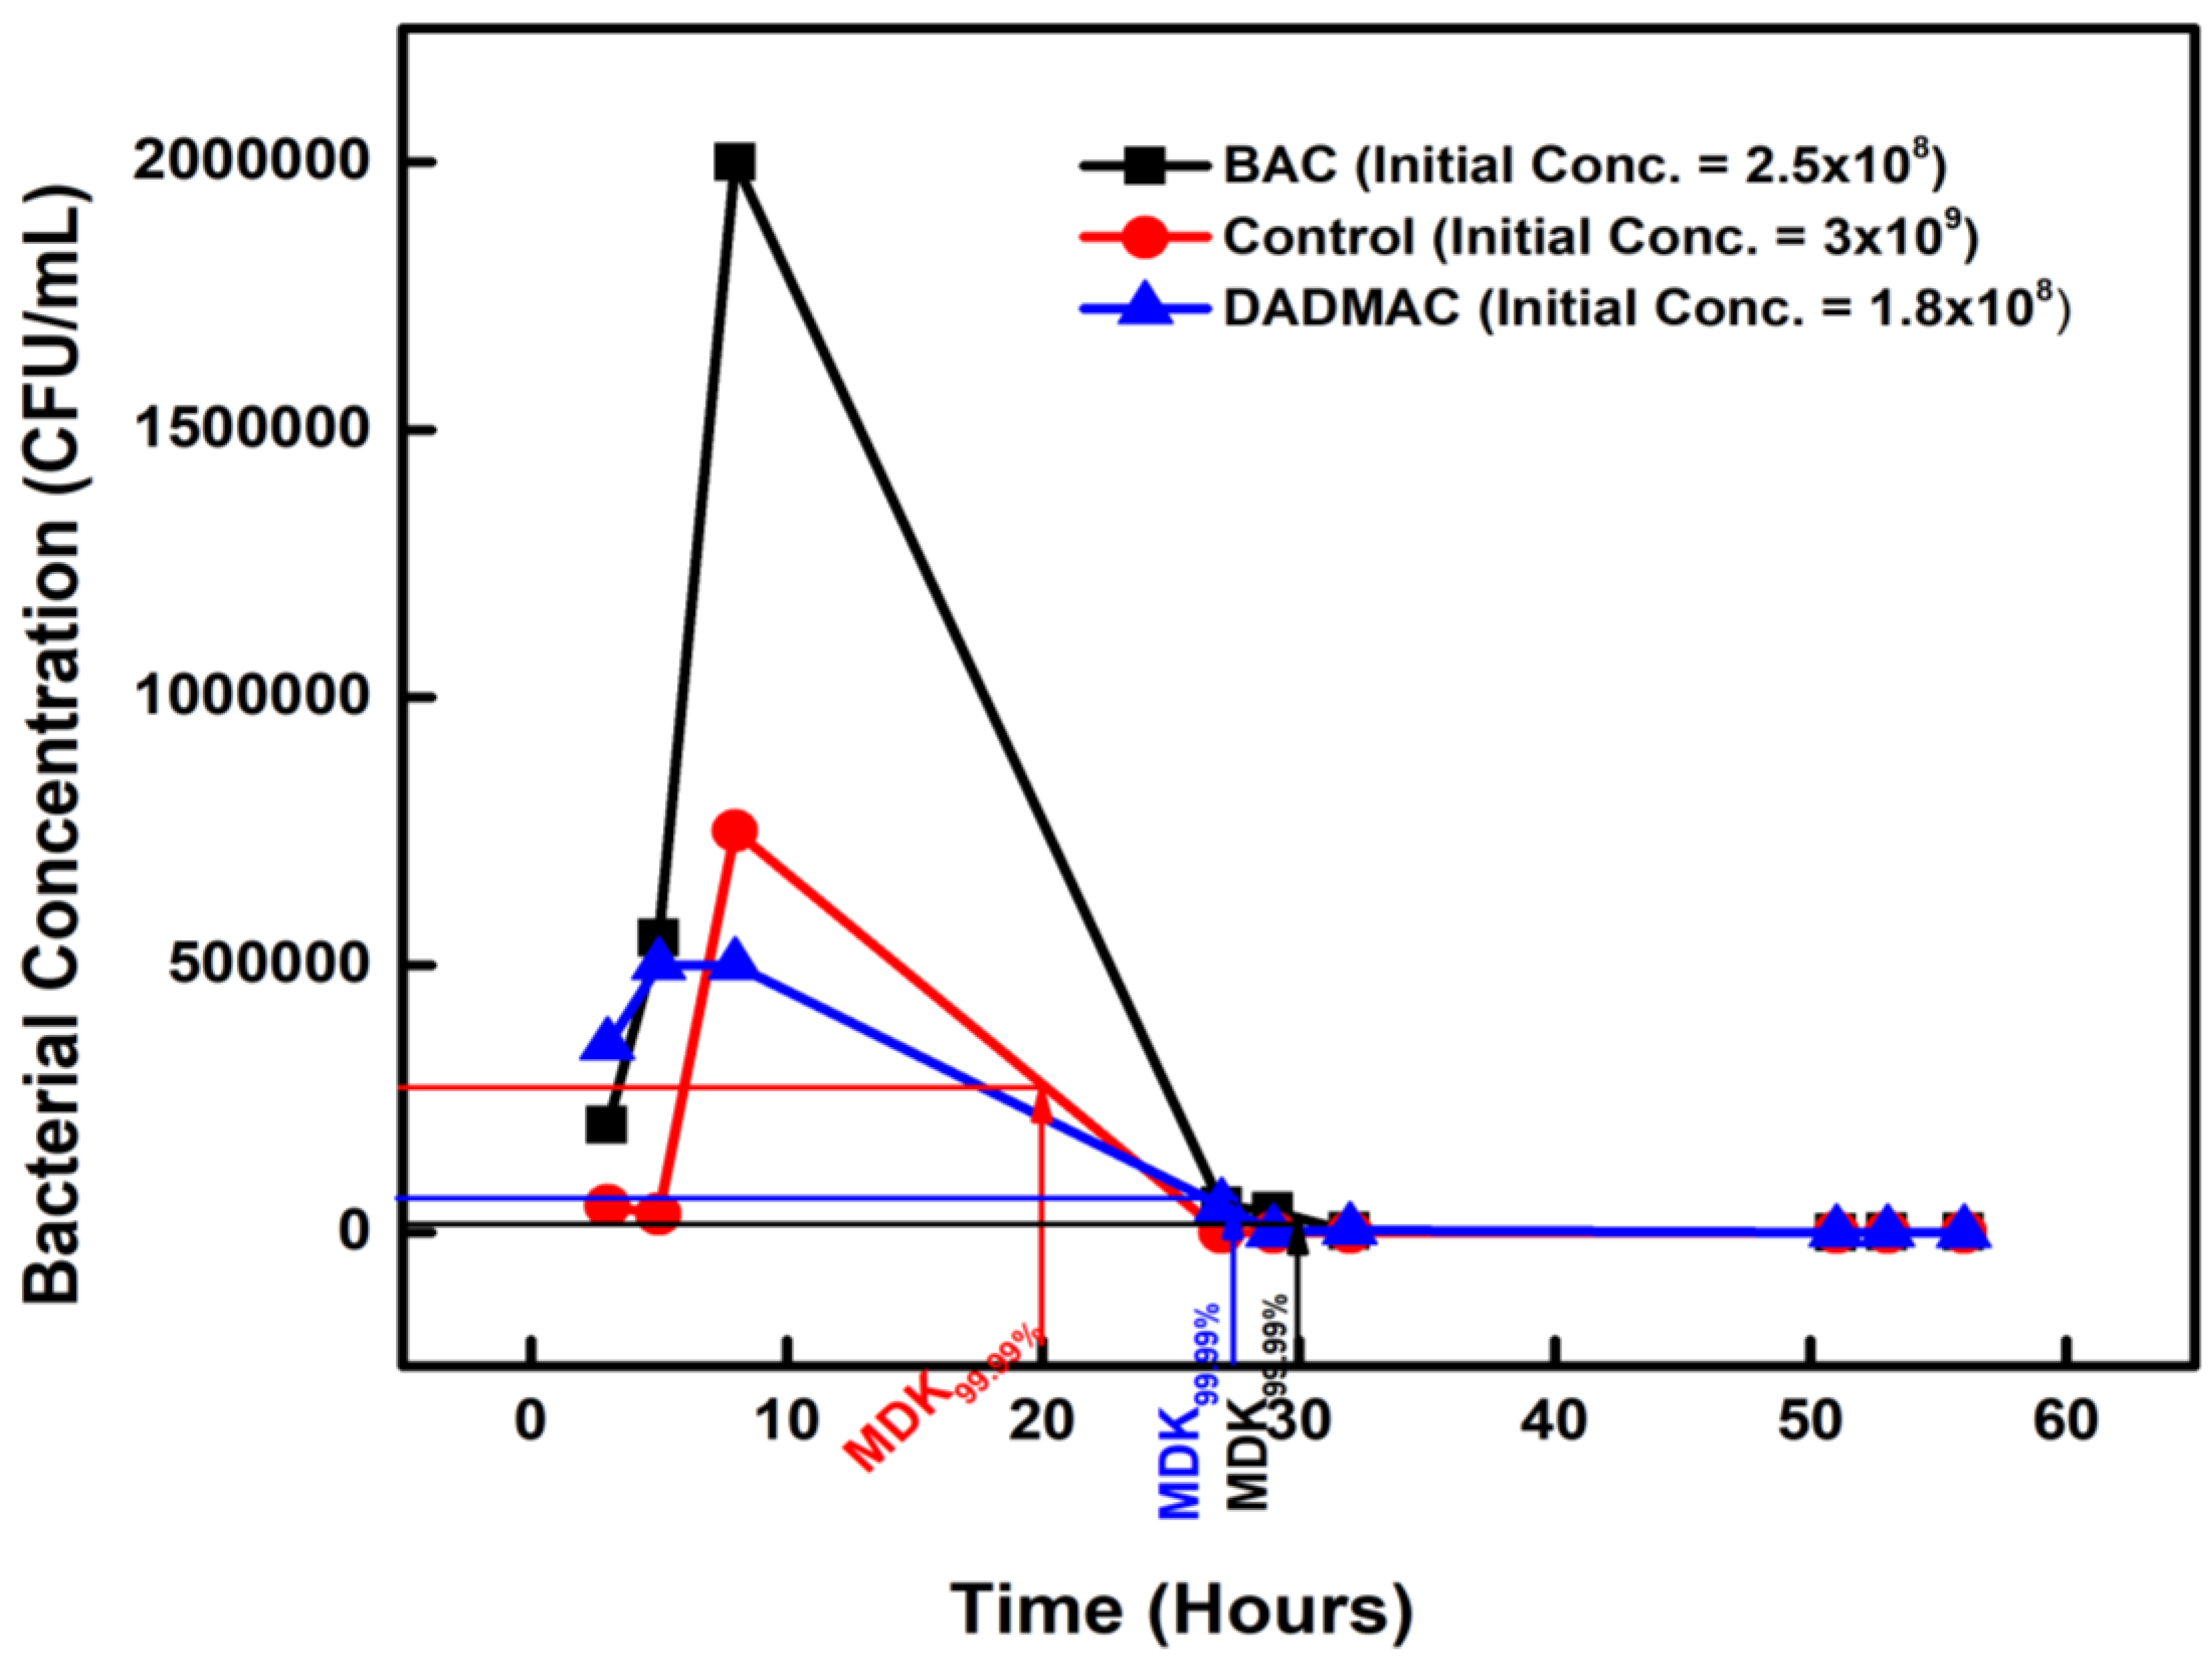
Figure 2.
Figure 2. The minimum duration for killing 99.99% (MDK99.99) of bacterial cells in the population for AMX and OXYTET-exposed isolates compared to the control.
Figure 2.
Figure 2. The minimum duration for killing 99.99% (MDK99.99) of bacterial cells in the population for AMX and OXYTET-exposed isolates compared to the control.
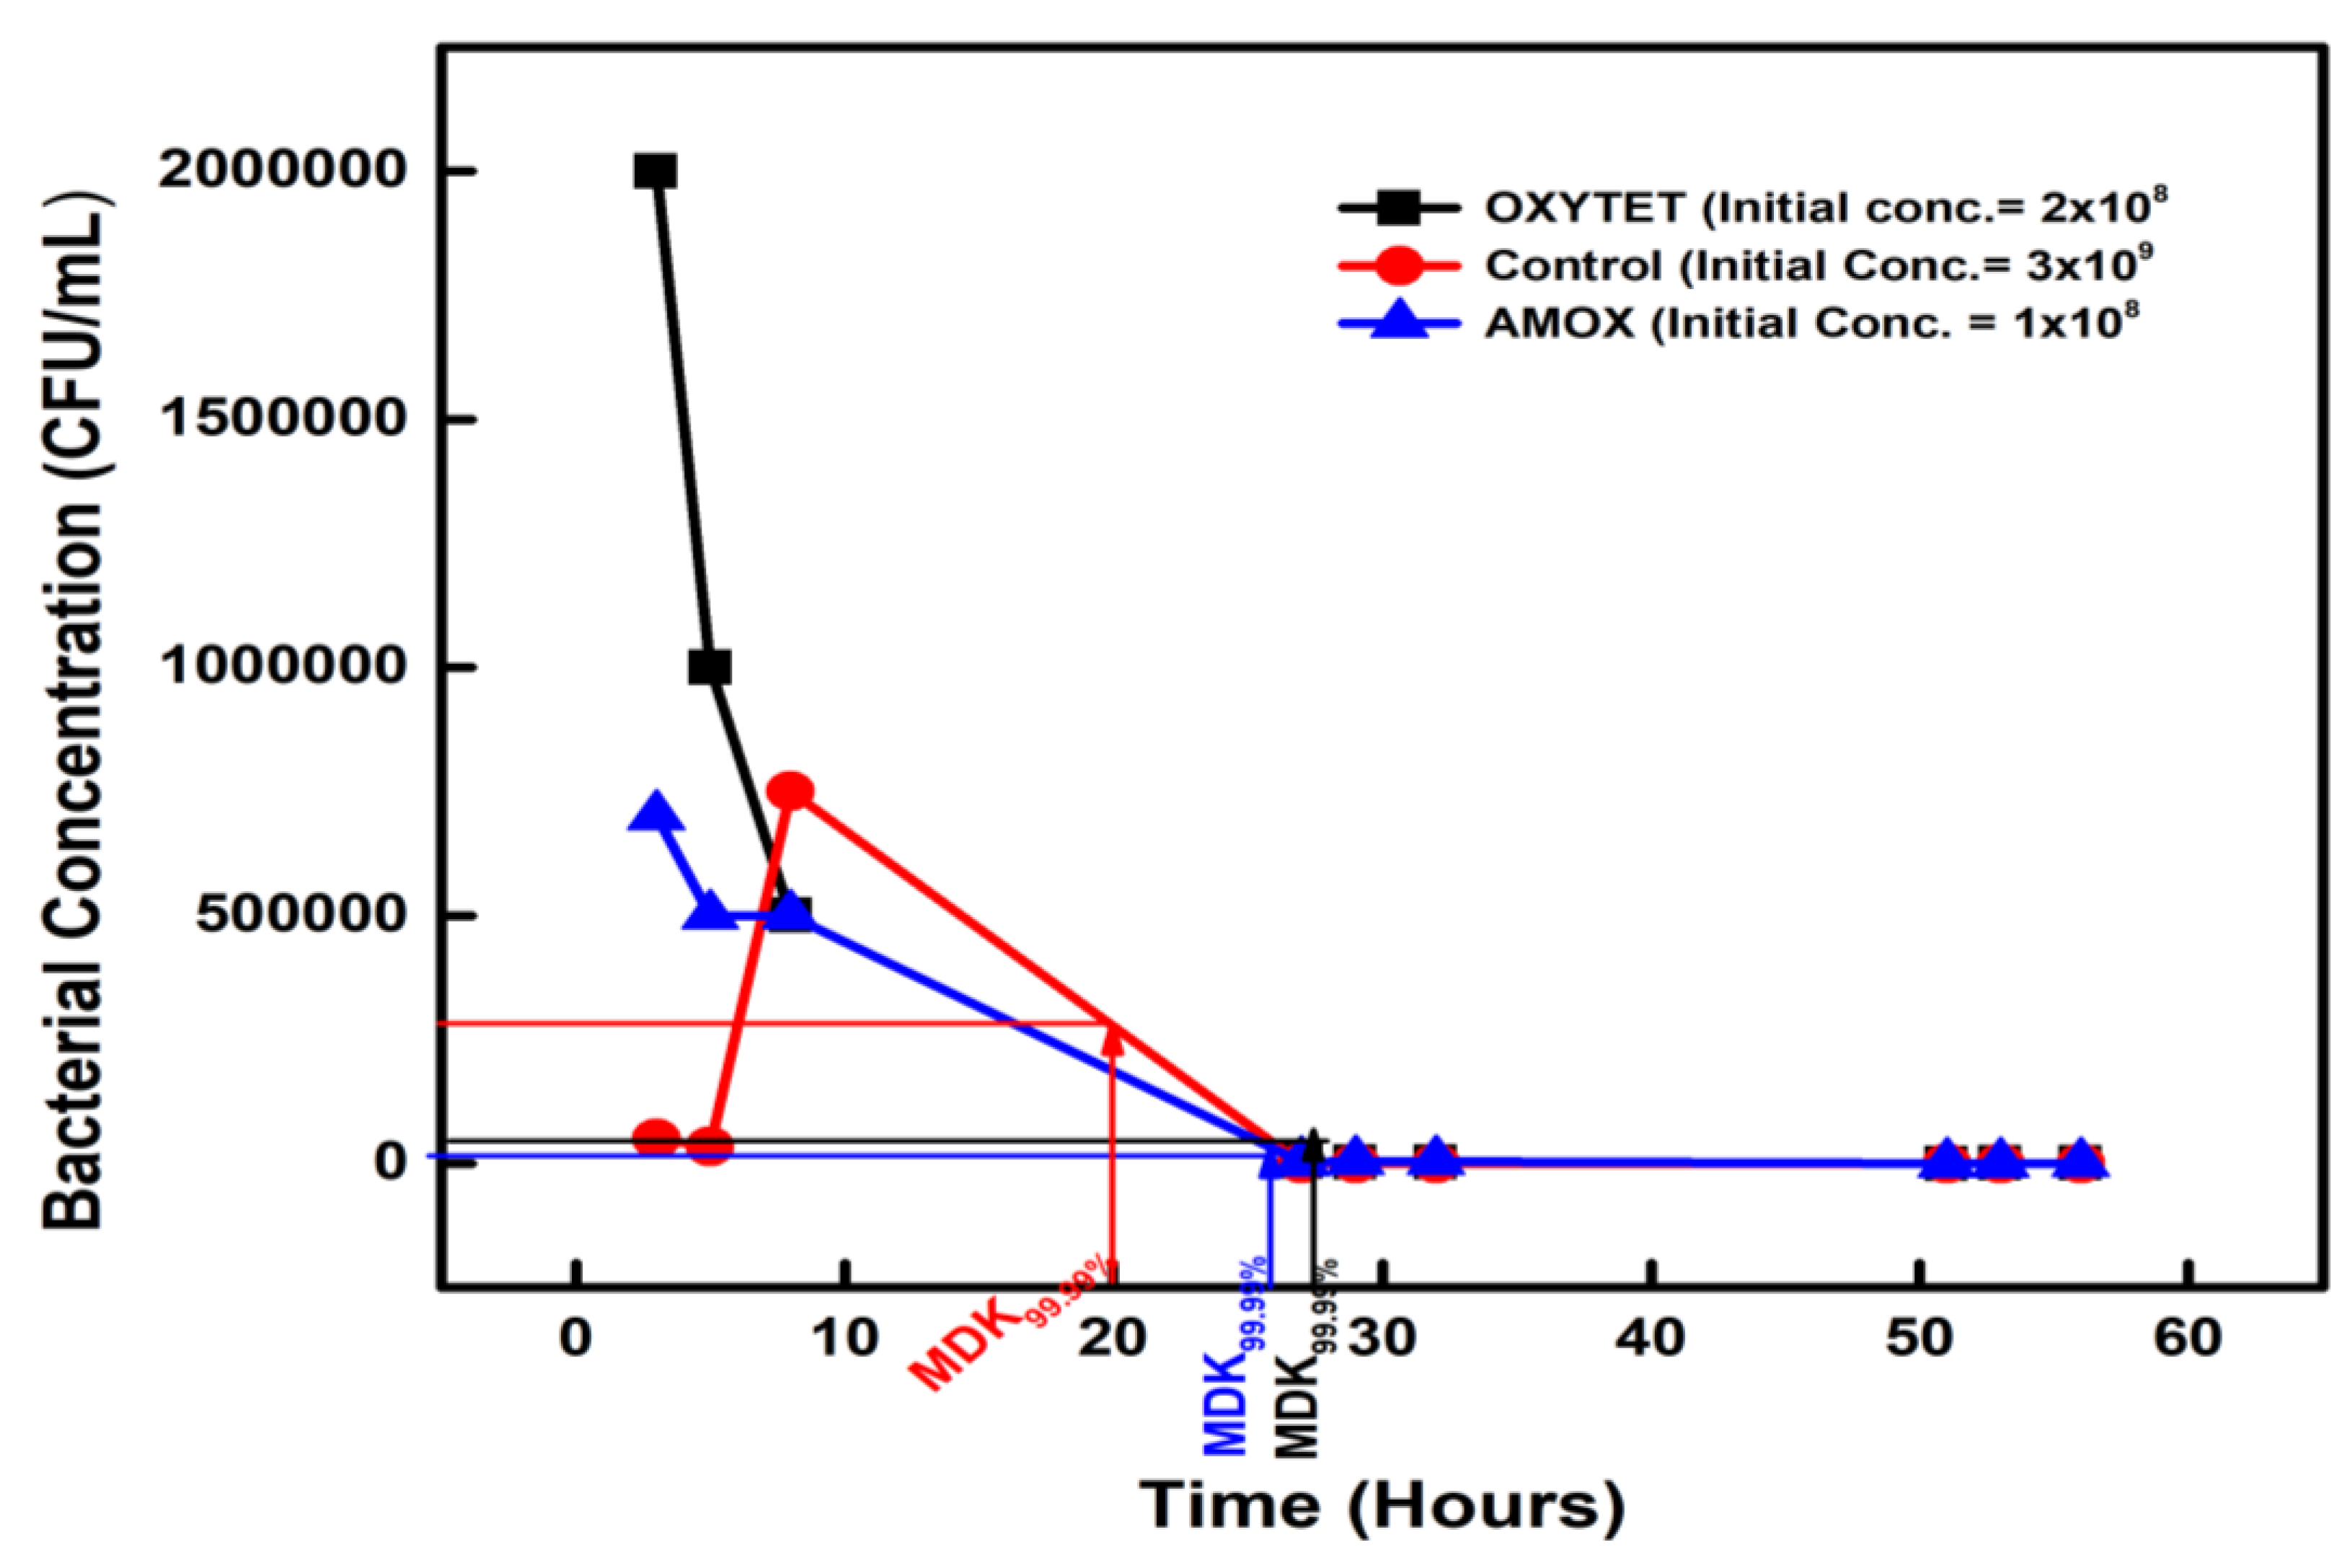
Figure 3.
Figure 3. The minimum duration for killing 99.99% (MDK99.99) of bacterial cells in the Zinc and Copper-exposed isolates compared to the control.
Figure 3.
Figure 3. The minimum duration for killing 99.99% (MDK99.99) of bacterial cells in the Zinc and Copper-exposed isolates compared to the control.
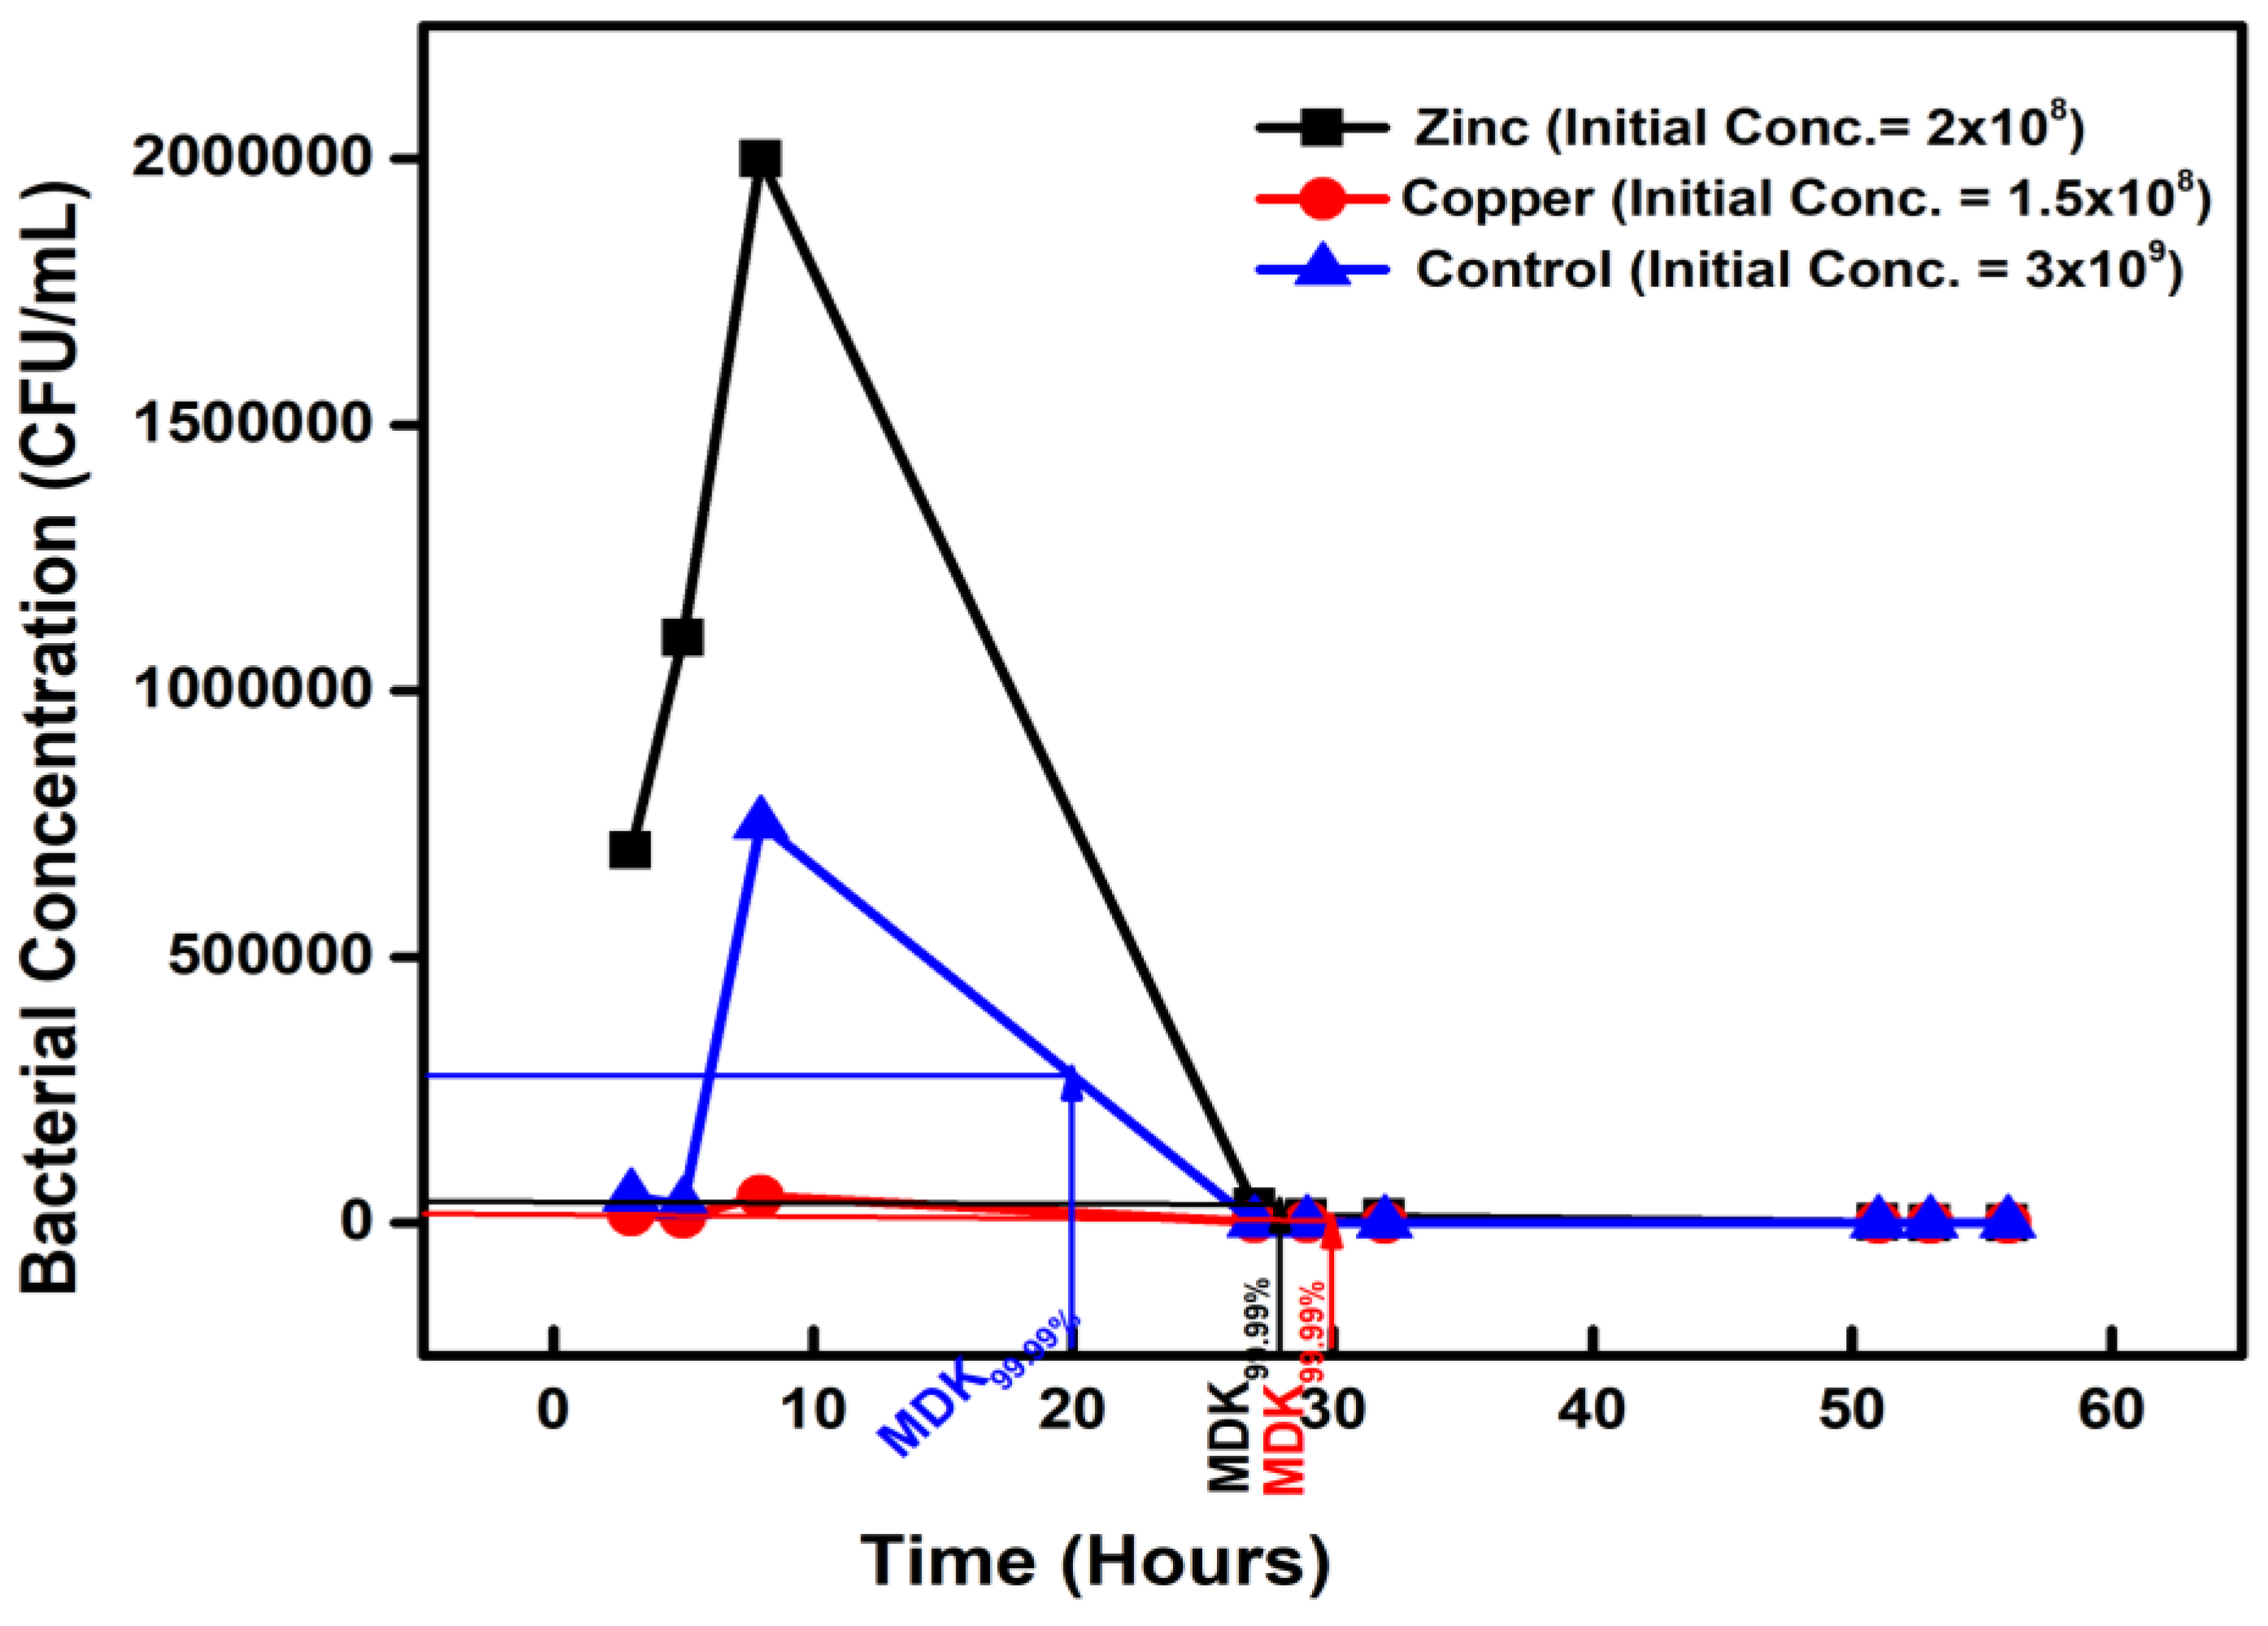
Figure 4.
Figure 4. The minimum duration for killing 99.99% (MDK99.99) of bacterial cells in the population for ALL compared to the control.
Figure 4.
Figure 4. The minimum duration for killing 99.99% (MDK99.99) of bacterial cells in the population for ALL compared to the control.
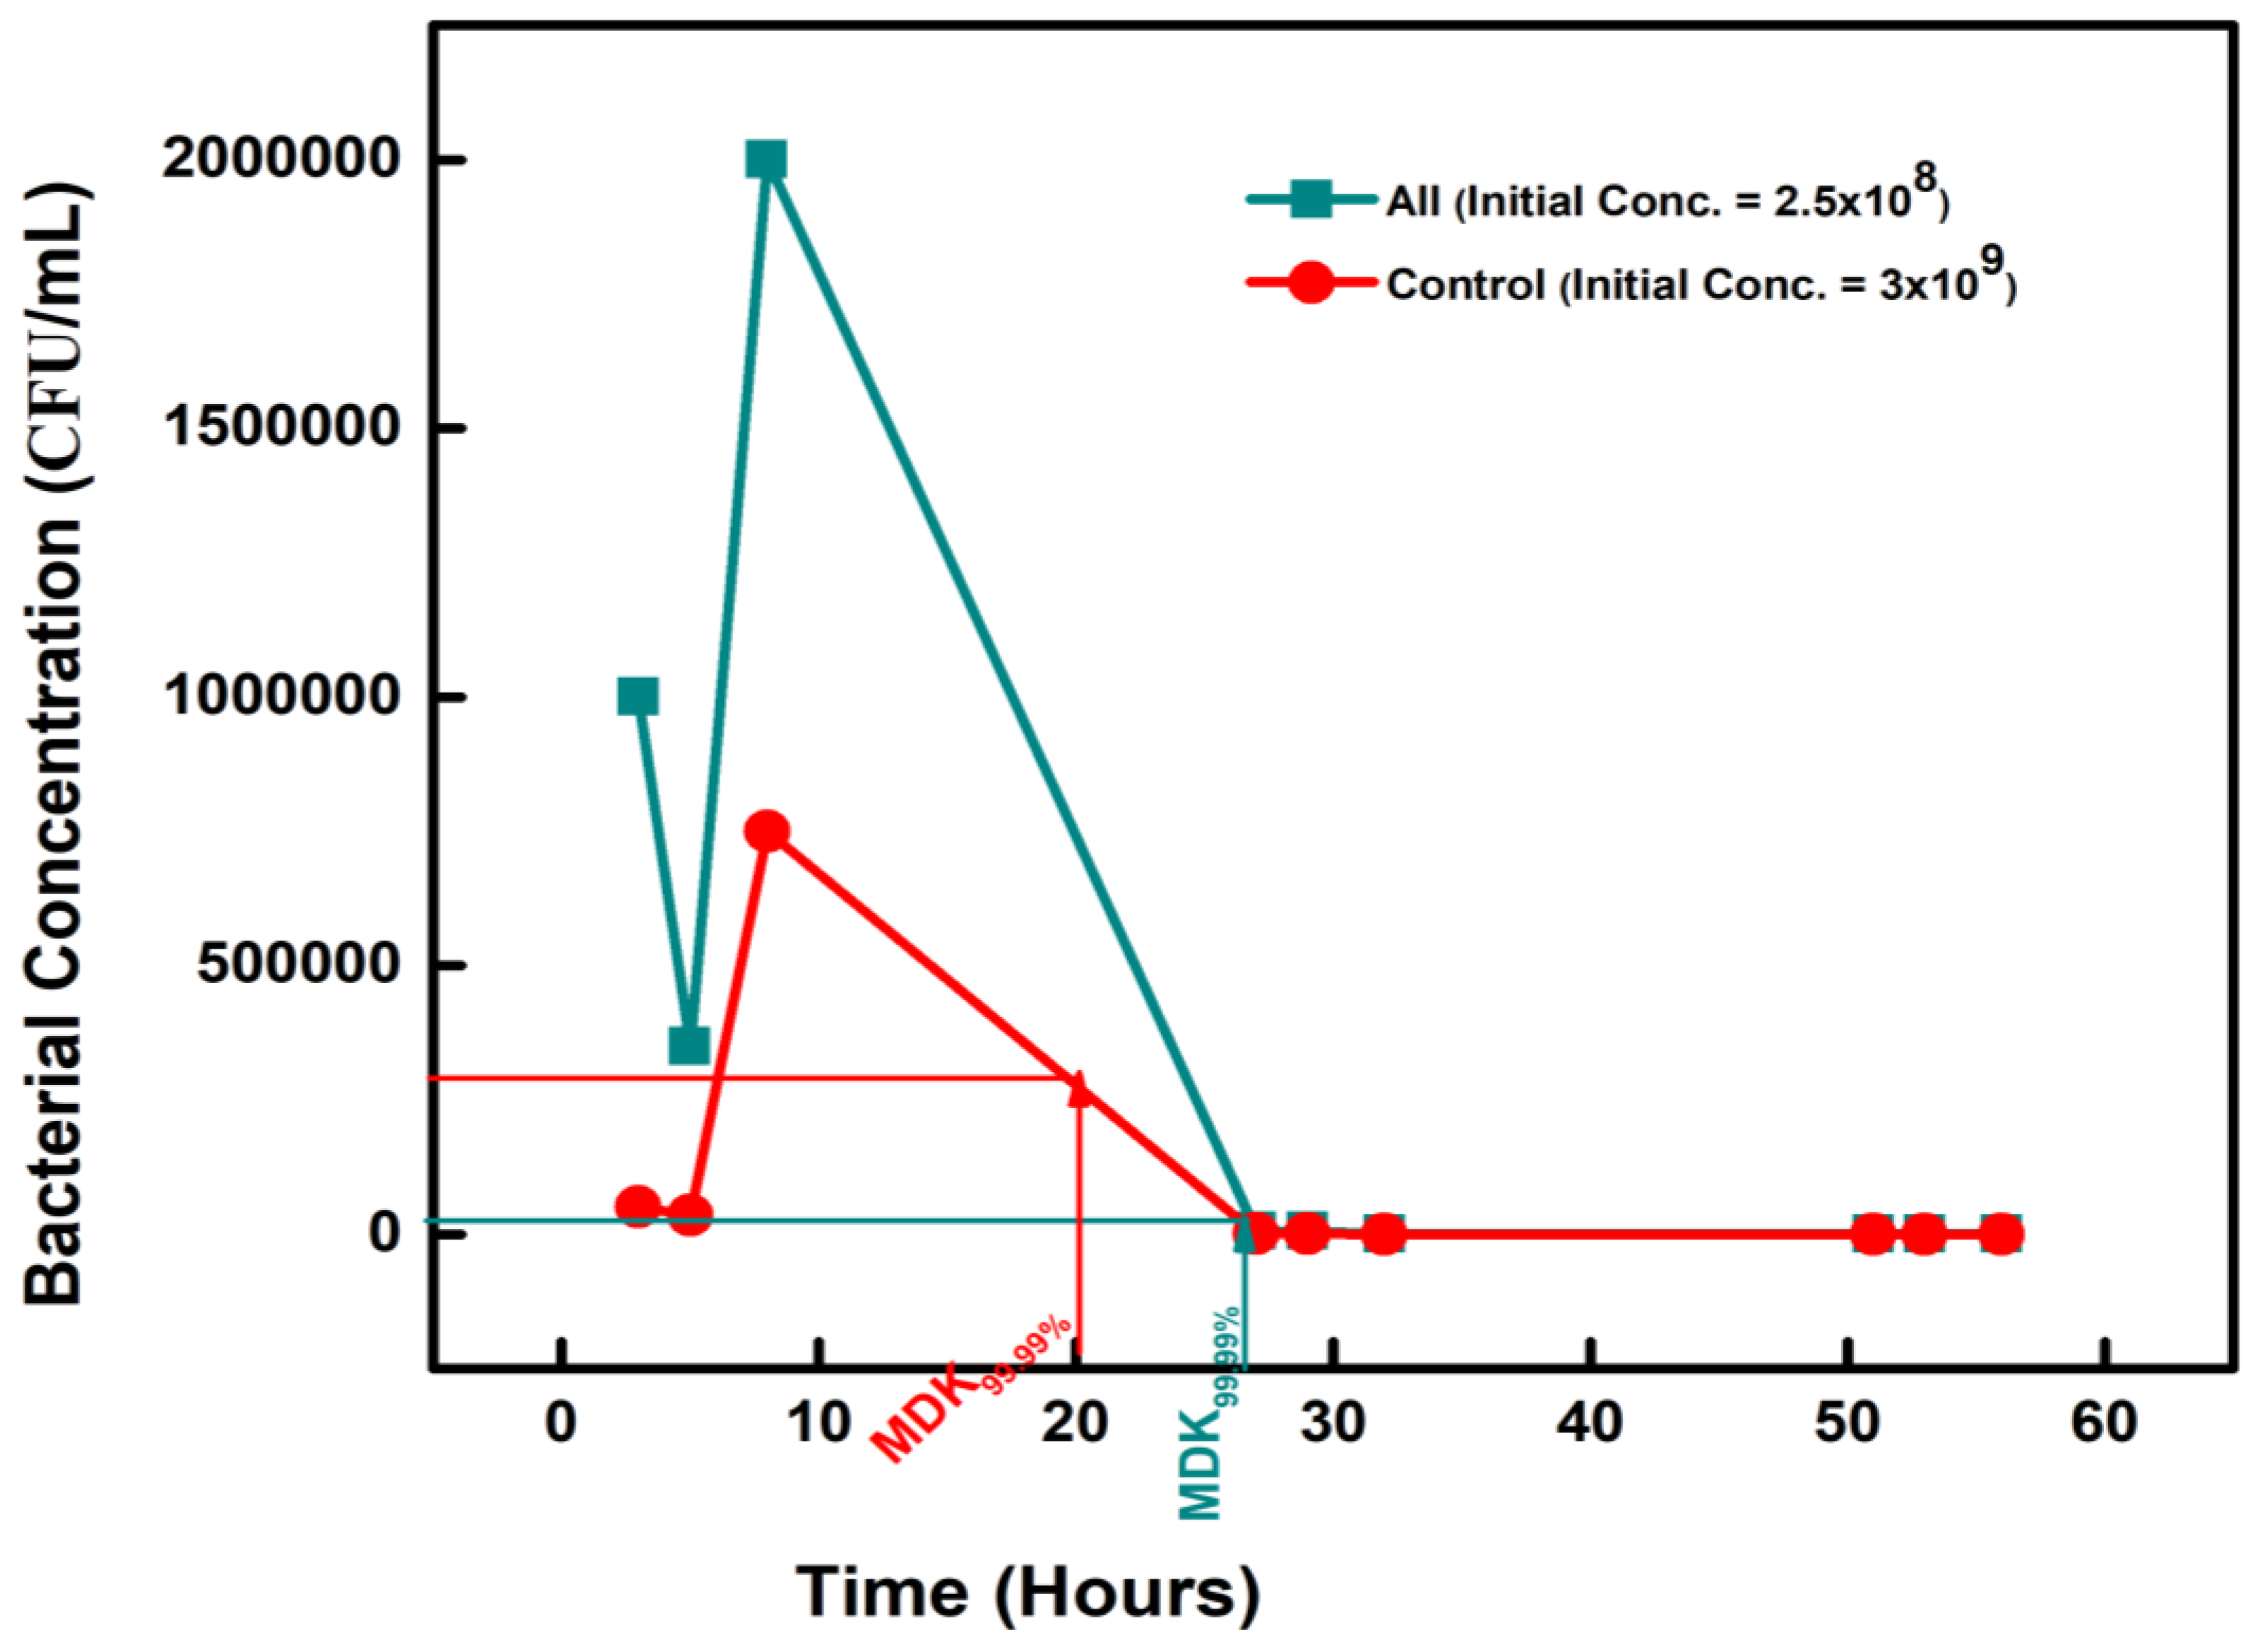

Table 1.
Summary of the tolerance experiment results showing the initial concentrations, final concentrations, MDK99.99, and percentage difference compared to the control. All show a positive percentage time increase.
Table 1.
Summary of the tolerance experiment results showing the initial concentrations, final concentrations, MDK99.99, and percentage difference compared to the control. All show a positive percentage time increase.
| Chemical-Exposed Isolate | Initial Concentration (CFU/mL) |
CONCENTRATION (CFU/mL) on Day 2 |
Percentage Difference | |
| BAC 12 | 2.5 × 10⁸ | 2.5 × 10⁴ | 30 | +50% |
| DADMAC 10 | 1.5 × 10⁸ | 1.5 × 10⁴ | 28 | +40% |
| AMOXICILLIN | 1 × 10⁸ | 1 × 10⁴ | 26 | +30% |
| OXYTETRACYCLINE | 2 × 10⁸ | 2 × 10⁴ | 28 | +40% |
| ZINC | 2 × 10⁸ | 2 × 10⁴ | 28 | +40% |
| COPPER | 1.5 × 10⁸ | 1.5 × 10⁴ | 26 | +30% |
| CONTROL | 3 × 10⁹ | 3 × 10⁵ | 20 | 0 |
Table 2.
Mutant Selection window of the 30-day-exposed isolates following oxytetracycline, amoxicillin and ampicillin treatment.
Table 2.
Mutant Selection window of the 30-day-exposed isolates following oxytetracycline, amoxicillin and ampicillin treatment.
| MSW Treatment | Exposure pollutant | Test Isolates | Controls | ||||
| MIC | MPC | MSW | MIC | MPC | MSW | ||
| OXYTETRACYCLIN | AMX | 2 | 256 | 0.5 – 256 | 2 | 256 | 2 – 256 |
| OXYTET | 2 | 256 | 2 – 256 | 2 | 256 | 2 – 256 | |
| COPPER | 2 | 256 | 2 – 256 | 2 | 256 | 2 – 256 | |
| ZINC | 2 | 256 | 2 – 256 | 2 | 256 | 2 – 256 | |
| BAC | 2 | 256 | 2 – 256 | 2 | 256 | 2 – 256 | |
| DADMAC | 0.5 | 256 | 0.5 – 256 | 0.5 | 256 | 0.5 – 256 | |
| ALL | 2 | 256 | 2 – 256 | 2 | 256 | 2 – 256 | |
| AMOXICILLIN | AMX | 8 | 512 | 8 - 512 | 8 | 512 | 8 – 512 |
| OXYTET | 8 | 512 | 8 – 512 | 8 | 512 | 8 – 512 | |
| COPPER | 8 | 512 | 8 – 512 | 8 | 512 | 8 – 512 | |
| ZINC | 8 | 512 | 8 – 512 | 8 | 256 | 8 – 256 | |
| BAC | 8 | 512 | 8 – 512 | 8 | 256 | 8 – 256 | |
| DADMAC | 8 | 256 | 8 – 256 | 8 | 128 | 8 – 128 | |
| ALL | 8 | 512 | 8 – 512 | 8 | 256 | 8 – 256 | |
| AMPICILLIN | AMX | 8 | 256 | 8 - 256 | 8 | 256 | 8 – 256 |
| OXYTET | 8 | 256 | 8 – 256 | 8 | 256 | 8 – 256 | |
| COPPER | 8 | 256 | 8 – 256 | 8 | 256 | 8 – 256 | |
| ZINC | 8 | 256 | 8 – 256 | 8 | 128 | 8 – 128 | |
| BAC | 8 | 512 | 8 – 512 | 8 | 128 | 8 – 128 | |
| DADMAC | 8 | 256 | 8 – 256 | 8 | 256 | 8 – 256 | |
| ALL | 8 | 258 | 8 – 258 | 8 | 128 | 8 – 128 | |
Disclaimer/Publisher’s Note: The statements, opinions and data contained in all publications are solely those of the individual author(s) and contributor(s) and not of MDPI and/or the editor(s). MDPI and/or the editor(s) disclaim responsibility for any injury to people or property resulting from any ideas, methods, instructions or products referred to in the content. |
© 2023 by the authors. Licensee MDPI, Basel, Switzerland. This article is an open access article distributed under the terms and conditions of the Creative Commons Attribution (CC BY) license (https://creativecommons.org/licenses/by/4.0/).
Copyright: This open access article is published under a Creative Commons CC BY 4.0 license, which permit the free download, distribution, and reuse, provided that the author and preprint are cited in any reuse.


