
Submitted:
13 July 2023
Posted:
17 July 2023
You are already at the latest version
Abstract
The GPA is a universally recognised and utilised metric of academic performance that is considered to also measure a student’s potential for academic performance in the future. In this short communication we examine to what extent the GPA of the first grade of high school predicts performance in the later grades of high school, either generally (as classified in excellent student, strong student, weak student or very weak student) or more accurately (as indicated by the exact GPA in the next grade). We also put to the test the widely held notion that it might be best if core courses such as language and mathematics contributed more to the calculation of the GPA compared to secondary courses such as physical education or music. Our findings confirm the predictive properties of the GPA but strongly rebut the notion that a weighted GPA might achieve a better reflection of students’ potential. The study is based on the academic records of every student in Greece that progressed from first to third grade of high school in the 2016-2019 period. This data set contains records of more than 85,000 students, making it one of the most extensive studies ever conducted on the topic of the properties of the GPA.
Keywords:
GPA
; high school
; academic potential
; predictive property
; weighted GPA
1. Introduction
Grade Point Average (GPA) is a widely used metric to describe a student’s performance. The wide use is a result of a range of advantages including simplicity (it is just one number), objectivity (it is based on numerical values, instead of qualitative estimations) and recognisability (it is used, known and understood throughout the world). It is also considered to be an accurate representation of a student’s performance and potential. This is supported by a number of studies that identify a strong link between first year GPA and end of studies performance [1,2] or end of studies GPA with professional success [3] or success in graduate studies [4,5], although studies also exist that question the strength of such links [6,7,8].
But what about earlier than that? Research efforts focusing on previous levels of education treat GPA as a given research input rather than a focus of the study. For example, studies focusing on high school suggest that a high GPA at the end of high school can be linked to better performance in college/university [9,10,11]. And in numerous studies focusing on either elementary or high school, researchers examine how GPA is affected by various parameters such as social background [12], learning styles [13], family situation [14,15], health [16] etc. What is missing is research on whether the GPA in elementary or early years of high school is a good description of a student’s potential and a good predictor of the student’s future academic success.
In this short communication, we focus on high school and examine the GPA metric from three different perspectives, which form the research questions for our study:
- (RQ1) Exactly how good is the GPA in the 1st grade of high school as a predictor of the rough future academic performance?
- (RQ2) Exactly how accurate is the GPA in the 1st grade of high school as a predictor of GPA values in later high school grades?
- (RQ3) Is the current way of calculating the GPA in high school the best or would an approach that gives more weight to the core courses provide a better reflection of a student’s true potential?
In order to answer these questions we analyse the full academic records of every student attending high school in Greece over a period of three years, from 2016 until 2019. In order to facilitate the reader, we examine each question separately. Specifically, the rest of the article is organised as follows: In Section 2 we present the data set upon which we have based our study. Following that, we start presenting our study in Section 3 where we examine how the GPA in the 1st grade of high school is related to the academic performance in the 2nd and 3rd grade. Section 4 follows with an examination of how the GPA changes as students progress from one grade to the next. Finally, Section 5 compares the predictive ability of the conventional GPA with that of adjusted GPA metrics that also consider the relative importance of the courses. Closing, Section 6 summarises our findings and identifies areas for future research.
2. Data set
The Educational Management Information System (EMIS) of the Greek Ministry of Education records information regarding all students attending any of the fourteen levels of primary and secondary education, including those who attend private schools. School principals across the country are responsible for entering the data. Information recorded in EMIS includes:
- Demographic characteristics of the students and their families, such as age, gender, profession of parents, nationality, religious affiliation etc.
- Records of the students’ academic performance, such as grades per subject, absences in class, and notes on behaviour.
- Information regarding the teaching staff, such as their contractual status, their contact information, the classes they teach, the number of hours they teach each week, the qualifications they possess, their historical teaching and employment records, etc.
- Data regarding the schools, such as their address, the contact person, facilities and resources available, requests they have submitted for the recruitment of additional teachers, etc.
For this study, we have been provided with a segment of this data set. Specifically, we have been provided with full academic records for all students attending the first, second and third grades of high school during three consecutive academic years, namely 2016–17, 2017–18 and 2018–19.
The data set is anonymised, i.e. it is not possible to identify any specific student. It contains pseudo-identifiers (the same unique id is associated to all the records that are related to the same student) which allows us to track students’ progress from one grade to the next.
There are in total 296,733 records in the data set, each one corresponding to a student’s records for an academic year, as outlined earlier. A brief presentation of the data set and a first look at some conclusions that can be drawn from analysing it has been included in our earlier work [17]; in that work, the focus was on the way demographic data correlates to academic performance, while here we focus on the predictive properties of the GPA metric.
It is of course most common for a student that starts the 1st grade of high school a given year to finish the 3rd grade of high school three years later. But not every single student in the country progresses through the academic grades in the same pace. Some are forced to repeat a year due to illness, poor performance, or other adverse situations. Others move abroad or drop out of school entirely, disappearing from the school system records. And some others follow the opposite direction, for example coming from abroad and joining the Greek educational system at an intermediate grade without the system having any prior records for them. As a result, not all records are part of a typical three year progression.
As in our study we need to track students over a three year progression through the grades of high school, we use the pseudo-identifiers to associate the records of the three years that correspond to the same students moving through the three grades and discard records that are not part of the typical progression. As shown in Table 1, this process leaves us with 85,344 complete records.
Of course the three school grades considered in our study do not all include exactly the same courses in their curricula; in Table 2 we summarise the courses taught in each grade. Firstly, we observe that there are differences in the core courses offered. For example, the third grade has “Social and Political Education” that is not offered in grades 1 and 2 and similarly the first grade has “Home Economics” which is not offered in later grades. Moreover, there are courses that are not offered to all students. Examples include “Religious Education” for which some students request and receive an exemption, and languages other than English because each student can only select one additional foreign language. To that we should add that in numerous schools none of the additional languages is offered due to the lack of competent teachers.
As a result, academic performance records are not easy to compare from grade to grade, or even from student to student within the same grade. In order to overcome this, the students’ GPA is calculated and is used as the core parameter based on which we assess academic performance and track progress from grade to grade; in some records it is the average of the student’s performance across 19 courses while in others it considers as few as 13 courses, the average being 17.7 courses per student and school grade.
Having completed the pre-processing of the data (linking records of different grades, cleaning the records that are not part of a typical 3 grade progression and calculating the GPA values), we are left with 85,344 triplets of GPAs, corresponding to individual students’ performances across the three grades of high school. This is the data upon which our study is based.
3. RQ1 – Prediction of future academic performance
In earlier work [17] we found that across both elementary and high school, pupil and student performances can be classified in four groups of different potential, based on course scores and using a method such as k-means. We also found that students tend to remain in the same performance group across many years of studies.
In order to assess how well the GPA reflects the students’ current performance and future potential, we start by using k-means in order to cluster the students of each grade into four groups. The groups correspond to:
- Group A with the highest centroid value: excellent academic performance,
- Group B with the second highest centroid value: strong academic performance,
- Group C with the third highest centroid value: weak academic performance and
- Group D with the lowest centroid value: very weak academic performance
In k-means the centroid is an imaginary ideal member of a cluster whose parameters are the average of the corresponding parameters of all the actual members of the cluster. In our case, the centroid value is the average GPA in each group.
The sizes of the groups across the three grades are presented in Table 3. The first thing we observe is that the relative sizes of the groups do not change drastically across the three grades of high school. This is even more apparent in Table 4, where percentages are given instead of counts. We see, for example, that regardless of which school grade we examine, we will find that approximately 30% of the students have an excellent academic performance while approximately 15% of the students have a very weak academic performance.
Of course, in order to assess how well the GPA predicts the future academic performance of students it is not enough to observe that the sizes of the groups remain the same. We need to look deeper and check whether the members of the groups also remain the same. We start by examining the transition from 1st to 2nd grade. For example, in Figure 1 we present how students that had a strong academic performance in the 1st grade progressed in the 2nd grade. We observe that 24504 students (67%) retained their strong performance, 33% moved to a different level of academic performance (either better or worse) and 89 students, approximately 0.4% of the latter had a drastically different academic performance, moving to a non-neighbouring academic performance group.
The results for all students, i.e. also including academic performance groups A, C and D, are summarised in Table 5. We observe that 3 out of 4 students maintain their academic performance. More importantly, we observe that drastic changes in academic performance are extremely rare, occurring in less than half a percent of the cases.
But is this true in the longer term? In order to assess this we compare the students’ 1st grade performance to that of the 3rd grade, as shown in Figure 2. In the figure we see that out of the 89 students that started with a strong performance in the first grade and dropped to a very weak performance in the second grade, more than half enhanced their performance again, with some even returning to their earlier strong performance. In Table 6 we present a summary of how all students progressed through the 3 grades, having considered the outputs of all possible paths. We observe that more than 2 out of 3 students maintain their academic performance. More importantly, we observe that drastic changes in academic performance are still extremely rare, occurring in one percent of the cases.
Overall, based on these observations, we can conclude that the GPA is a relatively good rough predictor for the academic progress of students, both over a single year and in the longer term, as it can be used to accurately predict the group of future academic performance in the vast majority of the cases, and most importantly almost never produces severely flawed predictions.
4. RQ2 – Prediction of future GPA
One can argue of course that the groups of academic performance are very rough descriptions and therefore that predicting the group of performance is not sufficient. In this section we will examine to what extent the GPA can be used to predict the exact academic performance in the future, as expressed by GPAs achieved in later years.
We start by examining the progression from the first to the second grade. A first obstacle to overcome is that student performance is not scored in the same way across the different school grades. Although the same range of 0–20 marks is used throughout high school, there is a general tendency to award effort in earlier education years and achievements in more mature years. As a consequence, high performance scores are harder to get as students move to higher education grades. Indicatively, in our data set whilst the average GPA in the first grade of high school is 17.21, for the second grade it falls to 16.77. Meaning students that maintain the same performance across the two grades can expect to see a drop of 0.44 points in their GPAs.
Taking this into consideration, for each student we predict the second grade GPA as the GPA of the first grade reduced by 0.44. We observe that the average absolute value of the difference between the predicted and the actual second grade GPA is 0.58 with a standard deviation of 0.48 and a median value of 0.47. Clearly, the difference between prediction and actual values is minimal.
We follow the same approach in order to predict the GPA in the third grade based on the 1st grade GPA and calculate the absolute value of the difference between the two. We find that the average difference is 0.7 points with a standard deviation of 0.61 and a median value of 0.52. Again, the prediction is impressively close to the actual GPA values.
Overall we easily conclude that the GPA is an excellent predictor of future academic performance as expressed by the GPA, as the GPA in the 1st grade can be used to accurately predict the GPA in both the immediately next grade and the one after that.
5. RQ3 – Alternative GPA calculations
By now we have established that the GPA in the 1st year of high school is a good predictor of academic performance in subsequent high school grades. But is it the best predictor?
Although not stated expressly in policy, in Greece it is widely considered by teachers, students and families alike that some courses (such as language and mathematics) are more important academically than others (such as arts or physical education). Apparently this is not particular to Greece, as the question of whether physical education should be included in the calculation of GPA has also been posed elsewhere [18]. In this section we will examine whether a GPA that does not consider all courses equally, but rather gives more importance to some and less to others, could provide a better reflection of a student’s potential and consequently an even better prediction of the student’s future academic performance.
In order to estimate the relative importance of the different courses, we use the rank widget of the Orange Data Mining platform1. The widget provides a variety of feature scoring methods, thus producing numerous combinations of weights. For example, in Table 7 we see the course importance weights when selecting the chi square scoring criterion. We immediately observe that the weights produced by the platform match the intuition, as on the one hand courses that are typically considered as “core” such as Greek language and mathematics are given the biggest scores and on the other hand courses such as physical education, music and skills workshops are given the lowest scores.
Using the scores of Table 7 as weights, we calculate GPA as the weighted average of the courses of the first grade (and similarly for the second and third grades). We then repeat the analysis of Section 3 and calculate the percentage of students that remained in the same performance group or changed performance groups when moving from the first to the second grade. Table 8 is directly comparable to Table 5 for the conventional GPA. We observe that the predictive properties of the two GPAs (the conventional one and the weighted one) are the same; if anything, the conventional GPA slightly outperforms the weighted one.
We repeat the process for a variety of different scoring criteria in the Orange platform (the corresponding weights are presented in Table A1 in Appendix A) and also examine the predictive properties of the different GPA metrics in both the short term (from 1st to 2nd grade) and the longer term (from 1st to 3rd grade). We gather all results in Table 9 in order to facilitate the comparison. In the table, we see how many students remain in the same performance group, i.e. for how many students we have a correct prediction of their future performance. We have omitted the data regarding drastic changes in academic performance, as they were negligible in all cases.
The weighted GPA with weights determined based on the reliefF criterion might produce slightly better predictions for the short term, but in the longer term - where it matters the most - the conventional GPA has the best performance. In any case, there is little to choose between the different approaches and perhaps a more fair takeaway would be that they all perform equally well. Our conclusion is that none of the alternatives that we examined managed to produce substantially better predictions when compared to the conventional GPA. Therefore, our study finds no reason to revise the way in which the GPA is calculated.
6. Conclusions
In this short communication we analysed the academic records of every student that enrolled in the first grade of high school in Greece in September 2016, and tracked their progress until the end of the third grade of high school in June 2019. In our analysis we focused on the GPA and its ability to predict future academic performance. The specific research questions we aimed to answer were (RQ1) whether 1st grade GPA predicts 2nd and 3rd grade academic performance group, (RQ2) whether 1st grade GPA predicts 2nd and 3rd grade GPA and (RQ3) whether an alternative calculation of the GPA might achieve better predictions.
Regarding RQ1, we found that GPA provides a reliable prediction of the future academic performance, with only 1% of students performing in the 3rd grade drastically different to what their first grade GPA indicates. Regarding RQ2, we found that 1st grade GPA is a very accurate predictor of future GPA, with an error rate that on average does not exceed 0.6 out of 20 for the second grade and 0.7 out of 20 for the third grade. Finally, regarding RQ3, having tested a variety of alternative approaches to the calculation of GPA, we found that the conventional GPA is performing equally well or better than any tried alternative.
All three findings are in support of continuing to use the conventional GPA in order to assess academic potential in high school; the first two supporting that the GPA is a good predictor of future academic performance and the last one supporting that there would be no benefit in using some alternative form of GPA.
Whereas our findings do not call for a change in the current practice, we believe they are still important for two reasons. The first one is that they are based on a quantitative analysis involving the full student population of a whole country. Thus, we no longer have a mere intuitive feeling about the value of the GPA, but instead, a very reliable (via the sheer volume of the data set) quantitative confirmation of its predictive properties. The second is that our findings are contradicting an intuitive expectation, emphatically rebutting the expectation that a weighted GPA that puts more emphasis on core courses and less on courses often deemed as secondary, would be more representative of a student’s potential.
A limitation of our study is that it has been based on data derived exclusively from the Greek education system. Therefore, our findings might be particular to the case of Greece. Further research is needed in order to establish whether similar findings hold true for other countries, especially those that have educational systems that are structured differently than that of Greece.
Having established that GPA is a meaningful metric in high school, as part of our future work we plan to examine whether the same holds true for earlier stages of education. In the Greek educational system numerical grades and GPA first come into play at the 5th grade of elementary school. As a next step, we shall examine the records of all 5th graders and track their progress through high school, aiming to establish whether there is an equally strong correlation between GPA in elementary school and later academic performance.
Author Contributions
Conceptualization, M.W. and I.P; methodology, V.P. and I.P.; validation, M.W, C.V and G.L.; resources, I.P.; data curation, V.P.; writing—original draft preparation, M.W and I.P.; writing—review and editing, V.P., C.V, G.L. and N.P.; visualization, M.W, N.P. and I.P.; supervision, M.W. All authors have read and agreed to the published version of the manuscript.
Funding
This research received no external funding.
Institutional Review Board Statement
The data collection procedure was accomplished in accordance with the guidelines of the Declaration of Helsinki for the protection of human research subjects.
Data Availability Statement
Restrictions apply to the availability of these data. Data was obtained from the Greek Ministry of Education and are available with the permission of the Greek Ministry of Education.
Conflicts of Interest
I.P. is Head of Administrative Directorate of the Regional Education Directorate of Peloponnese. The other authors declare no conflict of interest.
Appendix A. Course weights used in the calculation of weighted GPA scores

Table A1.
Courses’ weights, as calculated by the Orange platform using different scoring options.
| Lesson | chi | inf. gain | gain ratio | ANOVA | reliefF |
|---|---|---|---|---|---|
| Greek Literature | 39,816.80 | 0.693016 | 0.350941 | 52,476.20 | 0.090410 |
| Greek Language | 44,856.70 | 0.670554 | 0.336379 | 48,928.90 | 0.082805 |
| Ancient Greek Language | 48,731.50 | 0.703587 | 0.361261 | 52,657.10 | 0.089857 |
| Religious Education | 35,999.96 | 0.486662 | 0.249384 | 29,996.70 | 0.072567 |
| History | 40,278.40 | 0.682574 | 0.344007 | 55,619.80 | 0.090181 |
| Mathematics | 40,398.50 | 0.601192 | 0.304467 | 44,838.70 | 0.083461 |
| Home Economics | 36,581.80 | 0.488409 | 0.250016 | 30,264.70 | 0.081459 |
| Computer Science | 23,896.10 | 0.313992 | 0.160368 | 15,433.20 | 0.032100 |
| Technology | 28,216.30 | 0.334923 | 0.222179 | 16,125.40 | 0.030976 |
| Physics | 38,961.90 | 0.545619 | 0.273215 | 38,949.40 | 0.038838 |
| Biology | 54,942.50 | 0.676912 | 0.339833 | 41617.60 | 0.105455 |
| Geography | 39,618.00 | 0.585534 | 0.294713 | 42,298.20 | 0.098573 |
| Chemistry | 57506.50 | 0.690078 | 0.346513 | 42860.60 | 0.107945 |
| Social and Political Education | 41787.50 | 0.582667 | 0.291426 | 38393.70 | 0.092651 |
| Music | 24,156.20 | 0.240835 | 0.157425 | 9,186.05 | 0.043716 |
| Physical Education | 4,517.47 | 0.068420 | 0.079009 | 1,072.91 | 0.003324 |
| Skills Workshops | 14,728.50 | 0.279432 | 0.187594 | 10,529.20 | 0.045207 |
| English Language | 27,747.90 | 0.402294 | 0.204230 | 23,218.20 | 0.068469 |
| Second Foreign Language | 33,262.50 | 0.463334 | 0.231998 | 26,867.00 | 0.043972 |
References
- Gershenfeld, S., Ward Hood, D., & Zhan, M. (2016). The Role of First-Semester GPA in Predicting Graduation Rates of Underrepresented Students. Journal of College Student Retention: Research, Theory & Practice, 17(4), 469–488. [CrossRef]
- Gayles, Jonathan. "Race, Late Bloomers and First-Year GPA: Predicting beyond the Freshman Year." Educational Research Quarterly 36, no. 1 (2012): 13-29.
- Mehmetaj, Nevila, and Merita Zulfiu Alili. "Employment of economics graduates: does gpa matter?." Interdisciplinary Description of Complex Systems: INDECS 19, no. 2 (2021): 210-226. [CrossRef]
- Verostek, Mike, Casey W. Miller, and Benjamin Zwickl. "Analyzing admissions metrics as predictors of graduate GPA and whether graduate GPA mediates Ph. D. completion." Physical Review Physics Education Research 17, no. 2 (2021): 020115.
- Darolia, Rajeev, Stephanie Potochnick, and Charles E. Menifield. "Assessing admission criteria for early and mid-career students: Evidence from a US MPA program." Education Policy Analysis Archives 22 (2014): 101-101. [CrossRef]
- Boles, Larry. "Predicting graduate school success in a speech-language pathology program." Teaching and Learning in Communication Sciences & Disorders 2, no. 2 (2018): 1. [CrossRef]
- Hall, Joshua D., Anna B. O’Connell, and Jeanette G. Cook. "Predictors of student productivity in biomedical graduate school applications." PLoS One 12, no. 1 (2017): e0169121. [CrossRef]
- Cohen-Schotanus, Janke, Arno MM Muijtjens, Jan J. Reinders, Jessica Agsteribbe, Herman JM Van Rossum, and Cees PM Van Der Vleuten. "The predictive validity of grade point average scores in a partial lottery medical school admission system." Medical Education 40, no. 10 (2006): 1012-1019. [CrossRef]
- Van Hofwegen, Lynn, Monika Eckfield, and Oscar Wambuguh. "Predicting nursing program success for veterans: Examining the importance of TEAS and pre-admit science GPA." Journal of Professional Nursing 35, no. 3 (2019): 209-215. [CrossRef]
- Vulperhorst, Jonne, Christel Lutz, Renske de Kleijn, and Jan van Tartwijk. "Disentangling the predictive validity of high school grades for academic success in university." Assessment & Evaluation in Higher Education 43, no. 3 (2018): 399-414. [CrossRef]
- Easton, John Q., Esperanza Johnson, and Lauren Sartain. "The predictive power of ninth-grade GPA." Chicago, IL: University of Chicago Consortium on School Research (2017): 2018-10.
- Fateel, Moosa Jaafar, Samar Mukallid, and Bani Arora. "The Interaction between Socioeconomic Status and Preschool Education on Academic Achievement of Elementary School Students." International Education Studies 14, no. 8 (2021): 60-66. [CrossRef]
- Mašić, Adela, Edda Polz, and Senad Bećirović. "The relationship between learning styles, GPA, school level and gender." European Researcher 11, no. 1 (2020): 51-60. [CrossRef]
- Pisinger, Veronica Sofie Clara, Sanne Pagh Møller, Susan Andersen, and Janne S. Tolstrup. "Perceived parental alcohol problems and later dropout and grade point average in high school: A register-based follow-up study." Drug and alcohol review (2023). [CrossRef]
- Gubbins, Verónica, and Gabriel Otero. "Parental involvement and low-SES children’s academic achievement in early elementary school: new evidence from Chile." Educational Studies 46, no. 5 (2020): 548-569. [CrossRef]
- Hermassi, Souhail, Mohamed Souhaiel Chelly, Lars Bojsen Michalsik, Nilihan EM Sanal, Lawrence D. Hayes, and Cristina Cadenas-Sanchez. "Relationship between fatness, physical fitness, and academic performance in normal weight and overweight schoolchild handball players in Qatar State." Plos one 16, no. 2 (2021): e0246476. [CrossRef]
- Papadogiannis, I.; Wallace, M.; Poulopoulos, V.; Karountzou, G.; Ekonomopoulos, D. A First Ever Look into Greece’s Vast Educational Data: Interesting Findings and Policy Implications. Educ. Sci. 2021, 11, 489. [Google Scholar] [CrossRef]
- Langendorfer, Stephen J., Scott AGM Crawford, Joseph Nickels, and Angel Mathews. "Should the physical education grade be included in a high school student’s GPA?." Journal of Physical Education, Recreation & Dance 72, no. 8 (2001): 9. [CrossRef]
| 1 |
Figure 1.
The progress of students with strong academic performance as they moved from the 1st to the 2nd grade of high school. Green indicates no change, yellow some change and orange drastic change.
Figure 1.
The progress of students with strong academic performance as they moved from the 1st to the 2nd grade of high school. Green indicates no change, yellow some change and orange drastic change.
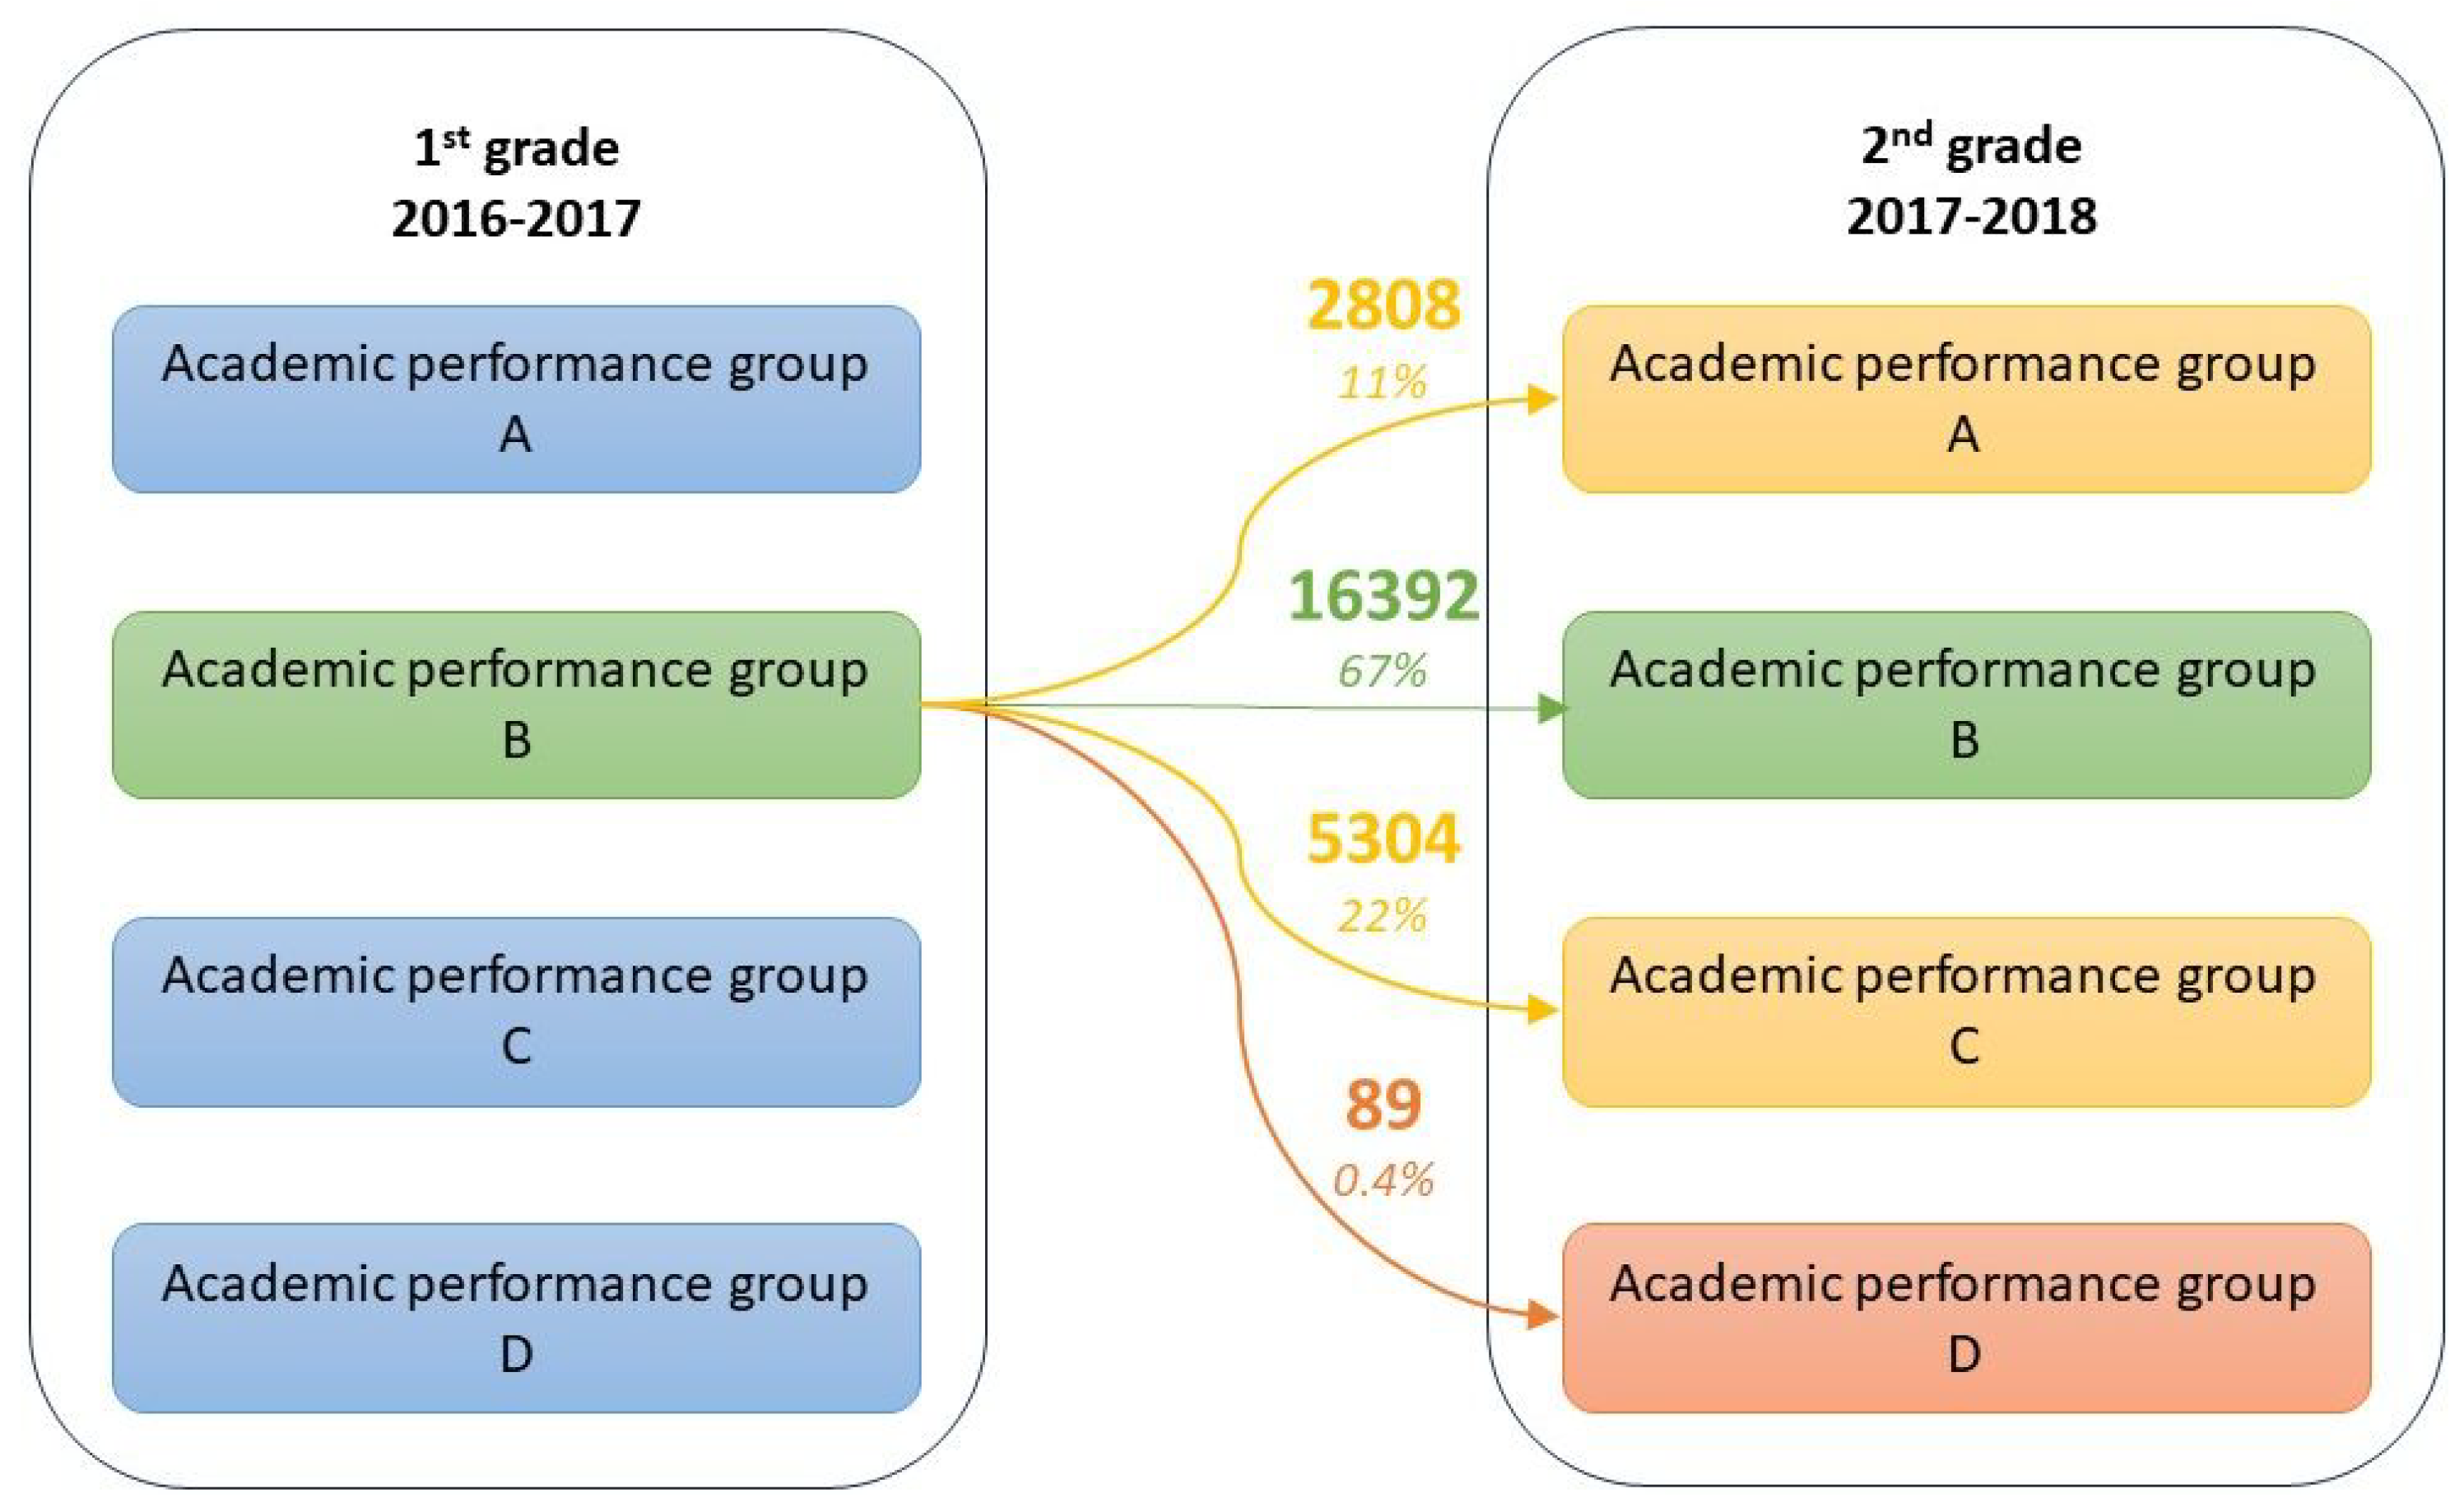
Figure 2.
The progress of some of the students with strong academic performance as they moved from the 1st to the 3rd grade of high school.
Figure 2.
The progress of some of the students with strong academic performance as they moved from the 1st to the 3rd grade of high school.
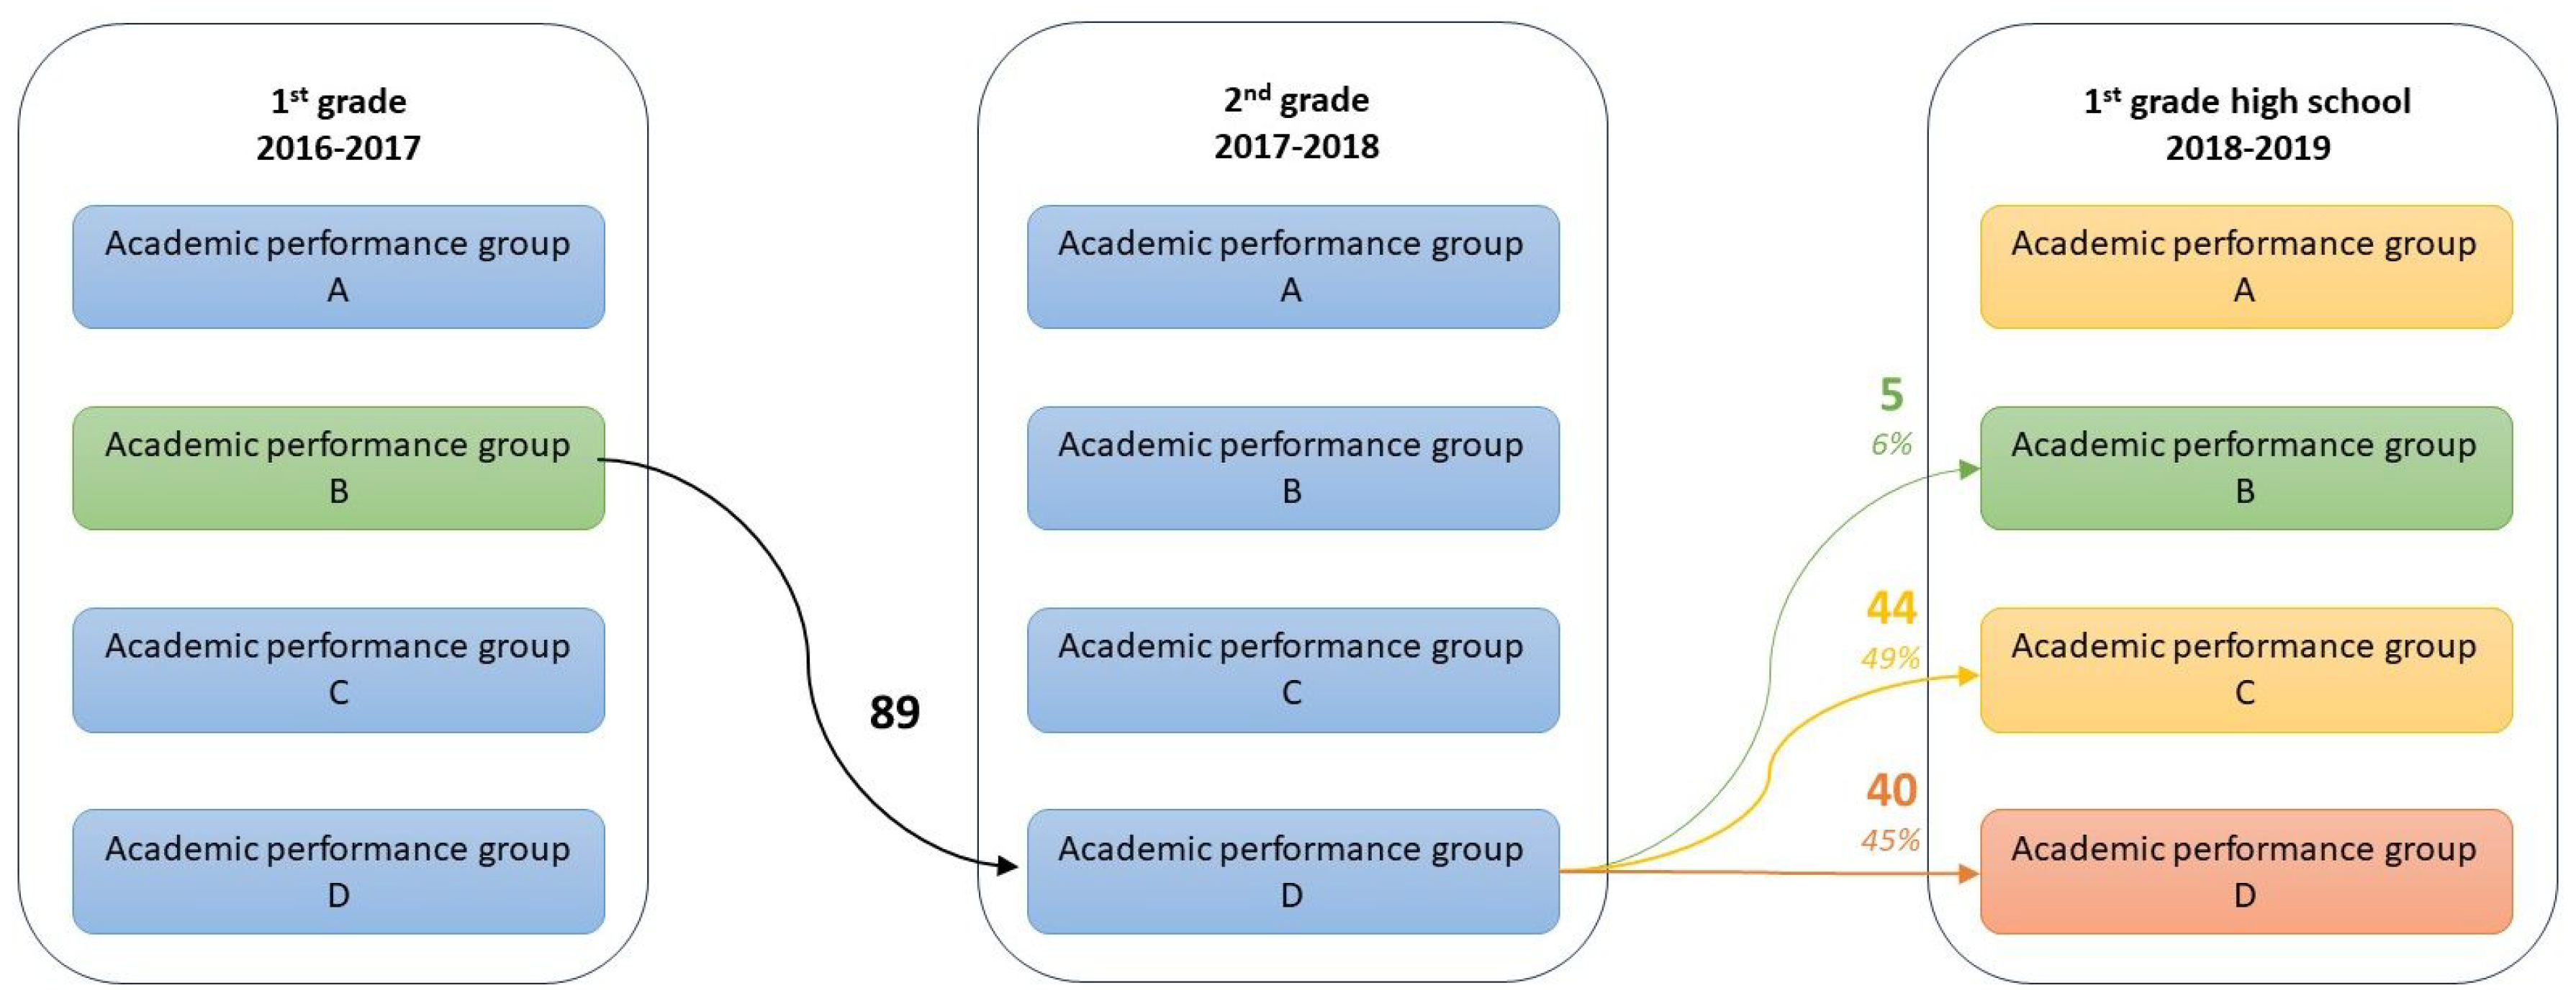
Table 1.
Consolidation of records.
| Grade | Records in the original data set | Retained records that span the 3 year period |
|---|---|---|
| 1st grade | 96,359 | 85,344 |
| 2nd grade | 99,431 | |
| 3rd grade | 100,943 |
Table 2.
Courses in the curriculum. ✓ indicates courses offered, X indicates courses not offered and (✓) indicates courses that are offered only in some schools or only for some students.
Table 2.
Courses in the curriculum. ✓ indicates courses offered, X indicates courses not offered and (✓) indicates courses that are offered only in some schools or only for some students.
| Course | 1st grade | 2nd grade | 3rd grade |
|---|---|---|---|
| Greek Literature | ✓ | ✓ | ✓ |
| Greek Language | ✓ | ✓ | ✓ |
| Ancient Greek Language | ✓ | ✓ | ✓ |
| Religious Education | (✓) | (✓) | (✓) |
| History | ✓ | ✓ | ✓ |
| Mathematics | ✓ | ✓ | ✓ |
| Home Economics | ✓ | x | x |
| Computer Science | ✓ | ✓ | ✓ |
| Technology | ✓ | ✓ | ✓ |
| Physics | ✓ | ✓ | ✓ |
| Biology | ✓ | ✓ | ✓ |
| Geography | ✓ | ✓ | X |
| Chemistry | X | ✓ | ✓ |
| Social and Political Education | X | X | ✓ |
| Music | ✓ | ✓ | ✓ |
| Physical Education | ✓ | ✓ | ✓ |
| Skills Workshops | ✓ | ✓ | ✓ |
| English Language | ✓ | ✓ | ✓ |
| French Language | (✓) | (✓) | (✓) |
| German Language | (✓) | (✓) | (✓) |
| Italian Language | (✓) | (✓) | (✓) |
Table 3.
Results of clustering in 4 clusters per academic year, based on GPA. Entries in the table indicate the count of students that has been assigned to each group.
Table 3.
Results of clustering in 4 clusters per academic year, based on GPA. Entries in the table indicate the count of students that has been assigned to each group.
| Academic performance group | 1st grade | 2nd grade | 3rd grade |
|---|---|---|---|
| A | 28,153 | 26,666 | 26,864 |
| B | 24,593 | 23,189 | 24,111 |
| C | 19,846 | 20,741 | 20,865 |
| D | 12,752 | 14,748 | 13,504 |
Table 4.
Results of clustering in 4 clusters per academic year, based on GPA, expressed as percentage of the academic year’s population.
Table 4.
Results of clustering in 4 clusters per academic year, based on GPA, expressed as percentage of the academic year’s population.
| Academic performance group | 1st grade | 2nd grade | 3rd grade |
|---|---|---|---|
| A | 33% | 31% | 31% |
| B | 29% | 27% | 28% |
| C | 23% | 24% | 24% |
| D | 15% | 17% | 16% |
Table 5.
Students that remained or did not remain in the same performance group when moving from the first to the second grade.
Table 5.
Students that remained or did not remain in the same performance group when moving from the first to the second grade.
| Change | Count of students | Percentage of students |
|---|---|---|
| No change | 64,507 | 76% |
| Any change, small or large | 20,837 | 24% |
| Drastic change | 236 | 0.3% |
Table 6.
Students that remained or did not remain in the same performance group when moving from the first to the third grade. Percentages do not add exactly to 100 due to rounding errors.
Table 6.
Students that remained or did not remain in the same performance group when moving from the first to the third grade. Percentages do not add exactly to 100 due to rounding errors.
| Change | Count of students | Percentage of students |
|---|---|---|
| No change | 59,194 | 69% |
| Any change, small or large | 26,150 | 31% |
| Drastic change | 886 | 1% |
Table 7.
Course importance weights, as produced by the Orange platform when selecting the chi square scoring method.
Table 7.
Course importance weights, as produced by the Orange platform when selecting the chi square scoring method.
| Course | Importance score |
|---|---|
| Greek Literature | 39,816.79 |
| Greek Language | 44,856.70 |
| Ancient Greek Language | 48,731.50 |
| Religious Education | 35,999.96 |
| History | 40,278.44 |
| Mathematics | 46,122.55 |
| Home Economics | 36,581.78 |
| Computer Science | 23,896.15 |
| Technology | 28,216.30 |
| Physics | 39,949.40 |
| Biology | 40,398.47 |
| Geography | 39,618.01 |
| Chemistry | 42,860.60 |
| Social and Political Education | 41,787.50 |
| Music | 9,186.05 |
| Physical Education | 4,517.47 |
| Skills Workshops | 14,728.50 |
| English Language | 27,747.90 |
| Second Foreign Language | 33,262.49 |
Table 8.
Students that remained or did not remain in the same performance group when moving from the first to the second grade, based on GPA.
Table 8.
Students that remained or did not remain in the same performance group when moving from the first to the second grade, based on GPA.
| Change | Count of students | Percentage of students |
|---|---|---|
| No change | 63,972 | 75% |
| Any change, small or large | 21,372 | 25% |
| Drastic change | 271 | 0.3% |
Table 9.
Predictive properties of various GPA alternatives. GPA is the conventional GPA. GPA is weighted based on the chi square criterion. GPA is weighted based on the information gain criterion. GPA is weighted based on the gain ratio criterion. GPA is weighted based on the ANOVA criterion. GPA is weighted based on the reliefF criterion.
| Type of GPA | 2nd grade | 3rd grade | ||
|---|---|---|---|---|
| Count | Percentage | Count | Percentage | |
| GPA | 64,507 | 76% | 59,194 | 69% |
| GPA. | 63,972 | 75% | 58,751 | 69% |
| GPA. | 63,933 | 75% | 58,816 | 69% |
| GPA. | 63,677 | 75% | 58,670 | 69% |
| GPA. | 63,858 | 75% | 58,420 | 68% |
| GPA. | 64,780 | 76% | 58,737 | 69% |
Disclaimer/Publisher’s Note: The statements, opinions and data contained in all publications are solely those of the individual author(s) and contributor(s) and not of MDPI and/or the editor(s). MDPI and/or the editor(s) disclaim responsibility for any injury to people or property resulting from any ideas, methods, instructions or products referred to in the content. |
© 2023 by the authors. Licensee MDPI, Basel, Switzerland. This article is an open access article distributed under the terms and conditions of the Creative Commons Attribution (CC BY) license (http://creativecommons.org/licenses/by/4.0/).
Copyright: This open access article is published under a Creative Commons CC BY 4.0 license, which permit the free download, distribution, and reuse, provided that the author and preprint are cited in any reuse.


