
Submitted:
07 July 2023
Posted:
11 July 2023
You are already at the latest version
Abstract
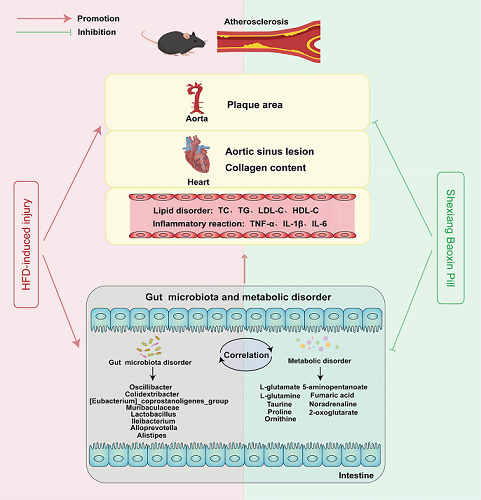
Background: Atherosclerosis (AS), a key pathological contributor of cardiovascular diseases (CVDs), was characterized by formation of atherosclerotic plaque in aortic wall and caused high mortality and morbidity worldwide. Factors contributing to the initiation and progression of AS included vascular endothelial dysfunction, dyslipidemia, inflammation, and oxidative stress. Shexiang Baoxin Pill (SBP) was a traditional Chinese medicine that had been widely applied in clinic and proved to be effective for patients with CVDs. However, the mechanisms underlying its anti-atherosclerotic effects have not been completely elucidated. The study aimed to investigate the protective effects of SBP on AS and its potential mechanisms. Methods: Different dose of SBP was orally administered in apolipoprotein E-deficient (ApoE-/-) mice treated with a high-fat diet (HFD). Histopathological and immunohistochemical analysis, ELISA, untargeted metabolomics analysis, 16S rRNA sequence analysis, and spearman analysis were applied to identify the protective effects and mechanisms of SBP in HFD-induced AS. Results: SBP significantly alleviated HFD-induced atherosclerotic lesion both in aorta and aortic sinus with a reduction in serum levels of total cholesterol (TC), triglycerides (TG) and low-density lipoprotein cholesterol (LDL-C), as well as interleukin-6 (IL-6) and interleukin-1β (IL-1β), and increased high-density lipoprotein cholesterol (HFD-C) level with no significant change of body weight in HFD-induced ApoE-/- mice. Mechanismly, SBP markedly reshaped the gut microbiota composition and associated metabolomic characteristics. 2 differential intestinal floras at phylum level and 8 differential microbes at genus level, 5 metabolic pathways and 9 differential fecal metabolites related to CVDs were figured out. Besides, intensive correlation between 8 differential microbes and 9 fecal metabolites was observed. Conclusions: Our results showed that SBP could improve HFD-triggered serum lipid disorder, systematic inflammation, and contribute to the alleviation of atherosclerotic lesion. The antiatherogenic properties of SBP might partly result from the reshaping of the gut microbiota and fecal metabolic profile.
Keywords:
Shexiang Baoxin Pill
; Atherosclerosis
; Gut microbiota
; Fecal metabolites
; Correlation
1. Introduction
Atherosclerosis (AS) is a major contributor of cardiovascular diseases (CVDs) and leads to a high rate of morbidity and mortality worldwide despite great advances in prevention, diagnosis and therapy [1]. Multiple factors contributed to AS pathogenesis, including vascular endothelial dysfunction, dyslipidemia, inflammation, and oxidative stress, which finally caused the formation of plaque in arterial lumen [2]. Until now, there are multiple therapeutic strategies for treating AS, such as anti-oxidant, anti-inflammatory, anti-hyperlipidemics and anti-platelets drugs. However, AS remains a universal problem threatening human health and the step of identification of new targets and drugs for therapy has been ongoing [3].
Gut microbiota and its metabolites are important parts of the gut microenvironment and considered as potential sources of novel therapeutics [4]. Increasing studies had shown that the gut microbiota was associated with certain human diseases, including obesity and diabetes [5], hyperlipidemia [6] and CVDs [7]. In addition, intensive connection between gut microbiota and AS had been reported in recent studies [6,8,9] and aroused increasing interest. Some microbes from intestine were observed in atherosclerotic plaque, implying that intestinal floras might hold direct influence on AS [10]. Compared with healthy controls, patients with AS showed much difference in the composition of gut microbiota [11]. Besides, inflammation, immunity, cholesterol and lipid metabolism were influenced by microbes and their metabolites in the intestine [8,12], which were key pathogenesis of AS. Furthermore, probiotics had been reported to ameliorate AS in animal experiments [13,14,15], which implied that gut microbiota and its products might be potential targets for treating AS.
Traditional Chinese medicine (TCM) has been widely applied in the prevention and treatment of CVDs in Asian countries, and accumulating studies related to TCM formulas have focused on CVDs [16,17]. Shexiang Baoxin Pill (SBP), a famous TCM formulation deriving from an ancient Suhexiang Pill, has been widely used to treat CVDs and improve health. SBP comprised seven medicinal materials including Moschus berezovskii Flerov (Moschus Artifactus), Panax ginseng C.A.Mey (Ginseng Radix), Liquidambar orientalis Mill (Styrax), Bufo bufo gargarizans Cantor (Bufonis Venenum,), Bos taurus domesticus Gmelin (Bovis Calculus Artifactus), Cinnamomum cassia Presl (Cinnamomi Cortex), and Cinnamomum camphora (L.)Presl (Borneolum Syntheticum) [18] (Table 1). The names of medicine were checked with Chinese Pharmacopoeia on July 20, 2022.The major active constituents of SBP had been systematically identified [19,20,21,22,23]. Previous studies had reported that SBP possesses multiple pharmacological effects against heart-related diseases in clinic, such ischemia related heart diseases and hypertension [18,24]. In addition, SBP exerted cardioprotective function via reducing oxidative stress [25], promoting angiogenesis [26], regulating cellular apoptosis [27], modulation blood lipid disorder and alleviating inflammation [28]. Moreover, the anti-atherosclerotic effect of SBP had been investigated in recent studies and the mechanism underlying SBP against AS involved improvement of inflammation, lipid metabolism and oxidative stress [28,29,30]. However, the exact anti-atherosclerotic mechanisms of SBP were not fully understood, and there were rare researches exploring the roles of SBP against AS from the perspective of gut microbiota and metabolites. In this study, we investigated the anti-atherosclerotic effect of SBP administration and then analyzed relevant mechanisms using methods of 16S rRNA sequencing and untargeted metabolomics in apolipoprotein E-deficient (ApoE-/-) mice.
2. Results
2.1. SBP Ameliorated Atherosclerotic Lesions in HFD-Induced apoE-/- Mice
During the period of the experiment, body weight of mice was monitored weekly and shown in Supplementary Figure S1. The results indicated much significance between Model and SBP groups in weight after seventh week, which implied that certain concentration of SBP administration could reduce body weight of mice treated with HFD.
In our study, aortic plaque lesions in ApoE-/- mice showed an effect of SBP on AS. The results showed that atherosclerotic plaque area in Model group significantly increased compared with the Control group. While, compared with Model group, SBP and Ator treatment significantly decreased aortic plaque area in ApoE-/- mice fed a HFD (Figure 1B,C). In addition, pathological staining was applied to measure the atherosclerotic lesions and collagen content in aortic sinus. As result, the Model group had the larger size of atherosclerotic lesions and collagen in aortic sinus than the Control group. Treatment with SBP and Ator significantly decreased atherosclerotic lesion area and collagen content (Figure 1D), when compared with the model group. These results indicated that SBP treatment could ameliorate HFD-induced atherosclerotic injury and Ator treatment had similar effects to SBP.
2.2. SBP Improved Lipid Profiles and Systemic Inflammation in HFD-Induce apoE-/- Mice
In the study, serum lipid profiles and inflammatory cytokines of mice were determined after 12 weeks of corresponding treatment. As shown in (Figure 2A–D), after 12 weeks of feeding HFD, ApoE-/- mice had significantly higher serum TC, TG, LDL-C levels and lower serum HDL level compared with the Control group. Ator treatment significantly decreased TC, TG, LDL-C levels and increased HDL-C level, and SBP treatment had similar effect to Ator treatment on lipid profiles. In addition, ApoE-/- mice in the Model group had markedly higher serum TNF-α, IL-6 and IL-1β levels compared with the Control group. Both SBP and Ator treatment significantly decreased serum levels of TNF-α, IL-6 and IL-1β (Figure 2E–G). Based on these results, SBP could reduce lipid levels and systemic inflammation in ApoE-/- mice fed a HFD.
2.3. SBP Regulated Composition of Gut Microbiota in Apoe-/- Mice
The effect of SBP on gut microbiota composition was analyzed by 16S rRNA sequencing. As results, a total of 1737701 clean reads were obtained from all samples (72404 ± 314.5 clean reads per sample) and there were 1501969 valid tags ranging in length from 415.83 to 419.59. A total of 9802 OTUs (2487 ± 74.73 OTUs per sample) were acquired after data processing. Next, the community richness and diversity of intestinal floras were determined and shown by Chao1 and Shannon indices. Other indexes to reflect community richness and diversity including goods coverage, observed species and Simpson were shown in Supplementary Table S1. The curves within each sample tended to flatten in diversity index rarefaction map as the number of sequences increased (Supplementary Figure S2), implying that the range of sequencing was reasonable for determining intestinal flora biodiversity. The richness and uniformity of species were investigated and reflected by rank abundance curve. As shown in Firure 3A, HFD feeding reduced the richness and uniformity of gut microbiota and SBP treatment markedly recovered it, while Ator had no repaired effect. Additionally, the Chao1 and Shannon indices in the Model group were significantly lower than those in the Control group, indicating that microbial diversity and richness were significantly reduced after HFD feeding in mice. Compared with the Model group, SBP treatment markedly increased the microbial richness and diversity while Ator had little effect on Chao1 and Shannon indexes (Figure 3B). PCoA based on bray curtis was applied to demonstrate the different compositions of the bacterial communities between groups. In the Control, Model and SBP groups, PCoA spots appeared to be separated, suggesting different bacterial community structures (Figure 3C).
The gut microbiota composition and differential floras at different taxonomic levels among the groups were identified and listed. The top 6 phyla of microflora were Bacteroidetes, Firmicutes, Desulfobacterota, Campilobacterota, Proteobacteria, and Actinobacteriota. A lower abundance of Bacteroidetes was observed in Model group compared to Control group, while SBP or Ator treatment reversed the change induced by HFD. Compared with the Control group, Model group had a markedly higher abundance of Firmicutes, which was significantly decreased after SBP or Ator treatment. Therefore, the ratio of Firmicutes to Bacteroidetes in Model group was higher than that in Control group, while SBP or Ator treatment reversed the ratio (Figure 3D). At genus level, the composition of intestinal folras in per sample and per group were shown, and Oscillibacter, [Eubacterium]_coprostanoligenes_group and Colidextribacter were much more abundant, Muribaculaceae, Lactobacillus, Ileibacterium, Alloprevotella, and Alistipes were markedly reduced after HFD feeding. SBP treatment recovered the disorder of intestinal floras induced by HFD. The Ator group showed no significant effects on Alistipes and Lactobacillus (Figure 3E). The structure of gut microbiota in per sample was shown in Supplementary Figure S3. In total, SBP and Ator treatment could recover the changing composition of intestinal floras in ApoE-/- mice treated with HFD.
In addition, the LEfSe analysis with a LDA score ≥ 4 was applied to idenify the core microbiota from phylum to genus in all groups. As shown in Figure 4A,B, the phylum Bacteroidota, the class Bacteroidia, the order Lachnospirales, Bacteroidales, the family Rikenellaceae, Muribaculaceae, Lachnospiraceae and the genus Lachnospiraceae_NK4A136_group, Muribaculaceae, Alistipes, Rikenellaceae_RC9_gut_group were enriched in Control group. After HFD feeding, the core microbes of mice were the phylum Firmicutes, Proteobacteria, Desulfobacterota, the class Clostridia, Gammaproteobacteria, Desulfovibrionia, the order Oscillospirales, Desulfovibrionales, the family Desulfovibrionaceae, Tannerellaceae, Eubacterium__coprostanoligenes_group, Oscillospiraceae, and the genus Colidextribacter, Parabacteroides, Eubacterium__coprostanoligenes_group. SBP or Ator treatment decreased the abundance of microbes enriched in Model group, and the phylum Campilobacterota, the class Campylobacteria, the order Campylobacterales, the family Helicobacteraceae, and the genus Helicobacter were enriched in SBP group, while the family Prevotellaceae, Bacteroidaceae, the genus Alloprevotella and Bacteroides were enriched after Ator treatment. Collectively, these findings suggested a significant impact of SBP and Ator on HFD-induced gut microbial reshaping.
2.4. SBP Reshaped the Fecal Metabolic Profiles in Apoe-/- Mice
Untargeted metabolomics analysis was performed to assess metabolic changes in response to gut microbiota in fecal samples. For PLS-DA and OPLS-DA analysis, the results showed good quality and stability after applying 7-fold cross-validation and 200 response permutations to prevent overfitting (Supplementary Figure S4). Distinct clustering of metabolites was apparent among Control, Model and SBP groups by PLS-DA analysis (Figure 5A,B). Besides, the OPLS-DA analysis with criteria of VIP > 1 and p < 0.05 was applied to identify differential metabolites. The OPLS-DA plots showed clear separation between the Model and Control groups. In addition, there were 505 up-regulated metabolites and 542 down- regulated in mice after HFD feeding, which implied that there was distinct fecal metabolic phenotype between Model and Control groups (Figure 5C,D). Expectedly, the OPLS-DA plots showed clear separation between the SBP and Model groups. After SBP treatment, 254 metabolites were significantly up-regulated and 300 down-regulated in HFD-induced ApoE-/- mice (Figure 5E,F). In total, fecal metabolic profiles in HFD-induced ApoE-/- mice were remodeled by SBP treatment.
2.5. SBP Regulated the Metabolic Pathways Related to CVDs
Based on the differentially expressed metabolites across groups, KEGG pathway enrichment analysis was performed. Total differentially expressed metabolites were clustered and heatmaps of top 50 differential metabolites between Model/Control and SBP/Model were shown in Figure 6A,B. Moreover, KEGG pathway enrichment analysis showed that there were 53 metabolic pathways with significant differences (p < 0.05) between Model/Control, and the differential metabolites between SBP/Model group were enriched in 44 pathways (p < 0.05) (Figure 6C,D). There were 24 overlapped pathways between Model/Control and SBP/Model (Supplementary Table S2), including Alanine, aspartate and glutamate metabolism, Regulation of lipolysis in adipocytes, Hypoxia-inducible factor 1 (HIF-1) signaling pathway, Taurine and hypotaurine metabolism, Adrenergic signaling in cardiomyocytes, which were reported related to CVDs [31,32,33,34,35]. There may be potential mechanisms of pathogenesis and therapeutic targets in the above five pathways that might alleviate AS (Table 2).
In addition, the differential metabolites from above 5 pathways were further investigated and shown in Figure 7. In alanine, aspartate and glutamate metabolism pathway, compared with the Control and SBP group, the Model group had significantly lower levels of L-glutamate and L-glutamine. The same trends were shown in the levels of taurine in taurine and hypotaurine metabolism, and ornithine,proline,5-aminopentanoate in arginine and proline metabolism. Besides, metabolites of 2-oxoglutarate, fumaric acid, noradrenaline in relative pathways were higher in Model group than those in Control group and SBP treatment appeared to decrease these metabolites. Above all, SBP regulated relative metabolic pathways enriched by differential metabolites.
2.6. Correlation among Gut Microbes, Metabolites and AS
Spearman correlation analysis was performed in this study to investigate the associations between differential gut microbiota and differential fecal metabolites, and the correlation network was visualized with Cytoscape 3.8.2. As shown in Figure 8 and Figure 9A, Alloprevotella was positively correlated with ornithine, 5-aminopentanoate, proline, L-glutamine and taurine, while negatively correlated with noradrenaline, fumaric acid, and 2-oxoglutarate. Muribaculaceae, Lactobacillus, Alistipes and Ileibacterium had positive correlation with ornithine, 5-aminopentanoate, L-glutamate, proline, L-glutamine and taurine, and had negative correlation with noradrenaline, fumaric acid, 2-oxoglutarate. Interestingly, the other 3 microbes seemed to have opposite correlation with these metabolites. [Eubacterium]_coprostanoligenes_group was negatively correlated with ornithine, 5-aminopentanoate, L-glutamate, proline, L-glutamine with positive correlation with noradrenaline, fumaric acid, 2-oxoglutarate. Similarly, Colidextribacter had negative correlation with ornithine, 5-aminopentanoate, L-glutamate and proline, while positively correlated with noradrenaline, fumaric acid, and 2-oxoglutarate. Oscillibacter showed the least correlation with metabolites, having positive connection with 2-oxoglutarate and negative connection with ornithine, 5-aminopentanoate. These results indicated that those microbes increased by SBP tended to have positive correlation with ornithine, 5-aminopentanoate, L-glutamate, proline, L-glutamine and taurine which were also advanced in SBP group. Moreover, those microbes enriched in Model group tended to have positive connection with noradrenaline, fumaric acid, and 2-oxoglutarate which were increased after HFD feeding.
In addition, the relationship between fecal potential biomarkers and AS indexes was shown in Figure 8 and Figure 9B. 2-oxoglutarate, noradrenaline and fumaric acid were positively correlated with atherosclerotic indexes except HDL-C level. 5-aminopentanoate, proline, L-glutamine and ornithine showed negative correlation with atherosclerotic indexes except HDL-C level, while L-glutamate showed negative correlation only with enface lesion, LDL-C and inflammatory factors. Besides, 2-oxoglutarate, noradrenaline and fumaric acid had negative correlation with HDL-C level, while ornithine, 5-aminopentanoate, L-glutamate, proline, L-glutamine and taurine did the opposite.
3. Discussion
The atherosclerotic lesions were mainly characterized by thickening of arterial wall, clear plaque and lipid deposition [36]. ORO, Masson, H&E staining were performed to visualize atherosclerotic lesions. In our previous study, we had conducted anti-atherosclerosis experiment in HFD-induced ApoE-/- mice with different dose of SBP and found that the concentration of 28 mg/kg/d exerted significant anti-atherosclerosis effect. Therefore, we further verified the anti-atherosclerosis effect of SBP with a concentration of 28 mg/kg/d and expored its potential mechanism. Results showed that SBP significantly improved atherosclerotic plaques in the aorta, atherosclerotic lesions and collagen content in the aortic sinus. Serum lipid disorder was a risk factor for atherosclerotic CVDs and contributed to the onset and progression of AS [37]. Target at improving lipid levels in serum had been an effective strategy for mitigating AS [38]. In HFD-induced ApoE-/- mice, SBP treatment significantly reduced plasma TC, TG, LDL-C levels and increased HDL-C levels. In addition, AS was a chronic inflammatory disease characterized by elevated inflammatory cytokines such as TNF-α, IL-1β, and IL-6 in the serum or atherosclerosis plaques, which implied the prospects of treating AS by inhibiting inflammation [39]. Our outcome showed that following SBP treatment, serum TNF-α, IL-1β and IL-6 levels decreased markedly. As results, there was a significant improvement in the aortic plaque, atherosclerotic lesions and collagen content in the aortic sinus in the SBP group. Ator showed similar results, suggesting that both SBP and Ator were atheroprotective.
Recently, increasing attention has focused on gut microbes and its metabolites due to their important role on physiology and pathology of the host [40]. Both humans and animals with AS-related diseases have demonstrated an intensive relationship between gut microbiota and AS [41]. A reduction in gut microbial diversity and richness increased the risk of AS [42]. In accordance with previous result [43], our study showed that HFD diet decreased the diversity of gut microbiota in ApoE-/- mice. After SBP treatment, Chao1 and Shannon indexes indicated that there was a significant increase in the diversity and richness of microbial species in ApoE-/- mice. While Ator had no obvious effect on Chao1 and Shannon indexes. Besides, altered composition of microbial species highlighted important role on AS [9]. According to our PCoA analysis, the composition of gut microbiota differed significantly among Control, Model, and SBP groups. Firmicutes and Bacteroidetes dominated in the composition of gut microbiota in human or mice at phylum level. Firmicutes aggravated metabolic endotoxins, inflammation, and increased AS risk, whereas Bacteroidetes protected against AS [41,44]. Increased Firmicutes/Bacteroidetes ratio was associated with increased risk of AS-related diseases [45,46]. In this study, we found that Ator or SBP treatment boosted Bacteroidetes abundance and decreased Firmicutes abundance, followed by decreasing Firmicutes/Bacteroidetes ratio which was higher simply with HFD feeding. Additionally, increasing studies had reported that gut microbes at genus level markedly impacted on the pathogenesis of AS. Lactobacillus acidophilus could attenuate the atherosclerotic progression by modulating oxidative stress, inflammation, and lipid metabolism in ApoE-/- mice treated with HFD [47,48,49] and Ileibacterium, Muribaculaceae could protect mice from HFD-induced obesity [50,51], pathological mechanisms of which recapitulated many features of AS. Besides, there was contrasting evidence indicating that Alistipes might have protective effects against some diseases including liver fibrosis, colitis, cancer immunotherapy, and cardiovascular disease [52], and Alloprevotella was considered as beneficial bacteria which could produce short-chain fatty acids [53]. In our experiment, 16S rRNA analysis revealed that the genus level of Lactobacillus, Ileibacterium, Muribaculaceae, Alistipes, Alloprevotella were markedly decreased after HFD feeding and SBP administration reversed this effect, whereas Ator only increased the relative abundance of Alistipes, Ileibacterium and Muribaculaceae. Additionally, high levels of Eubacterium_coprostanoligenes_group promoted obesity [54], and Oscillibacter abundance was closely linked to inflammation in obese mice [55]. Moreover, previous study had reported that Colidextribacter was positively correlated with serum malondialdehyde, hyperlipidemia-related parameters and negatively correlated with serum superoxide dismutase, which suggested its unfavorable effect on oxidative stress and lipid metabolism [56,57]. Our results showed that Eubacterium_coprostanoligenes_group, Oscillibacter, and Colidextribacter were significantly decreased by SBP or Ator. Besides, some other microbes including Parabacteriodes were reduced by SBP treatment, and might be worth further study.
Studies had showed that one of the pathophysiological mechanisms by which gut microbiota affected AS was the generation of active metabolites [58]. PLS-DA and OPLS-DA analysis in our investigation showed that there was much different in fecal metabolic profile between Model/Control and SBP/Model. In addition, metabolic pathways annotated by metabolites were considered significant to related diseases. In our experiment, KEGG pathway enrichment analysis indicated that 5 metabolic pathways involving Alanine, aspartate and glutamate metabolism, Regulation of lipolysis in adipocytes, HIF-1 signaling pathway, Taurine and hypotaurine metabolism and Adrenergic signaling in cardiomyocytes, which were reported to play important role in CVDs [31,32,33,34,35], were modulated both by HFD and SBP treatment. Convincing evidence showed that metabolites derived from gut microbiota also had a great impact on CVDs. L-glutamate, L-glutamine and fumaric acid were metabolites of Alanine, aspartate and glutamate metabolism pathway. L-glutamate was important resource in glutamine synthesis and studies showed that glutamine was negatively corrected with the progression of atherosclerotic lesions [59]. And glutamine accumulation improved the distinction of macrophage inflammatory states and can be utilized to image AS [60]. However, fumaric acid accumulation could activate inflammation and increase ROS signaling to aggravate oxidative stress [61,62]. The fecal differential metabolites in significant metabolic pathways were further investigated in our study and results showed that low levels of L-glutamate and L-glutamine, high level of fumaric acid were induced by HFD, while SBP treatment markedly reversed this HFD-induced effects. 2-oxoglutarate was product of most pathways including HIF-1 signaling pathway. HIF-1played important role in the progression of atherosclerotic arterial disease that underlay ischemia in many vascular beds. In normoxic conditions, the 2-oxoglutarate dependent HIF prolyl hydroxylases (PHDs) (Factor Inhibiting HIF) modified residues on HIF1α that target the protein for degradation and prevented its transcriptional activity. Deleting HIF1α in cardiomyocytes alone or cardiac loss of PHD function resulted in decreased ATP, lactate, and phosphocreatine levels, as well as impaired cardiac contractility [34]. Our study showed that SBP significantly reduced HFD-induced high level of 2-oxoglutarate in HIF-1 signaling pathway, which might inhibit PHDs, enhance transcriptional activity of HIF1α and finally attenuated CVDs. Stimulation of adipocyte lipolysis was reported to be linked with obesity, T2 diabetes and fatty liver disease which were risk factors of AS. And norepinephrine was a major catecholamine that promoted adipocyte lipolysis [32]. Additionally, norepinephrine released from the terminals of perivascular nerves suppressed endothelial production of nitric oxide (NO), which leads to vascular contraction that underlie the pathological conditions of AS [63]. Expectedly, our experiment demonstrated SBP treatment markedly decreased high level of norepinephrine induced by HFD administration. Taurine was reported to hold antioxidant and hypocholesterolemic effects, improve lipid profile and reduce atherosclerotic plaque, which was partly mediated by accelerating cholesterol degradation and the excretion of bile acid [33]. Our work showed that HFD treatment reduced the abundance of taurine with no significance, while SBP significantly increased taurine level. Moreover, ornithine,proline,5-aminopentanoate were metabolites of Arginine and proline metabolism pathway. Precious studies indicated that proline, derived from ornithine, could improve cardiac remodeling following myocardial infarction and attenuate cardiomyocyte apoptosis via redox regulation [64]. And low proline was associated with acute ischemic stroke and its subtypes [65]. Metabolomic studies on high-risk stroke patients indicated that low level of 5-aminopentanoate was considered as novel biomarker for thrombotic stroke [66]. Our analysis showed that levels of ornithine, proline and 5-aminopentanoate were markedly decreased after HFD feeding, while SBP treatment significantly increased these metabolites. These results indicated that fecal metabolic profiles could potentially serve as biomarkers of AS induced by HFD in ApoE-/- mice, and implied the protective effect of SBP on AS by regulating fecal metabolites related to CVDs.
Previous studies showed that Lactobacillus, Ileibacterium, Muribaculaceae, Alistipes, Alloprevotella had beneficial effects on CVDs [49-51], while Eubacterium_coprostanoligenes_group, Oscillibacter and Colidextribacter had opposite function [54,55,57]. And L-glutamate, L-glutamine, taurine, ornithine,proline,5-aminopentanoate were reported to exhibit protective effects on CVDs-related diseases [33,59,64,66], while fumaric acid, 2-oxoglutarate and norepinephrine might serve as risk factors of CVDs [32,34,62]. Consistently, sperman correlation analysis in our study showed that Lactobacillus, Ileibacterium, Muribaculaceae, Alistipes, Alloprevotella were almost positively correlated with beneficial metabolites including L-glutamate, L-glutamine, taurine, ornithine, proline, 5-aminopentanoate, while negatively correlated with harmful metabolites such as fumaric acid, 2-oxoglutarate and norepinephrine. And Eubacterium_coprostanoligenes_group, Oscillibacter and Colidextribacter, the microbes harmful to CVDs, had negatively association with metabolites beneficial to CVDs, while positively correlated with umaric acid, 2-oxoglutarate and norepinephrine. The correlation between fecal differential metabolites and AS was also consistent with previous reports. Therefore, We hypothesized that SBP treatment modulated gut microbiota related to CVDs, followed by a shift in fecal metabolic profiles from harmful to beneficial and finally alleviated AS. While, the causal relationship among changed gut microbiota, potential biomarkers and AS still remained unclear and further study will be needed to verify the correlation.
4. Materials and Methods
4.1. Reagents and Materials
SBP (Chinese Pharmacopoeia 2020, approval number Z31020068) was offered by Shanghai Hutchison Pharmaceuticals (batch number 191523, Shanghai, China). Pfizer Pharmaceuticals Ltd. (NY, USA) offered atorvastatin (Ator, Approval No. H20051408). Assay kits for total cholesterol (TC), triglycerides (TG), low-density lipoprotein cholesterol (LDL-C), and high-density lipoprotein cholesterol (HDL-C) were obtained from Nanjing Jiancheng Institute (Nanjing, China). The mouse tumor necrosis factor-α (TNF-α), interleukin-6 (IL-6), interleukin-1β (IL-1β) ELISA kits were products of Neobioscience (Shenzhen, China).
4.2. Animals and Treatment
Seven-week-old male ApoE-/- mice with C57/BL6 background (License number: SCXK (Su) 2018-0008) were acquired from Jiangsu GemPharmatech Co., Ltd. (Jiangsu, China). Total mice were housed in an environmentally controlled condition (22 ± 1 ℃, 60 % relative humidity, and 12 h/12 h light/dark cycle) and free access to drinking water and food. All procedures in animal experiment were performed in accordance with the Guideline for the Care and Use of Laboratory Animals from the Naval Medical University and acquired approval by the Ethics Committee of the Naval Medical University (Approval number NMU2020004).
After one-week acclimatation, the mice were randomly distributed to four groups (n = 6): (1) the blank control group, in which the mice were fed a normal chow diet and the same volume of 0.5 % sodium carboxymethyl cellulose solution; (2) the model group, in which the mice were fed a high fat diet (HFD, 21% fat, 1.25% cholesterol ) and 0.5% sodium carboxymethyl cellulose solution in the same volume; (3) the SBP group (SBP), in which the mice were fed a HFD with SBP treatment (SBP 28 mg/kg/d by gavage); (4) the Ator group, in which the mice were fed a HFD containing Ator (Ator 10 mg/kg/d by gavage). 0.5 % sodium carboxymethyl cellulose solution was used to dissolve the medicine and the mice received corresponding treatment for 12 weeks consecutively. During the study, the body weight was monitored and recorded weekly (Figure 1A).
At week 12, the mice were fasted overnight and sacrificed, and blood, organs and tissue samples were taken for further assessment.
4.3. Assessment of Atherosclerotic Lesions
Refer to previous study [28], the heart and aorta were perfused with phosphate buffer saline (PBS) at a rate of 2 ml/min. The whole aorta was carefully dissected from the arch to the iliac bifurcation, and the adventitial tissue was cleaned, followed by fixed in 4% paraformaldehyde solution for 16 h. Next, the aorta was washed with PBS and then stained with 0.5 % Oil Red O (ORO) working solution. The severity of aortic AS was expressed as the “fraction area” of the oil red-O-positive stained area compared with the whole vessel area. In addition, for histological analysis, mice hearts with proximal aortas were embedded in optimal cutting temperature (O.C.T.) compound, then cut into 10 μm sections. An evaluation of the lesion area and collagen content was performed using hematoxylin and eosin (H&E) and Masson's trichrome staining, respectively. Finally, Image-pro plus 6.0 software (Media Cybernetics) was applied to analyze the captured images.
4.4. Determination of Serum Cytokines
Whole blood was drawn from eyeball. Serum samples were separated from whole blood through centrifugation at 2500 g for 15 min at 4 ℃. Lipid levels of TC, TG, LDL-C and HDL-C in serum were measured using biochemical kits from Nanjing Jiancheng Bioengineering Institute, and serum inflammatory factors of TNF-α, IL-6 and IL-1β were detected by ELISA kits from Neobioscience following the manufacturer’s instructions. The measurement of absorbance at corresponding wavelength was performed by a Bio-Tek microplate reader (Winooski, VT, USA).
4.5. 16S rRNA Sequencing and Analysis
Total genomic DNA from cecal contents was extracted using the MagPure Soil DNA LQ Kit (Magen) following the manufacturer's instructions. Quality and purity of the DNA were verified with 1% agarose gel electrophoresis. The amplification of the V3-V4 region of the bacterial 16S rRNA genes was performed by a thermocycler polymerase chain reaction (PCR) system (Bio-rad). The primers were as follows: 343F (5’-TACGGRAGGCAGCAG-3’) and 798R (5’- AGGGTATCTAAT-CCT-3’). Gel electrophoresis was used to visualize the amplicon quality. Qubit dsDNA assay kit (Life Technologies) was used to quantify PCR products purified with AMPure XP beads (Agencourt ).
The OE Biotech Co., Ltd. (Shanghai, China) sequenced and analyzed the 16S rRNA gene amplicon. High throughput sequencing was performed on a MiSeq platform (Illumina, San Diego, USA). VSEARCH was used to group operational taxonomic units (OTUs) with a similarity cutoff of 97%, and QIIME (v1.8.0) was used to select representative reads for each OTU. The taxonomy of each 16S rRNA gene sequence was analyzed using RDP classifier against Silva database (v132) with a confidence threshold of 70 %. Microbial alpha (α) diversity in cecal contents was accessed by the indexes of Chao1 and Shannon, which were calculated using online software offered by OE Biotech Co., Ltd. The beta diversity was calculated using principal coordinate analysis (PCoA ) with unweighted unifrac distance matrix. Based on non-parametric factorial Kruskal-Wallis sum-rank tests and Wilcoxon rank-sum tests, linear discriminant analysis (LDA) coupled with effect size (LEfSe) measurements were carried out to identify significantly key taxa between groups, with the criteria of p < 0.05 and an LDA score threshold of 4.
4.6. LC-MS-Based Untargeted Metabolomics Analysis
Chromatographic analysis was performed using a Dionex Ultimate 3000 RS UHPLC (Thermo Fisher Scientific), equipped with a Q-Exactive plus quadrupole-Orbitrap mass spectrometer with heated electrospray ionization (ESI) source. ACQUITY UPLC HSS T3 (1.8 μm, 2.1 × 100 mm) was used, with acetonitrile and water with 0.1% formic acid as mobile phases. The LC-MS parameters were set as follows: flow rate, 0.35 mL/min; column temperature, 45 °C; injection volume, 2 μL. There was a mass range setting from 100 to 1,000 Da. A resolution of 70,000 was set for the full MS scans and 17,500 for the HCD MS/MS scans. Collision energies were set at 10, 20 and 40 eV.
The original LC/MS data were imported to by software Progenesis QI Data Processing Software (Waters Corporation, Milford, USA) for data analysis and identification of metabolites based on public databases such as Human Metabolome Database (HMDB), Lipidmaps (v2.3) Metlin, EMDB, PMDB, and self-built databases. The positive and negative data were combined to get a combine data which was imported into R ropls package. The matrix was imported in R to carry out Principal Component Analysis (PCA) and (orthogonal) partial least squares discriminant analysis (O) (PLS-DA) was carried out to visualize the overall distribution among the samples, and distinguish the metabolites that differ between groups, respectively. Seven-fold cross-validation and 200 response permutation testing were conducted to evaluate the quality of the model and guard against overfitting. Variable Importance in Projection (VIP) ranked the overall contribution of each variable to the OPLS-DA model. Candidate metabolites with criteria of VIP > 1 and p < 0.05 were selected as potential biomarkers. Pathway annotation of differential metabolites was performed by Kyoto Encyclopedia of Genes and Genomes (KEGG).
4.7. Statistical Analysis
The data were shown as mean ± S.E.M and analyzed using GraphPad Prism 8.0 (GraphPad Software, Inc. USA). ANOVA, T-test, Welch's ANOVA, and Welch-corrected T-test were used based on the data features. Spearman’s correlation analysis was performed in online platform provided by OE Biotech Co., Ltd. p-value < 0.05 was considered statistically significant.
5. Conclusions
In this study, we investigated the effect and potential mechanism of SBP in ApoE-/- mice with HFD-induced AS. Results showed that SBP could attenuate atherosclerotic lesion both in aorta and aortic sinus, improve serum lipid levels and systemic inflammation without significant change of body weight in ApoE-/- mice fed with HFD. Considering the change in composition of gut microbes and fecal metabolic profile, and the correlation between differential microbiota and metabolites, the mechanism by which SBP exerted its anti-atherosclerotic effects was probably mediated by its effects on gut microbiota and differentially expressed fecal metabolites closely related to AS (Graphical abstract). The anti-atherosclerotic effect of SBP on ApoE-/- mice was first reported by our study based on integrated analysis in gut microbiota and fecal metabolites and their correlation with AS using methods of 16S rRNA sequence and untargeted metabolomics. However, the study was focused on the integrated effect of SBP against AS, which microbe or metabolite contributed the most to protective effect of SBP still remain unclear, and further studies are required to excavate more results.
Supplementary Materials
The following supporting information can be downloaded at the website of this paper posted on Preprints.org.
Author Contributions
Runhui Liu and Peng Fu designed the study and reviewed the manuscript. Bin Xie, Xianpeng Zu and Zhicong Wang performed the experiments. Bin Xie, Xianpeng Zu and Peng Fu analyzed and interpreted the data. Xike Xu directed the design of animal experiment. Bin Xie and Xianpeng Zu wrote the manuscript, and Jiayun Xin beautified figures. All the authors approved the submitted manuscript for publication and other aspects of the work.
Funding
This research was funded by National Natural Science Foundation of China (No. 82073981, 82273810, 82004215), The Key Research and Development Program of China (2019YFC1711006), Shanghai Municipal Health Commission Project (20204Y0326), Three-year Action Plan for Shanghai TCM Development and Inheritance Program [ZY(2021-2023)-0401] and Sailing Program of Naval Medical University.
Institutional Review Board Statement
All procedures in animal experiment were performed in accordance with the Guideline for the Care and Use of Laboratory Animals from the Naval Medical University and acquired approval by the Ethics Committee of the Naval Medical University (Approval number NMU2020004).
Informed Consent Statement
Not applicable.
Data Availability Statement
Data is contained within the article and Supplementary Materials.
Conflicts of Interest
The authors declare no conflict of interest.
Abbreviations: AS, atherosclerosis; CVDs, cardiovascular diseases; TCM, traditional Chinese medicine; SBP, Shexiang Baoxin Pill; ApoE-/-, apolipoprotein E-deficient; HFD, high-fat diet; Ator, atorvastatin; TC, total cholesterol; TG, triglyceride; LDL-C, low-density lipoprotein cholesterol; HDL-C, high-density lipoprotein cholesterol; TNF-α, tumor necrosis factor-α; IL-6, interleukin-6; IL-1β, interleukin-1β; PBS, phosphate buffer saline; ORO, oil red O; H&E, hematoxylin and eosin; OTU, operational taxonomic unit; PCR, polymerase chain reaction; PCoA, principal coordinate analysis; LDA, linear discriminant analysis; LEfSe, linear discriminant analysis coupled with effect size; (O) PLS-DA, (orthogonal) partial least-squares-discriminant analysis; VIP, variable importance in projection; KEGG, kyoto encyclopedia of genes and genomes; HIF-1, hypoxia-inducible factor 1; PHDs, prolyl hydroxylases; NO, nitric oxide.
References
- Negre-Salvayre, A.; Guerby, P.; Gayral, S.; Laffargue, M.; Salvayre, R. Role of reactive oxygen species in atherosclerosis: Lessons from murine genetic models. Free Radic. Biol. Med. 2020, 149, 8–22. [Google Scholar] [CrossRef]
- Hu, B.; Boakye-Yiadom, K.O.; Yu, W.; Yuan, Z.W.; Ho, W.; Xu, X.; Zhang, X.Q. Nanomedicine Approaches for Advanced Diagnosis and Treatment of Atherosclerosis and Related Ischemic Diseases. Adv. Healthc. Mater. 2020, 9, e2000336. [Google Scholar] [CrossRef] [PubMed]
- Salekeen, R.; Haider, A.N.; Akhter, F.; Billah, M.M.; Islam, M.E.; Didarul Islam, K.M. Lipid oxidation in pathophysiology of atherosclerosis: Current understanding and therapeutic strategies. Int. J. Cardiol. Cardiovasc. Risk Prev. 2022, 14, 200143. [Google Scholar] [CrossRef] [PubMed]
- Cani, P.D. Human gut microbiome: Hopes, threats and promises. Gut 2018, 67, 1716–1725. [Google Scholar] [CrossRef]
- Singer-Englar, T.; Barlow, G.; Mathur, R. Obesity, diabetes, and the gut microbiome: An updated review. Expert. Rev. Gastroenterol. Hepatol. 2019, 13, 3–15. [Google Scholar] [CrossRef]
- Vourakis, M.; Mayer, G.; Rousseau, G. The Role of Gut Microbiota on Cholesterol Metabolism in Atherosclerosis. Int. J. Mol. Sci. 2021, 22, 8074. [Google Scholar] [CrossRef] [PubMed]
- Tang, W.H.; Kitai, T.; Hazen, S.L. Gut Microbiota in Cardiovascular Health and Disease. Circ. Res. 2017, 120, 1183–1196. [Google Scholar] [CrossRef] [PubMed]
- Jonsson, A.L.; Backhed, F. Role of gut microbiota in atherosclerosis. Nat. Rev. Cardiol. 2017, 14, 79–87. [Google Scholar] [CrossRef] [PubMed]
- Verhaar, B.J.H.; Prodan, A.; Nieuwdorp, M.; Muller, M. Gut Microbiota in Hypertension and Atherosclerosis: A Review. Nutrients 2020, 12, 2982. [Google Scholar] [CrossRef]
- Fak, F.; Tremaroli, V.; Bergstrom, G.; Backhed, F. Oral microbiota in patients with atherosclerosis. Atherosclerosis 2015, 243, 573–578. [Google Scholar] [CrossRef]
- Chen, J.; Qin, Q.; Yan, S.; Yang, Y.; Yan, H.; Li, T.; Ding, S. Gut Microbiome Alterations in Patients With Carotid Atherosclerosis. Front. Cardiovasc. Med. 2021, 8, 739093. [Google Scholar] [CrossRef]
- Ma, J.; Li, H. The Role of Gut Microbiota in Atherosclerosis and Hypertension. Front. Pharmacol. 2018, 9, 1082. [Google Scholar] [CrossRef] [PubMed]
- Chan, Y.K.; Brar, M.S.; Kirjavainen, P.V.; Chen, Y.; Peng, J.; Li, D.; El-Nezami, H. High fat diet induced atherosclerosis is accompanied with low colonic bacterial diversity and altered abundances that correlates with plaque size, plasma A-FABP and cholesterol: A pilot study of high fat diet and its intervention with Lactobacillus rhamnosus GG (LGG) or telmisartan in ApoE(-/-) mice. BMC Microbiol. 2016, 16, 264. [Google Scholar] [CrossRef]
- Chan, Y.K.; El-Nezami, H.; Chen, Y.; Kinnunen, K.; Kirjavainen, P.V. Probiotic mixture VSL#3 reduce high fat diet induced vascular inflammation and atherosclerosis in ApoE(-/-) mice. AMB Express 2016, 6, 61. [Google Scholar] [CrossRef]
- O’Morain, V.L.; Chan, Y.H.; Williams, J.O.; Alotibi, R.; Alahmadi, A.; Rodrigues, N.P.; Ramji, D.P. The Lab4P Consortium of Probiotics Attenuates Atherosclerosis in LDL Receptor Deficient Mice Fed a High Fat Diet and Causes Plaque Stabilization by Inhibiting Inflammation and Several Pro-Atherogenic Processes. Mol. Nutr. Food Res. 2021, 65, e2100214. [Google Scholar] [CrossRef] [PubMed]
- Hao, P.; Jiang, F.; Cheng, J.; Ma, L.; Zhang, Y.; Zhao, Y. Traditional Chinese Medicine for Cardiovascular Disease: Evidence and Potential Mechanisms. J. Am. Coll. Cardiol. 2017, 69, 2952–2966. [Google Scholar] [CrossRef]
- Wang, C.; Niimi, M.; Watanabe, T.; Wang, Y.; Liang, J.; Fan, J. Treatment of atherosclerosis by traditional Chinese medicine: Questions and quandaries. Atherosclerosis 2018, 277, 136–144. [Google Scholar] [CrossRef] [PubMed]
- Lu, L.; Sun, X.; Chen, C.; Qin, Y.; Guo, X. Shexiang Baoxin Pill, Derived From the Traditional Chinese Medicine, Provides Protective Roles Against Cardiovascular Diseases. Front. Pharmacol. 2018, 9, 1161. [Google Scholar] [CrossRef]
- Yan, S.K.; Zhang, W.D.; Liu, R.H.; Zhan, Y.C. Chemical fingerprinting of Shexiang Baoxin Pill and simultaneous determination of its major constituents by HPLC with evaporative light scattering detection and electrospray mass spectrometric detection. Chem Pharm Bull 2006, 54, 1058–1062. [Google Scholar] [CrossRef]
- Jiang, P.; Liu, R.; Dou, S.; Liu, L.; Zhang, W.; Chen, Z.; Ding, J. Analysis of the constituents in rat plasma after oral administration of Shexiang Baoxin pill by HPLC-ESI-MS/MS. Biomed. Chromatogr. 2009, 23, 1333–1343. [Google Scholar] [CrossRef]
- Chang, W.; Han, L.; Huang, H.; Wen, B.; Peng, C.; Lv, C.; Liu, R. Simultaneous determination of four volatile compounds in rat plasma after oral administration of Shexiang Baoxin Pill (SBP) by HS-SPDE-GC-MS/MS and its application to pharmacokinetic studies. J. Chromatogr. B Analyt Technol. Biomed. Life Sci. 2014, 963, 47–53. [Google Scholar] [CrossRef] [PubMed]
- Wang, S.; Peng, C.; Jiang, P.; Fu, P.; Tao, J.; Han, L.; Liu, R. Simultaneous determination of seven bufadienolides in rat plasma after oral administration of Shexiang Baoxin Pill by liquid chromatography-electrospray ionization-tandem mass spectrometry: Application to a pharmacokinetic study. J. Chromatogr. B Analyt Technol. Biomed. Life Sci. 2014, 967, 255–263. [Google Scholar] [CrossRef] [PubMed]
- Lv, C.; Chen, L.; Fu, P.; Yang, N.; Liu, Q.; Xu, Y.; Liu, R. Simultaneous quantification of 11 active constituents in Shexiang Baoxin Pill by ultraperformance convergence chromatography combined with tandem mass spectrometry. J. Chromatogr. B Analyt Technol. Biomed. Life Sci. 2017, 1052, 135–141. [Google Scholar] [CrossRef] [PubMed]
- Wei, J.; Liu, S.; Wang, X.; Li, B.; Qiao, L.; Wang, Y.; Zhu, M. Efficacy and Safety of Shexiang Baoxin Pill for Coronary Heart Disease after Percutaneous Coronary Intervention: A Systematic Review and Meta-analysis. Evid. Based Complement. Alternat Med. 2021, 2021, 2672516. [Google Scholar] [CrossRef]
- Guo, J.; Qin, Z.; He, Q.; Fong, T.L.; Lau, N.C.; Cho, W.C.S.; Chen, H. Shexiang Baoxin Pill for Acute Myocardial Infarction: Clinical Evidence and Molecular Mechanism of Antioxidative Stress. Oxid. Med. Cell Longev. 2021, 2021, 7644648. [Google Scholar] [CrossRef]
- Zhang, K.J.; Zhu, J.Z.; Bao, X.Y.; Zheng, Q.; Zheng, G.Q.; Wang, Y. Shexiang Baoxin Pills for Coronary Heart Disease in Animal Models: Preclinical Evidence and Promoting Angiogenesis Mechanism. Front. Pharmacol. 2017, 8, 404. [Google Scholar] [CrossRef]
- Li, Y.P.; Qiang, T.T.; Wang, K.Y.; Wang, X.L. Shexiang Baoxin Pill Regulates Intimal Hyperplasia, Migration, and Apoptosis after Platelet-Derived Growth Factor-BB-Stimulation of Vascular Smooth Muscle Cells via miR-451. Chin. J. Integr. Med. 2022, 28, 785–793. [Google Scholar] [CrossRef]
- Lu, L.; Qin, Y.; Zhang, X.; Chen, C.; Xu, X.; Yu, C.; Guo, X. Shexiang Baoxin Pill Alleviates the Atherosclerotic Lesions in Mice via Improving Inflammation Response and Inhibiting Lipid Accumulation in the Arterial Wall. Mediators Inflamm. 2019, 2019, 6710759. [Google Scholar] [CrossRef]
- Parsons, C.; Agasthi, P.; Mookadam, F.; Arsanjani, R. Reversal of coronary atherosclerosis: Role of life style and medical management. Trends Cardiovasc. Med. 2018, 28, 524–531. [Google Scholar] [CrossRef]
- Lu, L.; Qin, Y.; Chen, C.; Zhang, X.; Xu, X.; Lv, C.; Guo, X. The atheroprotective roles of heart-protecting musk pills against atherosclerosis development in apolipoprotein E-deficient mice. Ann. Transl. Med. 2019, 7, 714. [Google Scholar] [CrossRef]
- Sookoian, S.; Pirola, C.J. Alanine and aspartate aminotransferase and glutamine-cycling pathway: Their roles in pathogenesis of metabolic syndrome. World J. Gastroenterol. 2012, 18, 3775–3781. [Google Scholar] [CrossRef]
- Yang, A.; Mottillo, E.P. Adipocyte lipolysis: From molecular mechanisms of regulation to disease and therapeutics. Biochem. J. 2020, 477, 985–1008. [Google Scholar] [CrossRef]
- Zaric, B.L.; Radovanovic, J.N.; Gluvic, Z.; Stewart, A.J.; Essack, M.; Motwalli, O.; Isenovic, E.R. Atherosclerosis Linked to Aberrant Amino Acid Metabolism and Immunosuppressive Amino Acid Catabolizing Enzymes. Front. Immunol. 2020, 11, 551758. [Google Scholar] [CrossRef] [PubMed]
- Knutson, A.K.; Williams, A.L.; Boisvert, W.A.; Shohet, R.V. HIF in the heart: Development, metabolism, ischemia, and atherosclerosis. J. Clin. Invest. 2021, 131, e137557. [Google Scholar] [CrossRef] [PubMed]
- Meyer, E.E.; Clancy, C.E.; Lewis, T.J. Dynamics of adrenergic signaling in cardiac myocytes and implications for pharmacological treatment. J. Theor. Biol. 2021, 519, 110619. [Google Scholar] [CrossRef]
- Stary, H.C.; Chandler, A.B.; Dinsmore, R.E.; Fuster, V.; Glagov, S.; Insull, W., Jr.; Wissler, R.W. A definition of advanced types of atherosclerotic lesions and a histological classification of atherosclerosis. A report from the Committee on Vascular Lesions of the Council on Arteriosclerosis, American Heart Association. Circulation 1995, 92, 1355–1374. [Google Scholar] [CrossRef]
- Khatana, C.; Saini, N.K.; Chakrabarti, S.; Saini, V.; Sharma, A.; Saini, R.V.; Saini, A.K. Mechanistic Insights into the Oxidized Low-Density Lipoprotein-Induced Atherosclerosis. Oxid. Med. Cell Longev. 2020, 2020, 5245308. [Google Scholar] [CrossRef]
- Lucchi, T.; Cesari, M.; Vergani, C. [Dislipidemia and lipid lowering drugs: From guidelines to clinical practice. An updated review of the literature. ]. Recenti Prog. Med. 2020, 111, 426–443. [Google Scholar] [CrossRef]
- Libby, P.; Loscalzo, J.; Ridker, P.M.; Farkouh, M.E.; Hsue, P.Y.; Fuster, V.; Amar, S. Inflammation, Immunity, and Infection in Atherothrombosis: JACC Review Topic of the Week. J. Am. Coll. Cardiol. 2018, 72, 2071–2081. [Google Scholar] [CrossRef] [PubMed]
- Andoh, A. Physiological Role of Gut Microbiota for Maintaining Human Health. Digestion 2016, 93, 176–181. [Google Scholar] [CrossRef]
- Ramirez-Macias, I.; Orenes-Pinero, E.; Camelo-Castillo, A.; Rivera-Caravaca, J.M.; Lopez-Garcia, C.; Marin, F. Novel insights in the relationship of gut microbiota and coronary artery diseases. Crit. Rev. Food Sci. Nutr. 2022, 62, 3738–3750. [Google Scholar] [CrossRef]
- Menni, C.; Lin, C.; Cecelja, M.; Mangino, M.; Matey-Hernandez, M.L.; Keehn, L.; Valdes, A.M. Gut microbial diversity is associated with lower arterial stiffness in women. Eur. Heart J. 2018, 39, 2390–2397. [Google Scholar] [CrossRef] [PubMed]
- Han, Y.; Park, H.; Choi, B.R.; Ji, Y.; Kwon, E.Y.; Choi, M.S. Alteration of Microbiome Profile by D-Allulose in Amelioration of High-Fat-Diet-Induced Obesity in Mice. Nutrients 2020, 12, 352. [Google Scholar] [CrossRef] [PubMed]
- Dong, Y.; Cheng, H.; Liu, Y.; Xue, M.; Liang, H. Red yeast rice ameliorates high-fat diet-induced atherosclerosis in Apoe(-/-) mice in association with improved inflammation and altered gut microbiota composition. Food Funct. 2019, 10, 3880–3889. [Google Scholar] [CrossRef] [PubMed]
- Emoto, T.; Yamashita, T.; Sasaki, N.; Hirota, Y.; Hayashi, T.; So, A.; Hirata, K. Analysis of Gut Microbiota in Coronary Artery Disease Patients: A Possible Link between Gut Microbiota and Coronary Artery Disease. J. Atheroscler. Thromb. 2016, 23, 908–921. [Google Scholar] [CrossRef]
- Szabo, H.; Hernyes, A.; Piroska, M.; Ligeti, B.; Fussy, P.; Zoldi, L.; Tarnoki, D.L. Association between Gut Microbial Diversity and Carotid Intima-Media Thickness. Medicina 2021, 57, 195. [Google Scholar] [CrossRef]
- Chen, L.; Liu, W.; Li, Y.; Luo, S.; Liu, Q.; Zhong, Y.; Bao, M. Lactobacillus acidophilus ATCC 4356 attenuates the atherosclerotic progression through modulation of oxidative stress and inflammatory process. Int. Immunopharmacol. 2013, 17, 108–115. [Google Scholar] [CrossRef]
- Huang, Y.; Wang, J.; Quan, G.; Wang, X.; Yang, L.; Zhong, L. Lactobacillus acidophilus ATCC 4356 prevents atherosclerosis via inhibition of intestinal cholesterol absorption in apolipoprotein E-knockout mice. Appl. Environ. Microbiol. 2014, 80, 7496–7504. [Google Scholar] [CrossRef]
- Zhao, Z.; Wang, C.; Zhang, L.; Zhao, Y.; Duan, C.; Zhang, X.; Li, S. Lactobacillus plantarum NA136 improves the non-alcoholic fatty liver disease by modulating the AMPK/Nrf2 pathway. Appl. Microbiol. Biotechnol. 2019, 103, 5843–5850. [Google Scholar] [CrossRef]
- den Hartigh, L.J.; Gao, Z.; Goodspeed, L.; Wang, S.; Das, A.K.; Burant, C.F.; Blaser, M.J. Obese Mice Losing Weight Due to trans-10,cis-12 Conjugated Linoleic Acid Supplementation or Food Restriction Harbor Distinct Gut Microbiota. J. Nutr. 2018, 148, 562–572. [Google Scholar] [CrossRef]
- Ohue-Kitano, R.; Taira, S.; Watanabe, K.; Masujima, Y.; Kuboshima, T.; Miyamoto, J.; Kimura, I. 3-(4-Hydroxy-3-methoxyphenyl)propionic Acid Produced from 4-Hydroxy-3-methoxycinnamic Acid by Gut Microbiota Improves Host Metabolic Condition in Diet-Induced Obese Mice. Nutrients 2019, 11, 1036. [Google Scholar] [CrossRef] [PubMed]
- Parker, B.J.; Wearsch, P.A.; Veloo, A.C.M.; Rodriguez-Palacios, A. The Genus Alistipes: Gut Bacteria With Emerging Implications to Inflammation, Cancer, and Mental Health. Front. Immunol. 2020, 11, 906. [Google Scholar] [CrossRef] [PubMed]
- Kong, C.; Gao, R.; Yan, X.; Huang, L.; Qin, H. Probiotics improve gut microbiota dysbiosis in obese mice fed a high-fat or high-sucrose diet. Nutrition 2019, 60, 175–184. [Google Scholar] [CrossRef] [PubMed]
- Gomes, A.C.; Hoffmann, C.; Mota, J.F. The human gut microbiota: Metabolism and perspective in obesity. Gut Microbes 2018, 9, 308–325. [Google Scholar] [CrossRef]
- Lam, Y.Y.; Ha, C.W.; Campbell, C.R.; Mitchell, A.J.; Dinudom, A.; Oscarsson, J.; Storlien, L.H. Increased gut permeability and microbiota change associate with mesenteric fat inflammation and metabolic dysfunction in diet-induced obese mice. PLoS ONE 2012, 7, e34233. [Google Scholar] [CrossRef]
- Duan, R.; Guan, X.; Huang, K.; Zhang, Y.; Li, S.; Xia, J.; Shen, M. Flavonoids from Whole-Grain Oat Alleviated High-Fat Diet-Induced Hyperlipidemia via Regulating Bile Acid Metabolism and Gut Microbiota in Mice. J. Agric. Food Chem. 2021, 69, 7629–7640. [Google Scholar] [CrossRef]
- Wang, M.; Zhang, S.; Zhong, R.; Wan, F.; Chen, L.; Liu, L.; Zhang, H. Olive Fruit Extracts Supplement Improve Antioxidant Capacity via Altering Colonic Microbiota Composition in Mice. Front. Nutr. 2021, 8, 645099. [Google Scholar] [CrossRef] [PubMed]
- Pieczynska, M.D.; Yang, Y.; Petrykowski, S.; Horbanczuk, O.K.; Atanasov, A.G.; Horbanczuk, J.O. Gut Microbiota and Its Metabolites in Atherosclerosis Development. Molecules 2020, 25, 594. [Google Scholar] [CrossRef]
- Chen, J.; Zhang, S.; Wu, J.; Wu, S.; Xu, G.; Wei, D. Essential Role of Nonessential Amino Acid Glutamine in Atherosclerotic Cardiovascular Disease. DNA Cell Biol. 2020, 39, 8–15. [Google Scholar] [CrossRef]
- Tavakoli, S.; Downs, K.; Short, J.D.; Nguyen, H.N.; Lai, Y.; Jerabek, P.A.; Asmis, R. Characterization of Macrophage Polarization States Using Combined Measurement of 2-Deoxyglucose and Glutamine Accumulation: Implications for Imaging of Atherosclerosis. Arterioscler. Thromb. Vasc. Biol. 2017, 37, 1840–1848. [Google Scholar] [CrossRef]
- Blatnik, M.; Thorpe, S.R.; Baynes, J.W. Succination of proteins by fumarate: Mechanism of inactivation of glyceraldehyde-3-phosphate dehydrogenase in diabetes. Ann. N. Y. Acad. Sci. 2008, 1126, 272–275. [Google Scholar] [CrossRef]
- Zheng, L.; Cardaci, S.; Jerby, L.; MacKenzie, E.D.; Sciacovelli, M.; Johnson, T.I.; Gottlieb, E. Fumarate induces redox-dependent senescence by modifying glutathione metabolism. Nat. Commun. 2015, 6, 6001. [Google Scholar] [CrossRef] [PubMed]
- Chistiakov, D.A.; Ashwell, K.W.; Orekhov, A.N.; Bobryshev, Y.V. Innervation of the arterial wall and its modification in atherosclerosis. Auton. Neurosci. 2015, 193, 7–11. [Google Scholar] [CrossRef] [PubMed]
- Wang, J.; Xue, Z.; Lin, J.; Wang, Y.; Ying, H.; Lv, Q.; Zhou, B. Proline improves cardiac remodeling following myocardial infarction and attenuates cardiomyocyte apoptosis via redox regulation. Biochem. Pharmacol. 2020, 178, 114065. [Google Scholar] [CrossRef] [PubMed]
- Wang, X.; Zhang, L.; Sun, W.; Pei, L.L.; Tian, M.; Liang, J.; Song, B. Changes of Metabolites in Acute Ischemic Stroke and Its Subtypes. Front. Neurosci. 2020, 14, 580929. [Google Scholar] [CrossRef] [PubMed]
- Lee, Y.; Khan, A.; Hong, S.; Jee, S.H.; Park, Y.H. A metabolomic study on high-risk stroke patients determines low levels of serum lysine metabolites: A retrospective cohort study. Mol. Biosyst. 2017, 13, 1109–1120. [Google Scholar] [CrossRef]
Figure 1.
Effect of SBP on atherosclerotic lesions in ApoE-/- mice (n=6). (A) Experimental outline of SBP administration in ApoE-/- mice. (B) Photographs of aortic arch captured by microscope. (C) Representative photographs of the whole aorta by Oil Red O staining and quantitative analysis of plaque area of the whole aorta. (D) Representative images of aortic sinus sections by H&E staining and Masson staining; bar = 400 μm. And quantitative analysis of the lesion and collagen area. The data are expressed as means ± SEM. *p < 0.05, **p < 0.01 and ***p < 0.0001 vs Control; #p < 0.05, ##p < 0.01 and ###p < 0.001 vs Model (Control = normal control group; Model = model group; Ator = atorvastatin group; SBP = Shexiang Baoxin Pill group).
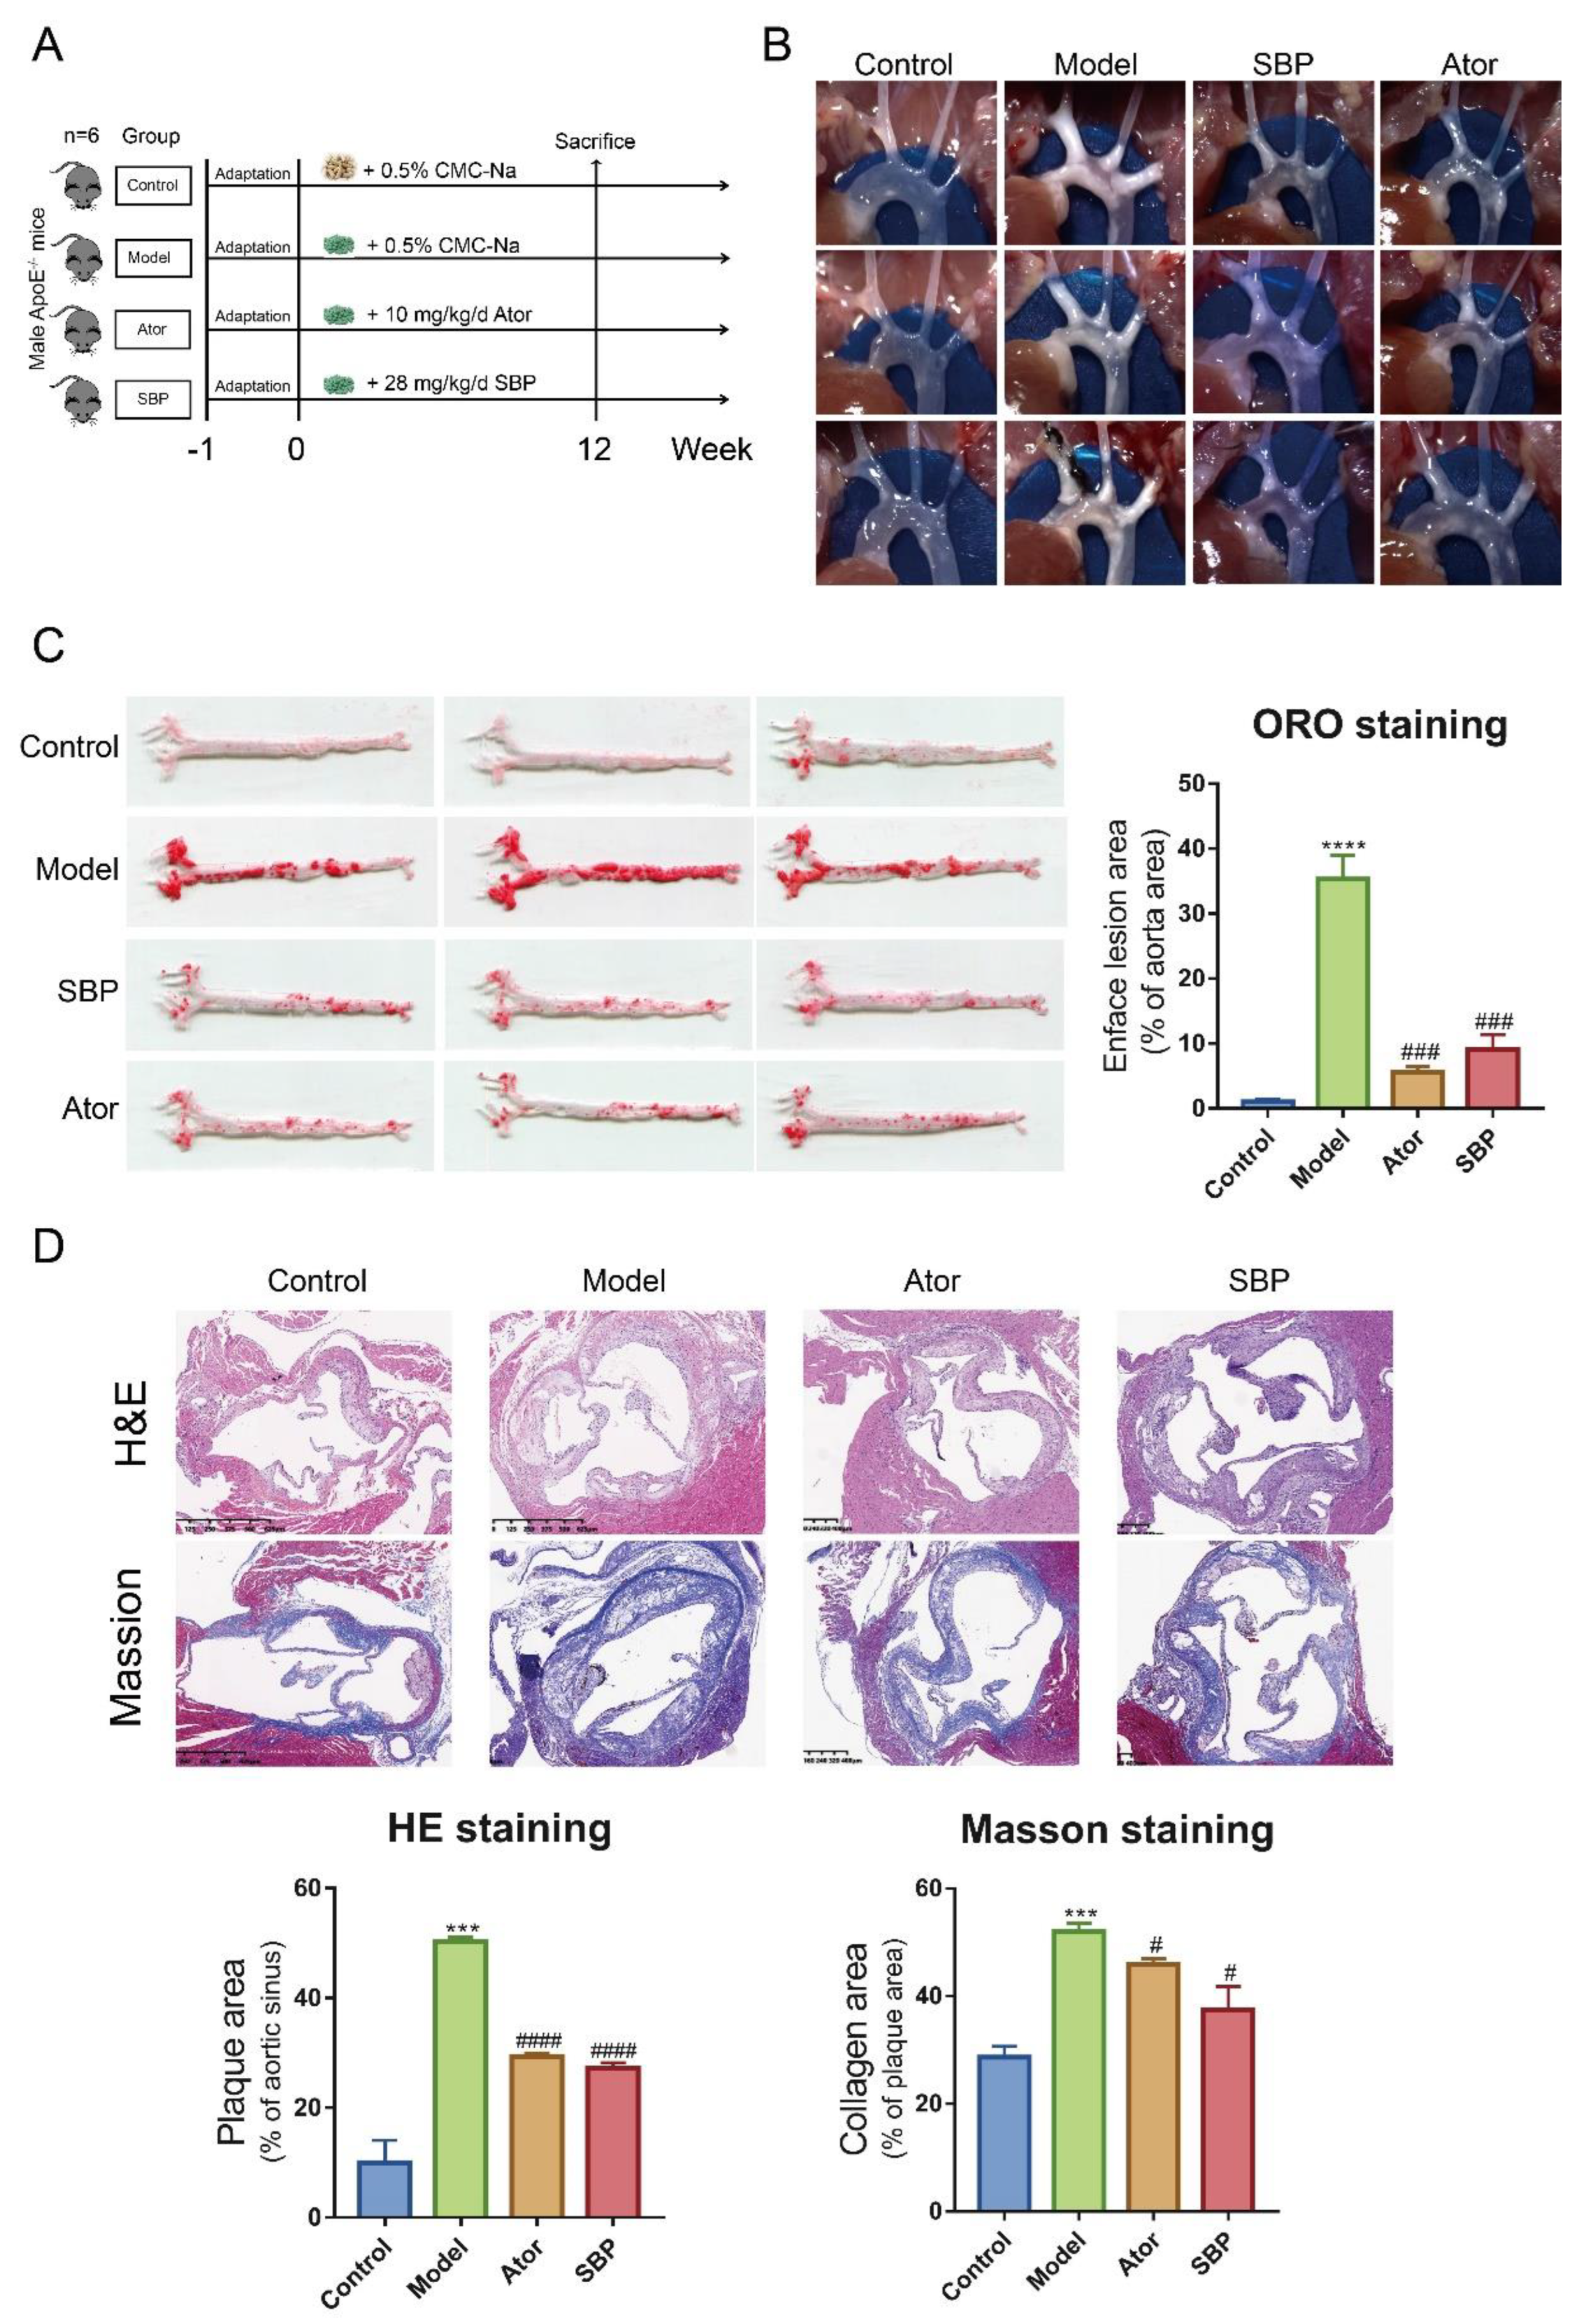
Figure 2.
SBP improved lipid profiles and systemic inflammation in HFD-induced ApoE-/- mice. (A-D) Levels of serum lipids (TC, TG, LDL-C, HDL-C) in per group. (E-G) Levels of inflammatory cytokines (TNF-α, IL-6, IL-1β) in per group. The data are expressed as means ± SEM. *p < 0.05, **p < 0.01 and ***p < 0.001 vs Control; #p < 0.05, ##p < 0.01 and ###p < 0.001 vs Model (Control = normal control group; Model = model group; Ator = atorvastatin group; SBP = Shexiang Baoxin Pill group).

Figure 3.
SBP regulated composition of gut microbiota in HFD-induced ApoE-/- mice (n=6). (A) Rank abundance curve explaining richness and uniformity of species in individual groups. (B) Richness and diversity of the gut microbiome assessed by Chao1 and Shannon indices, respectively. (C) PCoA analysis based on bray curtis for all samples at the OUT level. (D) The structure and relative abundance of gut microbiota at phylum level and the radio of Firmicutes/Bacteroidetes. (E) The structure and relative abundance of gut microbiota at genus level. The data are expressed as means ± SEM. *p < 0.05, **p < 0.01 and ***p < 0.001 vs Control; #p < 0.05, ##p < 0.01 and ###p < 0.001 vs Model (Control = normal control group; Model = model group; Ator = atorvastatin group; SBP = Shexiang Baoxin Pill group).
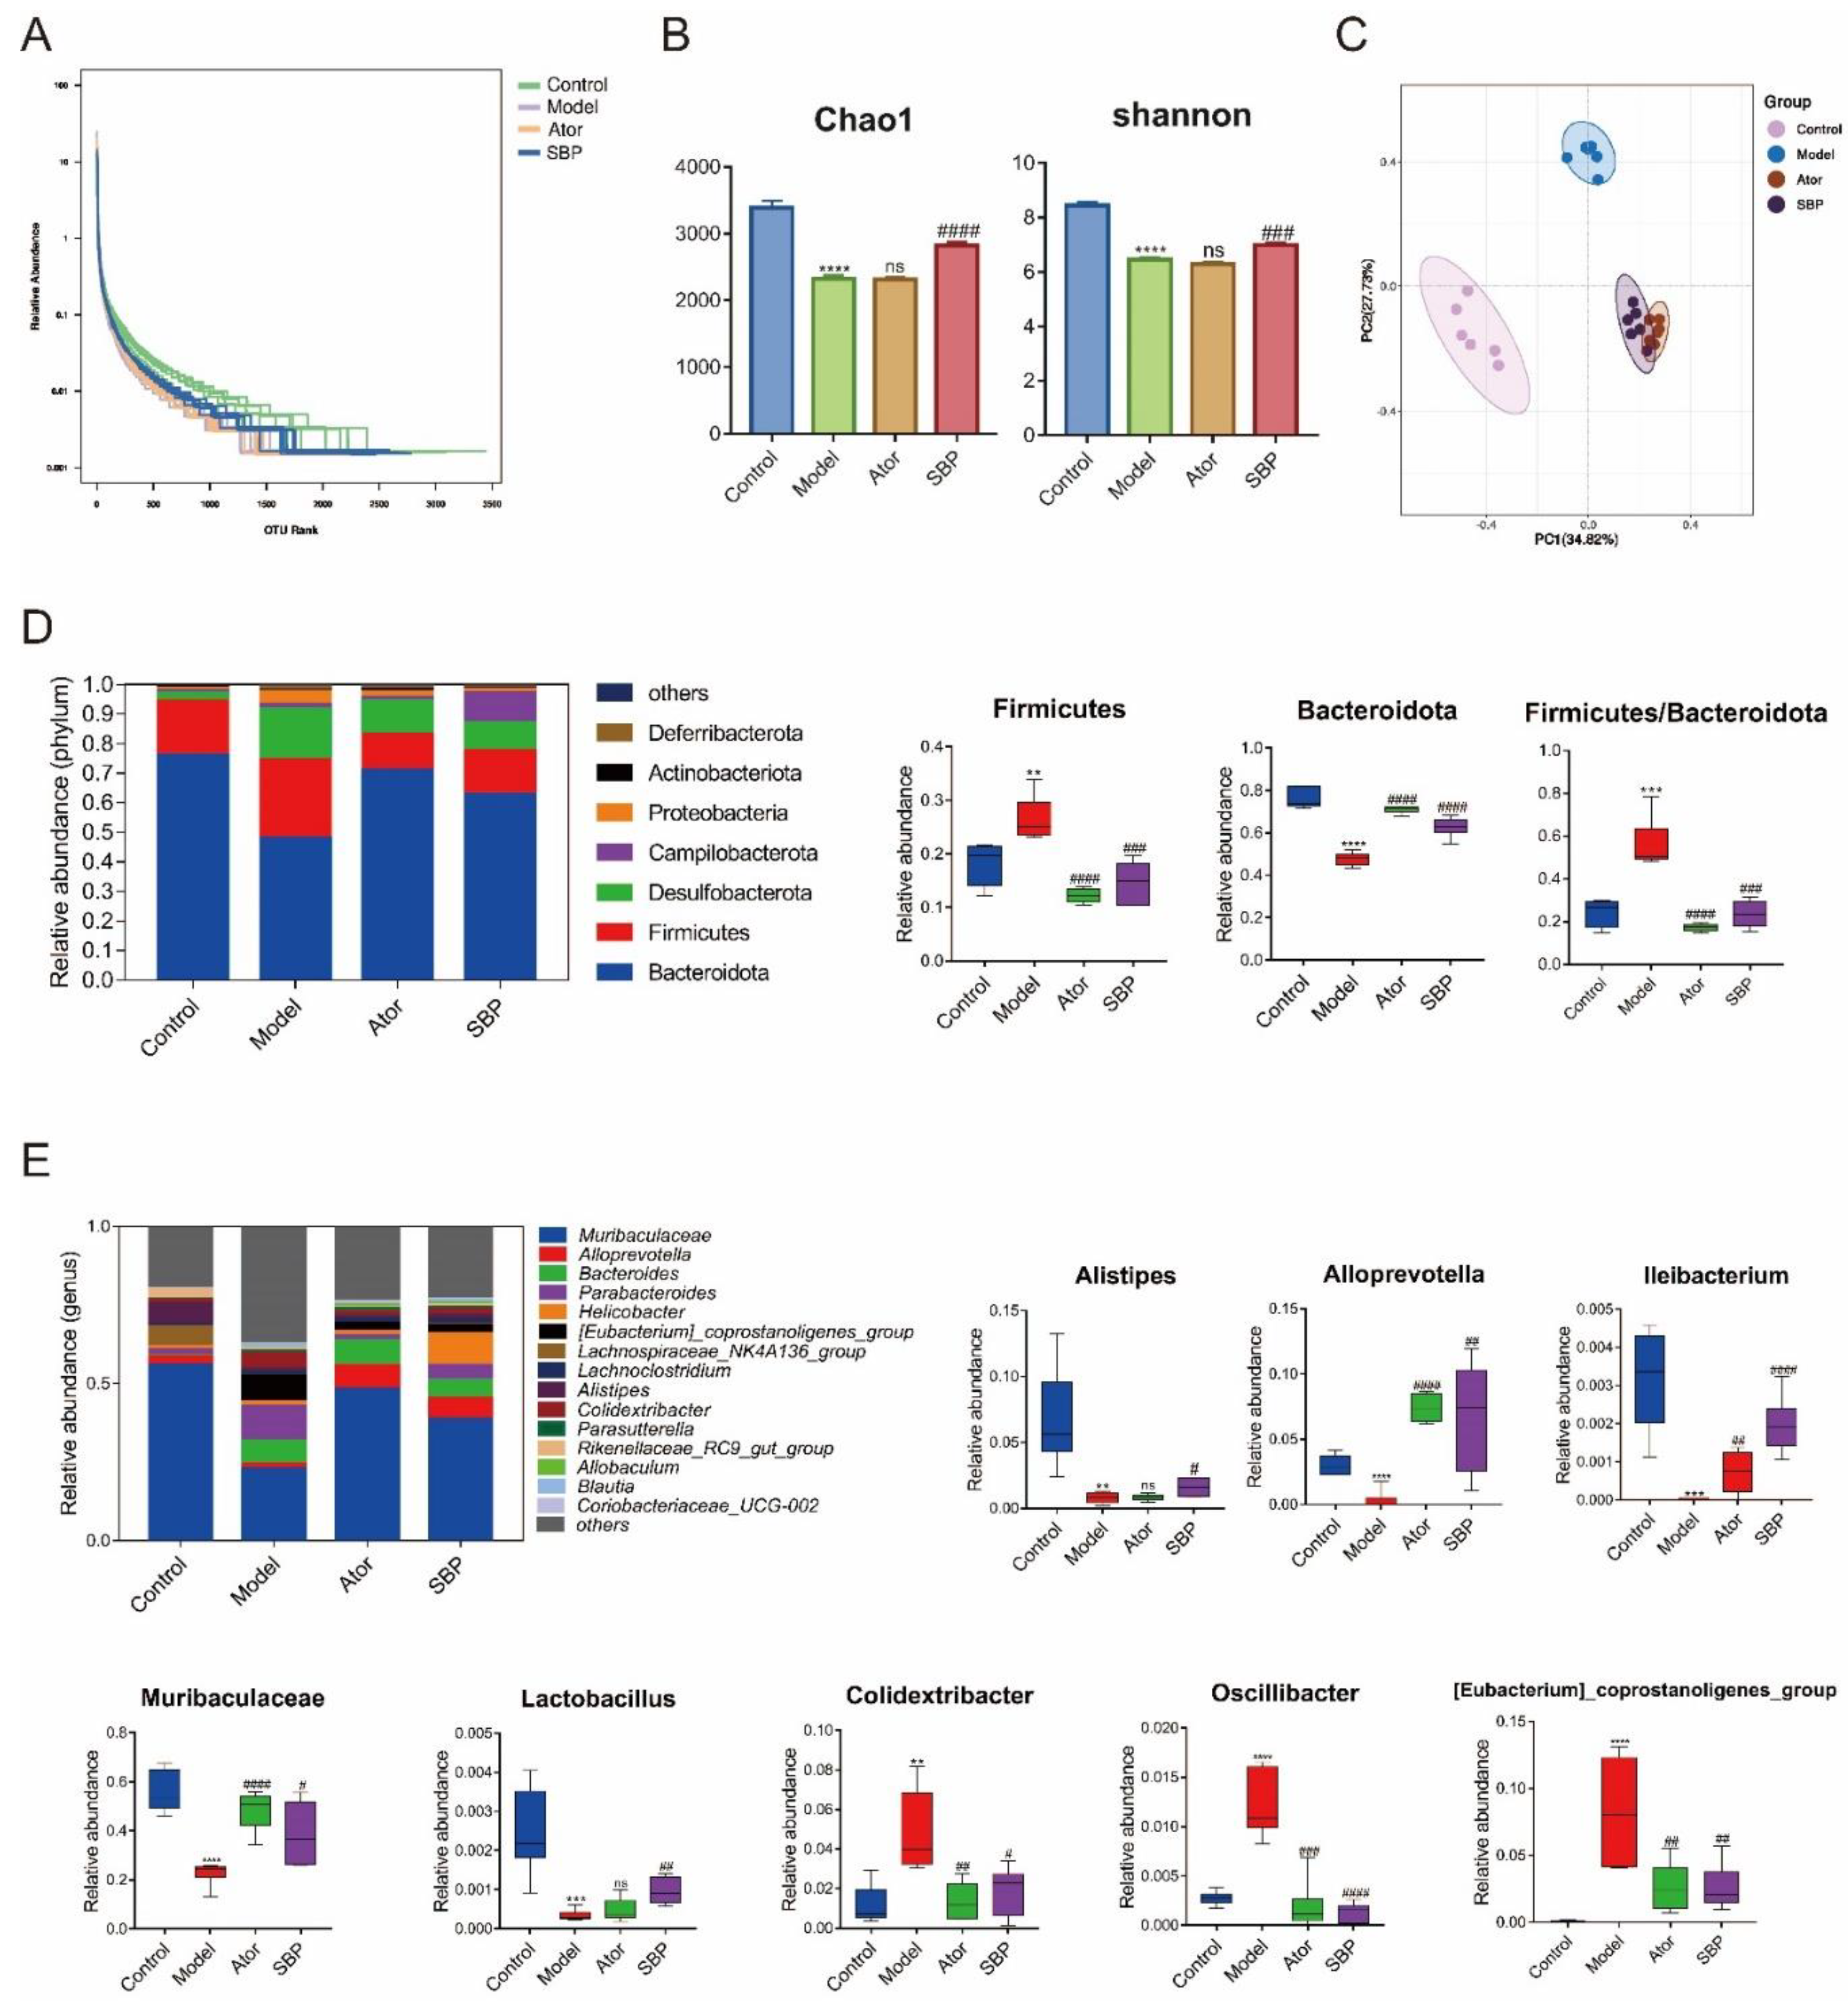
Figure 4.
Core bacterial phenotypes analysis in HFD-induced ApoE-/- mice (n=6). (A) LDA scores of taxa enriched at different taxonomy levels (LDA significant threshold = 4). (B) Taxonomic cladogram generated by LEfSe analysis showing taxa significantly enriched in Control group (green), Model group (blue), SBP group (purple), Ator group (red), respectively. Each ring represents a taxonomic level from phylum to genus. The size of each dot on the ring represents the relative abundance of the taxon (Control = normal control group; Model = model group; Ator = atorvastatin group; SBP = Shexiang Baoxin Pill group).
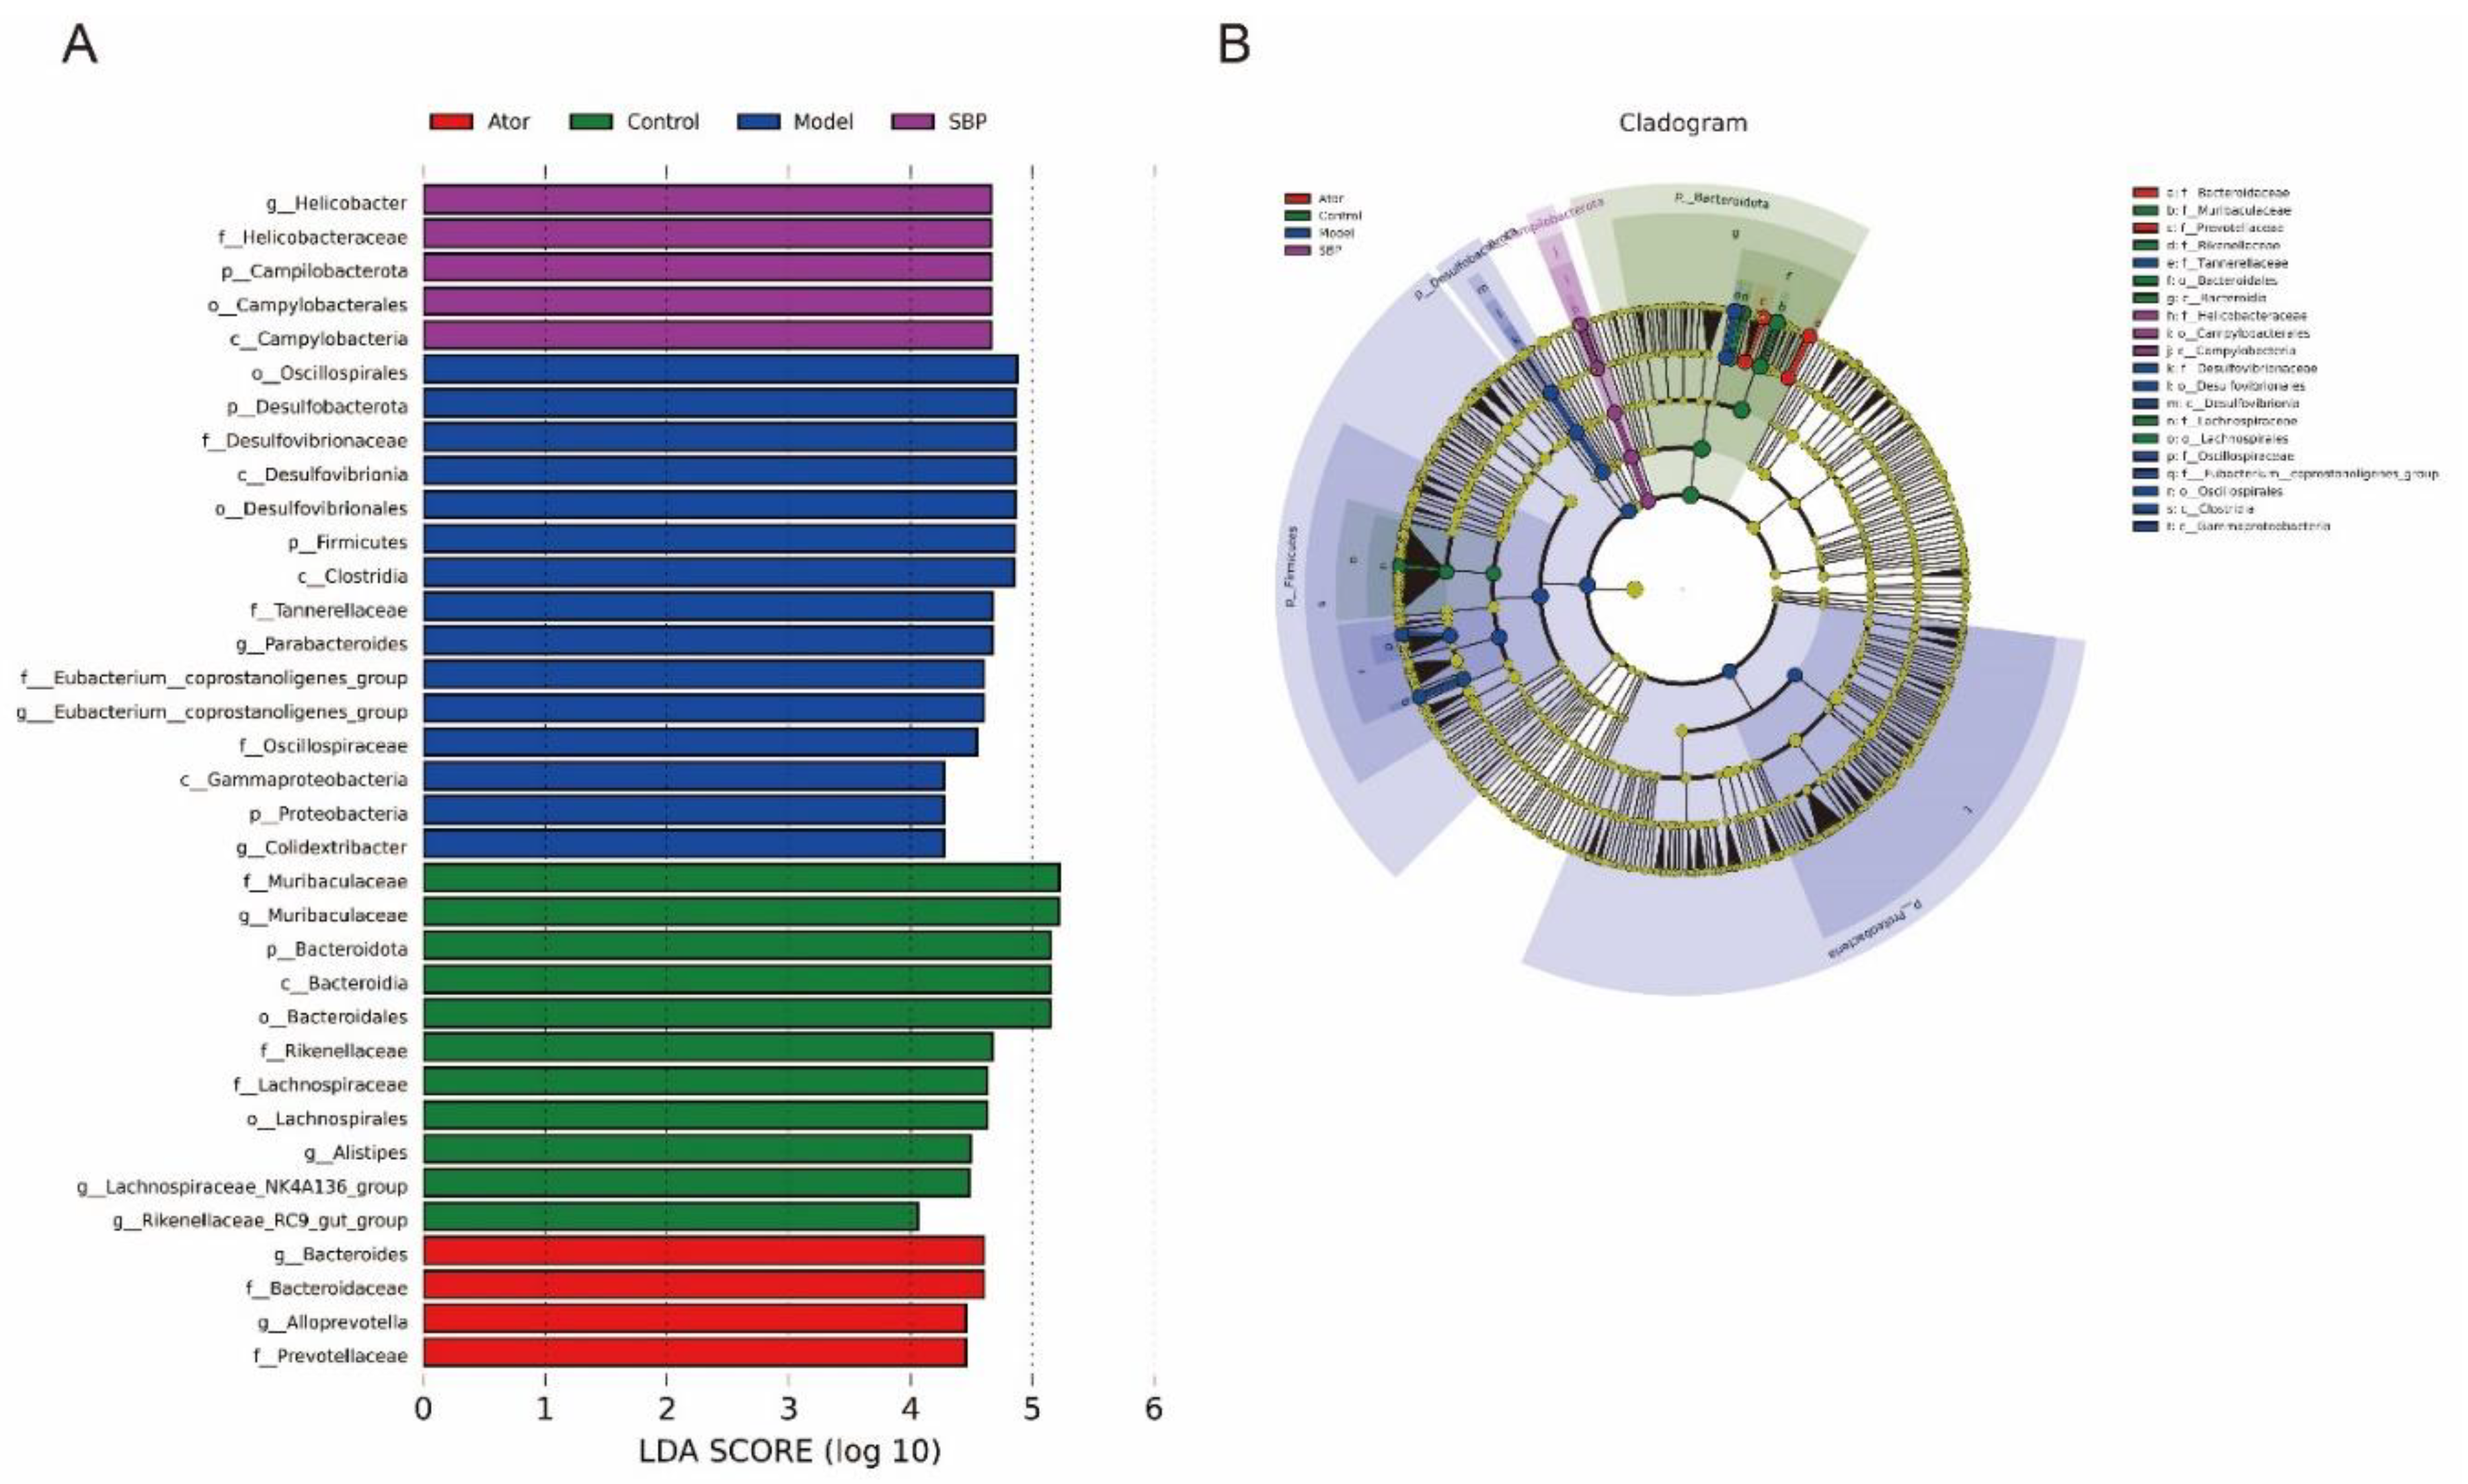
Figure 5.
SBP reshaped the fecal metabolic profiles in ApoE-/- mice (n=6). (A) Two-dimensional PLS-DA score plots in per group. (B) Three-dimensional PLS-DA score plots in per group. (C) OPLS-DA score plot in Model and Control groups. (D) Relative volcano plot in Model and Control groups. (E) OPLS-DA score plot in SBP and Model groups. (F) Relative volcano plot in SBP and Model groups (Control = normal control group; Model = model group; Ator = atorvastatin group; SBP = Shexiang Baoxin Pill group).
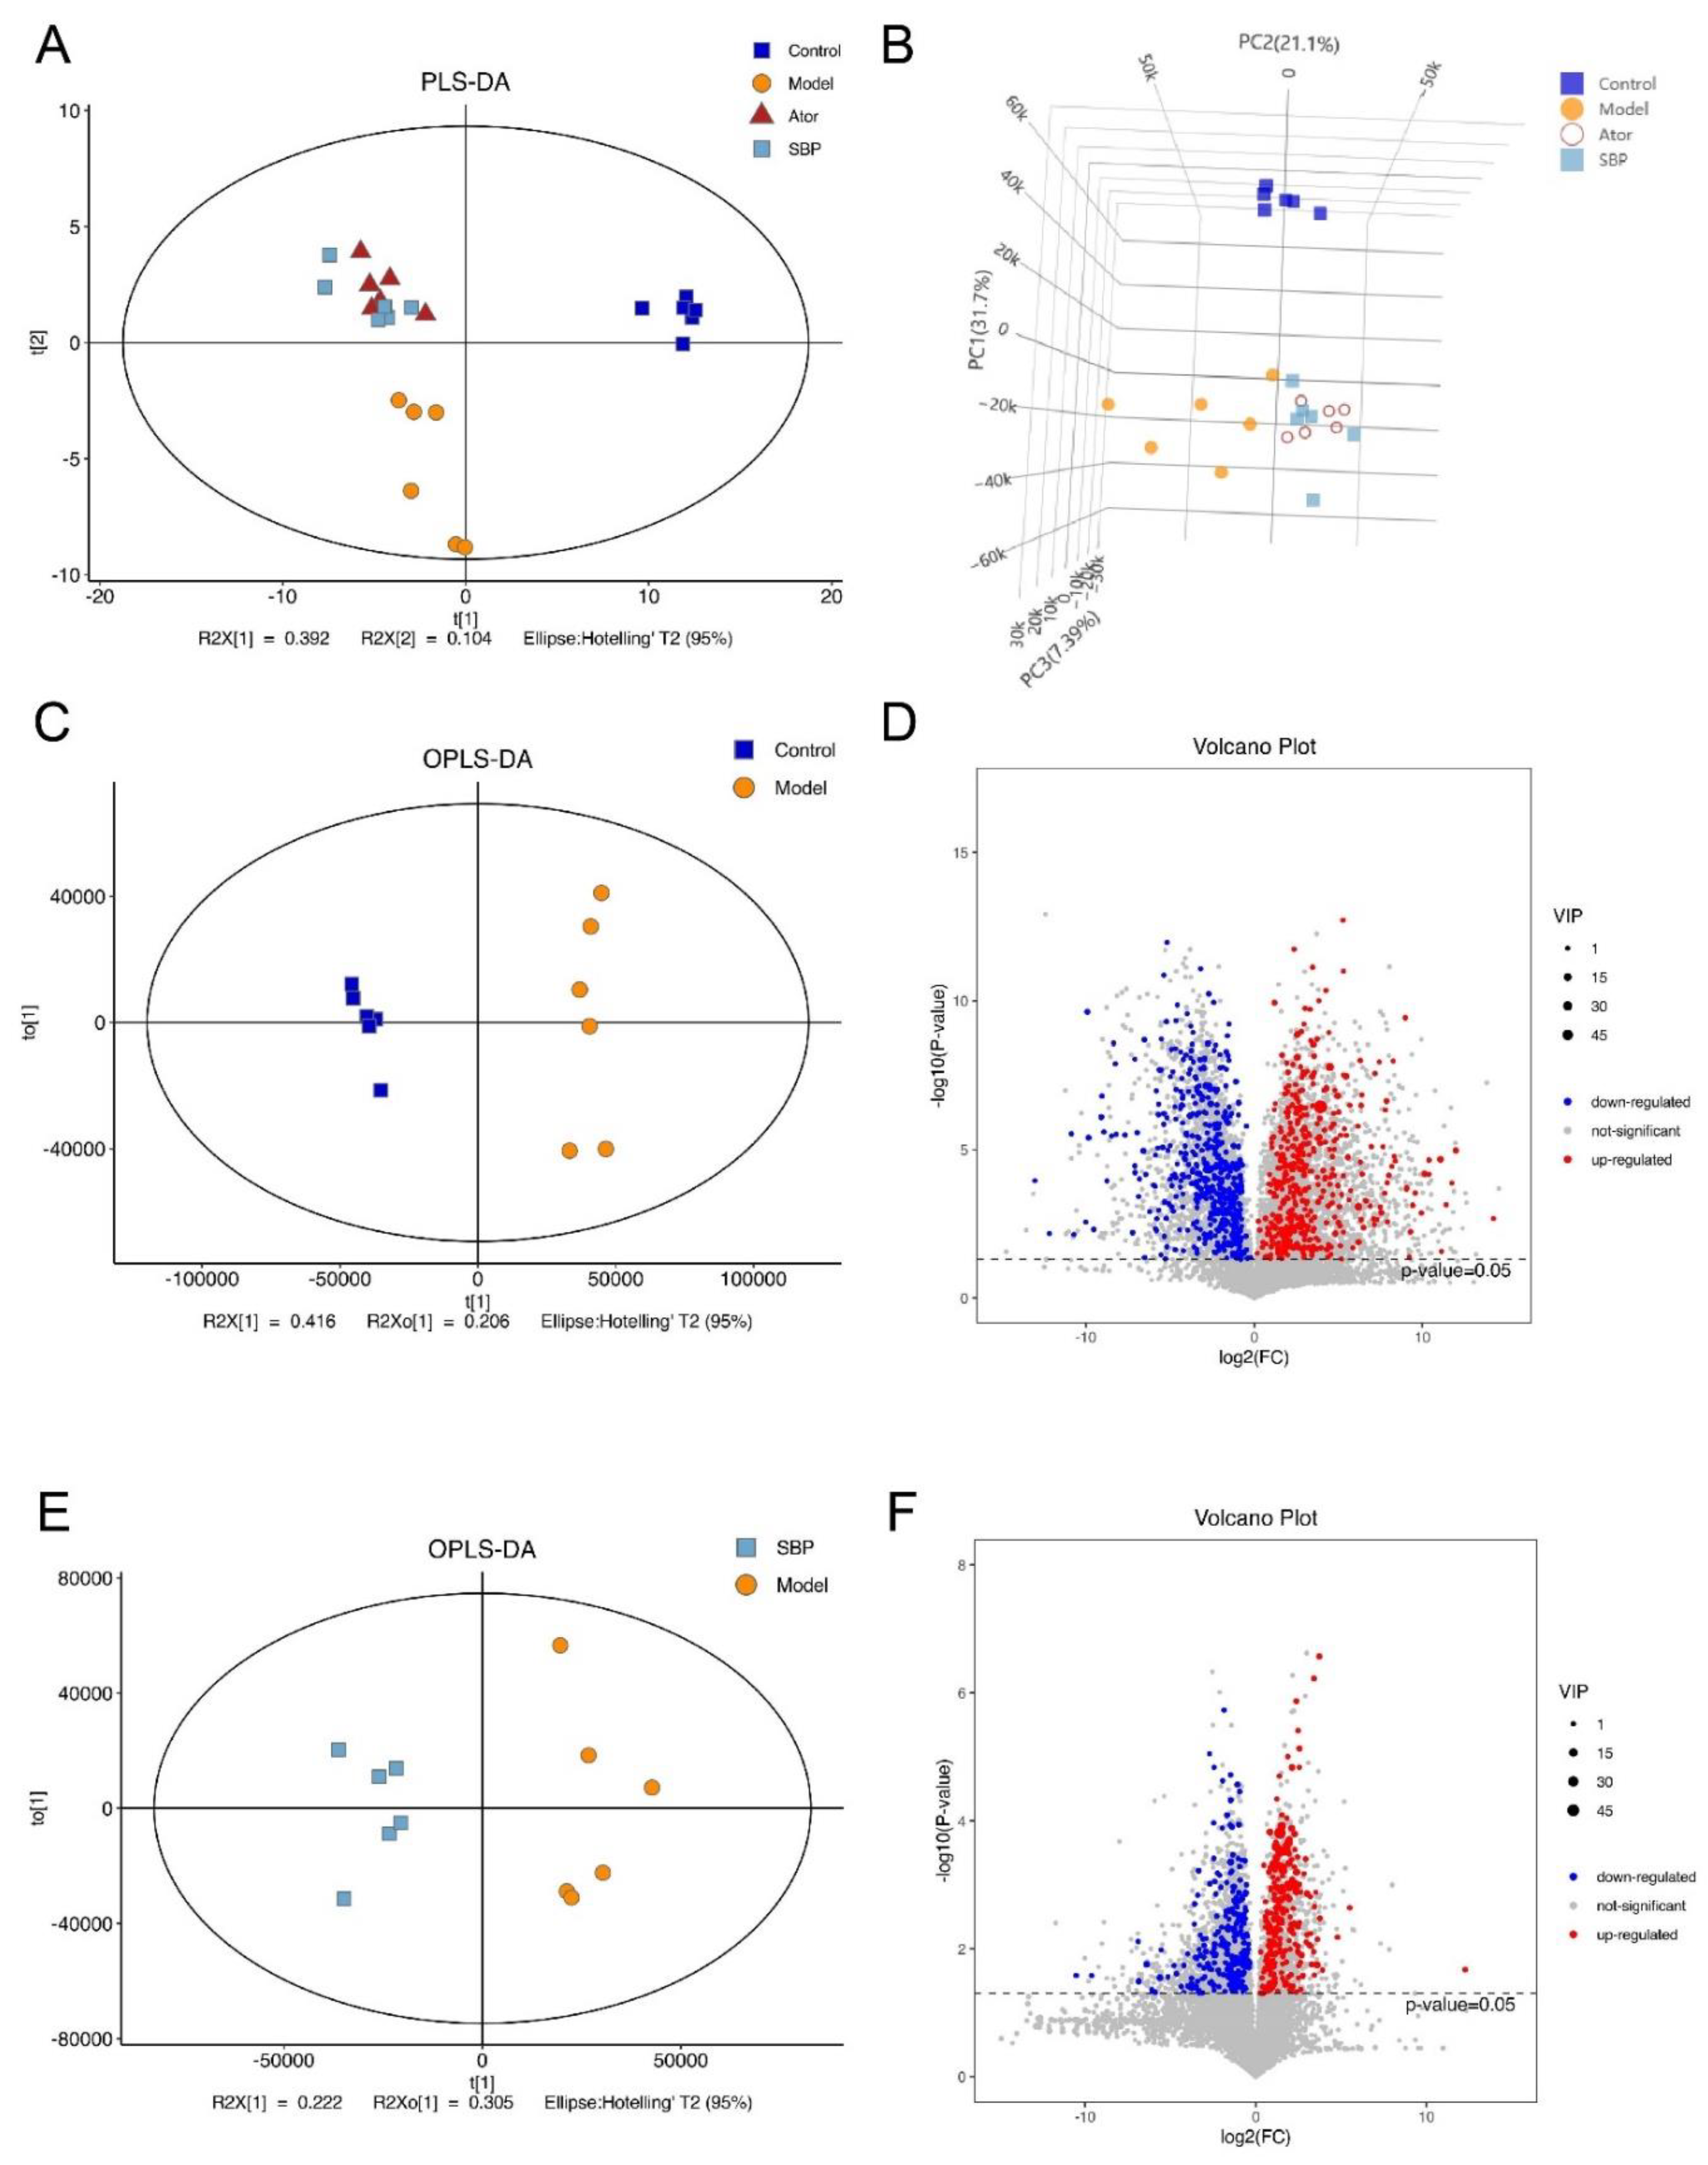
Figure 6.
SBP regulated the metabolic pathways in ApoE-/- mice (n=6). (A) Clustering heatmap of differential metabolites in feces between Model and Control groups. (B) Clustering heatmap of differential metabolites in feces between SBP and Model groups. (C) Scatterplot based on KEGG pathway enrichment analysis between Model and Control groups. (D) Scatterplot based on KEGG pathway enrichment analysis between SBP and Model groups. Rich factor indicates the number of differentially expressed metabolites located in the KEGG/the total number of metabolites located in the KEGG (Control = normal control group; Model = model group; Ator = atorvastatin group; SBP = Shexiang Baoxin Pill group).

Figure 7.
SBP regulated the potential biomarkers in ApoE-/- mice (n=6). (A) Differential metabolites from pathways of alanine, aspartate and glutamate metabolism, regulation of lipolysis in adipocytes, HIF-1 signaling pathway, taurine and hypotaurine metabolism, adrenergic signaling in cardiomyocytes, arginine and proline metabolism. *p < 0.05, **p < 0.01 and ***p < 0.001 vs Control; #p < 0.05, ##p < 0.01 and ###p < 0.001 vs Model (Control = normal control group; Model = model group; Ator = atorvastatin group; SBP = Shexiang Baoxin Pill group).

Figure 8.
Spearman correlation analysis among gut microbiota, differentially expressed fecal metabolites and atherosclerotic parameters. The correlation analysis value was represented by colors of grinds. Red stood for positive correlation and blue for negative correlation. *p < 0.05, **p < 0.01 and ***p < 0.001.

Figure 9.
The associated network diagram based on spearman correlation analysis. (A) The associated network diagram between gut microbes and fecal metabolites. (B) The associated network diagram between fecal metabolites and AS indexes. The network diagram was plotted by the relationship pair of p-value ≤ 0.05. The red line represented the positive correlation and the blue line represented the negative correlation. The thickness of the line represented the strength of the correlation.
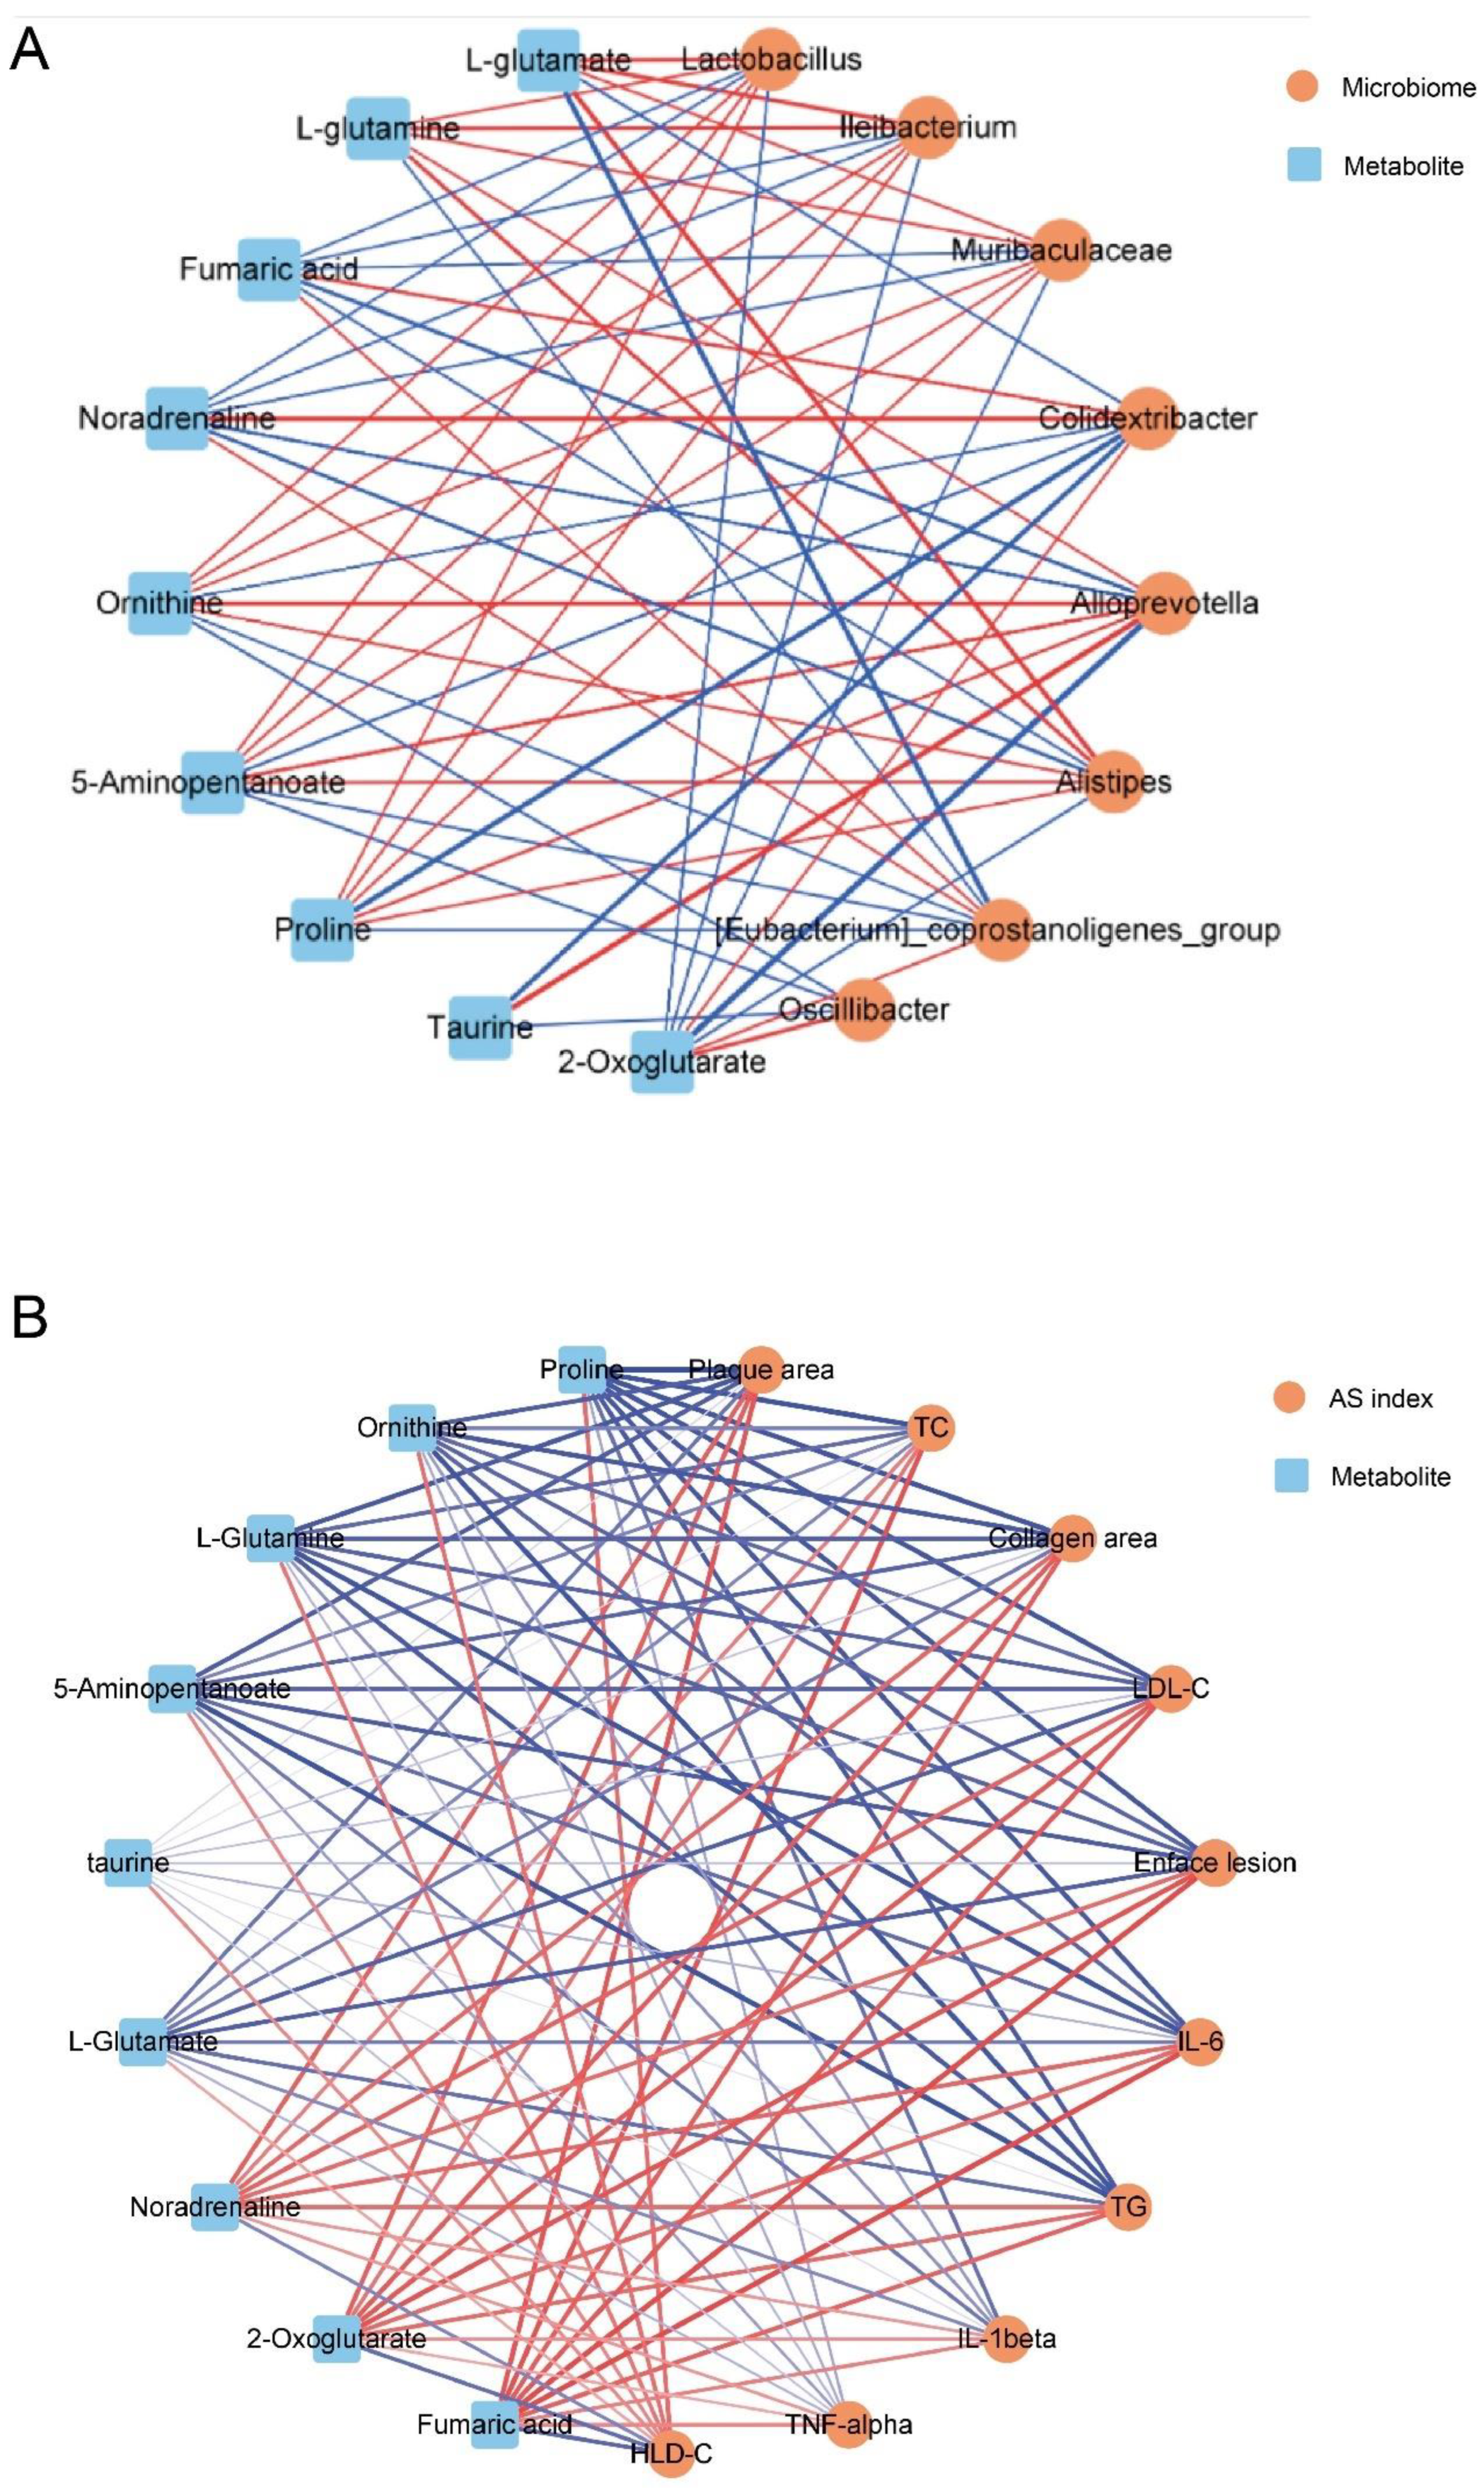

Table 1.
The medicinal materials and bioactive extracts contained in SBP.
| Medicine | Medicinal Materials | Bioactive Extracts |
|---|---|---|
| Shexiang Baoxin Pill | Cinnamomum cassia Presl | Cinnamaldehyde; Cinnamic acid |
| Liquidambar orientalis Mill | Benzyl benzoate | |
| Cinnamomum camphora (L.) Presl | Borneol; Isoborneol | |
| Panax ginseng C.A.Mey | Ginsenosides | |
| Bufo bufo gargarizans Cantor | Cinobufagin; Resibufogenin; Arenobufagin | |
| Moschus berezovskii Flerov | Muscone; Testosterone | |
| Bos taurus domesticus Gmelin | Cholic acid; Deoxycholic acid |
Table 2.
Potential metabolic pathway of SBP to AS.
| NO. | KEGG pathway | Model/Control | SBP/Model | |||
|---|---|---|---|---|---|---|
| Rich Factor | p value | Rich Factor | p value | |||
| 1 | Alanine, aspartate and glutamate metabolism | 0.1786 | 0.003646 | 0.1786 | 0.000352 | |
| 2 | Regulation of lipolysis in adipocytes | 0.2143 | 0.014570 | 0.2143 | 0.003462 | |
| 3 | HIF-1 signaling pathway | 0.2000 | 0.017712 | 0.2000 | 0.004257 | |
| 4 | Taurine and hypotaurine metabolism | 0.1364 | 0.049406 | 0.1364 | 0.004969 | |
| 5 | Adrenergic signaling in cardiomyocytes | 0.3000 | 0.005372 | 0.2000 | 0.020522 | |
Disclaimer/Publisher’s Note: The statements, opinions and data contained in all publications are solely those of the individual author(s) and contributor(s) and not of MDPI and/or the editor(s). MDPI and/or the editor(s) disclaim responsibility for any injury to people or property resulting from any ideas, methods, instructions or products referred to in the content. |
© 2023 by the authors. Licensee MDPI, Basel, Switzerland. This article is an open access article distributed under the terms and conditions of the Creative Commons Attribution (CC BY) license (http://creativecommons.org/licenses/by/4.0/).
Copyright: This open access article is published under a Creative Commons CC BY 4.0 license, which permit the free download, distribution, and reuse, provided that the author and preprint are cited in any reuse.


