Submitted:
06 July 2023
Posted:
07 July 2023
You are already at the latest version
Abstract
Microarray gene expression-based detection and classification of medical conditions have been prominent in research studies over the past few decades. However, extracting relevant data from the high-volume microarray gene expression with inherent nonlinearity and inseparable noise components raises significant challenges during data classification and disease detection. So, this paper proposes a two-level strategy involving feature extraction and selection methods before the classification step. The feature extraction step utilizes Short Term Fourier Transform (STFT), and the feature selection step employs Particle Swarm Optimization (PSO) and Harmonic Search (HS) metaheuristic methods. The classifiers employed are Non-Linear Regression, Gaussian Mixture Model, Softmax Discriminant, Naive Bayes, SVM (Linear), SVM (Polynomial), and SVM (RBF). The two-level extracted relevant features are compared with raw data classification results, including Convolutional Neural Network (CNN) Methodology. Among the methods, STFT with PSO feature selection and SVM (RBF) classifier produced the highest accuracy of 94.47%.
Keywords:
Lung cancer classification
; dimensionality reduction
; feature selection techniques
; STFT
; Particle Swarm Optimization
; Harmonic Search
; Non-Linear Regression
; Mixture Model
; Convolutional Neural Network (CNN) for Lung Cancer
; Microarray gene expression dataset
1. Introduction
Lung cancer remains one of the most significant health concerns worldwide, with high morbidity and mortality rates. It is primarily associated with exposure to tobacco smoke, either through active or passive smoke. However, as mentioned in Dubinet.al. [1], non-smokers may also develop lung cancer due to environmental pollutants, occupational hazards, genetic predisposition, and underlying lung diseases. The risk increases with prolonged exposure to carcinogens, such as asbestos, radon, and certain industrial chemicals. In recent years, there has been increasing emphasis on early detection and intervention of lung cancer. At early stages, the tumour is localized; hence the treatment options are more effective, and the chances of successful intervention and cure are significantly high. Unfortunately as sermonized in Selman et al. [2], lung cancer often remains asymptomatic or presents nonspecific symptoms until it reaches an advanced stage, making early detection challenging.
Various detection methods have been employed to identify lung cancer early. Infante et al. [3], utilized chest X-rays and Computed Tomography (CT) scan imaging techniques to detect suspicious lung nodules, masses, or other abnormalities that may indicate the presence of lung cancer. The Sputum Cytology method used in Thunnissenet al. [4] analyzes the sputum sample for the presence of cancer cells. There are also procedures such as Bronchoscopy studied in Andolfiet al. [5] that allow the collection of lung tissue samples and visualization of the airways using a thin, flexible tube and camera. All the above methods or procedures are conducted in the primary stages after the spread of lung cancer cells in the individual. However, Zhu et al. [6] used method of Microarray-based gene expression analysis to detect lung cancer at its earliest stages, facilitating timely intervention and improving patient outcomes. The microarray analysis compares healthy lung tissue's gene expression profiles with cancerous tissue. The analysis aids the researchers in identifying distinct patterns and signatures associated with different lung cancer types.
1.1. Review of Previous Works
As mentioned, microarray based gene expression analysis is widely used for the detection and classification of various health conditions. A microarray is a tool used in molecular biology to study gene expression. As described by Churchill et al. [7], microarray is a collection of microscopic spots containing DNA molecules representing individual genes. These spots are arranged in a grid pattern on a small glass slide or a silicon chip. Microarray gene expression analysis can investigate changes in gene expression patterns in cancer cells compared to normal cells, as sermonized in Ross et al. [8]. By simultaneously measuring the expression levels of thousands of genes, microarrays can provide a comprehensive view of the changes in cancer cells. Also, as reported by Reis et al. [9], microarray gene expression analysis can be utilized to classify different types of cancer, which can help and guide treatment decisions at early stages.
As indicated in Lapointe et al. [10], different types of cancer have distinct gene expression profiles, which reflect the underlying molecular and genetic changes that drive the disease. In Dwivediet. al. [11], researchers have used microarray analysis to identify gene expression patterns that distinguish between different types of leukaemia, such as acute lymphoblastic leukaemia (ALL) and acute myeloid leukaemia (AML). Similarly, Rody et al. [12] used microarray analysis to distinguish between different breast cancer subtypes, such as estrogen receptor-positive and HER2-positive breast cancer.In Sanchez et al. [13], microarray gene expression analysis is employed to predict the chances of tumour and lung cancer. Kerkentzes et al. [14] classified Adenocarcinoma (Adeno) and Mesothelioma (Meso) lung cancer from microarray genes.Adeno and Meso are considered serious cancer conditions for diverse reasons mentioned in Wagner et al. [15]. Adeno can exhibit rapid tumour growth and potentially spread to other body parts, including distant organs. Meso is extremely aggressive, making the treatment difficult when diagnosed at advanced stages. Both adeno and meso have limited treatment options compared to other forms of lung cancer. Although surgery, chemotherapy, and radiation therapy can be used, these treatments may not always be curative, especially if the cancer has spread all over the body.
Further, these cancer conditions develop resistance to standard cancer treatments due to genetic mutations in tumour cells, limiting the effectiveness of targeted therapies. Above all, the significance of this research investigation is the poor prognosis of adeno and meso conditions compared to other forms of lung cancer. The outcome of this research will help in timely detection, early intervention, and personalized treatment approaches to improve the conditions of cancer-diagnosed individuals. Microarray gene expression analysis-based lung cancer detection offers several advantages over traditional histopathology diagnostic methods as sermonized in Weigelt et al. [16]. Unlike histopathology, gene expression analysis provides molecular insights into the underlying biology of lung cancer, which helps to understand lung cancer subtypes, disease progression, and treatment responses. The molecular information goes beyond the structural or morphological features captured by imaging or histopathology, providing a deeper understanding of the disease. Also, traditional diagnostic methods may only detect lung cancer when it has already reached a more advanced stage. Microarray gene expression analysis also brings up potential biomarkers with higher sensitivity and specificity than traditional diagnostic methods. All these benefits motivate us to use microarray gene expression analysis for early diagnosis of lung cancer.
1.2. Review of Feature extraction techniques
Feature extraction techniques are crucial in acquiring relevant features from microarray gene data. As described in Hiraet al. [17], these methods aim to reduce the dimensionality of the data while retaining important information for subsequent analysis. The high dimensional data is reduced so that it can explain most of the variance in the dataset. The reduced data also contains the essential patterns and relationships between genes, entitling a more manageable and meaningful representation of the data. Feature extraction methods are advantageous in removing noise by extracting the underlying signal or patterns in the data by focusing on the most significant features.
In this paper, we employ Short-Time Fourier Transform (STFT) for analyzing and expressing the microarray gene expression data. The STFT provides a time-frequency representation of the signal, which can capture changes in gene expression over time. The STFT provides information about the temporal localization of signal events, allowing researchers to identify specific time points or intervals where gene expression changes occur as mentioned in Qi et al. [18]. This representation can also reveal temporal patterns and relationships between genes, allowing for the identification of dynamic gene expression changes associated with specific conditions or biological processes. The STFT can also extract frequency-domain features from gene expression data. These features provide additional information about the distribution or characteristics of gene expression patterns that help to improve classification accuracy. Also, STFT identifies specific frequency bands representing relevant genes associated with biological processes and disease conditions.
1.3. Review of Feature selection techniques
After feature extraction, feature selection methods further improve lung cancer classification from microarray gene expression data. As described in Abdelwahab et al. [19], these methods help identify a subset of relevant genes that are informative for distinguishing between different lung cancer types. In this paper, we employ Metaheuristic feature selection methods namely Particle Swarm Optimization (PSO) and Harmonic Search (HS) for selecting this subset of genes most discriminatory for lung cancer classification. As elaborated in Shukla et al. [20], by focusing on the most discriminative genes, these metaheuristic methods can reduce the risk of overfitting and improve the generalization capability of the classifier, leading to better performance. Also, this is extremely useful for classifying the LH2 dataset, as the number of samples is limited. Metaheuristic feature selection methods can also handle correlations and dependencies between genes to remove redundant genes while maximizing their relevance to lung cancer classification. Overall, the metaheuristic feature selection methods identify a biologically relevant gene subset and can give insights into the underlying biological processes associated with lung cancer. But, the choice of metaheuristic algorithm for the feature selection method plays a vital role in selecting the relevant genes from the dataset. So it is important to evaluate different metaheuristic methods and consider their performance, computational complexity, and suitability for the specific problem.
1.4. Review of CNN Methodology
Apart from machine learning classifiers, Convolutional Neural Networks (CNNs) may make a significant difference in the classification of lung cancer from microarray gene expression data. Without manual feature extraction and selection methods, CNNs can automatically learn relevant features from raw input data. In the context of gene expression data, CNNs can extract meaningful patterns and relationships between genes. This methodology allows CNN to capture complex interactions that may be difficult to discern manually. For gene expression data, genes can be considered spatial entities, and their expressions across samples can be treated as spatial patterns. Here, CNNs excel at learning hierarchical representations, starting from low-level gene expression features and gradually building up to higher-level features that capture more abstract characteristics. Also, CNNs can identify gene expression patterns relevant to lung cancer, even if they occur in different regions or orders within the microarray.CNNs employ parameter optimisation and deduce conclusions better from limited training data like microarray gene expression datasets.Further, CNNs are robust to inherent noise, variability, and batch effects variations. CNNs can learn to identify important patterns despite these variations, making them suitable for analysing microarray gene expression datasets. Also, CNNs models inherently form non-linear relationships between features crucial for capturing the complex and non-linear interactions within gene expression data. So we also use experiment on employing CNN methodology to classify lung cancer from microarray gene expression data. The overall methodologies for dimensionality reduction and classification of Microarray gene expression data for lung cancer employed in this paper is shown in Figure 1.
Despite the numerous benefits of using CNNs for classifying lung cancer from microarray gene expression data, they also have certain limitations.Even though CNNs are good at learning features, it is often challenging to interpret the physical significance behind the prediction and classification of gene expression patterns from the learned features due to their black-box nature. Further, CNNs are usually prone to overfitting due to the limited dataset availability; hence, it is important to carefully tune and select the parameters in the CNN model. The feature extraction and selection methods can solve the overfitting problem to a certain extent in CNN models. However, these stages also add computational complexity to CNN networks' inherent complexity. For the microarray gene expression dataset used in this paper (Lung Harvard 2 Data Set), the imbalanced class distributions in the lung cancer dataset can pose challenges. Due to class imbalance, CNNs may tend to bias towards the adeno class, leading to lower accuracy for the meso class. The performance of CNN can be improved by carefully choosing tuning parameters like learning rate, network architecture, and regularization strength. Also, suitable classifiers are integrated into the softmax layer to improve classification performance in CNN.
1.5. Description of the Data set
In this research, we have utilised using Lung Harvard 2 (LH2) medical imaging dataset [21]. This dataset contains translated microarray data of patient samples affected by Adenocarcinoma (Adeno) and Mesothelioma (Meso). The gene expression ratio technique is the translation technique used in the dataset for a simpler representation. The technique can accurately differentiate between genetically disparate and normal tissues based on thresholds. The dataset contains a total of 150 Adeno and 31 Meso tissue samples. The 12533x 1 genes characterize each of the subject. The final row of the dataset is used for labelling Adenocarcinoma and malignant Mesothelioma samples. This microarray gene expression dataset is widely used for early and authentic diagnosis of lung cancer classification.
1.6. Relevance of this research
As mentioned earlier, lung cancer detection from microarray gene data helps to diagnose cancer at an earlier stage, which is crucial as the treatment options are limited in advanced stages. Thus early detection can significantly improve patient outcomes and survival rates. In this paper, we perform the lung cancer classification of adeno and meso cancer from the LH2 dataset. The dataset is of high volume and contains inherent non-linearity and class imbalance. Therefore it is important to adopt suitable preprocessing and classification methods to enhance the classification performance. Thus learning on microarray gene data analysis enables the identification of potential biomarkers associated with lung cancer to help in diagnosis, prognosis, and monitoring treatment response.
2. Methodology
In this research, a two-level strategy is adopted to improve the overall efficiency of the classifiers. First, feature extraction is performed using STFT to solve the curse of dimensionality problem. The dimension of the dataset is reduced to leverage the computational overhead of the classifier. Further, the second step involves selecting features from PSO and HS metaheuristic algorithms. The feature selection step further improves the classification methodology by selecting relevant features and patterns and reducing the risk of overfitting and underfitting.
2.1. Feature Extraction using STFT
The Short-Time Fourier Transform (STFT) is a frequency domain analysis of the information over a short period. The STFT, when applied to microarray gene data, can reduce the data dimension by extracting relevant and useful features. Gupta et al. [22] have performed QRS Complex Detection Using STFT. The authors have identified that STFT is useful in providing a time-frequency representation of the data, which helps researchers investigate how gene expression levels change over time and across different frequency components. Identifying specific time intervals where certain frequency components are prominent is possible with STFT, giving a localized representation of frequency content over time. For microarray gene expression analysis, this feature of STFT is useful in identifying genes that exhibit temporal patterns active during specific time intervals. Moreover, STFT reduces dimensionality by extracting the important genes or gene clusters associated with specific frequency components. The dimensionality of the microarray gene expression dataset is reduced to 2049 x 150 and 2049 x 31 for adeno and meso subjects respectively. For performing STFT, the Blackman window that minimizes spectral leakage is used as the windowing function.Thus, STFT can provide biological insights by finding the frequency patterns and fundamental relationships in the dataset.For the input data x[n] of length N, STFT with a window w[n] having length M is given as:
Where n=0, 1, 2… N-1, and m=0, 1, 2… M-1
The Blackman window is given by the expression
Next, section is an analysis on the various statistical parameters associated with STFT dimensionality reduction.
2.2. Statistical Analysis on STFT
After the dimensionality reduction methods on Microarray genes and the resultant outputs are analyzed by the statistical parameters such as mean, variance, skewness, kurtosis, Pearson correlation coefficient (PCC), f-test, T-test, p-value, and CCA to identify whether the outcomes are representing the underlying microarray genes properties in the reduced subspace. Table 1 shows the statistical features analysis for three types of Dimensionally Reduced Adeno carcinoma and Meso Cancer Cases of microarray genes. As mentioned in Table 1, the Hilbert Transform and DFA-based DR methods display higher mean values and variance among the classes. But the least square Linear Regression DR method depicts low mean and variance parameters, indicating a class part of variables within the cancer classes. All three types of DR methods show positive skewness values and flat kurtosis values. PCC values indicate the high correlation within the class of attained outputs. The F-test, T-test and p-value exhibit no significant nature of the dimensionally reduced outputs of the microarray gene. This subsequently indicates that the values are associated with non-Gaussian and nonlinear ones. The histogram, Normal probability plots, and Scatter plots of DR techniques output further examine the same. Canonical correlation Analysis (CCA) visualizes the correlation of DR methods outcomes among the Adeno carcinoma and Meso cancer cases. The low CCA values in Table 1 indicate that the DR outcomes are less correlated among the two cancer classes.
Figure 2 explores the Scatter plot for the STFT-based Dimensionality Reduction Method in Meso and Adeno carcinoma Cancer Classes. The plot shows the clustered, nonlinear, overlapped outliers and non-Gaussian nature of the STFT DR method among the two cancer classes.
2.3. Feature selection using Metaheuristic Algorithms
As described before Dimensionality reduction step reduces the computational complexity and removes noise in the data. The feature selection step further reduces the number of features after the dimensionality reduction step making subsequent computations faster and more efficient. Also feature selection step acts as one more noise filter stage that captures only the relevant features that contribute to the underlying structure of the data. The feature selection step reveals the relevant features from the dimensionally reduced data. This subset of the significant features is the most informative one that holds the gene patterns and functionality to develop a simpler model.The feature selection using metaheuristic algorithms helps to overcome the problems of computationally expensive and noise-hidden datasets by employing efficient search strategies. The algorithms, namely PSO (Particle Swarm Optimization) and Harmony Search (HS), are known for effectively handling high dimensional and complex datasets like microarray gene datasets. Metaheuristic Algorithm reduces themicroarray gene expression datasets considering the original number of samples and the required number of genes. The reduced dataset contains complex relationships between genes and their associations with biological processes. Metaheuristic algorithms evaluate the collective behaviour of the population to arrive at optimal feature subsets. The optimal feature subset assists the subsequent stages, like disease classification.
PSO is an optimization algorithm inspired by the food search and social behaviour of a flock of birds. When applied in the feature selection step, the PSO explores and refines the population by moving through the entire search space, balancing exploration and exploitation. Over the iterations, PSO gradually refines the solution space towards the global optimum. The implementation of PSO is simple and efficient as it involves fewer control parameters than other metaheuristic algorithms. Therefore PSO converges relatively fast, making it computationally efficient for feature selection from large datasets like microarray gene expression datasets. The HS, on the other hand, is inspired by the process of improvisation in music. The generation of harmonious musical notes represents potential solutions. The HS employs a unique approach to enhance the search space exploration by dodging local optima. The HS incorporates adaptive parameters that dynamically change during the search process. This behaviour is useful because HS can easily adapt to the characteristics of the microarray gene expression dataset. The HS is also robust to noise and non-linearities in data, making it a suitable method for feature selection from microarray datasets. So based on the peculiar characteristics possessed by PSO and HS, these algorithms are used as the feature selection step in this research to understand gene interactions, capture complex relationships, balance exploration and exploitation, and thus identify the most relevant genes.Both objective and fitness functions in the PSO problem are to minimize the Mean Square Error (MSE) of the training process.The relevant features selected after the metaheuristic method will further reduce the dimensionality of the STFT feature extracted values to 2049 x 30 and 2049 x 6 for adeno and meso cancer subjects, respectively.
The normal probability plot for the STFT DR method followed by the PSO feature Selection technique for Adeno carcinoma Cancer Classes is shown in Figure 3. It is also observed from the Figure 3 that the PSO feature selection turned around the STFT features into a clustered one with a sigmoid structure having a mean value of 2.56. The normal plot also implies that the PSO features are non-Gaussian and exhibit minimum segregation.
The normal probability plot for the STFT DR method followed by the PSO feature Selection technique for Meso carcinoma Cancer Classes is shown in Figure 4. It is also observed from Figure 4 that the PSO feature selection clustered the STFT features around its mean value of 2.47. The normal plot also looks like a sigmoid structure. The normal plot also implies that the PSO features are non-Gaussian and exhibit minimum segregation.
Figure 5 displays the histogram of the STFT DR method followed by Harmonic Search Feature selection techniques for Adeno Carcinoma Cancer classes. The histogram also depicts harmonic search features with outliers, wide gaps, down trends and non-Gaussian nature.
Figure 6 exhibits the histogram of the STFT DR method followed by Harmonic Search Feature selection techniques for Meso Carcinoma Cancer classes. The histogram also displays harmonic search features with outliers, wide gaps, skewed, and non-Gaussian nature.
Friedman test is one type of statistical test which tests the stationarity and two-way analysis of variance.It is an extension of the sign test for matched pairs and is used when the data arise from more than two related samples. It is applied to determine whether any dependent variable significantly affects the feature selection method. It is employed in this research as a measuring tool to compare the performance of feature selection algorithms on the same dataset and assess their relative performance. So the Friedman test helps to identify the most effective method among the evaluated set. Since it is a non-parametric test, it is particularly useful when data has heterogeneity or is not following a normal distribution. The Friedman test also provides a statistical measure to determine whether the observed differences in performance are significant. Overall, the test is useful in deciding the relative efficacy of the feature selection techniques. At first, suitable parameters attained from the Friedman test are decided, and performance is evaluated multiple times to account for variability. After that, methods are ranked such that the best method receives a rank of 1, the second best receives a rank of 2, and so on. Consecutively average rank is also calculated. Finally, the Friedman statistic is computed using the following expression.
Here, k represents the number of feature selection methods, n denotes the number of repetitions, and R indicates the average rank of each method. This research measures the efficacy of feature selection methods, namely PSO and HS, on STFT data. The parameters from the Friedman test are X2r statistic, p-value, and its significance for p <0.01, confidence level.
3. Classification using Machine Learning Techniques
This research employs various machine learning classifiers for lung cancer classification. The choice of the classifier is very significant in the classification methodology. Martín et al. [23] employed a nonlinear regression classifier for heterogeneous and highly nonlinear datasets related to the manufacturing process. For this research problem, such a classifier can capture complex nonlinear dependencies between gene expression levels and class labels is suitable. Linear classifiers cannot effectively capture these complex patterns and nonlinear decision boundaries. Also, as discussed in Dalatu et al. [24], Nonlinear regression models can be more robust to outliers than linear classifiers. Ficklin et al. [25] have utilised Gaussian Mixture Models (GMMs) for the classification of microarray gene data for various cancer types, namelylower-grade glioma, thyroid, glioblastoma, ovarian, and bladder cancer.Since GMMs are probabilistic models, they can work effectively on microarray gene expression datasets that are combinations of multi-modal distributions. The GMMs can capture complex data distributions by representing them as a combination of Gaussian components. Further, each Gaussian component in the mixture model can represent a different class, and the combination of these components enables the modelling of nonlinear decision boundaries that can be particularly useful when large amounts of samples overlap among the classes.Shah et al. [26] used the softmax discriminant classifier for lung classification from microarray gene expression. The classifier works on estimating probability for each class, and it produces a probability distribution over all possible classes. This property is useful and suitable for multi-class classification problems, such as microarray gene expression data. The softmax discriminant classifier is also computationally efficient as it incorporates regularisation techniques to prevent overfitting and improve generalisation. Ahmed et al. [27] used Naive Bayesian Classifier (NBC) to classify head and neck cancer from microarray gene expression data. NBCs are based on probabilistic principles, specifically Bayes' theorem. The classifier computes the probabilities of diverse classes based on the feature values and allocates the class label with the highest probability. NBC framework also facilitates the integration of prior knowledge or expert beliefs through prior probabilities. Moreover, NBCs are computationally efficient, making them particularly suitable for large-volume and sparse data sets like microarray gene expression datasets. Vanitha et al. [28] used a Support Vector Machine (SVM) for gene expression-based data classification. SVM classifiers work on Vapnik's statistical learning theory and thus handle the curse of dimensionality problem by finding the optimal hyperplanes in high-dimensional feature space. This process maximises the margin between classes and provides robustness to outliers. In SVM, the mapping of higher dimensional feature space is achieved through the kernel trick. SVMs often yield sparse solutions and select the most informative genes contributing to the classification task. The sparse solution reduces the computational burden and improves generalisation and classification accuracy. All the above features of SVM make it a suitable classifier for microarray gene expression datasets.The following sections discuss the classification methodology of each classifier mentioned above.
3.1. Nonlinear Regression (NLR)
The nonlinear regression classification is another variant of the linear regression classifier that associates variables in the form of y = mx + c. Unlike linear regression models, nonlinear regression models associate variables by randomly changing the variable y. NLR strives to minimise the MSE of the individual observations in the dataset. The data points are adapted to a nonlinear function through multiple iterations for building a classifier model. The Euclidean distance is initially calculated from the dataset's target and input data through the following expression as in Dai et.al. [29]
Here T represents target data, and X represents input data. The Euclidean distance is then projected to a three-dimensional space using the following cuboid equation:
Minimize: z=k1 × y +k22 × y2 +k33 × y3
Later the minimum value of the three-dimensional space, f = min (z) is computed
The classification problem is now framed with the help of function ‘f’ and d0 as follows:
g = f + d0
The d0is the sum ofthe squares of mean deviation values. Since the calculation of d0 involves least squares method, the methodology employed here may be also called as a least square based NLR.
3.2. Gaussian Mixture Model
The Gaussian Mixture Model (GMM) is a probabilistic model for classification and clustering tasks. The model considers that the data points are generated from a mixture of Gaussian distributions. The probability Density Function (PDF) of the Gaussian distribution having mean μ and covariance Ԑ is given by Ge et.al [30].
Where x is the data point, n hold the dimensionality of the data, and T indicates the transpose operation.The GMM assumes that the observed data is generated from a mixture of K Gaussian distributions. The posterior probability of thekth Gaussian component with mixing coefficient πk is given by:
µk and Ԑk are the covariance matrix and mean vector for the kth component with k as total number of components in the mixture.In the next step, the parameters of the GMM, including the mixing coefficients, means, and covariances, will be estimated using the Maximum Likelihood Estimation (MLE) technique.In the next step, the parameters of the GMM, including the mixing coefficients, means, and covariances, will be estimated using the Maximum Likelihood Estimation (MLE) technique. The MLE estimation for the GMM is defined as the log-likelihood of the observed data.
Where θ represents the set of all parameters of the GMM and N is the total number of observed data points.In the next step, the expectation minimization is performed through an iterative approach by computing posterior probabilities for each data point and updating parameters θ by maximizing the log-likelihood, considering the computed posterior probabilities.
3.3. Softmax Discriminant Classifier
Softmax discriminant classifier uses the Softmax function to transform the discriminant scores into class probabilities. At first, in SDC, the discriminant scores are calculated by taking the dot product between the feature vector x and the weight vector wk for each class k, along with the bias term bk. Mathematically, the discriminant score zk for class k is given by Hastie et al. [31]
For the discriminant scores z = [z1, z2... zK] for K classes, the softmax function calculates the probability of the input x belonging to class k using the following expression
The loss function measures the discrepancy between the predicted class probabilities and the true class labels. The typically used loss function for softmax discriminant classification is the cross-entropy loss. For the training dataset with N samples, the cross-entropy loss ‘L’ is defined as
Where N is the number of samples in the training dataset, yk(i) is the true label for sample i, which is 1 if the sample belongs to class k and 0 otherwise, and is the predicted probability of class k for sample i. Finally, the weight vector and bias term are updated using gradient descent optimization method with learning rateα as follows.
3.4. Naive Bayesian Classifier (NBC)
The Naive Bayesian classifier (NBC) is efficient and straightforward and works on Bayes principles. NBC is a probabilistic classification algorithm based on the Bayes theorem and feature independence assumption. First, NBC calculates the posterior probability of a class using the prior probability and likelihood. For a given class C and features x1, x2… xn, posterior probability is expressed as Berrar [32].
For the class C, represents the prior probability, is the likelihood, and is the evidence probability.
In Naive Bayes approach is that the features are conditionally independent for the class. This assumption that simplifies the calculation of the likelihood can be expressed as
Where is the probability of feature of the class C.Theis estimated from the fraction of class C training examples with the feature value. Then the prior probability can be estimated as the fraction of training examples belonging to class C.Finally, to predict the class label for the features, the algorithm calculates the posterior probability for each class and assigns the instance to the class with the highest probability.
3.5. Support Vector Machine Classifier (Linear)
In machine learning, Support Vector Machine (SVM) is a robust learning algorithm used for analysing and classifying data.SVM with linear kernel model is the type of SVM that can solve linear problems by creating a line or hyperplane which separates the data into classes. The data that reside close to the hyperplane is considered the support vector. The expression for the hyperplane used in the binary classification problem can be written as Zhang et al. [33].
Here f(x) is the objective function with x as the feature vector, w as the weight vector perpendicular to the hyper plane and b as the bias term, determining the offset of the hyper plane from the origin.SVM aims to find the hyperplane that maximizes the margin. The optimization problem for SVM linear classification withmargin is given by:
Here represents the class label (+1 or -1) for the training example with feature vectorFrom the above primal optimization problem, the dual optimization problem is derived by finding the Lagrange multipliers or dual variables for each training example. The dual problem reduces computational burden using optimal Lagrange multipliers. Thus the SVMclassification with the decision function is expressed as
If is positive, the instance is assigned to one class, and if it is negative, it is assigned to the other class.
3.6. Support Vector Machine Classifier (Polynomial)
SVM with a polynomial kernel is a variant of SVM that allows for non-linear classification by mapping the input features into a higher-dimensional space using a polynomial function. The polynomial kernel function calculates the dot product between the mapped feature vectors in the higher-dimensional space. The polynomial kernel function with x and z are pair of feature vectors is given by Zhang et al. [33].
Where γ is the coefficient scaling the dot product, r is the coefficient representing the independent term, and d is the degree of the polynomial.Further, the decision function in SVM polynomial classification is defined as the linear combination of the kernel evaluations between the support vectors and the input feature vector with the bias term. The decision function . is given by:
Based on value, the class assignment is done in a similar way as performed in SVM (Linear) classifier.
3.7. Support Vector Machine Classifier (RBF)
The Radial Basis Function (RBF) can also be used as a kernel while using SVM classifier. Here, non-linear mapping of the input features into a higher-dimensional space is performed using an RBF.The RBF kernel . that is used to compute the similarity between feature vectors in the input space is expressed as Zhang et al. [33].
Where |x - z| is the Euclidean distance between x and z with σ as the kernel width parameter that controls the influence of each training sample.As computed before, the decision function for SVM RBF classification is also defined as a linear combination of the kernel evaluations between the support vectors and the input feature vector with the bias term. The decision function
for SVM RBF is given by:
Based on value, the class assignment is done in a similar way as performed in SVM linear and polynomial classifiers.
3.8. Selection of target
This research involves a binary classification, and hence two targets and for adeno and meso classification and mapping constraints must be selected.The target and mapping constraints are selected based on the distribution of classes in the dataset and the class imbalance problems involved in the microarray gene expression dataset. The target value, is having the following constraint. For N number of features, with as the average of input feature vector, the mapping constraint is framed as:
must have a target value greater than and the average of input feature vectors for meso case. The target value ∈[0,1], for meso case with M number of features, the mapping constraint is framed as
Also, the difference between the target values must follow the following constraint:
Thus, following all the above mentioned constraints, the targets,and for Adeno, andMeso output classes are chosen as 0.95, and 0.1, respectively. The performance of classifiers is will be evaluated based on the Mean Squared Error (MSE).
3.9. Training and Testing of Classifiers
The training data for the dataset is limited. So, we perform k-fold cross-validation. K-fold cross-validation is a popular method for estimating the performance of a machine-learning model. The process performed by Fushiki et al. [34] for k-fold cross-validation is as follows. The first step is to divide the dataset into k equally sized subsets (or "folds"). For each fold, i, train the model on all the data except the i-th fold and test the model on the i-th fold. The process is repeated for all k folds so that each is used once for testing. At the end of the process, you will have k performance estimates (one for each fold). Now, calculate the average of the k performance estimates to get an overall estimate of the model's performance. Once the model has been trained and validated using k-fold cross-validation, you can retrain it on the full dataset and predict new, unseen data. The advantage of k-fold cross-validation is that it provides a more reliable estimate of a model's performance than a simple train-test split, as it uses all the available data. In this paper, the k-value is chosen as 10-fold.This research used a value of 2049 dimensionally reduced features per patient. This research is associated with 150 patients of Adenocarcinoma and 31 Meso cancer patients with multi trail training of classifiers required. The use of cross-validation removes any dependence on the choice of pattern for the test set. The training process is controlled by monitoring the Mean Square Error (MSE), which is defined by Wang et al. [46] as,
Where Oj is the observed value at time j, Tj is the target value at model j;j=1and 2, and N is the total number of observations per epoch. In our case, it is 2049. The MSE value reached 1.0 E-10 within 1000 iterations as the training progressed.
In the case of lung cancer detection, the following terms can be defined:
True Positive (TP): A patient correctly identifies as having Adeno Carcinoma lung cancer.
True Negative (TN): A patient is correctly identified as having Meso cancer.
False Positive (FP): A patient is incorrectly identified as having Adeno Carcinoma lung cancer when they have Meso carcinoma cancer disease.
False Negative (FN): A patient is incorrectly identified as having Meso Carcinoma lung cancer when they do have the Adeno carcinoma Cancer disease.
Table 4 explores the training and testing MSE performance of the classifiers without and with feature selection (PSO and Harmonic Search) Methods for STFT Dimensionality reduction techniques. The training MSE always varies between 10E-07 to 10E-09, while the testing MSE varies from 10E-05 to 10E-08. GMM classifier without feature selection method settled at minimum training and Testing MSE of 3.6E-08 and 7.21E-07, respectively. PSO Feature Selection method SVM (RBF) Classifier scores minimum training and Testing MSE of 2.25E-09 and 3.6E-08, correspondingly. Like the Harmonic Search feature Selection method, the SVM (RBF) classifier once again attained minimum Training and Testing MSE of 2.56E-08 and 1.96E-07, respectively. The Minimum testing MSE is one of the indicators towards the attainment of better classifier performance. As shown in Table 4, the higher the value of testing MSE leads to the poorer performance of the classifier, irrespective of the feature selection methods.
4. Classification using CNN Methods
Convolutional Neural Networks (CNNs) are a deep learning model commonly used for image classification tasks.The CNN classification methodology adopted in this research is depicted in Figure 7. The CNN architecture employed in this research consists of a convolutional layer, a fully connected layer and a softmax layer. The convolutional layer is the building block of CNN that performs a convolution operation on the input data using a set of learnable filters.The convolutional layer consists of a convolutional 2D layer, Batch Normalization Layer, ReLU layer, and Max Pooling 2D layer.The classification methodology in CNNs involves stacking these layers in a sequential manner. Combining these layers and training the network, CNNs can effectively learn and classify complex patterns in image data.
In the convolutional 2D layer, the convolution operation is performed between the filter and local patches of the 12533 x 181 input data. This stage produces feature maps and patterns that help to improve the stability and convergence of the network during training. Next, the batch normalization layer normalizes the mean and variance of the input by utilizing mini-batches of training data from the Max Pooling 2D layer.The Batch Normalization Layer helps in reducing internal covariate shift and allows the network to learn more efficiently. The ReLU Layer applies the Rectified Linear Unit (ReLU) activation function element-wise to the Batch Normalization layer's output. The ReLU function sets negative values to zero and keeps positive values unchanged. This step is a crucial process that introduces non-linearity into the network, enabling CNN to learn complex and non-linear relationships in the dataset. The final step in the convolutional layer is a 2 x 2 Max Pooling 2D layer, which reduces the feature maps' spatial dimensions while retaining the most prominent features. Max Pooling 2D layer divides the input into non-overlapping regions and only keeps the maximum value from each region. Thus, Max pooling helps in reducing computational complexity and controlling the overfitting problem. Likewise, in this research, we employed three convolutional layers with filter sizes 16, 32 and 64.
The convolutional layers learn local image features, while the pooling layers reduce spatial dimensions. Batch normalization and ReLU layers help in normalization and non-linearity, respectively. The fully connected layers capture high-level representations, and the softmax layer produces class probabilities for classification.By combining these layers and training the network using techniques like back propagation and optimization algorithms, CNNs can effectively learn and classify complex patterns in image data.
4.1. CNN Training and Testing Parameters
The optimal training and testing parameter values are set using trial and error methods to achieve better classification accuracy and improved CNN performance.The ten-fold cross-validation technique averages the performance across multiple validation sets. The dataset is divided into ten folds; each used as a validation set once. The remaining nine folds are used for training. The process is repeated ten times with a different fold as the validation set. As the dataset is imbalanced, the cross-validation techniques prevent overfitting and underfitting problems by representing the distribution of the minority and majority classes over every fold.The learning rate is selected to prevent overshooting and obtain an optimal set of weights for the CNN model.The Minibatches that use simultaneous processing of a subset of training samples provide efficient computation, and better generalization, reducing memory requirements and allowing for parallelization.The maximum number of epochs is fine-tuned to ensure the modelhas sufficient opportunities to learn the complex microarray gene dataset patterns while avoiding the risk of overfitting and underfitting.The number of convolutional and fully connected layers is chosen such that the CNN model captures intricate patterns and achieves higher accuracy in classification. The filter size is tuned to obtain the spatial relationships and extract different levels of features. The number of filters is selected to learn relevant patterns and representations in the microarray gene expression data.From all the above observations, the optimal training and testing parameter values are fixed and are given in Table 6.
A sample of the accuracy and loss function during CNN training and testing progress is shown in Figure 8. The accuracy function measures the percentage of correctly classified samples to determine the CNN model's performance. It also helps to monitor training progress and evaluate the model's ability to generalize unseen data. On the other hand, the loss function quantifies the discrepancy between the predicted and actual outputs. By optimizing the loss function, the CNN model can adjust its parameters to minimize errors and learn the underlying patterns in the data.
Table 7 exhibits the training and testing performance of the classifiers based on the accuracy of the raw data and with STFT features for CNN Methods. As in the case of raw data, the training accuracy of classifiers always varied between 87.235% to 93.631%, while the testing accuracy varied from 83.425% to 90.607%. In the STFT feature method, Naïve Bayesian Classifier arrived at maximum training accuracy of 94.452%. The testing accuracy is ebbed at the peak value of 91.66% for the classifiers SDC and Naïve Bayesian. Table 7 shows that the Nonlinear regression classifier is a poor-performing one for both cases of the inputs.
4.2. CNN with cross entropy loss
The cross-entropy loss is a popular loss function used with CNNs for training the model.The cross-entropy loss measures the difference between the predicted class probabilities and the true class labels. It enables the CNN to minimize the difference between the predicted and actual distributions. The cross entropy loss ‘L’ in CNN is defined as:
Where y is the one-hot encoded true class label vector, and p is the predicted class probability vector.The cross-entropy loss is significant for CNNs as it predicts how well the class probabilities match the ground truth labels. Also, the network learns meaningful representations and makes accurate predictions by minimizing the cross-entropy loss. Also, in CNN, the gradients obtained from the cross-entropy loss facilitate efficient parameter updates during backpropagation.
5. Results and Discussion
The research utilizes formal ten-fold testing for machine learning and CNN classification methodologies. The training uses 85% of the gene expression data, and the remaining 15% is employed for testing the model. Since this research is binary classification, the performance metrics are accordingly chosen. In binary classification problems, a confusion matrix is a valuable tool for evaluating the performance of a machine-learning model. As mentioned earlier, the confusion matrix summarizes the predictions made by the model against the true labels of the data. The performance metrics such as Accuracy, F1 score, MCC, Error Rate, and Kappa are derived by analyzing the values within the confusion matrix.Next, we discuss in detail the performance matrices employed in this research.
Accuracy
The accuracy of a classifier is a measure of how well it correctly identifies the class labels of a dataset. It is calculated by dividing the number of correctly classified instances by the total number of instances in the dataset.The equation for accuracy is given by Wilson et al. [35].
F1 Score
The F1 score is a measure of a classifier's accuracy that combines precision and recall into a single metric. It is calculated as the harmonic mean of precision and recall, with values ranging from 0 to 1, where 1 indicates perfect precision and recall.The equation for F1 score is given by Koizumi et al. [36].
Here, precision is the proportion of true positives among all instances classified as positive, and recall is the proportion of true positives among all positive instances. The F1 score is useful when the classes in the dataset are imbalanced, meaning there are more instances of one class than the other. In such cases, accuracy may be a bad metric, as a classifier that predicts the majority class would have high accuracy but low precision and recall. The F1 score provides a more balanced measure of a classifier's performance.
Matthews Correlation Coefficient (MCC)
MCC stands for "Matthews Correlation Coefficient," which measures the quality of binary (two-class) classification models. It considers true and false positives and negatives and is particularly useful in situations where the classes are imbalanced.
The MCC is defined by the following equation as given in Chicco et al. [37]:
The MCC takes on values between -1 and 1, where a coefficient of 1 represents a perfect prediction, 0 represents a random prediction, and -1 represents a perfectly incorrect prediction.
Error Rate
As mentioned by Duda et al. [38], the error rate of a classifier is the proportion of misclassified instances. It can be calculated using the following equation:
Kappa <!-- MathType@Translator@5@5@MathML2 (no namespace).tdl@MathML 2.0 (no namespace)@ -->
e kappa statistic, also known as Cohen's kappa, measures agreement between two raters or between a rater and a classifier. In the context of classification, it is used to evaluate the performance of a classifier on a binary or multi-class classification task. The kappa staistic measures the agreement between the predicted and true classes, considering the possibility of the agreement by chance. Cohen et al. [39] defined kappa as follows:
Where is the observed proportion of agreement, and is the proportion of agreement expected by chance. and. are calculated as follows:
The kappa statistic takes on values between -1 and 1, where values greater than 0 indicate agreement better than chance, 0 indicate agreement by chance, and values less than 0 indicate agreement worse than chance. The results are tabulated in the following tables.
Table 8 indicates the performance analysis of the classifiers based on parameters such as Accuracy, F1 Score, MCC, Error Rate, and Kappa values for the STFT Dimensionality Reduction method without feature selection methods. It is explored from Table 8 that the GMM Classifier is a high performing one with an accuracy of 80.66%, an F1 Score of 87.71%, with a low error rate of 19.34%. The GMM Classifier also demonstrates a moderate value of MCC 0.4419 and a Kappa value of 0.4285. The Softmax discriminant Classifier is a low-performing classifier with a low accuracy of 59.11%, with high Error Rate of 40.89% and an F1 Score of 69.67%. The MCC and Kappa values of the SD classifier are 0.2083 and 0.1609, respectively.
Table 9 depicts the performance analysis of the classifiers for the STFT Dimensionality Reduction method with PSO feature selection methods. It is identified from Table 9 that the SVM(RBF) Classifier achieved high accuracy of 94.47%, an F1 Score of 96.62% with a low error rate of 5.52%. The SVM(RBF)Classifier has also reached a high value of MCC 0.81709 and Kappa value of 0.81485. The Non-linear Regression classifier is placed at the lower edge with a low accuracy of 59.91 %, a high Error Rate of 43.09% and an F1 Score of 68.03%. The MCC and Kappa values of the Non-Linear Regression classifier are at 0.1496 and 0.1156, correspondingly.
Table 10 exhibits the performance analysis of the classifiers for the STFT Dimensionality Reduction method with Harmonic Search feature selection methods. As shown in Table 10, the SVM (RBF) Classifier achieved high accuracy of 90.05% F1 Score of 93.75% with a low error rate of 9.94%. The SVM (RBF) Classifier is also maintained at a high value of MCC 0.711 and Kappa value of 0.6963. Unfortunately, SVM (poly) classifier is placed at the low performing one with an accuracy of 59.11 %, a high Error Rate of 40.89% and an F1 Score of 70.4%. The MCC and Kappa value of the SVM (Poly) classifier is at 0.1512 and 0.1217, accordingly.
Figure 9 shows the Performance of Classifiers with and without Feature Selection regarding MCC and Kappa parameters. As indicated by Figure 9 that the SVM (RBF) Classifier is reached a high value of MCC 0.81709 and Kappa value of 0.81485. The Non-Linear Regression classifier for the PSO feature selection method attains low MCC and Kappa values of 0.1496 and 0.1156. The average MCC and Kappa value across the classifiers for feature selection is 0.3212 and 0.27403, respectively. The average MCC and Kappa values across the classifiers for PSO and Harmonic Search Feature selection methods are settled at 0.4194, 0.3878 and 0.4841 and 0.4667. This signature effect of Feature selection shows the improvement of average MCC and Kappa values across the classifiers.
Figure 10 shows the Performance of Classifiers with and without Feature Selection regarding parameters like Accuracy, F1 Score and Error Rate. As identified by Figure 10, the SVM (RBF) Classifier with the PSO feature selection method achieved higher values in Accuracy of 94.47%, an F1 Score of 96.62% and a lower Error Rate of 5.52% than all other categories of classifiers. In the case of the Harmonic Search feature selection method, once again SVM (RBF) classifier attained good values of Accuracy of 90.05%, an F1 Score of 93.75% and a low error Rate of 9.944% compared with all other six Classifiers. GMM Classifier attained an appreciable value of Accuracy of 80.66%, F1 Score of 87.71% and moderate Error Rate of 19.33% for the STFT inputs without any feature selection methods. The effect of feature selection improves the classifiers' benchmark parameters and overall performance. The PSO feature Selection retained its top position. It maintained its superiority over the harmonic search Feature selection method, reflected in the classical improvements of the classifier's performance.
Table 11 explores the performance analysis of the classifiers for raw micro array gene data with CNN methods.
As displayed in Table 11, the SVM (RBF) Classifier achieved the highest accuracy of 90.607%, an F1 Score of 94.56%, with a low error rate of 9.39%. The SVM (RBF) Classifier is also maintained at a moderate value of MCC 0.6329 and Kappa value of 0.6031. For the CNN method, all seven classifiers are maintained at more than 83% accuracy and more than 90% F1 Score. The Softmax Discriminant Classifier attained minimum MCC and Kappa values of 0.5016 and 0.4616, respectively.
Table 12 exhibits the performance analysis of the classifiers for the STFT Dimensionality Reduction method with CNN methods. Table 12 shows that Soft max Discriminant Classifier(SDC) achieved a high accuracy of 91.66%, an F1 Score of 95.08%, with a low error rate of 8.33%. The SD Classifier is also maintained at a high MCC value of 0.6825 and Kappa value of 0.6785. All seven classifiers are maintained at more than 86% of accuracy and more than 92% of F1 Score. The Naïve Bayesian Classifier achieved an accuracy of 91.66% and also attained MCC and Kappa values of 0.6742 and 0.625, respectively. It is also observed from Table 12 that STFT input to the CNN method enhances the performance metrics of the classifiers when compared with raw input with CNN methods, as discussed in the paper.
Figure 11 depicts the Performance of Classifiers regarding MCC and Kappa parameters for Raw and STFT inputs to the CNN method. As indicated by Figure 11, the SD Classifier for the STFT feature method reached high MCC and Kappa values of 0.6825 and 0.6785, respectively. The average MCC and Kappa values across the classifiers are 0.5236 and 0.485. As shown by Figure 11 that the SVM (RBF) Classifier is attained at good values of MCC 0.6329 and Kappa value of 0.6031 for the raw inputs to the CNN method. The average MCC and Kappa value across the classifiers for CNN is 0.4794 and 0.4226, respectively. The Scalogram effect of STFT inputs to the CNN methods exemplifies the enhancement of average MCC and Kappa values across the classifiers.
Figure 12 shows the Performance of Classifiers regarding Accuracy, F1 Score, and Error Rate parameters for raw and STFT inputs with the CNN method. As depicted by Figure 12, the SVM(RBF) Classifier for raw input with the CNN method reached high accuracy, F1 Score and low error rates of 90.6%,94.56% and 9.39%, respectively. As displayed in Figure 12 that the SD Classifier is attained at the high accuracy value, F1 Score and low Error Rate of91.66%, 95.08% and 8.33%, respectively, for STFT inputs with the CNN method. The yardstick effect of STFT inputs in CNN methods maketh the improvement in the accuracy, F1 Score and Error Rate values across the classifiers.
Figure 13 displays the Performance of Classifiers in terms of Deviation of MCC and Kappa Parameters with mean Values.The MCC and Kappa are the benchmark parameters that indicate the classifiers' outcomes for different inputs.As in this research, there are two categories of inputs like raw microarray genes, STFT, STFT with PSO and Harmonic Search Feature selection, STFT with Scalogram method and finally, CNN methods are provided to the classifiers. The classifier's performance is observed through the attained MCC and Kappa values for these inputs. The average MCC and Kappa values from the classifiers are 0.4681 and 0.44518, respectively. Now a methodology is devised to identify the deviation of MCC and Kappa values from their respective mean values to point out the classifier's performance. It is also observed from Figure 13 that the MCC and Kappa values placed in the third quadrant of the graph depict the nonlinearoutcome of the classifiers with lower performance metrics. The MCC and Kappa values placed at the first quadrant show higher outcomes for classifiers with MCC and Kappa values more than the average value. This specifies the classifier's performance is improved for the STFT inputs along with the PSO Feature selection method. Figure 13 is also denoted by the curve fitting of the linear line with the following equation y = 1.062x + 1E-07 and R² = 0.991 values.
5.1. Computational Complexity
The computational complexity analyses the efficiency of the machine learning methods in terms of time and space complexity. In this research, the Big O notation represents the computational complexity of the dimensionality reduction, feature selection and classification methodologies. The computational complexity is represented by O(n),where n is the number of features. The O(log2n) means that the computational complexity increases 'log2n' times for any increase in 'n'. The classifiers considered in this research are integrated with either dimensionality reduction techniques, feature selection techniques, or a combination of both. Therefore, the computational complexity also is a combination of these hybrid methods. Overall, the choice of methodology should consider the trade-off between computational complexity and the desired level of performance in classification methodology. Table 13 shows the computational complexity of the classifiers for the STFT dimensionality reduction method with and without feature selection methods, along with CNN Models.
As noted from Table 13, the SVM(Linear), NBC, Nonlinear Regression, Soft max discriminant classifiers, and SVM(RBF) classifiers are at the level of low computational complexity for the STFT DR method without feature selection methods. GMM Classifier attains moderate complexity of O(2n4 log2n) without feature selection methods and achieved good accuracy of 80.66%. For PSO and Harmonic search feature selection methods, the SVM(RBF) classifier with the computational complexity of O(2n5 log 4n) placed at high accuracy of 94.47% and 90.05%, respectively.GMM and SVM(polynomial) classifiers are denoted by the high computational complexity of O(2n7 log 2n) for the PSO and Harmonic Search Feature selection methods poorly performed in terms of accuracy score. These poor performances of classifiers are due to the presence of outlier problems in the STFT features. In order to enhance the performance of the classifiers, the STFT Scalogram features and CNN methods are included in this research. The SVM(RBF) Classifier attained good performance with moderate complexity of O(2n3 log4n) and O(2n3 log8n) for the methods, respectively.Next, through Table 14, we compare the accuracy of our research work with various methodologies across diverse microarray gene datasets employed for Adenocarcinoma and mesothelioma lung cancer.
Overall, this research evaluates and explores machine learning and CNN classifiers for detecting lung cancer from microarray gene expressions. The research investigation shows that although CNNs are good at learning features, due to their black-box nature, the CNNs fail to analyse the physical meaning behind forecasting and categorising gene expression patterns from the learned features. Further, the LH2 dataset used for this research contains data imbalance, and many times during the analysis, CNNs were prone to overfitting and underfitting issues. The measures like the feature extraction step and replacement of the softmax layer with suitable classifiers were adopted to rectify these issues. But, the trade-off is that computational complexity will be increased while adding multiple stages to the CNN classification methodology.
Our research shows that microarray gene expression-based data is instrumental for disease classification. It contributes significantly to understanding gene expression patterns and their association with various biological processes and diseases. However, microarray genes have some limitations over general approaches like mRNA-Seq. The microarray gene expressions are selected from limited areas with specific genes or tissue regions. Therefore, the data generated may not capture the entire transcriptome and provide comprehensive information about gene expression. Also, microarray experiments may be prone to background noise and cross-hybridization problems due to non-specific binding, resulting in decreased sensitivity and specificity. Microarray experiments are expensive and sometimes have limited throughput compared to newer high-throughput sequencing technologies like mRNA-Seq.
6. Conclusion
The generation of malignant lung tissue is often inconspicuous and doesn't show symptoms in the early stages. Therefore the early detection of lung cancer is significant as it can lead to improved treatment outcomes and increased chances of survival. The microarray gene expression analysis of lung cancer data effectively detects lung cancer at an early stage, allowing for prompt intervention and potentially curative treatment options. Therefore, this paper uses microarray gene expression combined with machine and deep learning techniques to improve lung cancer data classification. The research employs two levels of pre-processing lung cancer data for better classification results: dimensionality reduction and feature selection techniques. The Short-Term Fourier Transform (STFT) dimensionality reduction with PSO feature selection and SVM (RBF) classifier produced the highest accuracy of 94.47%. The future endeavours of this research focuses on improving the classification accuracy of the CNN classifiers by investigating non-linear transforms like wavelets and nature-inspired feature extraction and selection methods incorporated into prior stages of CNN classification.
References
- Dubin, S.; Griffin, D. Lung Cancer in Non-Smokers. Mo. Med. 2020, 117, 375–379. [Google Scholar] [PubMed]
- Selman, M.; Pardo, A.; King, T.E., Jr. Hypersensitivity pneumonitis: insights in diagnosis and pathobiology. Am. J. Respir. Crit. Care Med. 2012, 186, 314–324. [Google Scholar]
- Infante, M.; Lutman, F.R.; Cavuto, S.; Brambilla, G.; Chiesa, G.; Passera, E.; Angeli, E.; Chiarenza, M.; Aranzulla, G.; Cariboni, U.; et al. Lung cancer screening with spiral CT: Baseline results of the randomized DANTE trial. Lung Cancer 2008, 59, 355–363. [Google Scholar] [CrossRef] [PubMed]
- Thunnissen, F.B.J.M. Sputum examination for early detection of lung cancer. J. Clin. Pathol. 2003, 56, 805–810. [Google Scholar] [CrossRef]
- Andolfi, M.; Potenza, R.; Capozzi, R.; Liparulo, V.; Puma, F.; Yasufuku, K. The role of bronchoscopy in the diagnosis of early lung cancer: a review. J. Thorac. Dis. 2016, 8, 3329–3337. [Google Scholar] [CrossRef] [PubMed]
- Zhu, C.-Q.; Pintilie, M.; John, T.; Strumpf, D.; Shepherd, F.A.; Der, S.D.; Jurisica, I.; Tsao, M.-S. Understanding Prognostic Gene Expression Signatures in Lung Cancer. Clin. Lung Cancer 2009, 10, 331–340. [Google Scholar] [CrossRef]
- Churchill, G.A. Fundamentals of experimental design for cDNA microarrays. Nat. Genet. 2002, 32, 490–495. [Google Scholar] [CrossRef]
- Ross, D.T.; Scherf, U.; Eisen, M.B.; Perou, C.M.; Rees, C.; Spellman, P.; Iyer, V.; Jeffrey, S.S.; Van de Rijn, M.; Waltham, M.; et al. Systematic variation in gene expression patterns in human cancer cell lines. Nat. Genet. 2000, 24, 227–235. [Google Scholar] [CrossRef] [PubMed]
- Reis-Filho, J.S.; Pusztai, L. Gene expression profiling in breast cancer: classification, prognostication, and prediction. The Lancet 2011, 378, 1812–1823. [Google Scholar]
- Lapointe, J.; Li, C.; Higgins, J.P.; van de Rijn, M.; Bair, E.; Montgomery, K.; Ferrari, M.; Egevad, L.; Rayford, W.; Bergerheim, U.; et al. Gene expression profiling identifies clinically relevant subtypes of prostate cancer. Proc. Natl. Acad. Sci. 2004, 101, 811–816. [Google Scholar] [CrossRef]
- Dwivedi, A.K. Artificial neural network model for effective cancer classification using microarray gene expression data. Neural Comput. Appl. 2016, 29, 1545–1554. [Google Scholar] [CrossRef]
- Rody, A.; Holtrich, U.; Pusztai, L.; Liedtke, C.; Gaetje, R.; Ruckhaeberle, E.; Solbach, C.; Hanker, L.; Ahr, A.; Metzler, D.; et al. T-cell metagene predicts a favorable prognosis in estrogen receptor-negative and HER2-positive breast cancers. Breast Cancer Res. 2009, 11, R15–R15. [Google Scholar] [CrossRef] [PubMed]
- Sanchez-Palencia, A.; Gomez-Morales, M.; Gomez-Capilla, J.A.; Pedraza, V.; Boyero, L.; Rosell, R.; Fárez-Vidal, M.E. Gene expression profiling reveals novel biomarkers in nonsmall cell lung cancer. Int. J. Cancer 2010, 129, 355–364. [Google Scholar] [CrossRef]
- Kerkentzes, K.; Lagani, V.; Tsamardinos, I.; Vyberg, M.; Røe, O.D. Hidden treasures in “ancient” microarrays: gene-expression portrays biology and potential resistance pathways of major lung cancer subtypes and normal tissue. Frontiers in oncology 2014, 4, 251. [Google Scholar] [CrossRef] [PubMed]
- Wagner, J.C.; Berry, G.; Skidmore, J.W.; Timbrell, V. The Effects of the Inhalation of Asbestos in Rats. Br. J. Cancer 1974, 29, 252–269. [Google Scholar] [CrossRef]
- Weigelt, B.; Baehner, F.L.; Reis-Filho, J.S. The contribution of gene expression profiling to breast cancer classification, prognostication and prediction: a retrospective of the last decade. The Journal of Pathology: A Journal of the Pathological Society of Great Britain and Ireland 2010, 220, 263–280. [Google Scholar]
- Hira, Z.M.; Gillies, D.F. A Review of Feature Selection and Feature Extraction Methods Applied on Microarray Data. Adv. Bioinform. 2015, 2015, 1–13. [Google Scholar] [CrossRef]
- Qi, Y.; Yang, L.; Liu, B.; Liu, L.; Liu, Y.; Zheng, Q.; Liu, D.; Luo, J. Highly accurate diagnosis of lung adenocarcinoma and squamous cell carcinoma tissues by deep learning. Spectrochim. Acta Part A: Mol. Biomol. Spectrosc. 2021, 265, 120400. [Google Scholar] [CrossRef]
- Abdelwahab, O.; Awad, N.; Elserafy, M.; Badr, E. A feature selection-based framework to identify biomarkers for cancer diagnosis: A focus on lung adenocarcinoma. PLOS ONE 2022, 17, e0269126. [Google Scholar] [CrossRef]
- Shukla, A.K.; Tripathi, D.; Reddy, B.R.; Chandramohan, D. A study on metaheuristics approaches for gene selection in microarray data: algorithms, applications and open challenges. Evolutionary Intelligence 2020, 13, 309–329. [Google Scholar]
- Gordon, G.J.; Jensen, R.V.; Hsiao, L.-L.; Gullans, S.R.; Blumenstock, J.E.; Ramaswamy, S.; Richards, W.G.; Sugarbaker, D.J.; Bueno, R. Translation of microarray data into clinically relevant cancer diagnostic tests using gene expression ratios in lung cancer and mesothelioma. Cancer research 2002, 62, 4963–4967. [Google Scholar]
- Gupta, V.; Mittal, M. QRS Complex Detection Using STFT, Chaos Analysis, and PCA in Standard and Real-Time ECG Databases. J. Inst. Eng. (India): Ser. B 2019, 100, 489–497. [Google Scholar] [CrossRef]
- Martín, C.A.; Pinillo, R.I.; Barasinski, A.; Chinesta, F. Code2vect: An efficient heterogenous data classifier and nonlinear regression technique. 347. [CrossRef]
- Dalatu, P.I.; Fitrianto, A.; Mustapha, A. A.; Mustapha, A. A Comparative Study of Linear andNonlinear Regression Models for Outlier Detection. In Recent Advances on Soft Computing and Data Mining. SCDM 2016. Advances in Intelligent Systems and Computing; Herawan, T., Ghazali, R., Nawi, N.M., Deris, M.M., Eds.; Springer: Cham, 2017; Volume 549. [Google Scholar] [CrossRef]
- Ficklin, S.P.; Dunwoodie, L.J.; Poehlman, W.L.; Watson, C.; Roche, K.E.; Feltus, F.A. Discovering Condition-Specific Gene Co-Expression Patterns Using Gaussian Mixture Models: A Cancer Case Study. Sci. Rep. 2017, 7, 1–11. [Google Scholar] [CrossRef] [PubMed]
- Shah, S.H.; Iqbal, M.J.; Ahmad, I.; Khan, S.; Rodrigues, J.J.P.C. Optimized gene selection and classification of cancer from microarray gene expression data using deep learning. Neural Comput. Appl. 2020, 1–12. [Google Scholar] [CrossRef]
- Ahmed, S.; Shahjaman; Rana, M. ; Mollah, N.H. Robustification of Naïve Bayes Classifier and Its Application for Microarray Gene Expression Data Analysis. BioMed Res. Int. 2017, 2017, 1–17. [Google Scholar] [CrossRef]
- Vanitha, C.D.A.; Devaraj, D.; Venkatesulu, M. Gene Expression Data Classification Using Support Vector Machine and Mutual Information-based Gene Selection. Procedia Comput. Sci. 2015, 47, 13–21. [Google Scholar] [CrossRef]
- Dai, W.; Chuang, Y.-Y.; Lu, C.-J. A Clustering-based Sales Forecasting Scheme Using Support Vector Regression for Computer Server. Procedia Manuf. 2015, 2, 82–86. [Google Scholar] [CrossRef]
- Ge, F.; Ju, Y.; Qi, Z.; Lin, Y. Parameter Estimation of a Gaussian Mixture Model for Wind Power Forecast Error by Riemann L-BFGS Optimization. IEEE Access 2018, 6, 38892–38899. [Google Scholar] [CrossRef]
- Hastie, T.; Tibshirani, R.; Buja, A. Flexible discriminant analysis by optimal scoring. Journal of the American statistical association 1994, 89, 1255–1270. [Google Scholar] [CrossRef]
- Berrar, D. Bayes’ theorem and naive Bayes classifier. Encyclopedia of bioinformatics and computational biology: ABC of bioinformatics 2018, 403, 412. [Google Scholar]
- Zhang, R.; Wang, W. Facilitating the applications of support vector machine by using a new kernel. Expert Syst. Appl. 2011, 38, 14225–14230. [Google Scholar] [CrossRef]
- Fushiki, T. Estimation of prediction error by using K-fold cross-validation. Stat. Comput. 2009, 21, 137–146. [Google Scholar] [CrossRef]
- Wilson, S.W. Classifier Fitness Based on Accuracy. Evol. Comput. 1995, 3, 149–175. [Google Scholar] [CrossRef]
- Koizumi, Y.; Saito, S.; Uematsu, H.; Harada, N. Optimizing acoustic feature extractor for anomalous sound detection based on Neyman-Pearson lemma. 2017 25th European Signal Processing Conference (EUSIPCO). IEEE, 2017. [CrossRef]
- Chicco, D.; Jurman, G. The advantages of the Matthews correlation coefficient (MCC) over F1 score and accuracy in binary classification evaluation. BMC Genom. 2020, 21, 1–13. [Google Scholar] [CrossRef]
- Duda, R.O.; Fossum, H. Pattern Classification by Iteratively Determined Linear and Piecewise Linear Discriminant Functions. IEEE Trans. Electron. Comput. -15. [CrossRef]
- Cohen, J. Weighted kappa: Nominal scale agreement provision for scaled disagreement or partial credit. Psychol. Bull. 1968, 70, 213–220. [Google Scholar] [CrossRef] [PubMed]
- Gupta, S.; Gupta, M.K.; Shabaz, M.; Sharma, A. Deep learning techniques for cancer classification using microarray gene expression data. Front. Physiol. 2022, 13, 952709. [Google Scholar] [CrossRef] [PubMed]
- Ke, L.; Li, M.; Wang, L.; Deng, S.; Ye, J.; Yu, X. Improved swarm-optimization-based filter-wrapper gene selection from microarray data for gene expression tumor classification. Pattern Anal. Appl. 2022, 26, 455–472. [Google Scholar] [CrossRef]
- Morani, F.; Bisceglia, L.; Rosini, G.; Mutti, L.; Melaiu, O.; Landi, S.; Gemignani, F. Identification of Overexpressed Genes in Malignant Pleural Mesothelioma. Int. J. Mol. Sci. 2021, 22, 2738. [Google Scholar] [CrossRef]
- Fathi, H.; AlSalman, H.; Gumaei, A.; Manhrawy, I.I.M.; Hussien, A.G.; El-Kafrawy, P. An Efficient Cancer Classification Model Using Microarray and High-Dimensional Data. Comput. Intell. Neurosci. 2021, 2021, 1–14. [Google Scholar] [CrossRef]
- Xia, D.; Leon, A.J.; Cabanero, M.; Pugh, T.J.; Tsao, M.S.; Rath, P.; Siu, L.L.-Y.; Yu, C.; Bedard, P.L.; Shepherd, F.A.; et al. Minimalist approaches to cancer tissue-of-origin classification by DNA methylation. Mod. Pathol. 2020, 33, 1874–1888. [Google Scholar] [CrossRef]
- Azzawi, H.; Hou, J.; Xiang, Y.; Alanni, R. Lung cancer prediction from microarray data by gene expression programming. IET Syst. Biol. 2016, 10, 168–178. [Google Scholar] [CrossRef]
- Guan, P.; Huang, D.; He, M.; Zhou, B. Lung cancer gene expression database analysis incorporating prior knowledge with support vector machine-based classification method. J. Exp. Clin. Cancer Res. 2009, 28, 103–7. [Google Scholar] [CrossRef] [PubMed]
- Mramor, M.; Leban, G.; Demšar, J.; Zupan, B. Visualization-based cancer microarray data classification analysis. Bioinformatics 2007, 23, 2147–2154. [Google Scholar] [CrossRef] [PubMed]
- Gordon, G.J.; Jensen, R.V.; Hsiao, L.-L.; Gullans, S.R.; E Blumenstock, J.; Ramaswamy, S.; Richards, W.G.; Sugarbaker, D.J.; Bueno, R. Translation of microarray data into clinically relevant cancer diagnostic tests using gene expression ratios in lung cancer and mesothelioma. Cancer Res. 2002, 62. [Google Scholar]
Figure 1.
Methodology for Dimensionality Reduction and Classification of Microarray gene expression data for lung cancer.
Figure 1.
Methodology for Dimensionality Reduction and Classification of Microarray gene expression data for lung cancer.
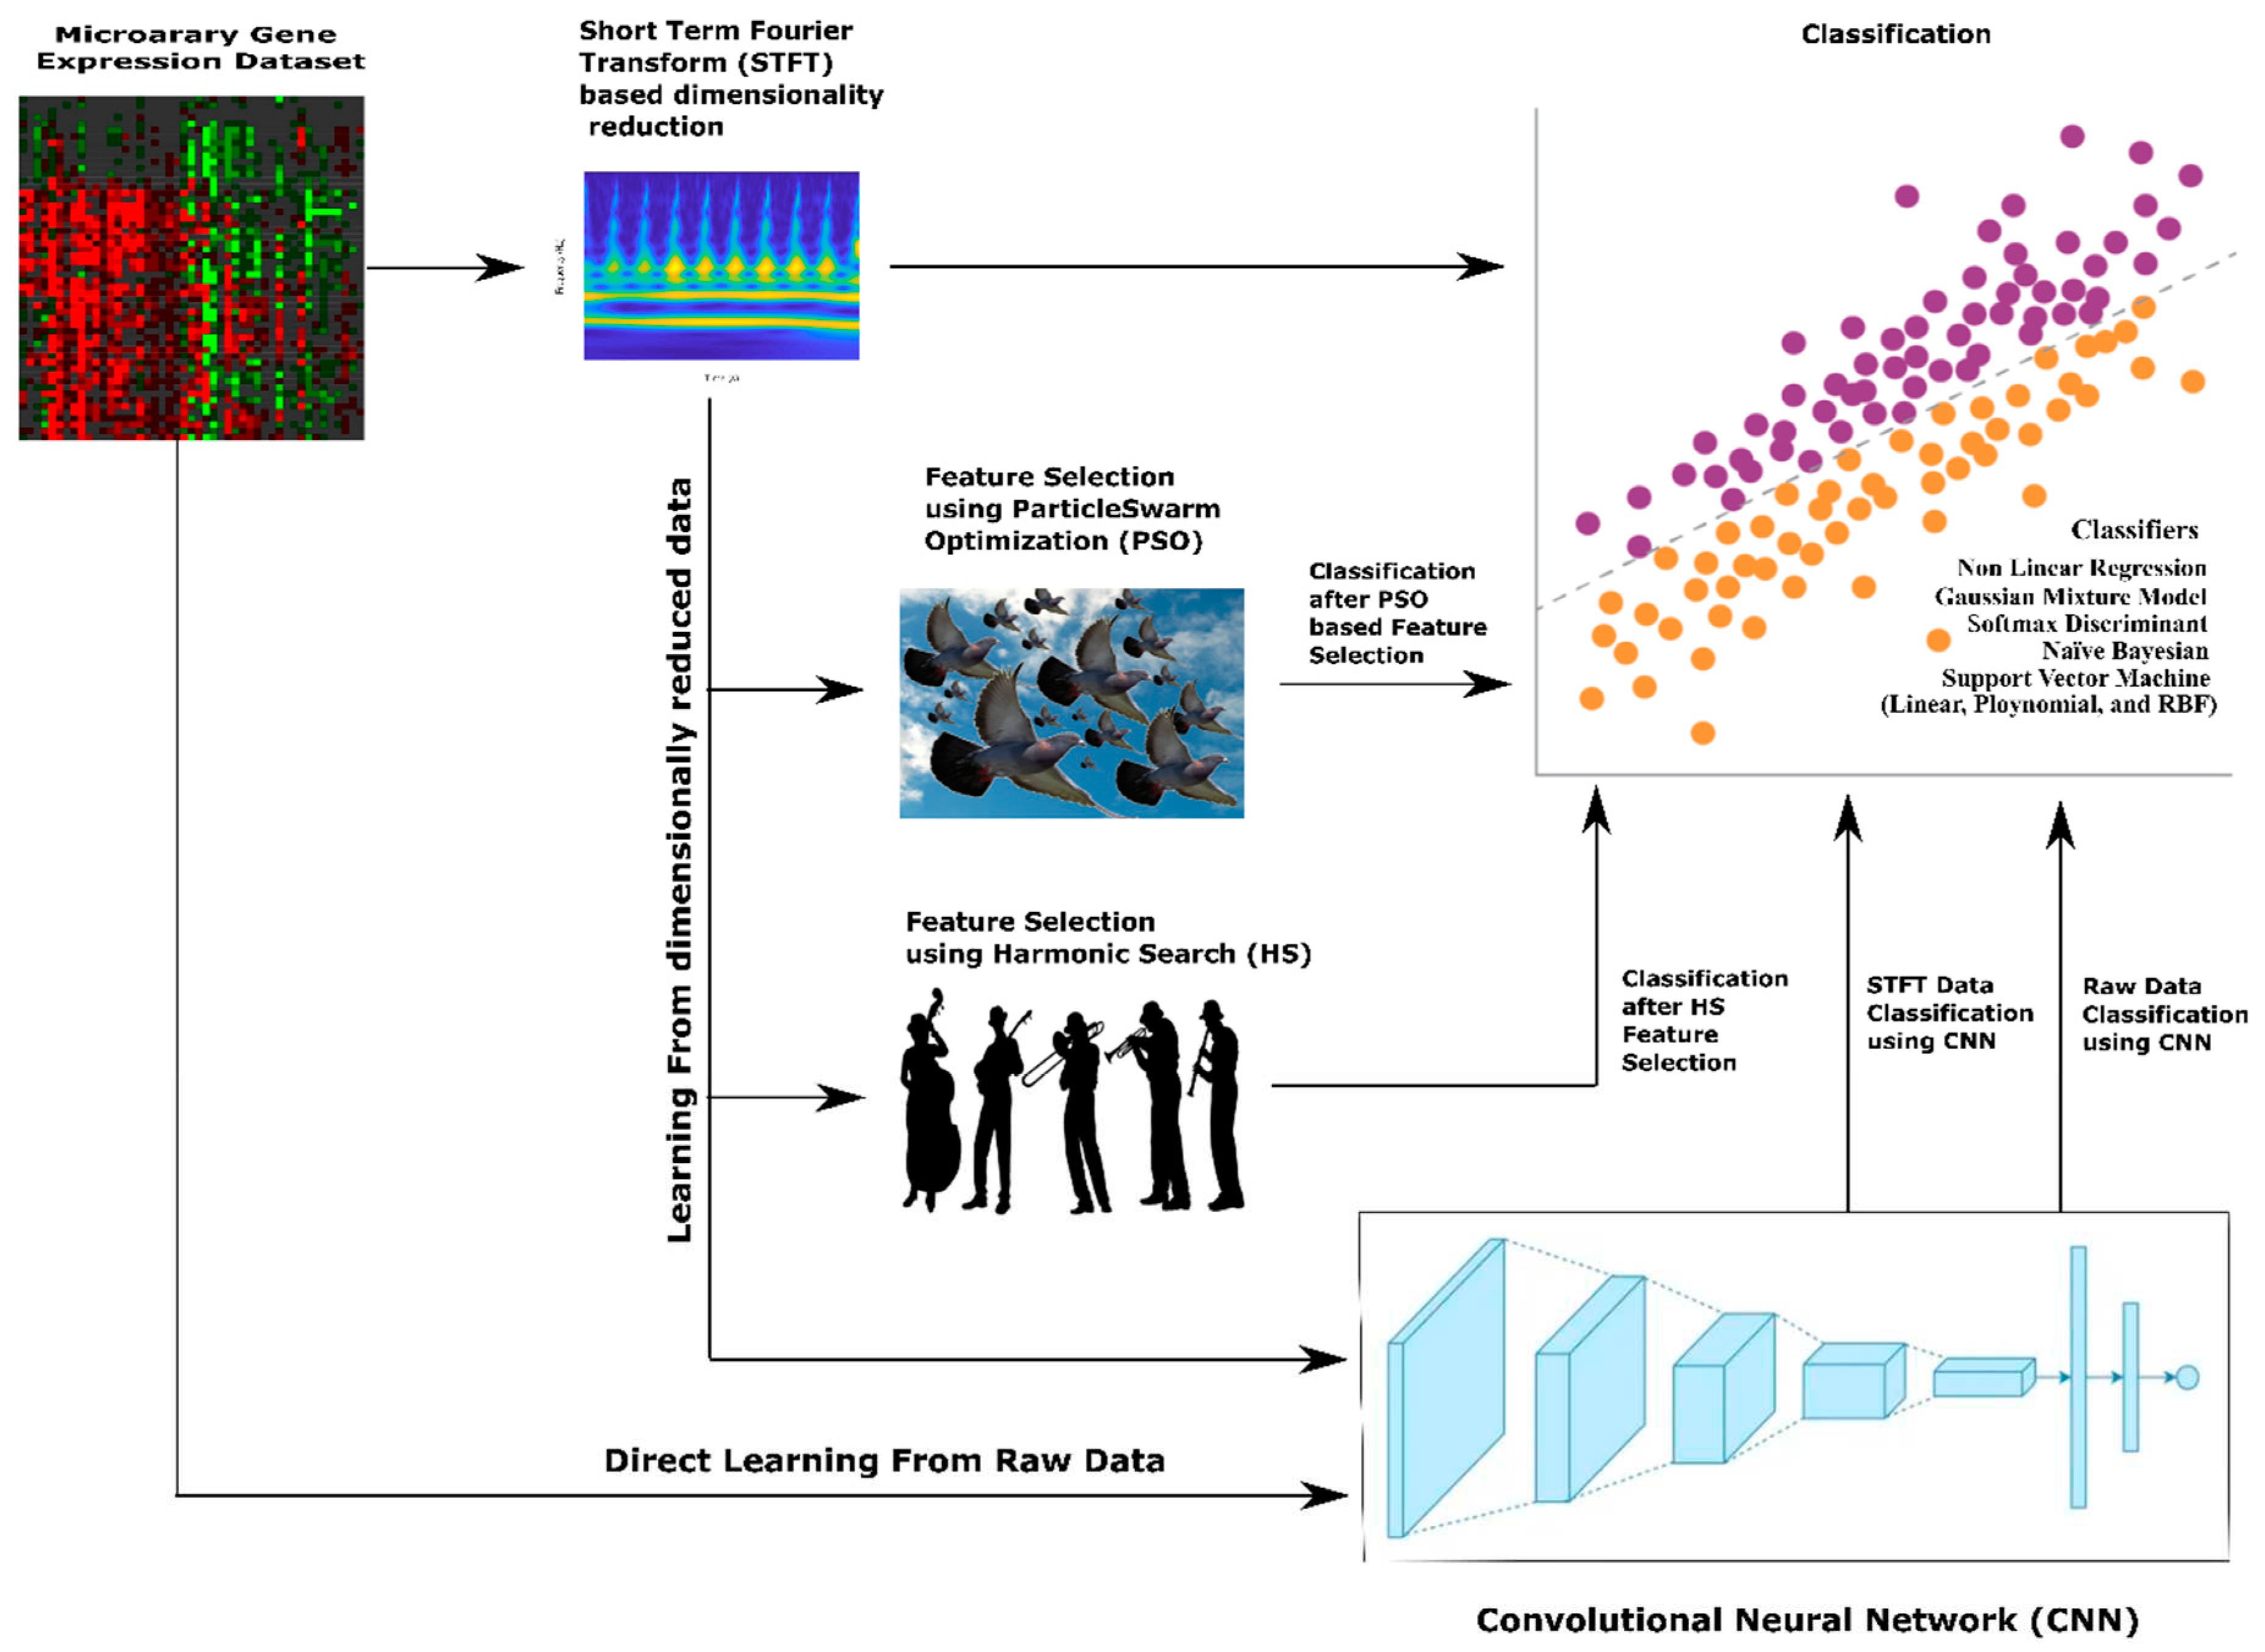
Figure 2.
Scatter plot for STFT based Dimensionality Reduction Method in Meso and Adeno carcinoma Cancer Classes.
Figure 2.
Scatter plot for STFT based Dimensionality Reduction Method in Meso and Adeno carcinoma Cancer Classes.
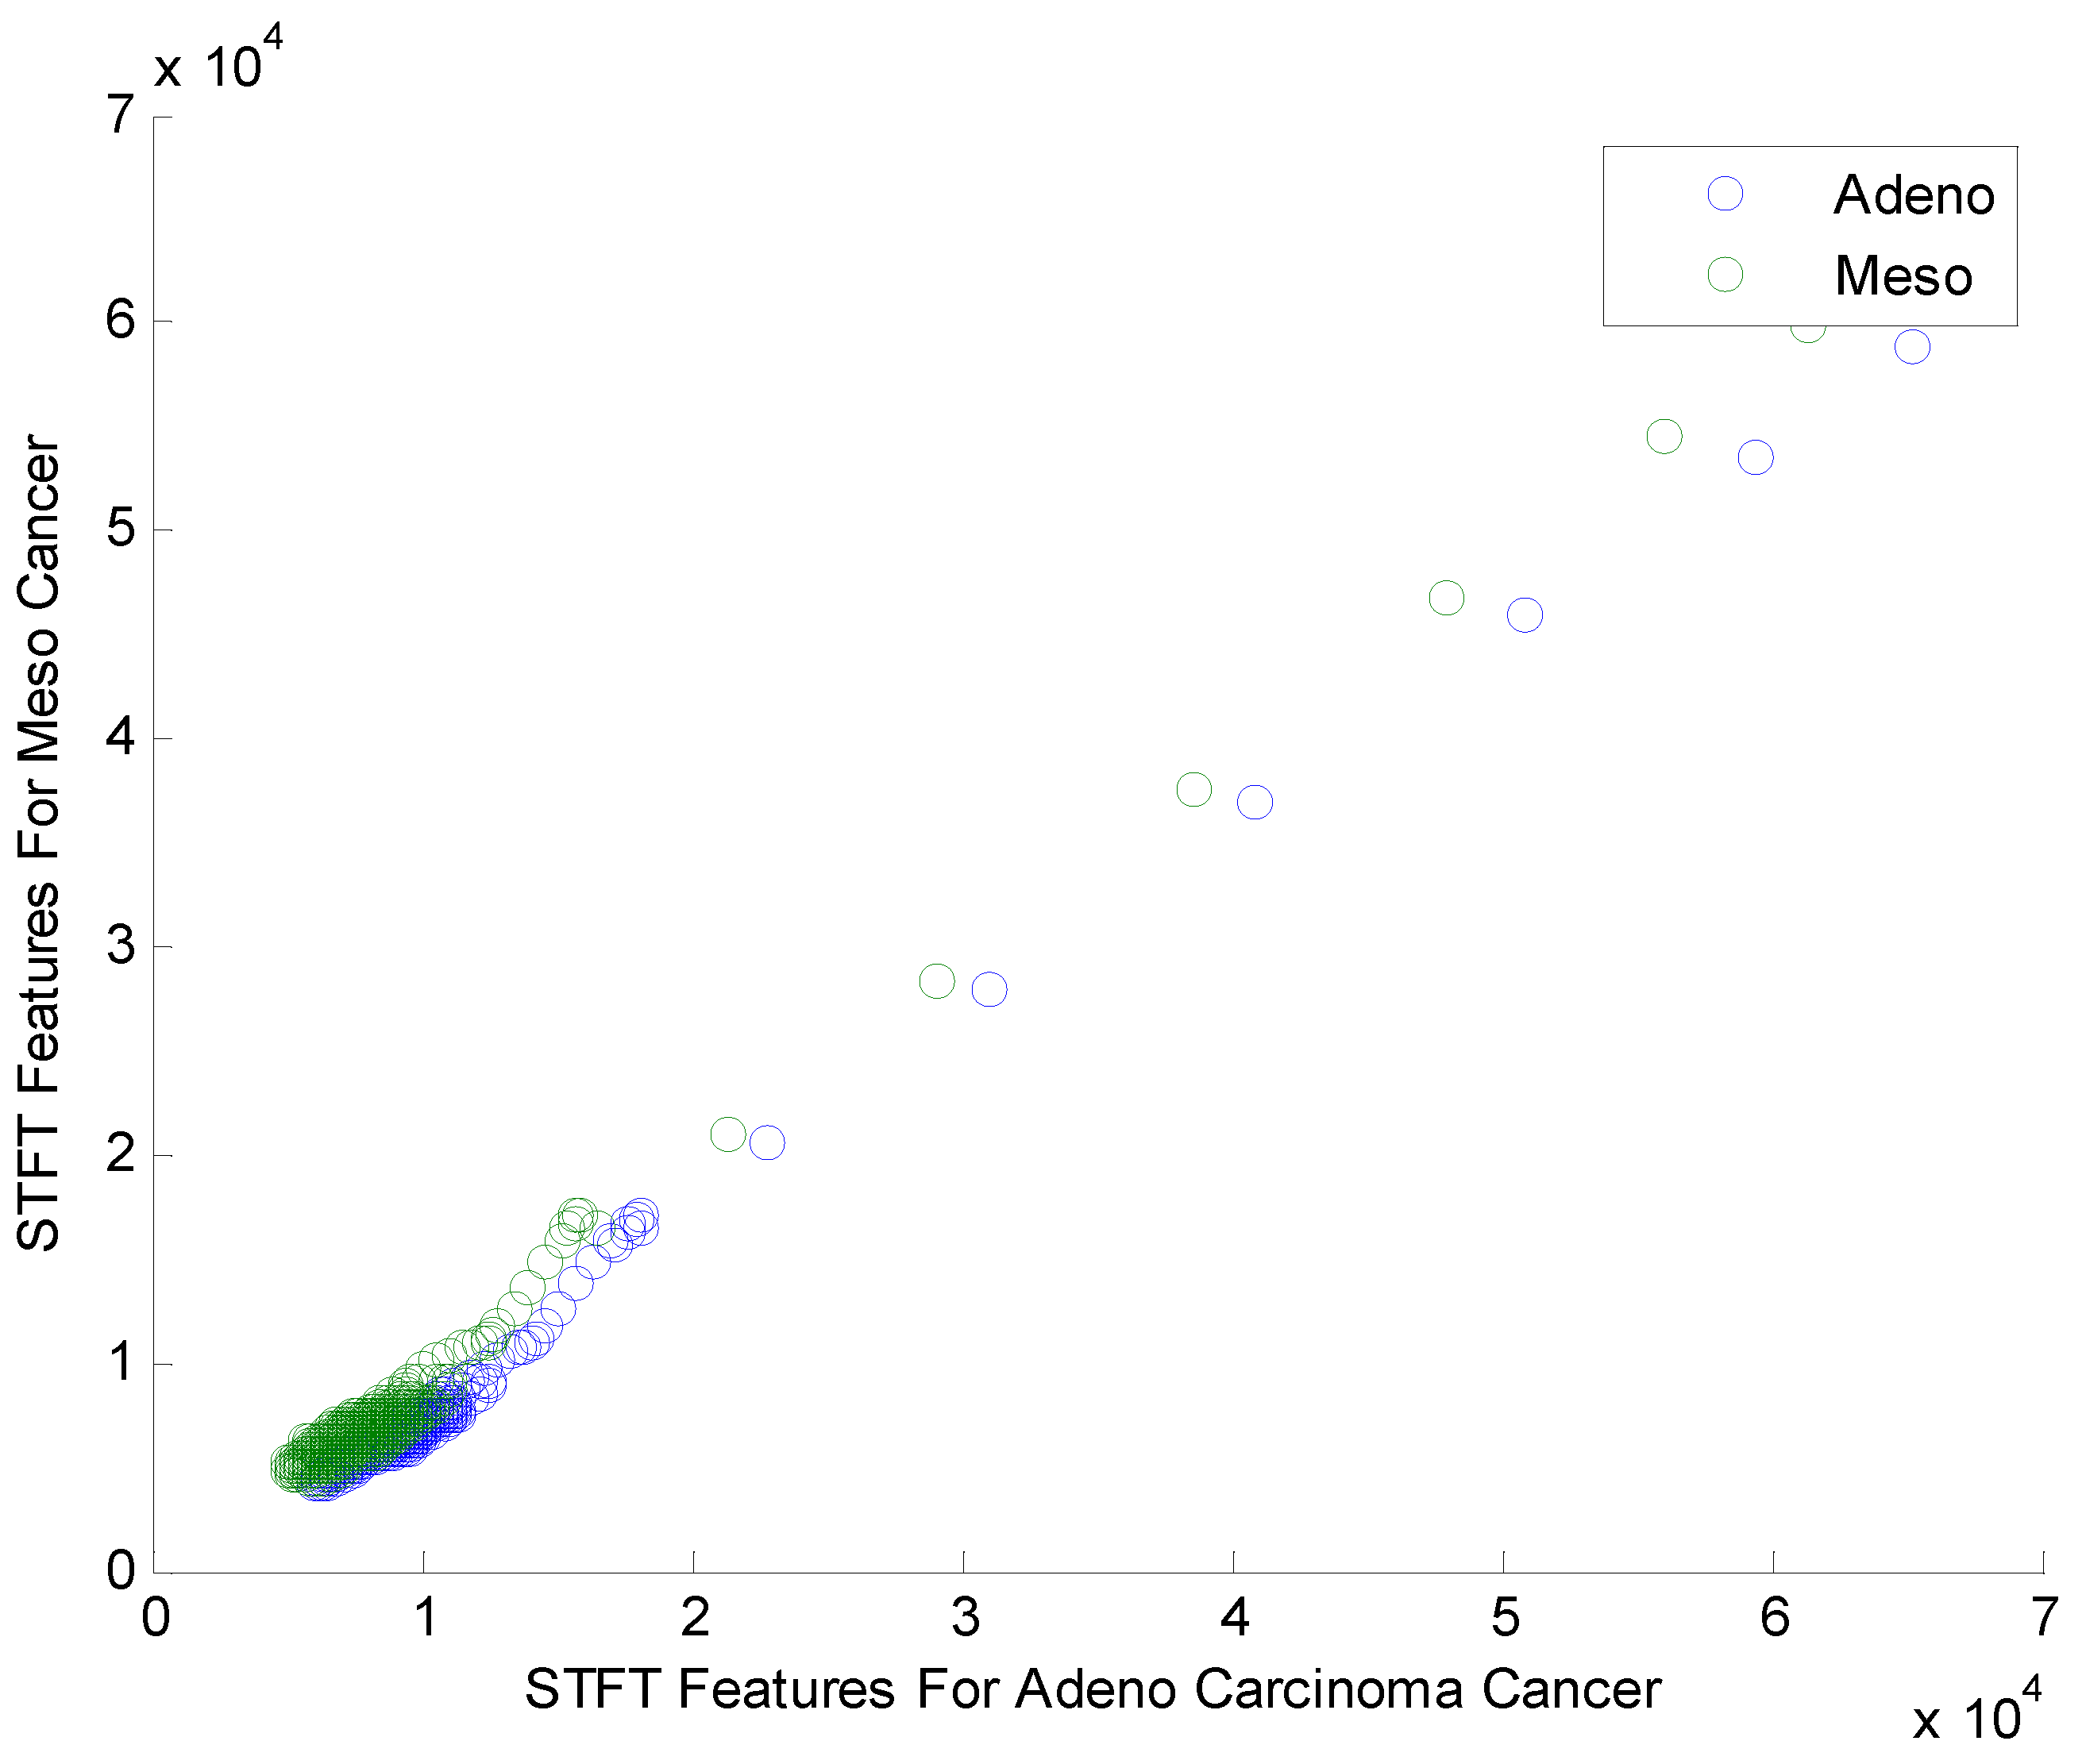
Figure 3.
NormalProbability plot for STFT Dimensionality Reduction Method with PSO Feature Selection in Adeno carcinoma Cancer Classes.
Figure 3.
NormalProbability plot for STFT Dimensionality Reduction Method with PSO Feature Selection in Adeno carcinoma Cancer Classes.
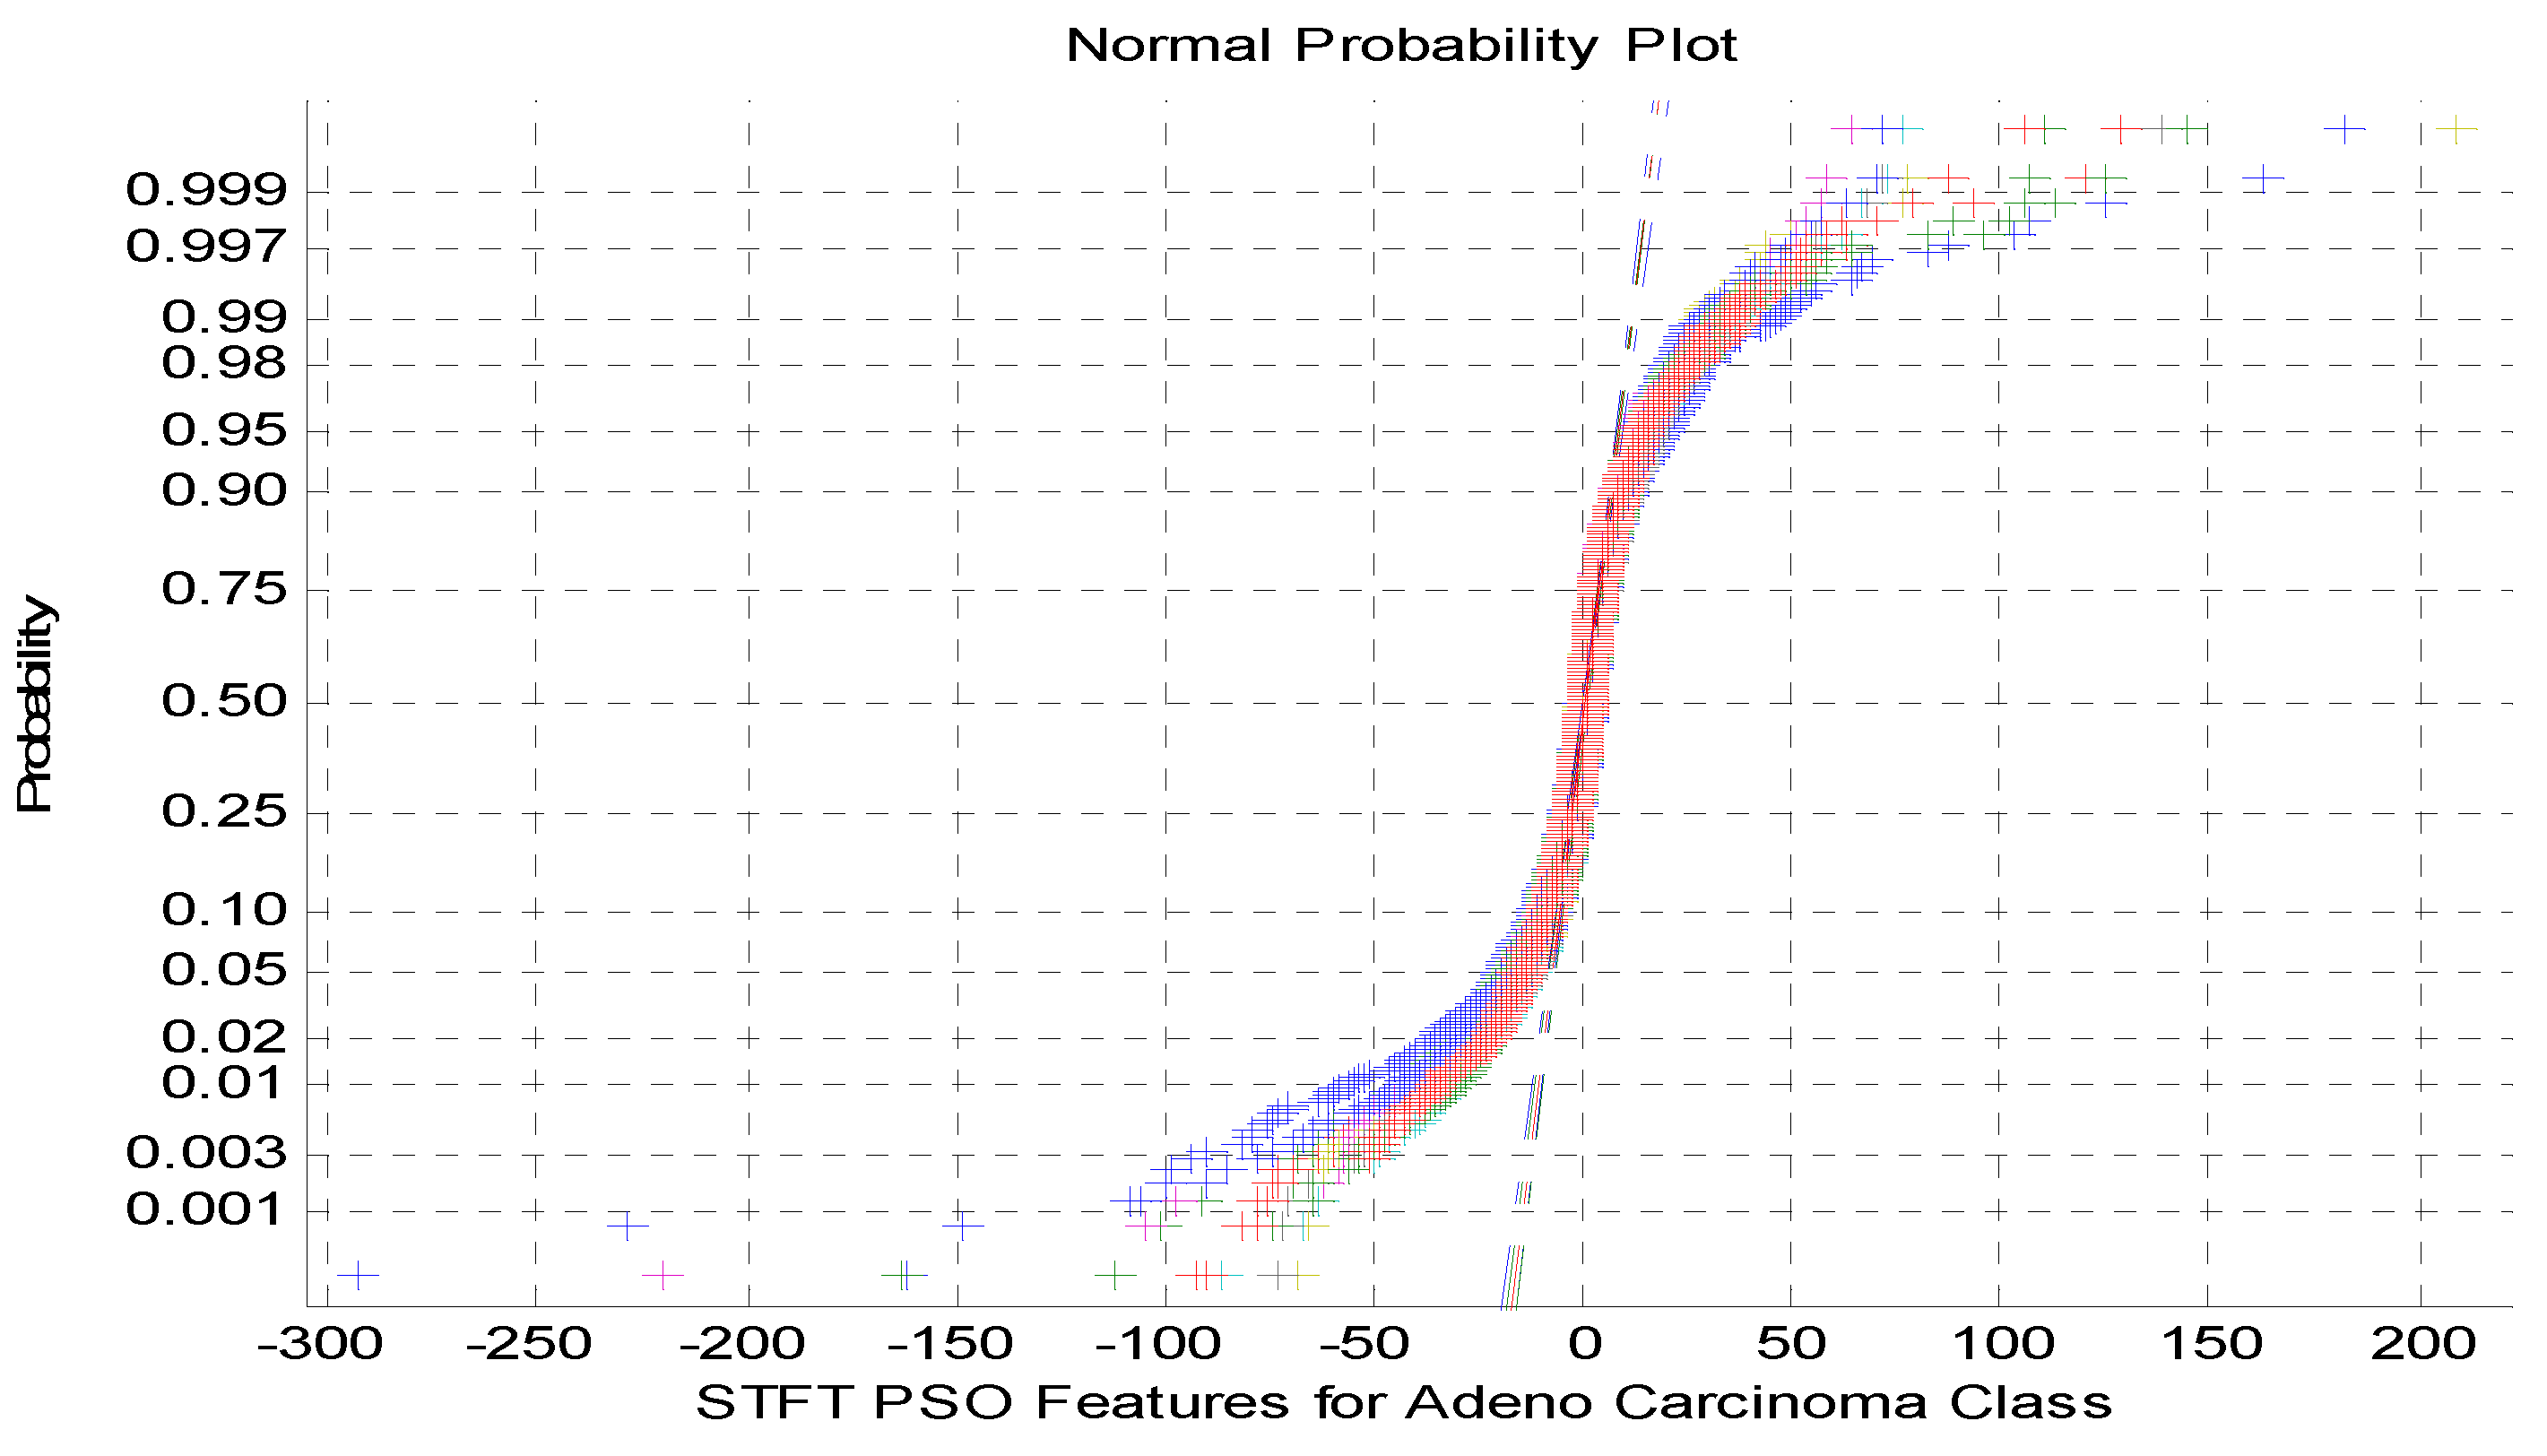
Figure 4.
Normalprobability plot for STFT Dimensionality Reduction Method with PSO Feature Selection in Meso carcinoma Cancer Classes.
Figure 4.
Normalprobability plot for STFT Dimensionality Reduction Method with PSO Feature Selection in Meso carcinoma Cancer Classes.
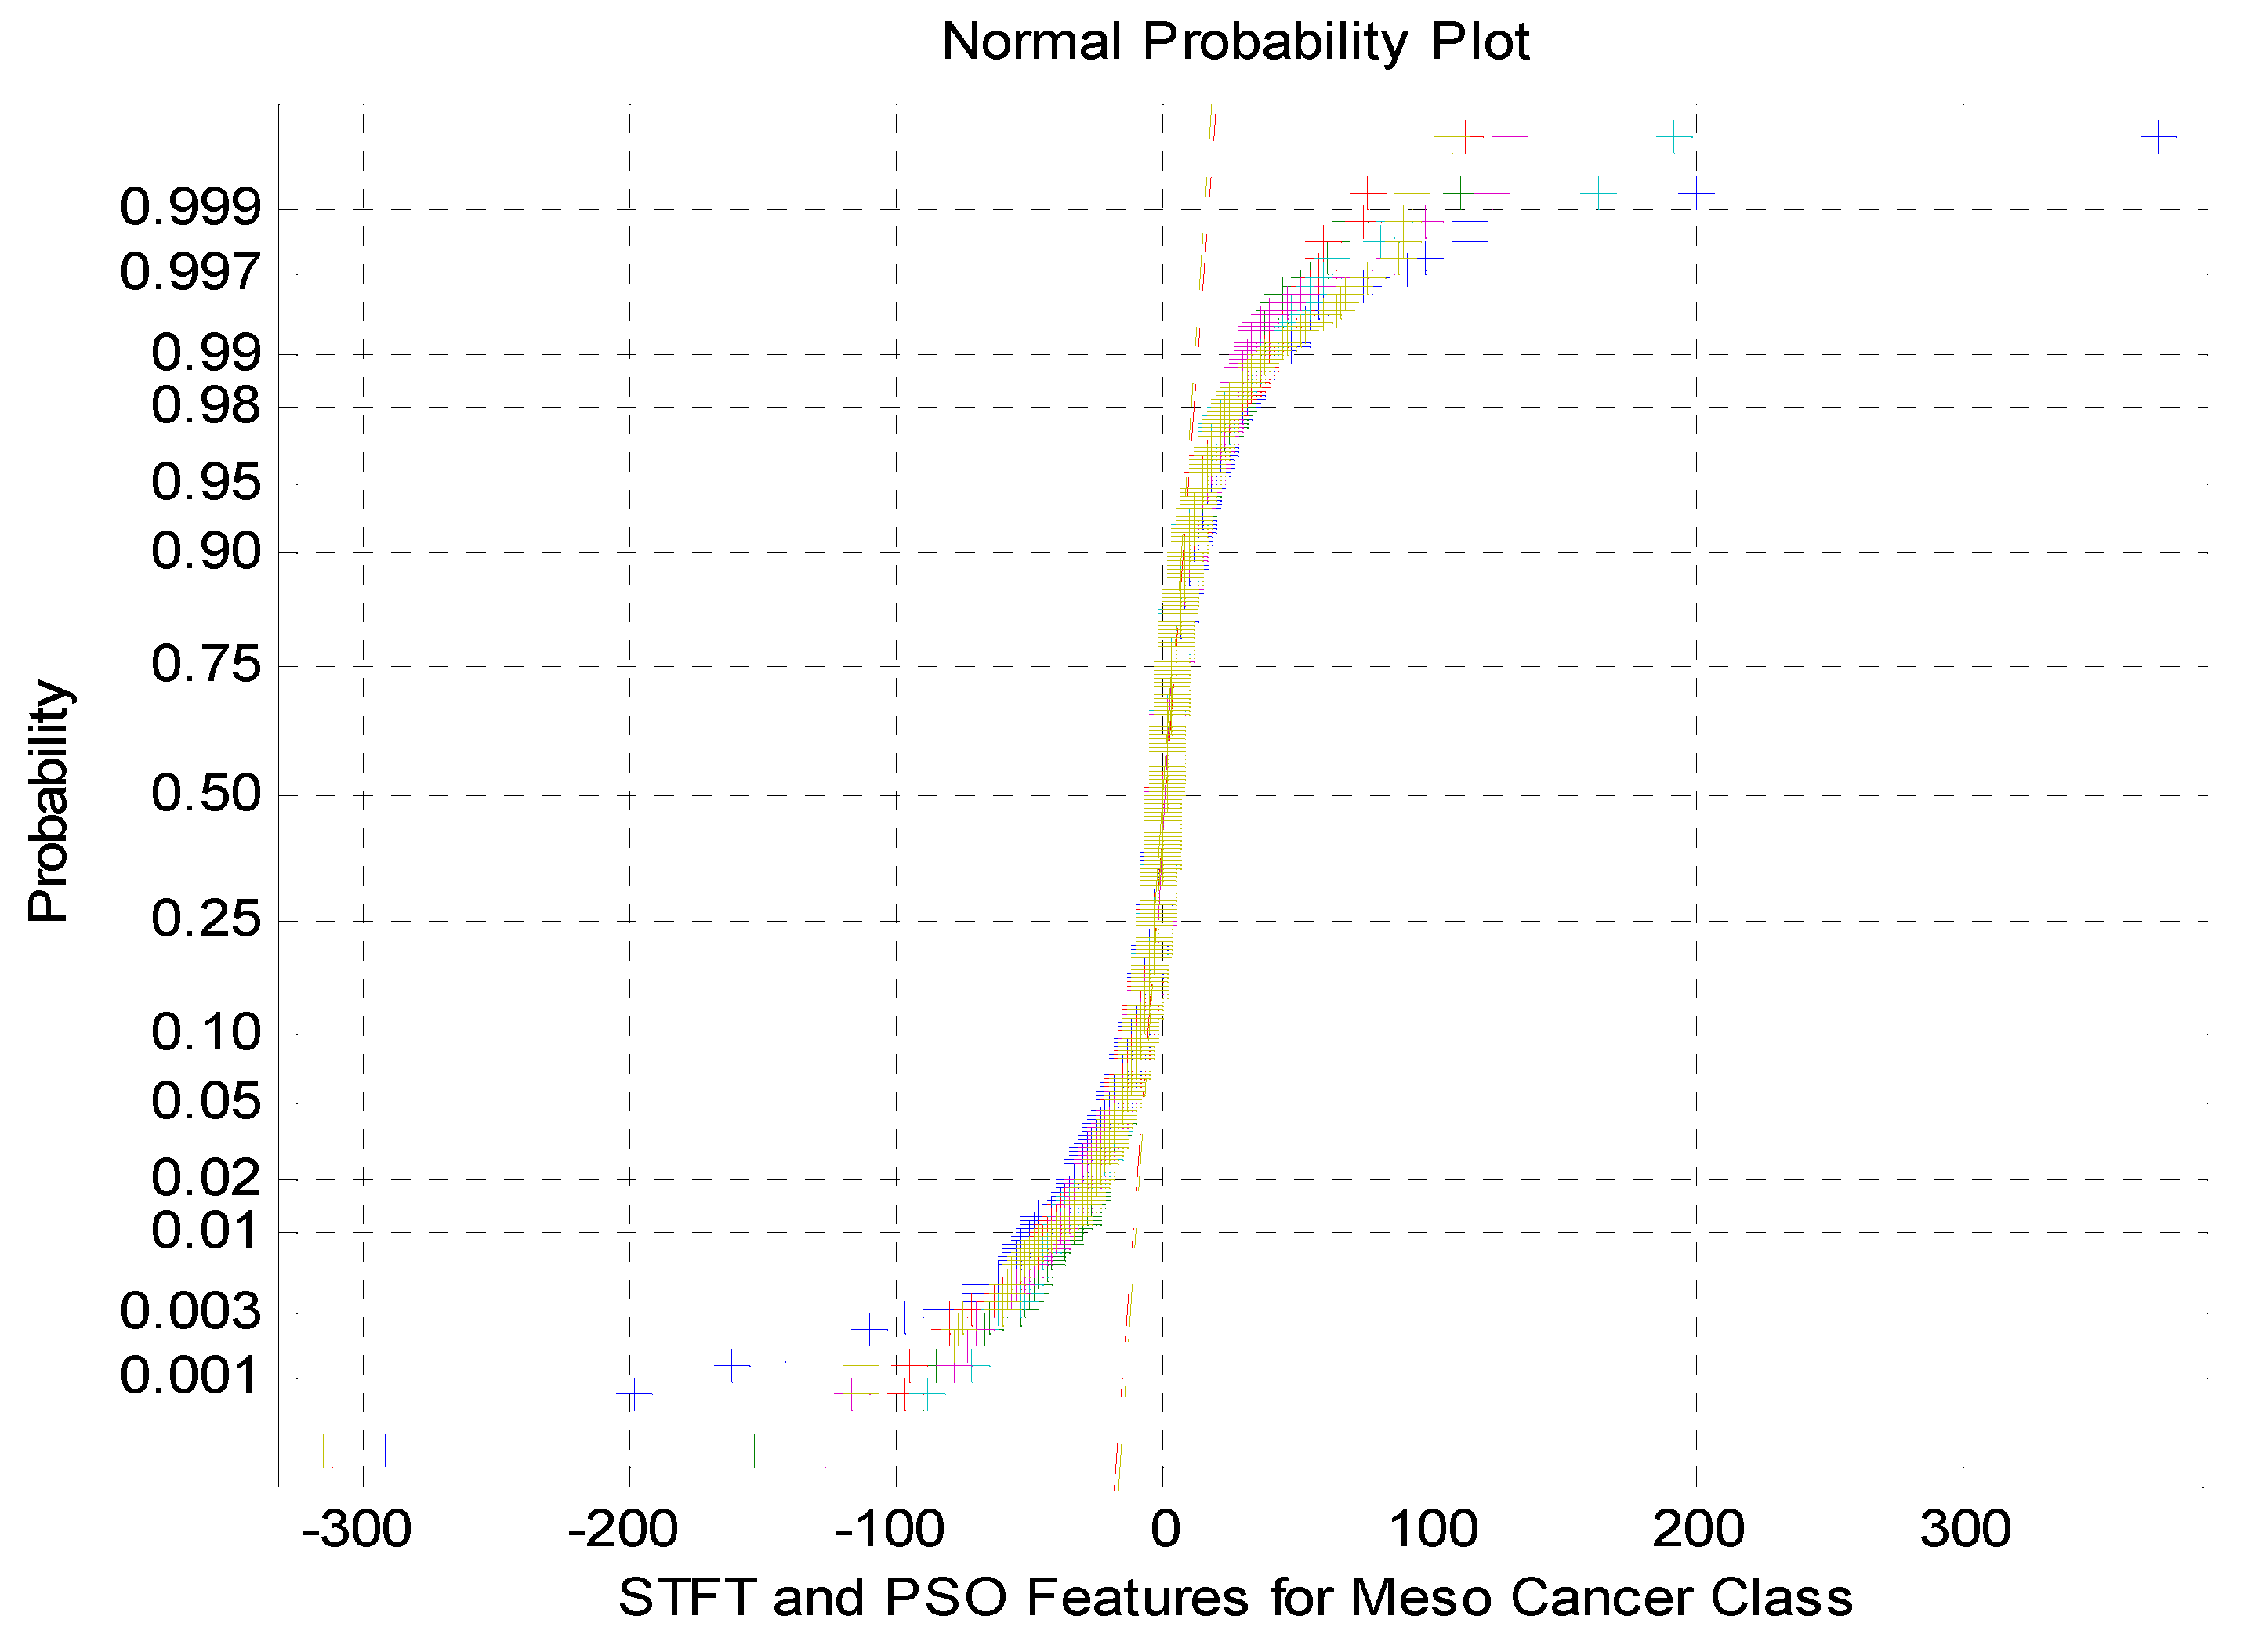
Figure 5.
Histogram for STFT Dimensionality Reduction Method with Harmonic Search Feature Selection in Adeno carcinoma Cancer Classes.
Figure 5.
Histogram for STFT Dimensionality Reduction Method with Harmonic Search Feature Selection in Adeno carcinoma Cancer Classes.
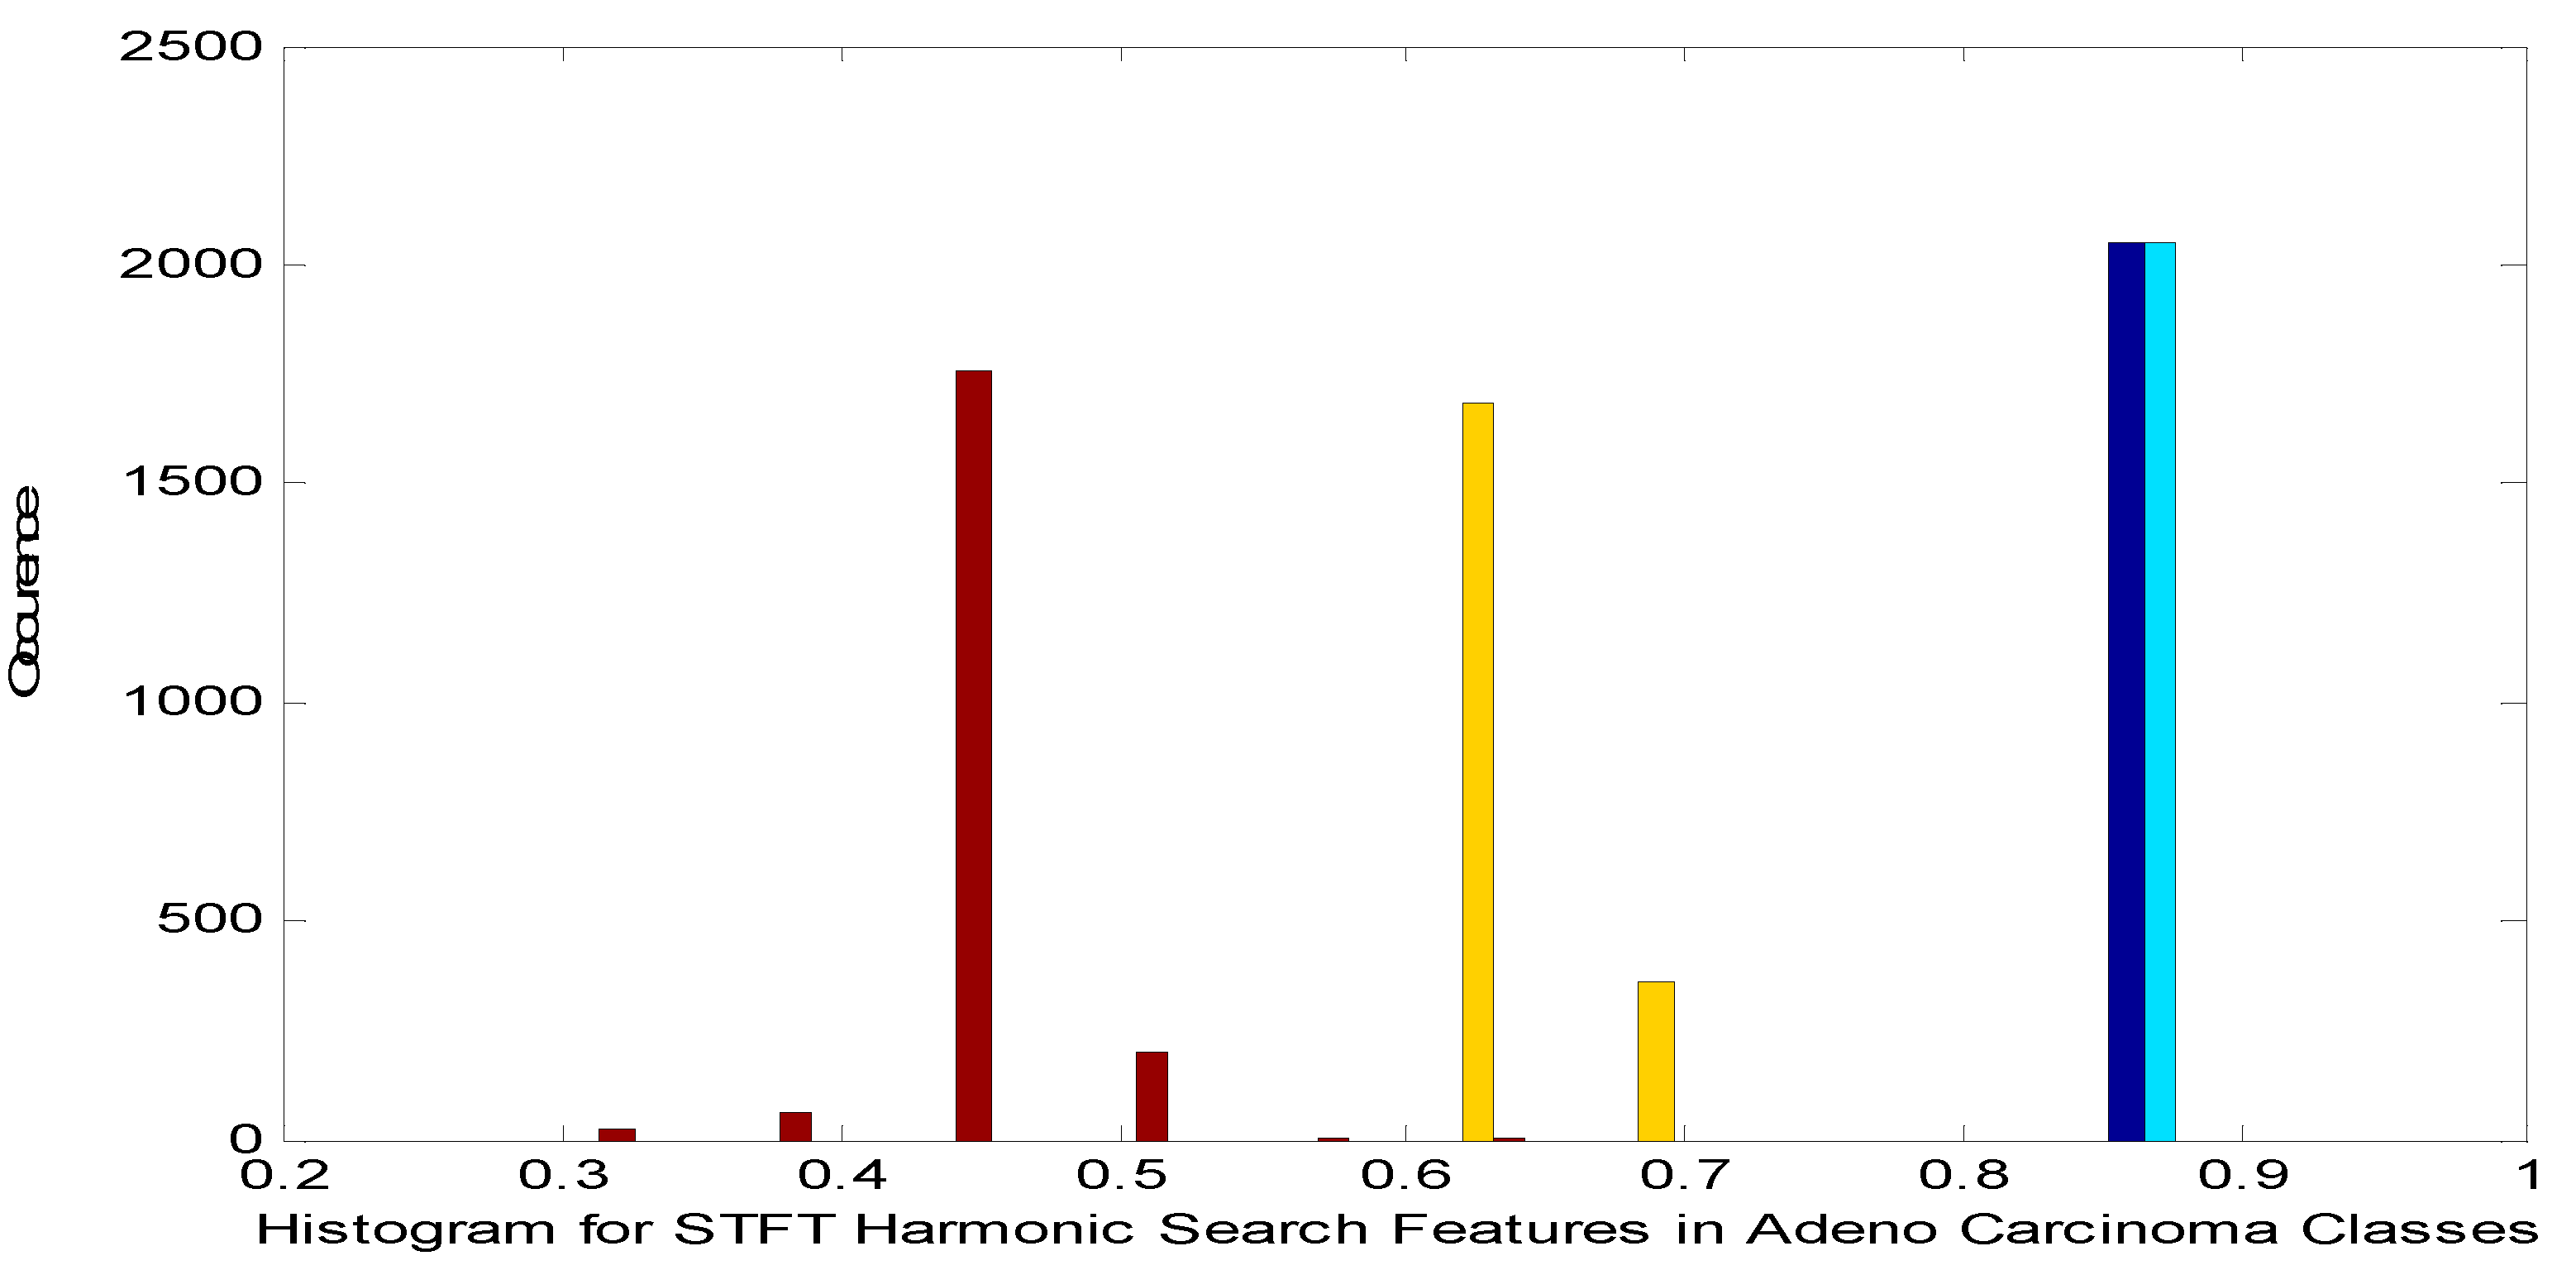
Figure 6.
Histogram for STFT Dimensionality Reduction Method with Harmonic Search Feature Selection in Meso carcinoma Cancer Classes.
Figure 6.
Histogram for STFT Dimensionality Reduction Method with Harmonic Search Feature Selection in Meso carcinoma Cancer Classes.
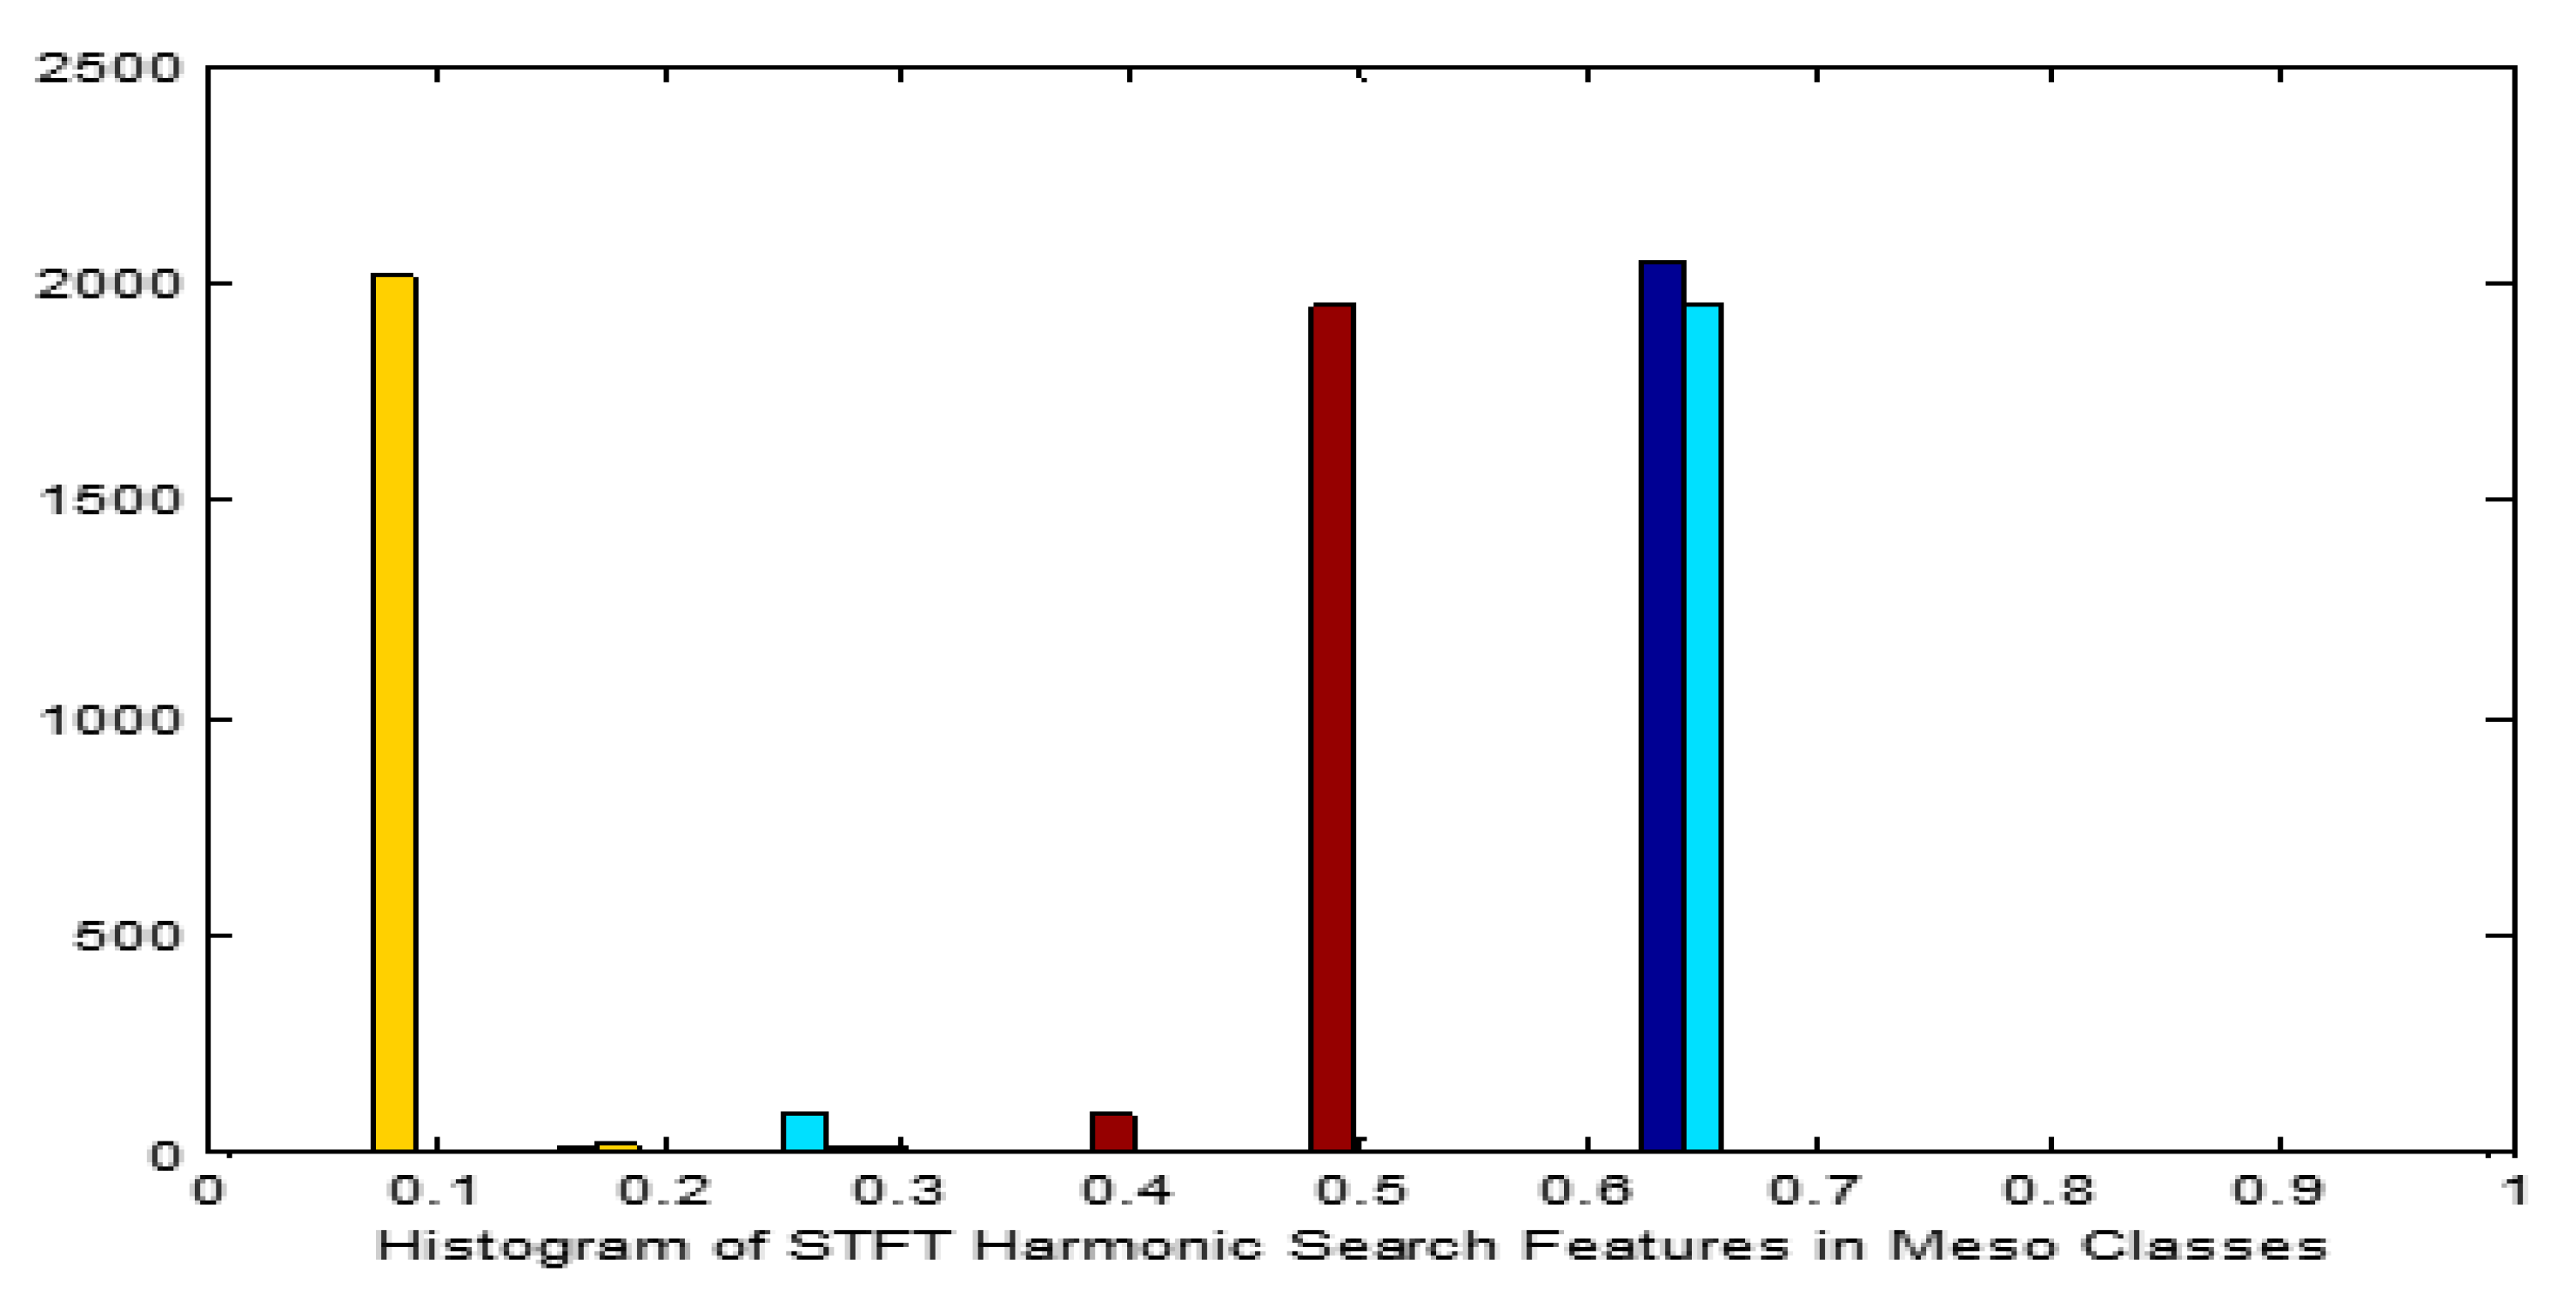
Figure 7.
CNN Classification Methodology.
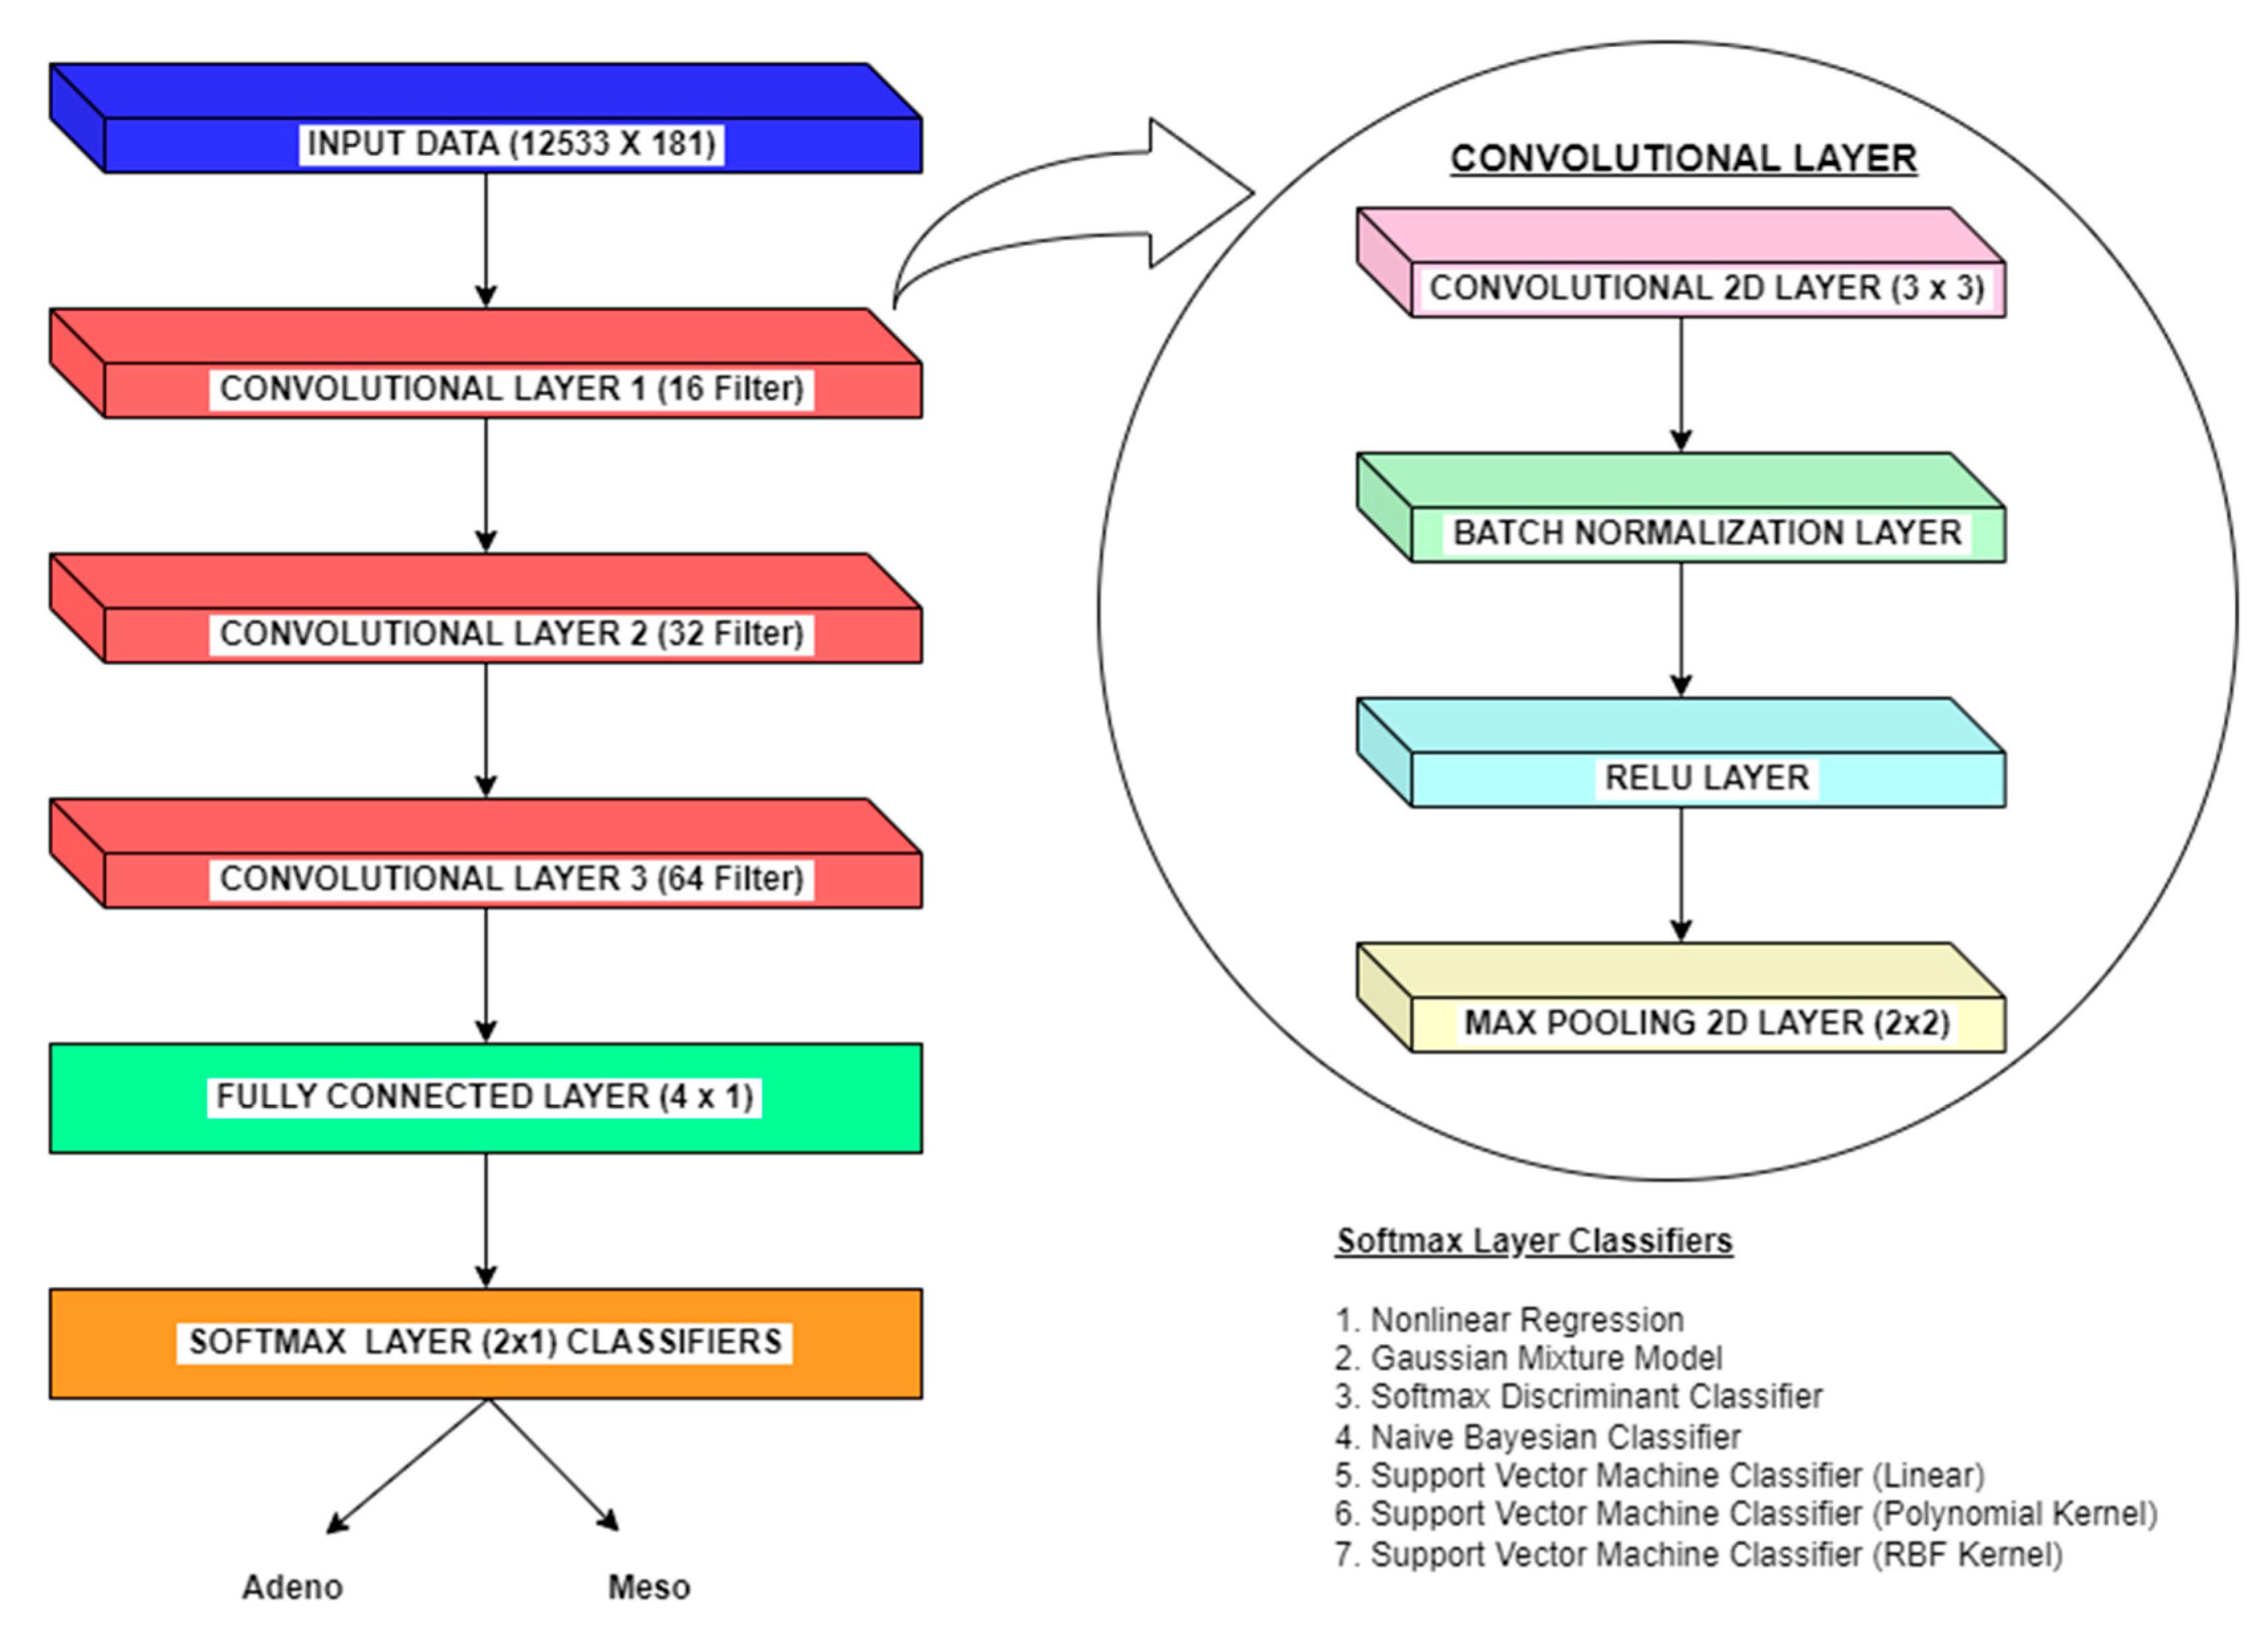
Figure 8.
Training and testingprogress of the first two epochs of SVM (RBF) Classifier in CNN Method with Raw Data.
Figure 8.
Training and testingprogress of the first two epochs of SVM (RBF) Classifier in CNN Method with Raw Data.
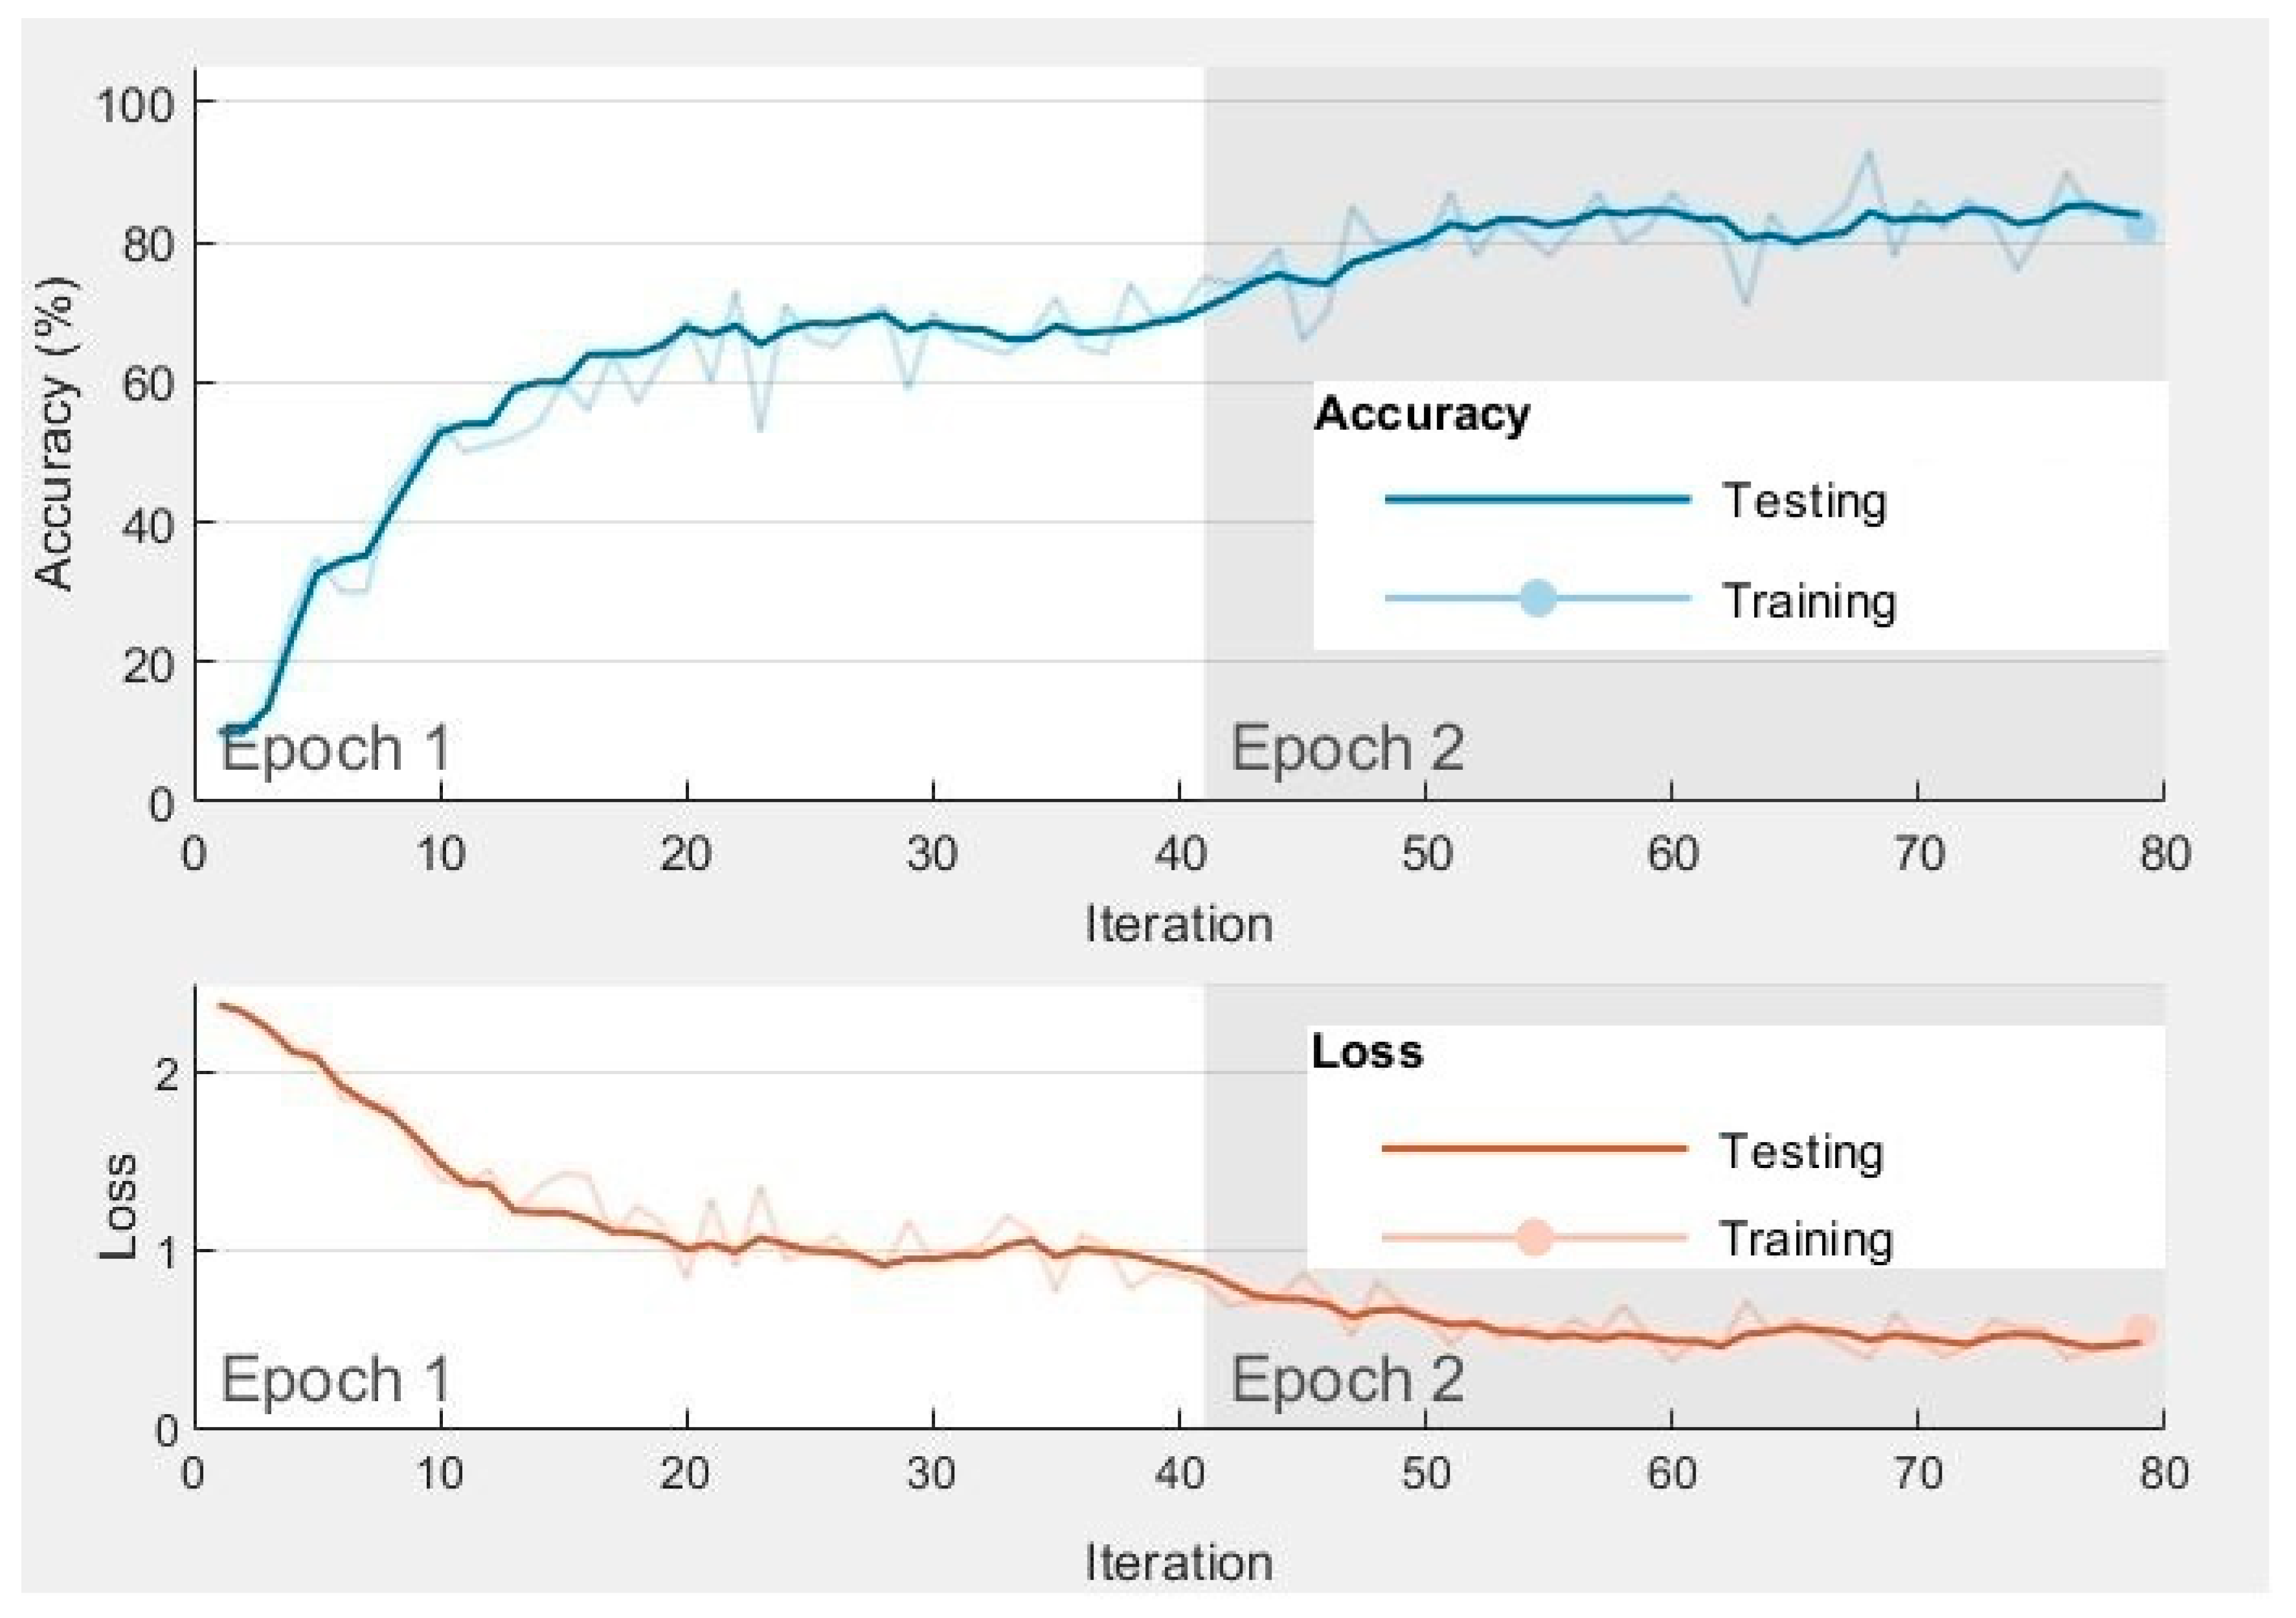
Figure 9.
Performance of Classifiers Without and With Feature Selection Methods in terms of MCC and Kappa Parameters.
Figure 9.
Performance of Classifiers Without and With Feature Selection Methods in terms of MCC and Kappa Parameters.
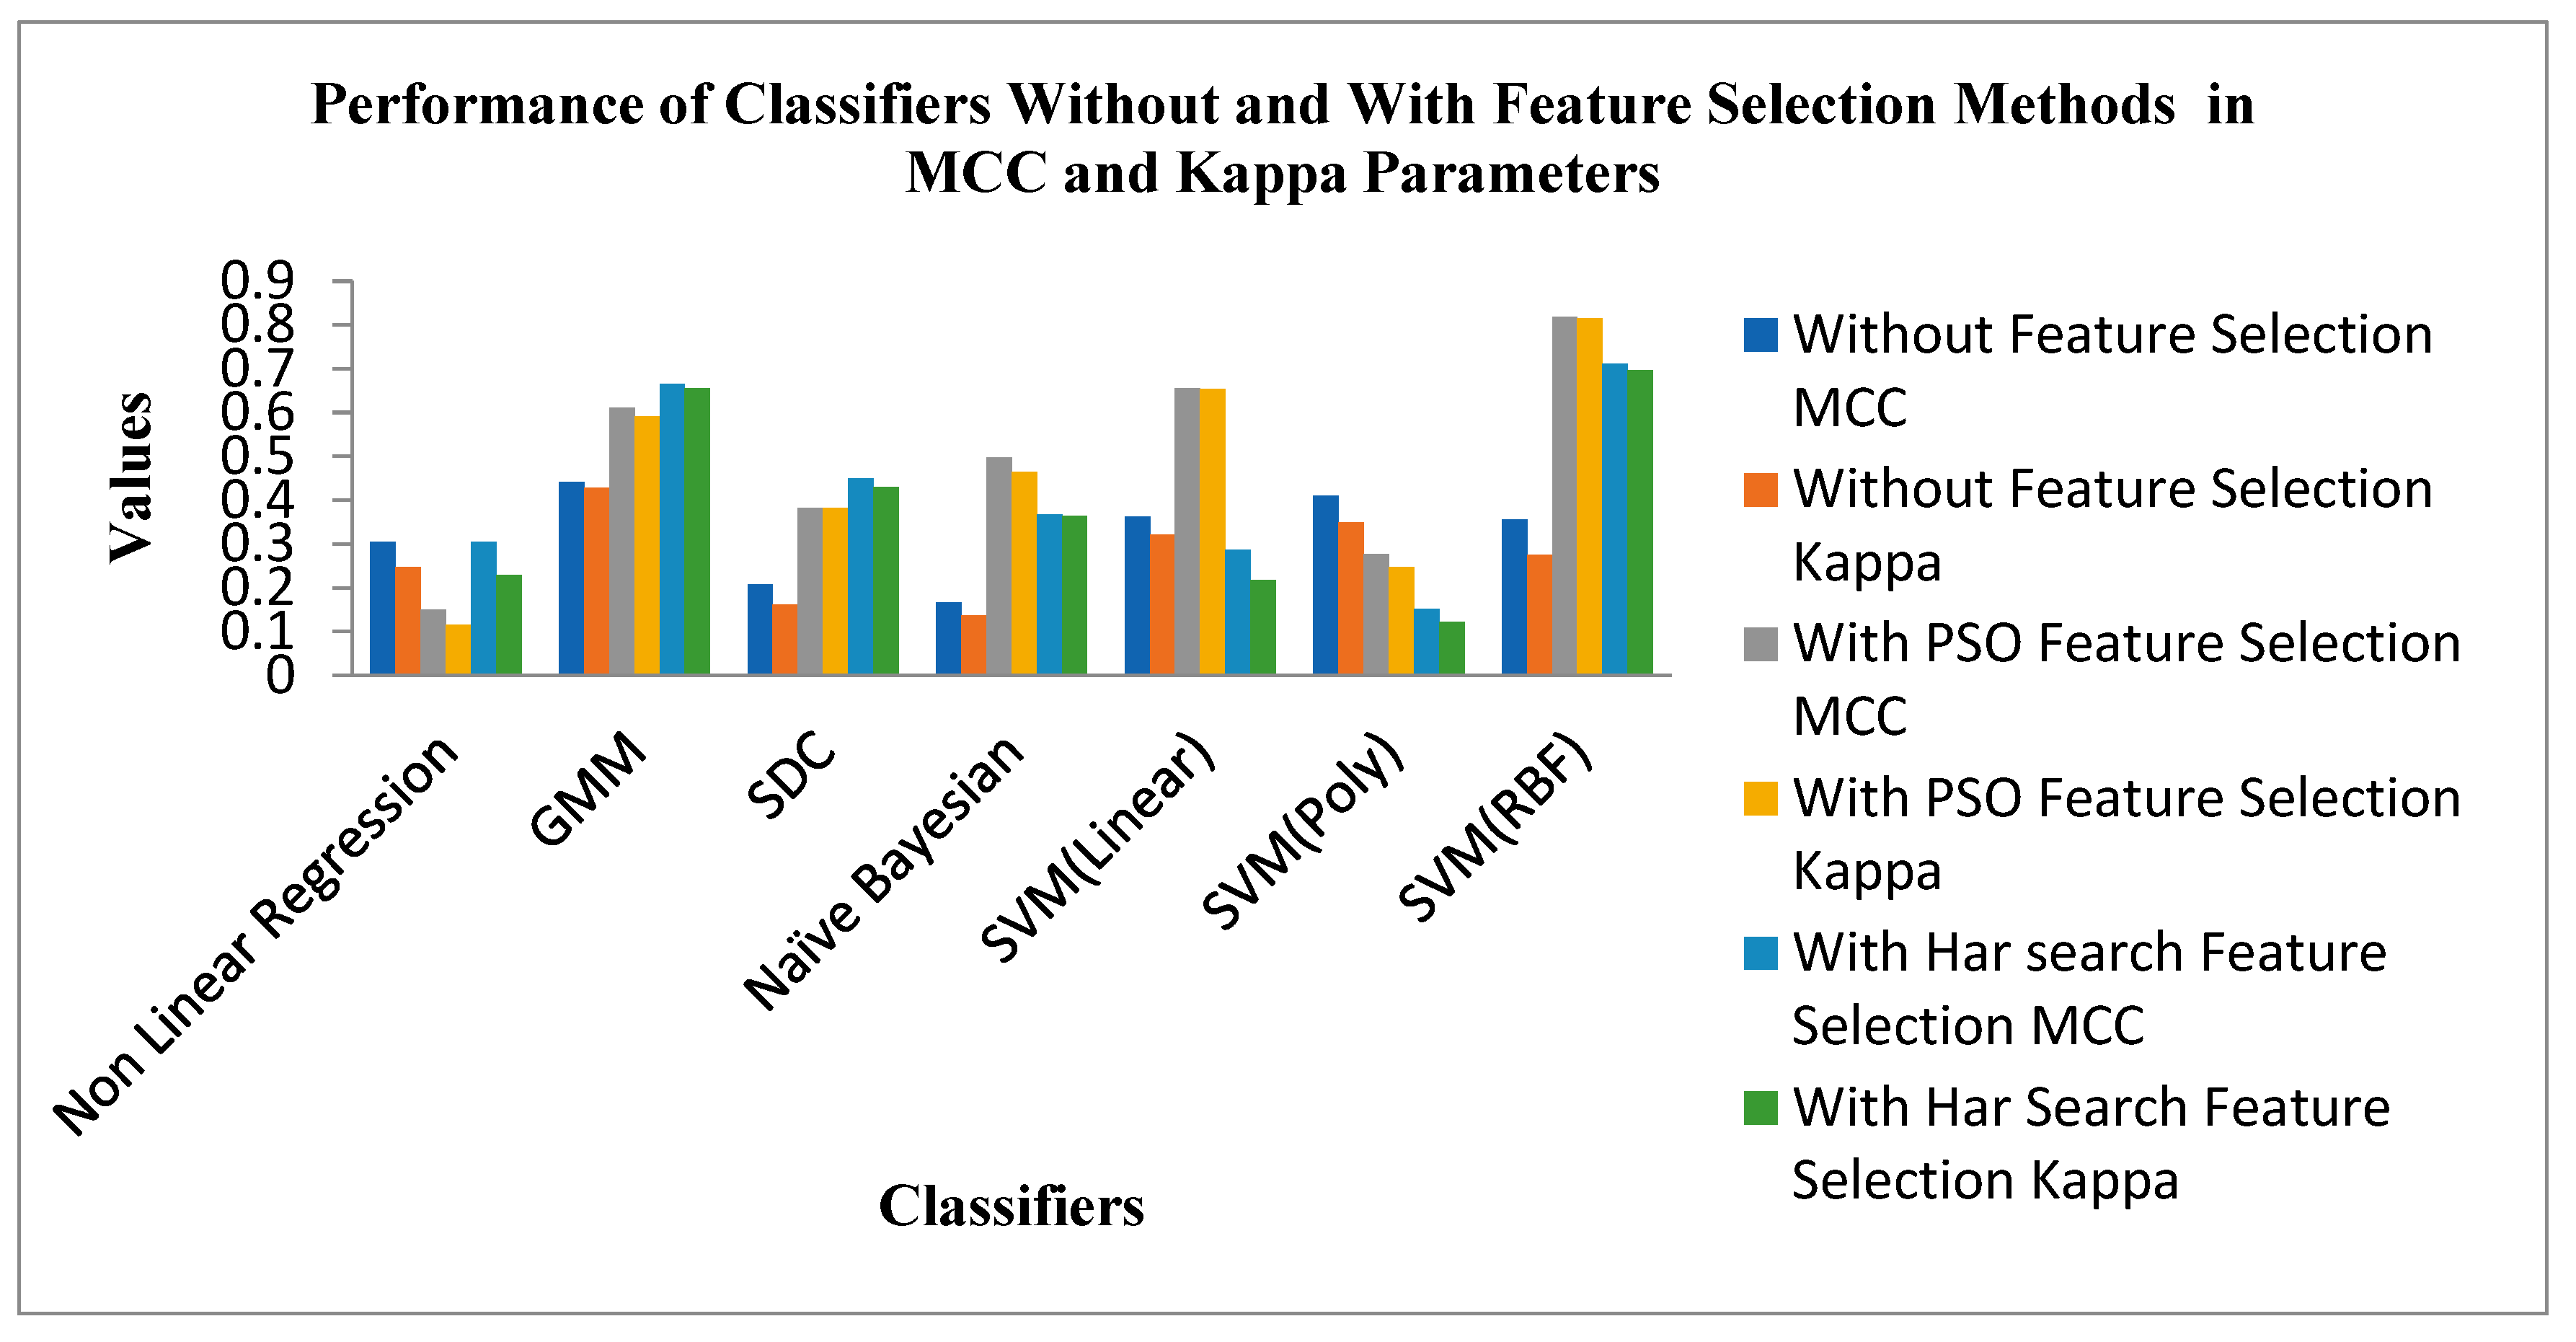
Figure 10.
Performance of Classifiers Without and With Feature Selection Methods in terms of Accuracy, F1 Score and Error Rate Parameters.
Figure 10.
Performance of Classifiers Without and With Feature Selection Methods in terms of Accuracy, F1 Score and Error Rate Parameters.
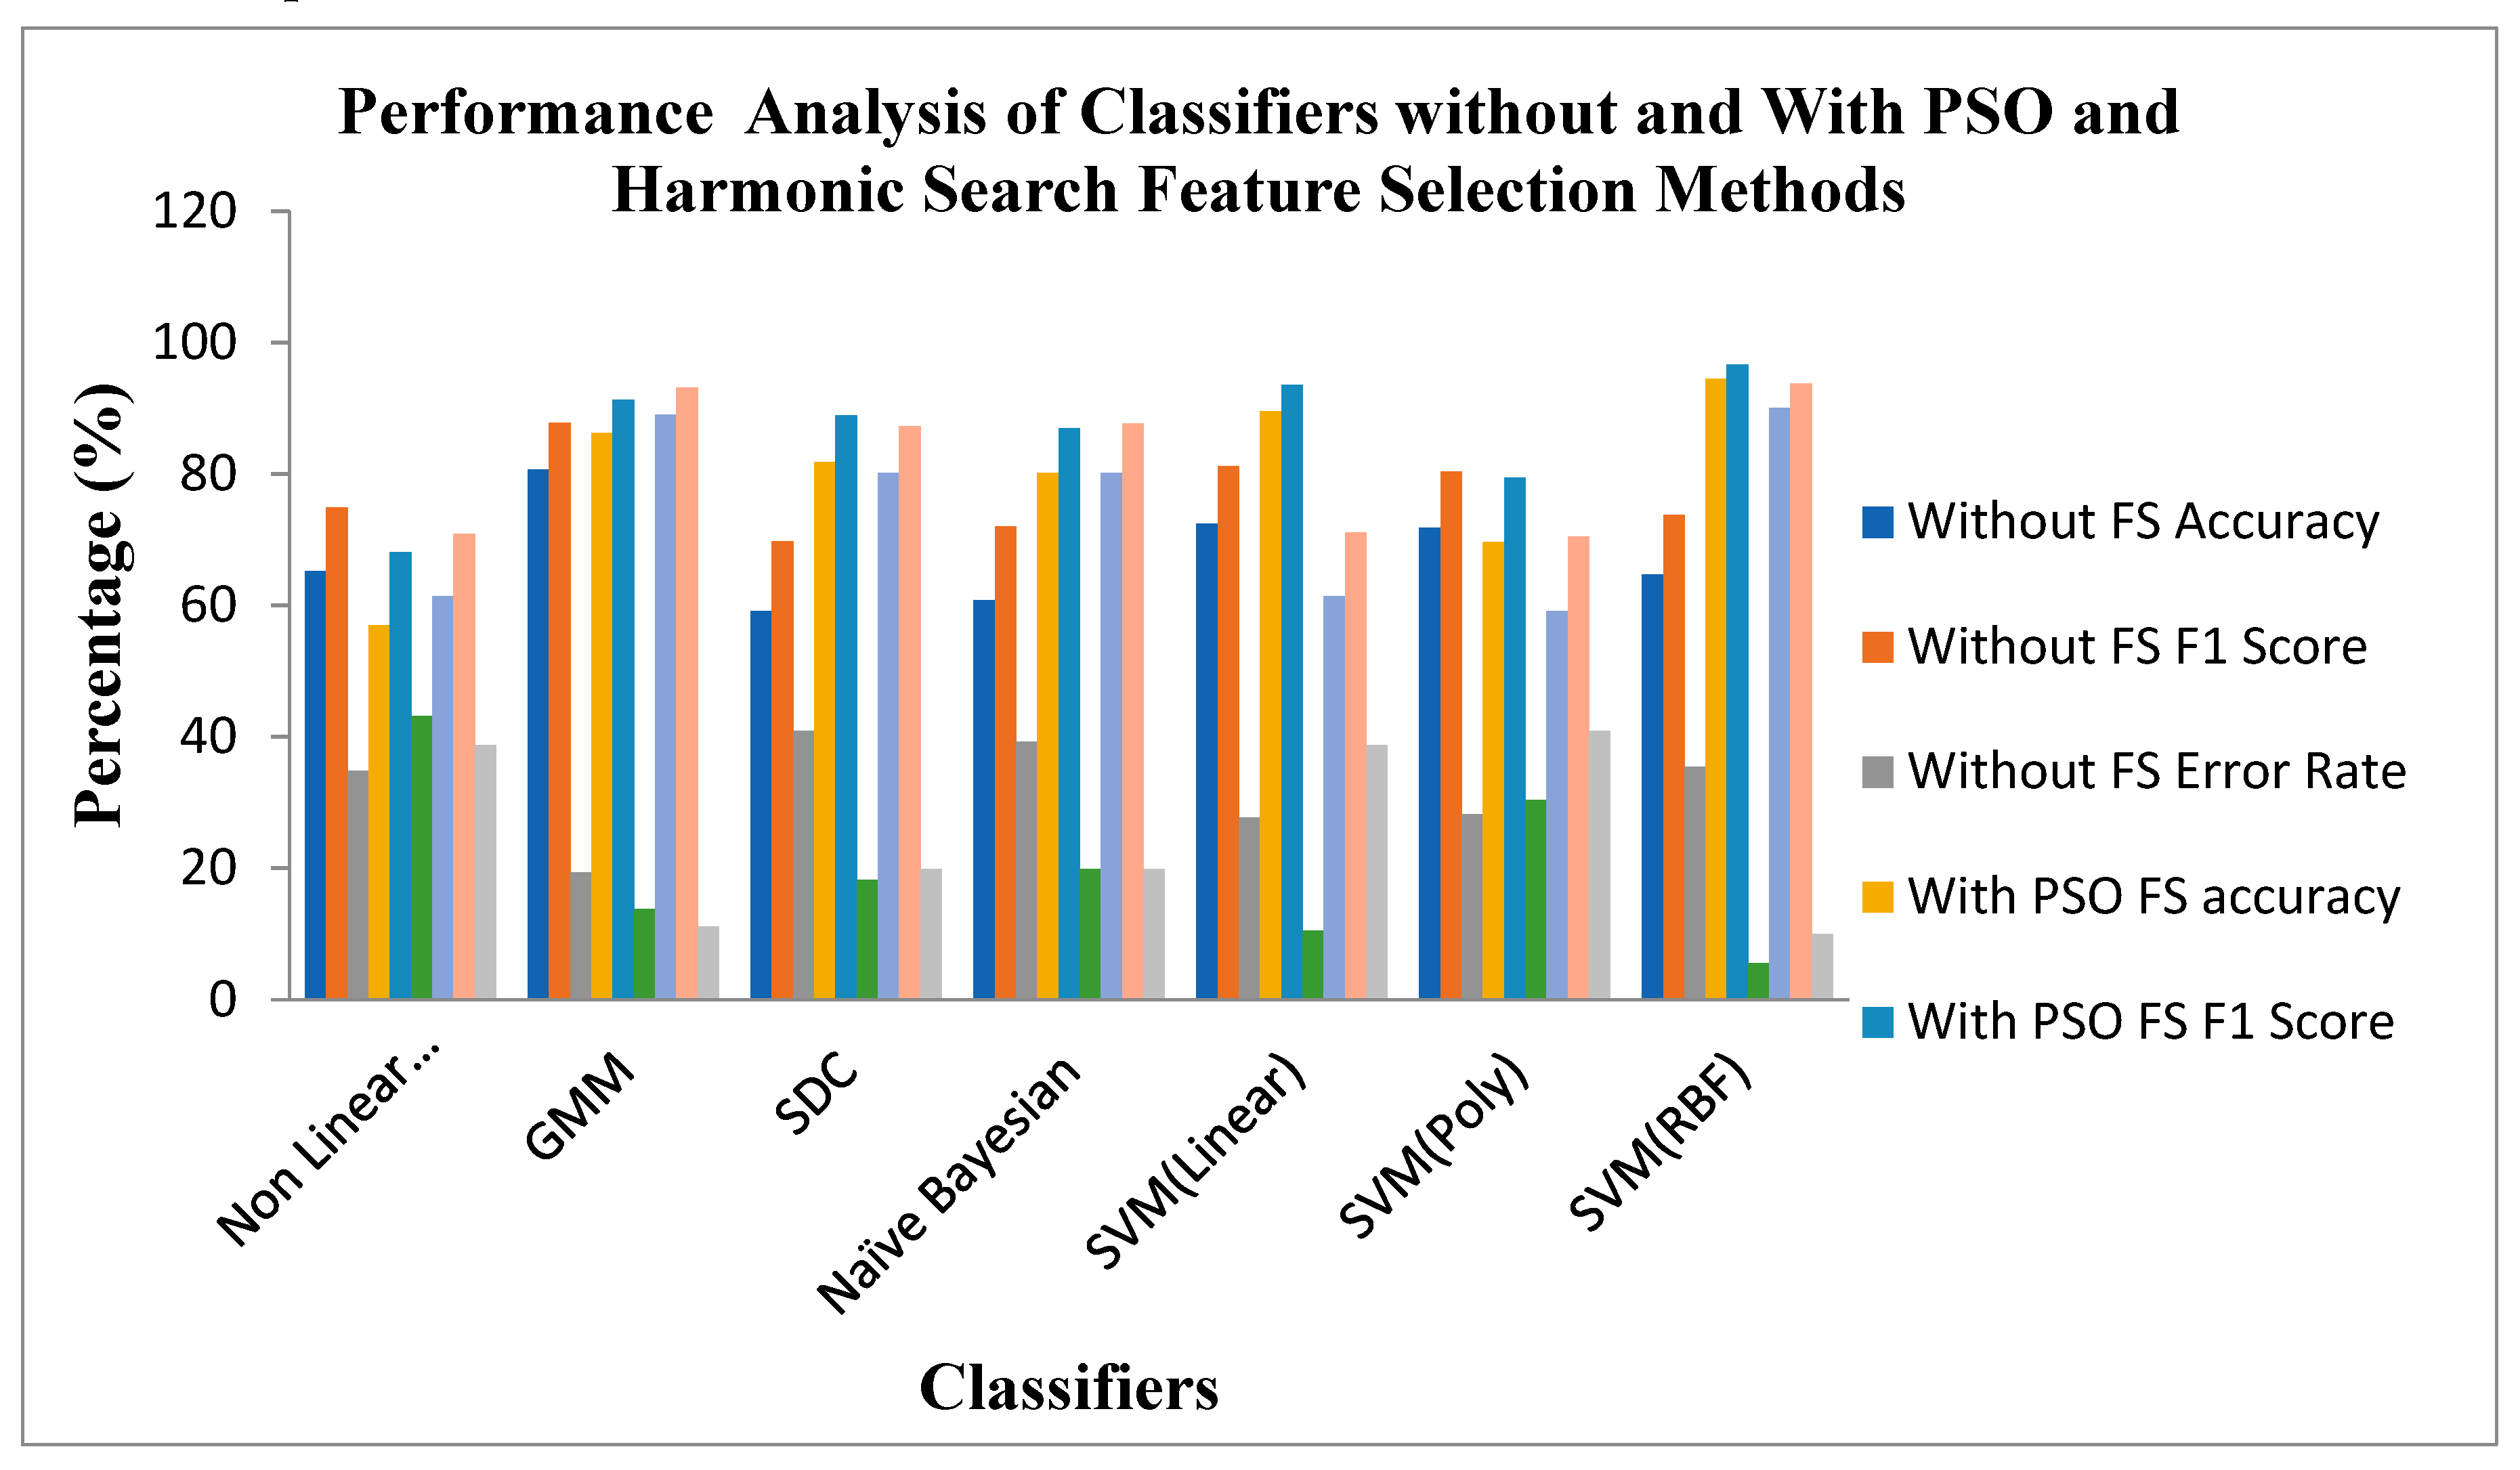
Figure 11.
Performance of Classifiers in terms of MCC and Kappa Parameters for Raw and STFT Inputs for CNN Methods.
Figure 11.
Performance of Classifiers in terms of MCC and Kappa Parameters for Raw and STFT Inputs for CNN Methods.
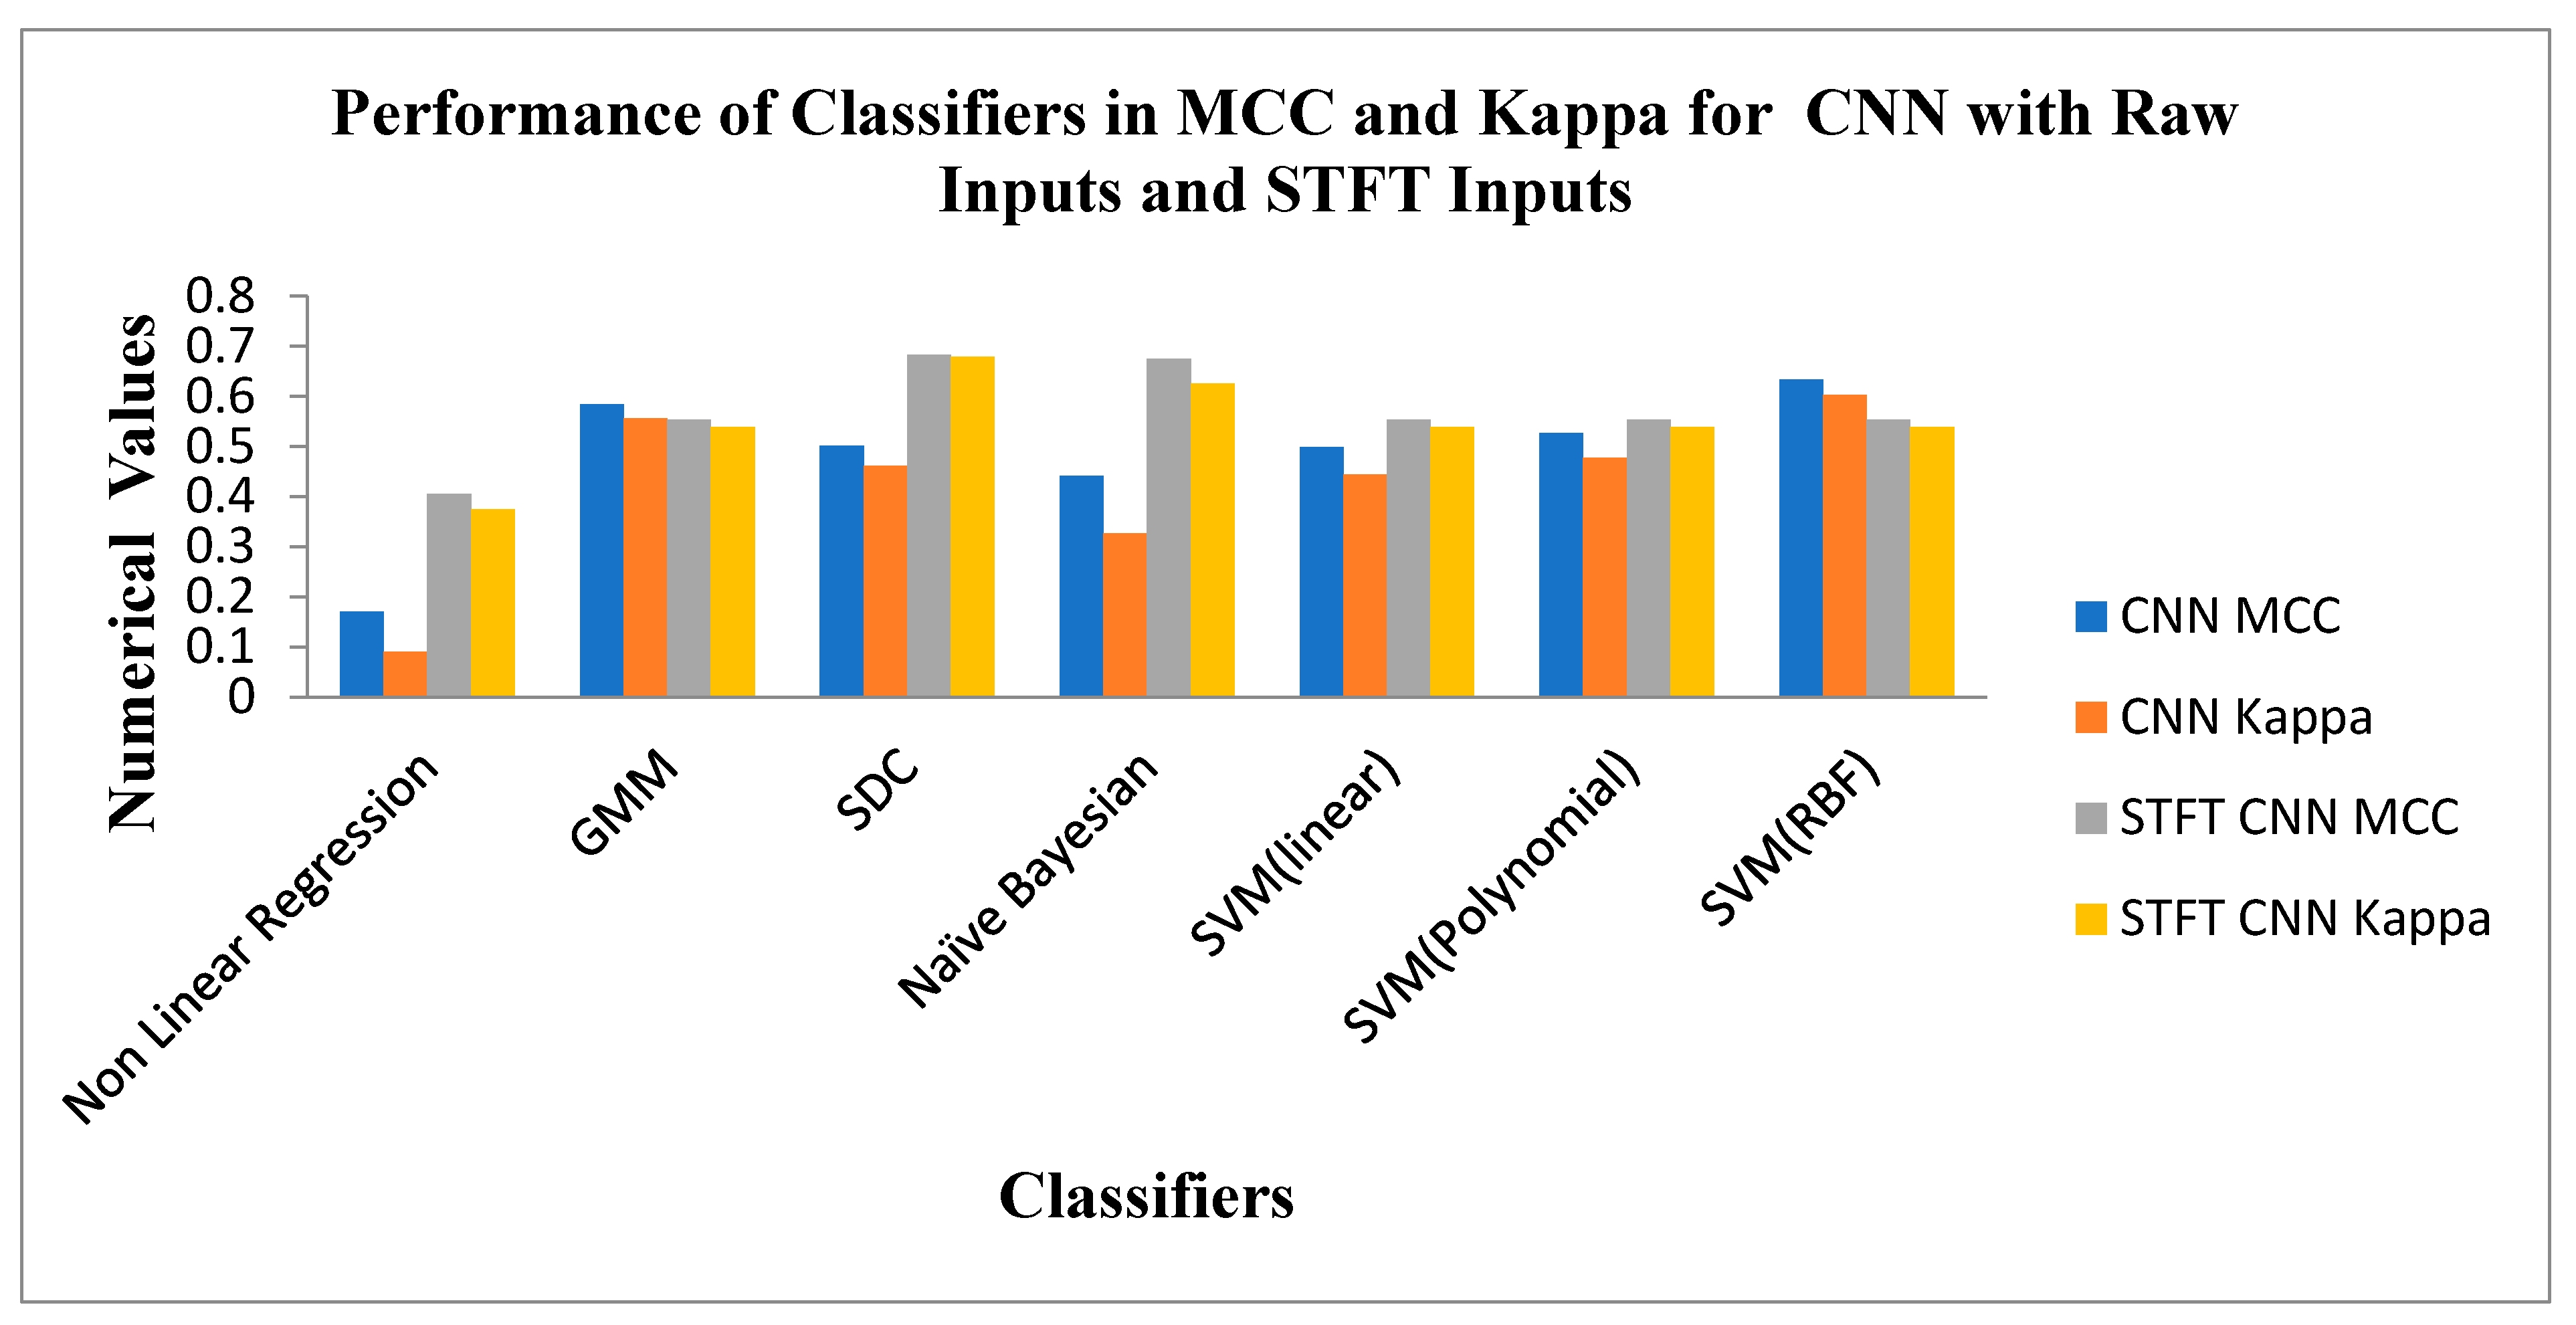
Figure 12.
Performance of Classifiers in terms of Accuracy, F1 Score and Error Rate Parameters for Raw and STFT Inputs in CNN Methods.
Figure 12.
Performance of Classifiers in terms of Accuracy, F1 Score and Error Rate Parameters for Raw and STFT Inputs in CNN Methods.
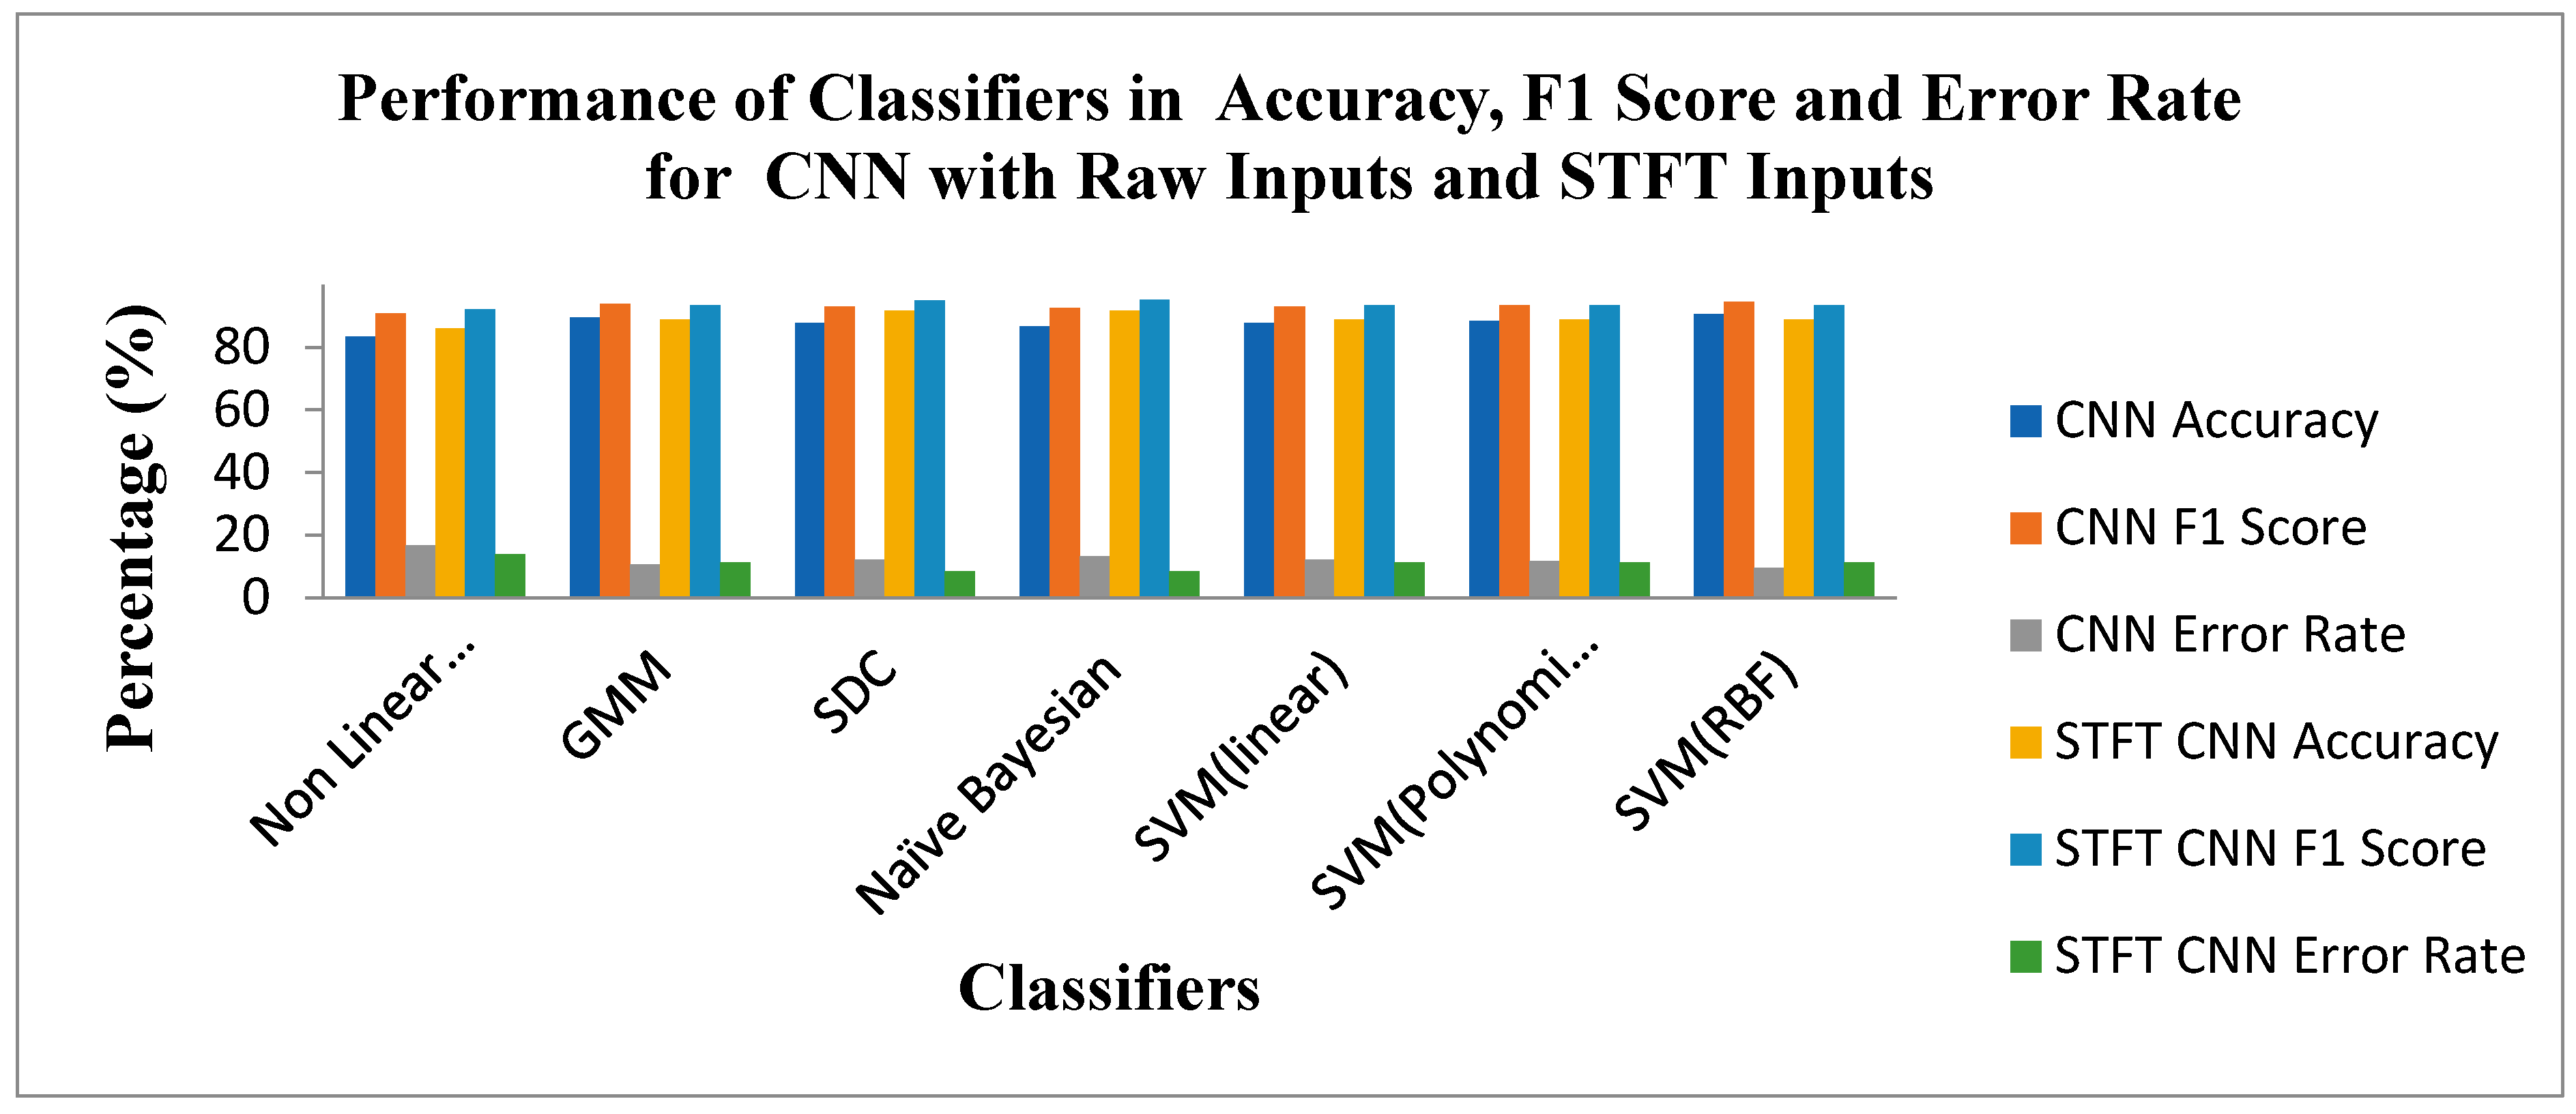
Figure 13.
Performance of Classifiers in terms of Deviation of MCC and Kappa Parameters with mean Values.
Figure 13.
Performance of Classifiers in terms of Deviation of MCC and Kappa Parameters with mean Values.
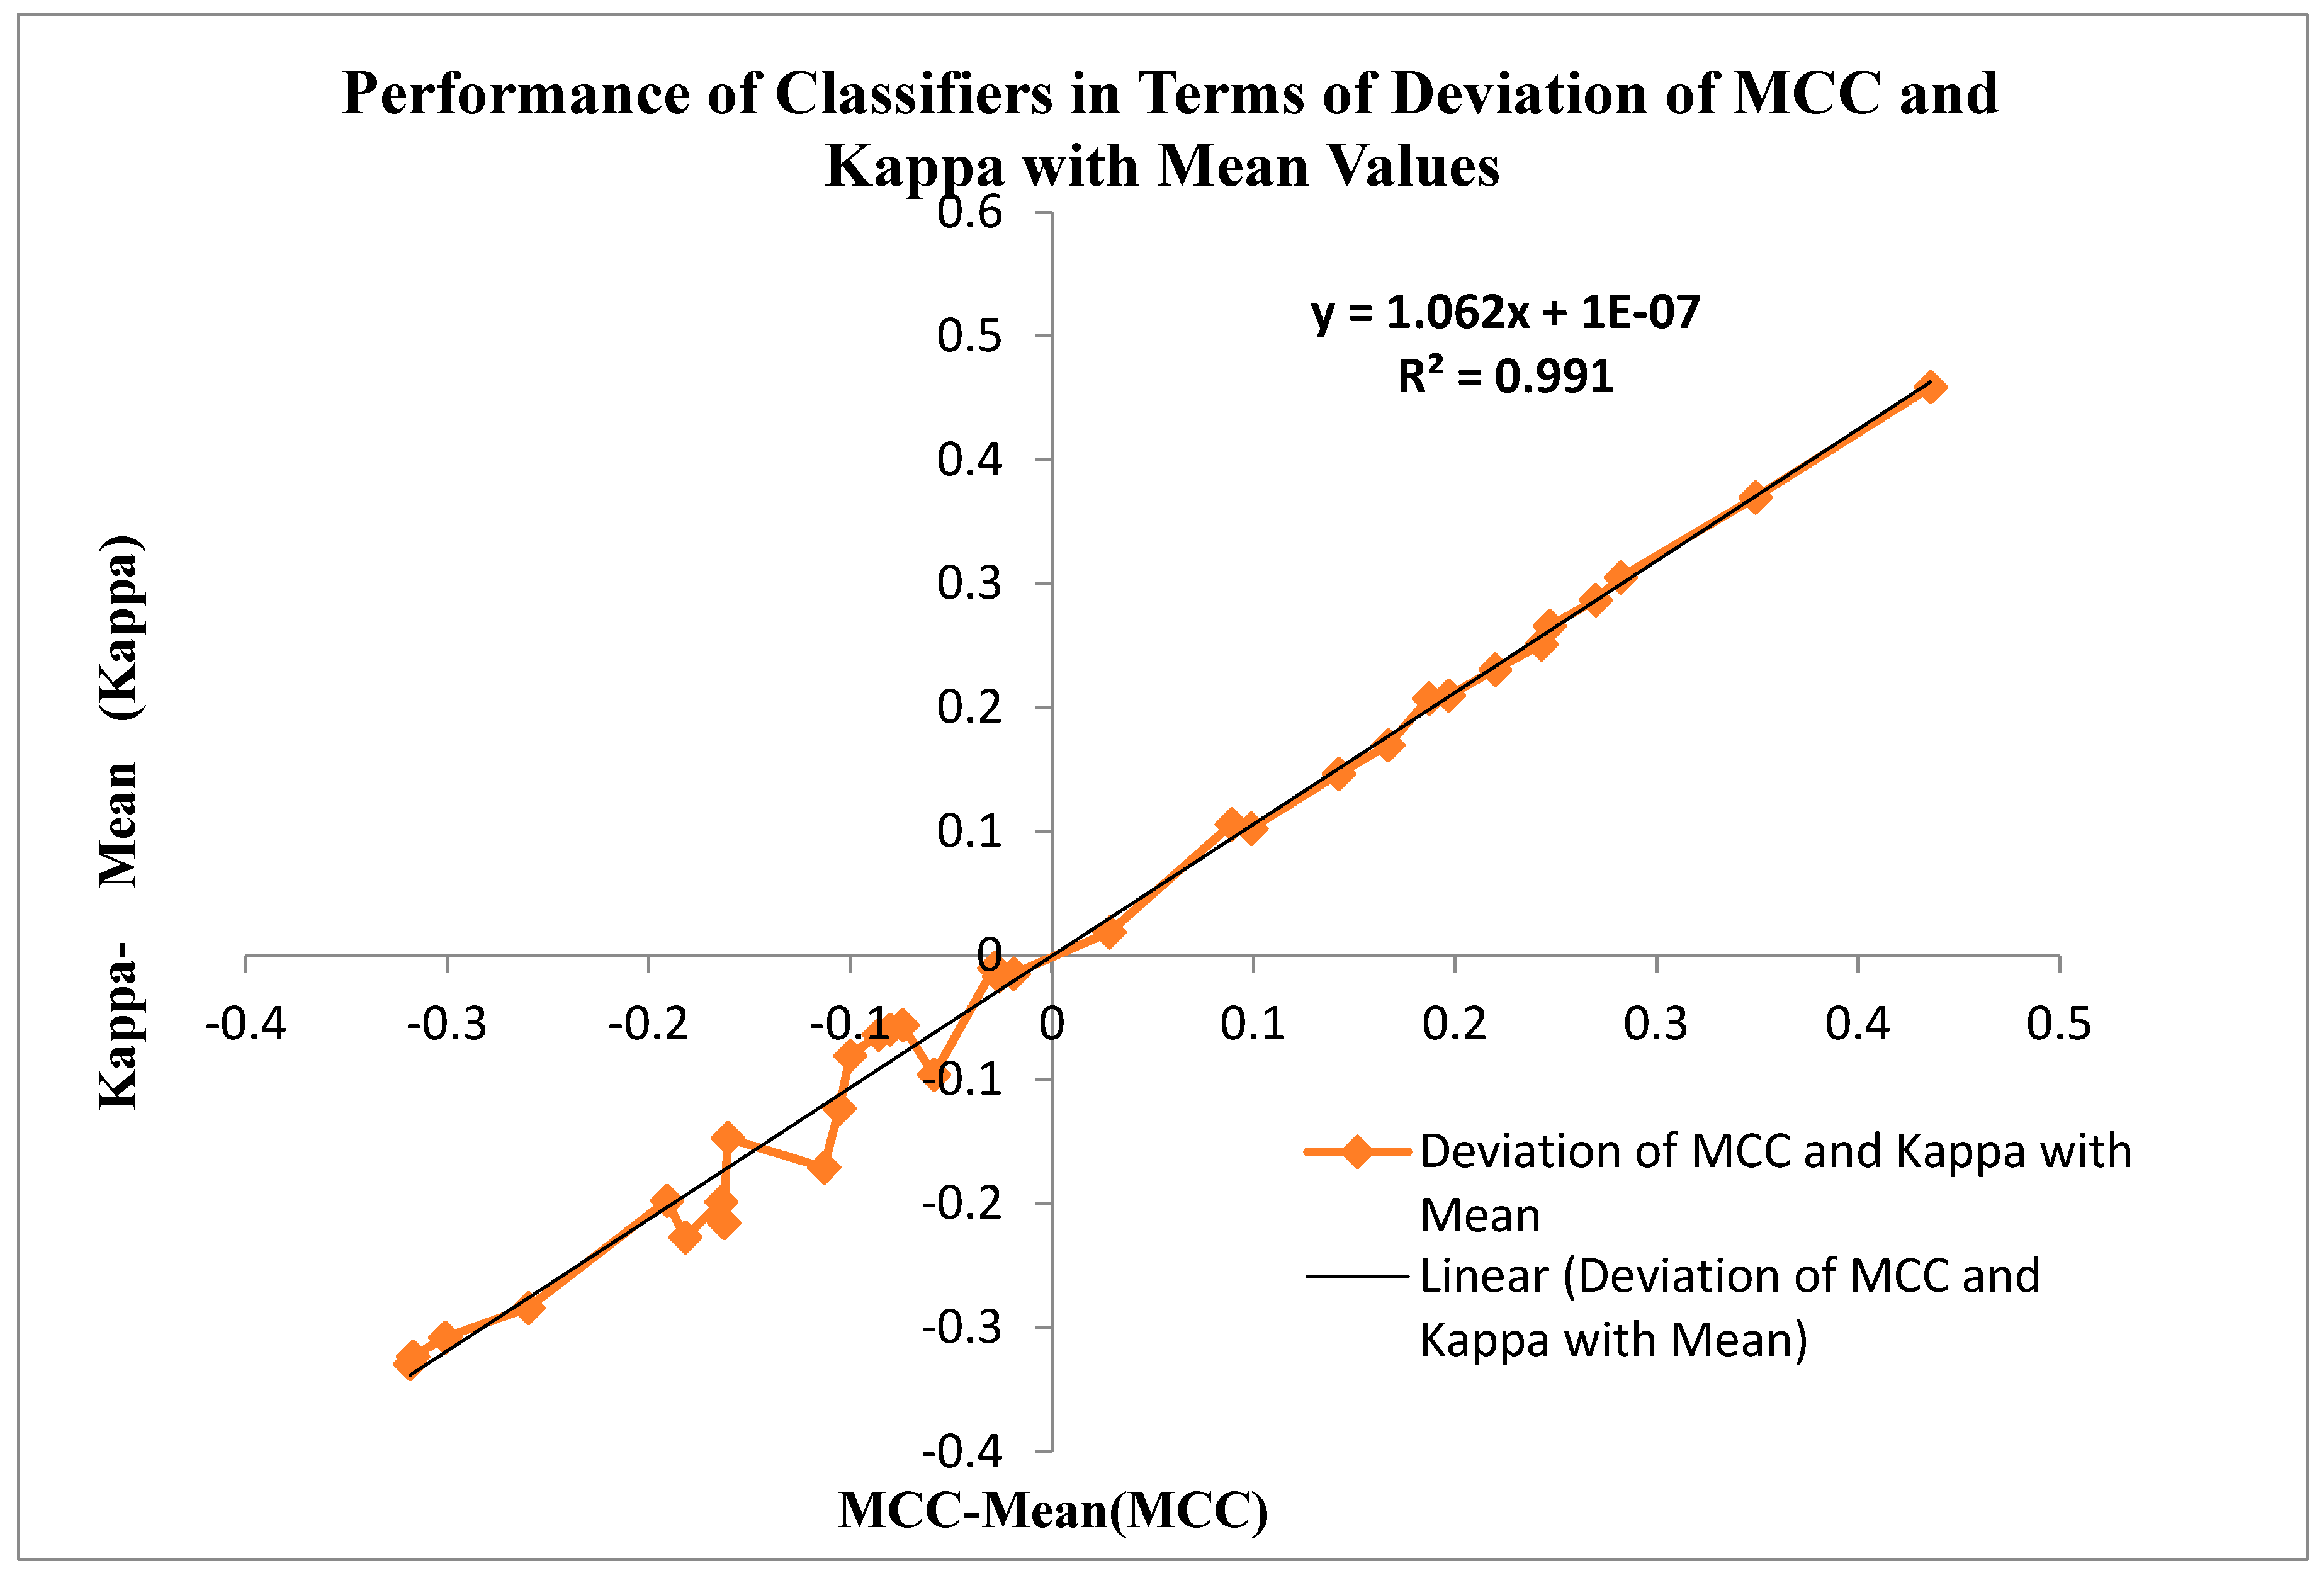

Table 1.
Average Statistical Features for STFT Dimensionally Reduced Adeno carcinoma and Meso Cancer Cases.
Table 1.
Average Statistical Features for STFT Dimensionally Reduced Adeno carcinoma and Meso Cancer Cases.
| Sl.No | Statistical Features | Cancer Classes | |
|---|---|---|---|
| Adenocarcinoma | Meso cancer | ||
| 1 | Mean | 7527.993 | 9410.937 |
| 2 | Variance | 7274816 | 8102763 |
| 3 | Skewness | 14.7733 | 14.68975 |
| 4 | Kurtosis | 272.0948 | 270.2702 |
| 5 | Pearson Correlation Coefficient (PCC) | 0.993359 | 0.993084 |
| 6 | F-test | 0.011166 | 0.390122 |
| 7 | T-test | 0.264175 | 0.000004 |
| 8 | p-value <0.01 | 0.4958 | 0.98 |
| 9 | Permutation Entropy | 0.6931 | 0.6931 |
| 10 | Sample Entropy | 11.0007 | 11.0007 |
| 11 | Canonical Correlation Analysis (CCA) | 0.367333 | |
Table 2.
Analysis of Friedman Test in Feature Selection Methods on STFT Data.
| Sl.No | Feature Selection Methods | Parameters | AdenoCarcinoma Cancer | Meso Cancer |
|---|---|---|---|---|
| 1 | PSO | X2r statistic | 2.326 | 1.376 |
| p-value | 0.67604. | 0.84836. | ||
| p < .01 | Not Significant | Not Significant | ||
| 2 | Harmonic Search | X2r statistic | 6.39 | 1.18 |
| p-value | 0.17185 | 0 .88138 | ||
| p < .01 | Not Significant | Not Significant |
Table 3.
Confusion matrix for Lung Cancer Detection
| Truth of Clinical Situation | Predicted Values | ||
|---|---|---|---|
| Adeno Carcinoma | Meso cancer | ||
| Actual Values | Adeno Carcinoma | TP | FN |
| Meso cancer | FP | TN | |
Table 4.
Training and Testing MSE Analysis of Classifiers for STFT Dimensionality Reduction Technique without and with PSO and Harmonic Search Feature Selection.
Table 4.
Training and Testing MSE Analysis of Classifiers for STFT Dimensionality Reduction Technique without and with PSO and Harmonic Search Feature Selection.
| Classifiers | Without Feature Selection | With PSO Feature Selection | With Harmonic Search Feature Selection | |||
|---|---|---|---|---|---|---|
| Training MSE | Testing MSE | Training MSE | Testing MSE | Training MSE | Testing MSE | |
| Non Linear Regression | 1.68E-07 | 5.63E-06 | 4.9E-07 | 1.32E-05 | 6.25E-06 | 9.6E-06 |
| GMM | 3.6E-08 | 7.21E-07 | 6.76E-08 | 4.84E-06 | 9E-07 | 1.96E-06 |
| SDC | 3.25E-07 | 8.84E-05 | 2.89E-07 | 3.61E-06 | 2.35E-07 | 1.16E-06 |
| Naïve Bayesian | 5.48E-07 | 6.24E-05 | 1.09E-07 | 1.52E-05 | 1.32E-07 | 6.76E-06 |
| SVM(Linear) | 2.02E-07 | 2.51E-05 | 1.76E-07 | 1.1E-06 | 1.22E-07 | 8.1E-05 |
| SVM(Poly) | 9E-07 | 3.48E-05 | 4.9E-08 | 3.03E-05 | 6.4E-07 | 7.06E-05 |
| SVM(RBF) | 4.84E-07 | 6.56E-05 | 2.25E-09 | 3.6E-08 | 2.56E-08 | 1.96E-07 |
Table 5.
Selection of Classifier Parameters.
| Classifiers | Description |
|---|---|
| NLR | Class target T1= 0.85 and T2=0.65, k1, k2, and k3 is from equation (4), Convergence Criteria: MSE |
| GMM | Mean, Covariance of the input samples, and tuning parameters with test point likelihood probability 0.1, cluster probability of 0.5, with convergence rate of 0.6, Convergence Criteria: MSE |
| SDC | γ = 0.5, along with mean of each class target values as 0.65 and 0.85, Class Weights (w) : 0.4, Bias (b): 0.05, Convergence Criteria: MSE |
| NBC | Smoothing parameter (alpha): 0.06, Prior Probabilities: 0.15, Convergence Criteria: MSE |
| SVM (Linear) | α (Regularization Parameter): 0.85, w : 0.4, b: 0.01, Convergence Criteria: MSE |
| SVM (Polynomial) | α: 0.76, Coefficient of the kernel function (γ): 10, w: 0.5, b: 0.01, Convergence Criteria: MSE |
| SVM (RBF) | α: 1, Kernel width parameter (σ): 100, w: 0.86, b: 0.01, Convergence Criteria: MSE |
Table 6.
Training and Testing Parameters of CNN Methodologyfor Raw Data and STFT Dimensionally reduced inputs.
Table 6.
Training and Testing Parameters of CNN Methodologyfor Raw Data and STFT Dimensionally reduced inputs.
| Parameter | Value |
|---|---|
| Number of cross-validation | 10 |
| Learning rate | 0.01 |
| Number of mini batch | 100 |
| Maximum number of Epochs | 10 |
| Number of convolutional layer | 3 |
| Number of fully connected layer | 4 |
| Number of filter in first convolutional layer | 16 |
| Size of filter in first convolutional layer | 3 x 3 |
| Number of filter in second convolutional layer | 32 |
| Size of filter in second convolutional layer | 3 x 3 |
| Number of filter in third convolutional layer | 64 |
| Size of filter in third convolutional layer | 3 x 3 |
| Loss Function | Cross Entropy |
Table 7.
Training and Testing Accuracy Analysis of variousClassifiers in CNN Method with Raw Data and STFT features.
Table 7.
Training and Testing Accuracy Analysis of variousClassifiers in CNN Method with Raw Data and STFT features.
| Classifiers | CNN methods with Raw Data | CNN methods with STFT Features | ||
|---|---|---|---|---|
| Training Accuracy | Testing Accuracy | Training Accuracy | Testing Accuracy | |
| Non Linear Regression | 87.235 | 83.42541 | 89.327 | 86.11111 |
| GMM | 92.752 | 89.50276 | 91.458 | 88.88889 |
| SDC | 90.516 | 87.8453 | 94.372 | 91.66667 |
| Naïve Bayesian | 90.023 | 86.74033 | 94.4527 | 91.66667 |
| SVM(Linear) | 91.358 | 87.8453 | 91.753 | 88.88889 |
| SVM(Poly) | 90.145 | 88.39779 | 91.991 | 88.88889 |
| SVM(RBF) | 93.631 | 90.60773 | 92.047 | 88.88889 |
Table 8.
Performance Analysis of Classifiers for STFT Dimensionality Reduction Technique without Feature Selection.
Table 8.
Performance Analysis of Classifiers for STFT Dimensionality Reduction Technique without Feature Selection.
| Classifiers | Parameters | ||||
| Accuracy | F1 Score | MCC | Error Rate | Kappa | |
| Non Linear Regression | 65.19337 | 74.9004 | 0.304098 | 34.80663 | 0.246382 |
| GMM | 80.66298 | 87.7193 | 0.441969 | 19.33702 | 0.428507 |
| SDC | 59.11602 | 69.67213 | 0.208379 | 40.88398 | 0.160987 |
| Naïve Bayesian | 60.77348 | 71.93676 | 0.167045 | 39.22652 | 0.137111 |
| SVM(Linear) | 72.37569 | 81.20301 | 0.362762 | 27.62431 | 0.321894 |
| SVM(Poly) | 71.8232 | 80.30888 | 0.409538 | 28.1768 | 0.348967 |
| SVM(RBF) | 64.64088 | 73.77049 | 0.355135 | 35.35912 | 0.274367 |
Table 9.
Performance Analysis of Classifiers for STFT Dimensionality Reduction Technique with PSO Feature Selection.
Table 9.
Performance Analysis of Classifiers for STFT Dimensionality Reduction Technique with PSO Feature Selection.
| Classifiers | Parameters | ||||
| Accuracy | F1 Score | MCC | Error Rate | Kappa | |
| Non Linear Regression | 56.90608 | 68.03279 | 0.149676 | 43.09392 | 0.115635 |
| GMM | 86.18785 | 91.22807 | 0.610382 | 13.81215 | 0.591791 |
| SDC | 81.76796 | 88.88889 | 0.382089 | 18.23204 | 0.381485 |
| Naïve Bayesian | 80.1105 | 86.95652 | 0.496771 | 19.8895 | 0.463968 |
| SVM(Linear) | 89.50276 | 93.55932 | 0.655197 | 10.49724 | 0.652451 |
| SVM(Poly) | 69.61326 | 79.40075 | 0.277252 | 30.38674 | 0.247373 |
| SVM(RBF) | 94.47514 | 96.62162 | 0.817097 | 5.524862 | 0.814853 |
Table 10.
Performance Analysis of Classifiers for STFT Dimensionality Reduction Technique with Harmonic Search Feature Selection.
Table 10.
Performance Analysis of Classifiers for STFT Dimensionality Reduction Technique with Harmonic Search Feature Selection.
| Classifiers | Parameters | ||||
| Accuracy | F1 Score | MCC | Error Rate | Kappa | |
| Non Linear Regression | 61.32597 | 70.83333 | 0.305452 | 38.67403 | 0.229319 |
| GMM | 88.95028 | 93.10345 | 0.664882 | 11.04972 | 0.654909 |
| SDC | 80.1105 | 87.23404 | 0.44911 | 19.8895 | 0.430519 |
| Naïve Bayesian | 80.1105 | 87.67123 | 0.368107 | 19.8895 | 0.364417 |
| SVM(Linear) | 61.32597 | 71.07438 | 0.286204 | 38.67403 | 0.217998 |
| SVM(Poly) | 59.11602 | 70.4 | 0.151209 | 40.88398 | 0.121705 |
| SVM(RBF) | 90.05525 | 93.75 | 0.711034 | 9.944751 | 0.696309 |
Table 11.
Performance Analysis of Classifiers for Raw data Without Dimensionality Reduction with CNN Method.
Table 11.
Performance Analysis of Classifiers for Raw data Without Dimensionality Reduction with CNN Method.
| Classifiers | Parameters | ||||
| Accuracy | F1 Score | MCC | Error Rate | Kappa | |
| Non Linear Regression | 83.42541 | 90.85366 | 0.170709 | 16.5745856 | 0.090147 |
| GMM | 89.50276 | 93.92971 | 0.583974 | 10.4972376 | 0.55643 |
| SDC | 87.8453 | 93.03797 | 0.501658 | 12.1546961 | 0.461601 |
| Naïve Bayesian | 86.74033 | 92.59259 | 0.441204 | 13.2596685 | 0.325885 |
| SVM(Linear) | 87.8453 | 93.08176 | 0.498308 | 12.1546961 | 0.443699 |
| SVM(Poly) | 88.39779 | 93.37539 | 0.52711 | 11.6022099 | 0.477669 |
| SVM(RBF) | 90.60773 | 94.56869 | 0.632977 | 9.39226519 | 0.603121 |
Table 12.
Performance Analysis of Classifiers for STFT Dimensionality Reduction Technique with CNN Method.
Table 12.
Performance Analysis of Classifiers for STFT Dimensionality Reduction Technique with CNN Method.
| Classifiers | Parameters | ||||
| Accuracy | F1 Score | MCC | Error Rate | Kappa | |
| Non Linear Regression | 86.11111 | 92.06349 | 0.40452 | 13.88889 | 0.375 |
| GMM | 88.88889 | 93.54839 | 0.553399 | 11.11111 | 0.538462 |
| SDC | 91.66667 | 95.08197 | 0.6825 | 8.333333 | 0.678571 |
| Naïve Bayesian | 91.66667 | 95.2381 | 0.6742 | 8.333333 | 0.625 |
| SVM(Linear) | 88.88889 | 93.54839 | 0.553399 | 11.11111 | 0.538462 |
| SVM(Poly) | 88.88889 | 93.54839 | 0.553399 | 11.11111 | 0.538462 |
| SVM(RBF) | 88.88889 | 93.54839 | 0.553399 | 11.11111 | 0.538462 |
Table 13.
Computational Complexity of the Classifiers for STFT Dimensionality Reduction Method without and with Feature selection methods and CNN Models.
Table 13.
Computational Complexity of the Classifiers for STFT Dimensionality Reduction Method without and with Feature selection methods and CNN Models.
| Classifiers | Without Feature Selection | With PSO Feature Selection | With Harmonic Search | CNN With Raw Data | CNN STFT DR Method |
| Non Linear Regression | O(2n3 log2n) | O(2n6 log 2n) | O(2n6 log 2n) | O(2n4 log2n) | O(2n4 log4n) |
| GMM | O(2n4 log2n) | O(2n7 log 2n) | O(2n7 log 2n) | O(2n5log2n) | O(2n5log4n) |
| Soft Max Discriminant | O(2n3 log2n) | O(2n6 log 2n) | O(2n6 log 2n) | O(2n4 log2n) | O(2n4 log4n) |
| Naïve Bayesian | O(2n3 log2n) | O(2n6 log 2n) | O(2n6 log 2n) | O(2n4 log2n) | O(2n4 log4n) |
| SVM(Linear) | O(2n3 log2n) | O(2n6 log 2n) | O(2n6 log 2n) | O(2n4 log2n) | O(2n4 log4n) |
| SVM(Poly) | O(2n4 log2n) | O(2n7 log 2n) | O(2n7 log 2n) | O(2n5 log2n) | O(2n5 log4n) |
| SVM(RBF) | O(2n2 log4n) | O(2n5 log 4n) | O(2n5 log 4n) | O(2n3 log4n) | O(2n3 log8n) |
Table 14.
Comparison with Existing Works in Adenocarcinoma and mesothelioma lung cancer classification from microarray gene datasets.
Table 14.
Comparison with Existing Works in Adenocarcinoma and mesothelioma lung cancer classification from microarray gene datasets.
| Serial No. | Author | Dataset | Methodology | Accuracy |
| 1 | As reported in this research work | LH2 Dataset | STFT with PSO feature selection and SVM (RBF) classifier | 94.47 |
| 2 | Gupta et al. (2022) [40] | Cancer Genome Atlas dataset | Deep learning with CNN Methodology | 92 |
| 3 | Lin Ke et.al. (2022) [41] | LH2 Dataset | Decision Tree C4.5 Classification | 93.2 |
| 4 | Federica Morani et al. (2021) [42] | Cancer Genome Atlas and curated gene expression datasets | Multivariate approach using Cox | 90 |
| 5 | Fathi et al. (2021) [43] | LH2 Dataset | Feature combination from different network layers using Decision tree | 85 |
| 6 | Daniel Xia et al. (2020) [44] | LH2 Dataset | Minimalist approach for Classification | 90.6 |
| 7 | Azzavi(2015) et al. [45] | Kent Ridge Bio-medical Dataset | multilayer perceptron (MLP), RBF and SVM | 91.3991.7289.82 |
| 8 | Guan et al.(2009) [46] | HG-U95 Dataset | SVM with RBF Kernel | 94 |
| 9 | Mramor et al. (2007) [47] | Whitehead Institute Database | SVM, NBC, k-nearest neighbour (KNN) , and Decision Tree | 94.6790.3575.2891.21 |
| 10 | Gordon (2002) [48] | LH2 Dataset | Translation of microarray data to gene expressions | 90 |
Disclaimer/Publisher’s Note: The statements, opinions and data contained in all publications are solely those of the individual author(s) and contributor(s) and not of MDPI and/or the editor(s). MDPI and/or the editor(s) disclaim responsibility for any injury to people or property resulting from any ideas, methods, instructions or products referred to in the content. |
© 2023 by the authors. Licensee MDPI, Basel, Switzerland. This article is an open access article distributed under the terms and conditions of the Creative Commons Attribution (CC BY) license (http://creativecommons.org/licenses/by/4.0/).
Copyright: This open access article is published under a Creative Commons CC BY 4.0 license, which permit the free download, distribution, and reuse, provided that the author and preprint are cited in any reuse.


