

Submitted:
05 July 2023
Posted:
06 July 2023
You are already at the latest version
Abstract
The service sector, whose value has started to increase in recent years, has gained momentum with the acceleration of economic developments especially after the 2000s in Turkey. In a world where competition is increasing and social purchase perception is changing, companies started to differentiate in the service sector to create a competitive advantage. Companies that would like to grow in the industry and aspire to a greater proportion need credit to extend. There are many factors to consider in order to allocate the credit. Banks make financial and non-financial analysis to make credit decisions. This study has been prepared to assess the effect of financial and non-financial features of middle segment companies that need credit in the service sector on the credit decision to be allocated by banks. The group of variables that explain the credit decision at the highest level in these companies are non-financial variables.
Keywords:
credit decision
; determinants of credit
; qualitative variables
; financials
; service sector
1. Introduction
Financial analysis plays a crucial role in understanding the financial status and performance of a company. By evaluating the accounts in the financial statements and comparing them with established standards and sector averages, financial analysis allows for a comprehensive assessment of a company's liquidity, financial structure, profitability, and activities. Financial analysis is a critical process in understanding and assessing the financial health of a company. It involves evaluating the relationships between accounts in the financial statements and interpreting them by comparing with industry benchmarks and established standards. Financial analysis is an essential tool for understanding and interpreting the financial statements of a company.(Konstantinidis et al., 2021)
Non-financial data collection and analysis are integral to credit assessment, aiming to determine the creditworthiness of borrowers and minimize credit risk (İş Bankası, 2012; Vakıfbank, 2011; Geçer, 2014). Bolkvadze (2019) emphasizes the importance of analytical financial tools in financial analysis, particularly in studying business entities. Ceran (2019) utilizes financial ratios to predict non-performing loans (NPLs) in advance through artificial neural networks. Mbona, Masimba, and Kong (2019) highlight the significance of financial statement analysis in understanding financial performance. Lam et al. (2021) propose an integrated entropy-fuzzy VIKOR model to evaluate the financial performance of construction companies, with ECONBHD identified as the top-performing firm. Erdinç (2020) examines the profitability of manufacturing enterprises listed on Borsa Istanbul, finding negative impacts of leverage and fixed asset ratios, but a positive effect of GDP growth rate on profitability.
This study aims to evaluate the impact of financial and non-financial features on credit decisions for SMEs in the service sector, specifically focusing on their credit needs from banks. While financial factors are traditionally important, this research recognizes the growing significance of non-financial variables in explaining credit decisions for these companies. The motivation behind this study lies in the changing landscape of competition and consumer behavior, where companies in the service sector strive to differentiate themselves to gain a competitive edge. By understanding the influence of both financial and non-financial variables on credit decisions, banks can make more informed assessments and effectively allocate credit to middle segment service sector companies.
The findings of this study will contribute to the existing knowledge by shedding light on the specific financial and non-financial features that significantly influence credit decisions for middle segment service sector companies. The research will provide valuable insights to banks and financial institutions in designing credit evaluation models that consider the unique characteristics and needs of these companies. To accomplish this, the study conducted a comprehensive analysis of a diverse range of financial and non-financial variables. Statistical techniques and models have been applied to assess the relative importance and impact of these variables on credit decisions. The results will provide actionable information for banks to enhance their credit allocation processes, enabling them to support the growth and development of middle segment companies in the dynamic service sector.
1.1. Financial Analysis
Financial analysis plays a vital role in financial decision making by collecting and interpreting data to evaluate the financial performance of businesses. It is of great importance for companies, banks and governments as it provides effective financial planning. Planning activities cannot be carried out effectively without a comprehensive analysis of a company's financial situation. Also, financial analysis is important for governments and organizations that are considering lending, partnering with, taxing, or investing in a business.
In the crediting process, firstly basic financial statements such as balance sheet and income statement and then other auxiliary tables are used to whether to determine that companies are suitable for crediting or not.
1.2. Financial Statement Items and Ratios
Banks request financial and non-financial data from companies that request credits in their crediting processes. Non-Financial data consists of the company's information in other banks and the market, while financial data comprised of balance sheet and income statement items, financial ratios and sectoral ratios. Financial ratios are optional because they consist of items in the balance sheet. In other words, it varies on a sectoral, regional and firm basis. Therefore, different ratios can be produced and used depending on the company and the sector in each credit evaluation.
The ratio analysis examines the partial relations of the items in the financial statements and gives information about the financial condition of the business. The ratio is the mathematical expression of the relationship between the two items in the financial statements. The calculated rates are usually stated as a percentage. It is possible to calculate a large number of rates indicating the relationships between the financial statement items. However, rather than calculating a large number of ratios in ratio analysis, it is necessary to calculate the ratios related to the financial statement items, which may have a meaningful relationship with each other.
1.3. Non-Financial Analysis
Credit Non-Financial is beneficial to get to know the customer well, to make accurate, fast and safety decisions. If the demands of a customer that is not well known cannot be answered accurately and safely, the margin of error in the decisions to be taken will be high. While evaluating the credit requests of the customers, it is necessary to make non-financial in order to reach a correct and safe decision. The purposes of non-financial in banking can be summarized as follows: to have information and opinions about general conditions of businesses, to put credit preparation into a discipline based on certain procedures and principles, ensuring that the credit risk is eliminated or reduced by determining the ability to pay of the business. There are a number of reasons why non-financial variables can be important predictors of credit risk. First, non-financial variables can provide insights into the borrower's motivations and intentions. For example, a borrower who is unemployed and has a history of defaulting on loans is more likely to default on a new loan than a borrower who is employed and has a good credit history ( World Bank, 2014).
1.4. Credit
Economically, credit is the purchasing power provided to a legal or real person. The main reason why various transactions, which are different from each other, is gathered under the name of credit, because all of these transactions include providing a purchasing power to the other party (Yürük, 2006, p. 63).
The relationship between total credit volume and economic growth is generally examined in two different ways in the literature. The first of these empirical studies is the evolution of credit volume as an indicator of financial development or credits to the private sector as the ratio of gross domestic product, and the second is focusing on the relationship between direct credit volume and economic growth. In the inferences that occur in these studies; with the increase in financial instruments and institutions, the results show that financial development increases and consequently economic growth is supported (Mercan, 2013, p. 57).
1.5. Service Industry in Turkey
In the information age, services, due to the dynamic components of other sectors, has a rapidly growing importance in Turkey also as well as in the global economy. For these reasons, Turkey has adopted the change of the sectoral structure in the planned development model that it has been implementing since the 1960s as an important objective and the plans have been prepared in this framework. After 1980s, Turkey have increased their activities in the industrial area while entering the period of globalization and since the 2000s, with the economic transformation, the importance of the service sector and its role in economy have increased more than once (İnamoğlu, 2013, p. 2).
2. Data and Methodology
2.1. Aim of The Research
Financial and non-financial analysis significantly influence credit decisions in the service sector, Since financial and non-financial analysis has a substantial effect on the credit decision, it is among the issues that are taken into consideration by the companies in today's service sector. Companies not only demand credit from banks, but also choose them as stakeholders for growth. So, in terms of both stakeholders, the mutualist relationship between a company and a bank over the years has a significant positive effect on both the survival and growth of the company and the bank's earnings.
The aim of this study is to analyze and evaluate the importance and the impact of financial and Non-Financial analysis in credit decision regarding service sector in Turkey. This study has been focused on the most powerful financial and non-financial variables among many options. By examining and referring to many studies conducted in the literature, which of the financial and Non-Financial data used in the credit decision to be made by banks will be analyzed and which factor group is more important than others will be determined. By determining how effective the items and rates used in banks' practices on credit decision will be determined, it will be determined which financial data improvement is an important factor for firms' healthy growth and contribution will be made to the targets of the bank to decrease NPL rates.
The first part of the study has been provided a brief introduction and dedicated to the information of the research topic and the aim of the study. In the second part, a literature review about the topics, financial and non-financial analysis, credit, service industry, has been fulfilled. This part has provided the theoretical framework through financial ratios and the main sources of non-financial which have been to explain detailed how they are become vital in credit processes service sector.
Research design and methodology part includes the purpose, scope, methodology and model of the research. Credit decision is the dependent variable and, financial and non-financial features are independent variables, chosen by regarding expert opinions. Data collection method, the measures that will be used in the study, the methods of statistical analysis of the data and characteristics of the variables are also given in this chapter. In the Conclusion part, answers to the researched hypotheses and major analysis findings are presented. This final chapter also includes the contributions to the literature and limitations of the research.
2.2. Research Methodology and Design
In this study, both qualitative and quantitative research methods have been used. Both of the research methods have been kinds of scientific research. They have been trying to understand asserted research subject by the relevant population. Although the general aim of quantitative and qualitative methods are the same, their ways and focus differ substantially. In order to explain the effects of financial ratios, items and non-financial data on the credit decision, data of 530 companies from a private bank were provided and 34 factors were determined for analysis (The data belonging to the companies were obtained from the data system of a private bank, by taking the necessary conformities, and it was deemed suitable to keep the private information related to the data completely confidential and not to be shared). After the factors were determined and the necessary addition / subtraction processes were completed, analyzes were performed and the proposed hypothesis was tried to be confirmed. The data helped to figure out the impact of the determined variables on the credit decision to be made.
2.3. Hypothesis
H0a: Financial items do not have a significant effect on the credit decision in Turkish service sector.
H1a: Financial items have a significant effect on the credit decision in Turkish service sector.
H0b: Financial ratios do not have a significant effect on the credit decision in Turkish service sector.
H1b: Financial ratios have a significant effect on the credit decision in Turkish service sector.
H0c: Non-Financial data do not have significant the credit decision in Turkish service sector.
H1c: Non-Financial data have a significant the credit decision in Turkish service sector.
H0d: Financial items, financial ratios and non-financial data do not have a significant the credit decision in Turkish service sector.
H1d: Financial items, financial ratios and non-financial data have a significant the credit decision in Turkish service sector.
In the Figure 1, research model has been showed.
In Figure 1, the framework of the hypotheses that are the subject of the study is given. In this Figure 1, a summary of whether the Financial Item, Financial Ratio and Non-Financial Items have an impact on the "Credit Decision" is shared. The combined analysis of all these analysis groups is also given as the name of the "All Variables" group.
2.4. Sampling and Data
This study investigated the relationship between financial and non-financial variables and credit decisions in the service sector of Turkey, with a focus on SMEs and commercial firms. Systematic sampling was used to select companies based on their segments, assets, and turnovers. The study employed 13 financial variables, 12 financial ratio variables, and 9 non-financial variables as independent variables, chosen through a combination of existing literature and expert input from bank allocation departments. Missing values were eliminated from the dataset of 1356 firms, resulting in an analysis of 530 data points. Both independent and dependent variables were continuous. The study encompassed various sub-branches within the service sector, considering it as a whole. Figure 2 presents the conceptual framework and visual representation of the theoretical model, depicting the relationship between credit decisions and financial/non-financial analysis. The Figure 2 displays 34 independent variables initially, categorized into three groups, with their full names provided. The dependent variable is the credit decision made by banks.
2.5. Measures
Figure 2 has been displaying the conceptual framework, visual representation of the theoretical model and the relationship between credit decision and financial and non-financial analysis. 34 independent variables have been showed firstly with their full names. Afterwards, these variables were divided into 3 groups and shown together with their group names. Dependent variable has been credit decision by banks.
2.6. Statistical Methods Used in Data Analysis
In the study, Python and SPSS 20.0 Package Program have been used for data analyzes and hypothesis tests. In the data analyzes, firstly normality analysis and then correlation analysis, regression analysis and hypothesis testing has been figured out orderly. Lastly, the conclusions of the study have been showed in last section.
Normality analysis; the distribution of the data was examined to determine the appropriate methods to be used in the analysis of the data. Kolmogorov-Smirnov test was used to check whether the data was normally distributed or not, since the sample size was over fifty. However, considering that this test is affected by large sample groups, it was evaluated in this study, where the sample size was high, only considering the test results in question would cause biased results. For this reason, P-P and Q-Q graphs were taken into consideration rather than normality test results when deciding whether the data was normally distributed or not.
Correlation analysis has been used in order to determine the relationship between the variables. The presence of a high relationship between the independent variables causes a linear connection problem. To prevent this problem, some of the variables that are highly related to each other are removed from the model by making correlation analysis between independent variables. When determining the variable to be subtracted, its relationship with the dependent variable is taken into account.
3. Data Analysis And Research Findings
P-P and Q-Q graphs were taken into consideration rather than the normality test when deciding whether the data was normally distributed or not. It has been found that the credit decision variable was observed approximately normal distribution.
3.1. Normality Analysis
There are many methods to measure the normality of a variable. The most used ones are given below.
Shapiro-Wilk Test:
Null Hypothesis: The data follows a normal distribution.
Test Statististic (W):
The test statistic W is calculated based on the ordered sample values and their corresponding expected values under normality.
Kolmogorov-Smirnov Test:
Null Hypothesis: The data follows a specific distribution (e.g., normal distribution).
Test Statistic (D):
The test statistic D s calculated based on the maximum absolute difference between the empirical cumulative distribution function (ECDF) of the observed data and the expected CDF under the hypothesized distribution (Shapiro et al., 1968).
P-P (Probability-Probability) and Q-Q (Quantile-Quantile) graphs:
P-P and Q-Q plots are utilized to assess the fit of a dataset to a normal distribution. The PP plot compares observed cumulative probabilities with expected probabilities under a normal distribution, while the Q-Q plot compares observed quantities with expected probabilities under a normal distribution. Ideally, the plotted points should align on a straight line, indicating normal distribution. Deviations from the straight line indicate departures from normality. These plots aid in identifying significant deviations from normality in the data. This study employed P-P and Q-Q methods and Figure 3 presents the corresponding plots for the dependent variable.
In Figure 3, it has been found that the credit decision was observed approximately normal distribution.
The following steps were followed in the analyzes made.
Correlation Analysis: the formula for Pearson's correlation coefficient (r) between two variables X and Y is given by:
where and represent the means of variables X and Y, respectively.
Multiple Regression Analysis: the formula for multiple linear regression is represented as follows:
where Y is the dependent variable, are the independent variables, are the regression coefficients, and is the error term.
R-squared (Coefficient of Determination): the formula for R-squared (R²) in multiple regression analysis is calculated as:
where Y represents the observed values of the dependent variable, epresents the predicted values from the regression model, and represents the mean of the dependent variable.
3.2. Financial Item Analysis
Some financial items belonging to 530 companies operating in the service sector, which are thought to affect the dependent variable, have been determined by taking into consideration the studies and expert opinion and were used in the financial item analysis.
Correlation analysis was performed to determine the relationship between financial item variables. Thus, the problem of linear connection between independent variables is prevented. There are 13 independent variables in financial items. As a result of this review; due to the strong relationship between them, one of the variables with ± 0.80 and above correlation was included in the analysis and it was deemed appropriate to exclude the other from the data set. In this direction; significant and high relationship between Assets and Current Assets; significant and high relationship between Assets and Long-Term Liabilities; important and high relationship between Current Assets and Current Liabilities was found (orderly P. Correlation = 0.842, p = 0.000; P. Correlation = 0.811, p = 0.000; P. Correlation = 0.863, p = 0.000). Thus, it was decided to exclude 2 variables from the data set and continued to work with 11 variables for financial item data. Variables extracted from the data set; Current Assets and Long-Term Liabilities.
Regression analysis was conducted to determine the relationship between credit decision and financial item variables. As a result of the multiple linear regression analysis using the Stepwise Method, the eighth model was found significant. The relation coefficient of the regression model, the dependent variable explanation amount of the independent variables and the adjusted R2 values are examined. According to these results, the rate of Assets, Liquid Assets, Inventories, Current Liabilities, Equity, Net Working Capital, Net Sales, Previous Net Sales, Absolute Value of Net Sales-Previous Net Sales, Net Profit, Total Liabilities variables to explain the Credit Decision variable has found 54 percent. In addition, there is a significant difference between Assets, Current Liabilities, Equity, Net Sales, Previous Net Sales, Absolute Value of Net Sales-Previous Net Sales, Net Profit, Total Liabilities variables and dependent variable (P < 0.05). No significant difference has found between Liquid Assets, Inventories, Net Working Capital and the Credit Decision (P> 0.05).
According to the results of the regression analysis, it has been seen that there is a significant relationship between Credit Decision and Financial Item variables. The obtained model has been found to be statistically significant (F = 75,143 p = 0.000, p <0.05). Also, there has been no correlation in the model (Durbin-Watson = 0.996). According to these results, the model has been found to be statistically valid.
3.3. Financial Ratio Analysis
The data of variables related to financial ratios of 530 companies operating in the service sector were analyzed. Financial ratio variables that are thought to affect the dependent variable are used in the financial ratio analysis.
Correlation analysis was performed to determine the relationship between the financial ratio variables. Thus, the problem of linear connection between independent variables is prevented. There are 12 independent variables in financial ratio variables. As a result of this analysis; due to the strong relationship between them, it was deemed appropriate to hold one of the variables with a correlation of ± 0.80 and above and remove the other from the data set. In this direction; there was a significant and high relationship between Net Profit / Assets and Current Liabilities / Net Profit and a significant and high relationship between Net Profit / Assets and Equity / Net Profit (orderly P. Correlation = 0.856, p = 0.000; P. Correlation = 0.872, p = 0.000). Thus, it was decided to remove 1 variable from the data set and continued to work with 11 variables for the financial ratio data. The variable extracted from the data set was the Net Profit / Assets ratio, which was lower in relation to the dependent variable.
Regression analysis was conducted to determine the relationship between credit decision and financial ratio variables. As a result of the multiple linear regression analysis using the Stepwise method, the fifth model was found significant. The relation coefficient of the regression model, the dependent variable explanation amount of the independent variables and the adjusted R2 values are examined. According to these results, the rate of Net Sales / Assets, Current Liabilities / Net Profit, Long Term Liabilities / Absolute Value of Net Sales-Previous Net Sales, Long Term Liabilities / Net Profit, Net Working Capital / Equity, Equity / Net Sales, Equity / Net Profit, Current Assets / Assets, Net Profit / Net Sales, Total Debt / Net Sales, Total Debt / Net Profit variables to explain the Credit Decision variable has found 21 percent. In addition, there has been a significant difference between Current Liabilities / Net Profit, Long Term Liabilities / Net Profit, Current Assets / Assets, Total Debt / Net Sales, Total Debt / Net Profit variables and Credit Decision variables (P <0. 05). A significant difference between Net Sales / Assets, Long-Term Liabilities / Absolute Value of Net Sales-Previous Net Sales, Net Working Capital / Equity, Equity / Net Sales, Equity / Net Profit, Net Profit / Net Sales and Credit Decision variables has not been found (P> 0.05).

Table 3.
Coefficients and R2 of Regression Model for Financial Ratios.
| 5. Model F | Independent Var. | Dependent Variables | β | t | p | R2 |
|---|---|---|---|---|---|---|
| F = 28,510 p = ,000 |
Credit Decision |
Constant | 925721 | 4,245 | ,000 |
,214 |
| Current Liabilities / Net Profit | -197123 | 10,023 | ,000 | |||
| Total Debt / Net Profit | -80574 | -5,919 | ,000 | |||
| Long Term Liabilities / Net Profit | -62880 | 2,951 | ,000 | |||
| Current Assets / Assets | 810149 | -2,464 | ,014 | |||
| Net Sales / Assets | 127067 | 2,118 | ,035 |
According to the results of the regression analysis, it has been seen that there is a significant relationship between Credit Decision and Financial Ratio variables. The obtained model has been found to be statistically significant (F = 28,510 p = 0.000, p <0.05). Also, there has been no correlation in the model (Durbin-Watson = 0.447). According to these results, the model has been found to be statistically valid.
3.4. Non-Financial Analysis
The data of the variables related to non-financial belonging to 530 companies operating in the service sector were analyzed. The non-financial variables that are thought to affect the dependent variable were used in the non-financial analysis.
Correlation analysis was performed to determine the relationship between non-financial variables. Thus, the problem of linear connection between independent variables is prevented. There are 9 independent variables in non-financial variables. As a result of this review; due to the strong relationship between them, it was considered appropriate to include one of the variables with ± 0.80 and above correlation with each other and exclude the other from the data set. Accordingly, a significant and high relationship was found between Cash Limit in Risk Center and Cash Risk in Risk Center (P. Correlation = 0.873, p = 0.01). Thus, it was decided to exclude 1 variable from the data set and continued to work with 8 variables for non-financial data. The variable extracted from the data set is Cash Risk in Risk Center.
Regression analysis has been used to determine the relationships between dependent variables and independent variables. Regression analysis was carried out to determine the relationship between the decision of credit and non-financial variables, excluding the variable derived in the correlation analysis. As a result of multiple linear regression analysis using Stepwise method, sixth model has been found significant. The correlation coefficient of the regression model, the dependent variable explanation amount of the independent variables and the adjusted R2 values are examined. According to these results, the rate of Deposit Average in Banks Last 1-Year, Cash Limit in Risk Center, Number of Banks with Limits in Risk Center, Current Class A Cash Collateral Amount, Current Class B Cash Collateral Amount, Current Class C Cash Collateral Amount, Weighted KKB score and Current Signature Collateral Limit variables to explain the Credit Decision variable has found 71 percent. In addition, there has been a significant difference between Cash Limit in Risk Center, Number of Banks with Limits in Risk Center, Current Class A Cash Collateral Amount, Current Class B Cash Collateral Amount, Current Class C Cash Collateral Amount, Current Signature Collateral Limit variables and the Credit Decision variable (P <0.05). There has not been significant difference between Deposit Average in Banks Last 1-Year, Weighted KKB and Credit Decision (P> 0.05).
Table 4.
Coefficients and R2 of Regression Model for Non-Financial Data.
| 5. Model F | Independent Var. | Dependent Variables | β | t | p | R2 |
|---|---|---|---|---|---|---|
| F = 217,73 p = ,000 |
Credit Decision |
Constant | 570182 | 5,937 | ,000 |
,714 |
| Current Class A Cash Collateral Amount | ,974 | 28,23 | ,000 | |||
| Cash Limit in Risk Center | ,061 | 7,076 | ,000 | |||
| Weighted KKB Score | 1,650 | 4,370 | ,000 | |||
| Current Class C Cash Collateral Amount | -1,313 | -3,696 | ,000 | |||
| Number of Banks with Limits in Risk Center | -36496 | -2,880 | ,004 | |||
| Current Class B Cash Collateral Amount | ,278 | 2,296 | ,022 |
According to the results of the regression analysis, it has been seen that there is a significant relationship between Credit Decision and Non-Financial variables. The obtained model has been found to be statistically significant (F = 217,73 p = 0.000, p <0.05). Also, there has been no correlation in the model (Durbin Watson = 1.442). According to these results, the model has been found to be statistically valid.
3.5. All Variable Groups Analysis
As a result of the regression analysis performed before, the data of the variables related to financial item, financial rate and non-financial data of 530 companies operating in the service sector were analyzed separately. Considering the previous regression analysis under this heading, multiple linear regression analysis was conducted to analyze the effect of financial item, financial ratio and non-financial variables together on credit decision. These variables are shown in Figure 4.
Table 5.
All Significant Variables.
| ALL SIGNIFICANT VARIABLES | ||
|---|---|---|
| FINANCIAL ITEMS | FINANCIAL RATIOS | NON-FİNANCİAL VARIABLES |
| Assets | Net Sales / Assets | Deposit Average in Banks Last 1-Year |
| Liquid Assets | Current Liabilities / Net Profit | Cash Limit in Risk Center |
| Inventories | Long Term Liabilities / Absolute Value of Net Sales-Previous Net Sales | Number of Banks with Limits in Risk Center |
| Current Liabilities | Long Term Liabilities / Net Profit | Current Class A Cash Collateral Amount |
| Equity | Net Working Capital / Equity | Current Class B Cash Collateral Amount |
| Net Working Capital | Equity / Net Sales | Current Class C Cash Collateral Amount |
| Net Sales | Equity / Net Profit | Weighted KKB Score |
| Previous Net Sales | Current Assets / Assets | Current Signature Collateral Limit |
| Absolute Value of Net Sales-Previous Net Sales | Net Profit / Net Sales | |
| Net Profit | Total Debt / Net Sales | |
| Total Liabilities | Total Debt / Net Profit | |
As a result of the previous analyzes, the variables that has been found and removed were determined as among Financial Item Variables; Current Assets, Long Term Liabilities, among Financial Ratio Variables; Net Profit / Assets, among Non-Financial Variables; Cash Risk in Risk Center.
Correlation analysis was conducted to determine the relationship of independent variables with each other. As a result of the correlation analysis, it was decided to subtract the Weighted KKB Score variable from the non-financial variables and Equity variable from the Financial Item Variables.
Regression analysis was conducted to determine the relationship between credit decision and all variables. As a result of the multiple linear regression analysis using the Stepwise method, the eighth model was found significant. The relation coefficient of the regression model, the dependent variable explanation amount of the independent variables and the corrected R2 values are given. According to these results, the amount of Financial Item, Financial Ratio and Non-Financial Data variables explaining the Credit Decision variable has found to be 81 percent. According to the results of the analysis, there has been a significant difference between Assets, Equity, Net Sales, Previous Net Sales, Net Profit, Total Liabilities from Financial Items; Net Sales / Assets, Current Liabilities / Net Profit, Long Term Liabilities / Net Profit, Net Profit / Net Sales, Total Debt / Net Sales, Total Debt / Net Profit from Financial Ratios; Cash Limit in Risk Center, Number of Banks with Limits in Risk Center, Current Class A Cash Collateral Amount, Current Class C Cash Collateral Amount, Weighted KKB Score, Current Signature Collateral Limit from Non-Financial variables and the Credit Decision variable (P <0.05).
Table 6.
Coefficients and R2 of Regression Model for All Variables.
| 8. Model F | Independent Variable | Dependent Variables | β | t | p | R2 |
|---|---|---|---|---|---|---|
| F = 132,641 p=,000 |
Credit Decision |
Constant | 245785 | 2,322 | ,021 |
,805 |
| Current Class A Cash Collateral Amount | ,682 | 18,025 | ,000 | |||
| Total Liabilities | ,152 | 8,596 | ,000 | |||
| Current Liabilities / Net Profit | 85375 | 7,533 | ,000 | |||
| Total Debt / Net Profit | -50288 | -5,732 | ,000 | |||
| Net Profit | ,280 | 4,963 | ,000 | |||
| Net Profit / Net Sales | -165810 | -3,097 | ,002 | |||
| Current Signature Collateral Limit | 1,289 | 4,081 | ,000 | |||
| Previous Net Sales | -,019 | -1,676 | ,004 | |||
| Net Sales | ,026 | 2,275 | ,023 | |||
| Number of Banks with Limits in Risk Center | -49598 | -4,540 | ,000 | |||
| Cash Limit in Risk Center | ,044 | 4,396 | ,000 | |||
| Assets | ,060 | -4,867 | ,000 | |||
| Long Term Liabilities / Net Profit | 38906 | 3,274 | ,001 | |||
| Net Sales / Assets | 106938 | 3,718 | ,000 | |||
| Current Class C Cash Collateral Amount | -,886 | -2,992 | ,003 | |||
| Total Debt / Net Sales | -99727 | -2,314 | ,021 |
According to the results of the regression analysis, it has been seen that there is a significant relationship between Credit Decision and Financial Items, Financial Ratios, Non-Financial variables. The obtained model has been found to be statistically significant (F = 132.641 p = .000, p <0.05). Also, there has been no correlation in the model (D.W. = 1.710). According to these results, the model has been found to be statistically valid. An increase in one unit in Current Class A Cash Collateral Amount, Total Liabilities, Current Liabilities / Net Profit, Net Profit, Net Profit / Net Sales, Current Signature Collateral Limit, Net Sales, Cash Limit in Risk Center, Assets, Long Term Liabilities / Net Profit and Net Sales / Assets causes an increase in Credit Decision of 0.682, 0.152, 85375, 0.280, 165810, 1.289, 0,026, 0,044, 0,060, 38906 and 106938, respectively. An increase in one unit in Total Debt / Net Profit, Previous Net Sales, Number of Banks with Limits in Risk Center, Current Class C Cash Collateral Amount and Total Debt / Net Sales causes a decrease in Credit Decision of 50288, 0.019, 49598, 0.886 and 99727, respectively.
4. Conclusion and Discussion
The ultimate objective of banks, like any commercial enterprise, is to generate profits. They achieve this through funding companies in the market or investing in treasury tools. Banks primarily generate high-profit income by providing funds to the market and closely monitoring the credit returns of the funded companies to prevent non-performing assets. In this process, banks analyze financial and non-financial data provided by companies to make informed credit allocation decisions. Companies that have a strong financial position and a reputable presence in the market are often preferred by banks due to the trust and confidence they instill. Establishing and maintaining a healthy relationship with banks becomes crucial for companies aiming for stable growth, as it enables them to address financial resource challenges. By focusing on maintaining these relationships and consistently providing financial and non-financial data, companies can enhance their credibility and reputation in the financial and commercial environment. These efforts contribute to the overall financial structure and quality of the companies, ultimately leading to an increase in their credit limits and market standing.
The results of the study indicate a significant impact of both financial and non-financial data on credit decisions. The analysis demonstrates that these data positively influence credit decisions, with non-financial variables having the strongest effect, followed by financial item variables and financial ratio variables. Regression analysis, considering all variable groups, confirms that evaluating these data together yields more effective credit decisions, with the highest model success rate compared to separate analyses. Thus, it can be concluded that the financial and non-financial data provided by enterprises in Turkey have a positive effect on their credit limits and the banks' credit allocation decisions.
For companies in the service sector, establishing effective, strong, and long-term credit relations with banks requires a focus on managing their financial and market reputation in all aspects of their operations. This entails keeping financial records clear, ensuring the strength of financial indicators, and maintaining transparent non-financial records. Such measures contribute to building a productive company image and reputation in the eyes of banks. By demonstrating their ability to effectively manage their financial and non-financial data, companies can establish themselves as trustworthy partners to banks, fostering ongoing profitable relationships.
In summary, the study highlights the importance of financial and non-financial data in credit decisions for companies in the service sector. It emphasizes the need for companies to actively manage their financial and market reputation to build strong and enduring credit relationships with banks. By providing comprehensive and reliable financial and non-financial data, companies can enhance their creditworthiness, expand their credit limits, and enjoy the benefits of continued support from banks.
4.1. Limitations and Future Study
There are limitations to consider, including the study's narrow focus on the service sector, a small sample size, and the examination of a single effect (credit decision). The results may not be generalizable beyond the studied industry. Furthermore, the presence of missing values in the dataset and potential limitations in the applicability of statistical methods to real-life scenarios are additional constraints.
This research makes a significant contribution to the existing literature by conducting a comprehensive analysis of financial items, financial ratios, and non-financial variables together, which has not been extensively explored in previous studies. The study provides valuable theoretical and practical insights into the relationship between financial and non-financial data and credit decisions in the SME segment service sector. Despite the limitations in terms of the theoretical dimension and application area, this study sheds light on the specific features that significantly influence credit decisions in the Turkish service sector, offering important guidance to banks and financial institutions in designing credit evaluation models that are tailored to the unique characteristics and needs of these companies.
One of the key contributions of this research lies in its theoretical and practical explanation of the relationship between financial and non-financial data and credit decisions. By analyzing the three variable groups, namely financial items, financial ratios, and non-financial data, within the context of the service sector, which holds considerable importance in Turkey, this study provides valuable insights into the factors that drive credit decisions. This comprehensive approach addresses a research gap and enhances our understanding of the credit allocation process in the service sector.
Furthermore, the comparative analysis among the three variable groups enriches the literature by examining their relative advantages and effects on credit decisions. By exploring the interplay between financial and non-financial factors, the study highlights the importance of considering both types of variables in credit evaluation models. This finding contributes to the development of more robust and comprehensive models that can better assess the creditworthiness of middle segment service sector companies.
Despite the limitations associated with only SME sand the focus on a specific sector, the research provides valuable insights that can guide banks and financial institutions in improving their credit allocation processes. The findings offer practical implications for designing effective credit evaluation models tailored to the unique characteristics and needs of SMEs in the service sector. Overall, this research significantly advances the understanding of the relationship between financial and non-financial data and credit decisions in the service sector, and it provides a foundation for future studies to build upon and explore credit decisions in other sectors.
Finally, the conclusion that the non-financial variables in this article have a higher effect on the credit decision than the financial variables will pave the way for future studies to focus more on non-financial studies, contrary to what has been done so far.
4.2. Data Availability
The company data were obtained from a private bank's data system, ensuring compliance with necessary regulations. The confidentiality of private information was strictly maintained, and data sharing was prohibited.
References
- Bolkvadze, B., (2019). The Importance of Financial Ratios in Financial Analysis of Business Entities. Globalization and Business. pp.154-157.
- Ceran, M., (2019), Bankacılıkta Dijitalleşme Kapsamında Öğrenen Yapay Zekâ Desteğiyle Sorunlu Kredilerin Belirlenmesi (Identifying Non-Performing Loans with the Support of Learning Artificial Intelligence within the Scope of Digitalization in Banking), PhD Thesis, Marmara Üniversitesi, Social Science Institute, İstanbul, Turkey. pp.122-128.
- Erdinç, N. Y., (2020). Borsa İstanbul’da İşlem Gören İmalat İşletmelerinin Kârlılığını Etkileyen İşletmeye Özgü ve Makroekonomik Değişkenlerin Analizi (Analysis of Business-Specific and Macroeconomic Variables Affecting the Profitability of Manufacturing Businesses Traded in Borsa Istanbul). Üçüncü Sektör Sosyal Ekonomi Dergisi. 55: (4). p. 2109.
- Geçer, T., (2014). Kredi İstihbaratı, Sosyal Bilimleri Dergisi. 25. pp. 21-35.
- İnamoğlu, Y., (2013), Türkiye’de Hizmet Sektörünün Gelişimi Ve Ekonomik Büyümeye Etkisi (The Development of the Service Sector in Turkey and Its Impact on Economic Growth, Graduate Thesis, Bülent Ecevit Üniversitesi, Social Science Institute, Zonguldak. pp.1-2.
- İş Bankası, (2012). İstihbarat. Eğitim Müdürlüğü Yayınları. İstanbul.
- Konstantinidis, C. V., Tsolaki, A., Giovanis, N. (2021). Estimating Competitiveness Relations Between Firms Of a Multinational Group Of Clothing And Footwear Manufacturing Industry In Greece. TEL, 04(11), 789-802. [CrossRef]
- Lam, W. N., Jaaman, S. H., Liew, K. F. (2021). Performance Evaluation Of Construction Companies Using Integrated Entropy–fuzzy Vikor Model. Entropy. 3: (23). 320. [CrossRef]
- Mbona, Reginald Masimba, and Kong Yusheng., (2019). Financial statement analysis: Principal component analysis (PCA) approach case study on China telecoms industry. Asian Journal of Accounting Research. 4: 2. p. 233-245.
- Mercan, M., (2013). Kredi Hacmindeki Değişimlerin Ekonomik Büyümeye Etkisi: Türkiye Ekonomisi İçin Sınır Testi Yaklaşımı (The Effect of Changes in Credit Volume on Economic Growth: Bounds Test Approach for Turkish Economy). TBB Bankacılar Dergisi. 84. pp.54-71.
- Shapiro, S. S., Wilk, M. B., & Chen, H. J. (1968). A comparative study of various tests for normality. Journal of the American statistical association. 63: (324). p. 343-1372.
- Vakıfbank, (2011). İstihbarat, Mali Tahlil ve Skorlama Yönetmeliği (Financial Analysis and Scoring Regulation). Ankara.
- Yürük, A. T., (2006). Banka ve Sigorta Hukuku (Banking and Insurance Law), Anadolu Üniversitesi Yayım. Eskişehir. p.63.
- World Bank., (2014). The Use of Non-Financial Information in Credit Scoring: A Review of the Literature. Washington, DC: World Bank.
Figure 1.
Hypothesis.
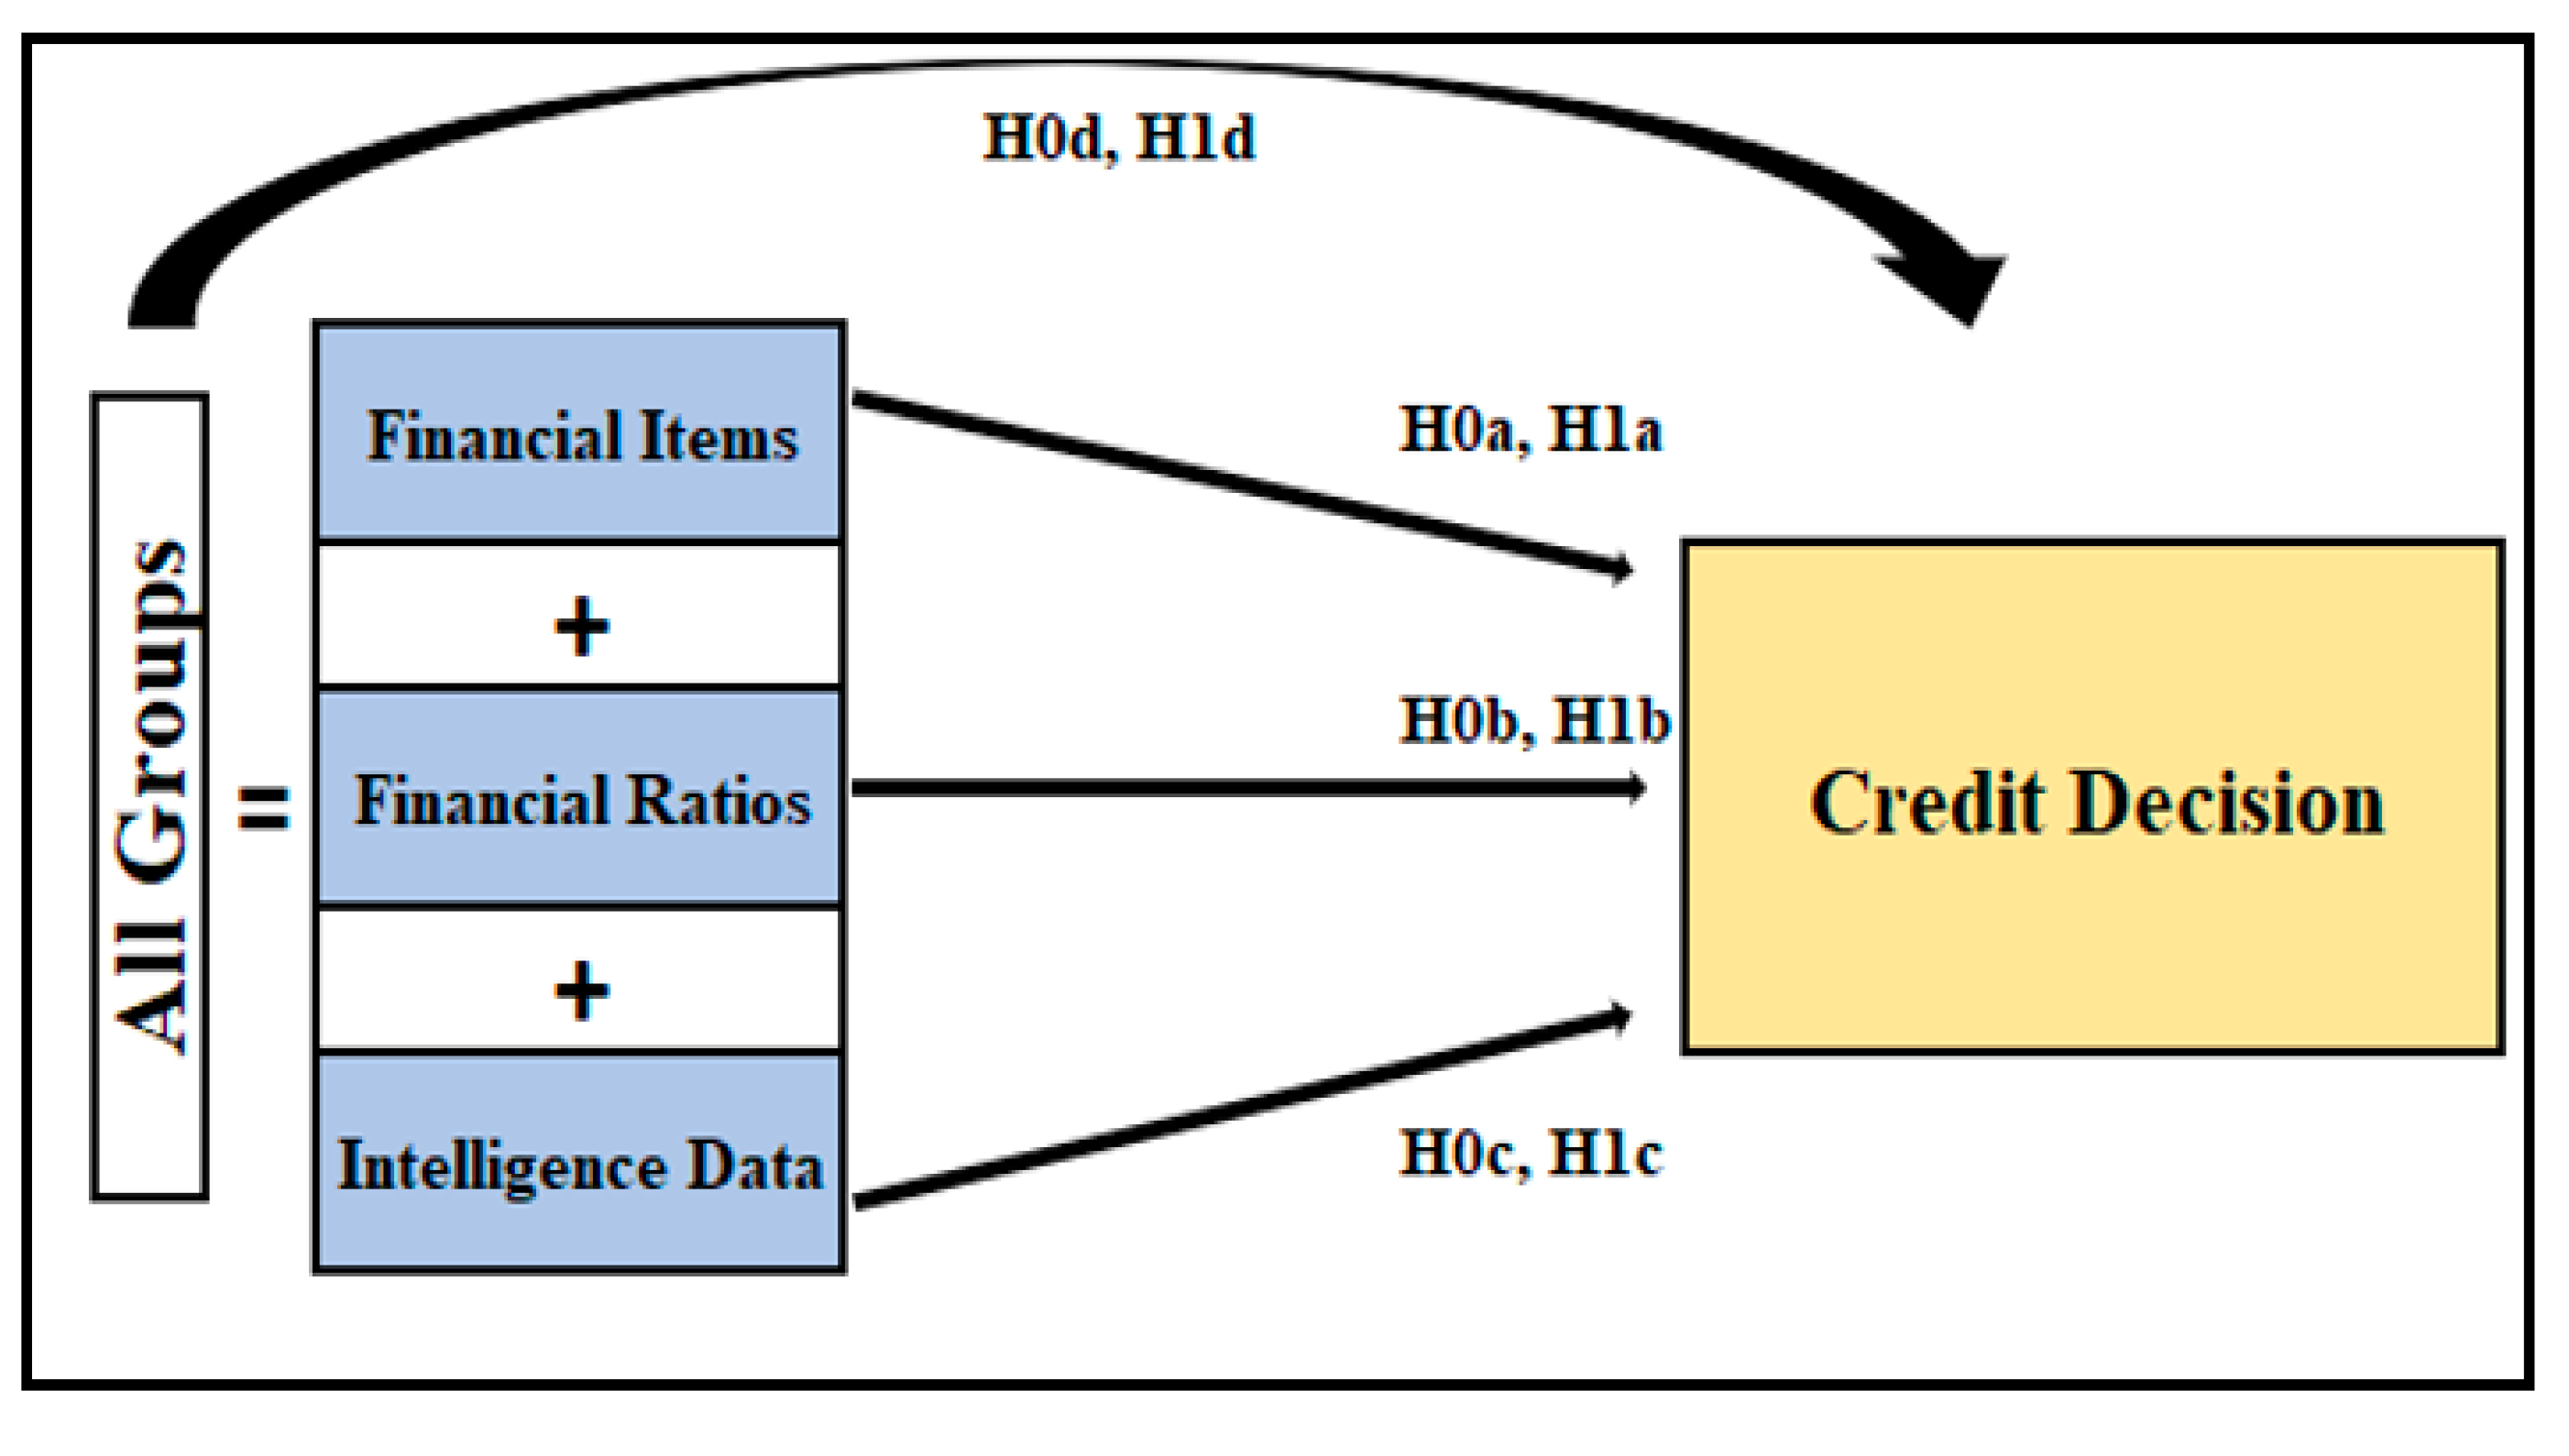
Figure 2.
Conceptual Framework.
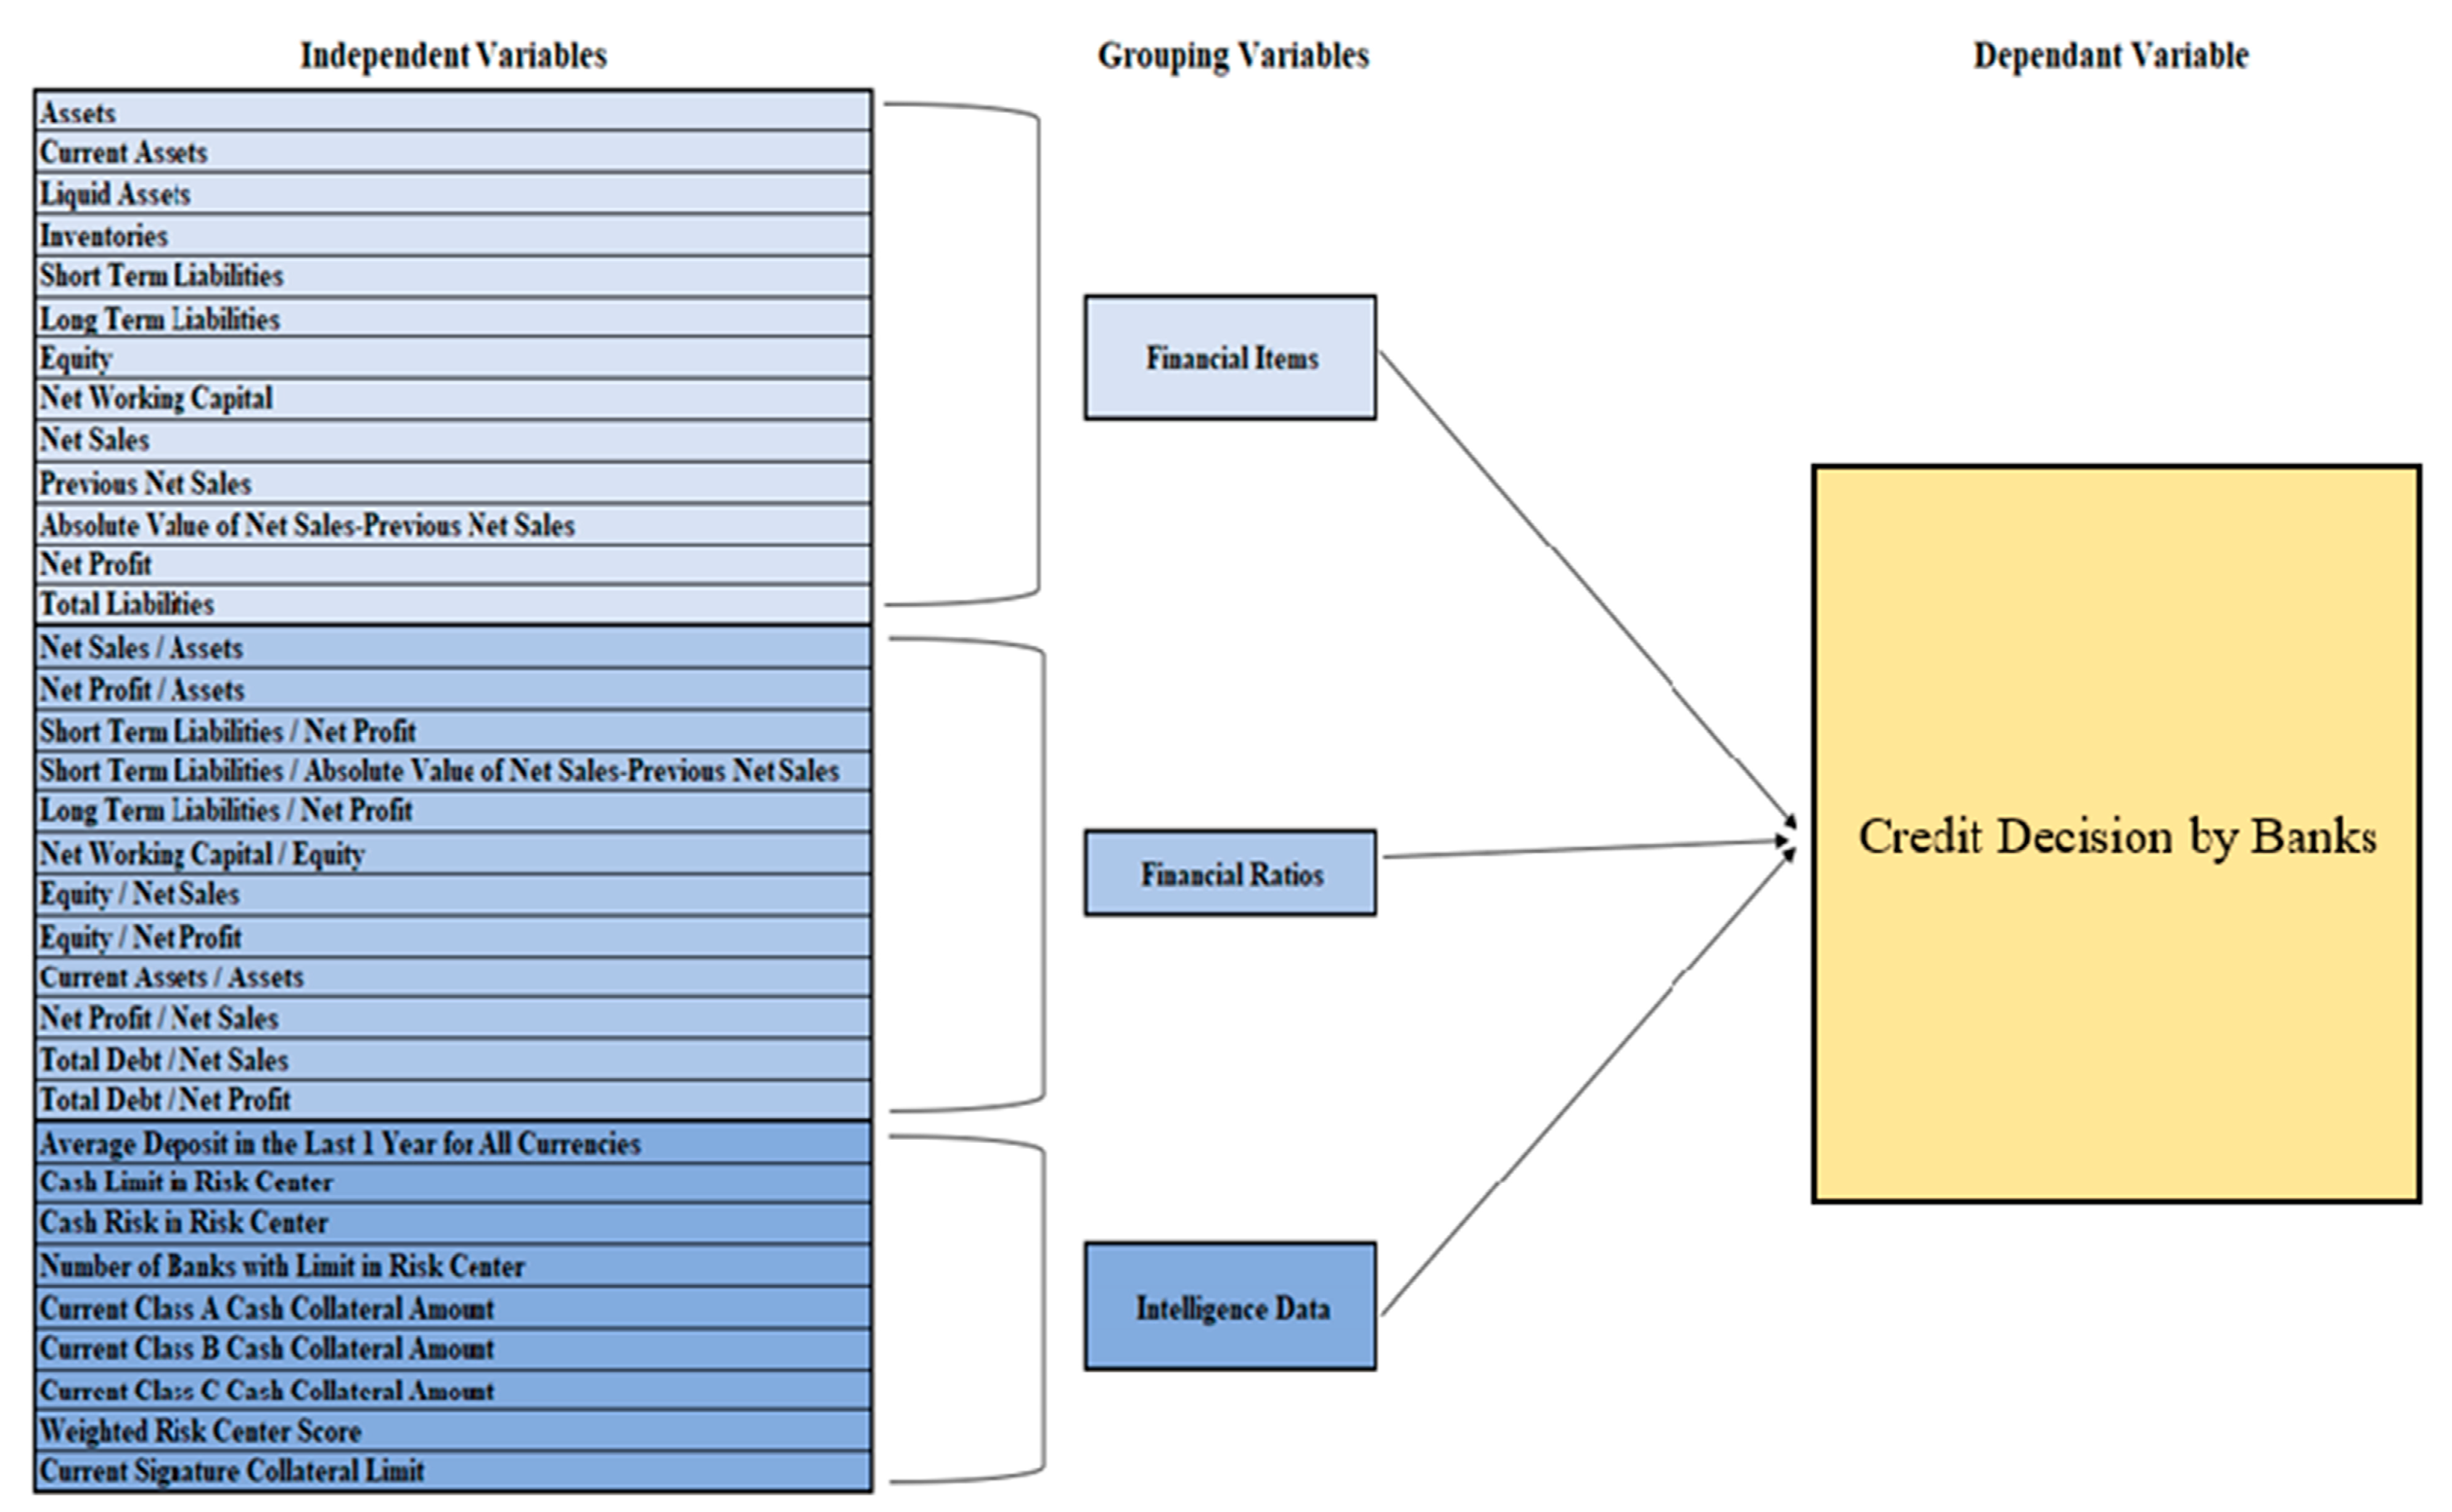
Figure 3.
Normal P-P and Q-Q Plot of the Credit Decision.
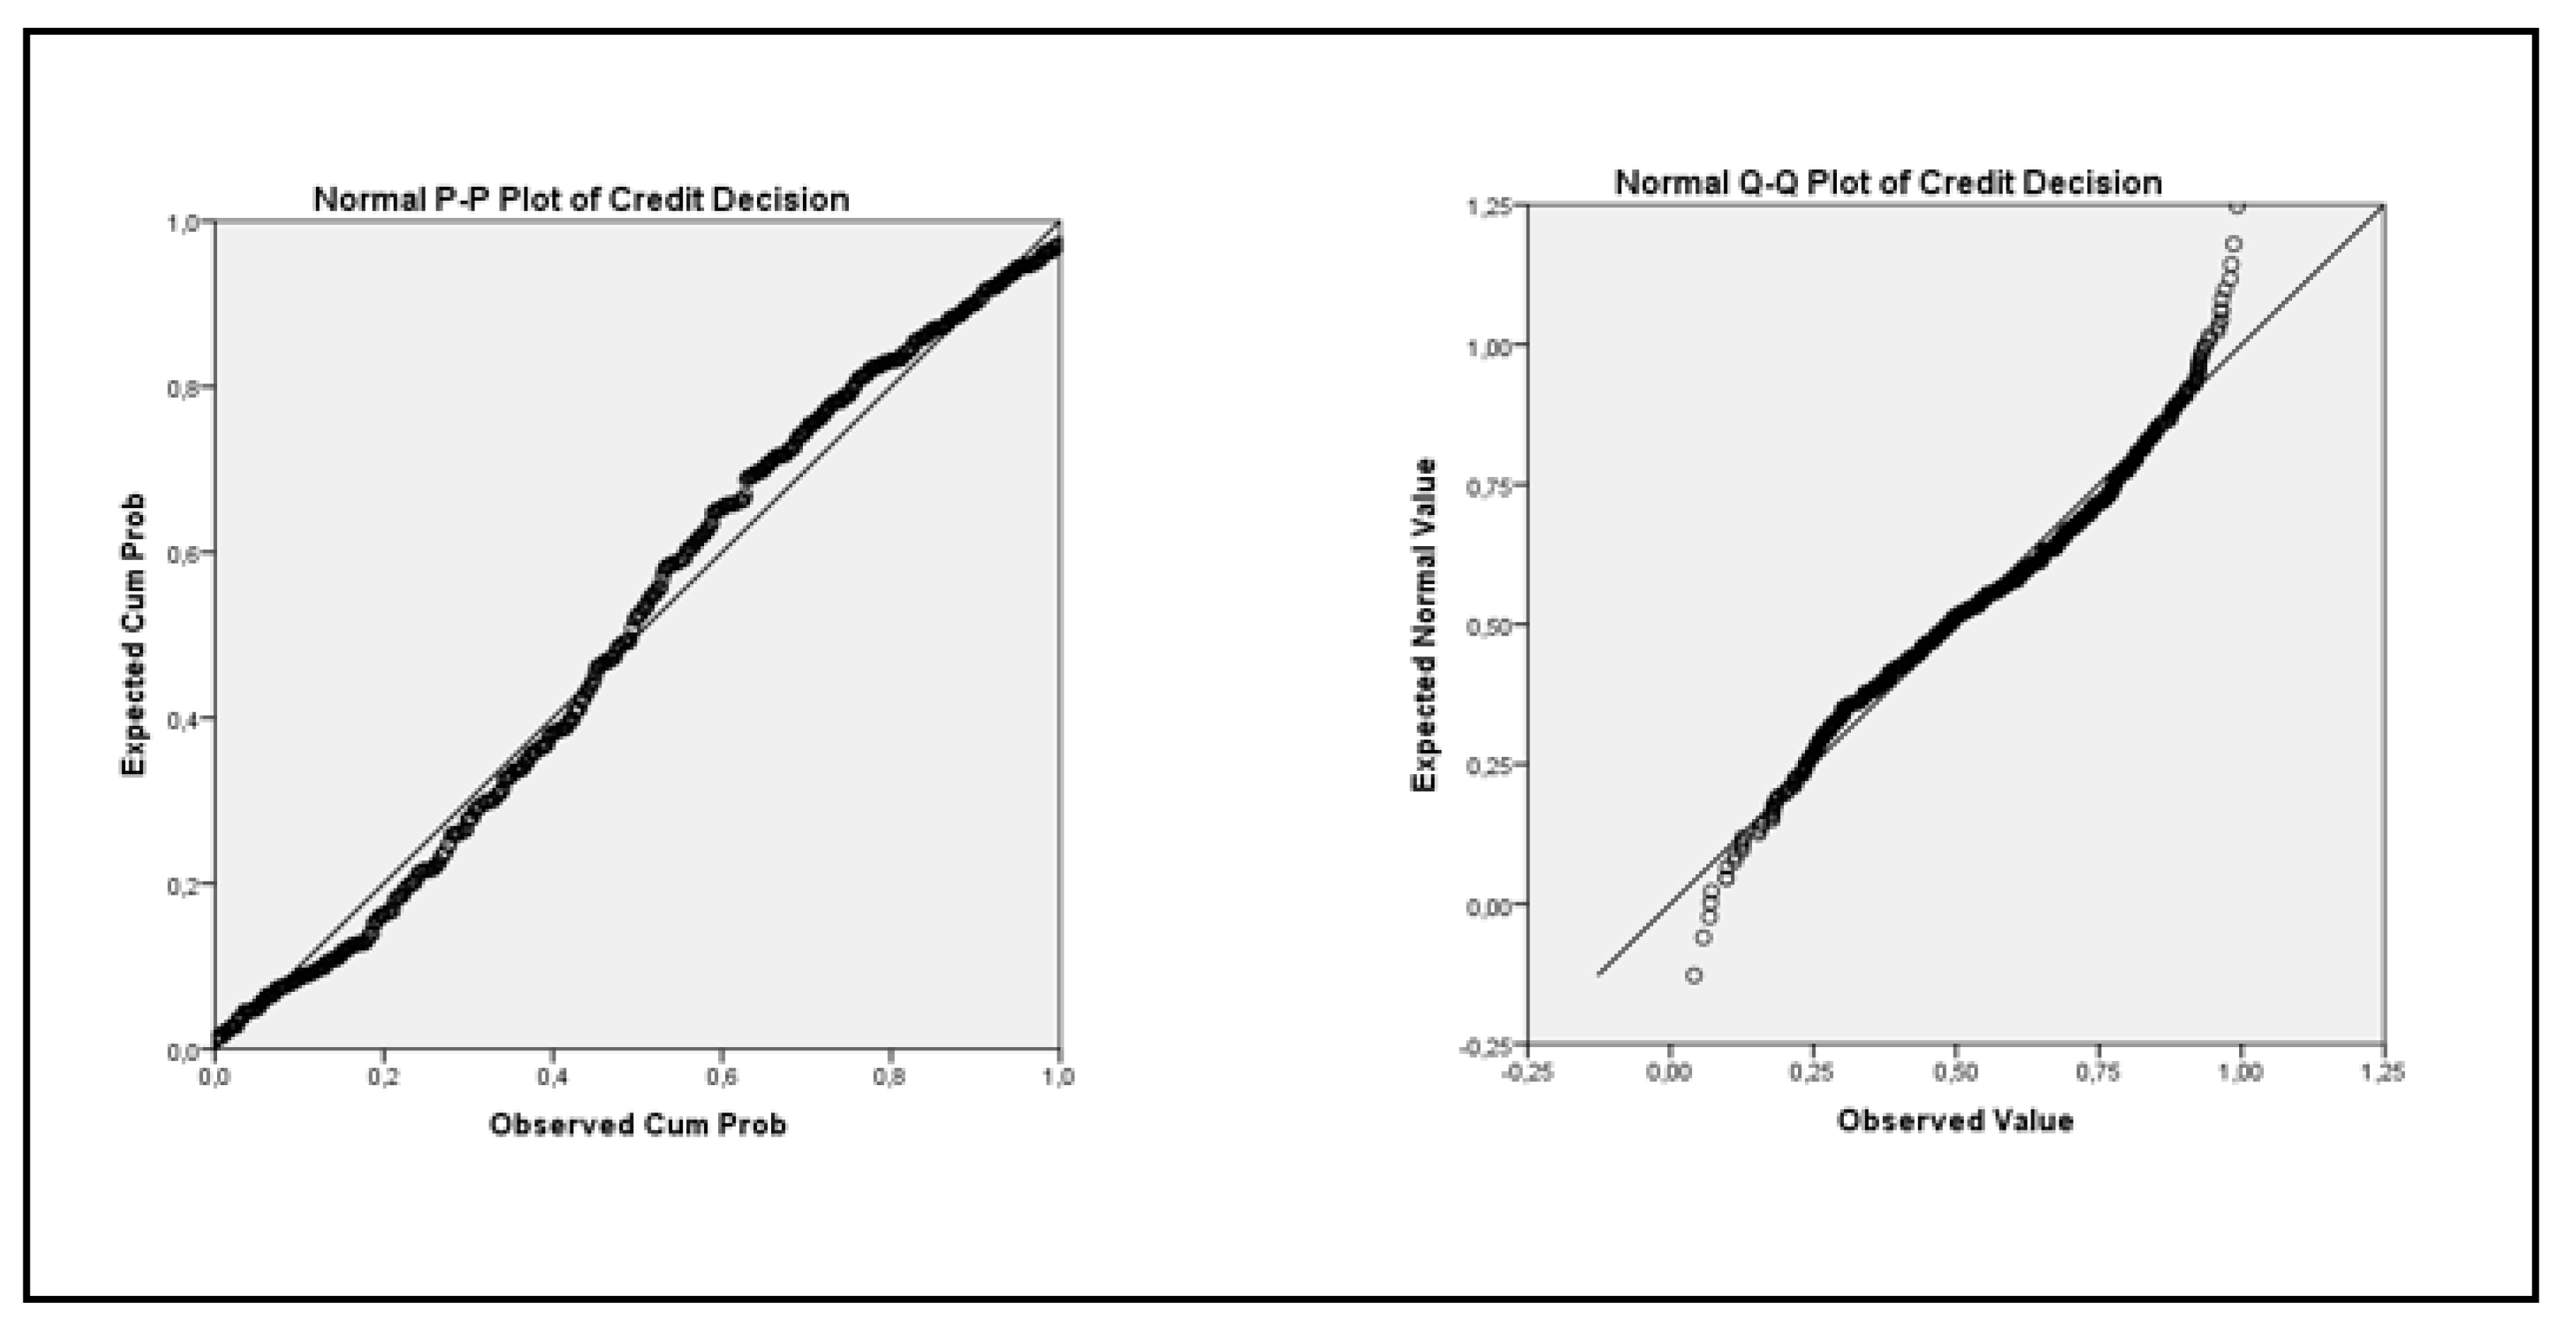
Table 2.
Coefficients and R2 of Regression Model for Financial Items.
| 8. Model F | Independent Variable | Dependent Variables | β | t | p | R2 |
|---|---|---|---|---|---|---|
| F = 75,143 p = ,000 |
Credit Decision |
Constant | -197186 | -2,488 | ,013 |
,536 |
| Total Liabilities | ,146 | 7,720 | ,000 | |||
| Net Profit | ,417 | 8,871 | ,000 | |||
| Equity | ,206 | 4,952 | ,000 | |||
| Previous Net Sales | -,120 | -7,026 | ,000 | |||
| Net Sales | ,084 | 5,596 | ,000 | |||
| Current Liabilities | ,182 | 5,084 | ,000 | |||
| Assets | ,061 | -2,554 | ,011 | |||
| Absolute Value of Net Sales-Previous Net Sales | -,076 | -2,198 | ,028 |
Disclaimer/Publisher’s Note: The statements, opinions and data contained in all publications are solely those of the individual author(s) and contributor(s) and not of MDPI and/or the editor(s). MDPI and/or the editor(s) disclaim responsibility for any injury to people or property resulting from any ideas, methods, instructions or products referred to in the content. |
© 2023 by the authors. Licensee MDPI, Basel, Switzerland. This article is an open access article distributed under the terms and conditions of the Creative Commons Attribution (CC BY) license (http://creativecommons.org/licenses/by/4.0/).
Copyright: This open access article is published under a Creative Commons CC BY 4.0 license, which permit the free download, distribution, and reuse, provided that the author and preprint are cited in any reuse.


