Submitted:
04 July 2023
Posted:
05 July 2023
You are already at the latest version
Abstract
In this paper, the experimental study of heating in 2 h lunch mode of air-conditioned bed system is carried out. The results show that the power consumption of heat conduction heating is only 0.34 kW·h, and the average heat dissipation is 81.3 W, while the power consumption of convection heating is 1.43 kW·h, with an average heat dissipation of 748.7 W. Regardless of power consumption or heat dissipation, convection heating is significantly higher than heat conduction heating, resulting in the room air temperature of the former increased from 12.3 °C to 17.3 °C, while the latter only increased from 14.4 °C to 15.2 °C. The study found that the water temperature of heat conduction heating can meet the thermal comfort needs of the human body in the range of 38~40 °C, while convection heating requires a higher temperature range, In contrast, the grade of hot water required for heat conduction heating is lower. Through the experiment, it is also found that the temperature of convection heating rises fast, but it is easy to appear dry feeling after a long time, while heat conductive heating has a slow temperature rise. there is a cool feeling within 20 min after the heating starts, and then the thermal comfort is better. The air conditioning system in this paper is used for the heating experiment in the winter lunch break mode, compared with convection heating, the overall thermal comfort of heat conduction heating is better and more energy efficient. it is suggested to adopt heat conduction heating mode in the winter heating of this system.
Keywords:
air-conditioned bed system
; heat conduction heating
; convection heating
; thermal comfort
; Energy conservation
1. Introduction
With the increasing threat of energy in the world, energy conservation and reduction of carbon emissions have become an important issue. In China, building energy consumption accounts for more than 30% of the total social energy consumption, while cooling and heating energy consumption accounts for more than 60% of building energy consumption [1,2]. In developed countries, air conditioning systems account for about 50% of building energy consumption and 20% of the country's overall energy use [3,4]. In order to reduce the energy consumption of air conditioning and improve personal comfort, some scholars focus on the study of personal comfort system [5]. Personal comfort system relaxes the restriction on the temperature of inactive area, and only adjusts the thermal comfort of the area where the individual is located, which is conducive to reducing the temperature difference between indoor and outdoor rooms and reducing energy consumption. Relevant research shows that the energy saving effect of relaxing the set temperature of air conditioning is obvious. For every 1 °C relaxation of the set temperature, the energy consumption of the air conditioning system can be reduced by about 10% [6].
At present, the research of personal comfort system is mainly based on personalized air supply in summer [7]. There are few studies on heating in winter, and it is mainly reflected in office space. In some cases, the airflow is blown to the head and other parts of the human body by setting an outlet or placing a fan near the desk [8,9,10]. There are also heating or cooling seats to meet the requirements of human thermal comfort [11,12]. More directly to a certain part of the human body such as feet placed heating device, through the form of heat conduction, radiation heating for the human body [13,14]. Foda et al. [15] proposed a strategy to maximize the energy efficiency of local floor heating, and found that local floor heating can meet the comfort requirements at 18 °C. Zeiler et al. [16] studied the thermal comfort in school classrooms, the results show that radiant heating is more comfortable than traditional heating methods. Deng et al. [17] found that the overall thermal sensation and comfort voting through personalized heating at 16 °C were neutral and comfortable, respectively, which were significantly higher than those without personalized heating at 18 °C. In addition, there are some differences in the thermal sensation of different parts of the human body, and the influence on the overall thermal sensation is also different. Arens et al. found that in colder environments, the thermal sensation of certain parts of the human body, such as the back, chest, etc, is greater than that of hands and feet [18]. Lv et al. conducted relevant experimental research on human thermal sensation and found that in a specific hot and humid environment, local heating or cooling of indoor personnel can produce a sense of thermal pleasure [19]. Schellen et al. studied the differences in the perception of thermal comfort between genders under non-uniform environmental conditions, and found that local thermal sensation and skin temperature have a more pronounced effect on the overall thermal sensation in women than in men [20].
In recent years, some experts and scholars have done a lot of research work on the personal comfort system in the sleep environment. Wang et al. [21] developed a water-heated bed, and Yu et al. [22] developed a solar phase change heat storage heating bed system. Both provide a thermal comfort environment in the case of sleep through heat conduction. By providing a thermal comfort environment under sleeping conditions through convection, Pan et al. [23] designed a sleep personal comfort system with a flexible air duct and a static pressure box, but the structure is more complex. Mao et al. [24,25,26,27] made a simplified treatment on this basis, removing the flexible air duct and the static pressure box, which is conducive to promotion. Du et al. [28] added a radiation plate on the basis of design by Mao et al, which is conducive to solving the discomfort caused by the tuyere blowing to the human body. In addition, radiant air conditioning also has good advantages. Radiation heating or cooling has a small vertical temperature gradient and can maintain high thermal comfort [29,30]. Xin et al. [31] designed a local space capillary radiation air conditioning system for sleeping environment. The capillary radiation plate is set above the flat human body and surrounded by a baffle and a bed curtain. The thermal comfort during heating is good and energy-saving. However, condensation is easy to occur in radiant air conditioning refrigeration, which is also a key factor restricting its development.
In this paper, a capillary convection and heat conduction air conditioning bed system is proposed, which creates a local thermal comfort environment when people sleep and rest. It can not only provide heating in winter, but also refrigeration in summer. There are three heat transfer modes: heat conduction, radiation and convection. This paper is mainly focuses on the experimental study of heating in the noon break mode.
2. Introduction to the experiment
2.1. Layout of experimental room and air conditioning bed system
The laboratory room is selected from a certain room in the student dormitory building of the school. The walls are all made of 240 mm brick walls, the inner side of the walls are painted with 20 mm white plaster, the outer side of the walls are painted with 20 mm white plaster or cement mortar, the external windows are installed with 6 mm thick single-layer ordinary glass, and the room height is 3.1 m. During the lunch break heating experiment, the adjacent rooms above, below, left, and right were not heated. The size of the wooden bed in the room is 1860 mm×1000 mm, a layer of 20 mm thick thermal insulation cotton is laid on the bed, and a layer of capillary tube network is laid on top of the thermal insulation cotton, places a sponge-padded mattress on the capillary tube. Capillary tube using third-type of Polypropylene Pipe (PP-R), the supply and return water main pipes are both 20 mm×2.0 mm, the capillary diameter adopts 4.3 mm×0.8 mm size, and the spacing is 40 mm. The relevant layout plan is shown in Figure 1.
2.2. Main experimental equipment and materials
In the experiment, 1.8 kg of sponge-padded mattress and 1.9 kg of cotton silk quilt are selected. It adopts the model FLIR T540 infrared thermal imager, T-type thermocouple, temperature and humidity recorder of COS-04, model GTLWGY10ALC2SSN turbine flow meter, UNI-T type anemometer, YP5000 multi-channel temperature recorder, etc. The air duct adopts a telescopic PVC aluminum foil pipe with a diameter of 183 mm, and the heat source unit adopts a fixed frequency air source heat pump to provide hot water for heating. A 280 W desktop computer is placed in the laboratory to collect data. They are shown in Figure 2, Figure 3, Figure 4 and Figure 5.
2.3. Subjects and measurement point arrangement
The subjects are four male college students and four female college students, aged 20-23 years, with a height of (1.70±0.12) m, a body mass of (60±14) kg, and a body mass index (BMI) of (20.4±2.0) kg/m2. In the experiment, everyone is required to wear thin long sleeves on top and thin pants on bottom, and the thermal resistance of the clothes is about 0.4clo [32]. All subjects are in good physical condition, don't exercise vigorously before the start of the experiment, After the experiment begins, subjects are required to lie flat and remain still throughout the entire process. During the experiment, always understand the subject's evaluation of thermal comfort. Figure 6 shows the field photos of the subject while doing the experiment.
During the experiment, T-type thermocouples are arranged in the inlet main pipe and outlet main pipe of the capillary network respectively, and the measured data are used as supply water temperature (SWT) and return water temperature (RWT) for the experiment. Take the temperature measurement of the thermocouple arranged on the surface of the mattress directly below the back of the human body as the temperature of the contact surface between human body and bed (TSHB). Three thermocouples are arranged on the surface of the capillary water supply pipe, and six thermocouples are arranged on the surface of the return pipe, and the average values of their measurements are taken as the surface temperature of supply water capillary (STSWC) and the surface temperature of return water capillary (STRWC). Using temperature and humidity recorder to record indoor and outdoor temperature and humidity changes.
2.4. Experimental research method
The noon time (12:00-14:00) of February 21, 2023 and February 26, 2023 are selected as the experimental time, and the heating experiment mainly based on heat conduction and the heating experiment mainly based on convection are carried out respectively, the external weather conditions of these two days are relatively close, which is conducive to the comparative analysis of the experimental results. When conducting heating experiments mainly focused on thermal conductivity, only the air source heat pump is required to provide hot water, and the range of water supply temperature is controlled by the control system, and then sent to the capillary tube for heat conduction experiments. When doing convection-based heating experiments, hot water is also provided by the air source heat pump, and the control system controls the temperature range of the water supply, sends the hot water to the fan coil and conducts convective heat exchange through the fan, then directly sends hot air to the vicinity of the human body.
The Predicted Mean Vote (PMV) and Predicted Percent Dissatisfied (PPD) proposed by Fanger are often used to evaluate human thermal sensation, but this evaluation index is suitable for the evaluation of human thermal comfort in a steady-state thermal environment, not to a dynamic environment. In addition, there are also ASHRAE 7-level scale method for thermal sensation voting in the form of questionnaire survey and the classification method of thermal comfort proposed by He et al. [33], but most of them are evaluated for a certain temperature rather than a certain temperature range. In this paper, the subjective evaluation method is used to evaluate the thermal comfort of human body, which is mainly based on the subjective feelings of the testers about the thermal environment, and it is also a voting method to find different temperature ranges of thermal comfort under the conditions of non-uniform environment and dynamic environment.
3. Results and analysis
3.1. Experimental results of thermally conductive heating
3.1.1. Analysis of data changes at different measurement points
As shown in Figure 7 and Figure 8, the indoor air temperature (IAT) and humidity are relatively stable, with the temperature ranging from 14.4 to 15.2 °C, an average of 14.9 °C, and the relative humidity in the range of 39.7 to 41.2%, with an average of 40.6%. The outdoor air temperature (OAT) and humidity also varied little, with temperature ranging from 6.9 to 7.6 °C, an average of 7.2 °C, and the relative humidity in the range of 47.5 to 56.2%, with an average of 51.4%.
As shown in Fig. 9, the unit starts from 12:00, and the water supply temperature rises from 28.6 to 42.8 °C within 40 min. When people lie on the bed, they feel obvious coldness at the beginning, then feel the surface temperature of the sponge-padded mattress is rising, and finally the cold feeling gradually disappears and a good thermal comfort feeling appears. Hot water enters into the capillary tube, first convection heat exchange with the inner wall of the capillary, then the heat is transferred to the outer surface of the capillary tube by heat conduction, and then to the outer surface of the sponge-padded mattress through thermal conduction. Some of the heat is transferred to the human body and quilt in contact with it through thermal conduction, while the other part is mainly transferred to the quilt and room by heat radiation form. During the period from 12:00 to 12:20, it is found that the temperature of the contact surface between human body and bed increased rapidly, and obviously exceeded the temperature of the supply and return water. It is obvious that it cannot be completely caused by the heat transfer from the heating hot water, the main reason is that the human body is in contact with the surface of the mattress, and the heat of the human body is transferred to the mattress in contact, resulting in a significant rise in temperature at that location.
From the temperature curve change rule in Figure 9, after the unit is shut down, the water supply temperature still rises for about 10 min. The reason is that the temperature of the condenser will not decrease immediately, and the water in the hot water tank will still be heated until condenser decays to the same temperature as the water in the hot water tank. In addition, the temperature of the supply and return water and the surface temperature of the supply and return capillary,will gradually decrease after reaching the maximum value, and the water supply temperature will still remain at a high temperature of 38.1 °C at 14:00. In this process, the temperature of the contact surface between human body and bed reaches the maximum temperature of 38.0 °C, and then remains basically unchanged. Even in close to 14:00, it exceeds the surface temperature of the capillary for the supply and return water, this is because as the supply and return water temperature decreases, the surface temperature of the capillary tube also decreases. And the sponge-padded mattress has a heat storage function, which greatly delays the attenuation of the temperature of the contact surface between human body and bed.
As shown in Figure 10, after the unit started operating for 10 min, the temperature of the four positions increase significantly, Subsequently, the temperature of the contact surface between human body and bed tends to be stable, as does the air temperature near the chest in the quilt (ATCQ). while the air temperature near the legs in the quilt (ATLQ) and the surface temperature of the sponge-padded mattress in the middle of the legs (STM) show a slow growth trend. The air temperature near the chest in the quilt is always higher than the air temperature near the legs in the quilt, the average difference between the two is 1.8 °C. On the one hand, this is related to the heat dissipation of the human body, the heat dissipation of the chest is larger, while the heat dissipation of the legs is smaller. On the other hand, it is also because the quilt covers the human body, tightly adheres to the surface of the human body and the mattress due to gravity, which hinders the circulation of the air inside the quilt. This tends to make the temperature of the legs rise slower, making people feel cold in their feet at first.
3.1.2. Temperature analysis of infrared thermal imager
As shown in Figure 11, Figure 12, Figure 13 and Figure 14, the surface temperature of the quilt is not high, and the surface temperature changes little with the change of time, the average temperature in different time periods only changes within the range of 16.0 to 17.7 °C, which indicates that the quilt has a good heat insulation function. In addition, it can also be seen that the outer surface temperature at the edge of the quilt is obviously lower than the outer surface temperature in the center of the quilt, because the surface temperature of human body is higher, and the temperature of the quilt in contact with it is increased by heat conduction. It can also be seen from the figures that the outer surface temperature of the quilt at the foot position of the human body is slightly lower than that at other parts of the human body, resulting in poor thermal comfort of the feet, which is also consistent with the above-mentioned law of air temperature distribution inside the quilt.
3.1.3. Analysis of power and heat dissipation data
As shown in Figure 15, the heat pump unit starts at 12:00 and stops at 12:30, running for exactly half an hour. The average power of the unit during operation is 876.4 W, while the average power of the pump is 35.6 W. After the heat pump unit is shut down, the pump continues to operate at an average power of 35.6 W, and the power consumption of the whole process is 0.52 kW·h. Through the experiment, it is found that if the lunch break mode experiment was done the day before and restarted the next day, the water supply temperature when turned on is often around 34 °C or even higher. The initial water supply temperature during the heat conduction heating experiment is only 28.6 °C, combing with the temperature change curve of supply and return water in Figure 9 and the power change curve in Figure 15, it can be seen that 0.18 kW·h energy consumption can be saved on this basis, that is to say, the heating in the lunch break mode only needs to consume 0.34 kW·h to meet the thermal comfort needs of the human body.
Through the water flow, the temperature difference of the supply and return water and the specific heat of the water, the heat dissipation of heat conduction heating can be calculated. Throughout the experiment, the water flow rate changes slightly, and the average water flow rate is 2.0 L/min. As can be seen from Figure 16, the heat dissipation is large when the unit is just started, reaching 112.0 W,although the water supply temperature is only 28.6 °C, mainly because the ambient temperature of the room, the temperature of the mattress and quilt are relatively low when the unit is just started, which is easy to dissipate heat. With the increase of water supply temperature, the ambient temperature is also gradually increasing, especially the sharp increase in the temperature of sponge-padded mattress and quilt, which reduces the temperature difference between them, but the heat dissipation is reduced, and it is reduced to 81.9 W at 12:10. With the further increase of the water supply temperature, it becomes more conducive to heat dissipation around, and its heat dissipation is also increasing, especially reaching a maximum of 152.5 W at 12:30. And then as the temperature difference between the water supply and mattresses, quilt, etc. further decreases, the heat dissipation gradually decreases, and after 13:40, it tends to be flat. The average heat dissipation during the whole lunch break heating time is only 81.3 W, which is much lower than that of the conventional air conditioning system. In addition, it can also be seen that during the entire lunch break process, the time period of large heat dissipation is mainly concentrated in the period from the start of the unit to the 20 min after the unit stops.
3.2. Experimental results of convective heat exchange heating
3.2.1. Analysis of data changes at different measurement points
From Figure 17, it can be seen that the indoor air temperature changes in the range of 12.3 to 17.3 °C, and the increase is more obvious. After half an hour, it tends to be stable, with an average of 16.2 °C. It can be seen that in the convective heating experiment, a large part of the heat is lost in the air, resulting in a significant increase in indoor air temperature. The outdoor air temperature ranges from 4.7 to 7.9 °C, with an average temperature of 6.4 °C, which is close to the weather conditions on the 21 st.
From Figure 18, it can be seen that the indoor relative humidity ranges from 43.5 to 46.6%, with an average of 44.9%, which is also relatively stable. The outdoor relative humidity is relatively high, ranging from 60.3 to 80.6%, with an average of 71.8%, showing a downward trend.
From Figure 19, it can be seen that when doing the convective heating experiment, the water supply temperature changes in the range of 39.9 to 48.8 °C, and the average temperature difference between the supply and return water is 6.7 °C, However, the average temperature difference between supply and return water in the heat conduction heating mode is only 0.6 °C. In addition, the air temperature near the legs in the quilt is still significantly lower than the air temperature near the chest in the quilt, the average difference between the two is 1.6 °C. This is because the heat dissipation of the chest is larger than that of the legs, the main reason is that the air outlet blows near the head of the person, and the temperature near the chest is obviously higher than that of other parts. Through experiments, it is found that the wind speed at the tuyere and near the human face is uneven, and the maximum value and the minimum value are very different. In this paper, the maximum value is expressed. During the experiment, the wind speed in the tuyere and near the person's face has been stable over time, and the maximum wind speed of tuyere has been maintained at about 2.0 m/s, while the temperature of tuyere changes with the change of water supply temperature, and remains in the range of 29.6 to 33.3 °C. The maximum wind speed near human face has been maintained at about 0.8 m/s, and the temperature varies between 24.2 °C and 27.1 °C. It gives a weak sense of blowing. The temperature is relatively comfortable, but there is a slight sense of dryness.
3.2.2. Temperature analysis of infrared thermal imager
From Figure 20, Figure 21, Figure 22, Figure 23 and Figure 24, it can be seen that at the beginning of the experiment, the outer surface temperature of the quilt is significantly lower with an average temperature of 15.3 °C. Subsequently, the temperature rises significantly and remains stable thereafter, with an average temperature ranging from 21.0 to 22.7 °C. The surface temperature of the quilt is significantly higher than that of the heat conduction heating experiment, resulting in a large amount of heat being lost to the air, which is also the fundamental reason why the room temperature is significantly higher than that of the heat conduction heating mode. The temperature is obviously higher in the area near the tuyere, while the temperature is lower in the farther place, especially near the human foot, which is also an important reason why the air temperature near the chest in the quilt is higher than the air temperature near the legs in the quilt. So people lie on the bed, at the beginning of a period of time, there will be a phenomenon of cold feet, until the phenomenon of cold feet gradually disappears and warm feet appears.
3.2.3. Analysis of power and heat dissipation data
As shown in Figure 25, the pump heat unit starts at 12:00 for convection heating. The initial water supply temperature is 41.5 °C. When the water supply temperature is close to 50 °C, the unit stops and reopens when it is reduced to close to 40 °C, so it changes periodically during operation. The heat pump unit has been running for two periods of time, with an average power of 928.5 W and a total of 76 min of operation, while the average power of the pump and fan is 105.9 W. The power consumption during the whole lunch break is 1.43 kW·h, which is significantly higher than that of thermally conductive heating mode.
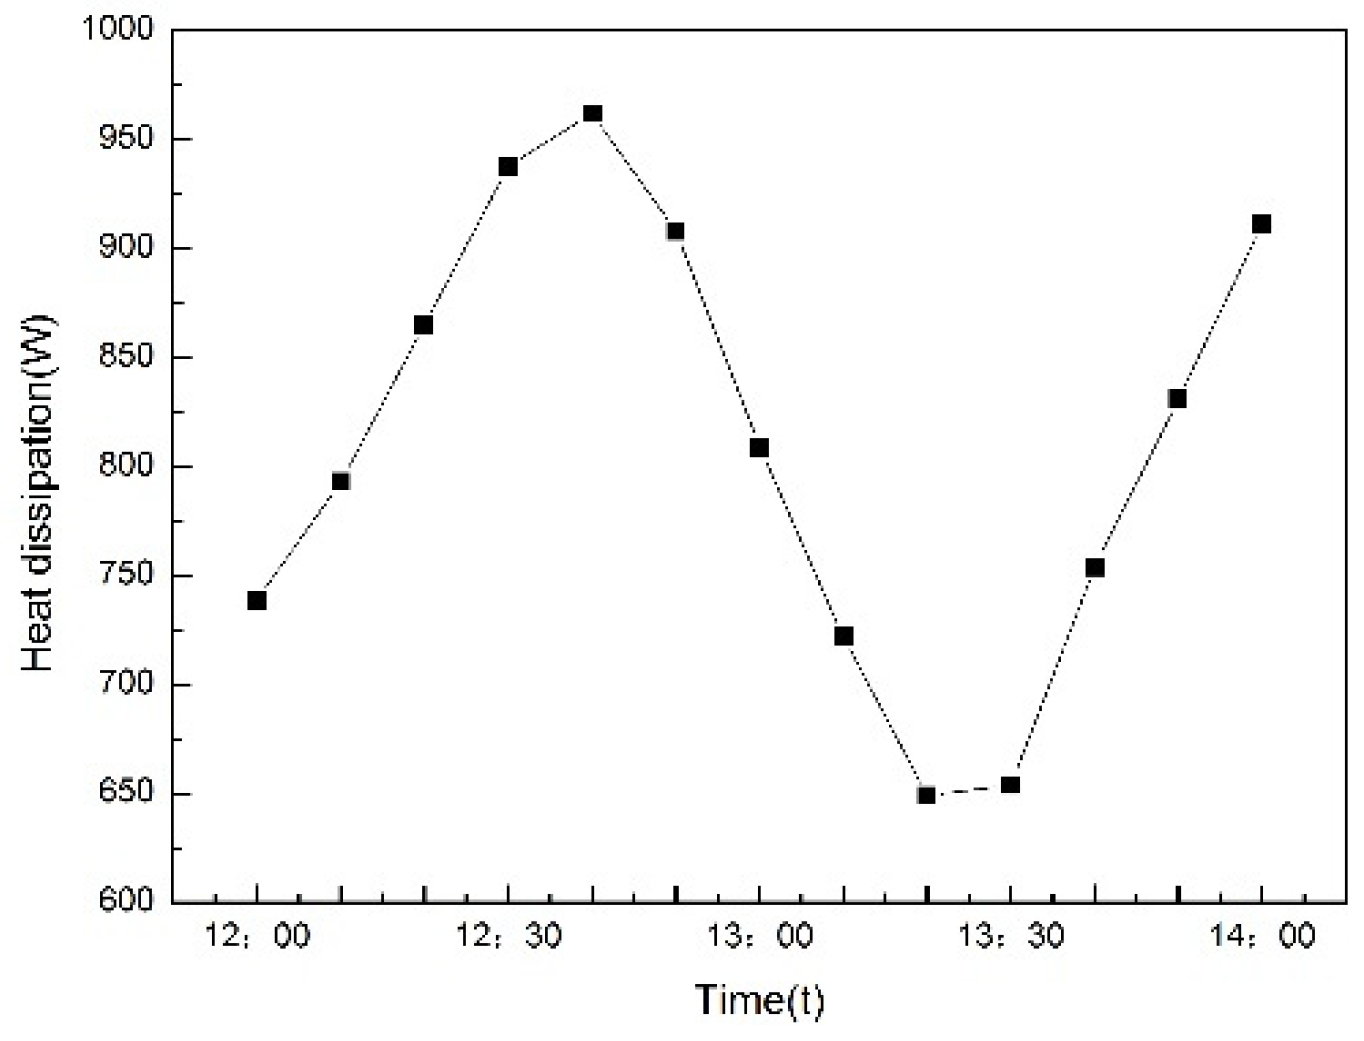
As shown in Figure 26, the amount of heat dissipation varies with the operation law of the heat pump unit. The amount of heat dissipation increases when the heat pump unit is running, and the amount of heat dissipation begins to decrease when the unit stops. The average heat dissipation of the whole process is 748.7 W, which is much larger than the average heat dissipation of heat conduction heating mode of 81.3 W, and the former is more than 9 times the latter.
4. Discussions
4.1. Thermal comfort analysis
The study found that in the heat conduction heating experiment, the human body basically reached a state of no cold feeling after 20 min of operation, and the discomfort basically disappeared. After that, the human body felt slightly warm, even warm, and the comfort gradually strengthened. Different people have certain differences in their thermal comfort, in this paper, the subjective voting method is used to evaluate the thermal comfort of human body. For the direct contact thermal comfort evaluation under non-uniform and dynamic environmental conditions, it is divided into five grades: very uncomfortable, uncomfortable, unfeeling, comfortable and very comfortable. By adopting the identification method with a voter turnout of more than 75%, finding different thermal comfort temperature ranges. Finally, it is concluded that the temperature of the contact surface between human body and bed is comfortable in the range of 36.7 to 37.2 °C, and 37.2 to 37.8 °C is very comfortable.
In the experiment of convective heating, when the wind speed of the outlet is too large, people will feel the obvious sense of blowing, thus feeling uncomfortable. When the wind speed is too small, the temperature of the blown air decays too quickly. When it reaches the head of human body, the air temperature is already low, which will also affect the thermal comfort. In this regard, during the experiment, the wind speed of the tuyere is adjusted to about 2.0 m/s, and the temperature near the human face can be maintained in the range of 24.2~27.1 °C. The blowing feeling is weak, and the overall thermal comfort is good, but for a long time, there will be a slight sense of dryness. The overall thermal comfort is not as good as the heat conduction heating.
4.2. Energy saving analysis
In the heat conduction heating experiment, the water supply temperature changes in the range of 28.6 to 42.8 °C, and the average heat dissipation during the whole lunch break heating time is only 81.3 W. If the heat loss caused by the bare capillary is removed, the value will be reduced. If the initial water supply temperature is 34 °C according to the experimental experience, the power consumption during the lunch break is 0.34 kW·h, and a large part of the power consumption is used for heating water in hot water tank and storing energy in the water. In addition, the study found that the heat conduction heating water temperature is roughly in the range of 38 to 40 °C, which can make people in a more comfortable state. Compared with radiators, floor heating, etc., the required water temperature is lower, which is more conducive to energy saving. And the heat pump unit only needs to run for 30 min to meet the heating needs of the two hours of lunch break.
In the convective heating experiment, the water supply temperature changes in the range of 39.9 to 48.8 °C, and the heating effect is relatively rapid. However, the average heat dissipation during the lunch break is 748.7 W, which is more than 9 times the average heat dissipation of thermal conduction heating experiment. During the whole lunch break heating period, the power consumption is 1.43 kW·h, which is more than 4 times that of the heat conduction heating experiment. In addition, compared with the heat conduction heating experiment, the water supply temperature of the convection heating experiment is significantly higher, which is not conducive to energy saving.
5. Conclusion
In this paper, the heat conduction heating experiment and convection heating experiment of the capillary convection and heat conduction air conditioning bed system are carried out respectively.
The experimental results show that during a 2-hour lunch break, the heat conduction heating only consumes 0.34 kW·h of electrical energy, the average heat dissipation is only 81.3 W, while convective heating requires 1.43 kW·h of electrical energy, and the average heat dissipation is 748.7 W.
From the pictures taken by the infrared thermal imager, it can be seen that compared to thermal conduction heating, the outer surface temperature of the quilt is significantly higher during convective heating, so that the heat dissipation of the quilt is relatively large. In addition, there is a continuous flow of hot air from the air outlet, resulting in the room air temperature rising from 12.3 to 17.3 °C, while the air temperature of thermal conduction heating room only rises from 14.4 to 15.2 °C.
Compared with heat conduction heating, convective heating has a faster heating effect, but it is prone to dryness for a long time, while heat conduction heating has a slower heating rate, and even has a cool feeling in the first 20 min, but then the thermal comfort has been better, making the overall thermal comfort of convective heating not as good as that of heat conduction heating. In addition, the water temperature range required for heat conduction heating is low, and the quality required for hot water is low, which is conducive to energy saving.
Whether it is heat conduction heating or convective heating, the air temperature near the chest in the quilt is significantly higher than the air temperature near the legs in the quilt, which makes the upper body of human body feel hotter than the lower body of human body. This is also the reason why cold feet often occur at the beginning of the experiment. After comparison, it is found that the overall thermal comfort of heat conduction heating is better and more energy saving. It is recommended that the system use heat conduction heating mode in winter heating.
Nomenclature
| IAT | Indoor air temperature(°C) |
| OAT | Outdoor air temperature(°C) |
| RHIA | Relative humidity of indoor air(%) |
| RHOA | Relative humidity of outdoor air(%) |
| SWT | Supply water temperature(°C) |
| RWT | Return water temperature(°C) |
| STSWC | Surface temperature of supply water capillary(°C) |
| STRWC | Surface temperature of return water capillary(°C) |
| TSHB | Temperature of the contact surface between human body and bed(°C) |
| ATCQ | Air temperature near the chest in the quilt(°C) |
| ATLQ | Air temperature near the legs in the quilt(°C) |
| STM | Surface temperature of the sponge-padded mattress in the middle of the legs(°C) |
| ATT | Air temperature of tuyere(°C) |
References
- Yao, R.; Li, B.; Steemers, K. Energy policy and standard for built environment in China. Renewable Energy 2005, 30, 1973–1988. [Google Scholar] [CrossRef]
- Yong, C.; Yiping, W.; Li, Z. Performance analysis on a building-integrated solar heating and cooling panel. Renewable Energy 2015, 74, 627–632. [Google Scholar] [CrossRef]
- Yang, L.; Yan, H.; Lam, J.C. Thermal comfort and building energy consumption implications – A review. Applied Energy 2014, 115, 164–173. [Google Scholar] [CrossRef]
- Tzivanidis, C.; Antonopoulos, K.A.; Gioti, F. Numerical simulation of cooling energy consumption in connection with thermostat operation mode and comfort requirements for the Athens buildings. Applied Energy 2011, 88, 2871–2884. [Google Scholar] [CrossRef]
- Zhang, H.; Arens, E.; Zhai, Y. A review of the corrective power of personal comfort systems in non-neutral ambient environments. Building and Environment 2015, 91, 15–41. [Google Scholar] [CrossRef]
- Hoyt, T.; Arens, E.; Zhang, H. Extending air temperature setpoints: Simulated energy savings and design considerations for new and retrofit buildings. Building and Environment 2015, 88, 89–96. [Google Scholar] [CrossRef]
- Li, N.; He, D.; He, Y.; He, M.; Zhang, W. Experimental Study on Thermal Comfort with Radiant Cooling Workstation and Desktop Fan in Hot – humid Environment. Journal of Huanan University (Natural Sciences) 2017, 44, 198–204. [Google Scholar] [CrossRef]
- Zhai, Y.; Zhang, H.; Zhang, Y.; Pasut, W.; Arens, E.; Meng, Q. Comfort under personally controlled air movement in warm and humid environments. Building and Environment 2013, 65, 109–117. [Google Scholar] [CrossRef]
- Huang, L.; Ouyang, Q.; Zhu, Y.; Jiang, L. A study about the demand for air movement in warm environment. Building and Environment 2013, 61, 27–33. [Google Scholar] [CrossRef]
- Zhang, H.; Arens, E.; Kim, D.; Buchberger, E.; Bauman, F.; Huizenga, C. Comfort, perceived air quality, and work performance in a low-power task–ambient conditioning system. Building and Environment 2010, 45, 29–39. [Google Scholar] [CrossRef]
- He, Y.; Wang, X.; Li, N.; He, M.; He, D. Heating chair assisted by leg-warmer: A potential way to achieve better thermal comfort and greater energy conservation in winter. Energy and Buildings 2018, 158, 1106–1116. [Google Scholar] [CrossRef]
- Pasut, W.; Zhang, H.; Arens, E.; Zhai, Y. Energy-efficient comfort with a heated/cooled chair: Results from human subject tests. Building and Environment 2015, 84, 10–21. [Google Scholar] [CrossRef]
- Oi, H.; Yanagi, K.; Tabata, K.; Tochihara, Y. Effects of heated seat and foot heater on thermal comfort and heater energy consumption in vehicle. Ergonomics 2011, 54, 690–699. [Google Scholar] [CrossRef]
- Zhang, H.; Arens, E.; Taub, M.; Dickerhoff, D.; Bauman, F.; Fountain, M.; Pasut, W.; Fannon, D.; Zhai, Y.; Pigman, M. Using footwarmers in offices for thermal comfort and energy savings. Energy and Buildings 2015, 104, 233–243. [Google Scholar] [CrossRef]
- Foda, E.; Sirén, K. Design strategy for maximizing the energy-efficiency of a localized floor-heating system using a thermal manikin with human thermoregulatory control. Energy and Buildings 2012, 51, 111–121. [Google Scholar] [CrossRef]
- Zeiler, W.; Boxem, G. Effects of thermal activated building systems in schools on thermal comfort in winter. Building and Environment 2009, 44, 2308–2317. [Google Scholar] [CrossRef]
- Deng, Q.; Wang, R.; Li, Y.; Miao, Y.; Zhao, J. Human thermal sensation and comfort in a non-uniform environment with personalized heating. Sci Total Environ 2017, 578, 242–248. [Google Scholar] [CrossRef]
- Arens, E.; Zhang, H.; Huizenga, C. Partial- and whole-body thermal sensation and comfort—Part II: Non-uniform environmental conditions. Journal of Thermal Biology 2006, 31, 60–66. [Google Scholar] [CrossRef]
- Lv, B.; Su, C.; Yang, L.; Wu, T. Effects of stimulus mode and ambient temperature on cerebral responses to local thermal stimulation: An EEG study. Int J Psychophysiol 2017, 113, 17–22. [Google Scholar] [CrossRef]
- Schellen, L.; Loomans, M.G.; de Wit, M.H.; Olesen, B.W.; van Marken Lichtenbelt, W.D. The influence of local effects on thermal sensation under non-uniform environmental conditions--gender differences in thermophysiology, thermal comfort and productivity during convective and radiant cooling. Physiol Behav 2012, 107, 252–261. [Google Scholar] [CrossRef]
- Wang, D.; Chen, P.; Liu, Y.; Wu, C.; Liu, J. Heat transfer characteristics of a novel sleeping bed with an integrated hot water heating system. Applied Thermal Engineering 2017, 113, 79–86. [Google Scholar] [CrossRef]
- Yu, G.; Gao, S.; Qiang, j. Modeling of heartbeat for sleep in integrated with PCM thermal storage and solar heating. Journal of ChongqingUniversity 2011, 34, 89–92+99. [Google Scholar]
- Pan, D.; Chan, M.; Xia, L.; Xu, X.; Deng, S. Performance evaluation of a novel bed-based task/ambient conditioning (TAC) system. Energy and Buildings 2012, 44, 54–62. [Google Scholar] [CrossRef]
- Mao, N.; Pan, D.; Chan, M.; Deng, S. Experimental and numerical studies on the performance evaluation of a bed-based task/ambient air conditioning (TAC) system. Applied Energy 2014, 136, 956–967. [Google Scholar] [CrossRef]
- Mao, N.; Song, M.; Deng, S.; Pan, D.; Chen, S. Experimental and numerical study on air flow and moisture transport in sleeping environments with a task/ambient air conditioning (TAC) system. Energy and Buildings 2016, 133, 596–604. [Google Scholar] [CrossRef]
- Mao, N.; Pan, D.; Li, Z.; Xu, Y.; Song, M.; Deng, S. A numerical study on influences of building envelope heat gain on operating performances of a bed-based task/ambient air conditioning (TAC) system in energy saving and thermal comfort. Applied Energy 2017, 192, 213–221. [Google Scholar] [CrossRef]
- Mao, N.; Hao, J.; Cui, B.; Li, Y.; Song, M.; Xu, Y.; Deng, S. Energy performance of a bedroom task/ambient air conditioning (TAC) system applied in different climate zones of China. Energy 2018, 159, 724–736. [Google Scholar] [CrossRef]
- Du, J.; Chan, M.; Deng, S. An experimental study on the performances of a radiation-based task/ambient air conditioning system applied to sleeping environments. Energy and Buildings 2017, 139, 291–301. [Google Scholar] [CrossRef]
- Catalina, T.; Virgone, J.; Kuznik, F. Evaluation of thermal comfort using combined CFD and experimentation study in a test room equipped with a cooling ceiling. Building and Environment 2009, 44, 1740–1750. [Google Scholar] [CrossRef]
- Mikeska, T.; Svendsen, S. Study of thermal performance of capillary micro tubes integrated into the building sandwich element made of high performance concrete. Applied Thermal Engineering 2013, 52, 576–584. [Google Scholar] [CrossRef]
- Xin, Y.; Cui, W.; Zeng, J. Experimental study on thermal comfort in a confined sleeping environment heating with capillary radiation panel. Energy and Buildings 2019, 205, 109540. [Google Scholar] [CrossRef]
- Jiang, P.; Huang, Y.; Wei, X.; Mu, Y. Effect of Local Radiant Heating on Thermal Comfort in Cold Environment. Journal of BEE 2022, 52–55. [Google Scholar] [CrossRef]
- He, Y.; Li, N.; Huang, Q. A field study on thermal environment and occupant local thermal sensation in offices with cooling ceiling in Zhuhai, China. Energy and Buildings 2015, 102, 277–283. [Google Scholar] [CrossRef]
Figure 1.
Layout of experimental room and air conditioning bed system.
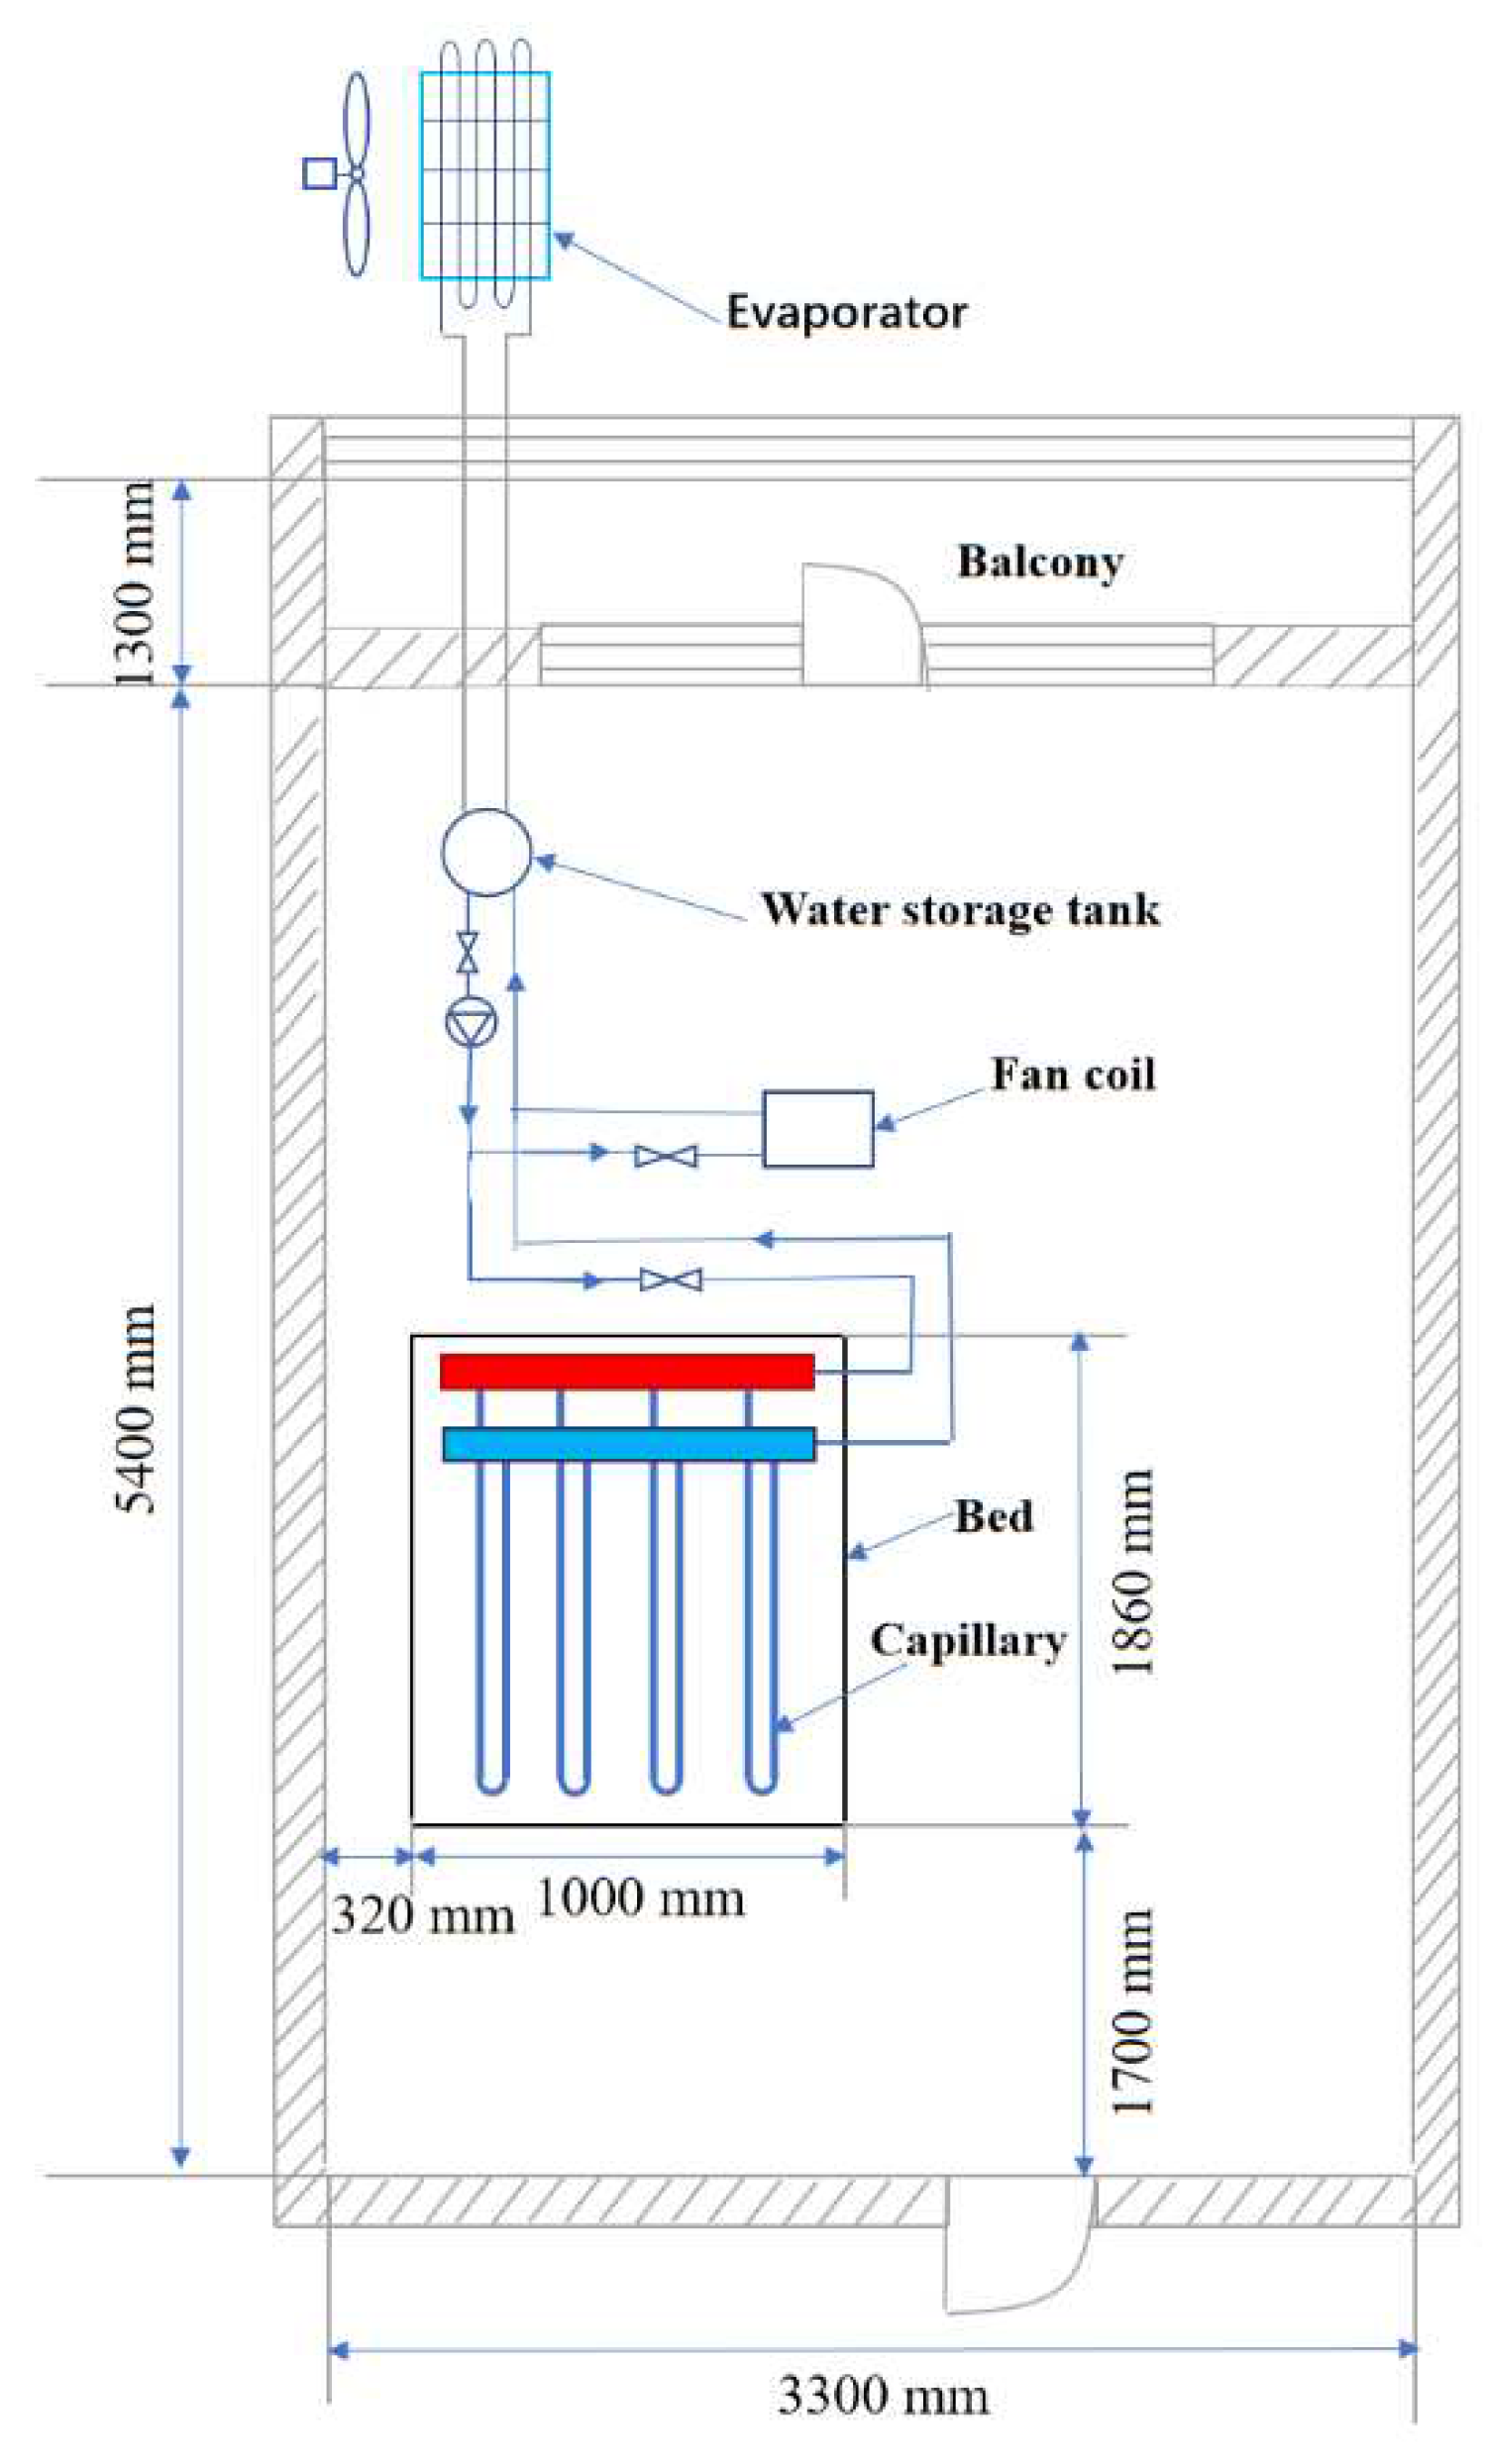
Figure 2.
Physical diagram of capillary convection and heat conduction air conditioning bed system.
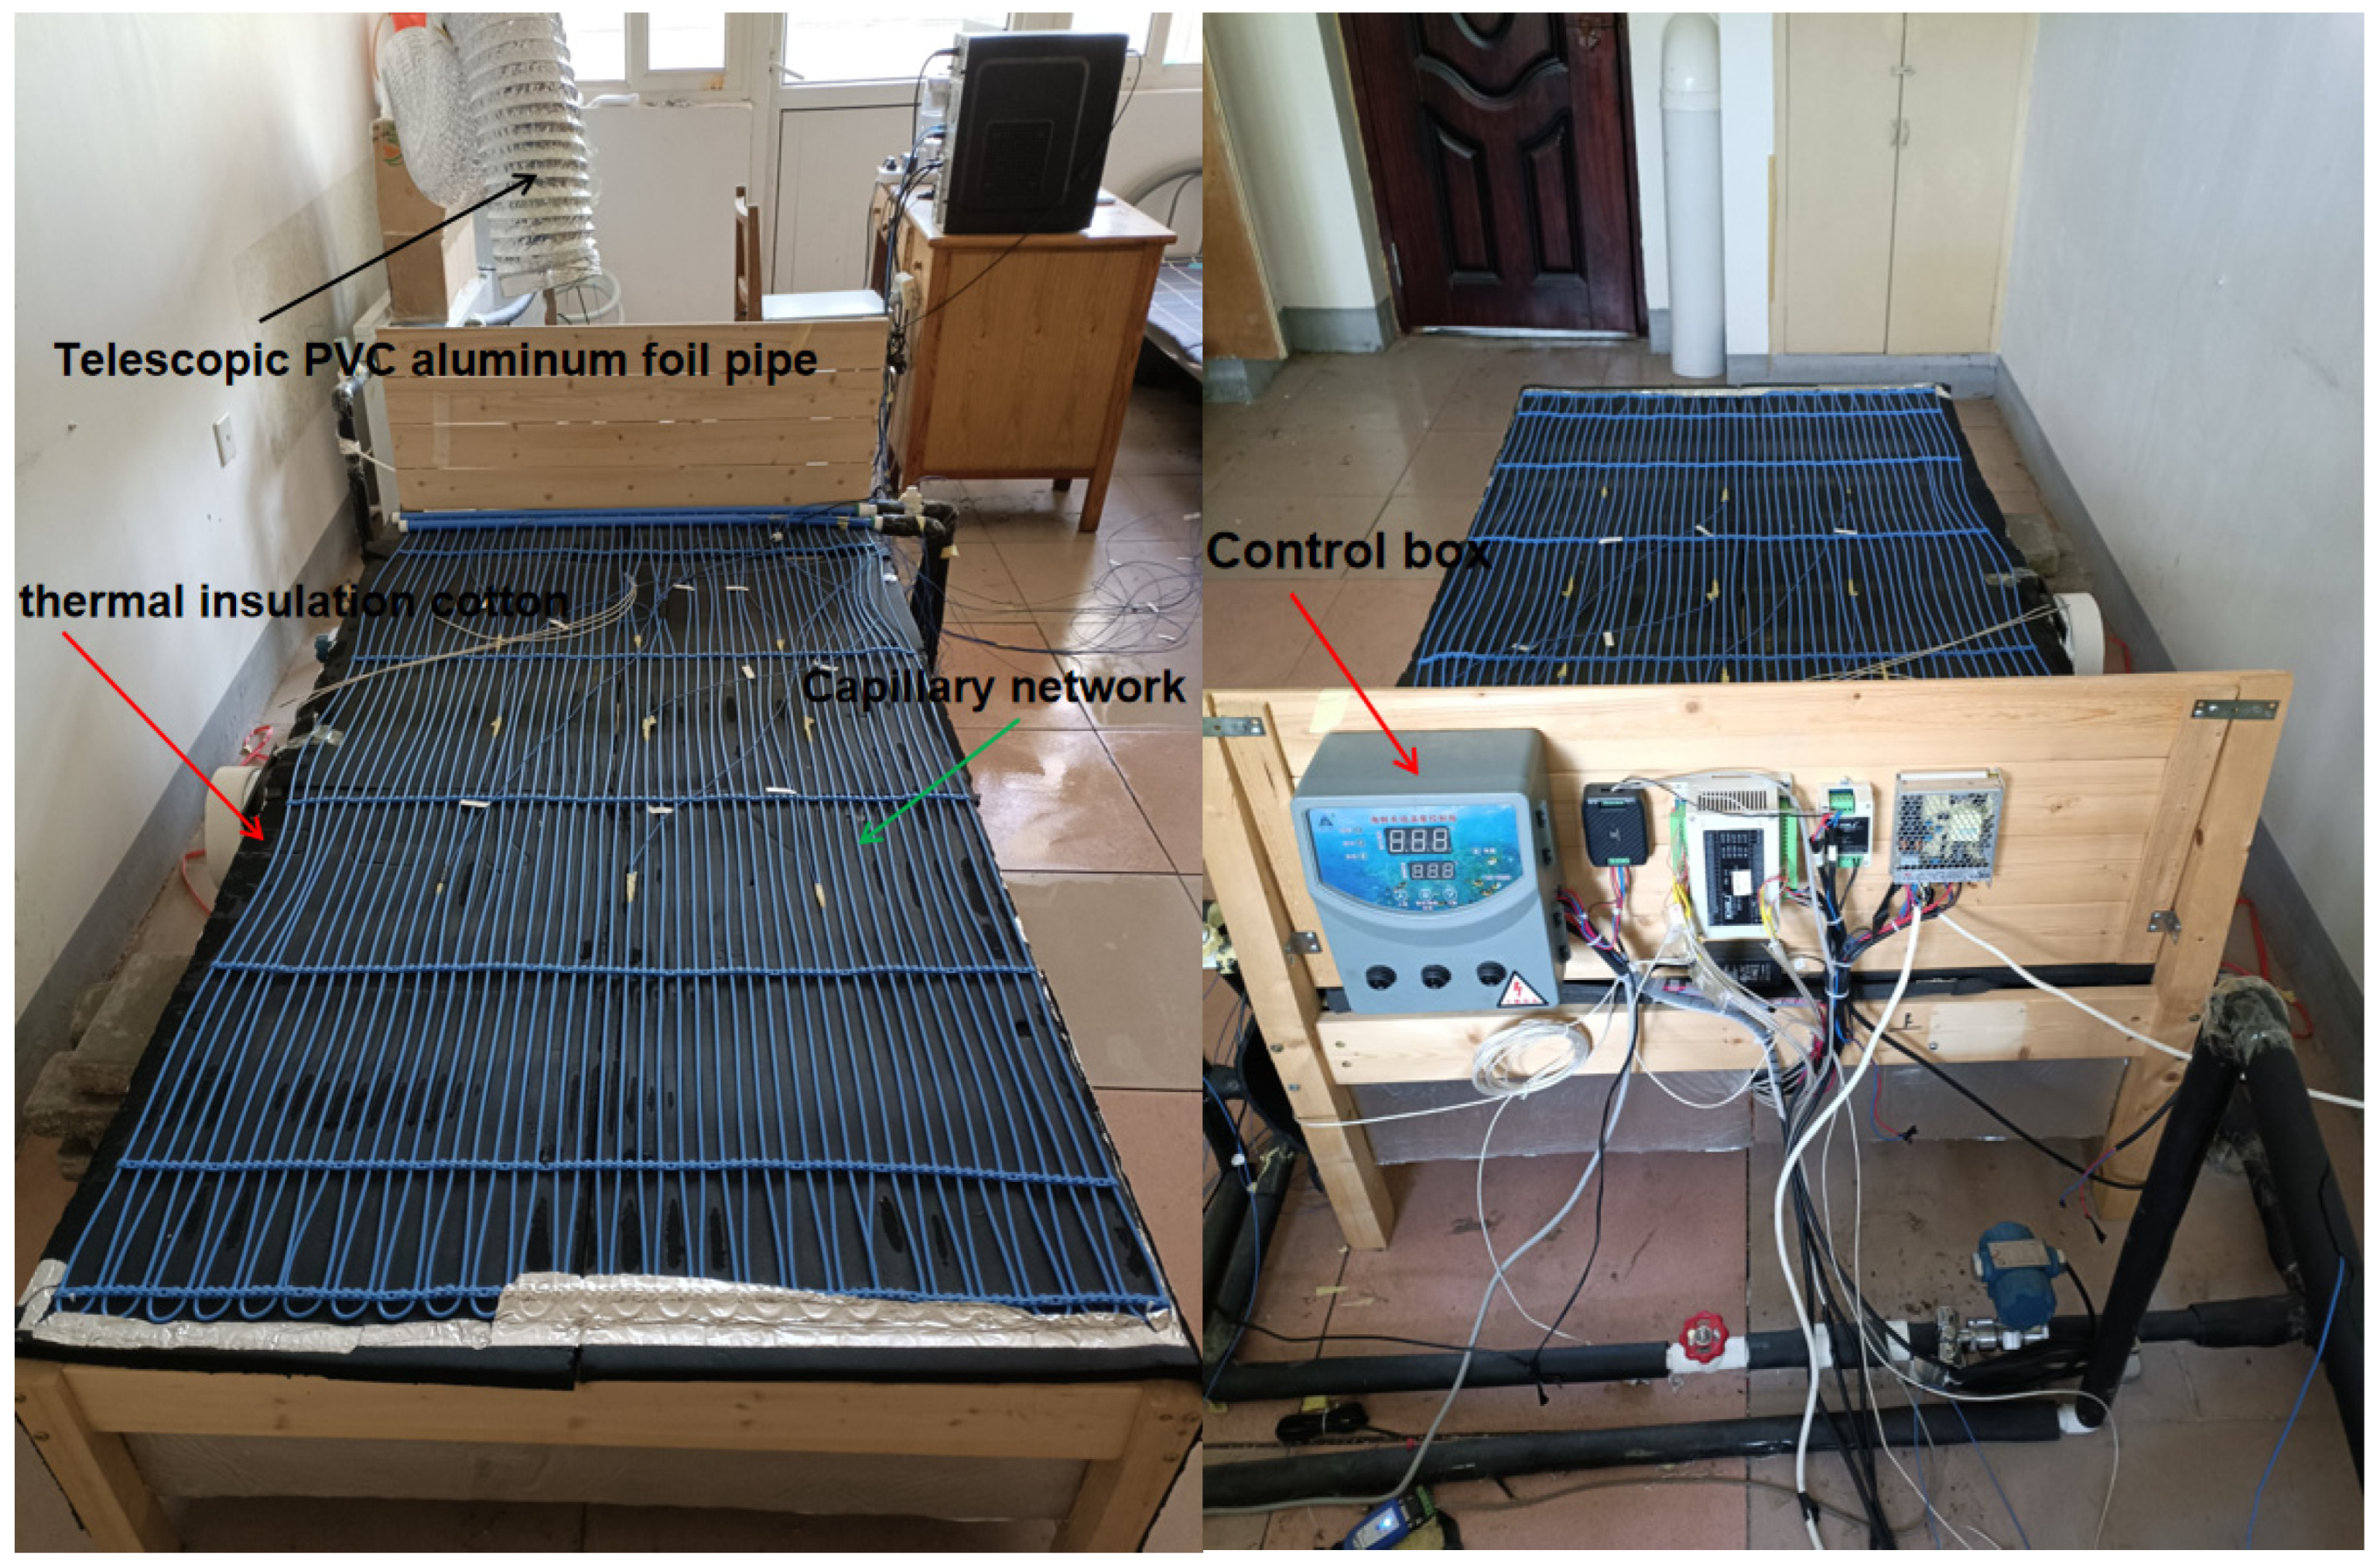
Figure 3.
Fan coil and hot water tank.
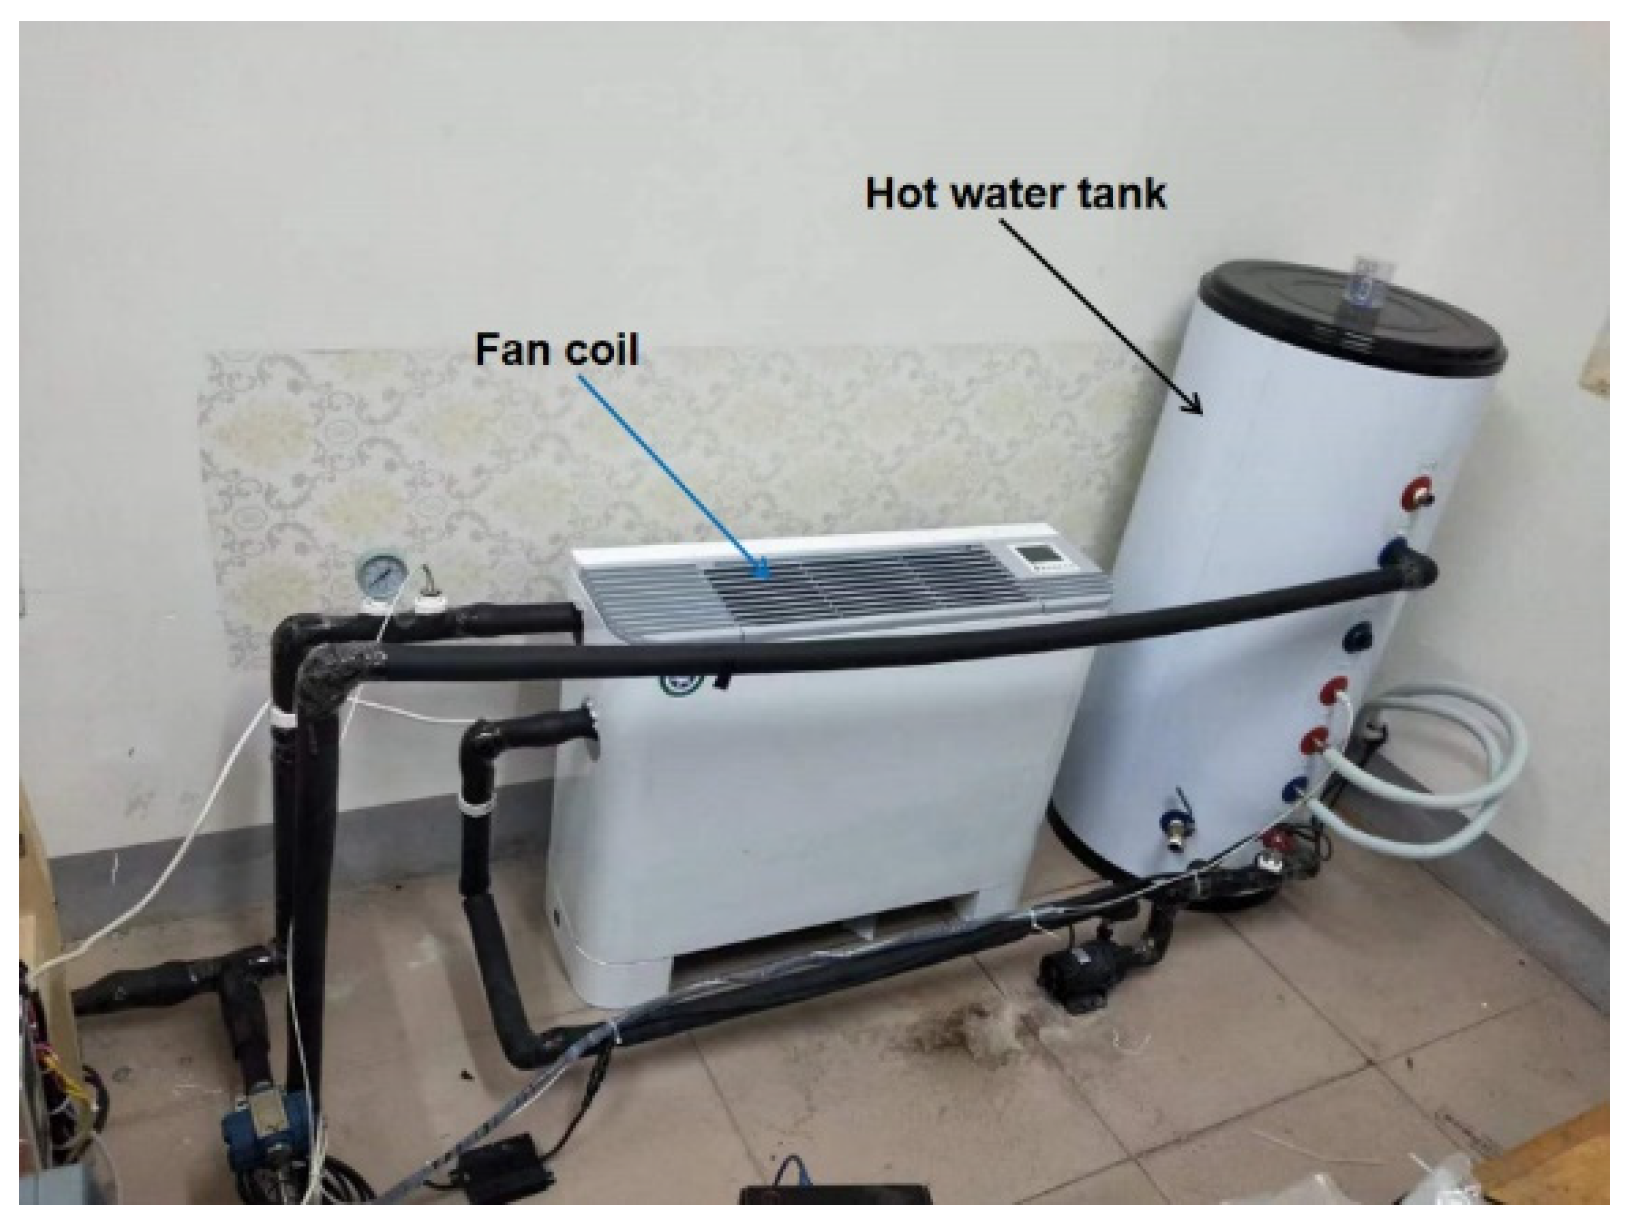
Figure 4.
Air source heat pump.
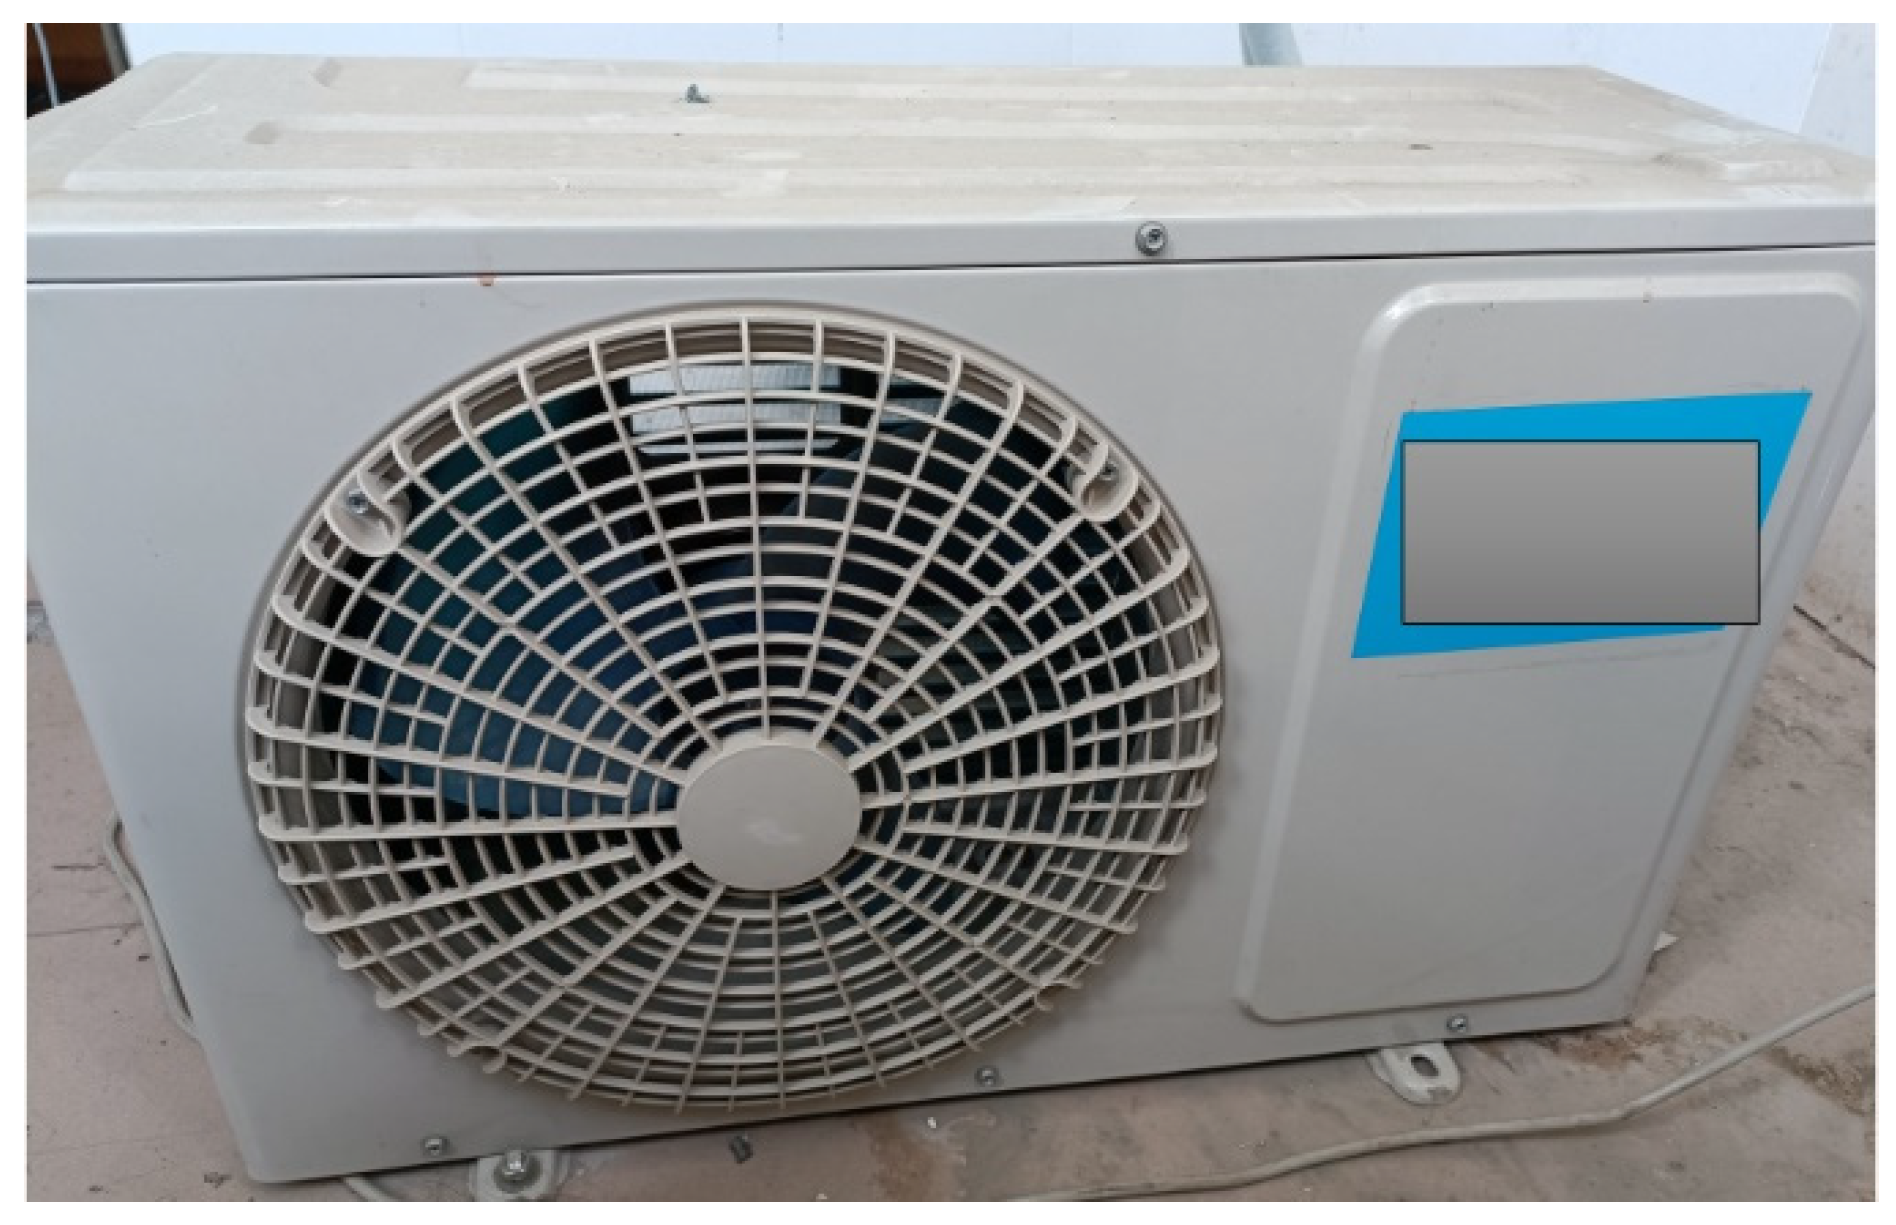
Figure 5.
YP5000 multi-channel temperature recorder and anemometer.
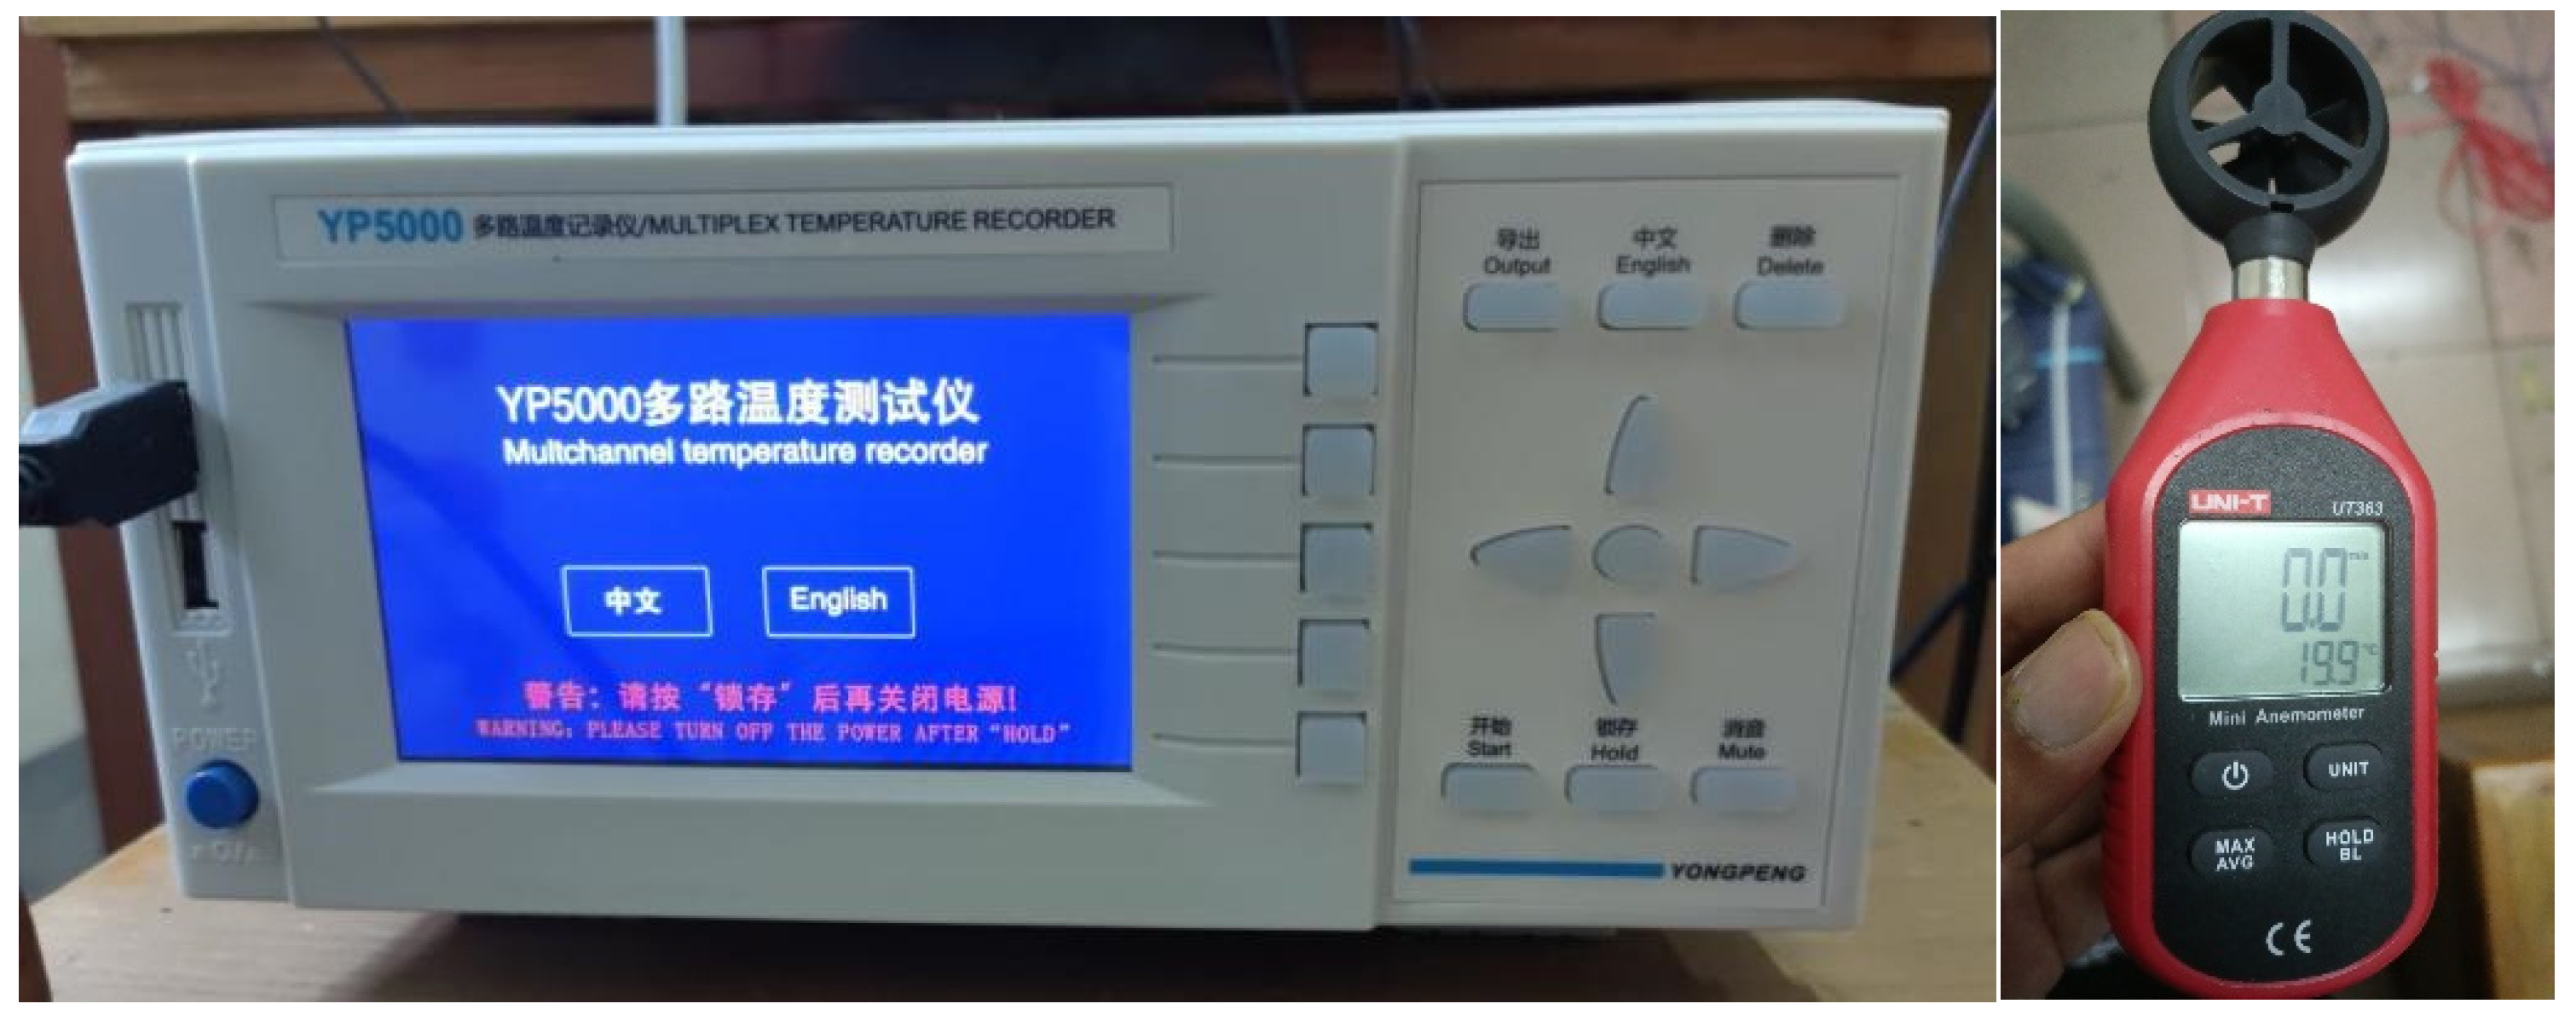
Figure 6.
Field view of the subject during the experiment.
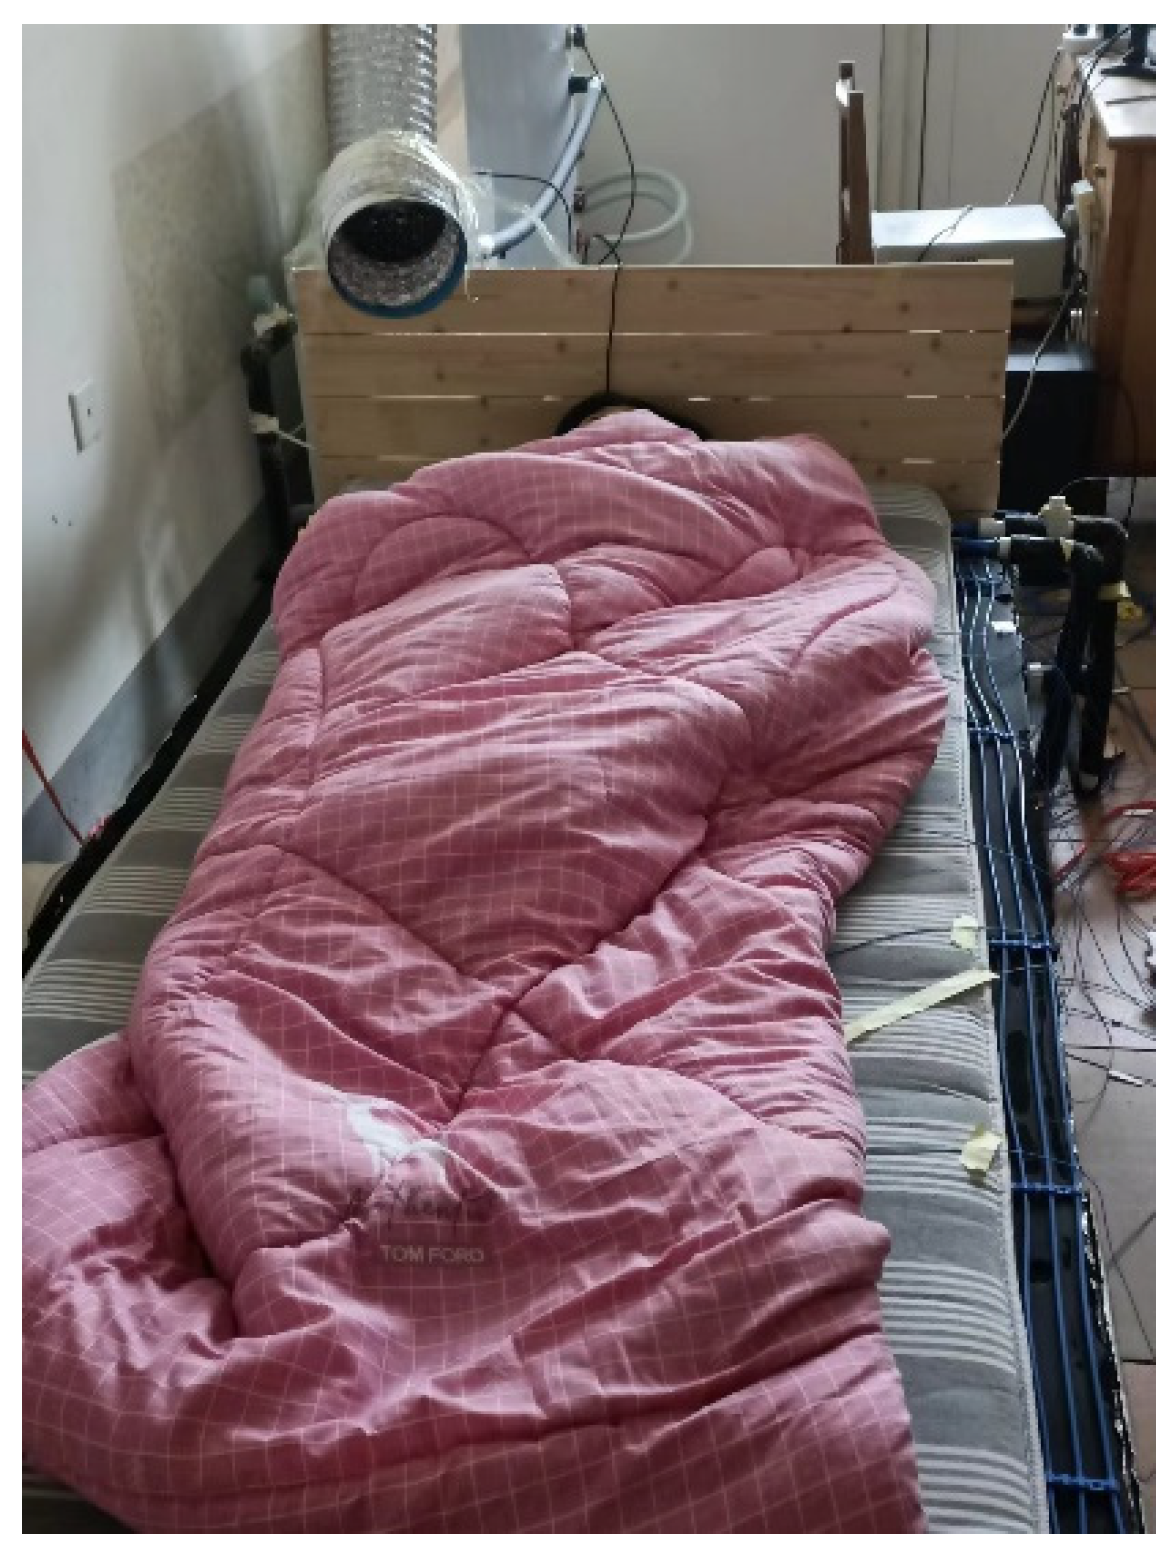
Figure 7.
Indoor and outdoor air temperature change graph.
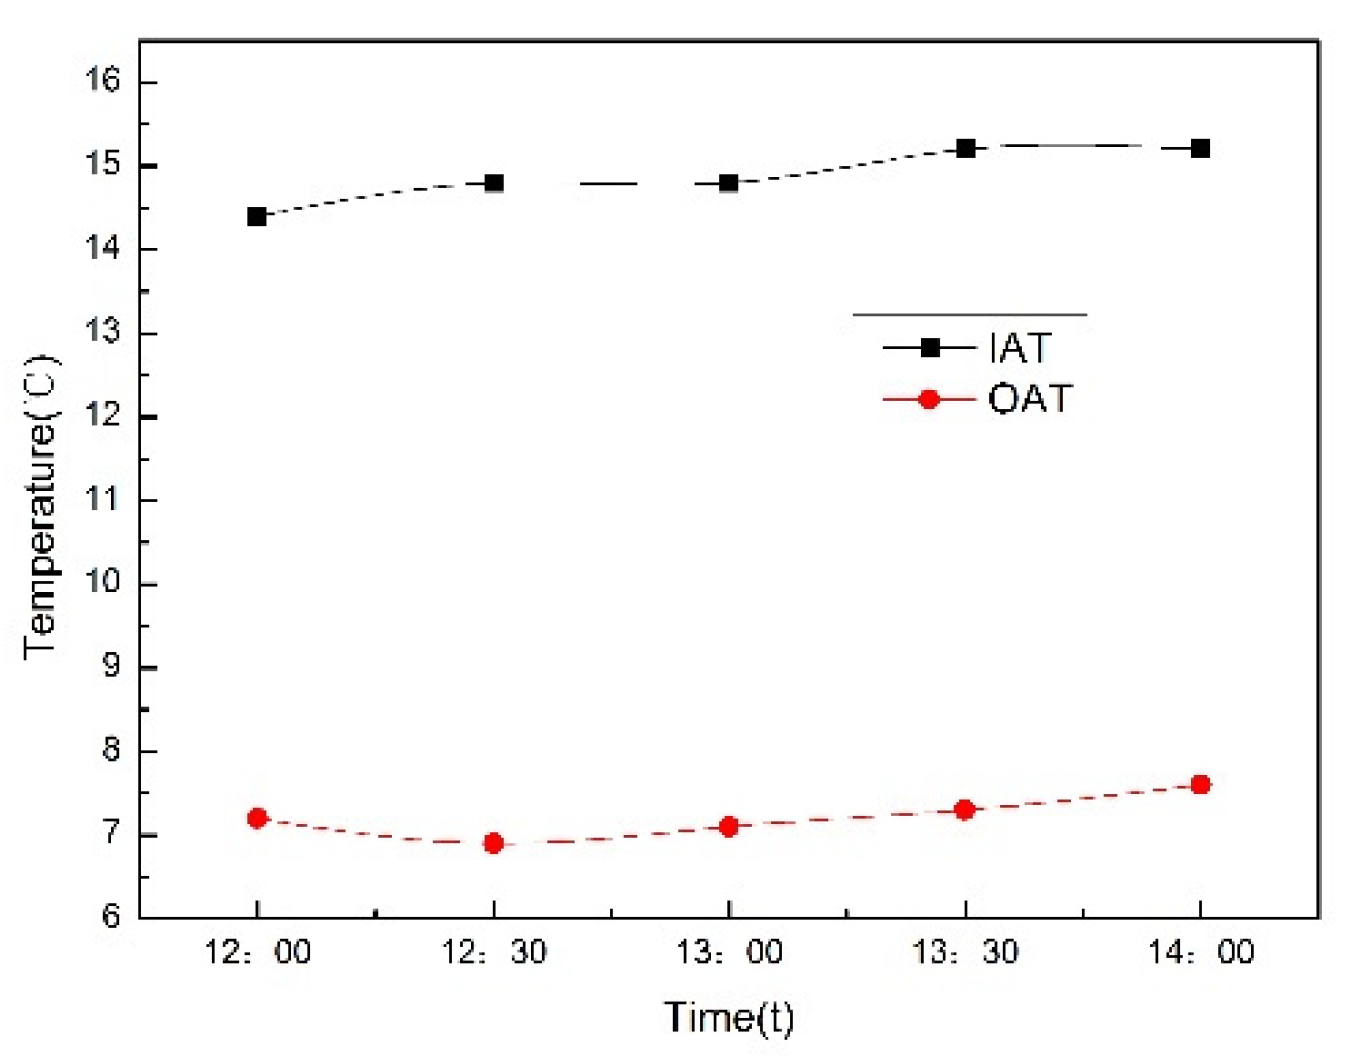
Figure 8.
Variation curve of indoor and outdoor air relative humidity.
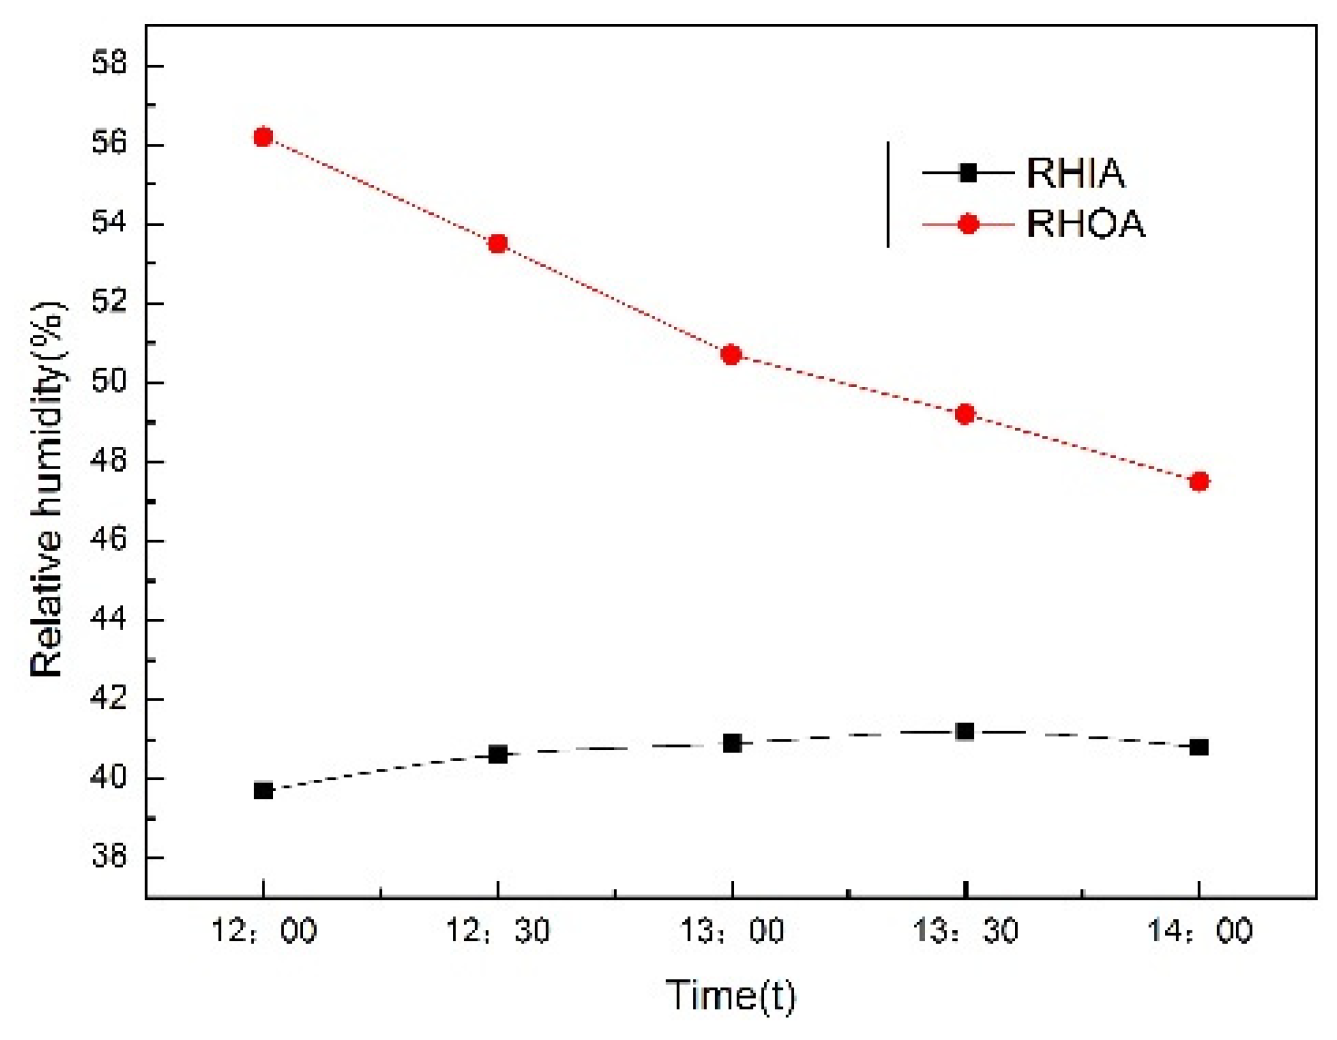
Figure 9.
Temperature variation curve of different measuring points during thermal conduction heating.
Figure 9.
Temperature variation curve of different measuring points during thermal conduction heating.
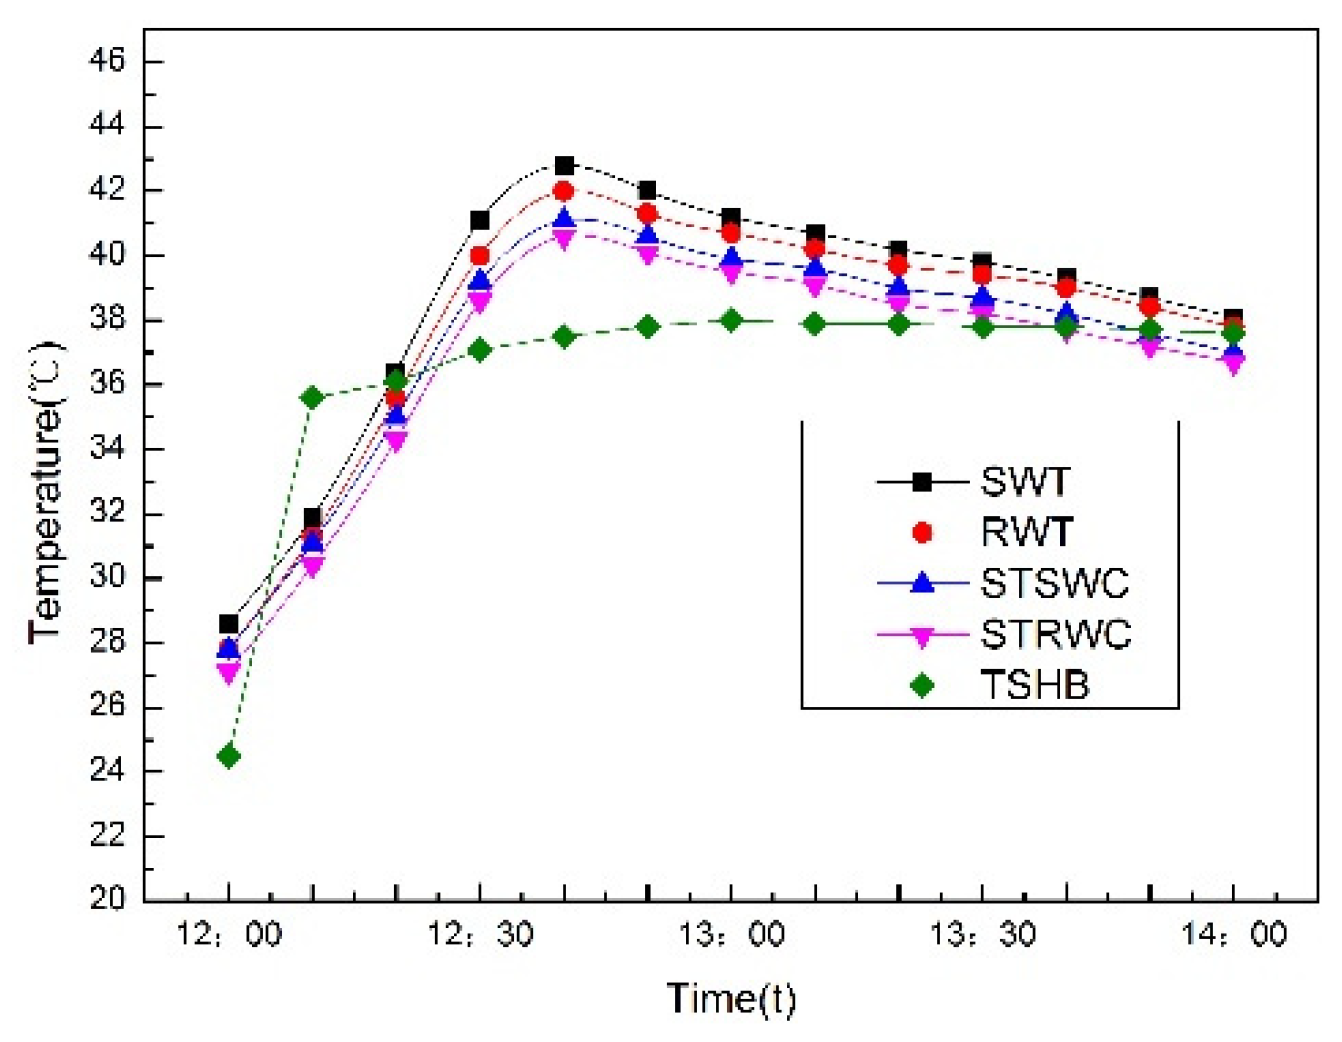
Figure 10.
Temperature change curve of measurement points in the quilt during thermal conduction heating.
Figure 10.
Temperature change curve of measurement points in the quilt during thermal conduction heating.
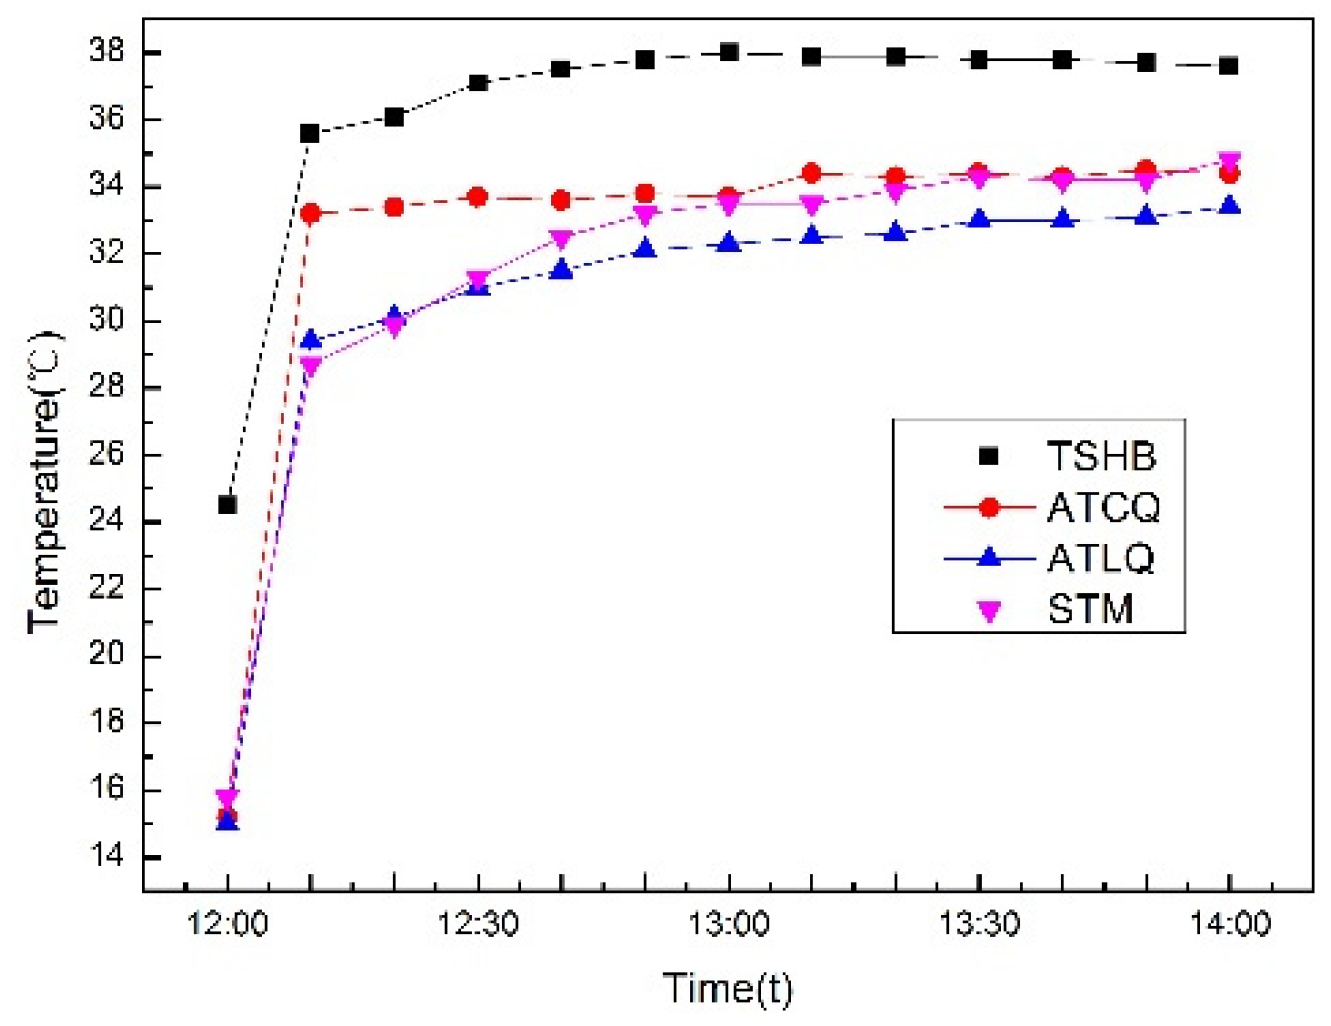
Figure 11.
Temperature field distribution of infrared thermal imager at 12:30.
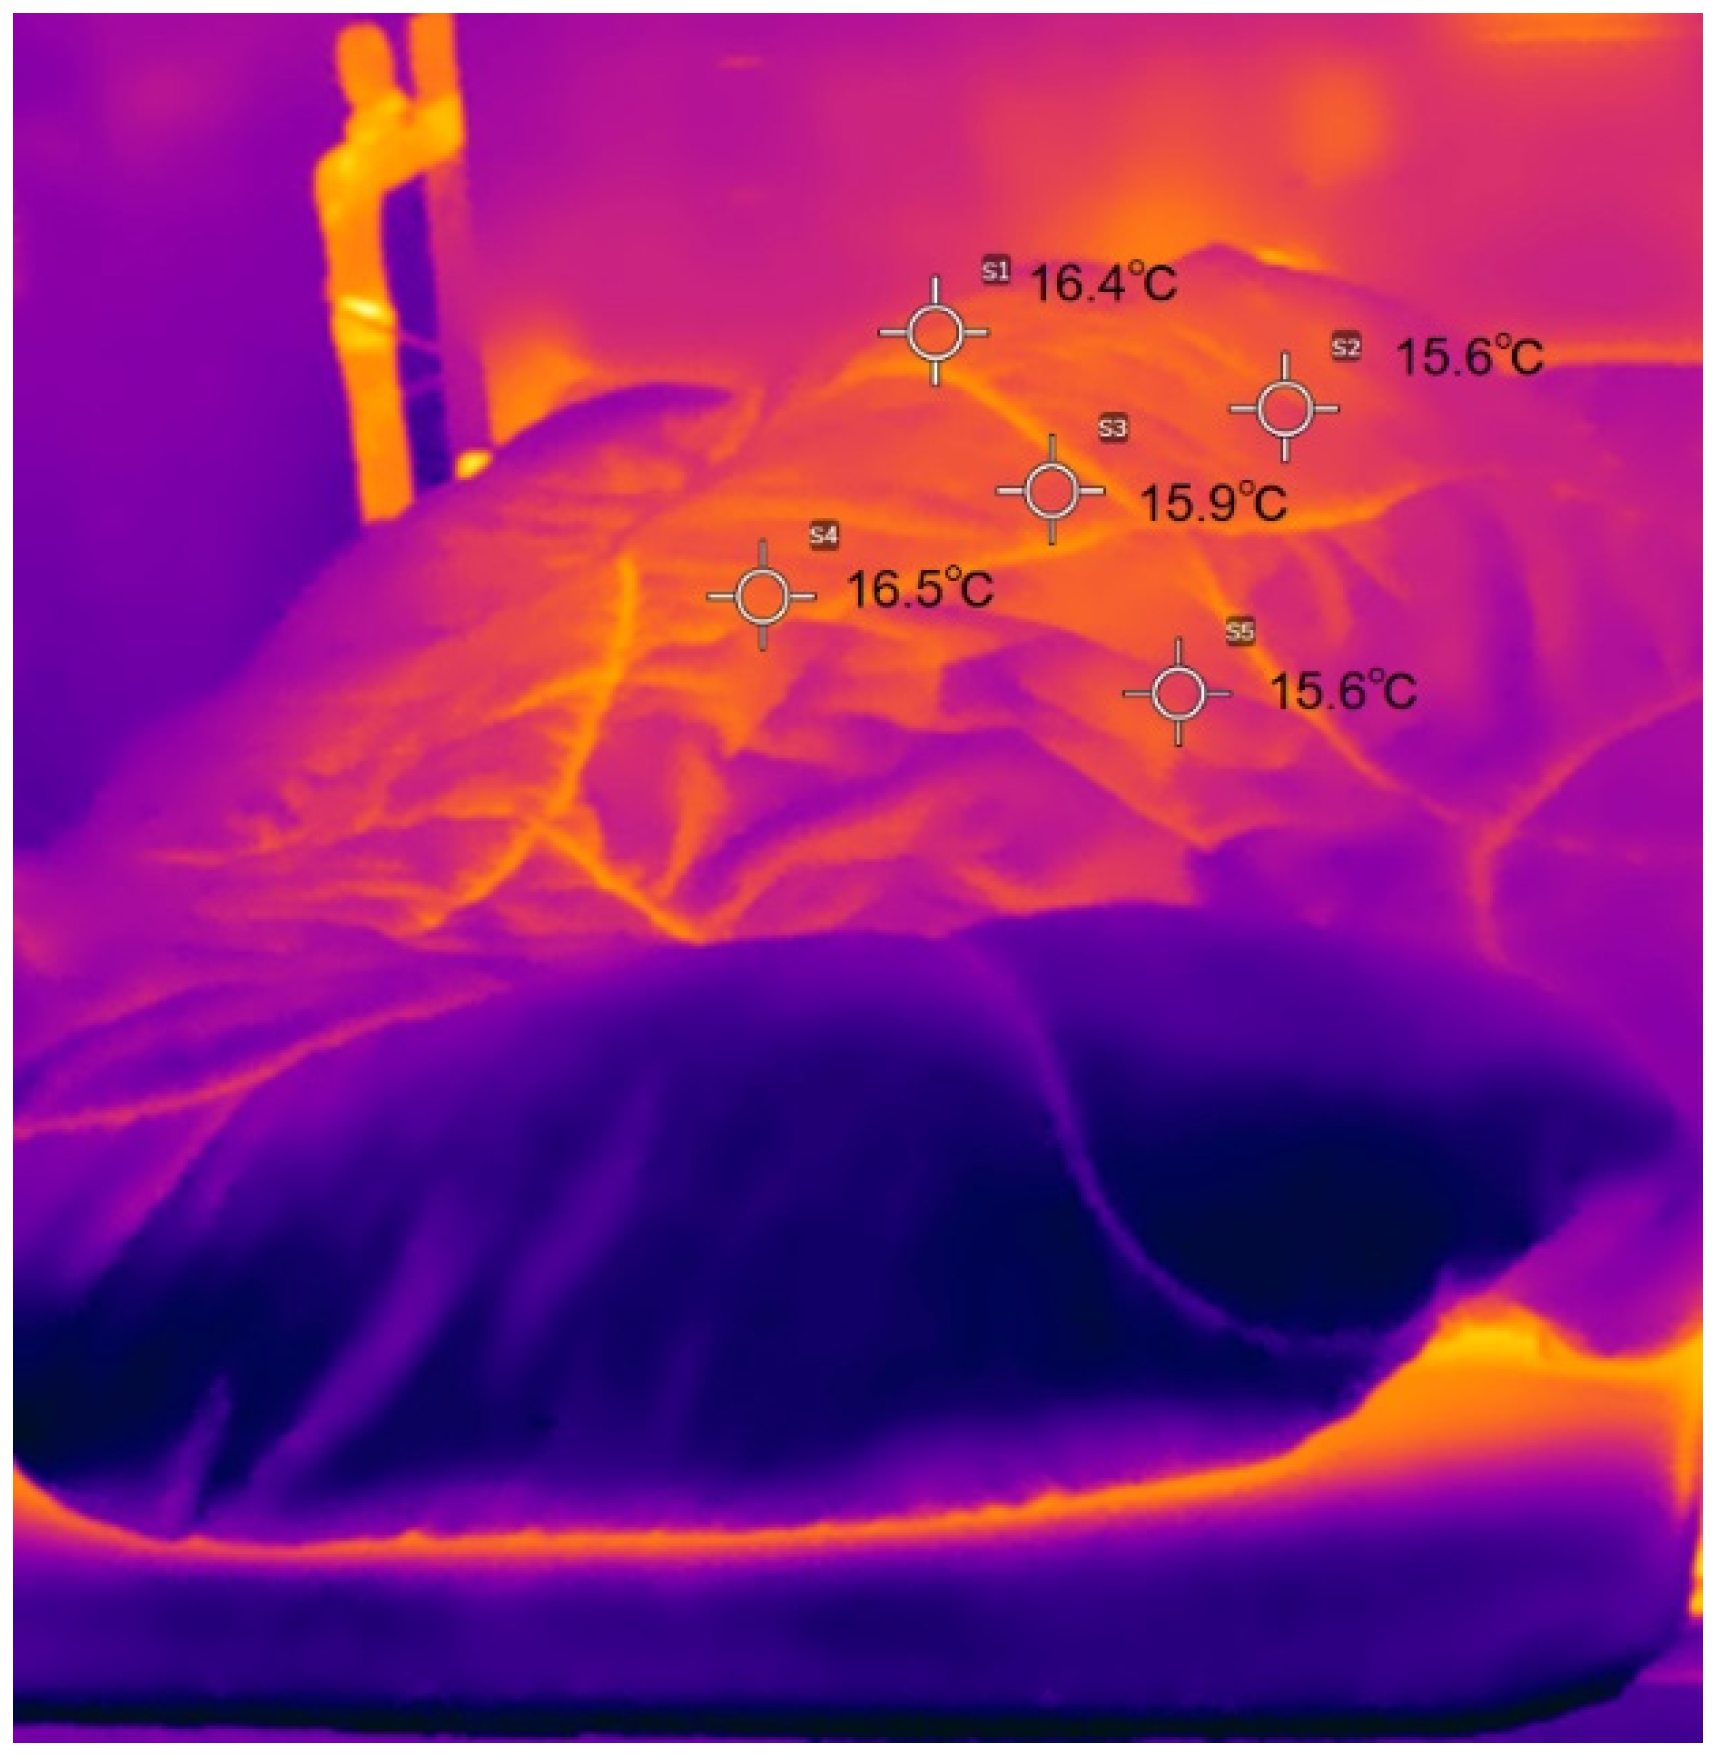
Figure 12.
Temperature field distribution of infrared thermal imager at 13:00.
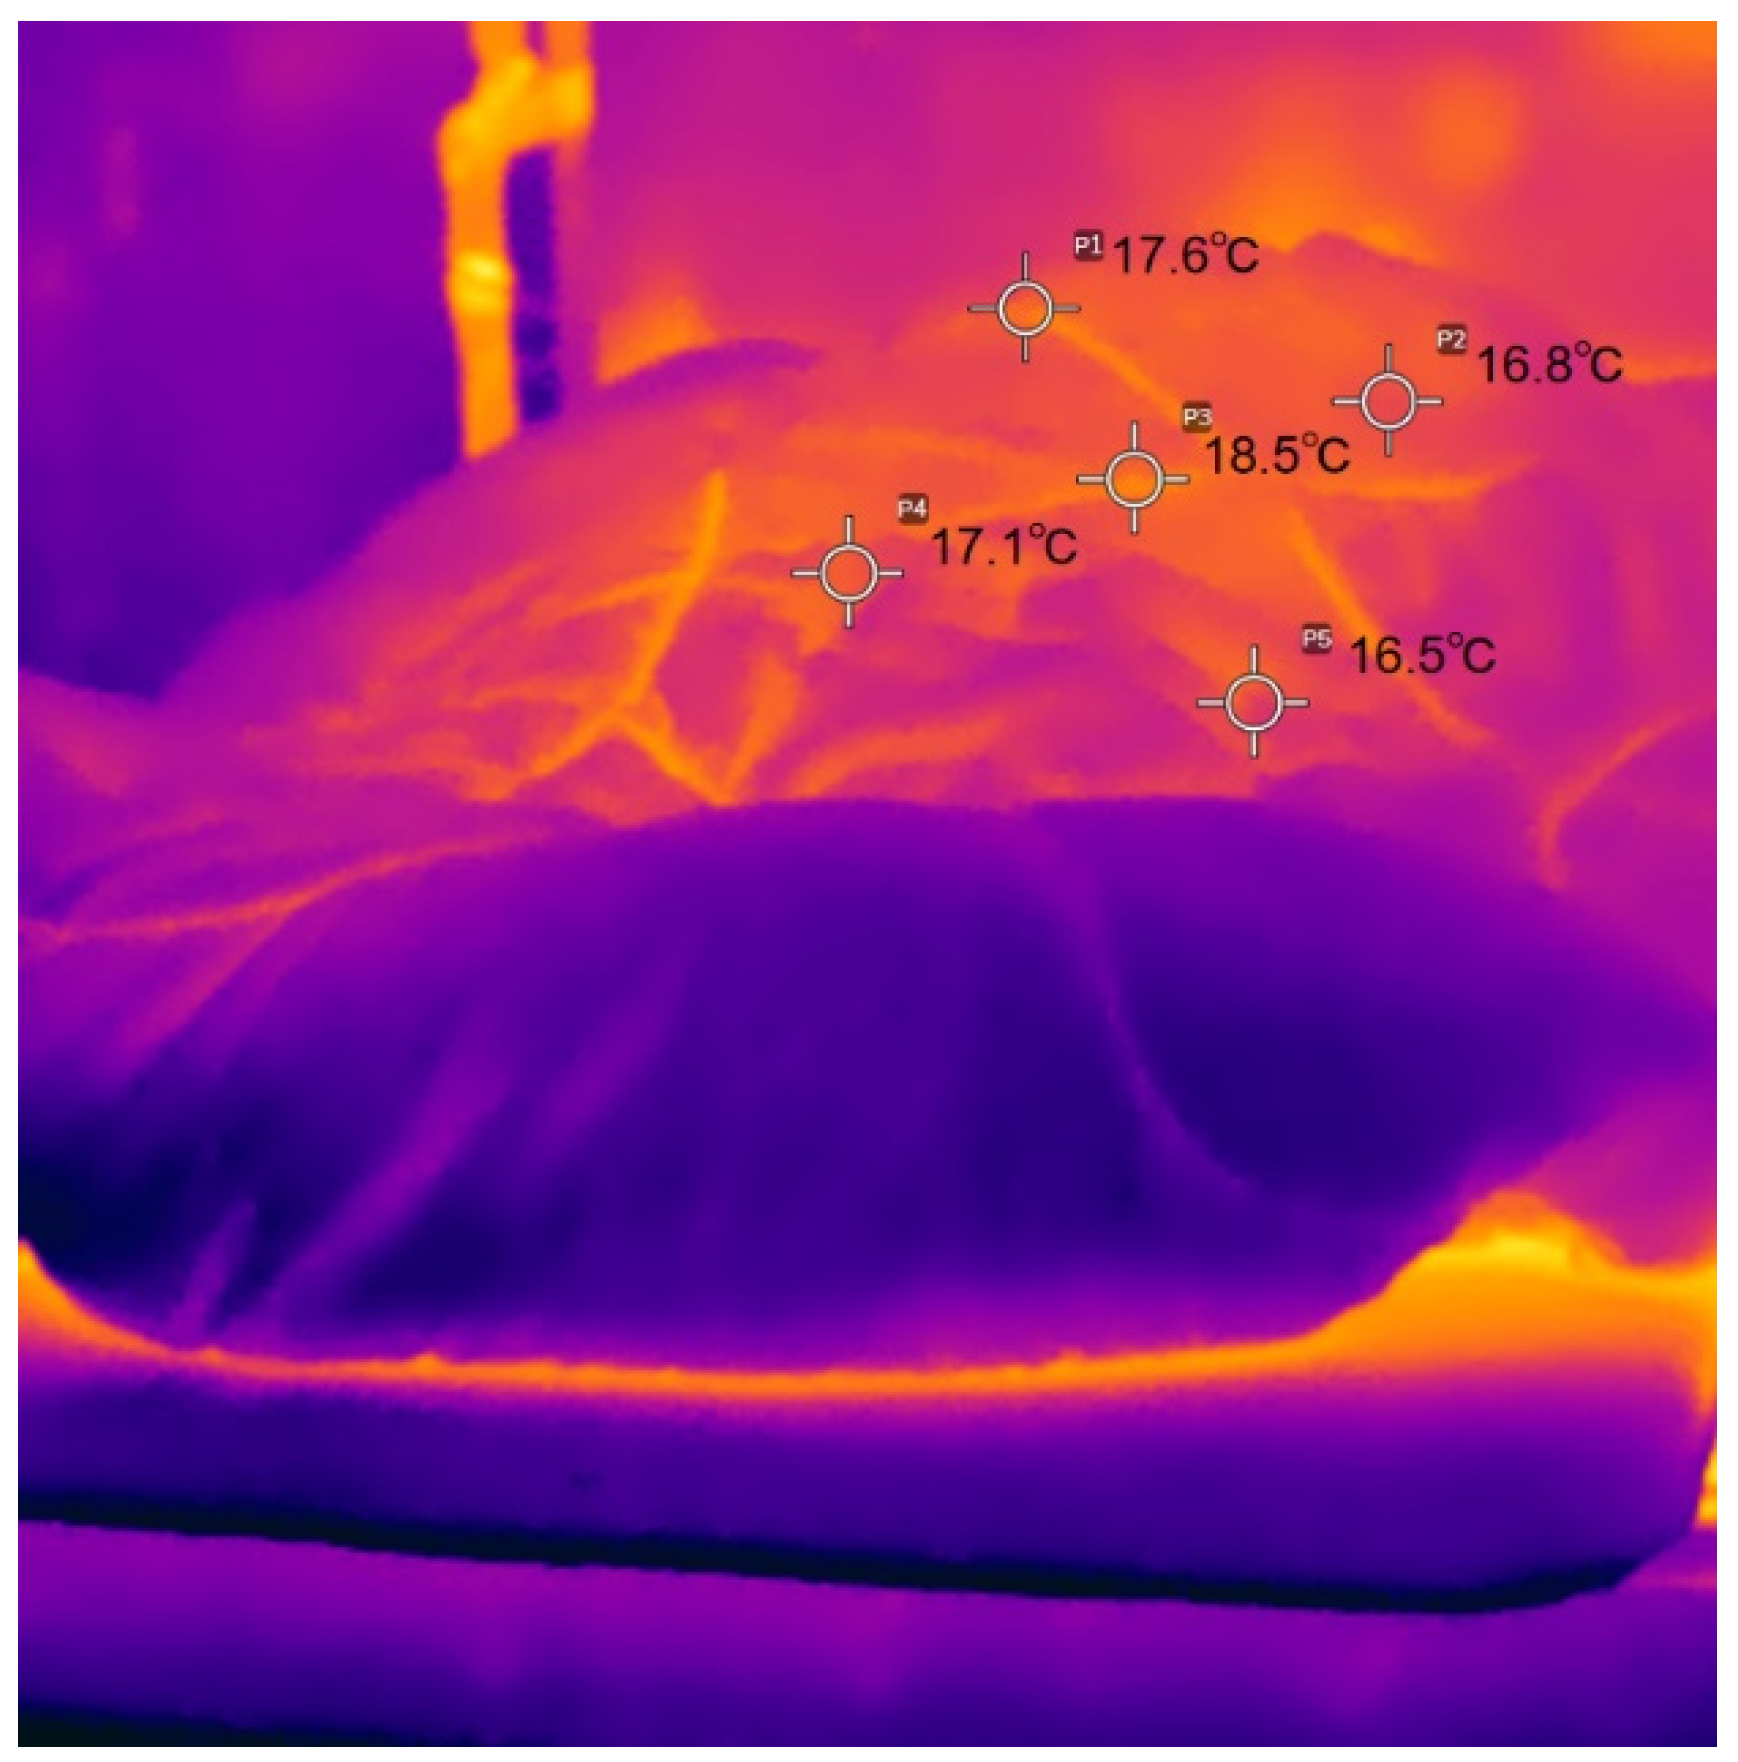
Figure 13.
Temperature field distribution of infrared thermal imager at 13:30.
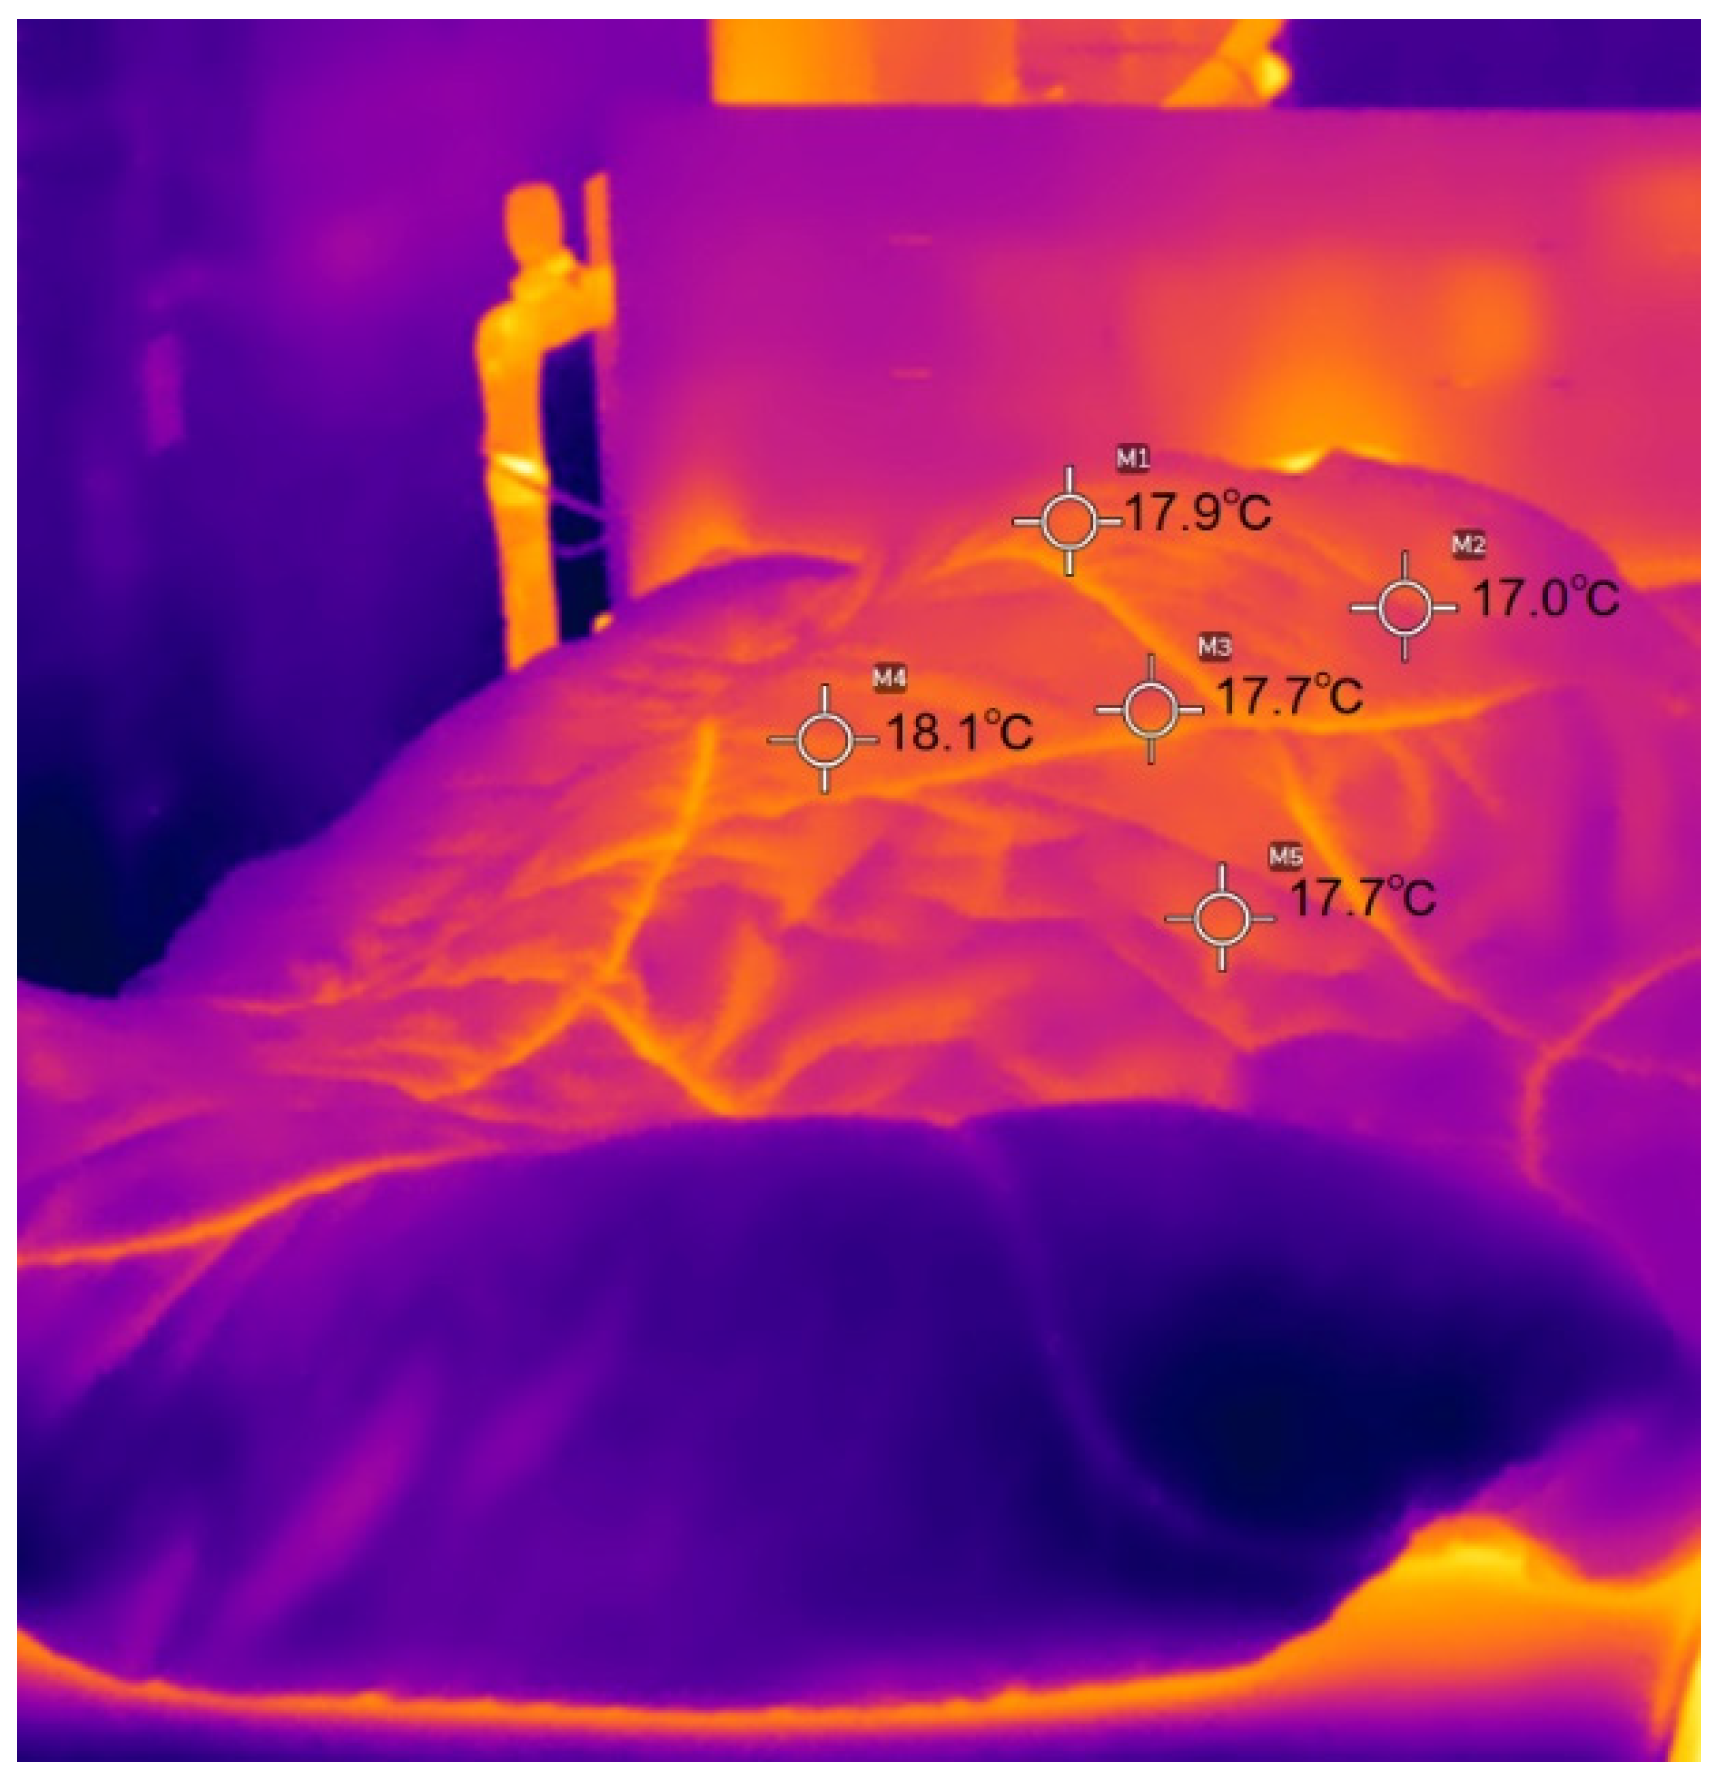
Figure 14.
Temperature field distribution of infrared thermal imager at 14:00.
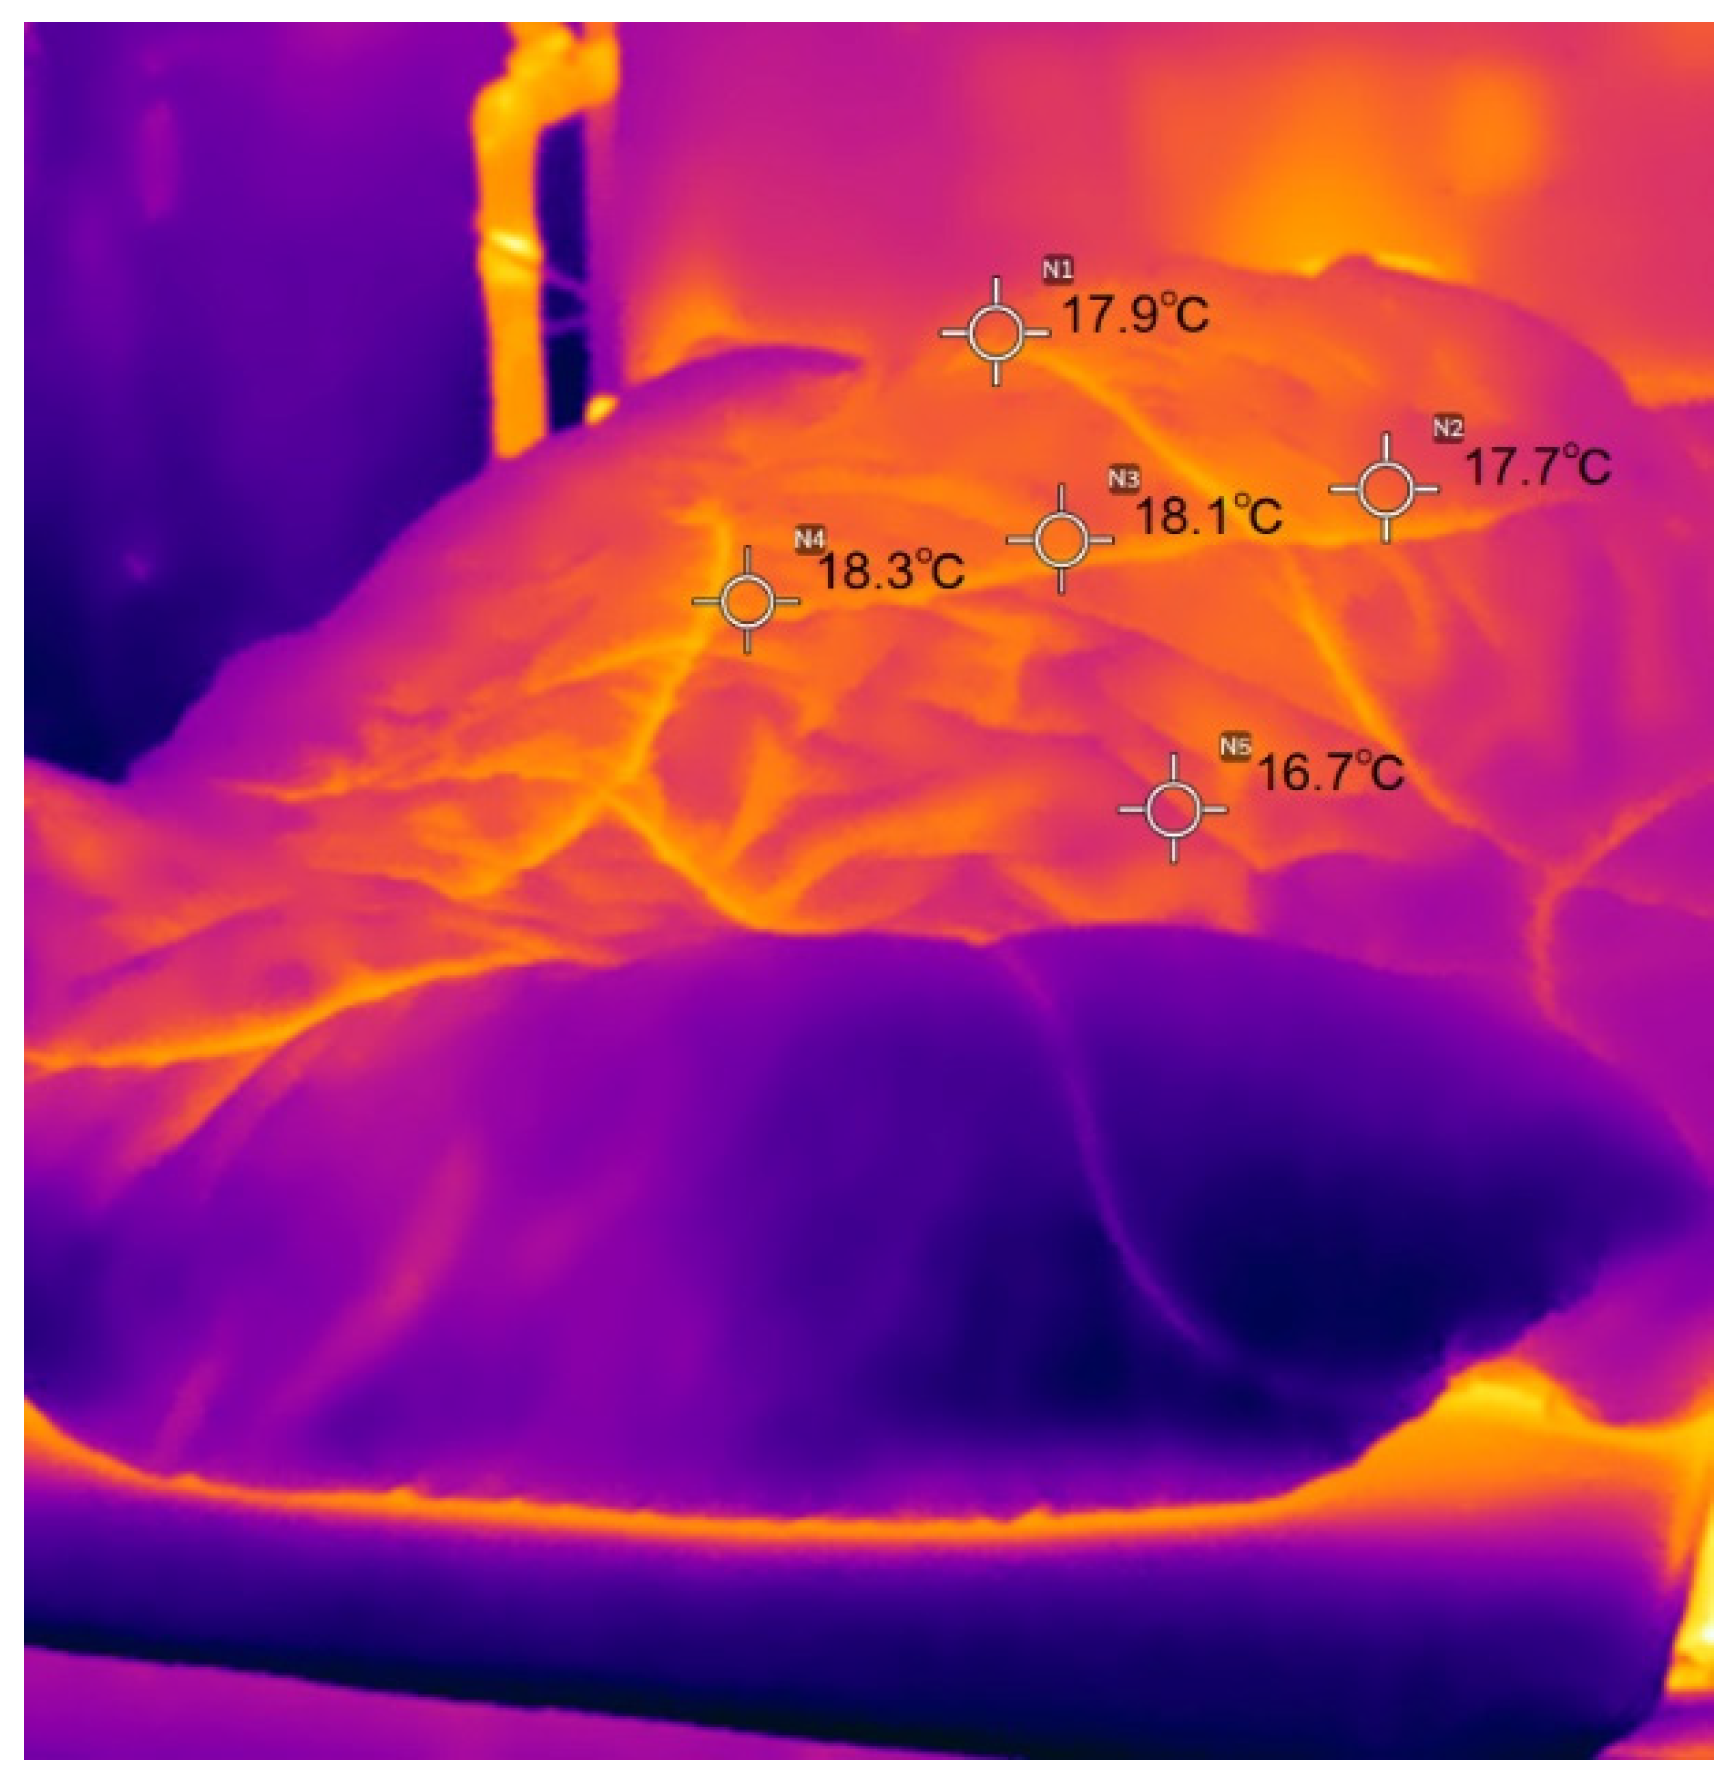
Figure 15.
Power variation curve of heat conduction heating with time.
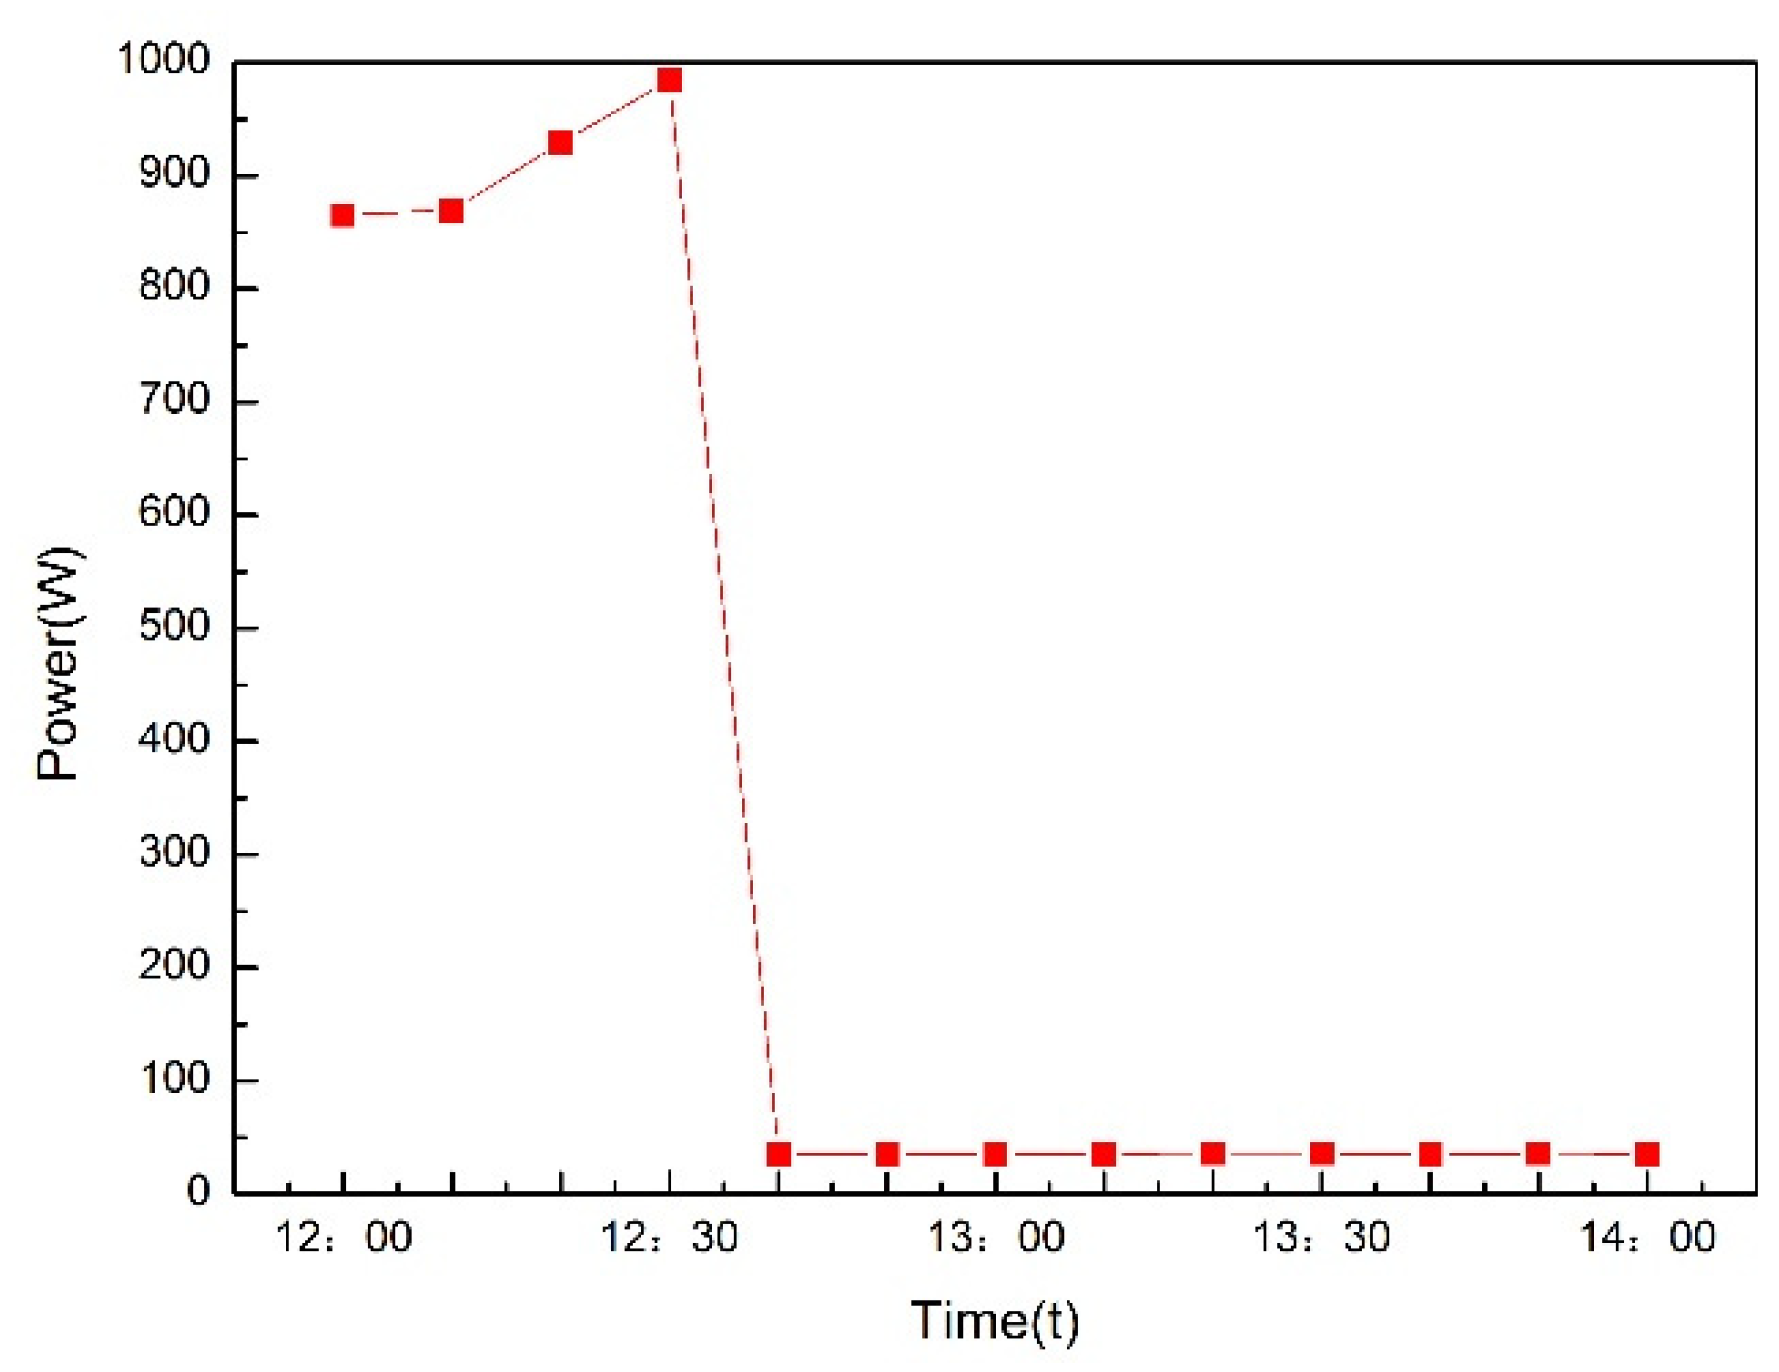
Figure 16.
Curve of heat dissipation with time during heat conduction heating.
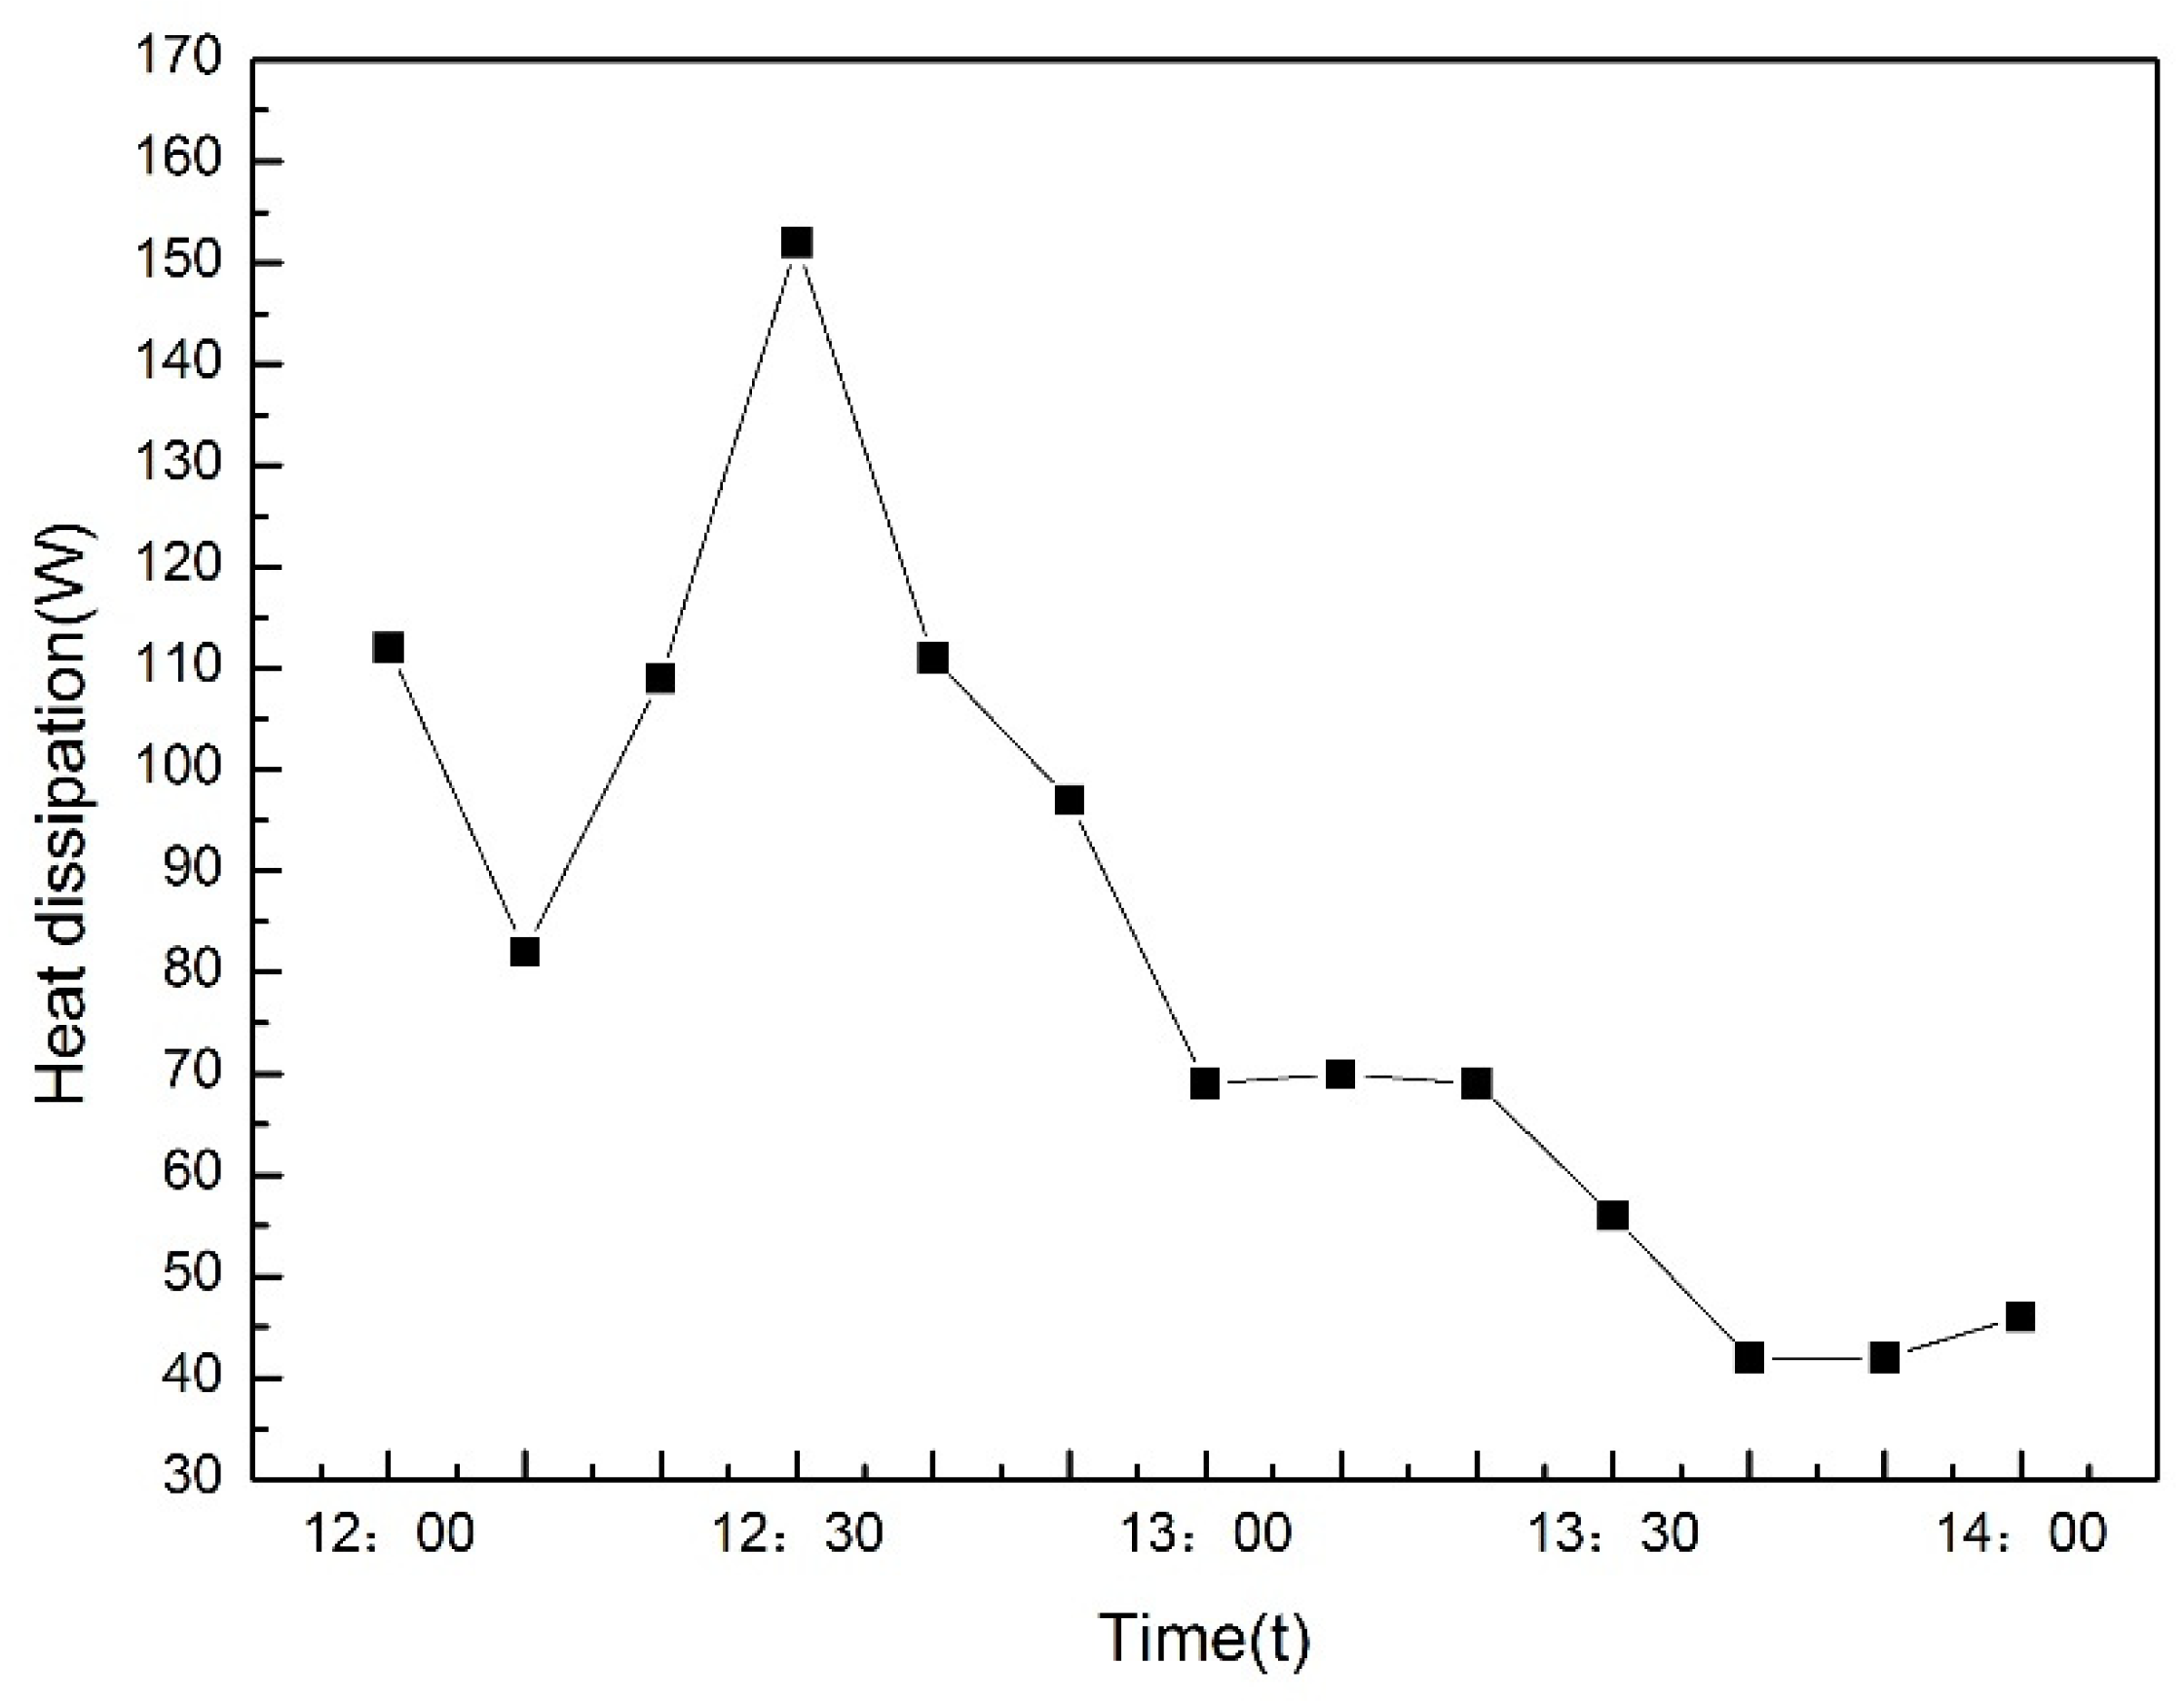
Figure 17.
Indoor and outdoor air temperature change graph.
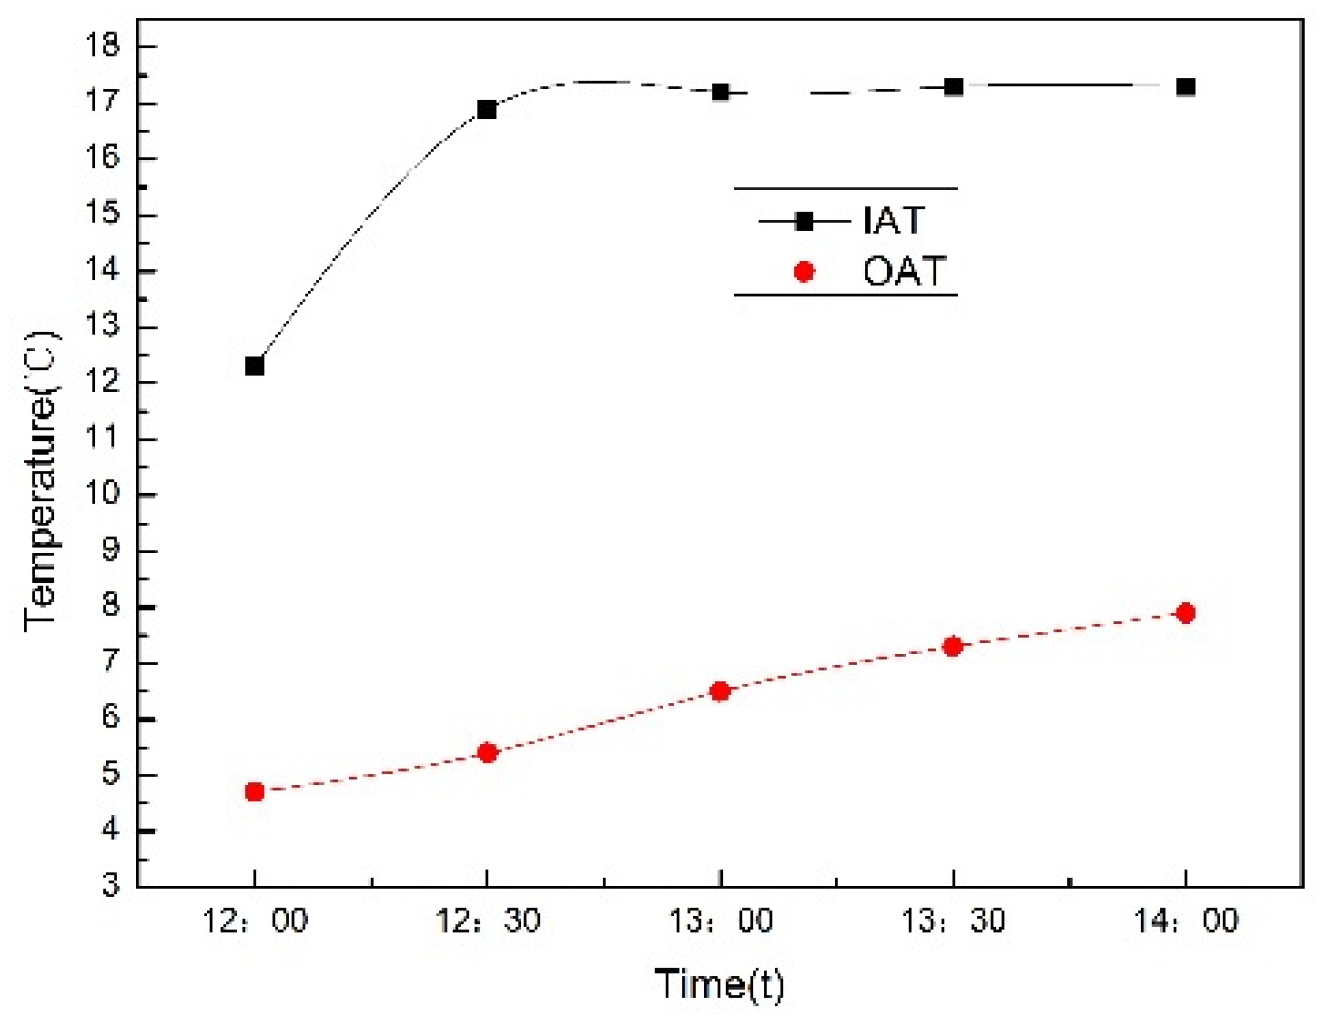
Figure 18.
Variation curve of indoor and outdoor air relative humidity.
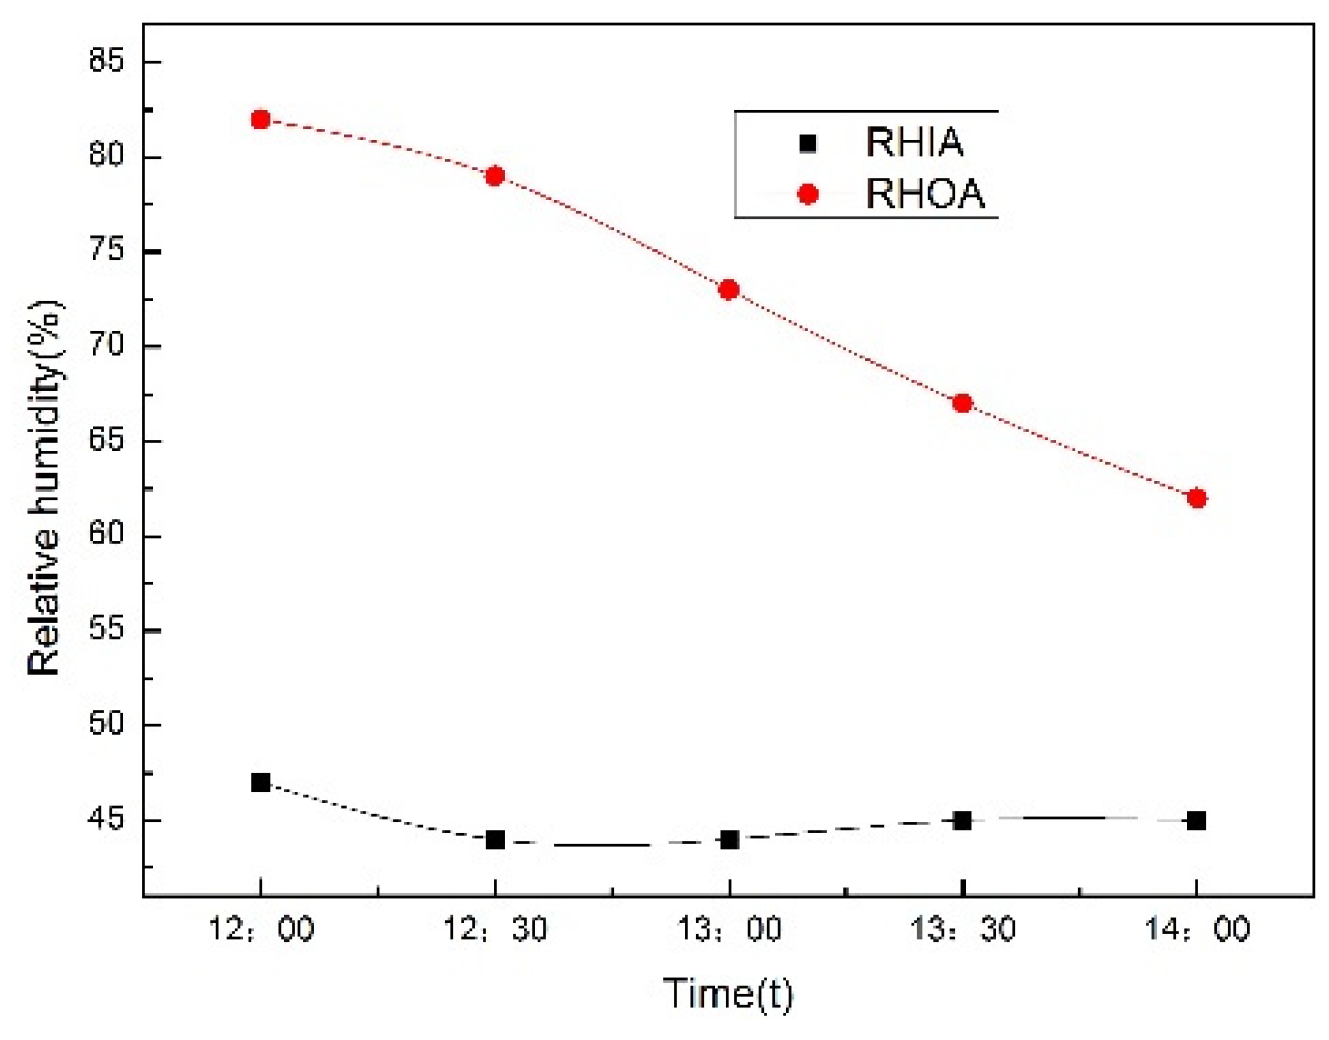
Figure 19.
Temperature variation curves at different measuring points during convective heating.
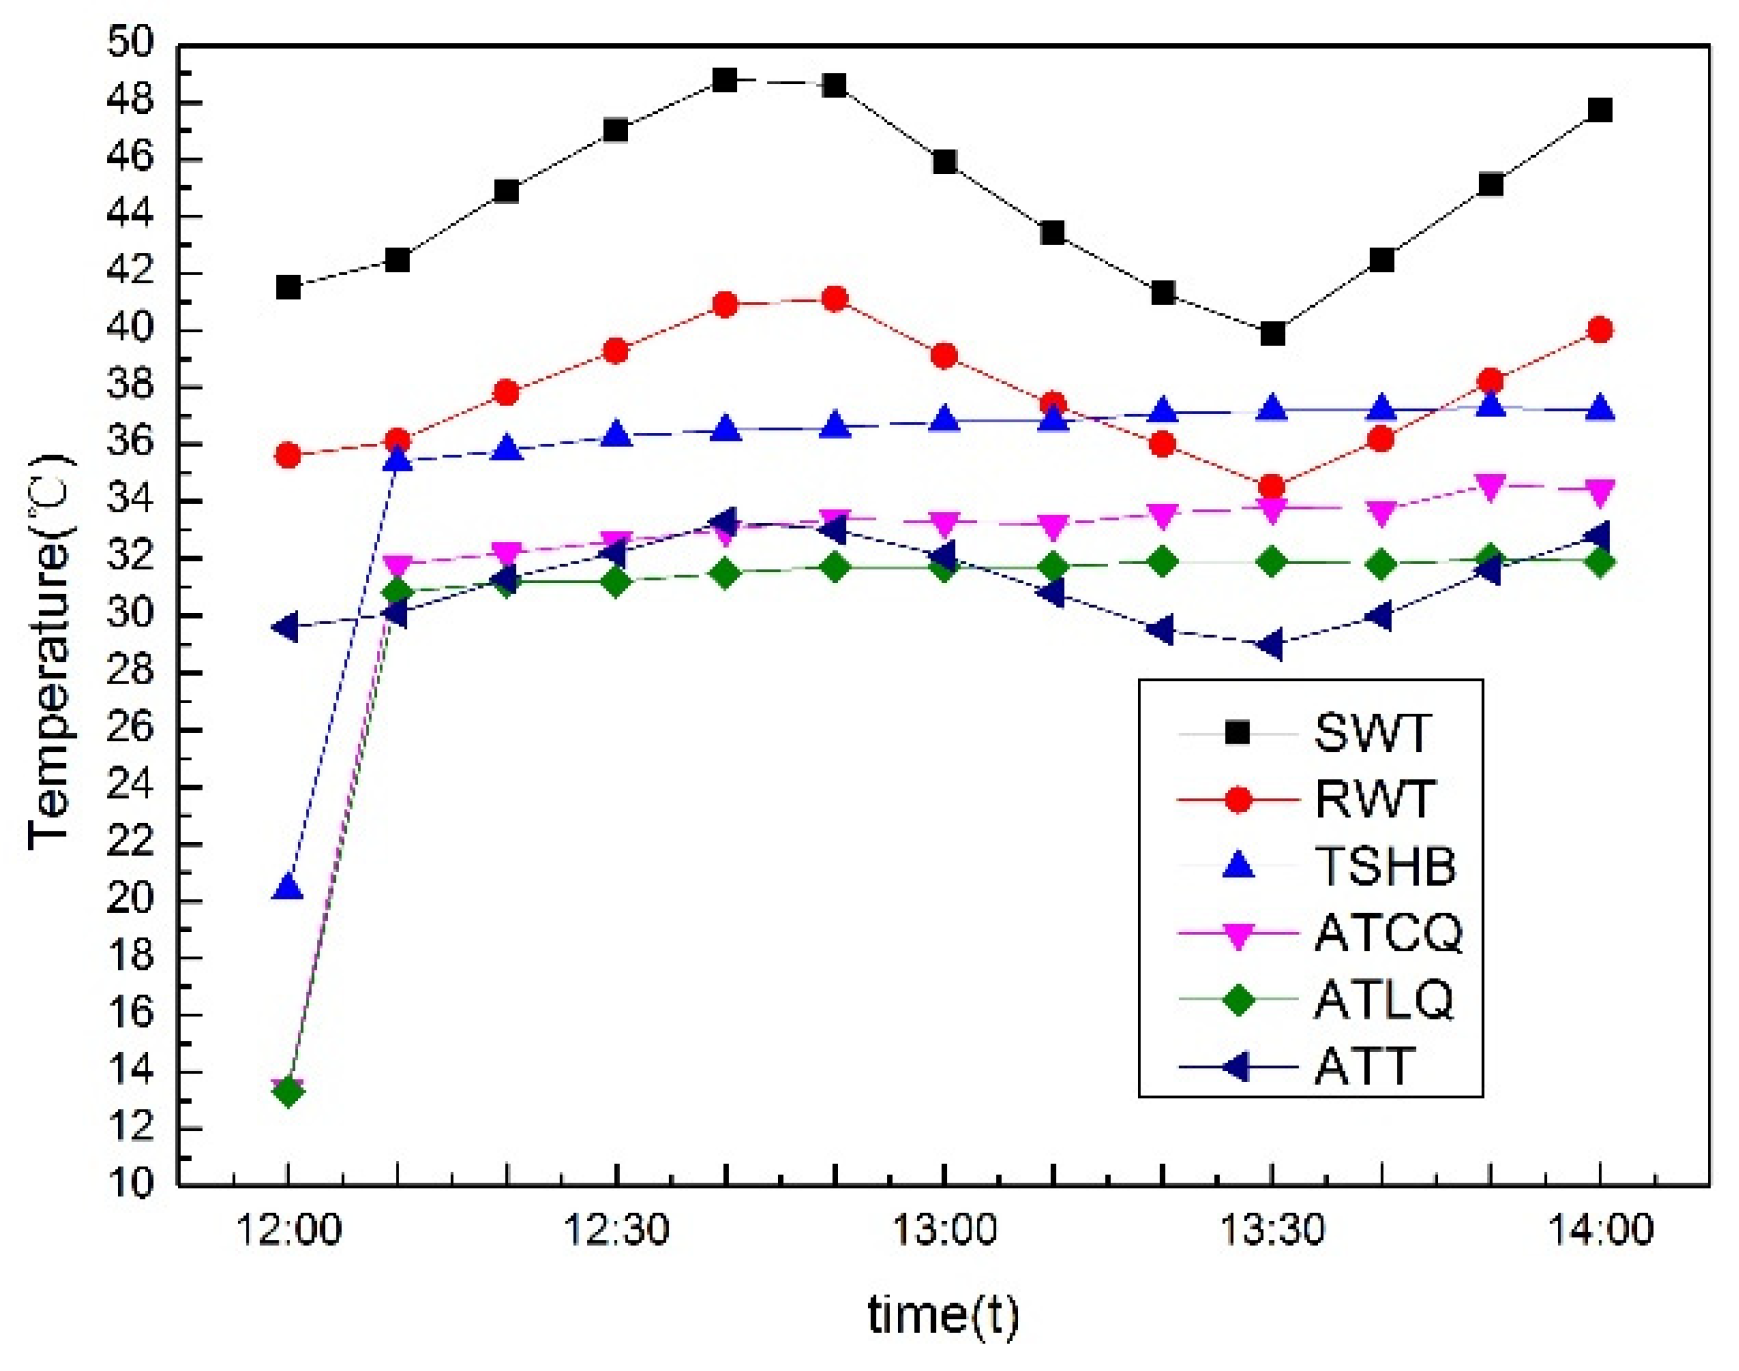
Figure 20.
Temperature field distribution of infrared thermal imager at 12:00.
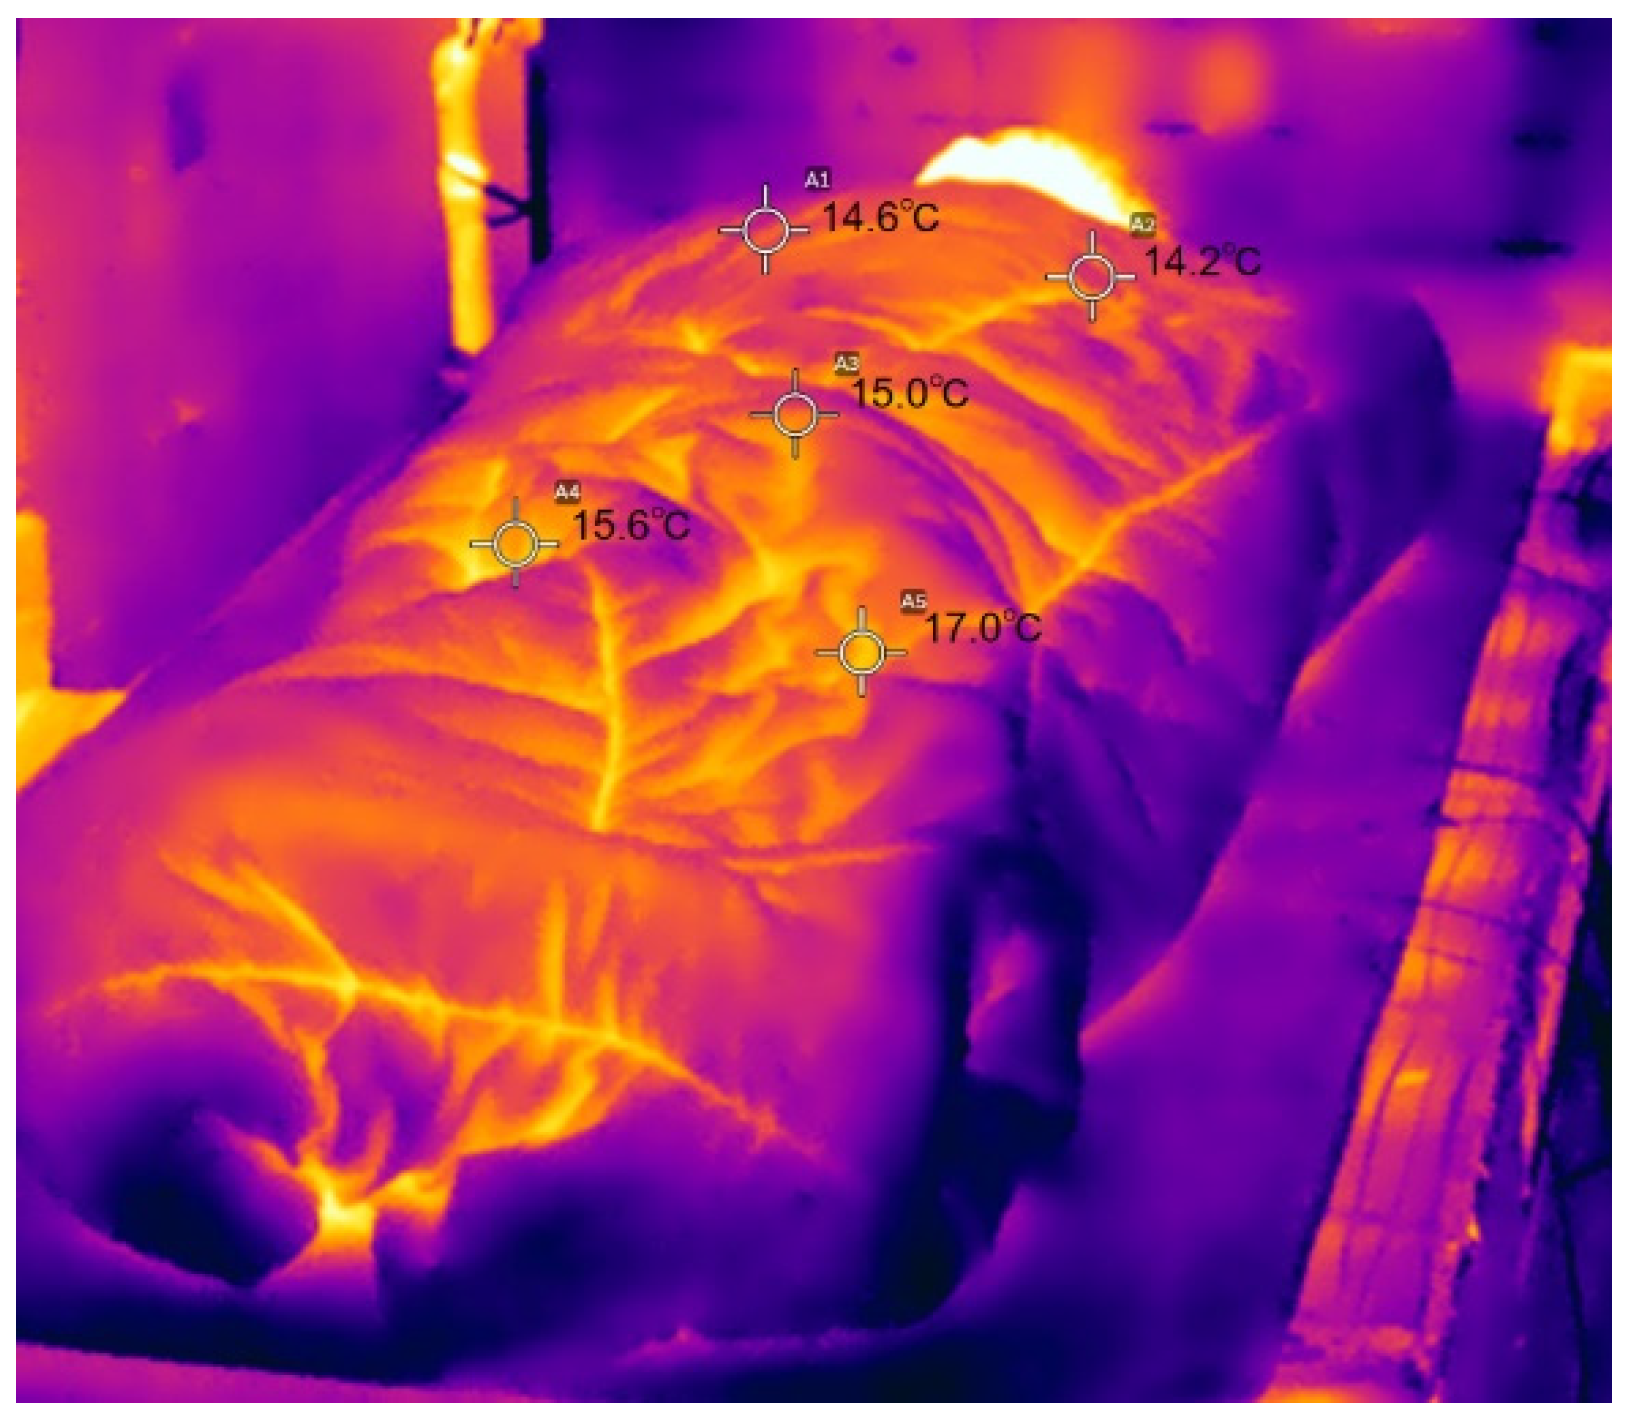
Figure 21.
Temperature field distribution of infrared thermal imager at 12:30.
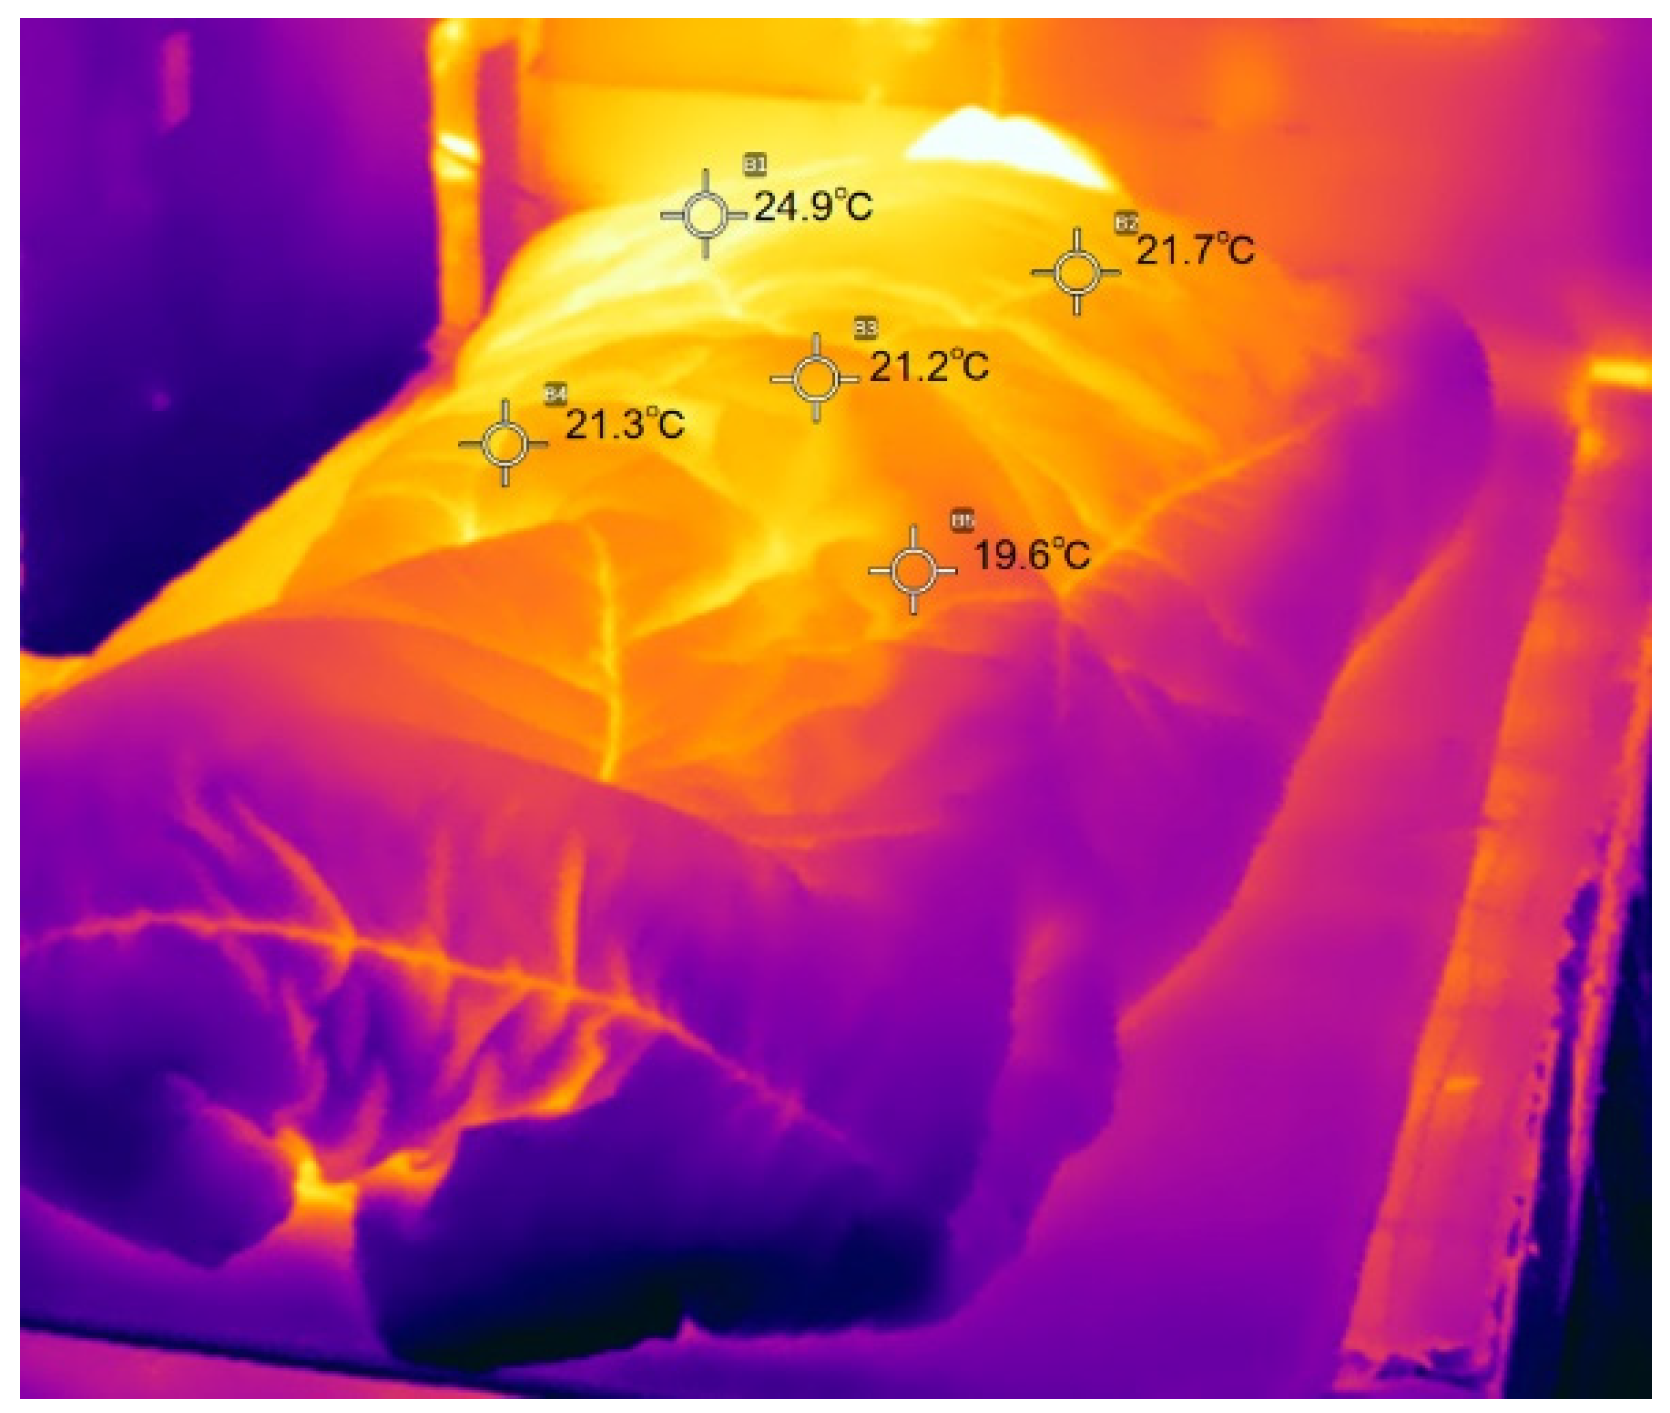
Figure 22.
Temperature field distribution of infrared thermal imager at 13:00.
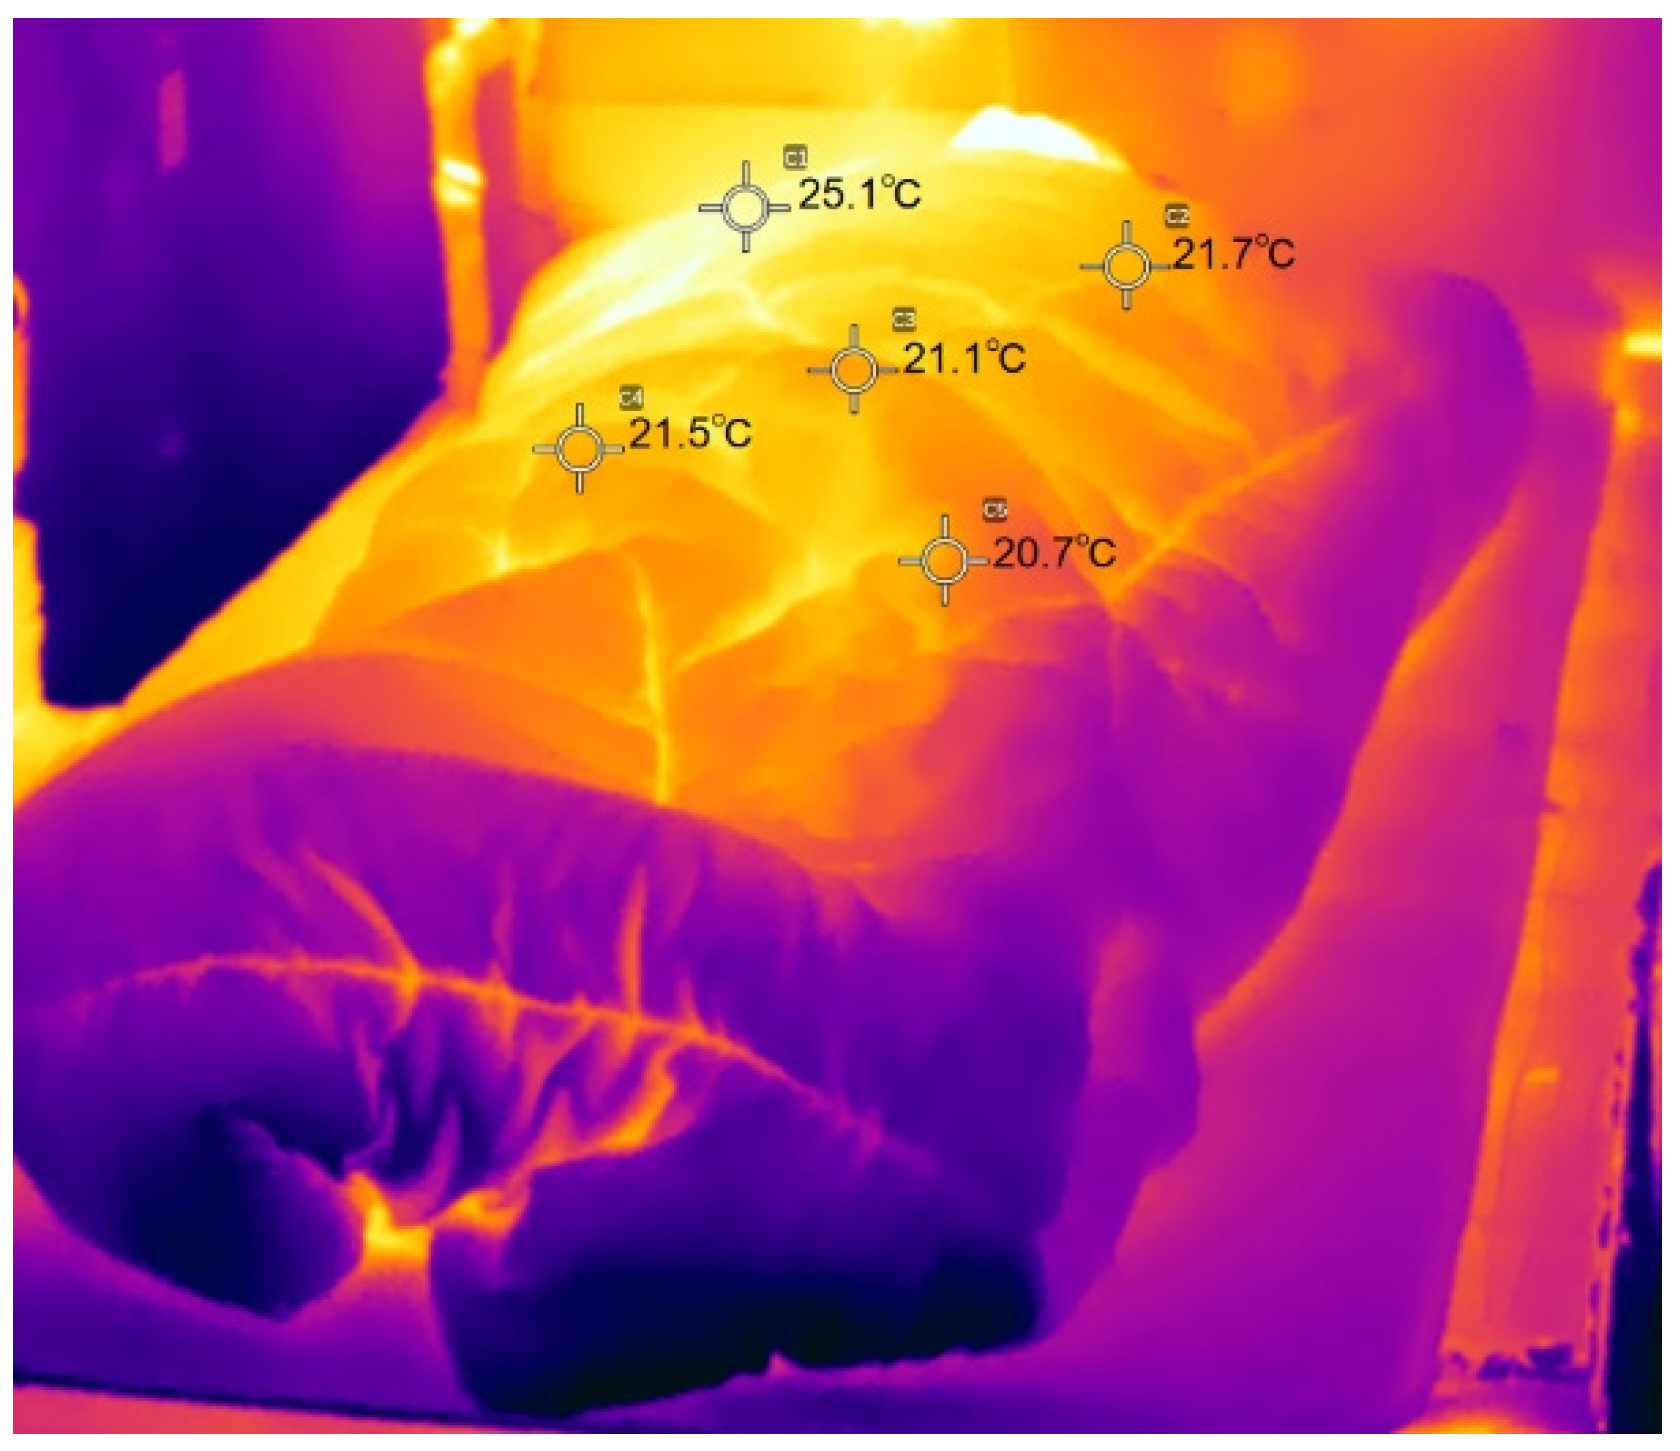
Figure 23.
Temperature field distribution of infrared thermal imager at 13:30.
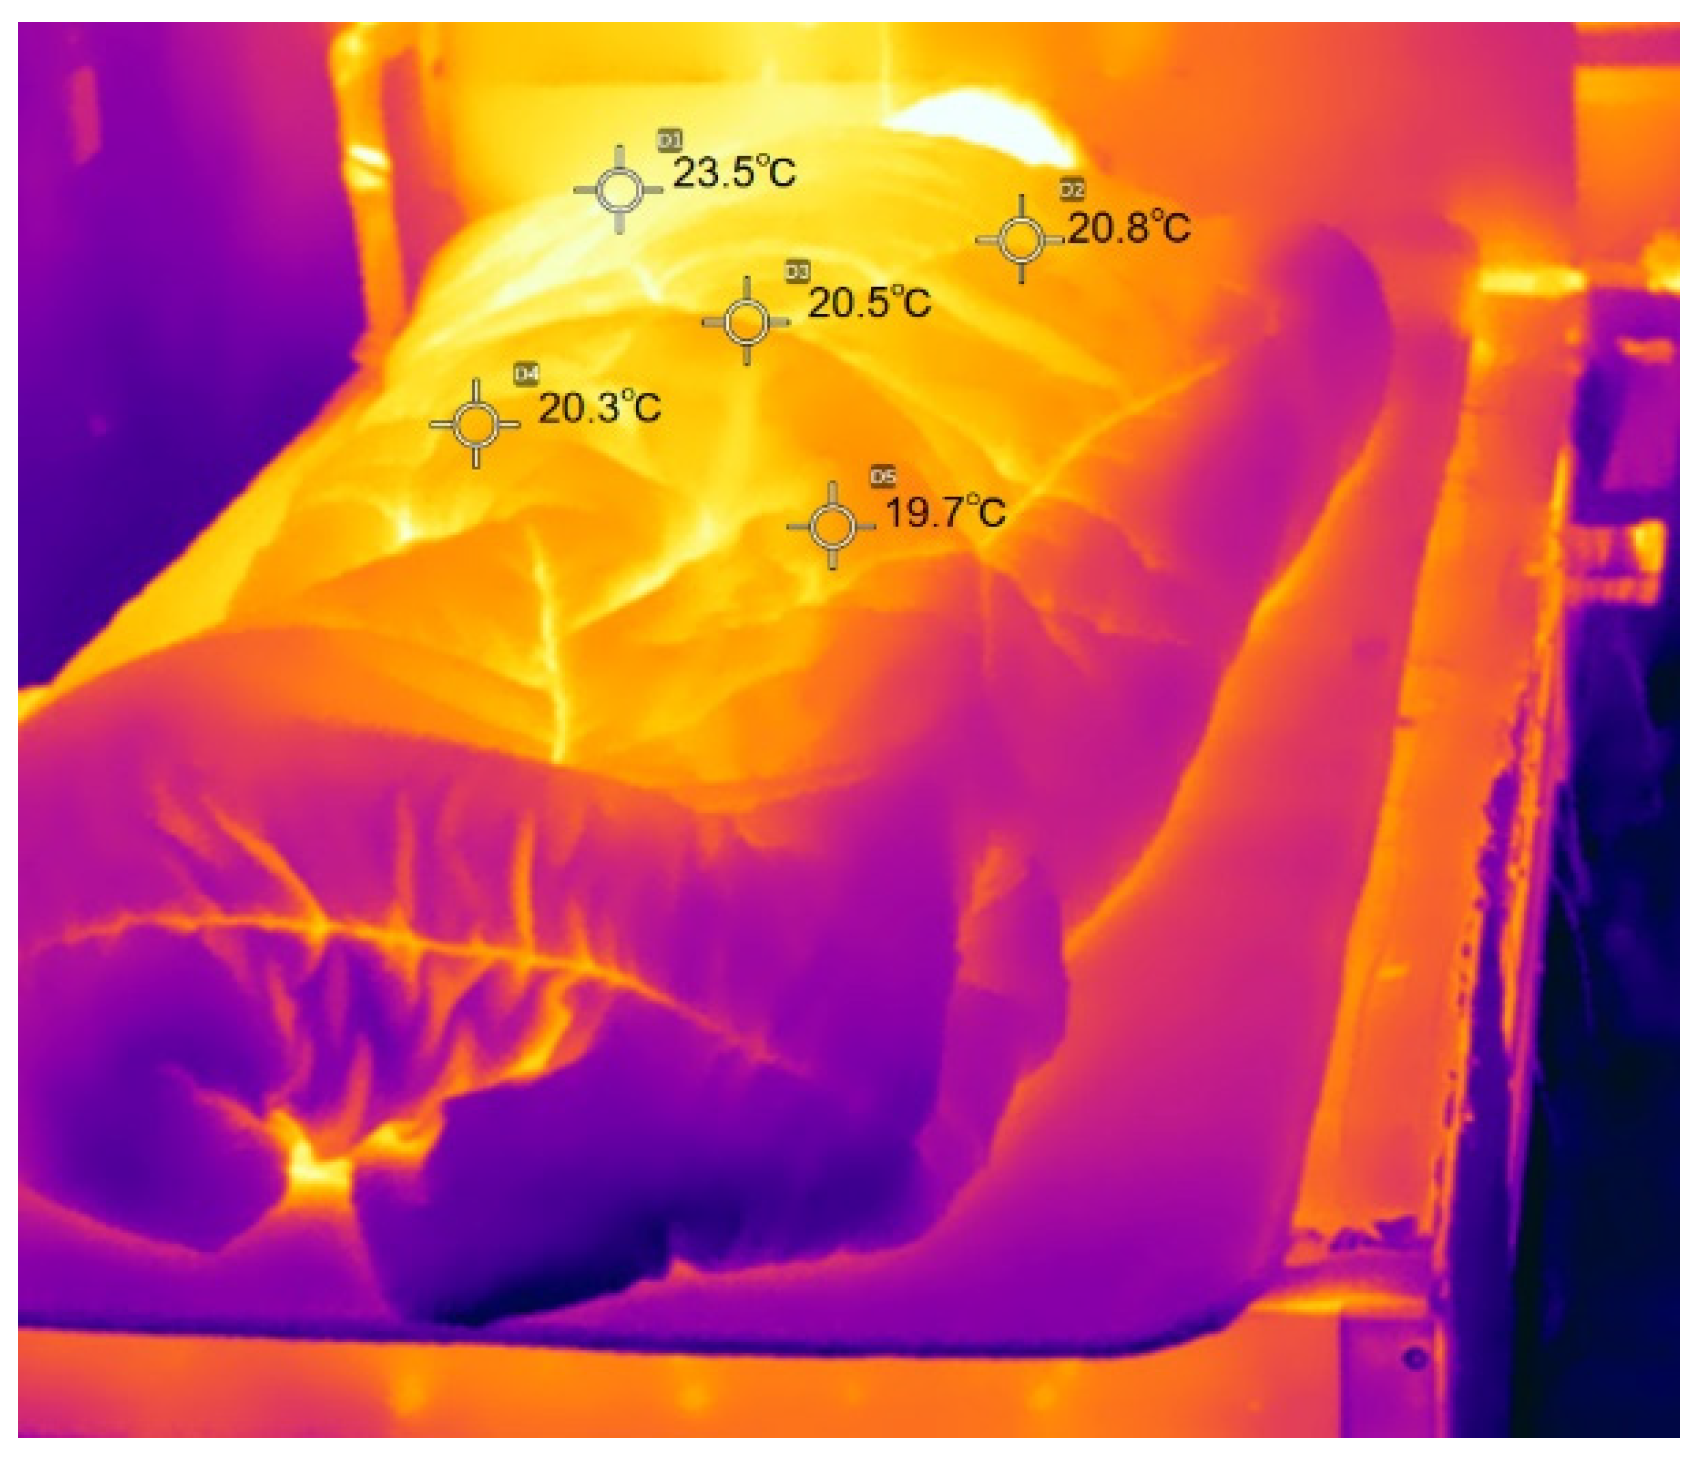
Figure 24.
Temperature field distribution of infrared thermal imager at 14:00.
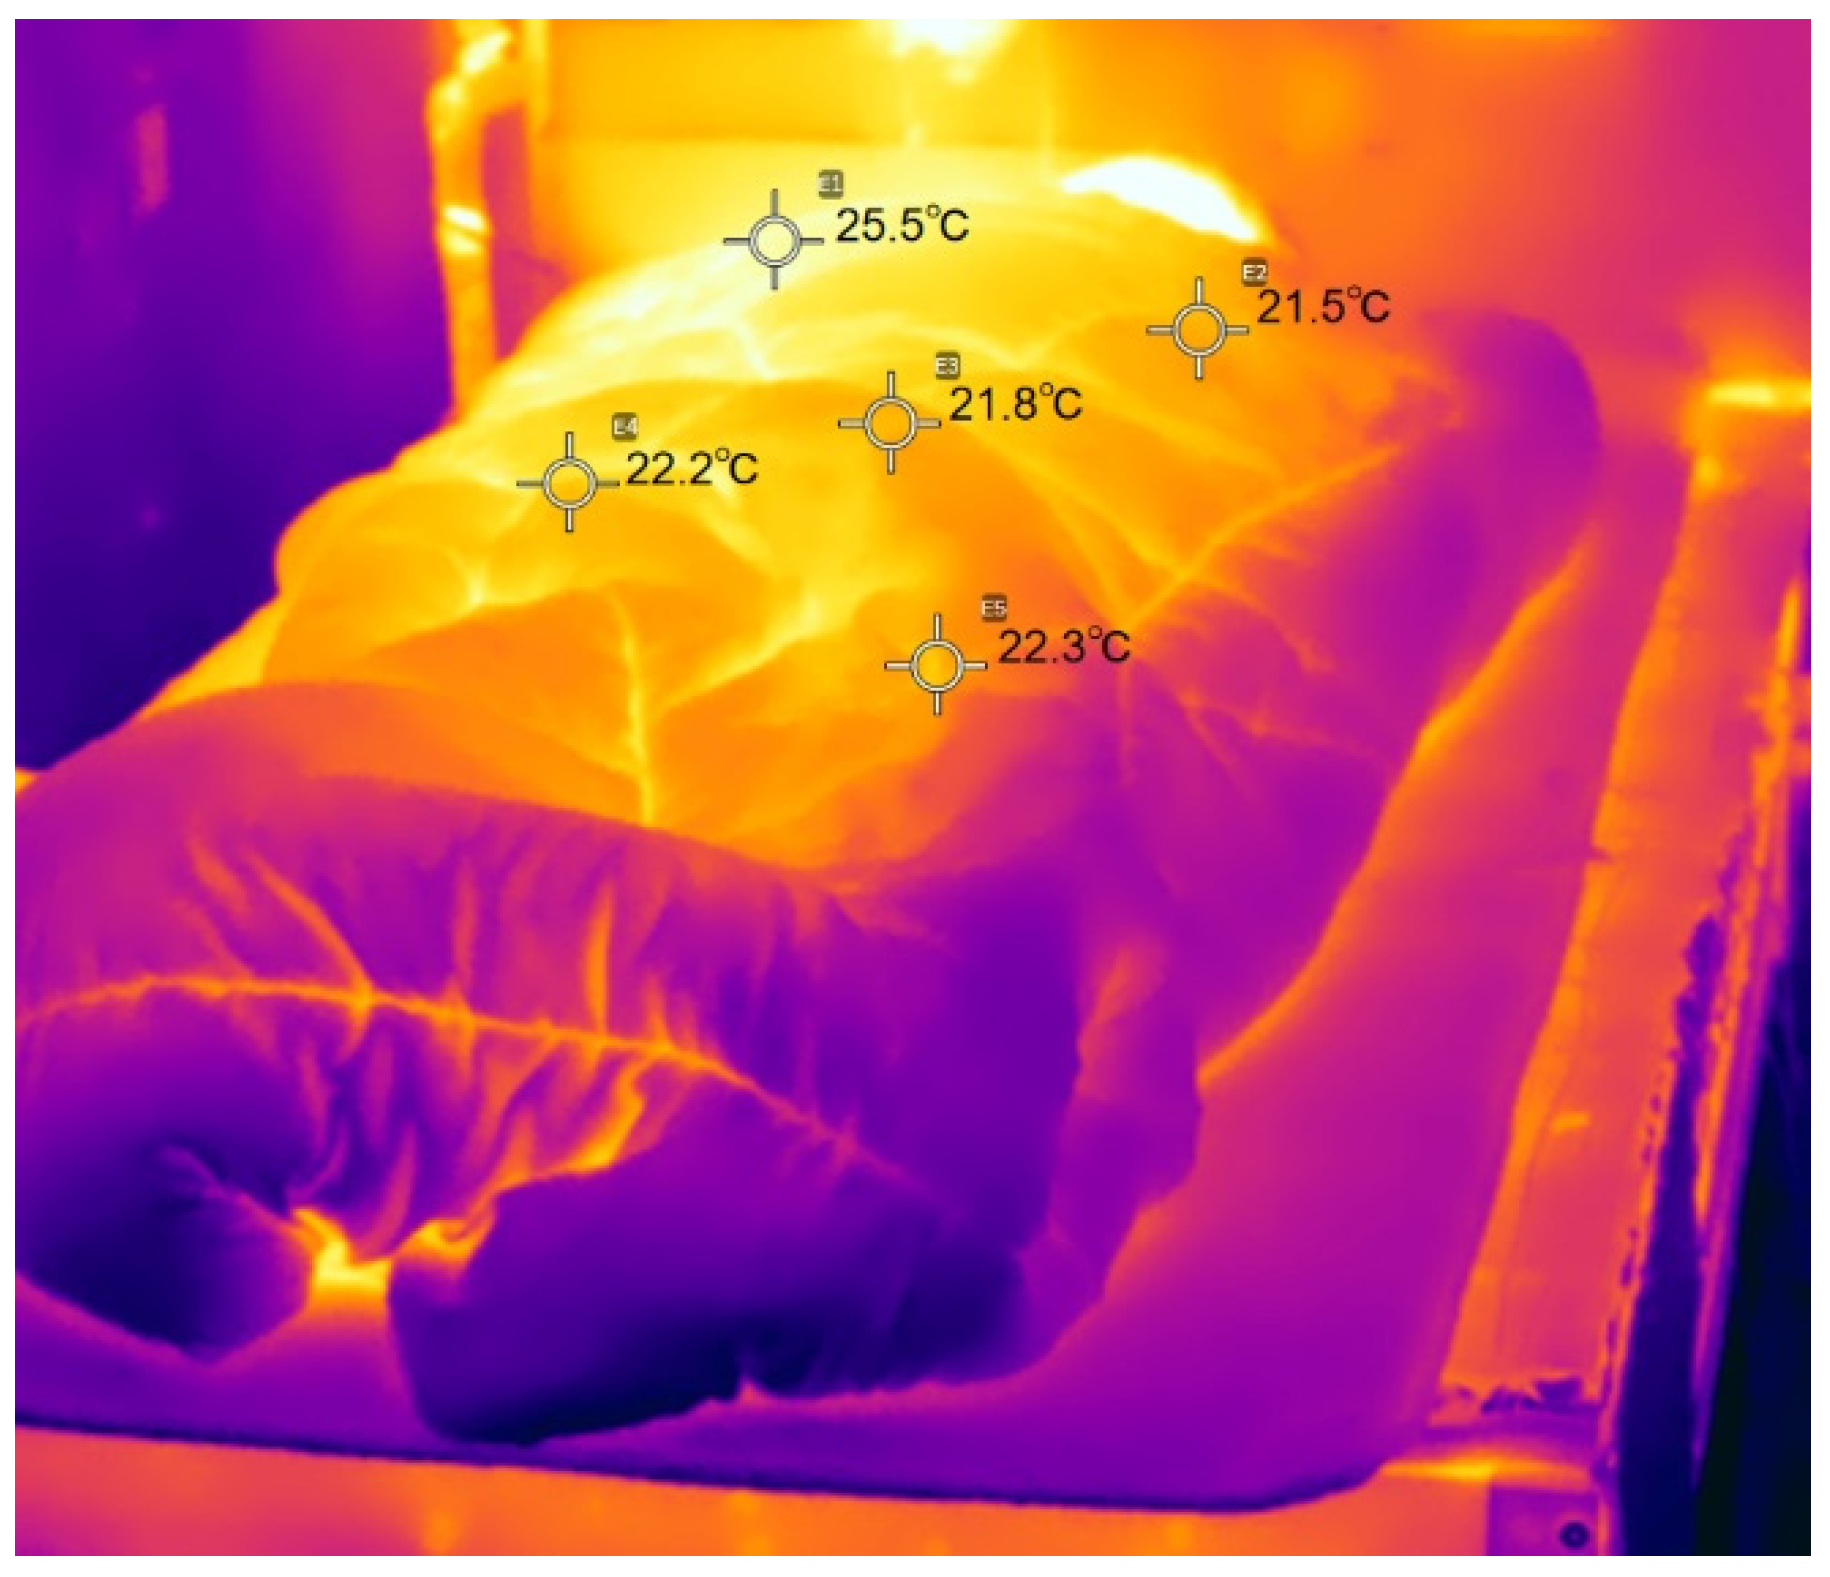
Figure 25.
Power variation curve of convection heating with time.
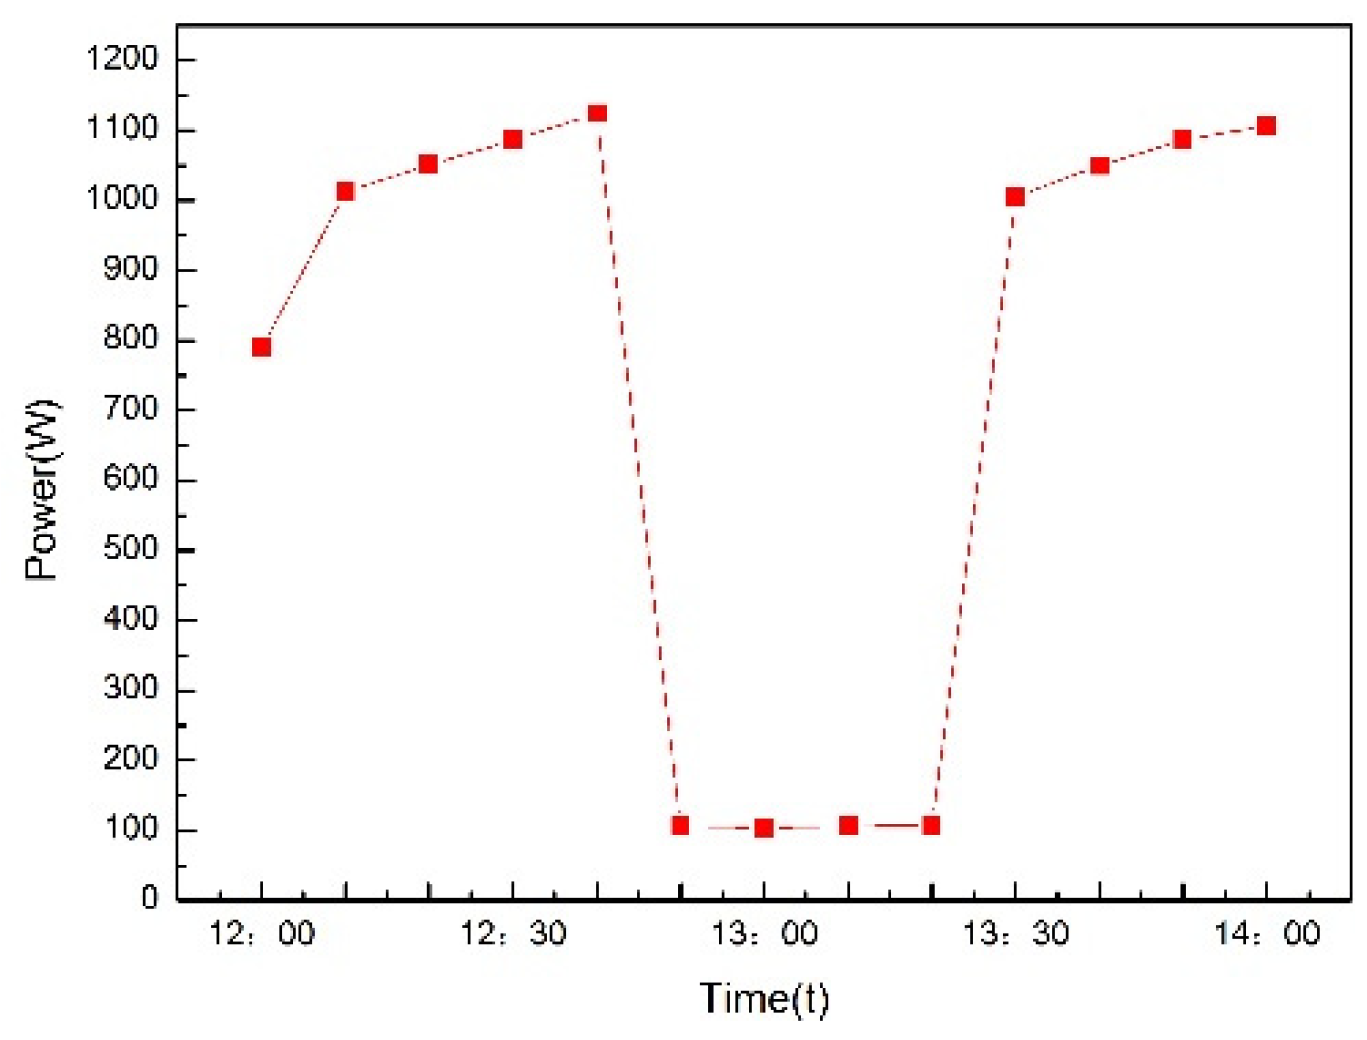
Figure 26.
Curve of heat dissipation with time during convection heating.
Disclaimer/Publisher’s Note: The statements, opinions and data contained in all publications are solely those of the individual author(s) and contributor(s) and not of MDPI and/or the editor(s). MDPI and/or the editor(s) disclaim responsibility for any injury to people or property resulting from any ideas, methods, instructions or products referred to in the content. |
© 2023 by the authors. Licensee MDPI, Basel, Switzerland. This article is an open access article distributed under the terms and conditions of the Creative Commons Attribution (CC BY) license (https://creativecommons.org/licenses/by/4.0/).
Copyright: This open access article is published under a Creative Commons CC BY 4.0 license, which permit the free download, distribution, and reuse, provided that the author and preprint are cited in any reuse.


