

Submitted:
03 July 2023
Posted:
05 July 2023
You are already at the latest version
Abstract
A large set of undrained compression triaxial tests was carried out on different types of cohesionless soils, from sands to silty-sands and silts. Shear wave velocity measurements were carried out alongside. These tests exhibited distinct state transitions ranging from flow liquefaction to strain softening or strain hardening. With the purpose of defining a framework to assess soil liquefaction, it was found that the ratio between the shear wave velocity (VS0) and the peak undrained deviatoric stress, qpeak, VS0/qpeak, could be accurately used to define a boundary between liquefaction and strain hardening for sands, and between strain softening and strain hardening for silty-sands and silts. Since this ratio is a function of the tested material, it was also discovered that the prediction of these boundaries could be made as a function of soil grading, namely via the coefficient of uniformity, CU. Despite not being regarded as a strong geomechanical parameter, CU is easily determined from a grain-size distribution test and it has an empirically proven correlation with critical state parameters.
Keywords:
liquefaction
; shear wave velocity
; peak undrained deviatoric stress
; soil grading
; coefficient of uniformity
Introduction
The assessment of soil liqu potential using laboratory techniques was initiated by Casagrande in 1936, who proposed the Critical Void Ratio line (CVR), (nowadays known as the Critical State Line, CSL), as a boundary separating liquefiable from non-liquefiable soils. Later, Been and Jefferies (1985) proposed, the state parameter, ψ, assuming the existence of a unique CSL. This parameter is usually correlated, for static liquefaction assessment purposes, with the brittleness index, IB, which measures the normalized degree of strain softening of a contractive soil, using the peak and minimum shear strengths, σ’d(peak) and σ’d(min), respectively (e.g. Uthayakumar and Vaid, 1998; Jefferies and Been, 2006; Sadrekarimi and Olsen, 2011). Despite being widely consistent, both parameters are dependent on the soil type. Moreover, the state parameter also requires the previous laboratory determination of the position of the CSL. Nevertheless, in order to provide a universal framework, Jefferies and Been (2006), after Hird and Hassona (1990), proposed the normalization of the state parameter, as a ratio between ψ and the slope of the CSL, λ (ψ/λ).
The use of shear wave velocities to assess cyclic liquefaction was initiated by Stokoe et al. (1988), and later adapted by Tokimatsu et al. (1991) through the correlation of the normalized small-strain shear wave-velocity with the cyclic resistance ratio, CRR.
In the case of static liquefaction, the combination of both strength and stiffness measurements, for example using the seismic cone penetrometer test (SCPTU), was found to effectively predict liquefaction response as it has a good correlation with the state parameter (Eslaamizaad and Robertson, 1997; Schnaid, 2005; Schnaid and Yu, 2007). This combination has also the advantage of distinguishing recent and/or aged or cemented deposits (Schneider and Moss, 2011). Its successful combination was already somewhat expected as both variables are controlled by confining stress, void ratio, stress history, soil structure and geological age (Hardin, 1978; Lo Presti et al., 2001; Viana da Fonseca et al. 2011a), being also correlated with critical state parameters, which governs soil liquefaction response.
Schnaid et al. (2013) used triaxial compression and extension tests with bender elements to develop a framework for the assessment of static liquefaction on gold tailings, showing that peak undrained deviatoric stress and shear wave velocities variables are correlated.
More recently, Riveros and Sadrekarimi (2021) used the normalized shear wave velocity to distinguish between liquefiable and non-liquefiable soils, proposing an empirical method to evaluate the onset of instability and the post-liquefaction strength of tailings using shear wave velocity. However, it is assumed that this relationship is still soil dependent, as demonstrated by Yang et al. (2022). Doygun et al. (2019) shows that shear wave velocity in granular soils is significantly affected by uniformity coefficient and fines content, which affect liquefaction potential (Zhao et al., 2023).
Santamarina and Cho (2004) and Cho et al. (2006) demonstrated that particle size and shape can be correlated to different critical state parameters as the macro scale behaviour of the soil results from particle level interaction.
This study aims to evaluate the applicability of the correlations between peak undrained deviatoric stress and shear wave velocity to assess the static liquefaction potential in different soils. The aim is to discuss its range of application and limitations depending of particle size, based on experimental evidence.
Soil properties
During this research, five materials were studied: 1) Osorio sand, a uniformly-graded sand from Brazil, well documented in past researches (e.g. Consoli et al., 2007; Consoli et al., 2009); 2) a silt, artificially produced from grinding Osorio sand; 3) a silty-sand (designated as mixture), artificially produced by mixing soils 1 and 2; 4) Algeria sand and 5) Coimbra sand, two uniformly-graded sands, also well documented in the literature (e.g. Santos et al., 2012; Viana da Fonseca et al., 2011b; Viana da Fonseca and Soares, 2012; Viana da Fonseca and Soares, 2014).
The results obtained on these materials will be presented and compared with the study previously published by Schnaid et al. (2013) on gold tailings.
Table 1 summarizes the main gradation characteristics of these materials, including the fines content (FC), the coefficients of uniformity and shape CU and CC, and the specific gravity. The maximum and minimum void ratios are also presented for the three sands, but not for the finer materials as the standards of these tests (for instance, ASTM D4254-16) are not applicable to soils with high fines content.
Gold tailings
The particle size distribution of the gold tailings (Figure 1), determined at the Geotechnical Laboratory of FEUP (LabGeo), reveals a well-graded soil classified as a silt with sand according to the Unified Soil Classification System (ASTM D2487, 1993). The specific gravity, Gs, also determined at LabGeo, is of 2.94. The grains are generally sub-angular and angular with uneven edges, as shown in Figure 2.
Osorio sand
Osorio sand is a siliceous fine sand from the region of Osorio near Porto Alegre in southern Brazil, with a specific gravity of 2.65 (Consoli et al. 2007). This soil is classified as non-plastic uniform fine sand according to the Unified Soil Classification System (ASTM D2487, 1993).
Grain size distribution results are provided in Figure 3a (dashed line) and evidence a material with a minimum amount of fines (<4%). The coefficients of uniformity and curvature, respectively, of CU = 1.9 and CC = 1.0, characterize this as a uniformly-graded sand (Figure 3a, dashed line). Microscopic analysis of particle shape enabled to identify generally rounded to sub-rounded grains, with a few sub-angular grains, as previously reported by other authors (e.g. Consoli et al. 2007) (see Figure 3b).
Silt
The silt is obtained from grinding Osorio sand, being a siliceous silt with a minor amount of sand (99.85% silt; <1% sand), as shown in Figure 3a (solid line). The coefficients of uniformity and curvature of this soil are CU = 9.6 and CC = 1.47, respectively, revealing a well-graded silt.
Mixture
The mixture of the two previous materials results in a silty sand (60% sand; 40% silt), which has also been independently studied. This material was produced with the purpose of obtaining a material with an intermediate particle size distribution between Osorio sand and silt. Its specific gravity is necessarily identical to that of the original sand and silt, of 2.65. The coefficients of uniformity and curvature, CU = 32.4 and CC = 2.6, indicate a well-graded silty sand according to the Unified Soil Classification System (ASTM D2487, 1993). From the observation of microscopic photographs, the grains are classified as generally sub-angular to angular with uneven edges, created by the grinding process (see Figure 3b).
Algeria sand
Algeria sand is a siliceous medium sand, with coefficients of uniformity and curvature of 1.76 and 0.97, revealing a poorly graded sand according to the Unified Soil Classification System (ASTM D2487, 1993) (Figure 4). Algeria sand is predominantly quartz sand with a minimal amount of feldspars. As shown in Figure 5, the grains are generally relatively spherical.
Coimbra sand
Coimbra sand is a predominantly siliceous sand, artificially prepared from a quarry. The coefficients of uniformity and shape are respectively CU = 2.13 and CC= 1.37, consistent with a poorly graded sand classification according to the Unified Soil Classification System (ASTM D2487, 1993) (Figure 6). The minimum and maximum void ratios were measured and correspond to emin = 0.48 and emax = 0.81, and the grains are generally angular to sub-angular (see Figure 7).
Specimen preparation and testing conditions
The specimens were tested at different void ratios, but usually reconstituted to very loose conditions, and a wide range of confining pressures, aiming to evaluate their influence on liquefaction susceptibility. The reconstituted specimens were prepared by moist tamping with a water content of 5% for all uniformly-graded sands (Osorio, Algeria and Coimbra sand), 11.5% for the silt and Gold tailings (Bedin, 2010) and 8.75% for the mixture (an intermediate value between 11.5% and 5%). These values were obtained by testing different tamping moisture contents, with the purpose of achieving a high void ratio. The moist tamping procedure was selected since Viana da Fonseca and Soares (2014) showed that inherent anisotropy created by specimen preparation technique (with moist tamping or funnel dry pluviation), did not significantly interfere with the liquefaction susceptibility of Coimbra sand.
It is also an effective, easy and relatively quick reconstitution technique, which does not segregate soil particles (as opposed to the dry funnel pluviation technique), allowing the operator to control the final density much more readily (adapted from Viana da Fonseca et al., 2021). The moist tamping reconstitution technique, used in the scope of this research, is described in detail in Viana da Fonseca et al. (2011b) and Soares and Viana da Fonseca (2016).
A large set of strain and stress-controlled triaxial tests were performed to study the static liquefaction potential of these soils. 38 undrained isotropically consolidated triaxial compression tests (CIU) are presented and discussed along this paper, together with 12 CIU triaxial tests published by Schnaid et al. (2013), whose details are presented in Table 2, Table 3, Table 4, Table 5, Table 6 and Table 7. Each triaxial test was carried out following the typical stages: percolation, saturation, consolidation, and shear. In the initial stage, the specimens were percolated with de-aired water in a volume no less than twice the initial voids volume, and saturated by back-pressuring at constant effective stresses, prior to consolidation and shearing stages. A minimum Skempton’s B parameter of 0.97 was ensured prior to the consolidation stage for most specimens. The specimen saturation was often verified by P-wave velocity around 1500m/s, measured by bender-extender elements.
Volumetric strains were systematically evaluated and recorded using internal/local transducers (inductive hall-effect calipers) to measure axial and radial deformation until the end of the saturation phase, and complementarily monitored by a volume change gauge during the consolidation and shear stage. In addition, 34 of the tests presented in this paper were carried out on triaxial apparatuses equipped with bender-extender elements (for S and P-wave velocity measurements) at the pedestal and cap (see Figure 8). When excited, the transmitting bender element vibrates in a direction perpendicular to the length of the element producing a shear wave, which is registered in the other bender, located at the other end of the specimen. The shear-wave velocity, Vs0, is then calculated from the ratio between the tip-to-tip distance and the travel time, based on the first wave arrival method (described in Viana da Fonseca et al., 2009), whereby:
where t the wave propagation time and d the travelling distance (measured from tip-to-tip).
However, four of the triaxial tests performed on the silt were not carried out with bender elements to enable freezing at the end of the test, aiming at validating and, if necessary, correcting CSL positioning. The freezing technique, initially proposed by Sladen and Handford (1987), was adopted in this study, in order to correct systematic errors found on void ratio measurements obtained from internal/local transducers, particularly on the silt specimens.
The shearing stage was applied under both strain-control or stress-control, on ‘Bishop-Wesley’ stress-path cells, shown in Figure 8, and classical triaxial cells, respectively, up to at least 20% axial strain, until the critical state or ‘true’ liquefaction was reached. The undrained tests were typically sheared with a strain rate of 0.05 mm/min while the ones carried out on the “Bishop-Wesley” cells required an initial stress-rate, specifically determined to enable shearing during less than one day. Despite the occurrence of bulging or excessive deformation, thus creating a complex distribution of stresses and strains inside the sample, the steady state was often reached for strains lower than 20% due to its ‘natural’ proximity to the critical state line. It should be noted that the steady state line was classically defined at constant pore water pressure and constant shear stress conditions with increasing shear strain. On the other hand, liquefaction onset occurred at a very low shear strain and therefore no bulging or excessive deformation affected the phenomenon.
Membrane penetration tends to underestimate the pore pressure for loose specimens (e > ec), and to overestimate the pore pressure of dense specimens (e < ec). According to Nicholson et al. (1993) this effect should be corrected only if the D20 of the soil is higher than twice the membrane thickness. As none of the tested soils have a D20 higher than 0.8 mm, this effect was considered negligible and therefore not taken into account.
Membrane rigidity may have a restraining effect, mainly for low confining pressures and when barreling occurs, over-predicting soil strength. Both deviator and mean effective stresses were corrected for the membrane effect, according to the European standard (CEN, 2004).
Liquefaction assessment based on stiffness/strength parameters
Definition of the critical state lines
Following numerous studies published on soil liquefaction assessment (e.g. Jefferies and Been, 2006; Uthayakumar and Vaid, 1998; Sadrekarimi and Olsen, 2011; Bedin et al. 2012), it was recognized that the state parameter, , has a significant influence on liquefaction instability. For that purpose, this study initiated with the determination of the Steady State Line (SSL) for all the distinct soils (SSL is defined as the ultimate state achieved under undrained conditions, whilst CSL is defined as the ultimate state achieved under drained conditions). However, it was perceived that the state parameter per se could not be used to determine accurately the limit beyond which soils exhibit a stable behavior, if it based in a linear CSL obtained from drained tests at low confining stresses or undrained tests at medium stresses. Figure 9 shows a sketch of the distinct ultimate state conditions.
Results obtained from both drained and undrained triaxial tests performed with the Silt, Mixture and Osorio sand are shown in Figure 10, Figure 11 and Figure 12, respectively. Each Figure presents 4 different plots, including the stress-strain curves, the q-p´ and the e-log p´ paths followed by each triaxial test, as well as the identification of the SSL and CSL. For simplicity, only the plots associated to these soils are included. Any further reference to Algeria and Coimbra sands can be found in Soares (2014). Similarly, further details concerning the other triaxial tests, namely non-CIU, are provided in Soares (2014). The tables presented in this paper refer only to CIU triaxial tests.
From these results, it is observed that Osorio sand, which has rounded particles, has lower critical state friction angle (related with M, the stress ratio q/p’ at critical state) than the silt or the mixture which show more angular particles due to the griding of Osorio sand. This is expected as particles angularity improves the particles interlocking.
Definition of the instability line
The loci on the p´-q-e space of the onset of liquefaction (identified by the peak undrained deviatoric stress) define the Instability Line (“IL”), as suggested by Lade (2002). Figure 13 shows the IL for all soils under study. It is interesting to note the strong correlation coefficient (R2) obtained, despite involving different types of soils, with different M values.
According to some published works (namely Lade and Yamamuro, 1993, Lade and Yamamuro, 1997 and Yamamuro and Lade, 1998), the IL was shown to be dependent on the initial confining stress, and on the initial void ratio (e.g. Chu et al., 2012). However, this effect might be a result of the relative positioning of the initial state of the soil on the p´-q-e space, with reference to the IL. Such fact could explain the strong correlation observed between the ILs obtained for the six different soils presented in Figure 13.
Liquefaction assessment
Whilst the state parameter has the limitations previously mentioned, both stiffness (expressed by the shear wave velocity, Vs0) and the peak undrained deviatoric stress (qpeak=σV-σH), are controlled (although differently) by the void ratio, mean stress state, contractiveness and soil structure. For this reason, these parameters were found to be particularly useful for predicting soil behaviour (Schnaid et al. 2013).
The peak deviatoric stress occurs before the onset of complete, qult=0kPa or partial instability, qult>0kPa. It should be noted that ‘complete’ or ‘true’ liquefaction is achieved when a null mean effective stress is reached whilst ‘partial instability’ is typically achieved by specimens which exhibit strain hardening and/or strain softening after reaching the phase transformation line and therefore always exhibit an ultimate deviatoric stress. A sketch between these distinct behaviors is shown in Figure 9.
VS0 is the shear wave velocity, measured after consolidation and prior to shearing. The respective normalized parameters q1 and VS1 have been defined as follows:
where is the atmospheric pressure (approximately 100 kPa), is the at rest coefficient of earth’s pressure, is the mean effective confining pressure and is the vertical effective stress.
Figure 14 correlates q1 and the ratio VS0/qpeak for all the studied materials in a single plot, showing that it is possible to define the boundaries between true liquefaction and strain softening for finer materials, as well as between true liquefaction and strain hardening for uniformly-graded sands. The adopted symbols aim to distinguish true liquefaction (open symbols), from a strain softening behavior (grey symbols) and from a stable behavior, characterized by strain hardening (black symbols). This figure clearly distinguishes the boundaries of soil behavior, which correspond, for the soils under study, to the ratios for true liquefaction triggering provided in Table 8. As shown in Figure 14, it is clear that low VS0/qpeak and high q1 correspond to a stable condition. This framework is particularly suitable to predict liquefaction potential, overcoming the limitations of other approaches.
Figure 15 shows that stability increases both with increasing shear wave velocity, Vs0, (or stiffness) and with increasing peak undrained deviatoric stress, qpeak, for all soils. Thus, stability increases with both increasing Vs1 and q1, reflecting greater contact between grains, due to the dual effect of the increase in confining pressure and the decrease in void ratio.
From both Figure 14 and Figure 15, further conclusions can be drawn. For instance, Figure 15 indicates that among the three sands, Algeria sand is the most stable one since the Vs0 boundary separating liquefaction from a stable behavior is obtained for low Vs0. This is believed to be associated with the greater roundness of its particles. On the contrary, Coimbra sand is the soil with higher brittleness, due to its highly meta-stable structure, created by the small contact bridges between its angular grains. It can also be observed that both Coimbra sand and the mixture can only reach full stability (i.e. a strain hardening behavior) for very high initial confining stresses (and/or low void ratios), as stability was not verified within the wide range of confining pressures applied on the triaxial tests (see Table 7). Finally, both the gold tailings and the silt are the least prone to liquefaction, yet this has not been reflected in a higher stability, since these soils display a strain softening behavior within a wide range of shear wave velocities.
Despite the robust correlations obtained with the laboratory results, good reasoning must be applied since a strong statistical correlation exists between both variables (i.e. between Vs0/qpeak and q1). In fact, a higher relevance should be given to the limiting Vs0/qpeak distinguishing liquefiable and non-liquefiable conditions than the correlation between Vs0/qpeak and q1, particularly in laboratory conditions.
Making use of the same parameters, a different approach may be adopted. This framework derives from a concept based on the Simplified Procedure proposed by Andrus and Stokoe (1997), initially adopted for cyclic conditions (see Soares et al., 2011), as shown in Figure 16. In this case study, instead of the cyclic resistance ratio (CRR), the normalized peak undrained deviatoric stress in monotonic conditions qpeak/(2.σ´h) is taken (equation (4)). Although this chart was initially proposed for determining the cyclic resistance of sands with low fines content, an analogy can be made associating the boundary that separates liquefiable from non-liquefiable conditions. It should be also pointed out that Andrus and Stokoe’s equation was not corrected for fines content, instead it was decided to adjust both b and Vs1* parameters. The main disadvantage of this framework is the existence of distinct boundaries, specific to each soil, which in this case is a function of b and Vs1*. Table 9 summarizes these values for the studied soils, where it becomes clear that b is around 3.0 but Vs1* varies between 150 and 240 depending on the soil type. This is also observed in Figure 16 as the lines have approximately the same shape but their vertical asymptote moves to the right with increasing instability potential.
In order to overcome the dispersion of the limiting ratios, given by VS0/qpeak, with the type of soil, a new framework is proposed.
Effect of soil type
It is known that soil liquefaction is mainly a function of the contractiveness of the soil, which is affected, in the first place, by relative density. Relative density in turn is affected by grain size distribution, shape of the grains, and specific gravity. For this case study, specific gravity was not an issue since most soils have similar values, except the gold tailings, which have a very distinct Gs value of 2.94. The challenge was to find a parameter that could take into account not only grain size distribution but also indirectly consider the shape of the grains. Bayat & Bayat (2013) have studied the effect of soil grading on the undrained shear strength of sands, having considered CU as an effective parameter to control shear resistance only for pure sand samples. Instead, the aim of this research was to define a single parameter for any soil type. Following this study, the coefficient of uniformity (CU) was found to be the most suitable parameter to correlate with the proposed ratios, as shown in Figure 17. Despite not being directly related with particle shape, CU can evaluate soil dispersion by considering particle diameters, which is highly related with potential fabric configuration. Following these studies, this research found the coefficient of uniformity to be a reliable measure of the liquefaction potential. Figure 17 illustrates the new approach for predicting soil liquefaction potential for any type of soil, using CU as soil identifier.
In order to construct the graph in Figure 17, the correlations needed to be consistent for all soils. For that, the adopted limiting Vs0/qpeak ratios were those between strain softening and strain hardening for finer soils and between true liquefaction and strain hardening for uniformly-graded sands, since these typically do not exhibit strain softening, as summarized in Table 8. For the case of the mixture, the ratios provided are considered indicative, due to the limited VS measurements in the undrained compression triaxial tests carried out so far.
Still, as most correlations, this framework does have a limitation. According to this approach, soils with a better grading are likely to be more resistant to soil liquefaction. However, in the case of gap-graded specimens, which display a high CU (similar to well-graded soils), a Vs0/qpeak ratio would be expected to be high, due to the high liquefaction potential (e.g. Igwe et al., 2012). This would go against the trend displayed in Figure 17. In any case, natural soils are generally not gap-graded.
Although more data is needed to confirm this trend, these promising results suggest that the limiting boundary between liquefaction or strain softening and strain hardening defined in terms of Vs0/qpeak ratio can be related grain size measured by the uniformity coefficient.
Conclusions
The results obtained from this laboratorial research expand the liquefaction assessment framework proposed by Schnaid et al. (2013). From this research, the ratio between the normalized shear wave velocity and the peak strength, Vs0/qpeak, proved to be a very good and reliable parameter for soil liquefaction assessment in different types of soils. The association of properties relative to both small and large strain levels, which are controlled (although differently) by void ratio, mean stress state, contractiveness, and soil structure, result in different functions of the same variables. Hence, these two measurements, as a ratio, can be useful in predicting, not only liquefaction, but also other relevant soil properties such as compressibility or cementation.
The boundary between strain hardening and strain softening soil behaviors measured by Vs0/ qpeak ratio was found to be a function of the coefficient of uniformity, CU. The correlation obtained between both parameters provided a reliable framework, independent of soil type, for application to the assessment of static soil liquefaction.
Further investigations are necessary involving distinct stress-paths, distinct K0-consolidation conditions, among other factors, to evaluate if the observed correlation between Vs0/qpeak and CU is limited to specific conditions.
However, in the authors’ opinion, the potential of this framework goes beyond laboratory assessment and can be also applied to in situ data, namely via the seismic piezocone, by using a similar stiffness/stress ratio, known as rigidity index, G0/qc.
Acknowledgments
The authors would like to thank Professor Fernando Schnaid for his cooperation in this research. The support of the Portuguese Foundation for Science and Technology (FCT) is also acknowledged through grant SFRH/BPD/120470/2016. This work was also financially supported by: Base Funding - UIDB/04708/2020 of the CONSTRUCT - Instituto de I&D em Estruturas e Construções - funded by national funds through FCT/MCTES (PIDDAC).
Notation
| CC | coefficient of shape CU |
| CIU | isotopically consolidated undrained triaxial test |
| CRR | cyclic resistance ratio |
| CSL | Critical State Line |
| CU | coefficient of uniformity |
| CVR | Critical Void Ratio line |
| emax | maximum void ratio |
| emin | minimum void ratio |
| G0 | small-strain shear modulus (MPa) |
| Gs | specific gravity |
| IB | brittleness index |
| IL | instability line |
| at rest coefficient of earth’s pressure | |
| atmospheric pressure (approximately 100 kPa) | |
| qc | CPT tip cone resistance (MPa) |
| qpeak | peak undrained deviatoric stress (kPa) |
| SSL | Steady State Line |
| VS0 | shear wave velocity prior to shear stage (m/s) |
| VS0/qpeak | ratio between the shear wave velocity (VS0) and the peak undrained deviatoric stress |
| VS1 | |
| (m/s) | |
| λ | CSL slope |
| σ’d(min) | minimum shear strength (kPa) |
| σ’d(peak) | peak shear strength (kPa) |
| mean effective confining pressure (kPa) | |
| vertical effective stress (kPa) | |
| ψ | state parameter, measured with reference to the CSL |
| state parameter, measured with reference to the SSL |
References
- Andrus, R.D.; Stokoe, K.H. (1997). “Liquefaction Resistance Based on Shear Wave Velocity.” Proceedings of the National Center for Earthquake Engineering Research (NCEER) Workshop on Evaluation of Liquefaction Resistance of Soils, T.Y. Youd and I.M. Idriss, Eds., Buffalo, NY.
- ASTM D4254 (2016). Standard Test Methods for Minimum Index Density and Unit Weight of Soils and Calculation of Relative Density, American Society of Testing Materials.
- Azeiteiro, R.N.J.; Marques, V.D.; Coelho, P.A.L.F. (2012). “Effect of singular peaks in uniform cyclic loading on the liquefaction resistance of sand.” Proceedings of the 2nd International Conference on Performance-Based Design in Earthquake Geotechnical Engineering, no. 6.13, Taormina, Italy.
- Bayat, E. and Bayat, M. (2013). “Effect of grading characteristics on the undrained shear strength of sand: review with new evidences.” Arabian Journal of Geosciences, 6, 4409-4418. [CrossRef]
- Bedin, J. (2010). “Study of the geomechanical behavior of tailings.” PhD thesis in Civil Engineering, Federal University of Rio Grande do Sul, Brazil.
- Bedin, J., Schnaid, F. and Viana da Fonseca, A. (2012). “Gold tailings liquefaction using critical state soil mechanics concepts.” Géotechnique, 62, 263–267. [CrossRef]
- Been, K. and Jefferies, M. G. (1985). “A state parameter for sands.” Géotechnique, 35, 99–112. [CrossRef]
- Casagrande, A. (1936). “Characteristics of cohesionless soils affecting the stability of slopes and earth fills.” Journal of the Boston Society of Civil Engineers, January: 13–32.
- CEN (2004). Standard on, Geotechnical investigation and testing – Llaboratory testing of soil – part 9: Consolidated triaxial compression on water saturated soil. Technical report, Brussels: Comité Européen de Normalisation, 2004b.
- Cho, G., Dodds, J. and Santamarina, J. C. (2006). Particle shape effects on packing density, stiffness, and strength: natural and crushed sands. J. Geotech. and Geoenviron. Eng., 132, 591–602, 2006. [CrossRef]
- Chu, J., Leong, W. K., Loke, W. L. and Wanatowski, D. (2012). “Instability of loose sand under drained conditions.” Journal of Geotechnical and Geoenvironmental Engineering, 138, 207–216. [CrossRef]
- Consoli, N., Viana da Fonseca, A., Cruz, R. C., Heineck, K. S. (2009). “Fundamental parameters for the stiffness and strength control of artificially cemented sand.” Journal of Geotechnical and Geoenvironmental Engineering 135, 1347-1353. [CrossRef]
- Consoli, N.C., Heineck, K.S., Coop, M.R., Viana da Fonseca, A. and Ferreira, C. (2007). “Coal bottom ash as a geomaterial: influence of particle morphology on the behavior of granular materials.” Soils and Foundations, 47, 361-373. [CrossRef]
- Doygun, O., Brandes, H.G. & Roy, T.T. Effect of Gradation and Non-plastic Fines on Monotonic and Cyclic Simple Shear Strength of Silica Sand. Geotech Geol Eng 37, 3221–3240 (2019). [CrossRef]
- Eslaamizaad, S. and Robertson, P. K. (1997). “Evaluation of settlement of footings on sand from seismic in-situ tests.” Proceedings of the 50th Canadian Geotechnical Conference, Ottawa, Ontario, 20-22 October 1997. BiTech Publishers, Vol. 2, pp. 755–764.
- Hardin, B. O. (1978). “The nature of stress-strain behavior of soils.” Proceedings of the Earthquake Engineering and Soil Dynamics Conference (ASCE), Vol. 1, pp. 3–90.
- Hird, C. C. and Hassona, F. A. K. (1990). “Some factors affecting the liquefaction and flow of saturated sands in laboratory tests.” Engineering Geology, 28, 149–170. [CrossRef]
- Igwe, O., Fukuoka, H. and Sassa, K. (2012). “The effect of relative density and confining stress on shear properties of sands with varying grading.” Geotechnical and Geological Engineering, 30, 1207-1229. [CrossRef]
- Ishihara, K. (1996). Soil behavior in earthquake geotechnics. Oxford University Press. New York.
- Jefferies, M. G. and Been, K. (2006). Soil liquefaction. A critical state approach. Taylor & Francis.
- Lade, P. V. (2002). “Instability, shear banding, and failure in granular materials.” International Journal of Solids and Structures, 39: 3337-3357.
- Lade, P. V. and Yamamuro, J. A. (1993). “Stability of granular materials in post peak softening regime.” Journal of Engineering Mechanics, 119, 128–144.
- Lade, P. V. and Yamamuro, J. A. (1997). “Effects of nonplastic fines on static liquefaction of sands.” Canadian Geotechnical Journal, 34, 918-928. [CrossRef]
- Leroueil, J. (2001). “Natural slopes and cuts: movement and failure mechanisms.” Géotechnique, 51, 197-243. [CrossRef]
- Lo Presti, D. C., Shibuya, S. and Rix, G. J. (2001). “Innovation in soil testing.” Proceedings of the 2nd International Conference on Pre-failure Deformation Characteristics of Geomaterials (IS Torino 99), Jamiolkowski, Lancellota & Lo Presti (Eds). Balkema, Rotterdam, Vol. 2, pp. 1027-1076.
- Nicholson, P.G., Seed, R.B., and Anwar, H.A. 1993. Elimination of membrane compliance in undrained triaxial testing. I. Measurement and evaluation. Canadian Geotechnical Journal, 30, 727–738. [CrossRef]
- Ramos, C.; Viana da Fonseca, A.; Vaunat, J. (2015). “Modeling flow instability of an Algerian sand with the dilatancy rule in CASM.” Geomechanics and Engineering, 9, 729 - 742. [CrossRef]
- Riveros, G. A., and Sadrekarimi, A. (2021). Static liquefaction behaviour of gold mine tailings. Canadian Geotechnical Journal, 58(6), 889-901. [CrossRef]
- Sadrekarimi, A. and Olsen, S. (2011). “Yield strength ratios, critical strength ratios and brittleness of sandy soils from laboratory tests.” Canadian Geotechnical Journal, 48, 493-510. [CrossRef]
- Santamarina, J. C. and G. Cho, G.C. (2004). Soil behaviour: The role of particle shape. Soil behaviour : The role of particle shape. pages 1–14. Proceedings Skempton Conference, 2004.Advances in geotechnical engineering: The Skempton conference. January 2004, pp. 604-617. 20 January; pp. 604–617.
- Santos, J.A., Gomes, R.C., Lourenço, J. C. , Marques, F., Coelho, P. Azeiteiro, R., Santos, L. A., Marques, V., Viana da Fonseca, A., Soares, M., Abreu, É. and Taborda, D. (2012). “Coimbra sand round robin tests to evaluate liquefaction resistance.” Proceedings of the 15th World Conference on Earthquake Engineering. Lisboa, Portugal.
- Schnaid, F. (2005). “Geocharacterization and engineering properties of natural soils by in situ tests.” Proceedings of the 16th International Conference on Soil Mechanics and Geotechnical Engineering, Balkema, Vol. 1, pp. 3–45.
- Schnaid, F. and Yu, H. S. (2007). “Theoretical interpretation of the seismic cone test in granular soils.” Géotechnique, 57, 265–272. [CrossRef]
- Schnaid, F., Bedin, J., Viana da Fonseca, A. and Costa-Filho, L. d. M. (2013). “Stiffness and strength governing the static liquefaction of tailings.” Journal of Geotechnical and Geoenvironmental Engineering, 139, 2136-2144. [CrossRef]
- Sladen, J. A. and Handford, G. (1987). “A potential systematic error in laboratory testing of very loose sands.” Canadian Geotechnical Journal, 1987, 24, 462-466. [CrossRef]
- Soares, M. (2014). “Evaluation of soil liquefaction potential based on laboratory data. Major factors and limit boundaries.” PhD thesis in Civil Engineering, University of Porto. Porto, Portugal.
- Soares, M., and Viana da Fonseca, A. (2016). “Factors affecting steady state locus in triaxial tests.” Geotechnical Testing Journal, 39, 1056-1078. [CrossRef]
- Soares, M., Bedin, J., Silva, J. and Viana da Fonseca, A. (2011). “Monotonic and cyclic liquefaction assessment on silty soils by triaxial tests with bender elements.” Proceedings of the International Conference on Advances in Geotechnical Engineering, Perth, Australia.
- Stokoe, K. H. I., Roesset, J. M., Bierschwale, J. G. and Aouad, M. (1988). “Liquefaction potential of sands from shear wave velocity.” Proceedings of the 9th World Conference on Earthquake Engineering. Vol.3, pp. 213–218.
- Tokimatsu, K., Kuwayama, S. and Tamura, S. (1991). “Liquefaction potential evaluation based on Rayleigh wave investigation and its comparison with field behavior.” Proceedings of the 2nd International Conference on Recent Advances in Geotechnical Earthquake Engineering and Soil Dynamics, Vol. 1, pp. 357–364.
- Uthayakumar, M., and Vaid, Y. (1998). “Static liquefaction of sands under multiaxial loading.” Canadian Geotechnical Journal, 35, 273-283. [CrossRef]
- Viana da Fonseca, A. and Soares, M. (2012). “Effect of principal stress rotation on cyclic liquefaction.” Proceedings of the 2nd International Conference on Performance-Based Design in Earthquake Geotechnical Engineering, no. 3.08, pp. 441-454. Taormina, Italy.
- Viana da Fonseca, A. and Soares, M. (2014). “Critical state soil mechanics assessment of instability and liquefaction locus of a sandy soil from Coimbra.” Proceedings of the XVII Brasilian Conference on Soil Mechanics and Geotechnical Engineering. Goiânia, Brasil.
- Viana da Fonseca, A., Coop, M.R., Fahey, M. and Consoli, N.(2011a). “The interpretation of conventional and non-conventional laboratory tests for challenging geotechnical problems”. Deformation Characteristics of Geomaterials, Vol. 1, pp. 84-119. IOS Press, Amsterdam.
- Viana da Fonseca, A., Ferreira, C. and Fahey, M. (2009). A framework interpreting bender element tests, combining time-domain and frequency-domain methods. ASTM Geotechnical Testing Journal, 32(2), 91–107. [CrossRef]
- Viana da Fonseca, A., Rocha, A. and Tahar, G. (2011b). “Liquefaction assessment charts on state and waves' velocities from static and cyclic triaxial tests on "Les Dunes" sands from Algier.” Proceedings of the 5th International Conference on Earthquake Geotechnical Engineering, Santiago, Chile.
- Viana da Fonseca, A., Soares, M. and Fourie, A. (2015). “Cyclic DSS tests for the evaluation of stress densification effects in liquefaction assessment.” Soil Dynamics and Earthquake Engineering, 75, 98-111. [CrossRef]
- Viana da Fonseca, A. V., Cordeiro, D., & Molina-Gómez, F. (2021). Recommended procedures to assess critical state locus from triaxial tests in cohesionless remoulded samples. Geotechnics, 1(1), 95-127. [CrossRef]
- Yamamuro, J. A. and Lade, P. V. (1998). “Steady-state concepts and static liquefaction of silty sands.” Journal of Geotechnical and Geoenvironmental Engineering, 124, 868–877. [CrossRef]
- Yang, Z., Liu, X., Guo, L. et al. Effect of silt/clay content on shear wave velocity in the Yellow River Delta (China), based on the cone penetration test (CPT). Bull Eng Geol Environ 81, 28 (2022). [CrossRef]
- Youd, T. L., Idriss, I. M., Andrus, R. D., Arango, I. et al. (2001). “Liquefaction resistance of soils summary report from the 1996 NCEER and 1998 NCEER/NSF workshops on evaluation of liquefaction resistance of soils.” Journal of Geotechnical and Geoenvironmental Engineering, 127, 817–833. [CrossRef]
- Zhao, Jiajing, Zhehao Zhu, Jiaquan Liu, and Huaqiao Zhong. 2023. "Damping Ratio of Sand Containing Fine Particles in Cyclic Triaxial Liquefaction Tests" Applied Sciences 13, no. 8: 4833. [CrossRef]
Figure 1.
Grading curve and coefficient of uniformity of gold tailings determined at LabGeo (Soares, 2014).
Figure 1.
Grading curve and coefficient of uniformity of gold tailings determined at LabGeo (Soares, 2014).
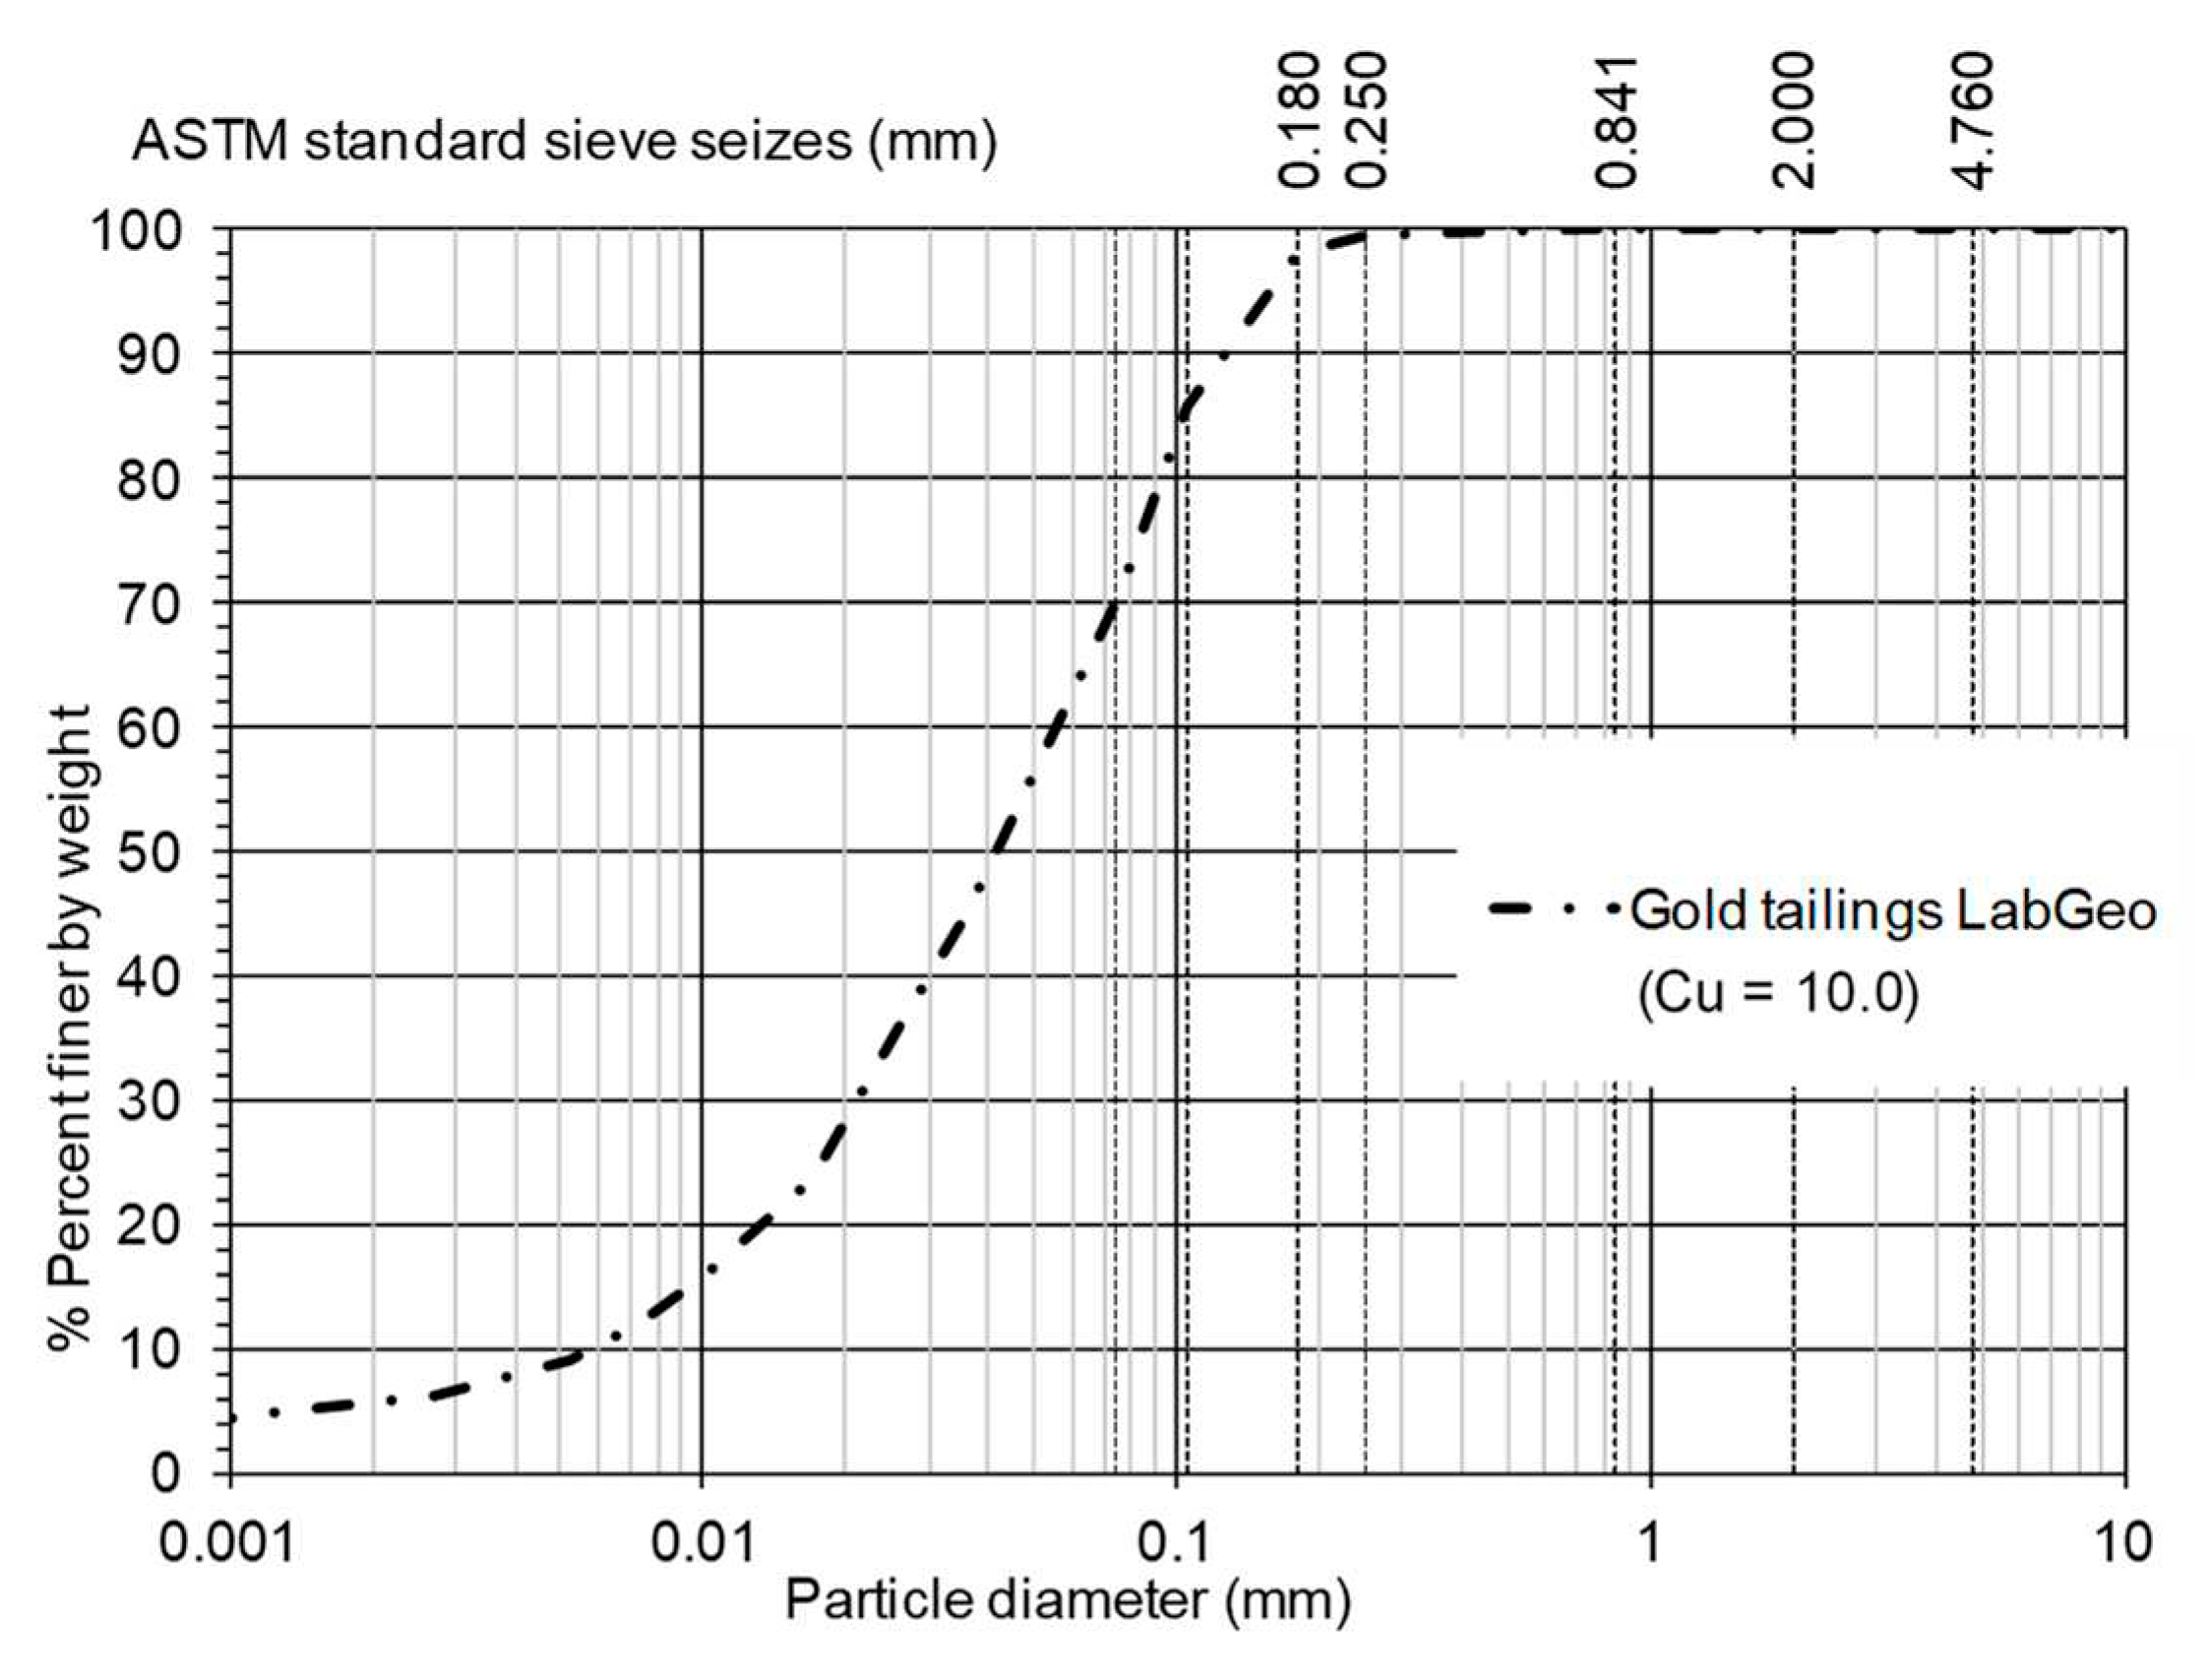
Figure 2.
Grain shape of gold tailings – Microstructural analysis (Bedin, 2009).
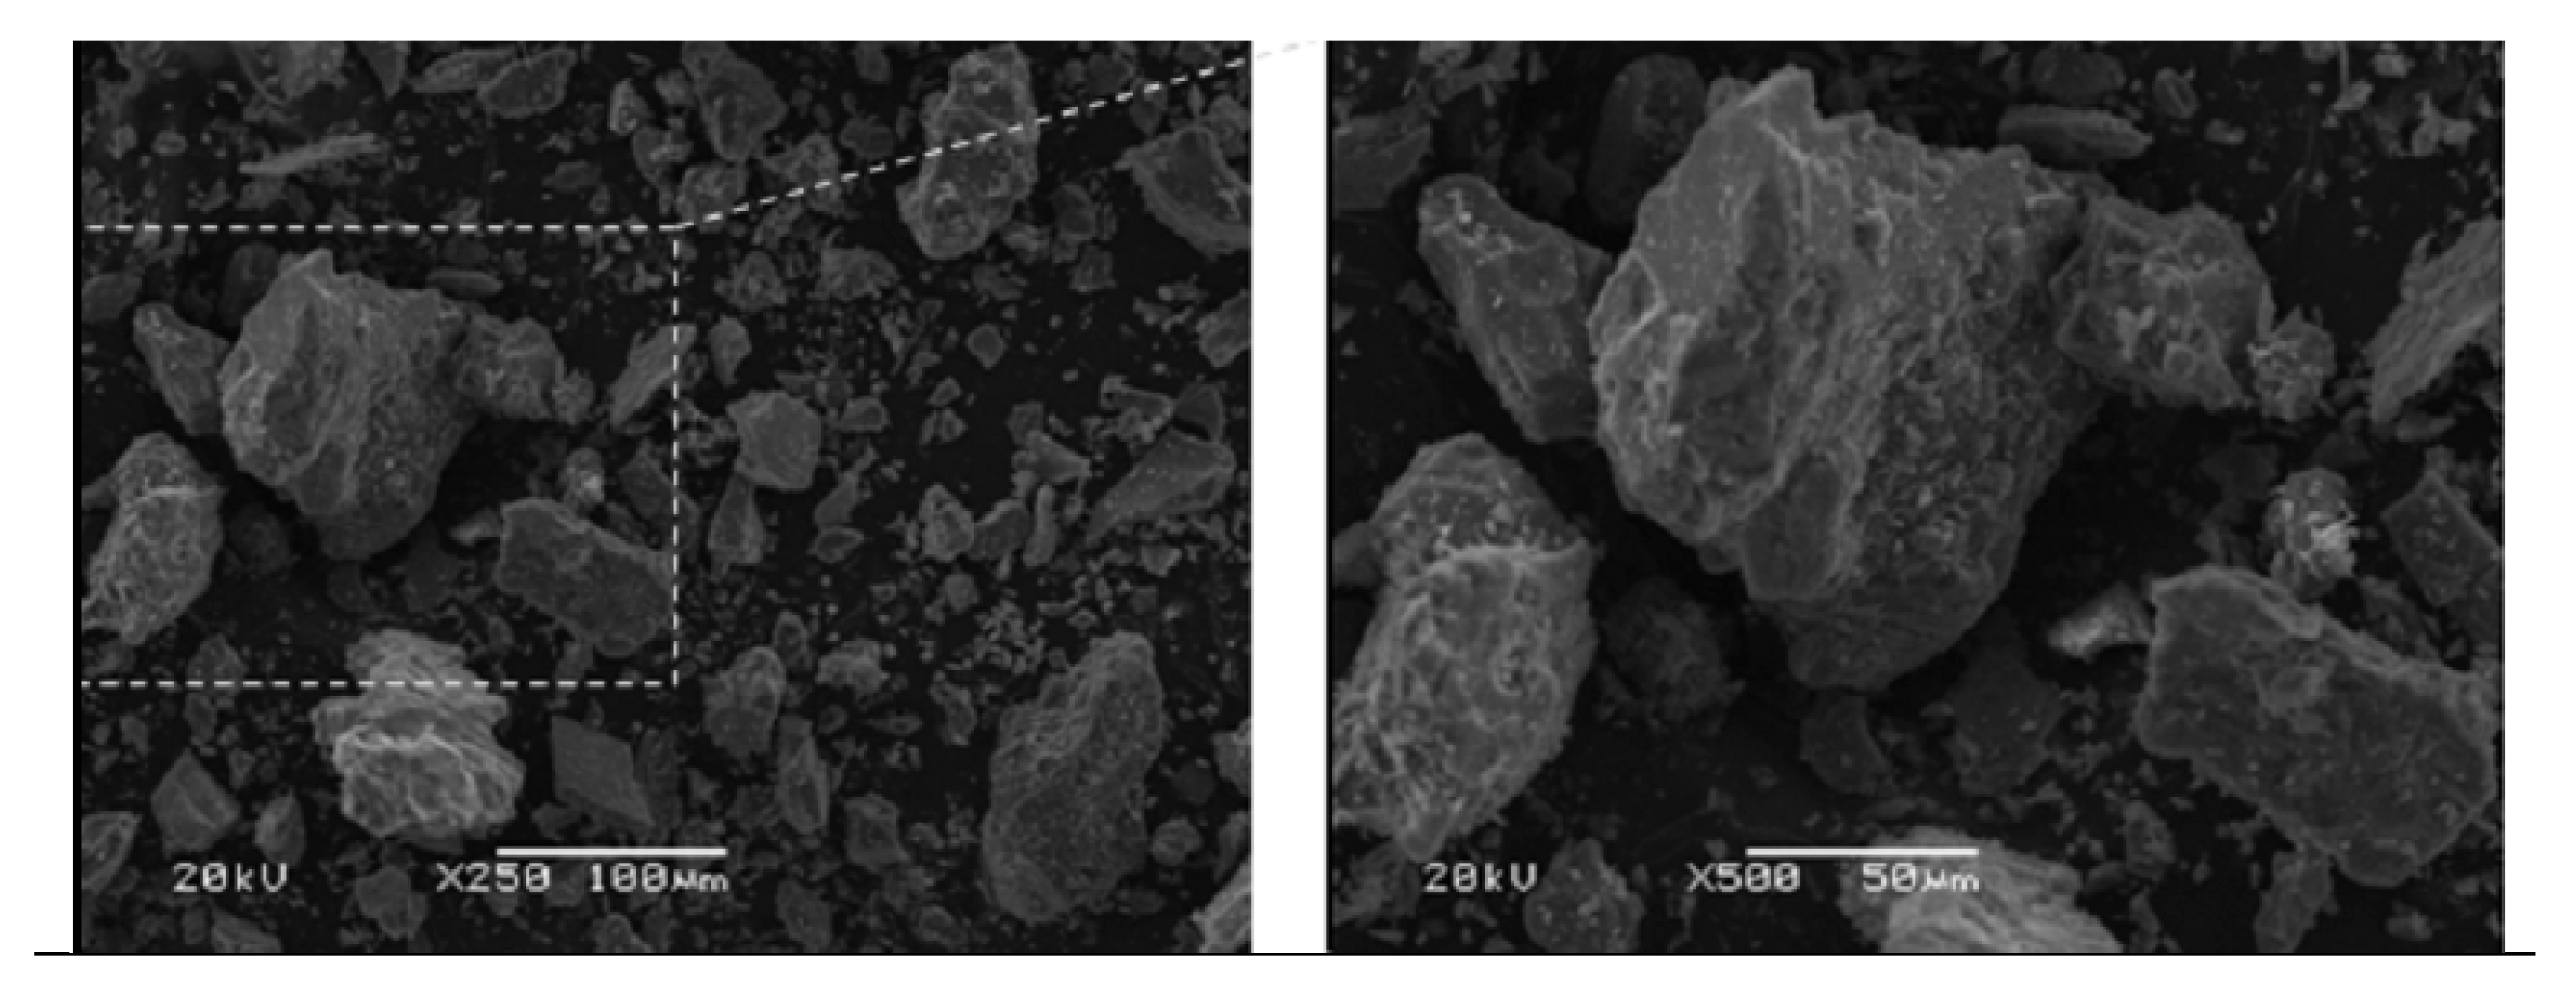
Figure 3.
Comparison of the grading curves and coefficients of uniformity of the silt, Osorio sand and the mixture (all of them determined at LabGeo at FEUP) (Soares, 2014).
Figure 3.
Comparison of the grading curves and coefficients of uniformity of the silt, Osorio sand and the mixture (all of them determined at LabGeo at FEUP) (Soares, 2014).
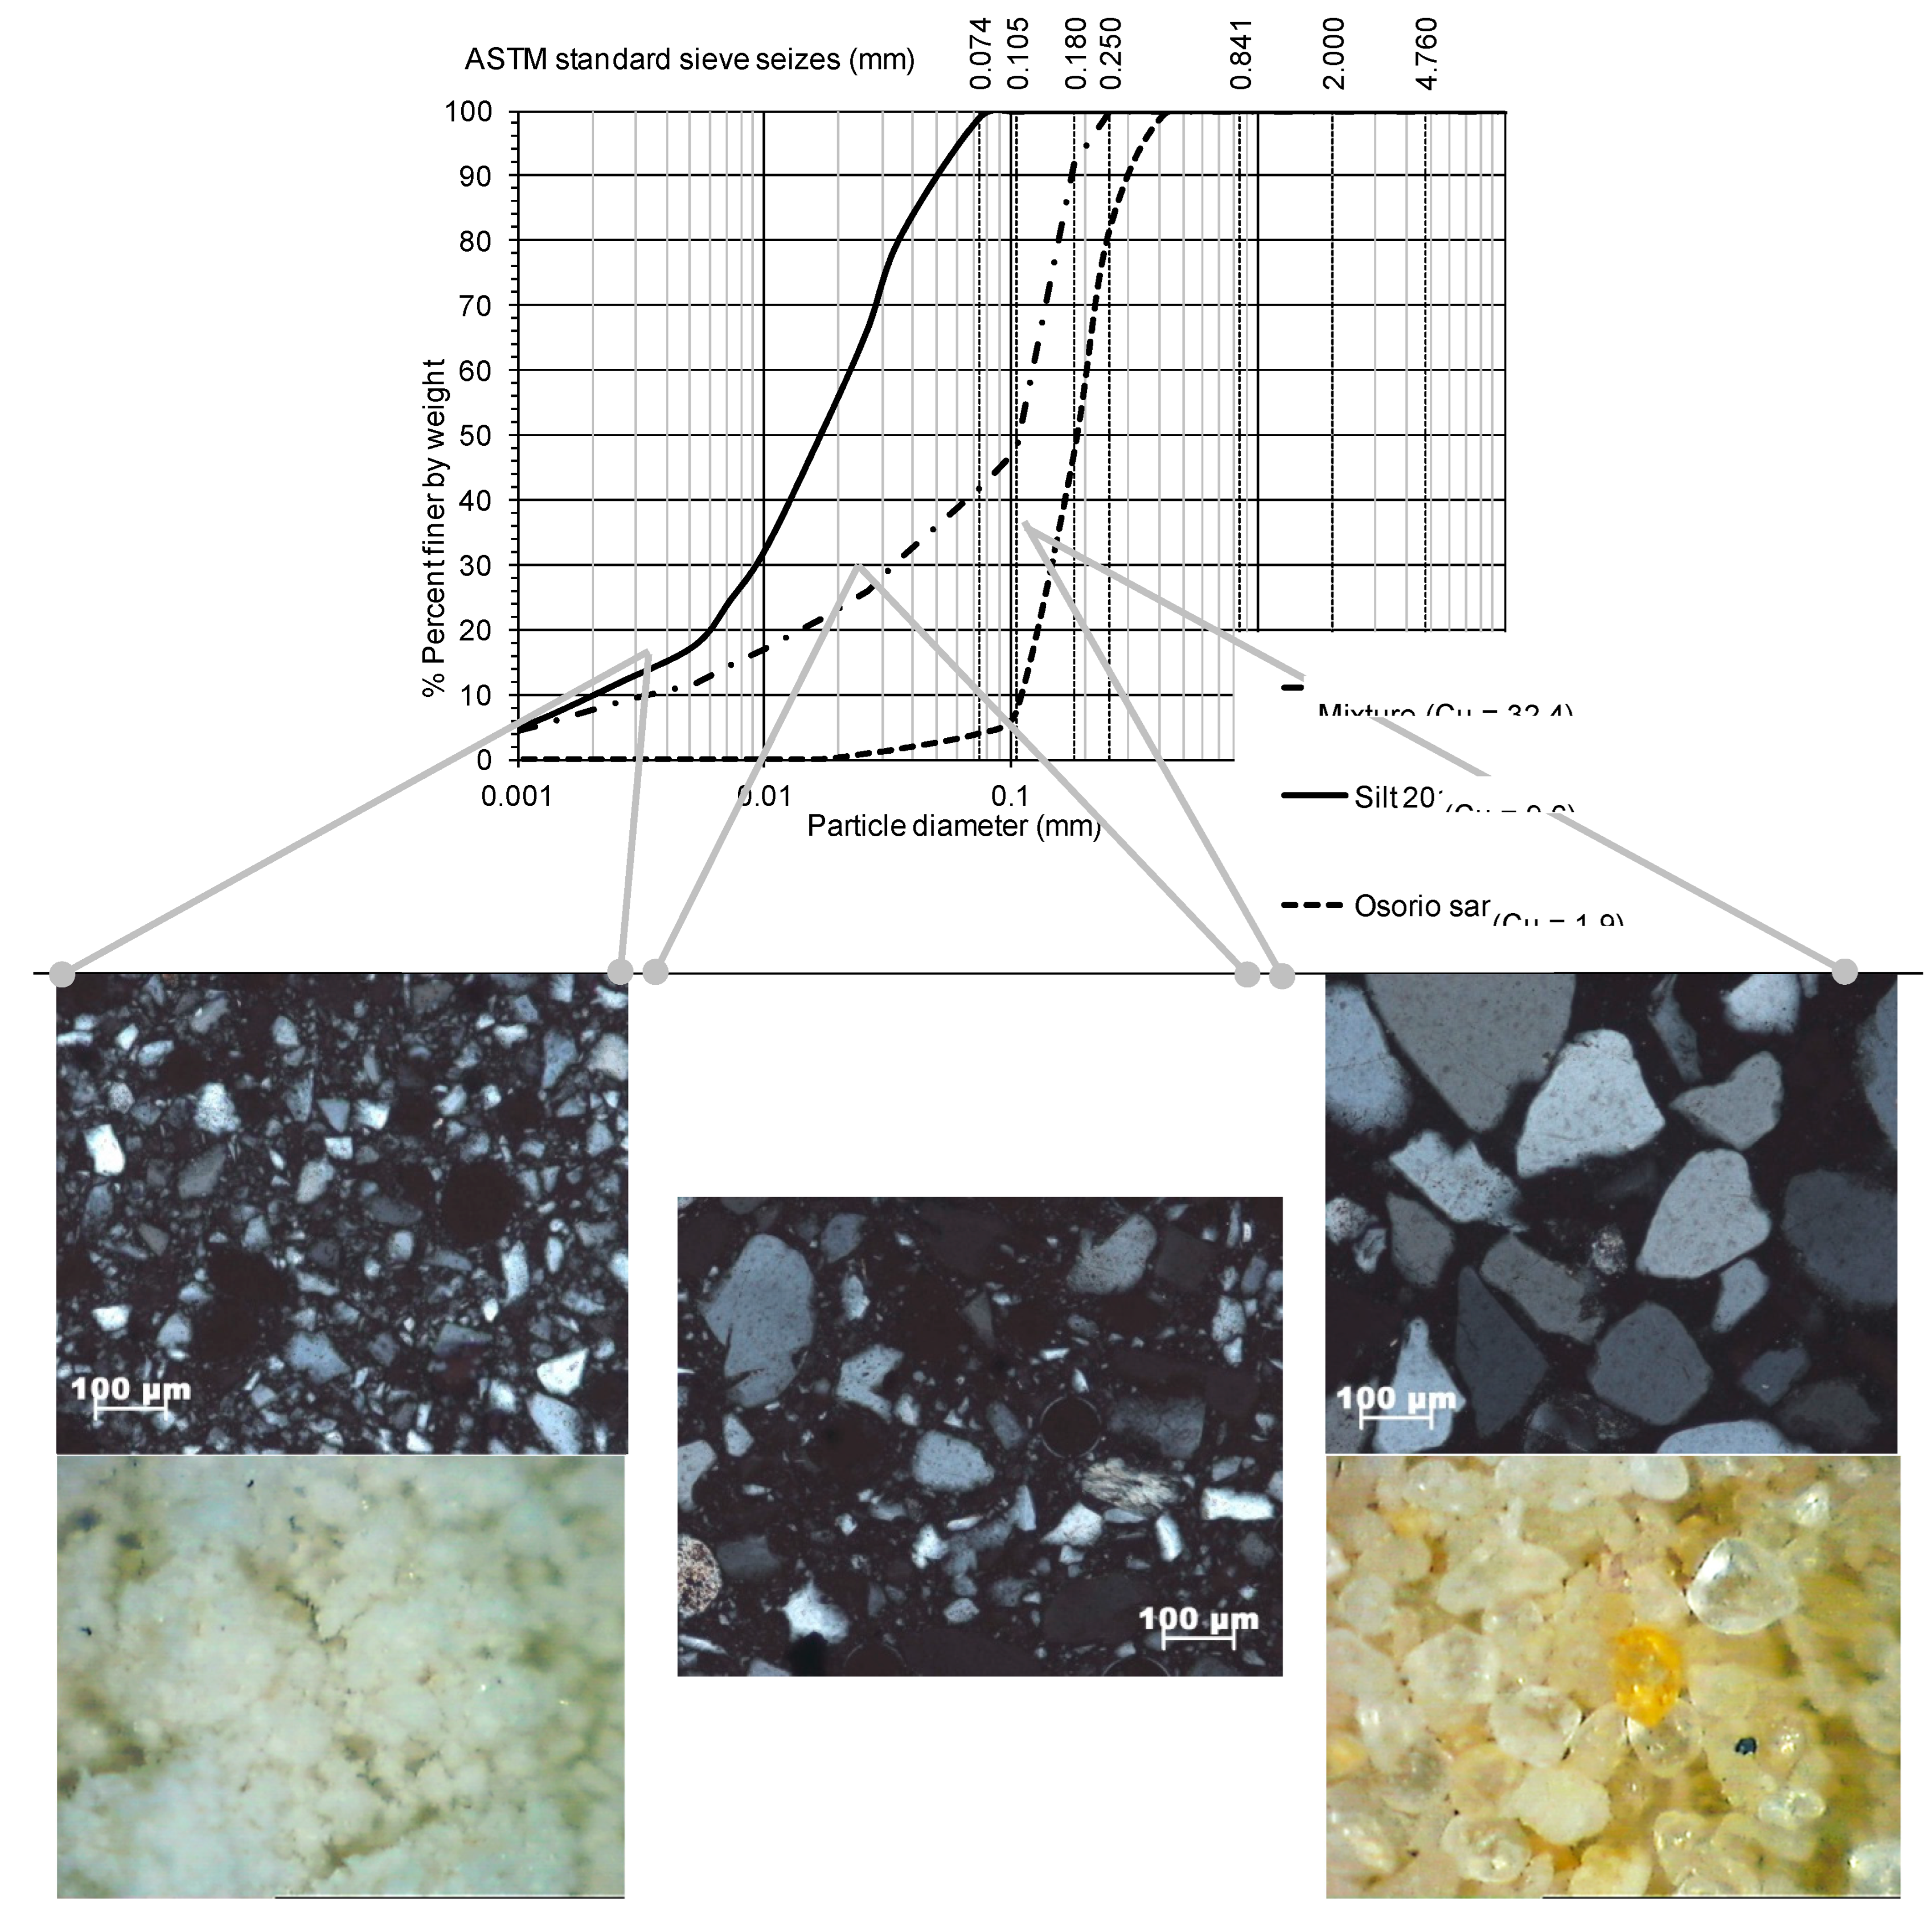
Figure 4.
Grading curve and coefficient of uniformity of Algeria sand determined at LabGeo (Soares, 2014).
Figure 4.
Grading curve and coefficient of uniformity of Algeria sand determined at LabGeo (Soares, 2014).
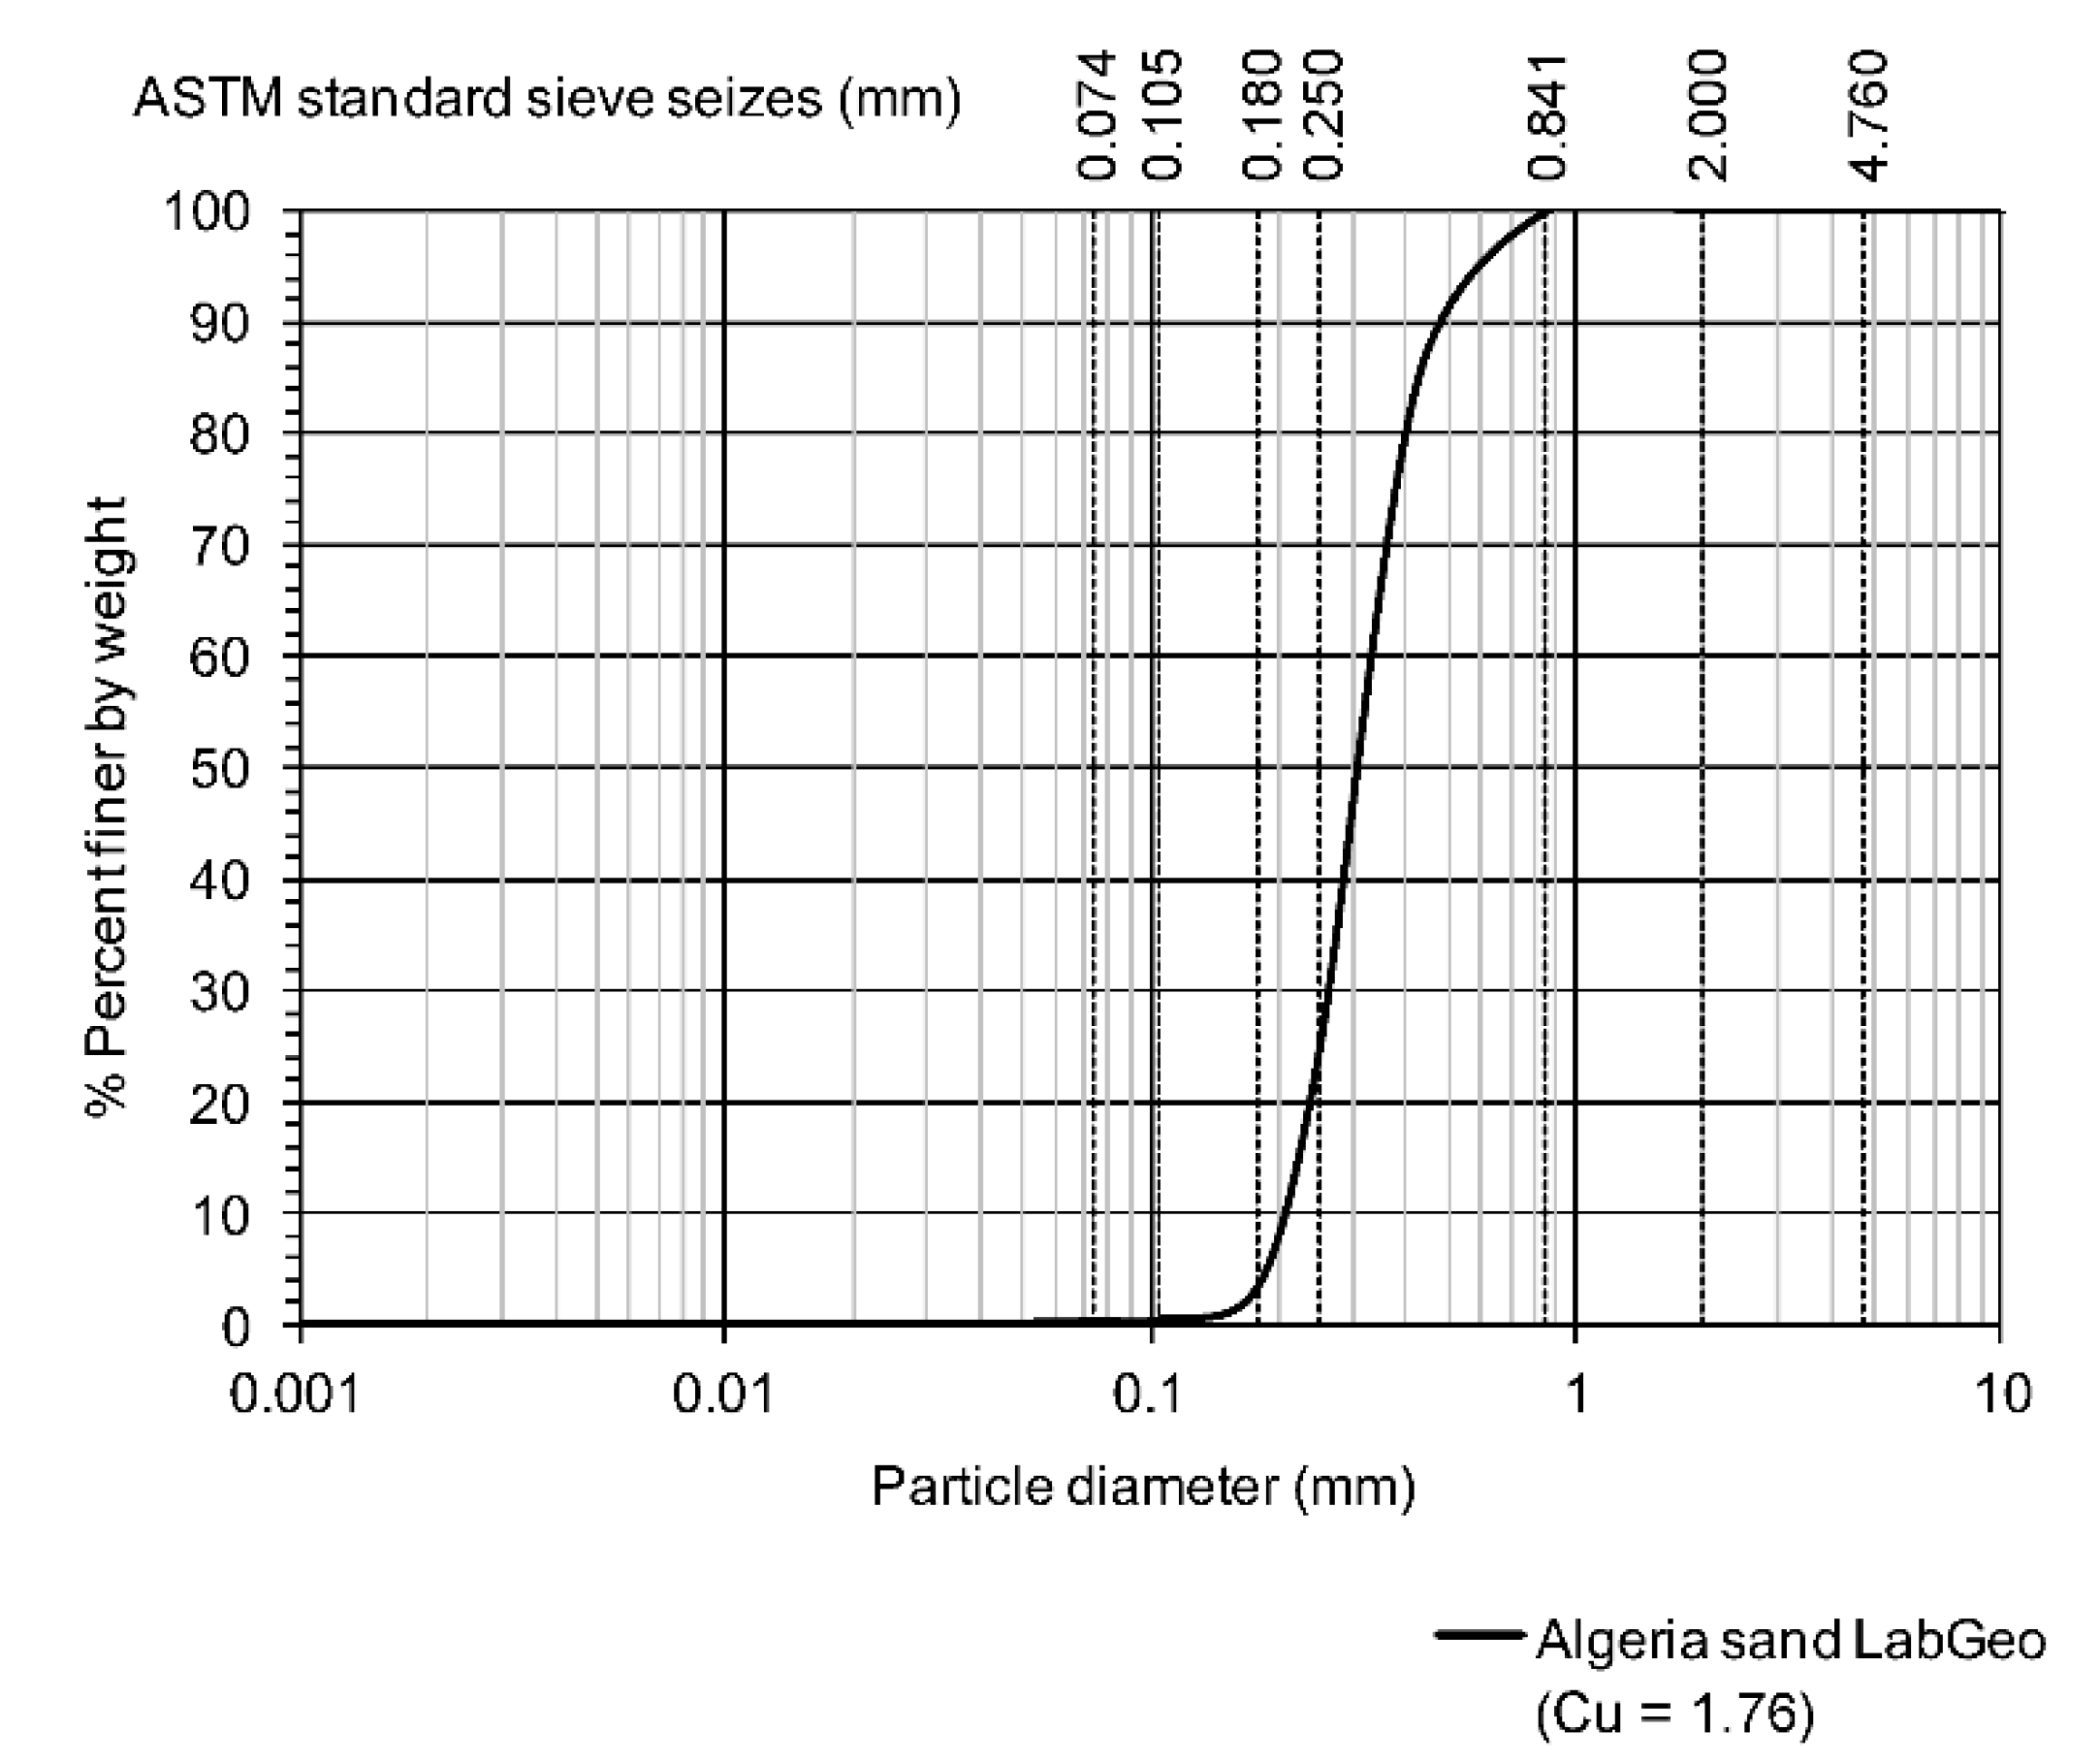
Figure 5.
Grain shape of Algeria sand (Viana da Fonseca et al., 2014).
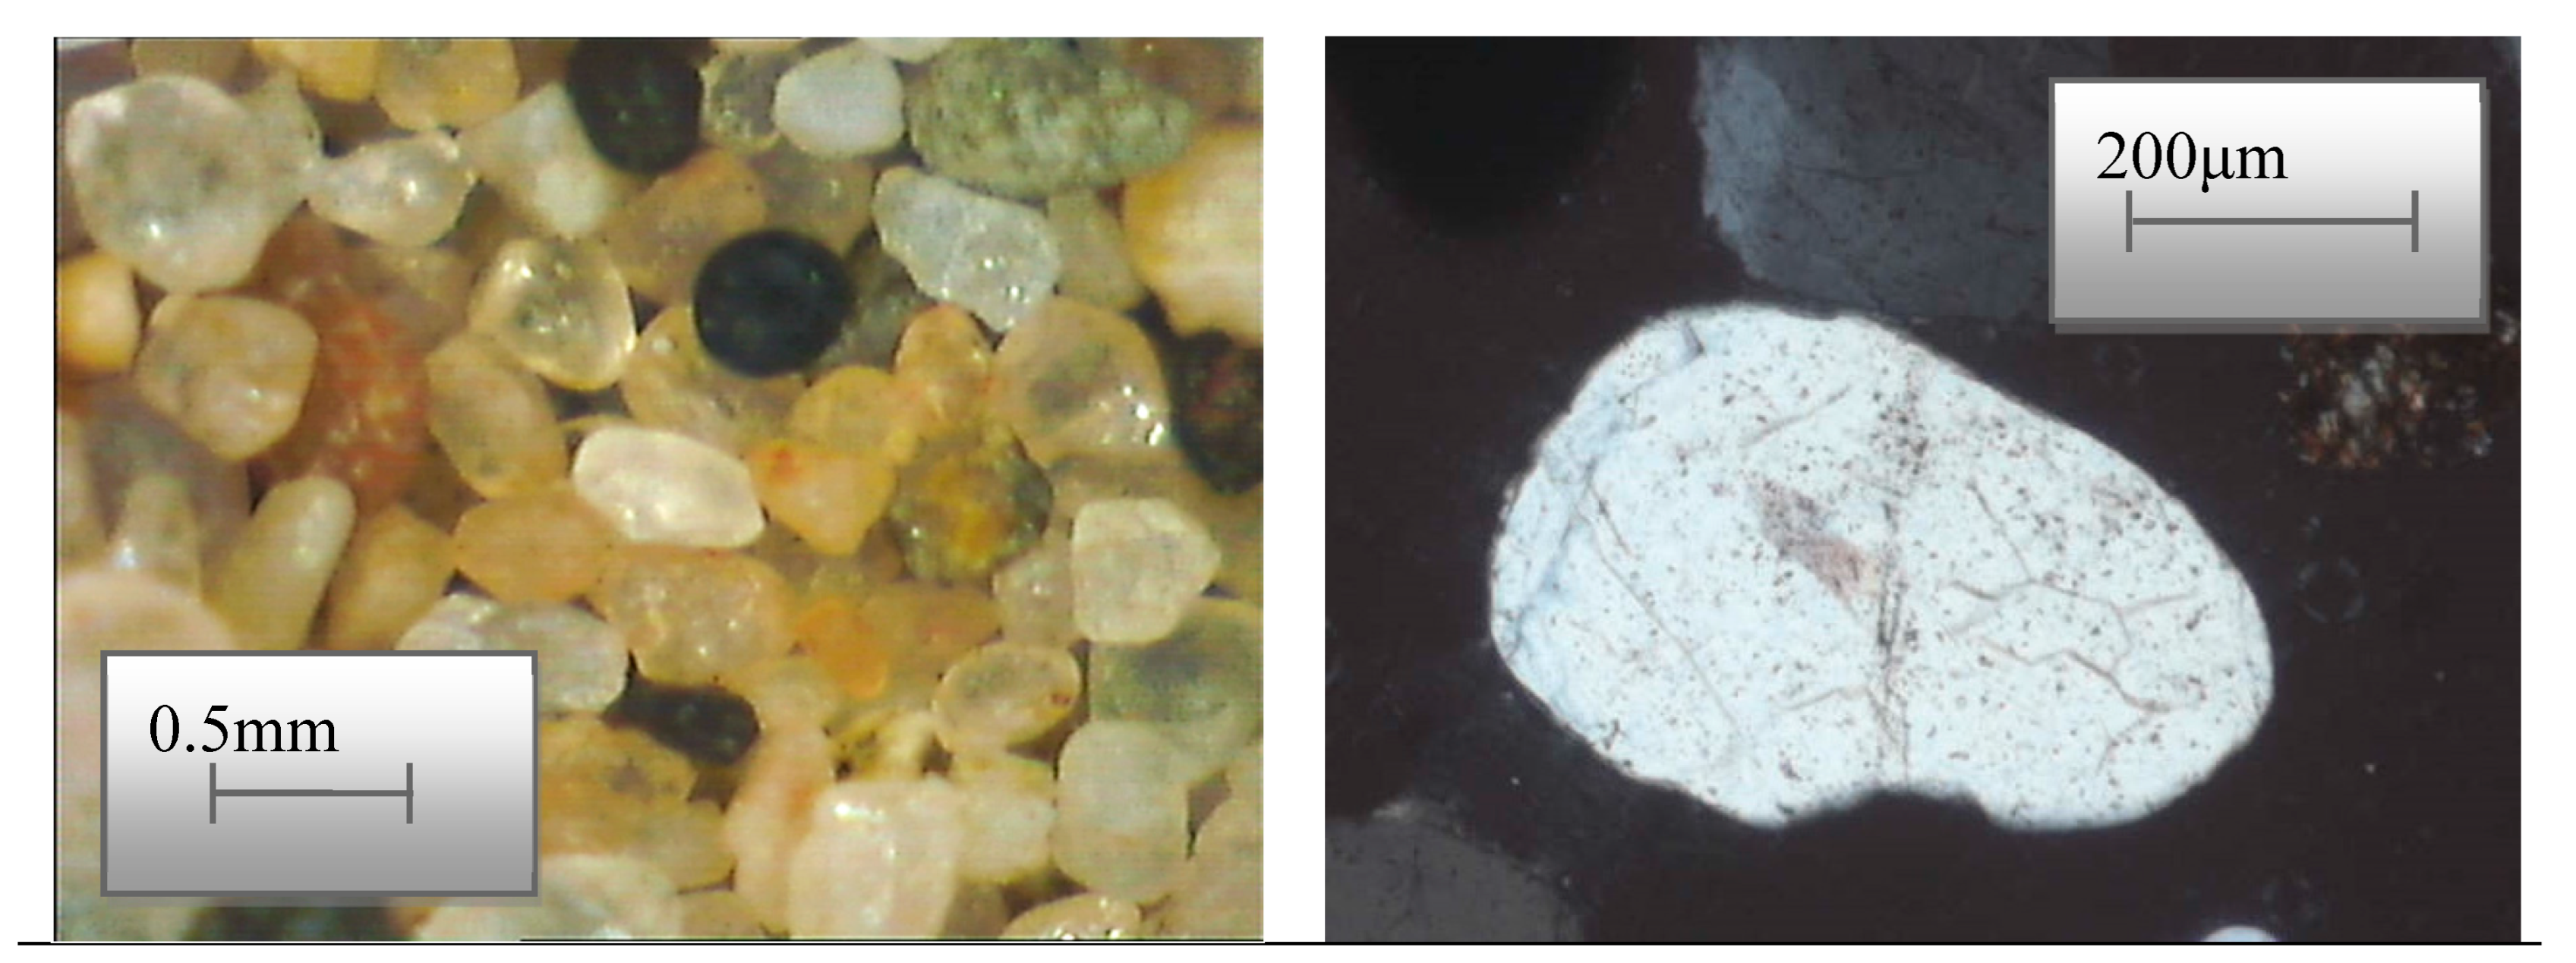
Figure 6.
Grading curve and coefficient of uniformity of Coimbra sand (Soares, 2014).
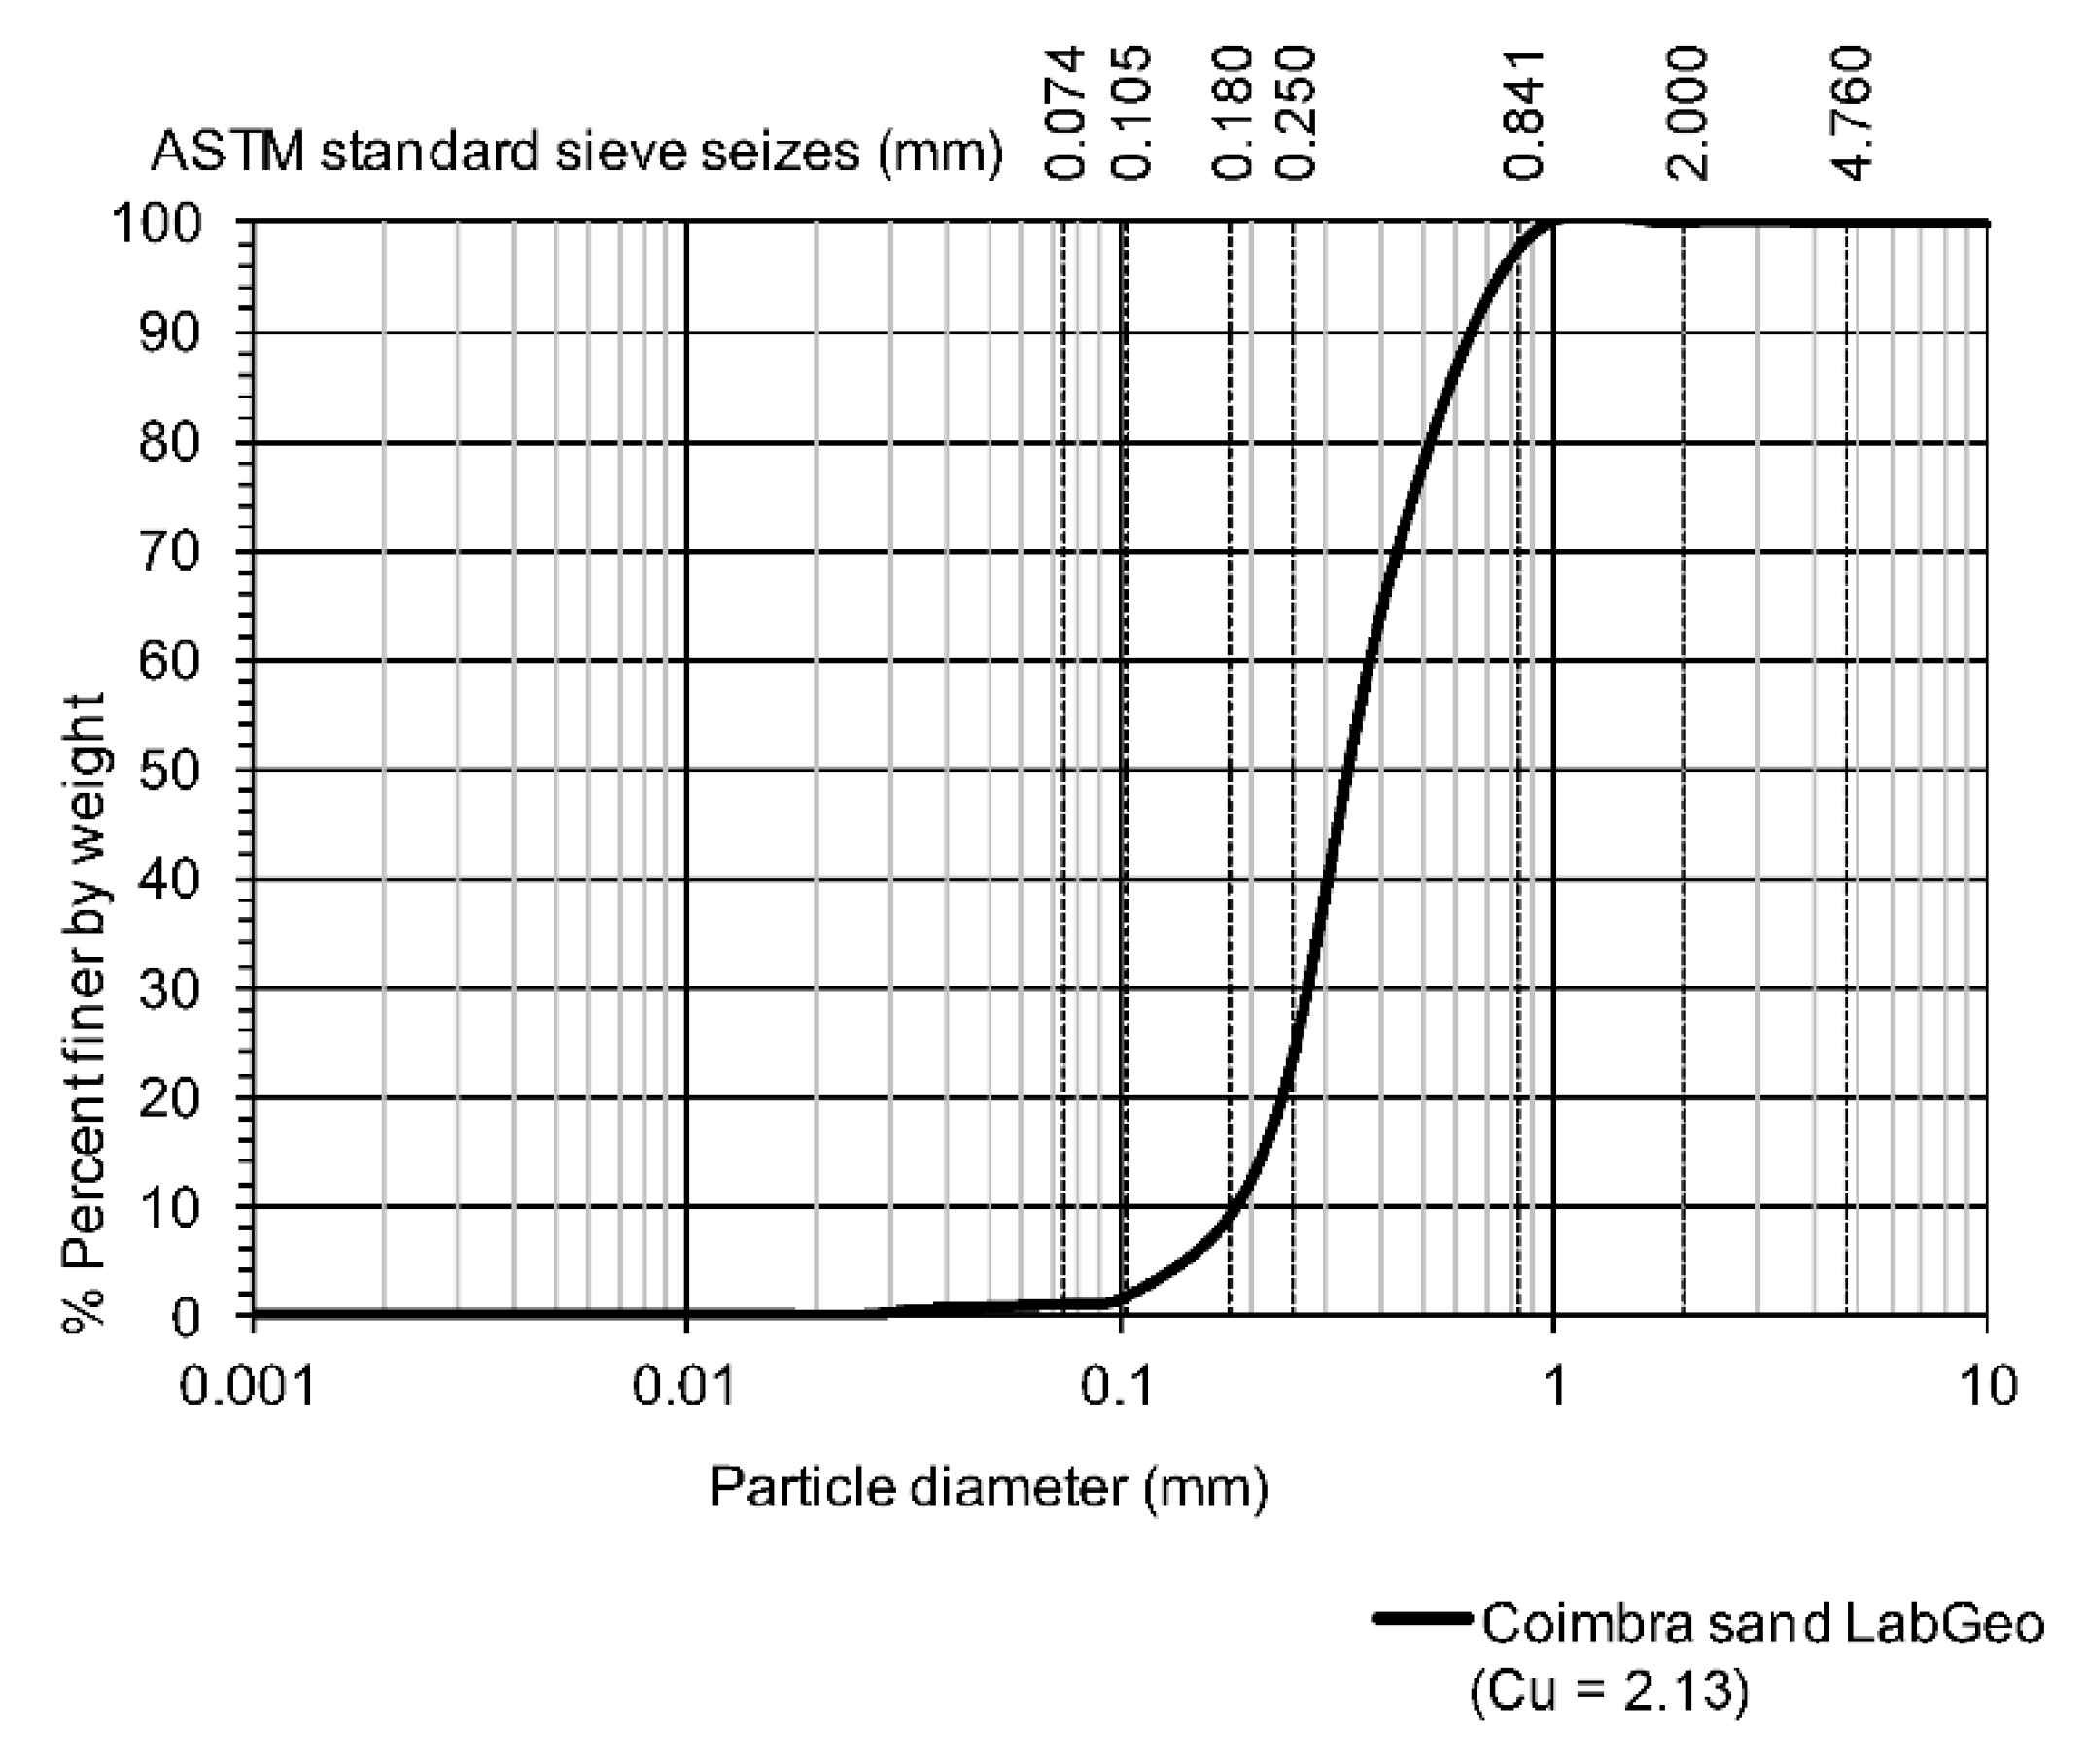
Figure 7.
Grain shape of Coimbra sand (Santos et al., 2012).

Figure 8.
a) ‘Bishop-Wesley’ stress-path triaxial apparatus in LabGeo (FEUP); b) Bender-elements on the pedestal of the apparatus.
Figure 8.
a) ‘Bishop-Wesley’ stress-path triaxial apparatus in LabGeo (FEUP); b) Bender-elements on the pedestal of the apparatus.
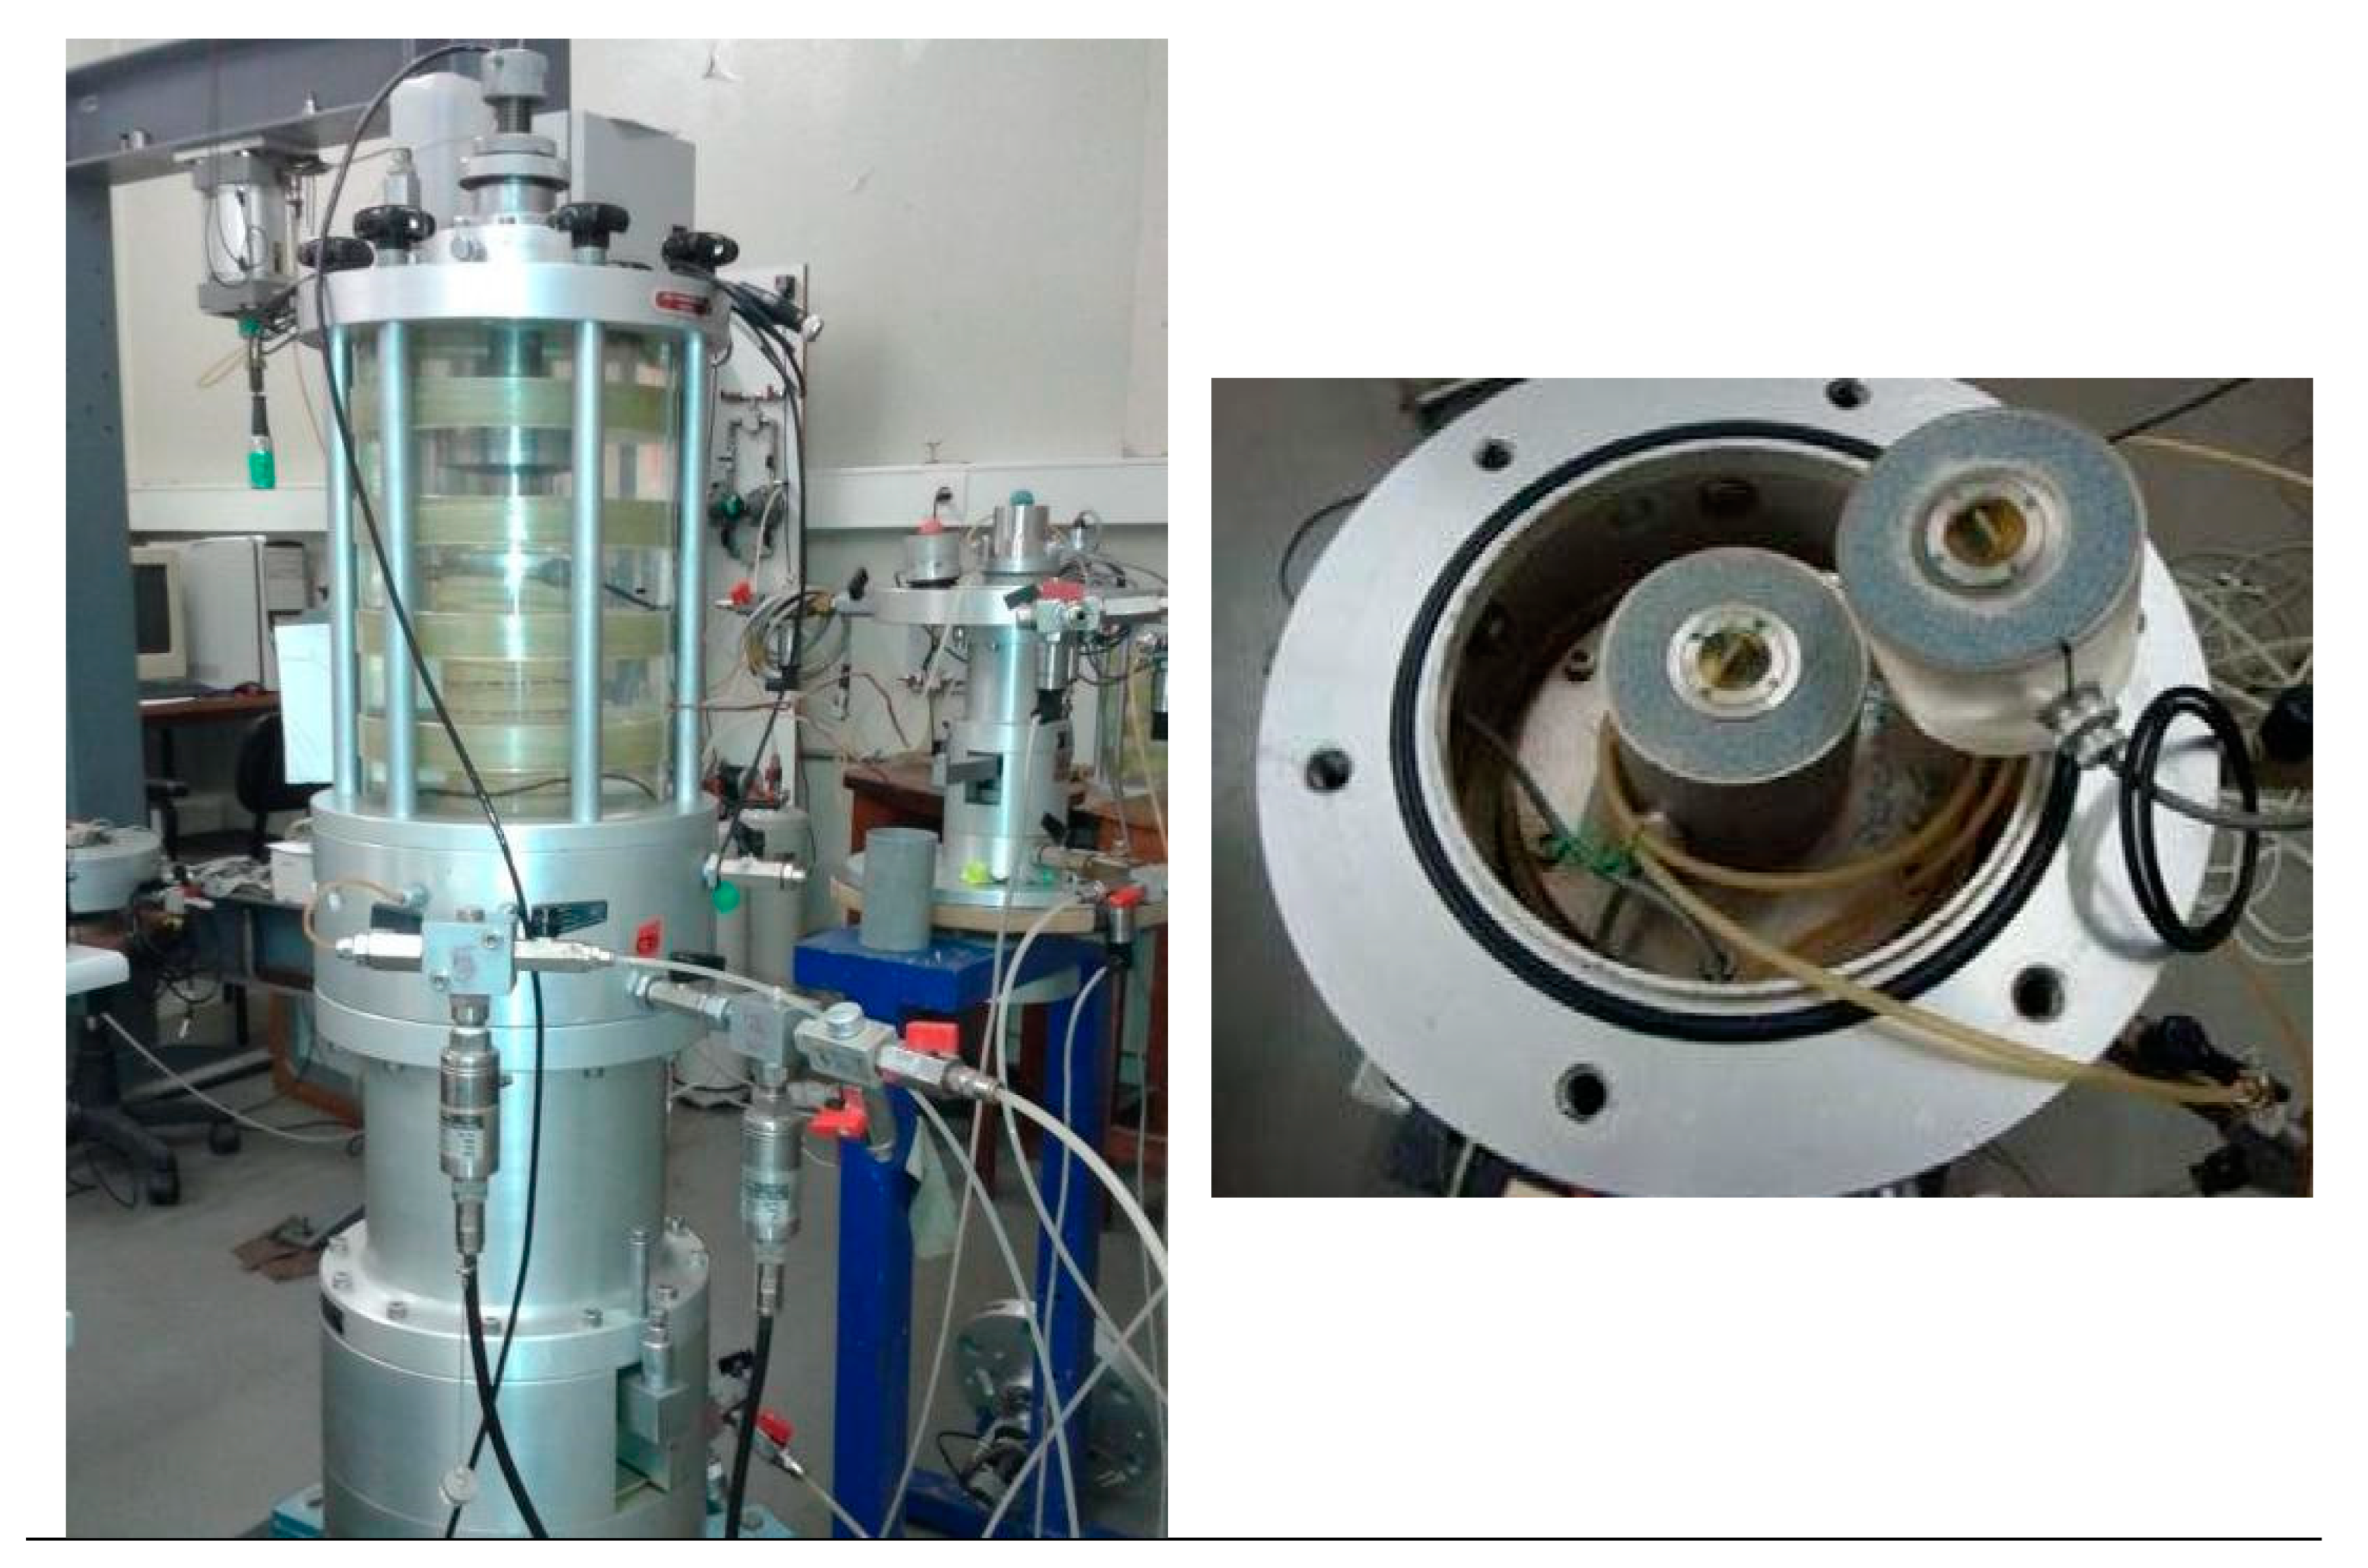
Figure 9.
Normal State Line, Critical State Line and Steady State Line for sands and silts; Undrained shear strength of soils delimited in a diagram e-log p’; Measurement of liquefaction potential through the state parameter ψ.
Figure 9.
Normal State Line, Critical State Line and Steady State Line for sands and silts; Undrained shear strength of soils delimited in a diagram e-log p’; Measurement of liquefaction potential through the state parameter ψ.
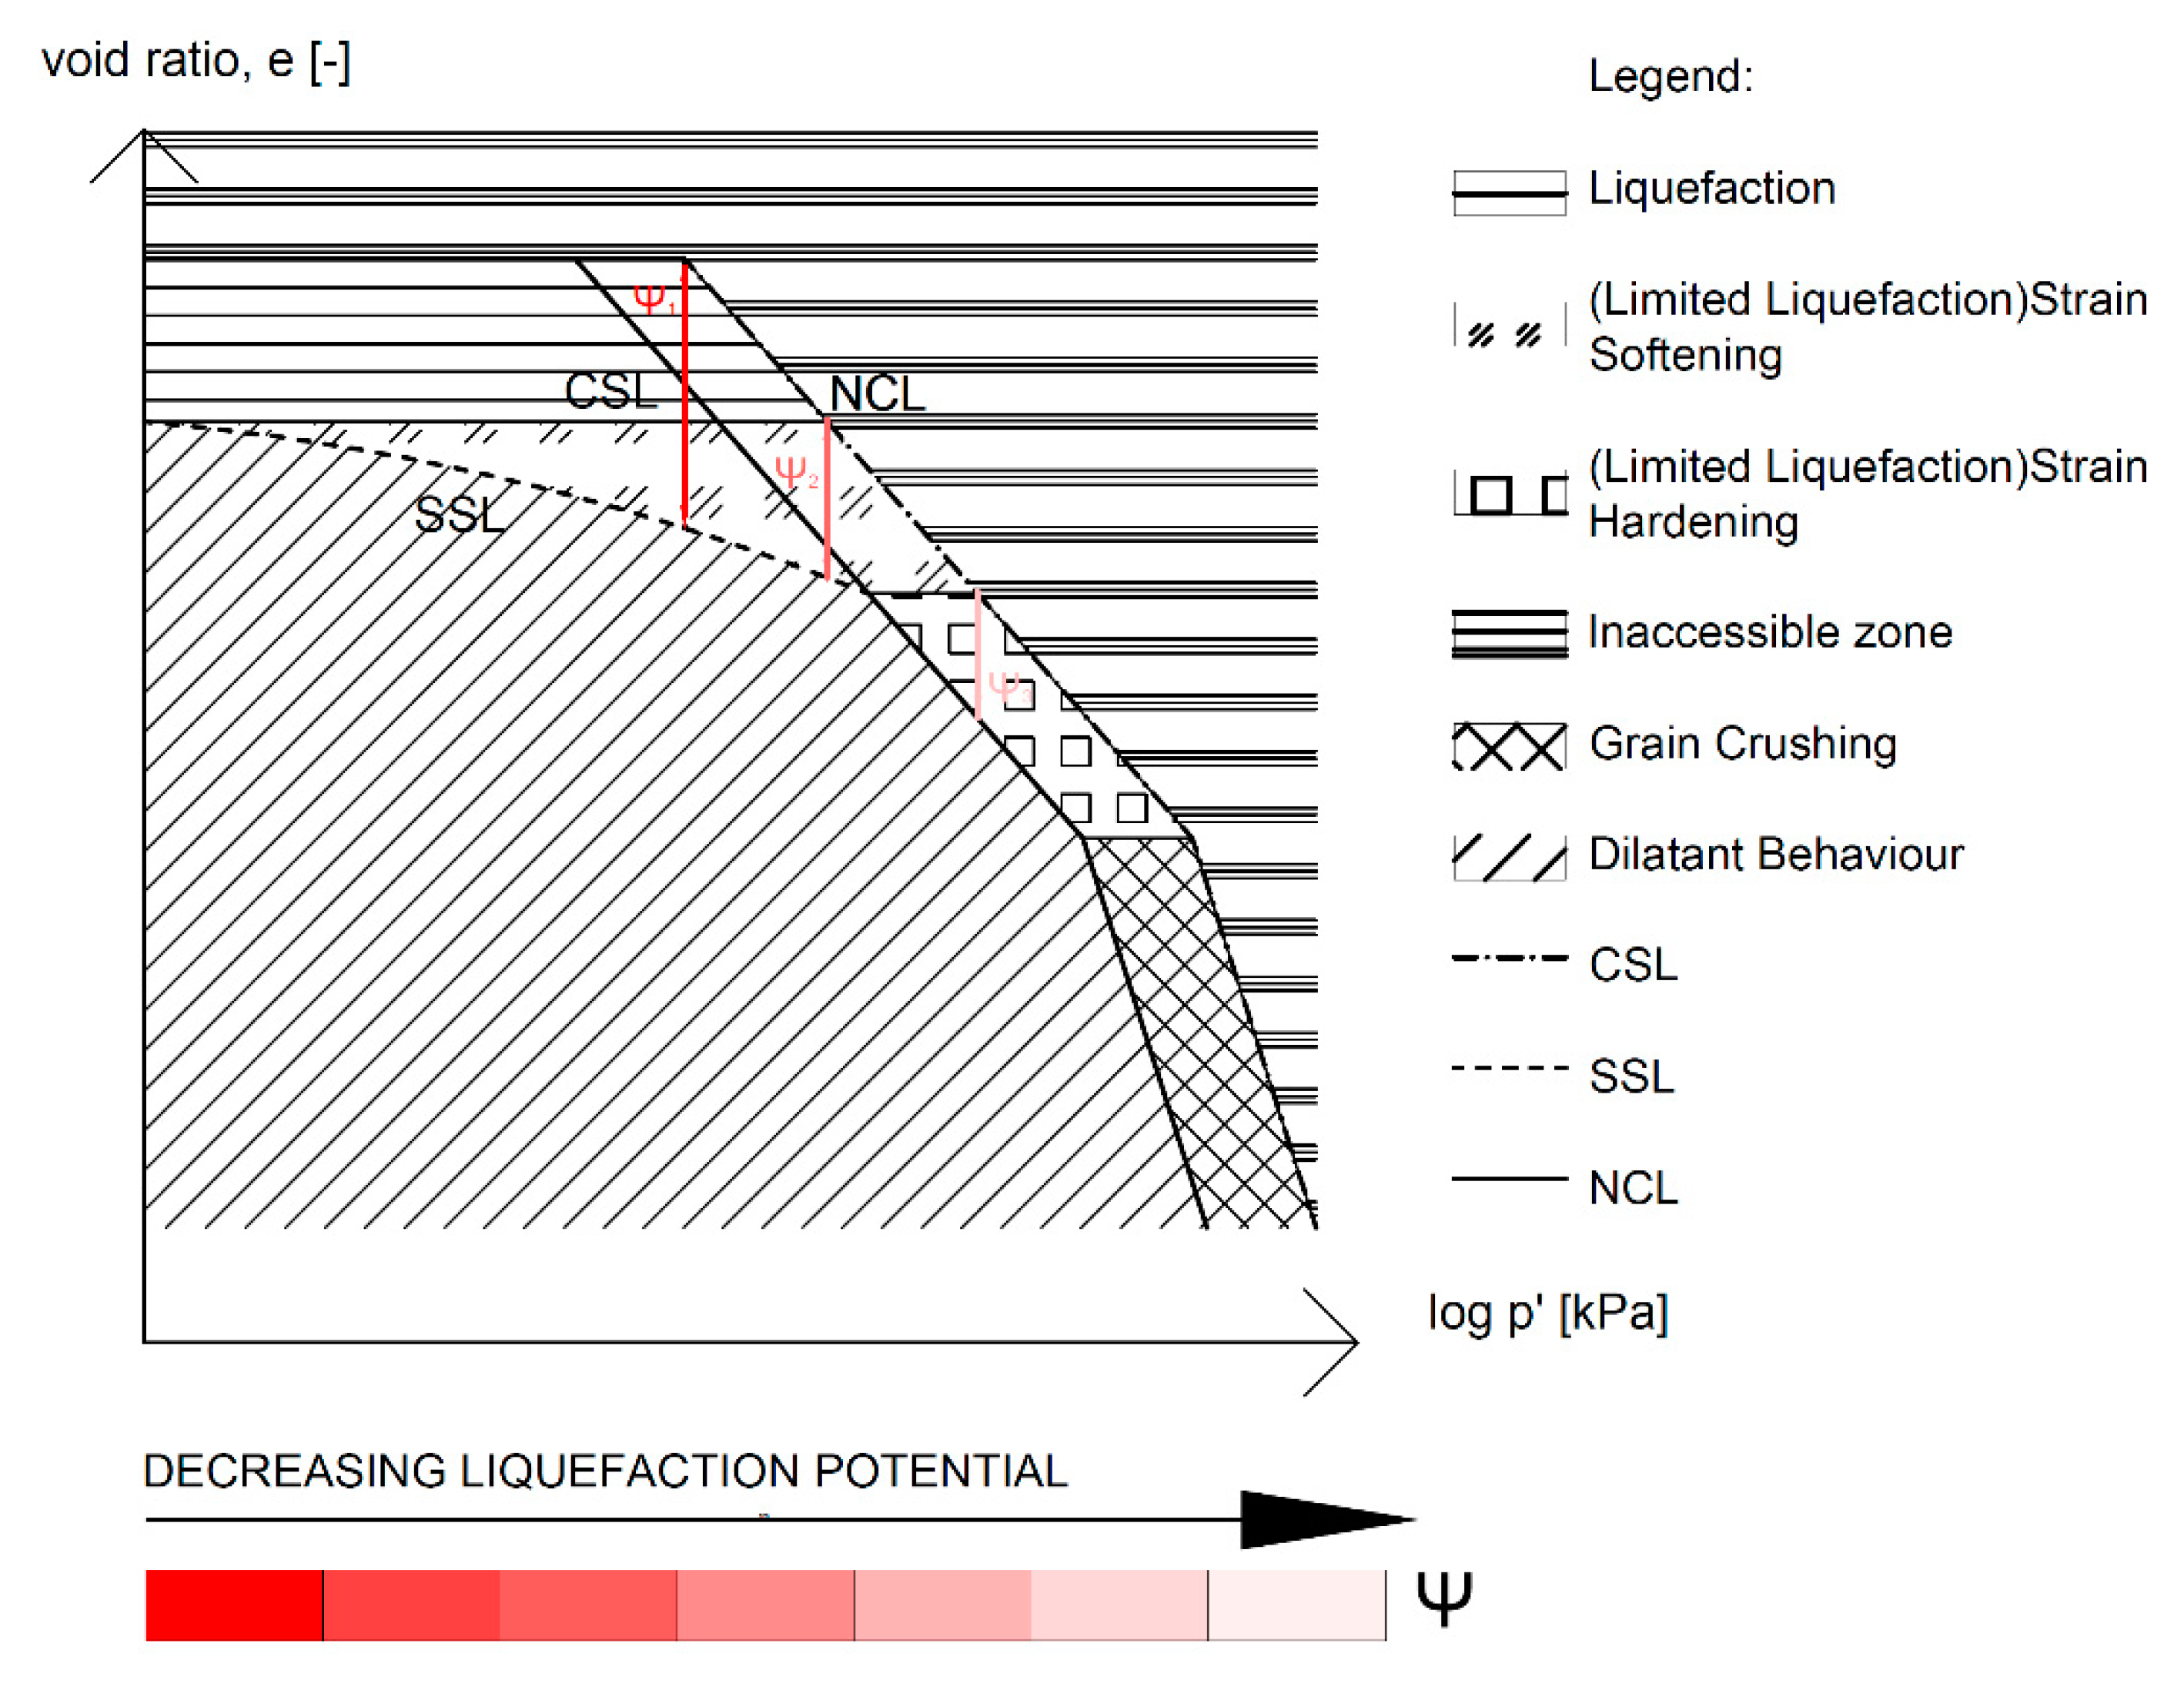
Figure 10.
Critical and Steady State lines of the silt (Soares and Viana da Fonseca, 2016).
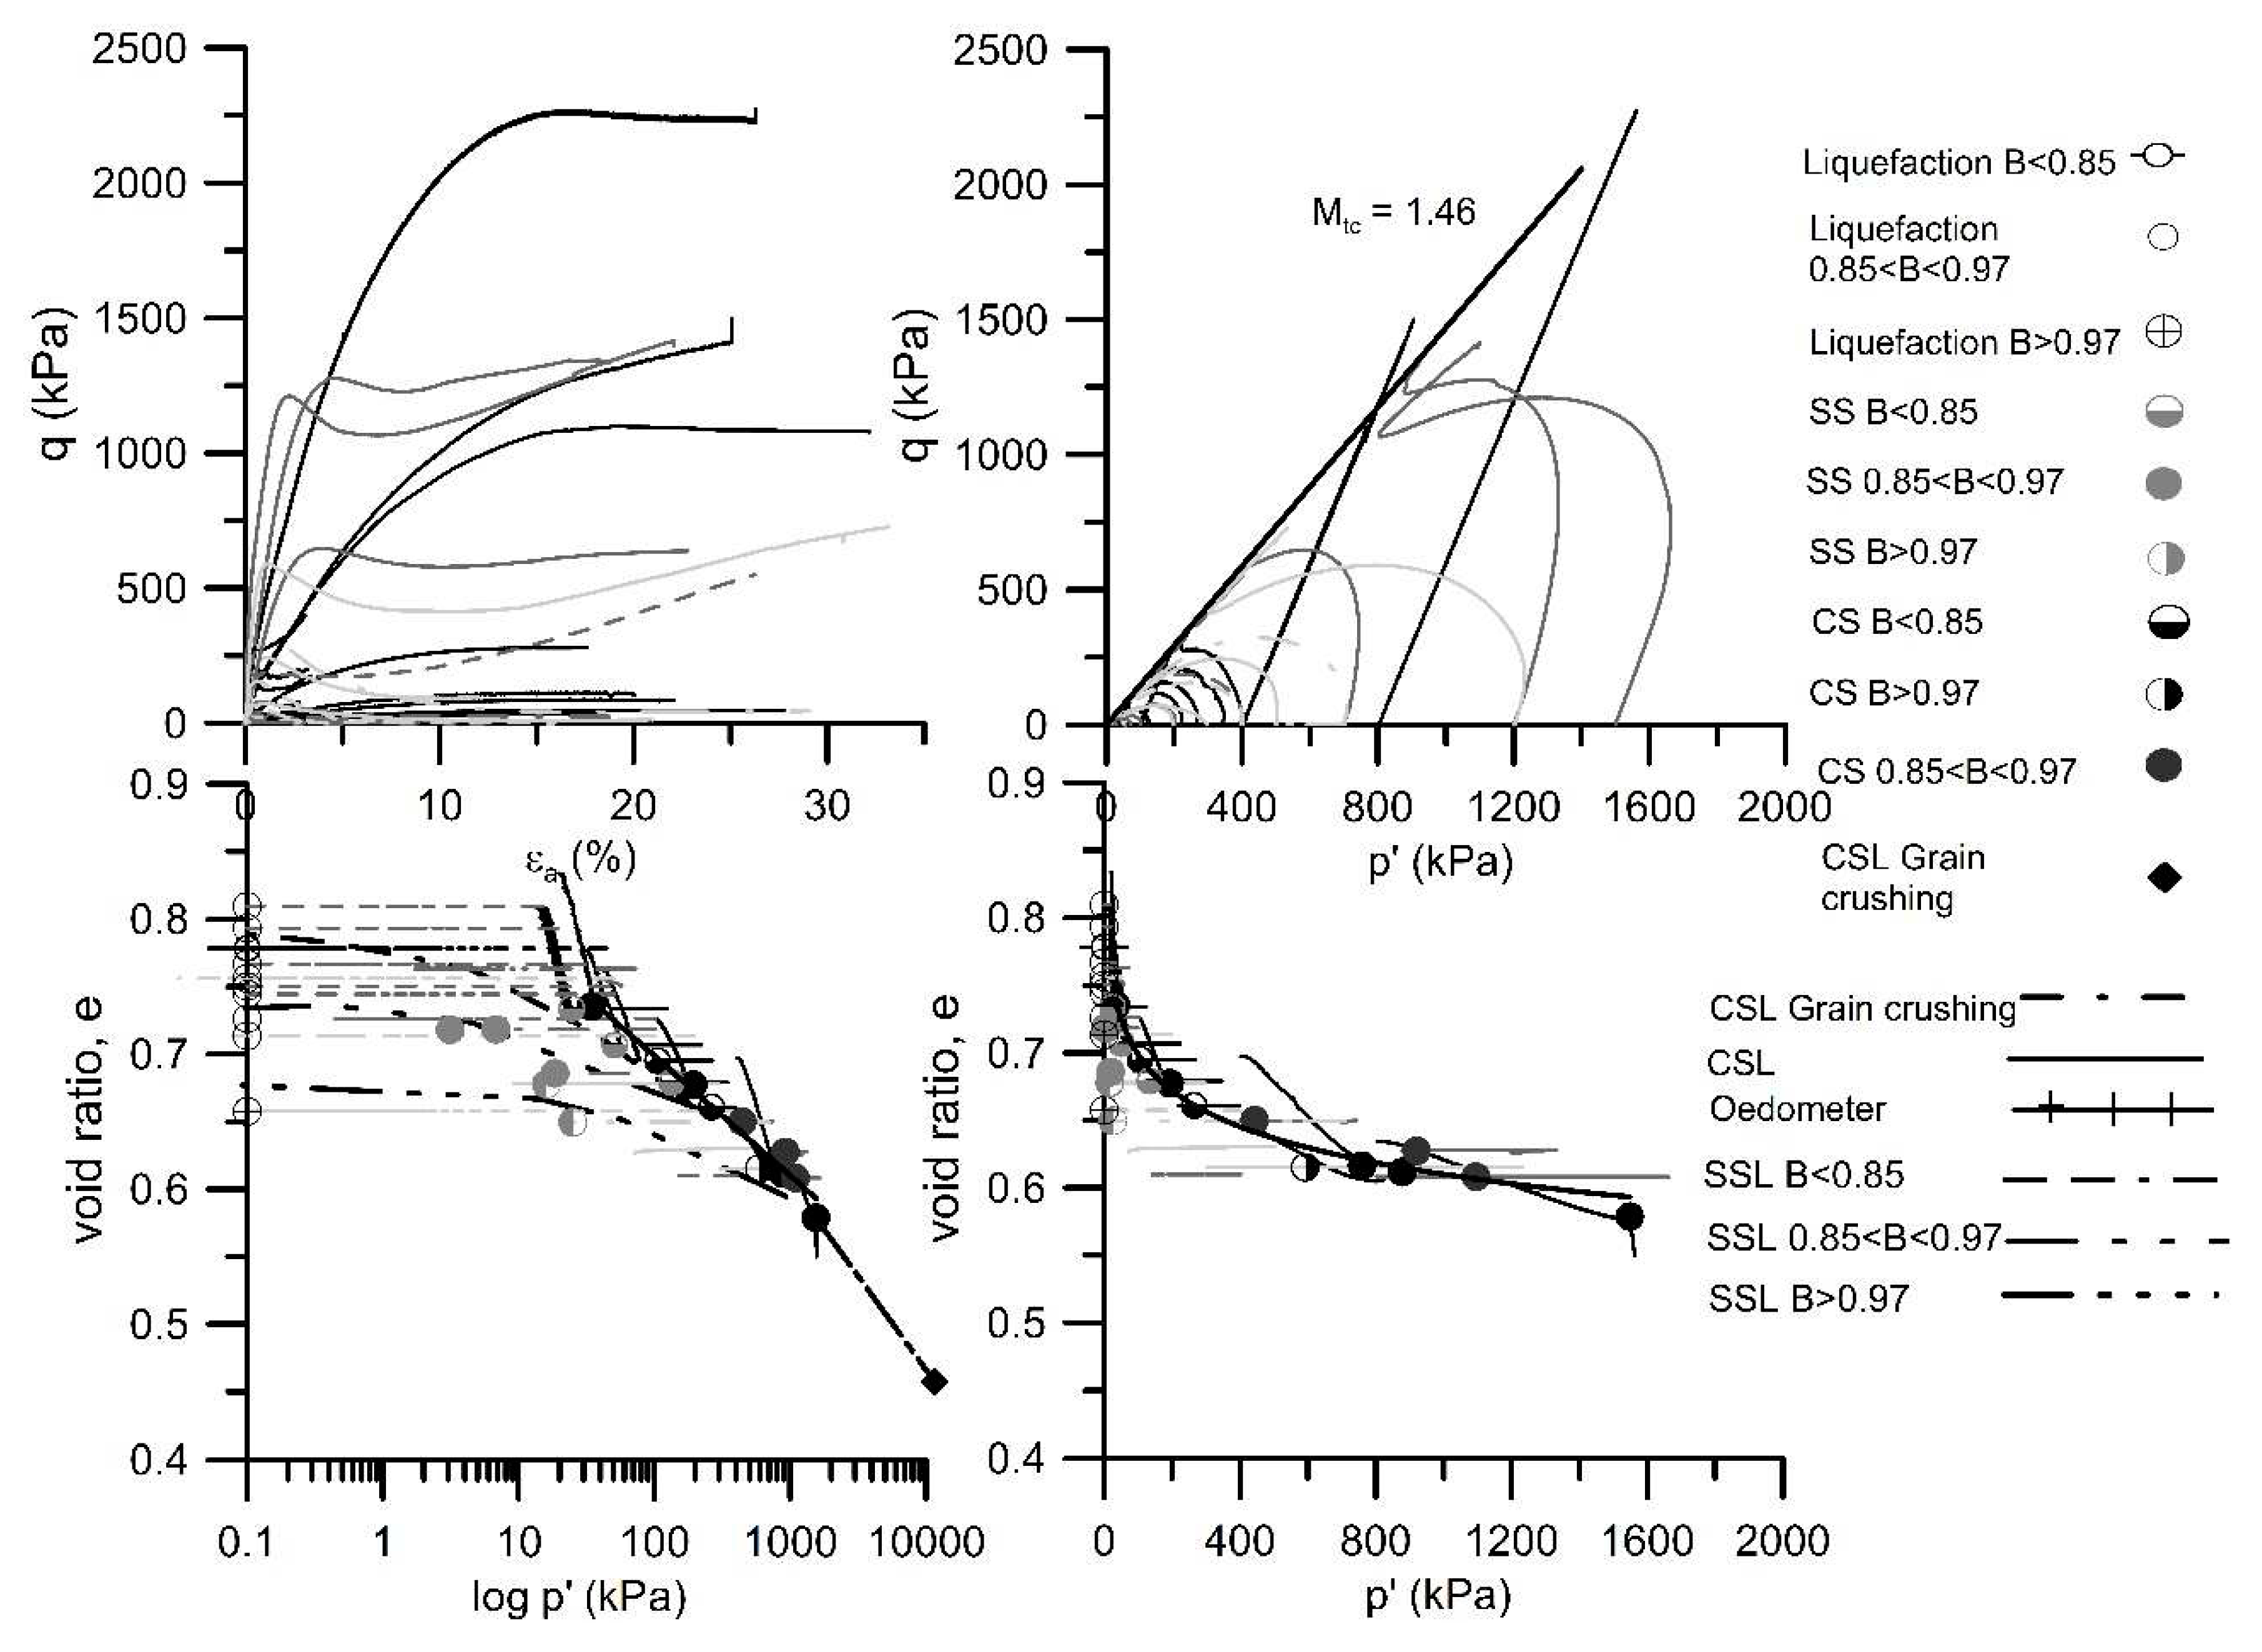
Figure 11.
Critical and Steady State lines of the mixture (Soares and Viana da Fonseca, 2017).
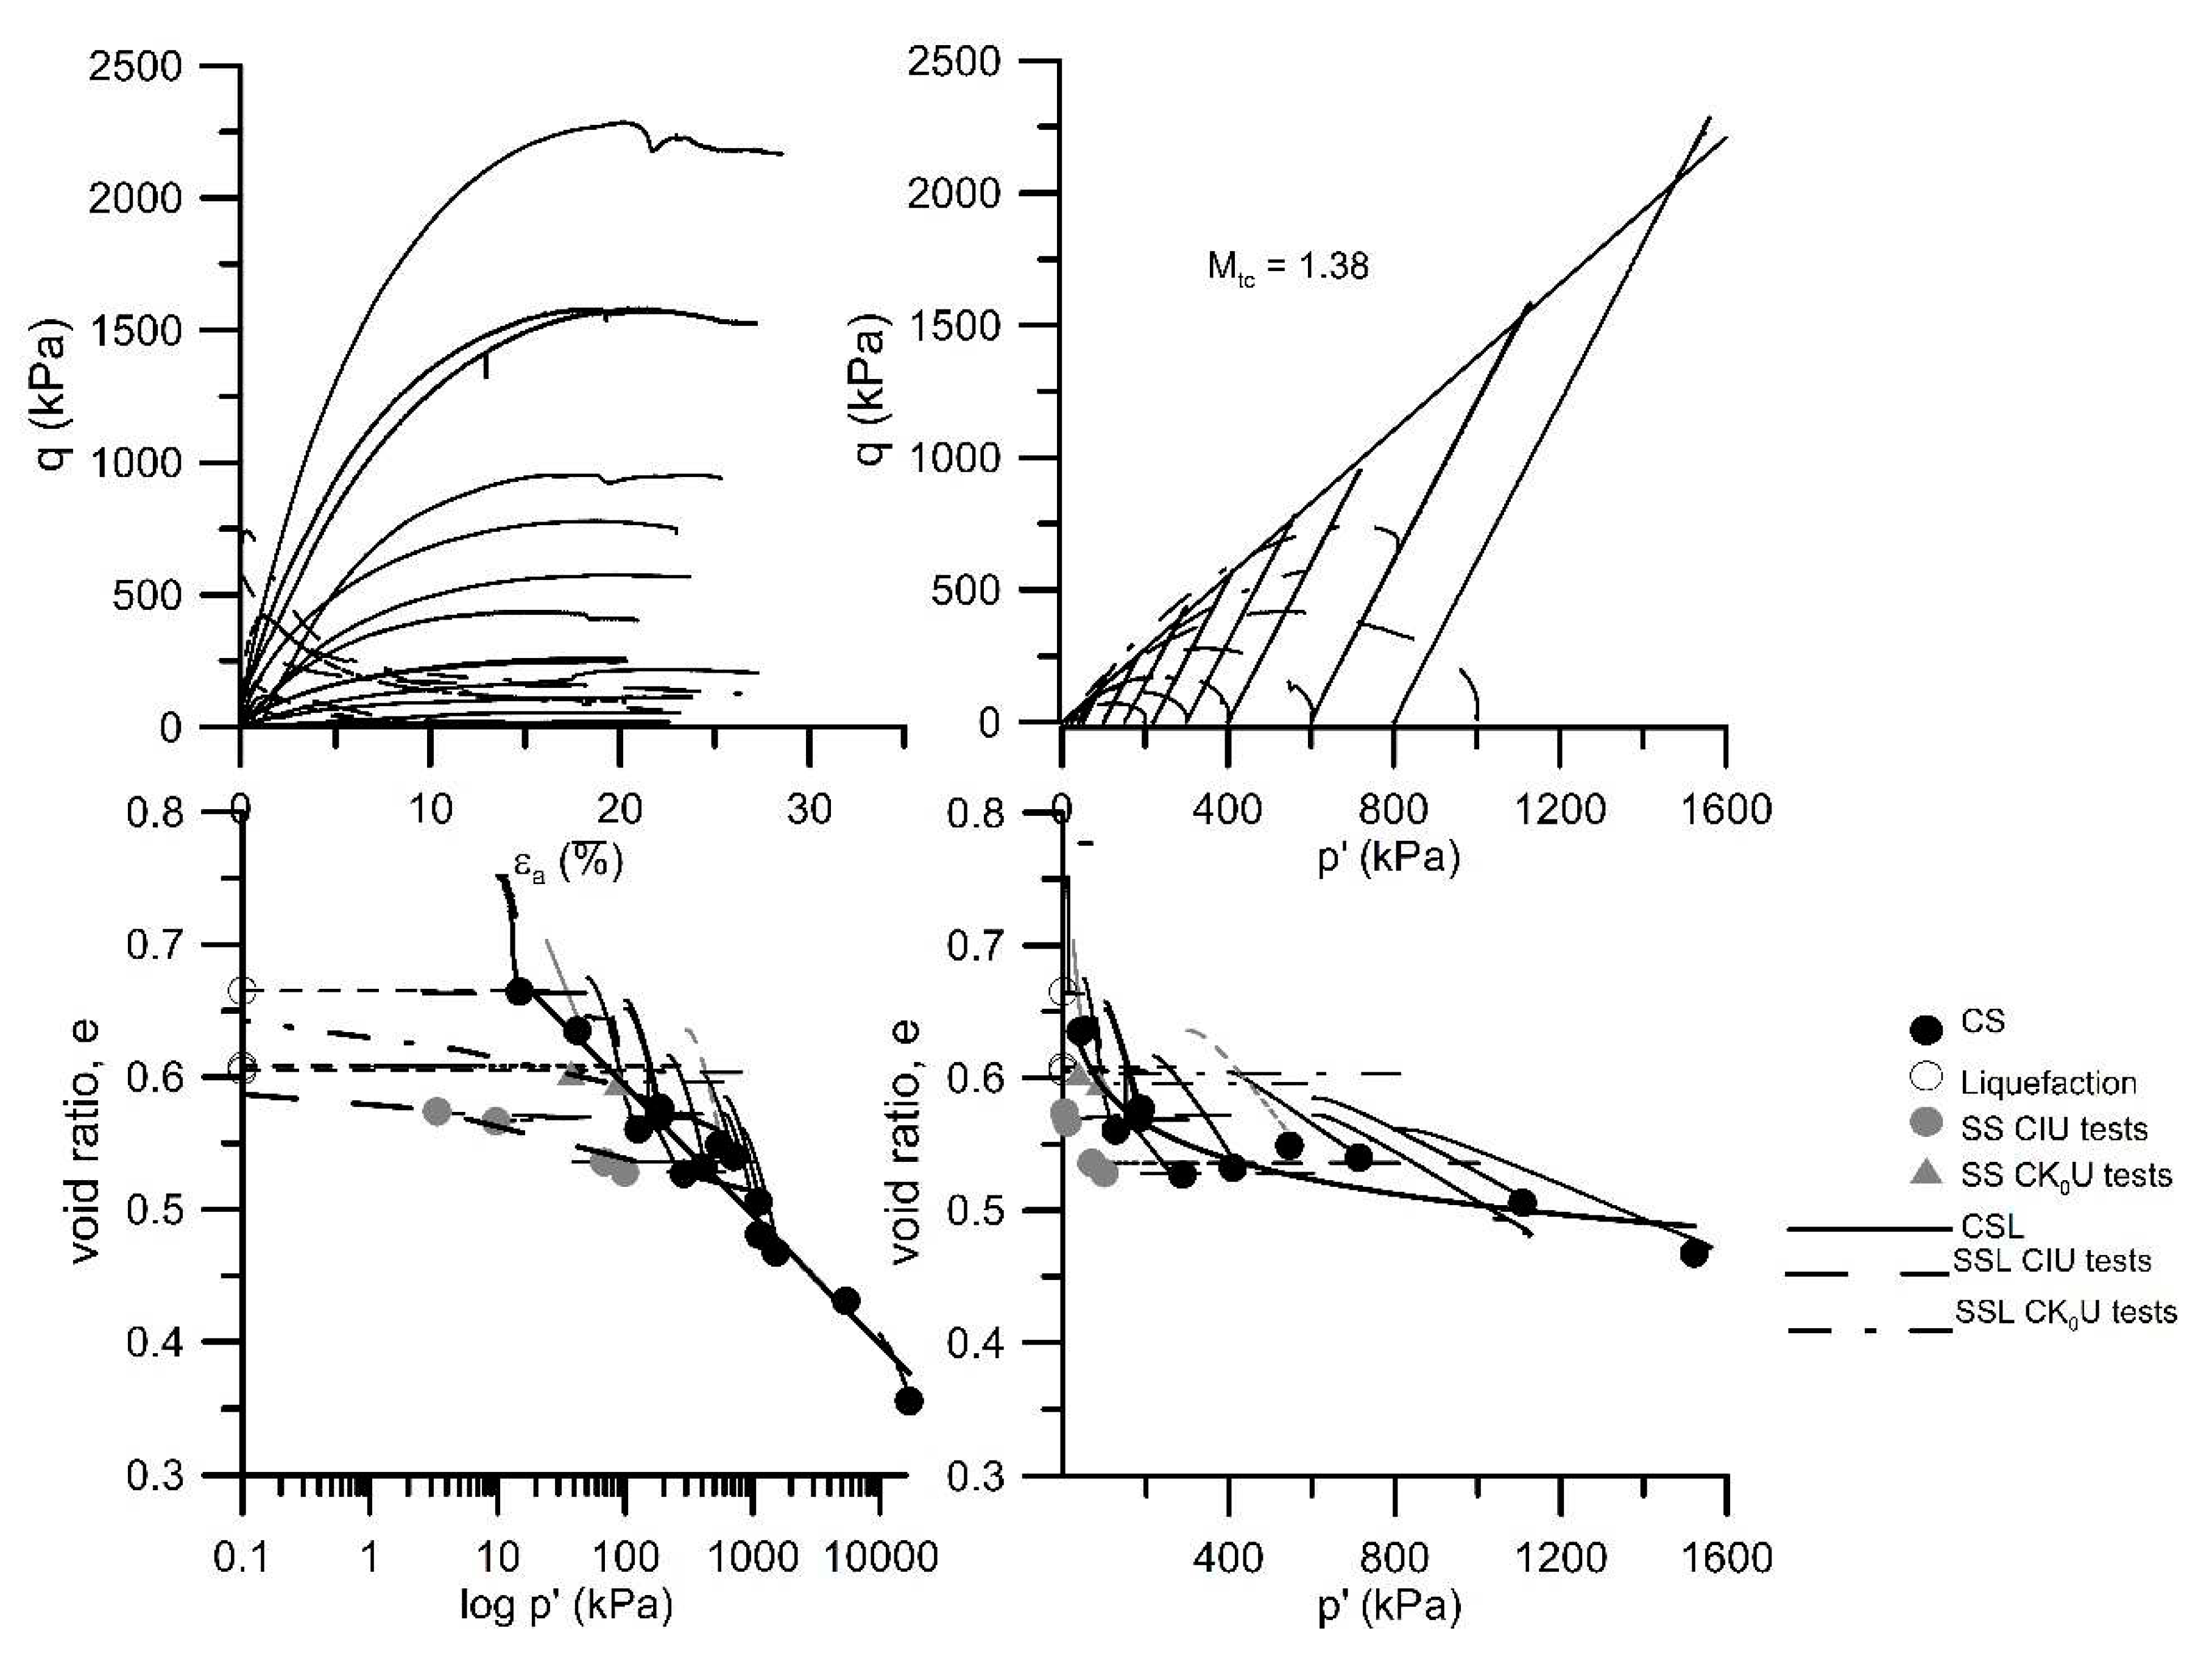
Figure 12.
Critical state and steady states lines of Osorio sand.
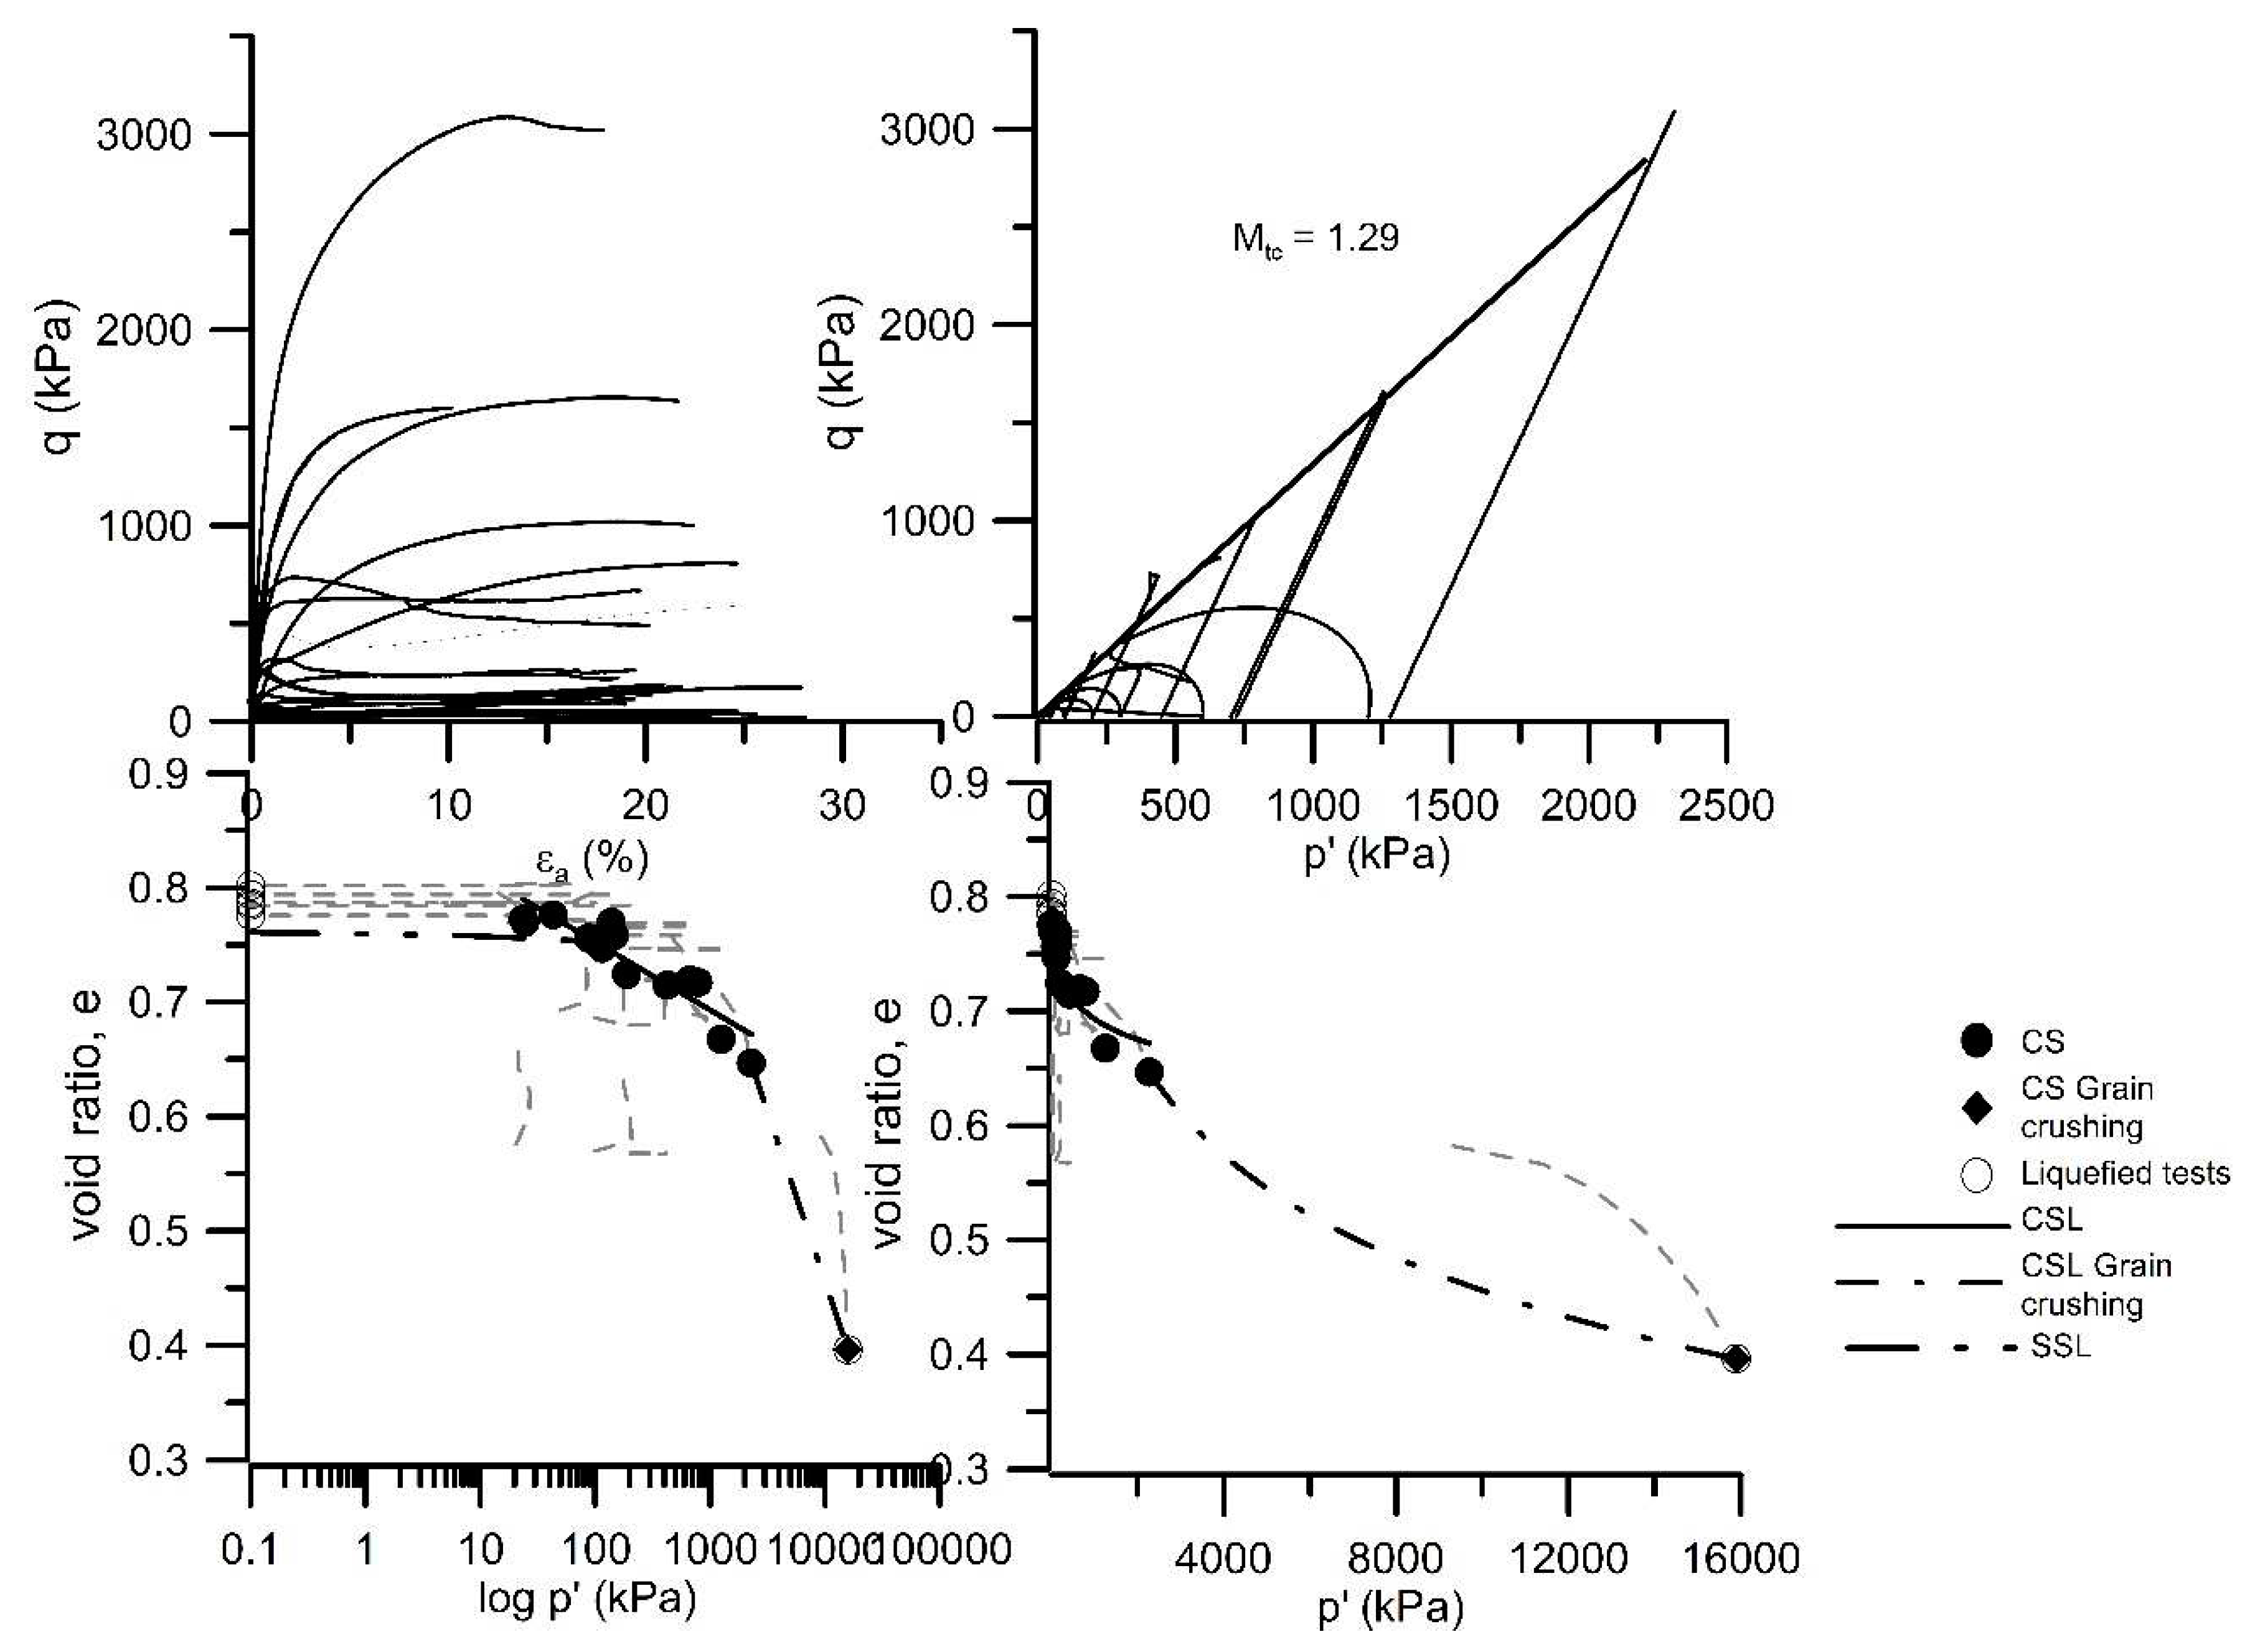
Figure 13.
Instability line of all soils on a log-log scale.
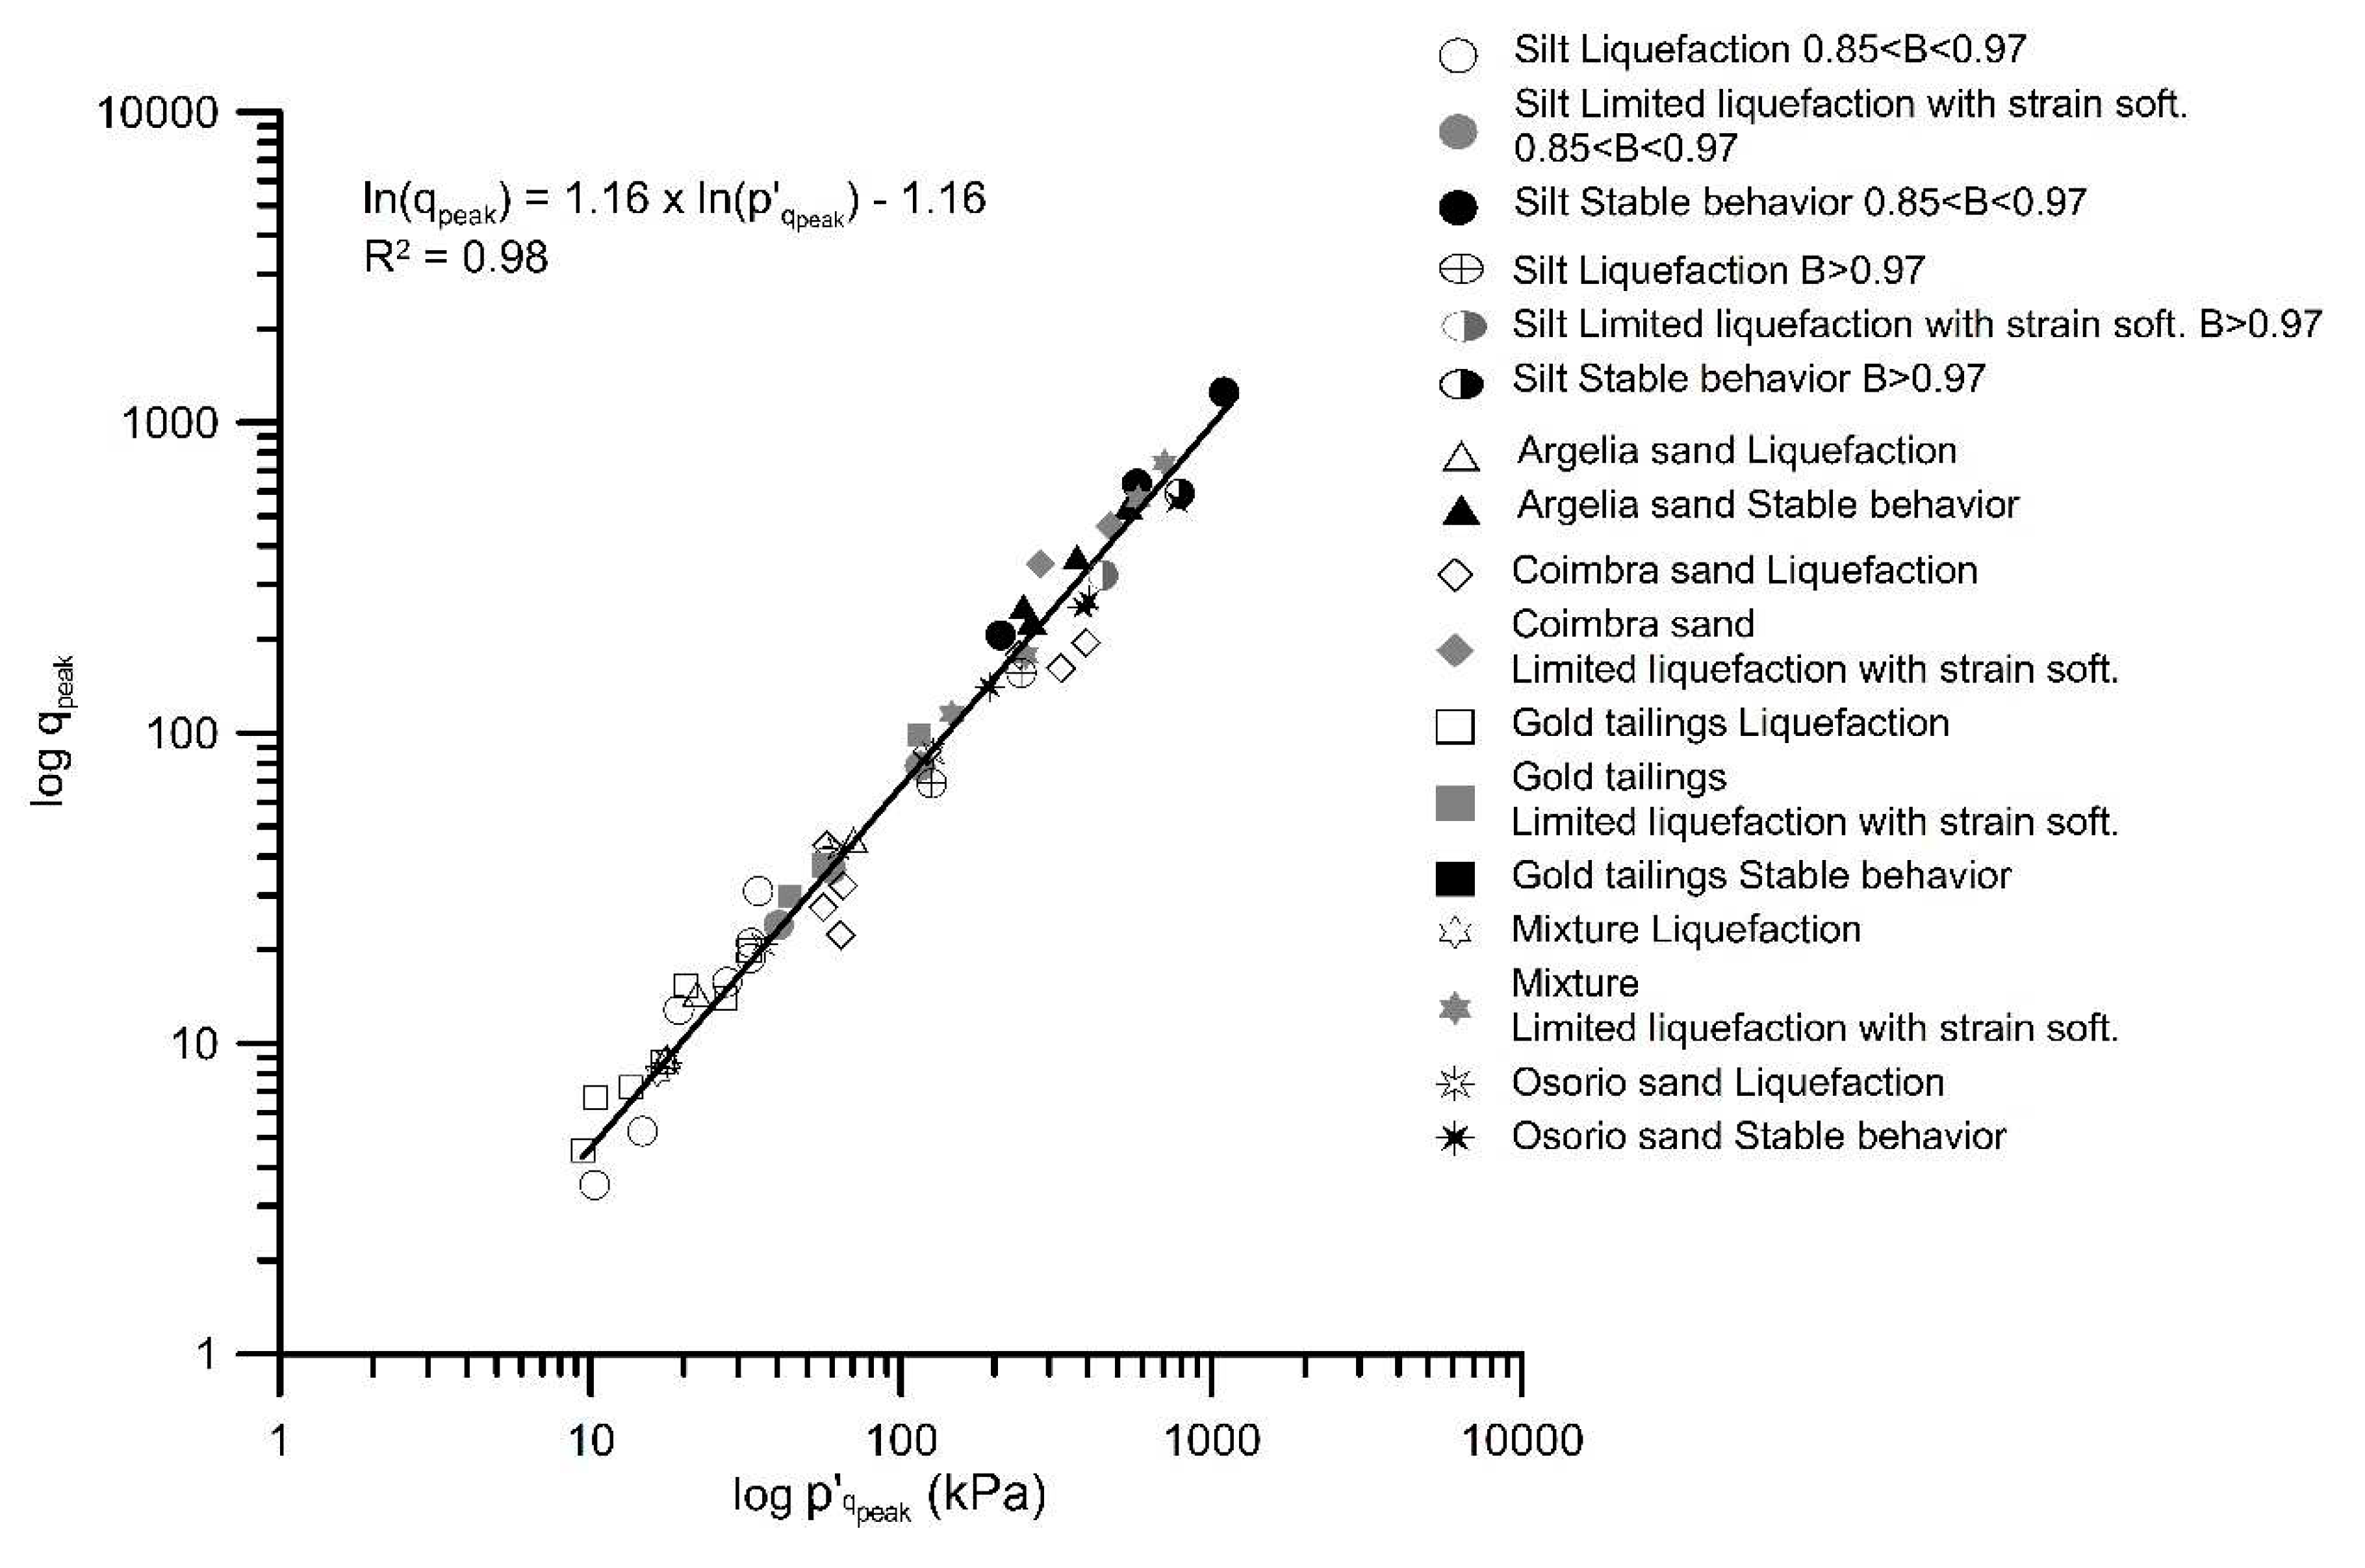
Figure 14.
Correlation between the normalized peak undrained deviatoric stress and the ratio between shear wave velocity and peak undrained deviatoric stress.
Figure 14.
Correlation between the normalized peak undrained deviatoric stress and the ratio between shear wave velocity and peak undrained deviatoric stress.
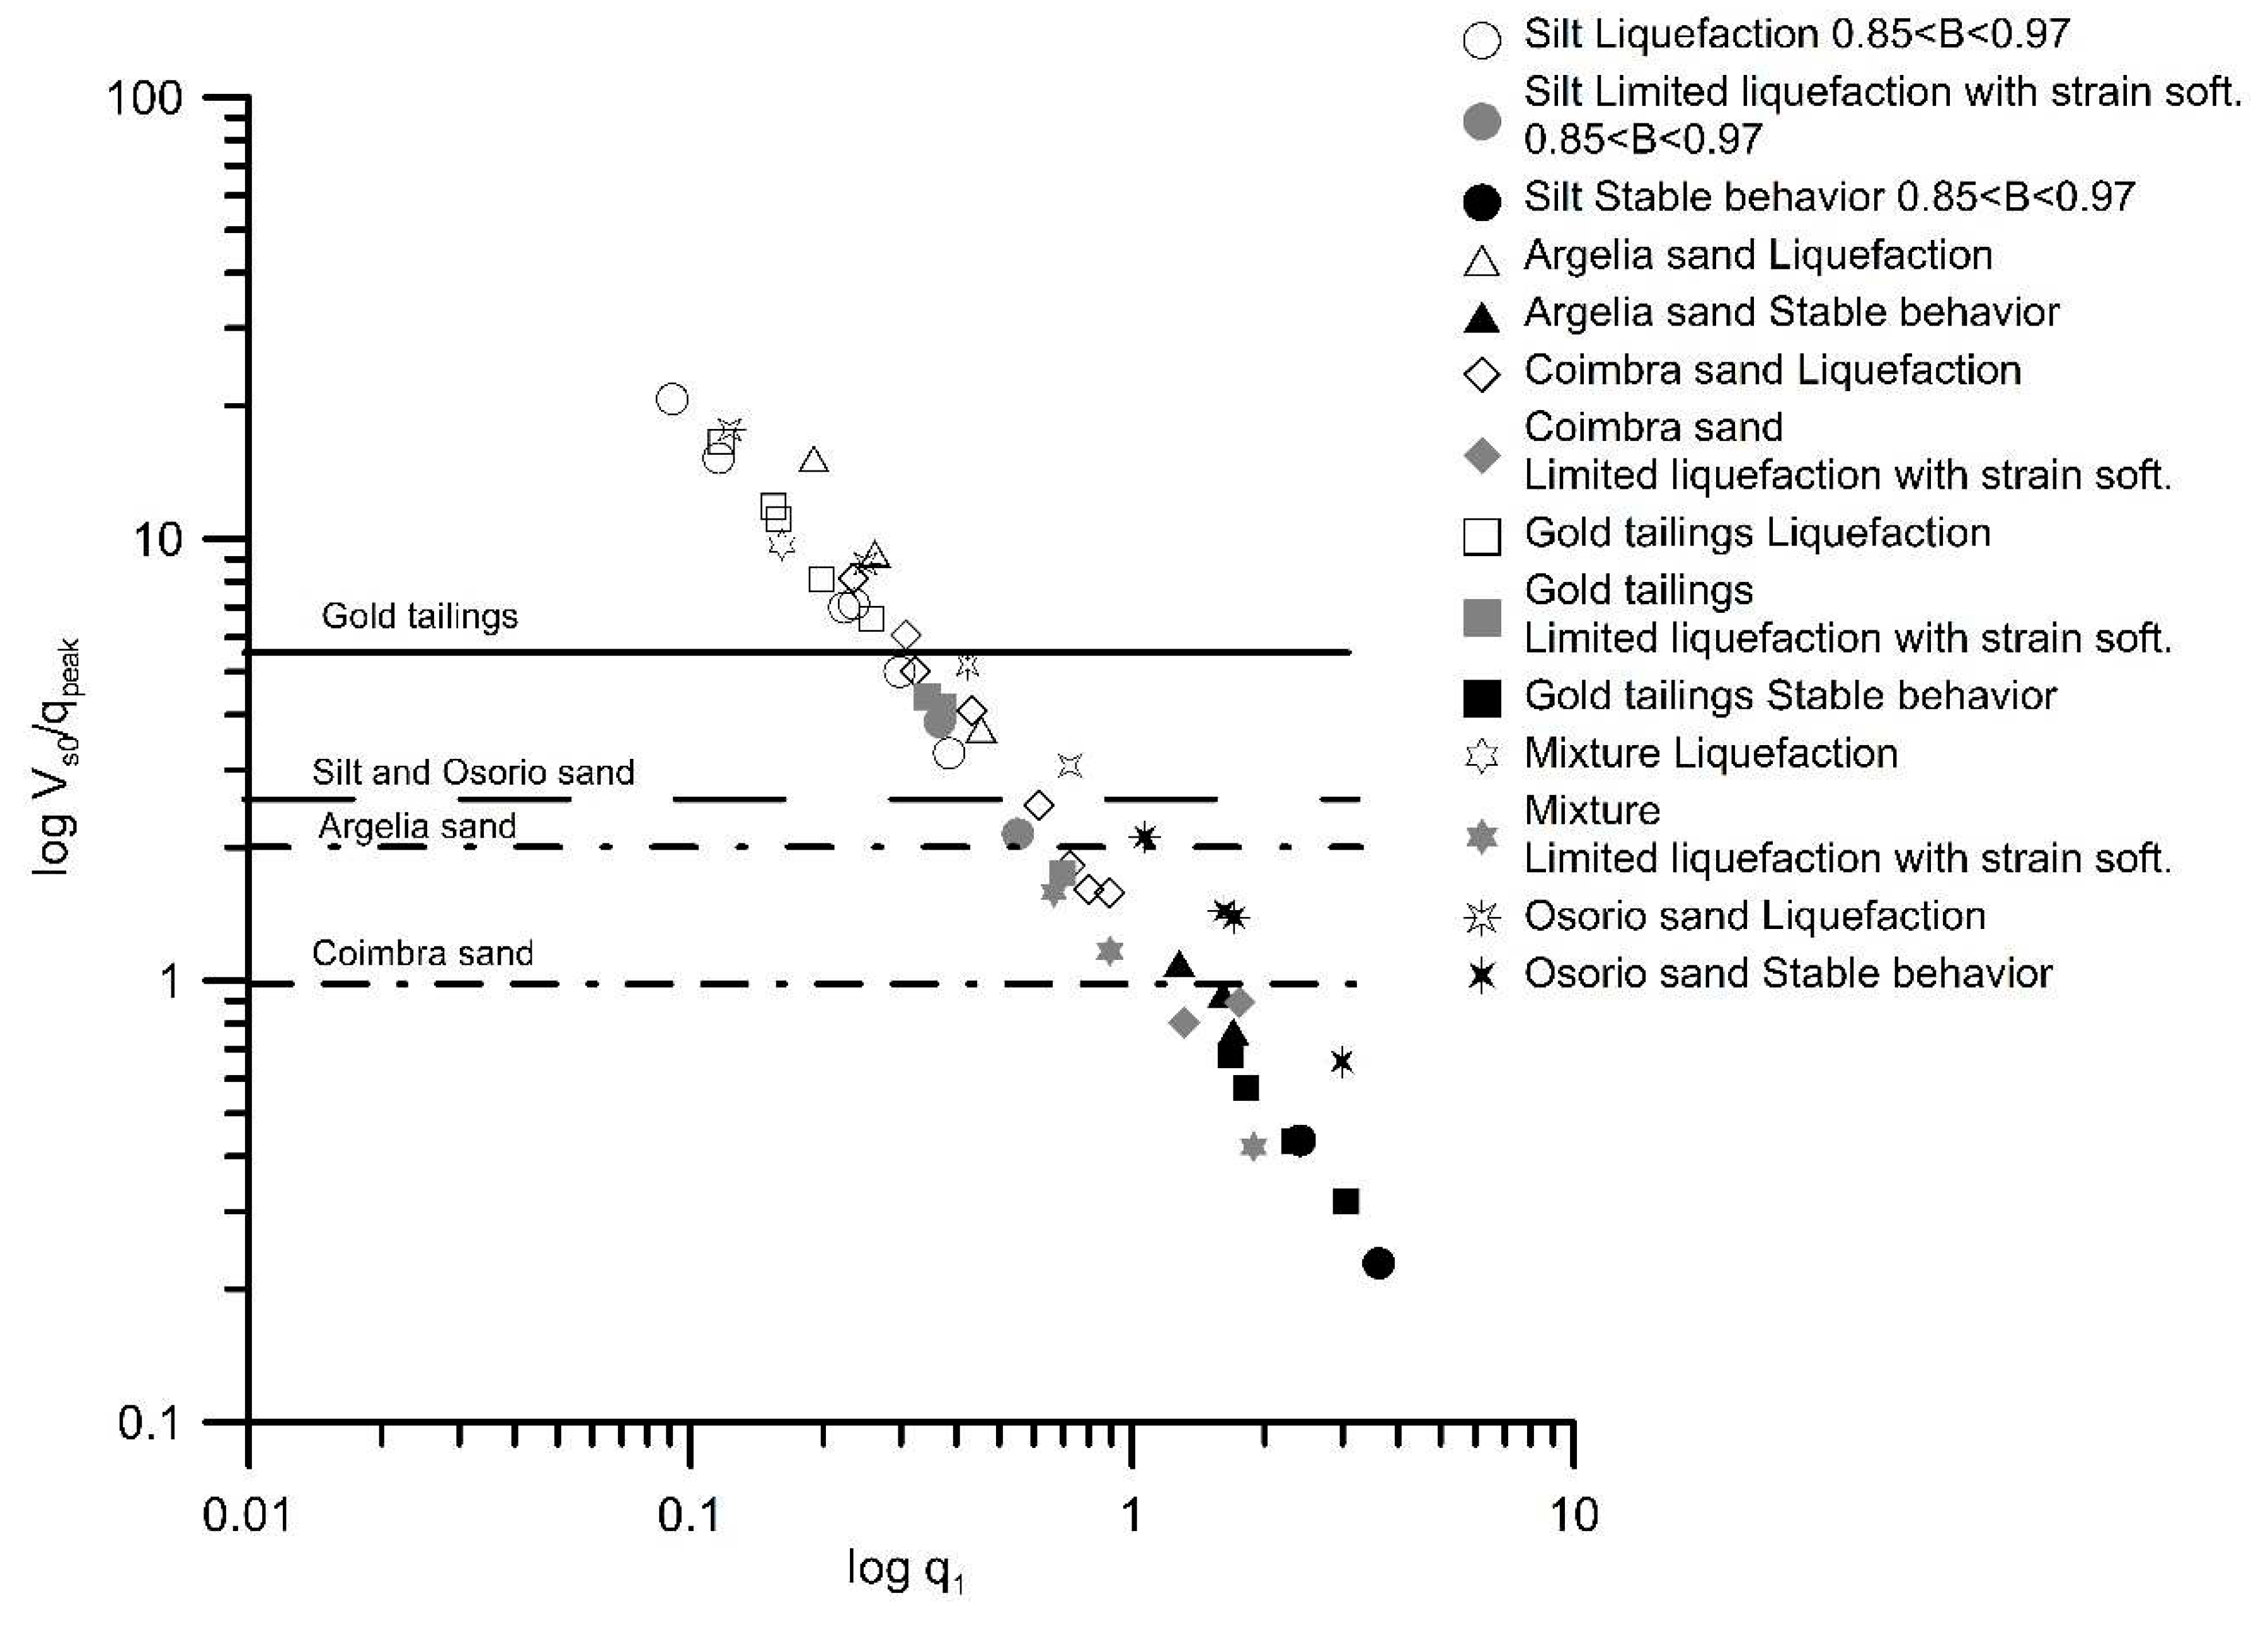
Figure 15.
Peak undrained deviatoric stress as function of the shear wave velocity.
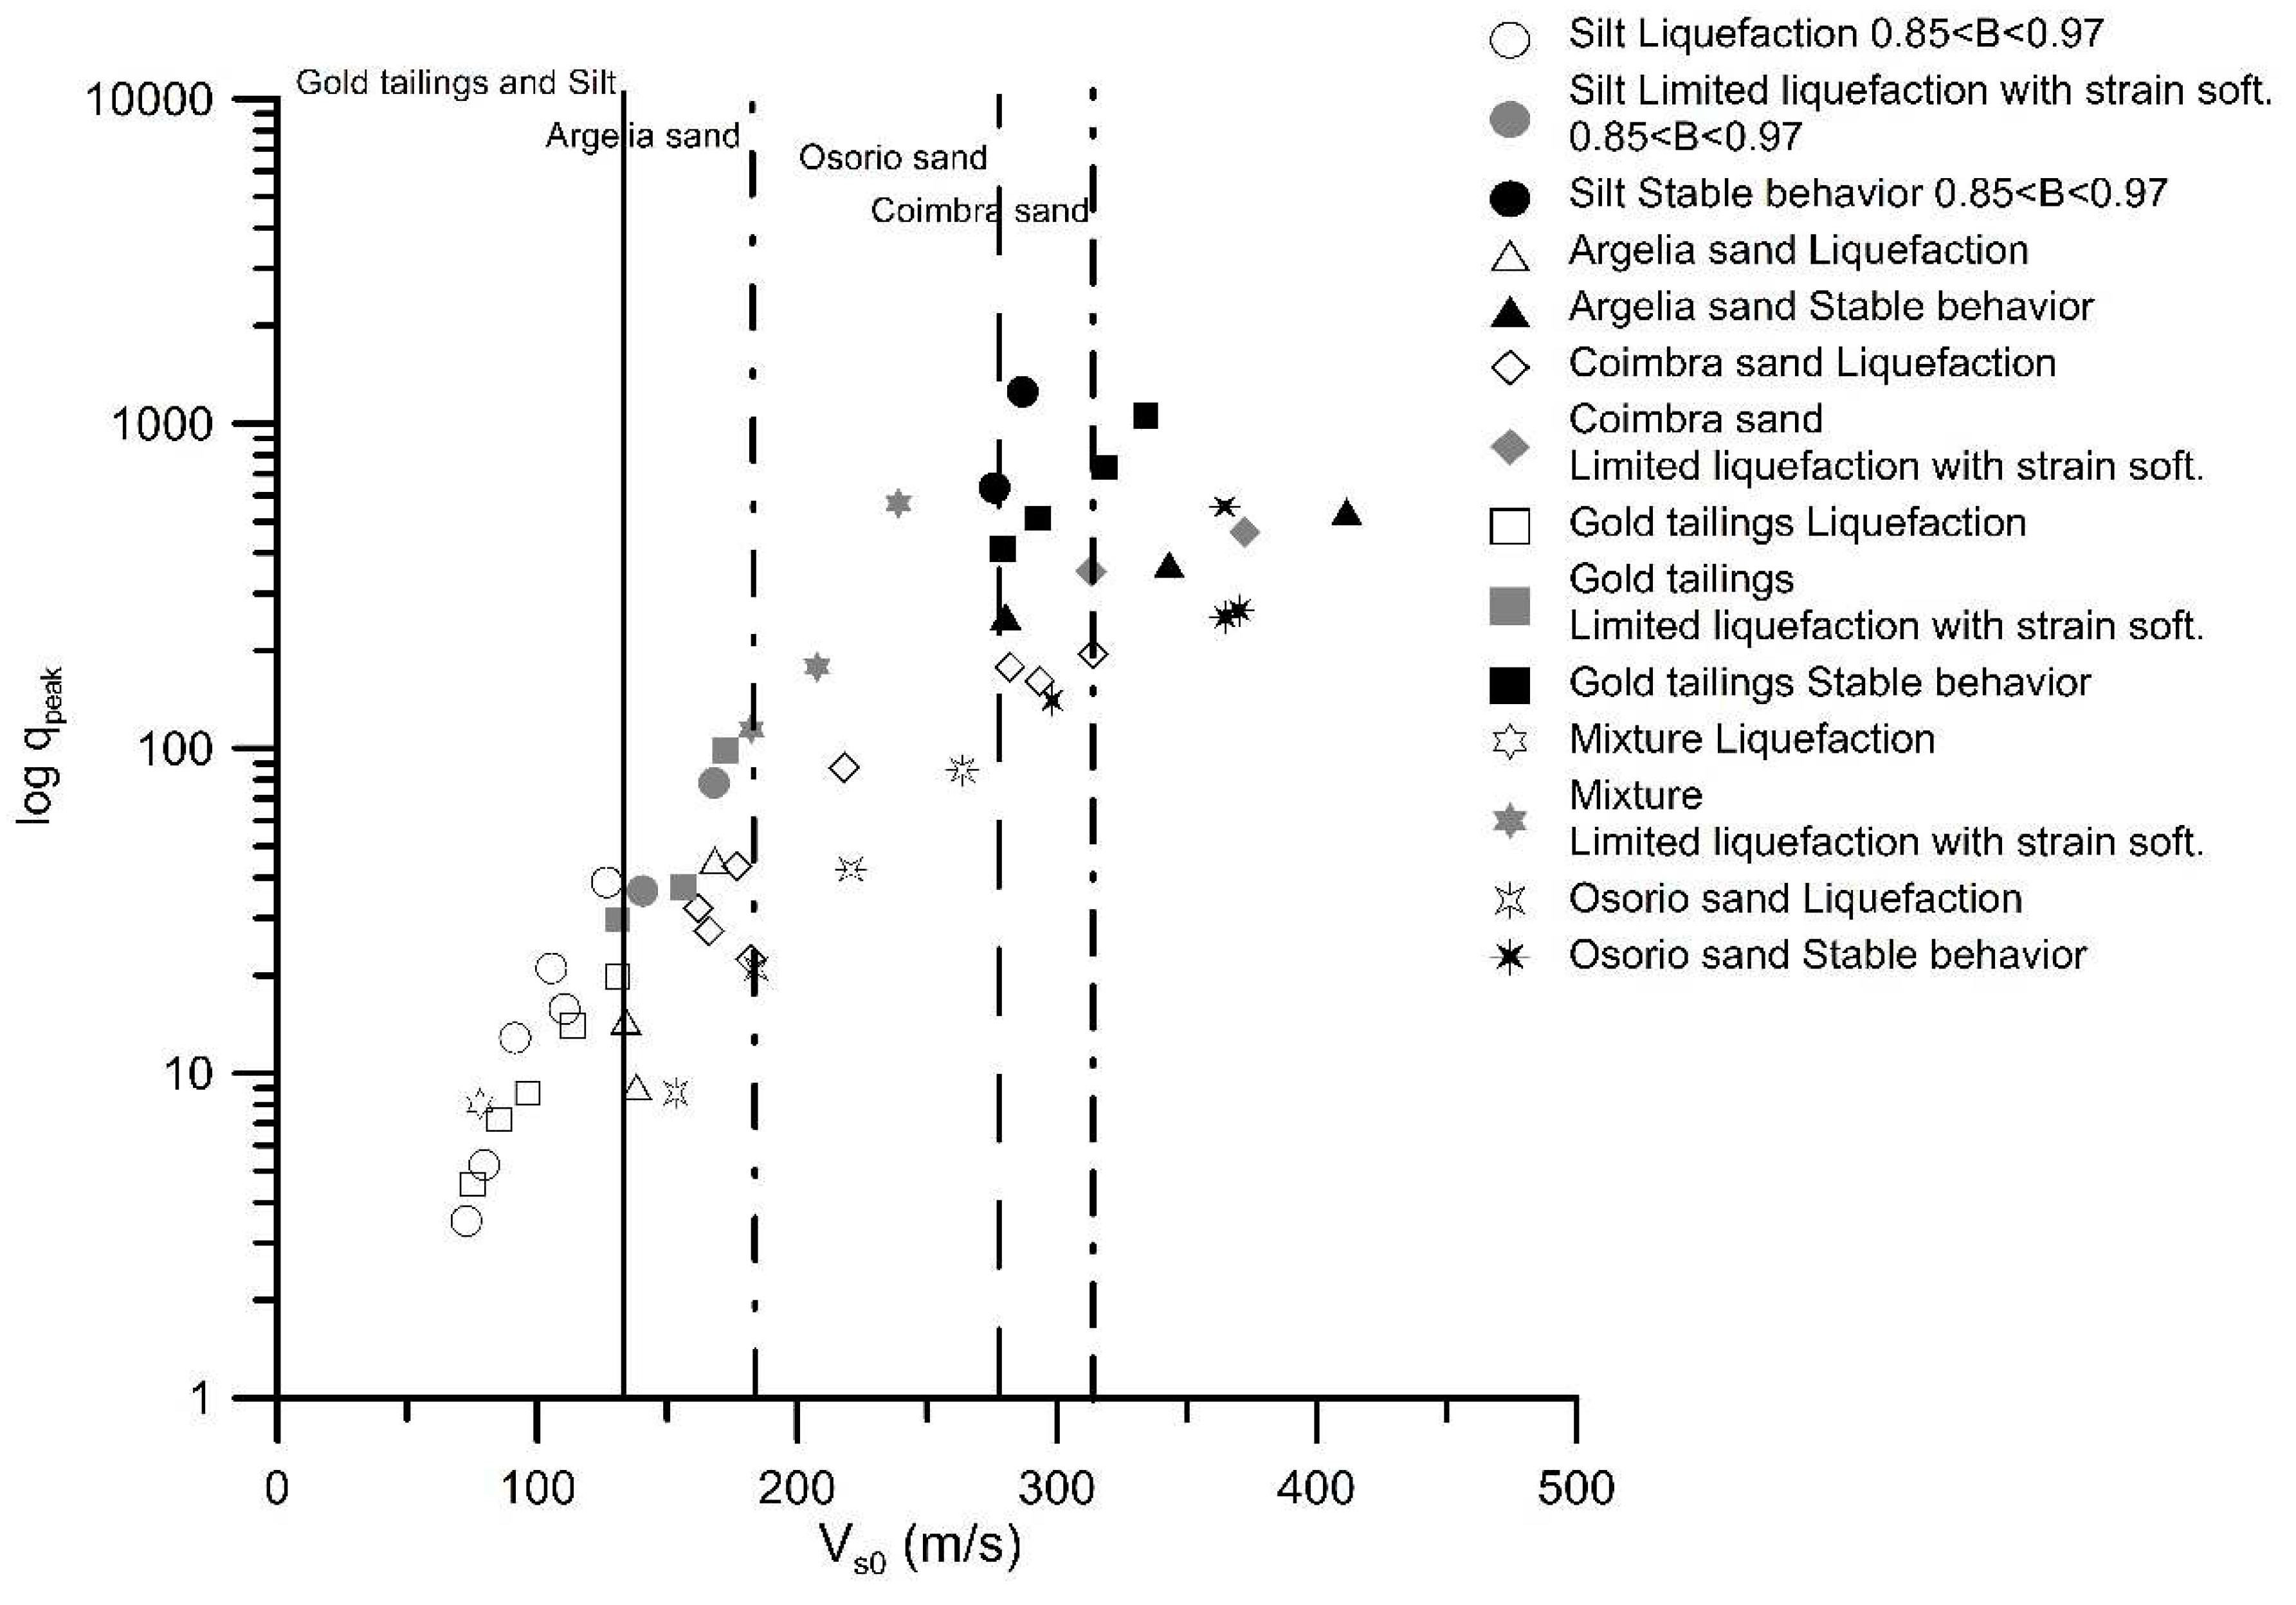
Figure 16.
Normalized peak deviatoric stress versus normalized shear wave velocity - simplified procedure to evaluate static liquefaction.
Figure 16.
Normalized peak deviatoric stress versus normalized shear wave velocity - simplified procedure to evaluate static liquefaction.
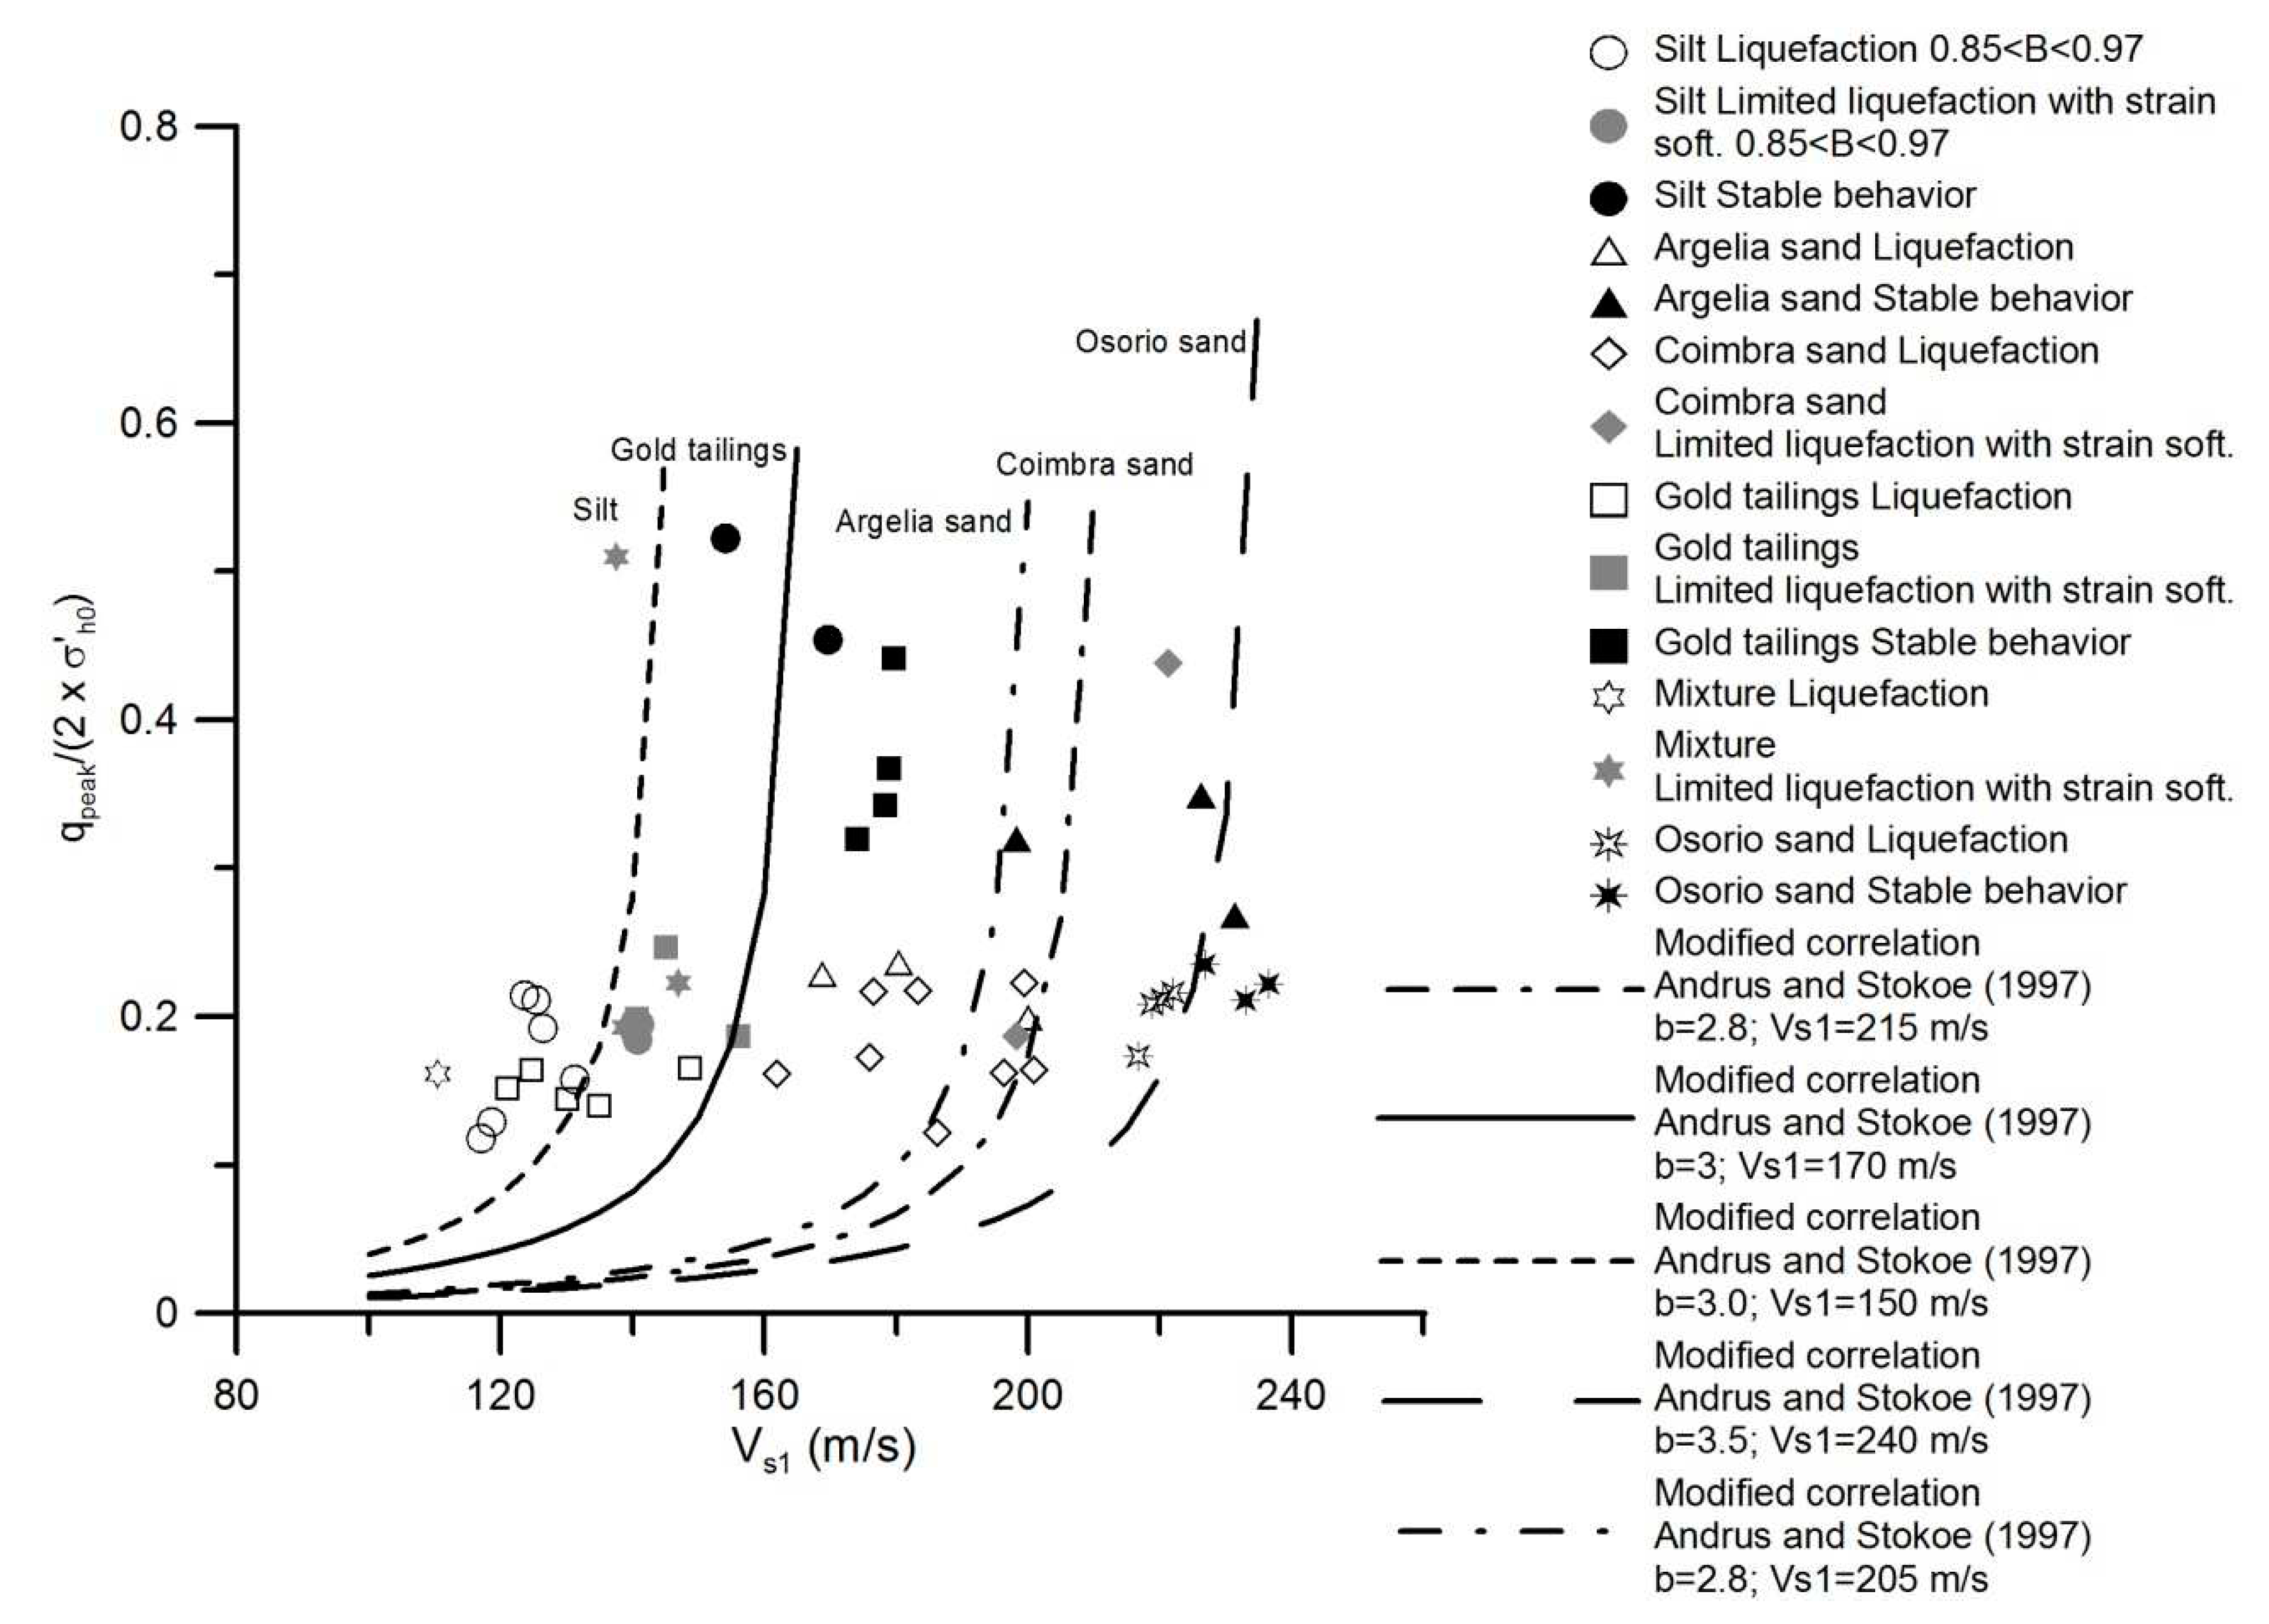
Figure 17.
Correlation between the coefficient of uniformity CU and the ratio of shear wave velocity to peak deviatoric stress (Vs0/qpeak) defining the limiting boundary between strain softening and strain hardening behavior.
Figure 17.
Correlation between the coefficient of uniformity CU and the ratio of shear wave velocity to peak deviatoric stress (Vs0/qpeak) defining the limiting boundary between strain softening and strain hardening behavior.
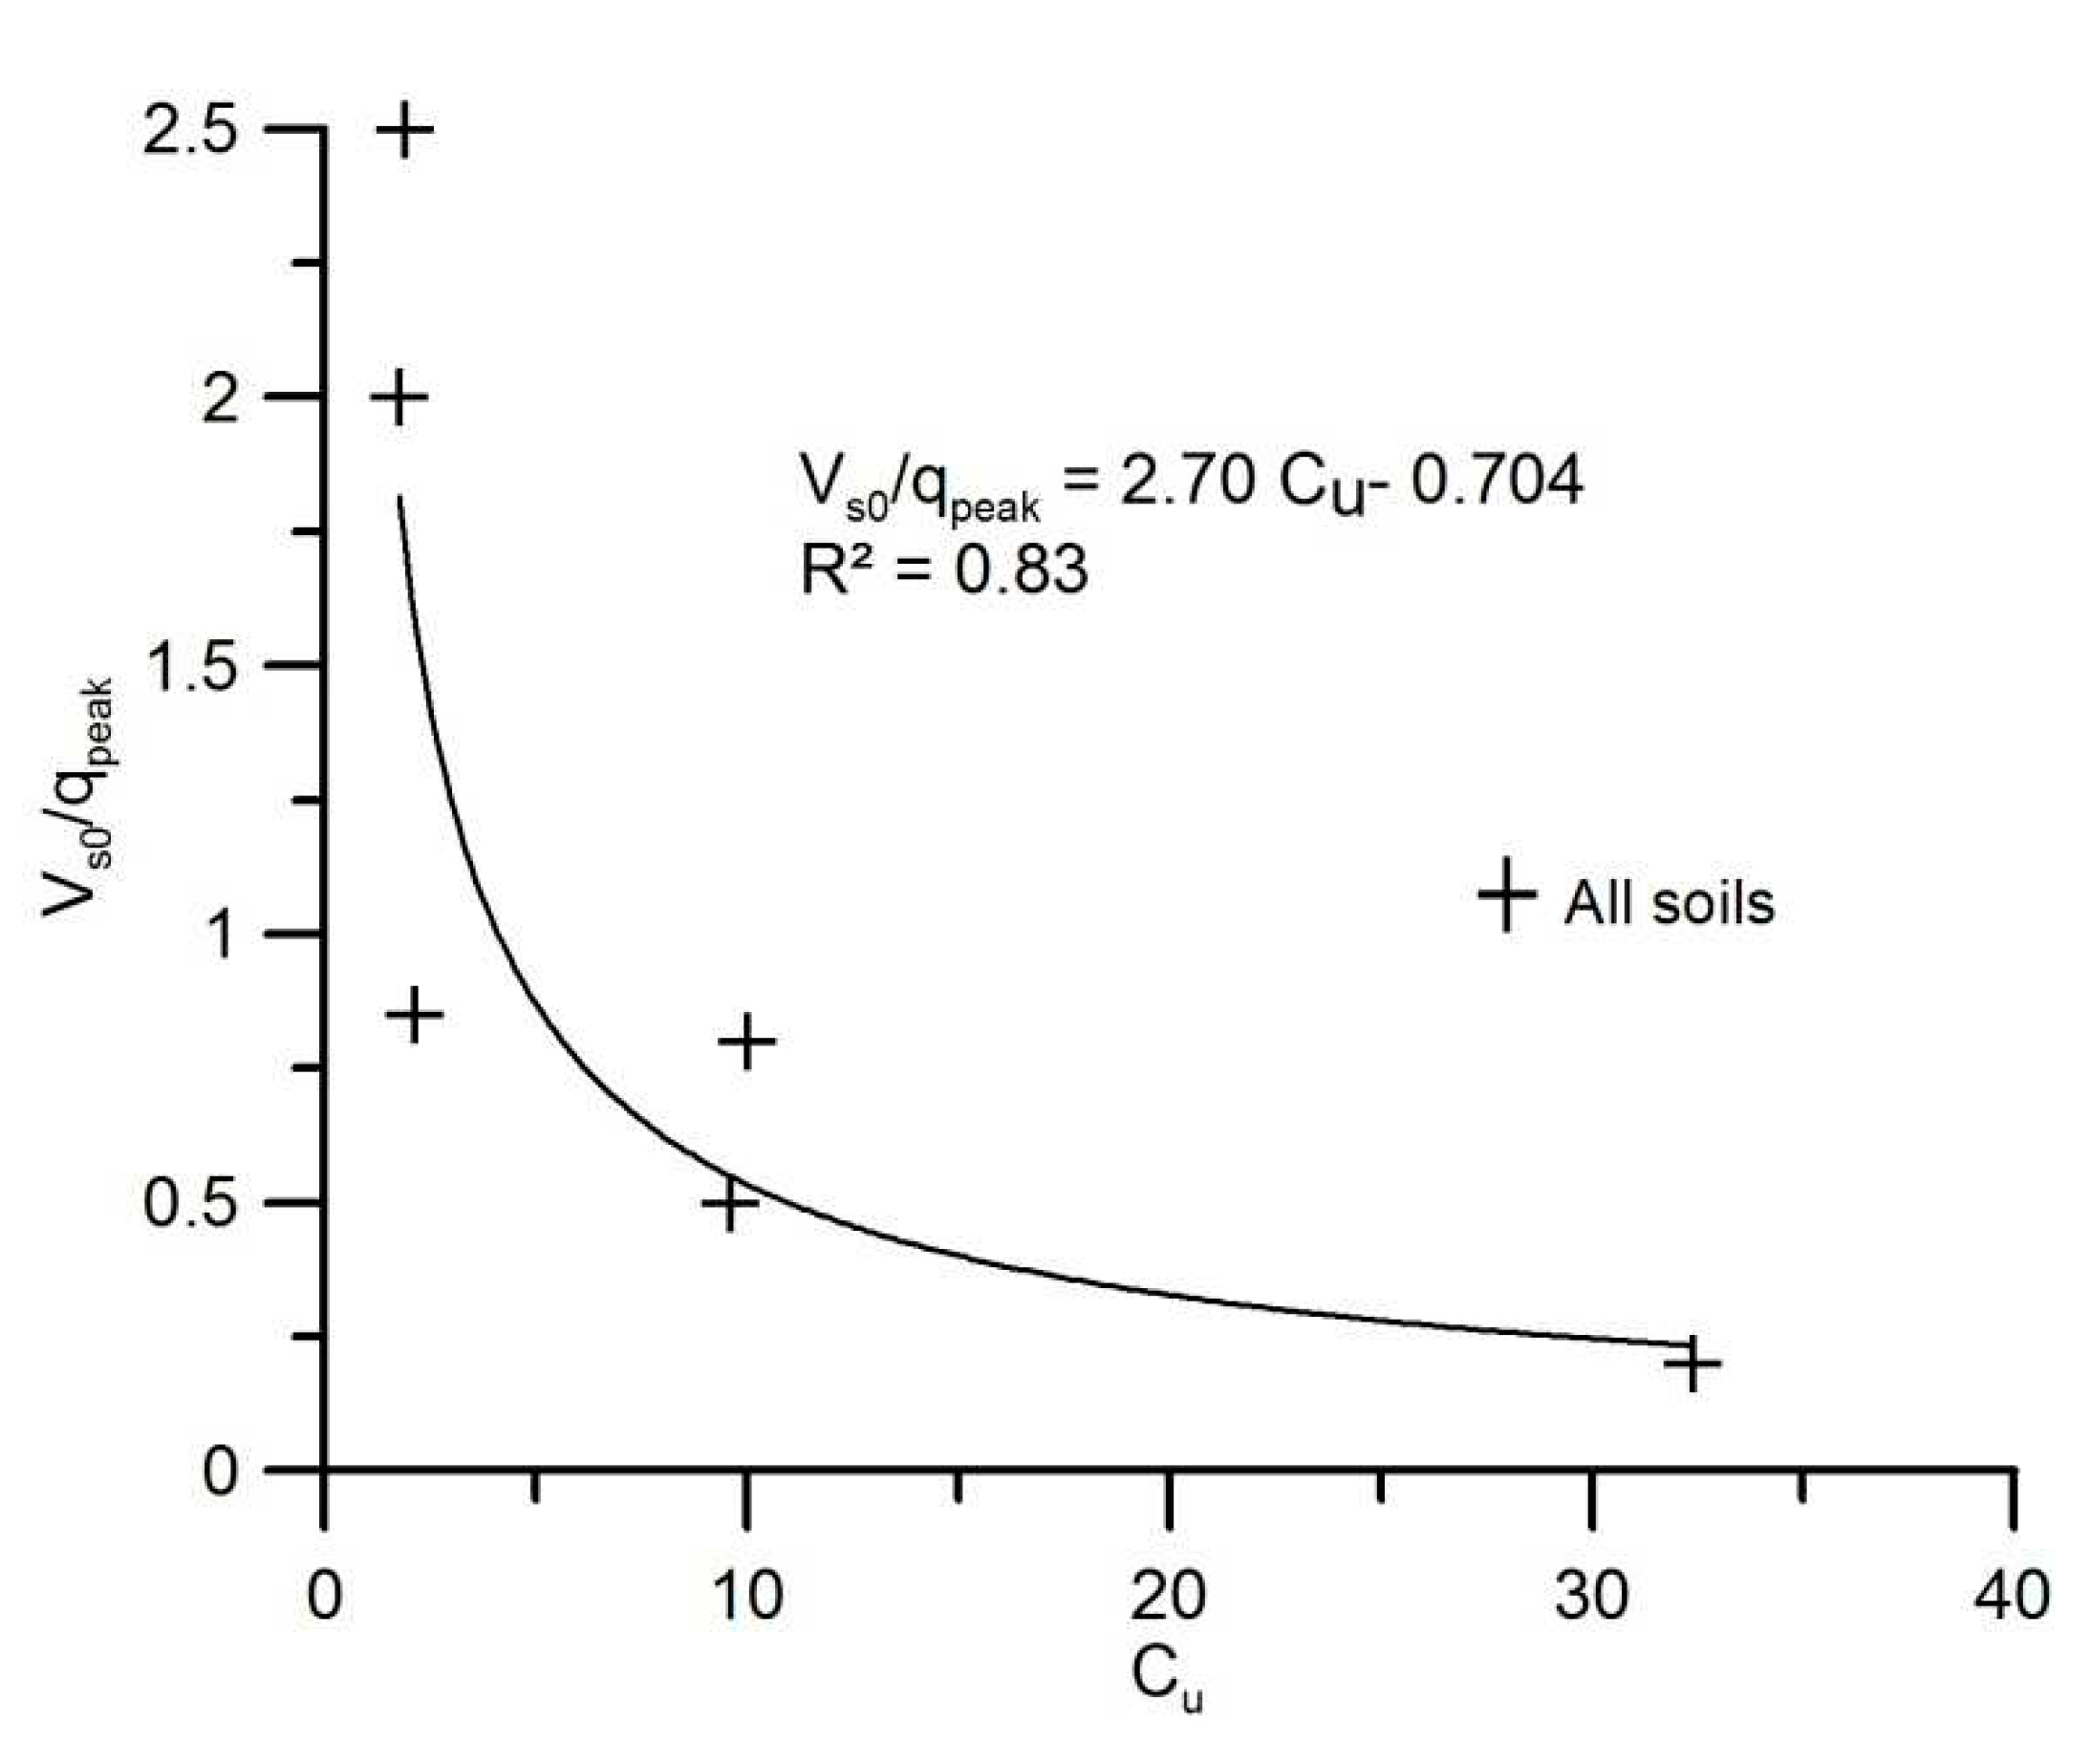

Table 1.
Gradation characteristics of the materials.
| Material | Gs | D50 | D100 | CU | CC | FC (%) | emax | emin | ASTM classif. |
|---|---|---|---|---|---|---|---|---|---|
| Gold tailings* | 2.94 | 0.044 | 0.841 | 10.0 | 1.35 | 70 | (1) | (1) | Silt with sand |
| Osorio sand | 2.65 | 0.190 | 0.420 | 1.9 | 1.00 | 4 | 0.85 | 0.57 | non-plastic uniform fine sand |
| Silt | 2.65 | 0.017 | 0.106 | 9.6 | 1.47 | 99.85 | (1) | (1) | Well graded silt |
| Mixture | 2.65 | 0.110 | 0.425 | 32.4 | 2.60 | 40 | (1) | (1) | well-graded silty sand |
| Algeria sand | 2.69 | 0.310 | 0.850 | 1.76 | 0.97 | 0 | 0.89 | 0.531 | poorly graded sand |
| Coimbra sand | 2.66 | 0.360 | 1.000 | 2.13 | 1.37 | 0 | 0.81 | 0.48 | poorly graded sand |
* results from Schnaid et al. (2013); (1) no information.
Table 2.
Set of results of CIU compression triaxial tests performed on gold tailings.
| Test ID | σ'h0(kPa) | σ'v0(kPa) | Vs0(m/s) | G0(kPa) | Vs1(m/s) | p'peak(kPa) | qpeak(kPa) | Vs0/qpeak | Behavior |
|---|---|---|---|---|---|---|---|---|---|
| GCU_1 | 15 | 15 | 8199 | 121 | 9.5 | 4.5 | 16.56 | Liquefaction | |
| GCU_2 | 22 | 22 | 10699 | 125 | 13.5 | 7.2 | 11.84 | Liquefaction | |
| GCU_3 | 30 | 30 | 13706 | 130 | 17.1 | 8.7 | 11.10 | Liquefaction | |
| GCU_4 | 50 | 50 | 19335 | 135 | 27.3 | 14.0 | 8.09 | Liquefaction | |
| GCU_5 | 60 | 60 | 25914 | 149 | 32.7 | 19.8 | 6.59 | Liquefaction | |
| GCU_6 | 75 | 75 | 26004 | 141 | 43.9 | 29.8 | 4.39 | Strain Softening | |
| GCU_7 | 100 | 100 | 37159 | 156 | 56.5 | 37.4 | 4.17 | Strain Softening | |
| GCU_8 | 200 | 200 | 46487 | 145 | 114.2 | 98.7 | 1.75 | Strain Softening | |
| GCU_9 | 600 | 600 | 127731 | 178 | 391.1 | 410.7 | 0.68 | Strain Hardening | |
| GCU_10 | 800 | 800 | 142062 | 174 | 463.2 | 511.4 | 0.57 | Strain Hardening | |
| GCU_11 | 1000 | 1000 | 169304 | 179 | 658.7 | 734.7 | 0.43 | Strain Hardening | |
| GCU_12 | 1200 | 1200 | 189210 | 180 | 891.5 | 1059.3 | 0.32 | Strain Hardening |
Table 3.
Set of results of CIU compression triaxial tests performed on Osorio sand.
| Test ID | σ'h0(kPa) | σ'v0(kPa) | Vs0(m/s) | G0(kPa) | Vs1(m/s) | p'peak(kPa) | qpeak(kPa) | Vs0/qpeak | Behavior |
|---|---|---|---|---|---|---|---|---|---|
| OCU_1 | 50 | 50 | 184 | 49913 | 219 | 35.8 | 21.0 | 8.79 | Liquefaction |
| OCU_2 | 25 | 25 | 153 | 35056 | 217 | 17.7 | 8.7 | 17.66 | Liquefaction |
| OCU_3 | 100 | 100 | 221 | 72218 | 220 | 63.0 | 42.5 | 5.20 | Liquefaction |
| OCU_4 | 199 | 199 | 264 | 103230 | 222 | 127.7 | 86.0 | 3.07 | Liquefaction |
| OCU_5 | 299 | 299 | 298 | 134685 | 227 | 193.0 | 140.7 | 2.12 | Strain Hardening |
| OCU_6 | 600 | 600 | 370 | 205636 | 237 | 403.2 | 266.3 | 1.39 | Strain Hardening |
| OCU_7 | 600 | 600 | 365 | 200484 | 233 | 386.0 | 253.4 | 1.44 | Strain Hardening |
| OCU_8 | 1200 | 1200 | 365 | 201677 | 196 | 773.7 | 555.3 | 0.66 | Strain Hardening |
Table 4.
Set of results of CIU compression triaxial tests performed on the silt.
| Test ID | σ'h0(kPa) | σ'v0(kPa) | Vs0(m/s) | G0(kPa) | Vs1(m/s) | p'peak(kPa) | qpeak(kPa) | Vs0/qpeak | Behavior |
|---|---|---|---|---|---|---|---|---|---|
| SCU_1 | 15 | 15 | 73 | 7738 | 117 | 10.3 | 3.5 | 20.73 | Liquefaction |
| SCU_2 | 30 | 30 | 91 | 12552 | 124 | 19.3 | 12.8 | 7.12 | Liquefaction |
| SCU_3 | 50 | 50 | 110 | 18518 | 131 | 27.6 | 15.8 | 6.99 | Liquefaction |
| SCU_4 | 101 | 101 | 127 | 24680 | 126 | 58.1 | 38.8 | 3.27 | Liquefaction |
| SCU_5 | 20 | 20 | 80 | 9363 | 119 | 14.7 | 5.2 | 15.24 | Liquefaction |
| SCU_6 | 50 | 50 | 105 | 16790 | 125 | 32.9 | 21.1 | 5.01 | Liquefaction |
| SCU_7 | 99 | 99 | 140 | 30417 | 141 | 59.7 | 36.5 | 3.85 | Strain Softening |
| SCU_8 | 201 | 201 | 168 | 44367 | 141 | 115.2 | 78.3 | 2.15 | Strain Softening |
| SCU_9 | 699 | 699 | 276 | 122377 | 170 | 575.2 | 635.0 | 0.43 | Strain Hardening |
| SCU_10 | 1199 | 1199 | 287 | 134019 | 154 | 1097.2 | 1252.8 | 0.23 | Strain Hardening |
Table 5.
Set of results of CIU compression triaxial tests performed on the mixture.
| Test ID | σ'h0(kPa) | σ'v0(kPa) | Vs0(m/s) | G0(kPa) | Vs1(m/s) | p'peak(kPa) | qpeak(kPa) | Vs0/qpeak | Behavior |
|---|---|---|---|---|---|---|---|---|---|
| MCU_1 | 25 | 25 | 78 | 9690 | 111 | 16.4 | 8.0 | 9.70 | Liquefaction |
| MCU_2 | 402 | 909 | 239 | 98593 | 138 | 582.0 | 568.5 | 0.42 | Strain Softening |
| MCU_3 | 298 | 298 | 182 | 56164 | 139 | 145.6 | 115.0 | 1.59 | Strain Softening |
| MCU_4 | 399 | 399 | 208 | 72689 | 147 | 252.9 | 178.0 | 1.17 | Strain Softening |
Table 6.
Set of results of CIU compression triaxial tests performed with Algeria sand.
| Test ID | σ'h0(kPa) | σ'v0(kPa) | Vs0(m/s) | G0(kPa) | Vs1(m/s) | p'peak(kPa) | qpeak(kPa) | Vs0/qpeak | Behavior |
|---|---|---|---|---|---|---|---|---|---|
| ACU_1 | 23 | 23 | 138 | 27790 | 200 | 17.6 | 9.1 | 15.21 | Liquefaction |
| ACU_2 | 31 | 31 | 134 | 26072 | 180 | 22.0 | 14.5 | 9.27 | Liquefaction |
| ACU_3 | 99 | 99 | 168 | 41743 | 169 | 70.3 | 45.3 | 3.71 | Liquefaction |
| ACU_4 | 400 | 400 | 280 | 117327 | 198 | 248.2 | 255.9 | 1.10 | Strain Hardening |
| ACU_5 | 1001 | 1001 | 411 | 253963 | 231 | 540.4 | 536.9 | 0.77 | Strain Hardening |
| ACU_6 | 529 | 529 | 343 | 181709 | 226 | 369.4 | 369.0 | 0.93 | Strain Hardening |
Table 7.
Set of results of CIU compression triaxial tests performed with Coimbra sand.
| Test ID | σ'h0(kPa) | σ'v0(kPa) | Vs0(m/s) | G0(kPa) | Vs1(m/s) | p'peak(kPa) | qpeak(kPa) | Vs0/qpeak | Behavior |
|---|---|---|---|---|---|---|---|---|---|
| CCU_1 | 100 | 100 | 177 | 49037 | 177 | 57.7 | 43.4 | 4.07 | Liquefaction |
| CCU_2 | 100 | 100 | 162 | 41244 | 162 | 65.2 | 32.2 | 5.02 | Liquefaction |
| CCU_3 | 201 | 201 | 218 | 76508 | 183 | 121.4 | 87.3 | 2.50 | Liquefaction |
| CCU_4 | 400 | 400 | 282 | 129778 | 199 | 241.1 | 178.0 | 1.58 | Liquefaction |
| CCU_5 | 92 | 92 | 182 | 51490 | 186 | 64.0 | 22.4 | 8.13 | Liquefaction |
| CCU_6 | 79 | 79 | 166 | 43121 | 176 | 56.3 | 27.4 | 6.06 | Liquefaction |
| CCU_7 | 498 | 498 | 293 | 137588 | 196 | 327.9 | 161.5 | 1.82 | Liquefaction |
| CCU_8 | 596 | 596 | 314 | 159104 | 201 | 394.3 | 195.2 | 1.61 | Liquefaction |
| CCU_9 | 400 | 400 | 313 | 159317 | 221 | 282.1 | 350.7 | 0.89 | Strain Softening |
| CCU_10 | 1242 | 1242 | 372 | 224325 | 198 | 471.8 | 463.5 | 0.80 | Strain Softening |
Table 8.
Vs0/qpeak ratios for true liquefaction triggering for the different tested materials.
| Material | Vs0/qpeak | |
| true liquefaction triggering | behavior limiting boundary * | |
| Gold tailings | > 5 to 6 | > 0.8 to 1 |
| Osorio sand | > 2 to 3 | > 2 to 3 |
| Silt | > 2 to 3 | > 0.5 |
| Mixture | > 2 to 10 # | > 0.2 # |
| Algeria sand | > 2 | > 2 |
| Coimbra sand | > 1 | > 1 |
* between strain softening and strain hardening for finer soils and between true liquefaction and strain hardening for monogranular sands; # due to limited VS data, there is greater uncertainty for this soil.
Table 9.
Vs1* and b fitting values for equation (4).
| Material | b | Vs1* |
|---|---|---|
| Gold tailings | 3.0 | 170 |
| Osorio sand | 3.5 | 240 |
| Silt | 3.0 | 150 |
| Algeria sand | 2.8 | 205 |
| Coimbra sand | 2.8 | 215 |
Disclaimer/Publisher’s Note: The statements, opinions and data contained in all publications are solely those of the individual author(s) and contributor(s) and not of MDPI and/or the editor(s). MDPI and/or the editor(s) disclaim responsibility for any injury to people or property resulting from any ideas, methods, instructions or products referred to in the content. |
© 2023 by the authors. Licensee MDPI, Basel, Switzerland. This article is an open access article distributed under the terms and conditions of the Creative Commons Attribution (CC BY) license (http://creativecommons.org/licenses/by/4.0/).
Copyright: This open access article is published under a Creative Commons CC BY 4.0 license, which permit the free download, distribution, and reuse, provided that the author and preprint are cited in any reuse.


