
Submitted:
03 July 2023
Posted:
04 July 2023
You are already at the latest version
Abstract
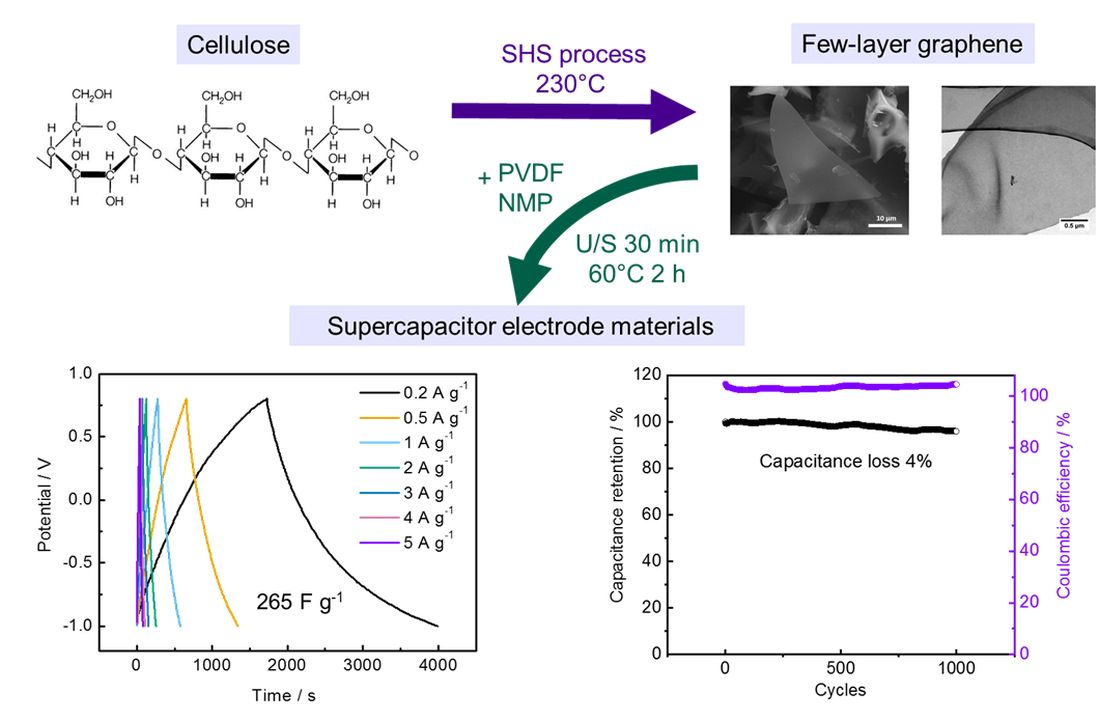
Graphene nanostructures (GNS) are among the most promising materials for creating supercapacitors. However, GNS are still not used in creating supercapacitors due to the impossibility of obtaining large volumes of high-quality material at an acceptable cost. In this work, we investigated the efficiency of using few-layer graphene (FLG) with the number of layers is not more than 5 synthesized under Self-propagating high-temperature synthesis (SHS) conditions as basic material for supercapacitors. Using the SHS process makes it possible to synthesize large volumes of FLG without Stone-Wales defects. It was found that the synthesized FLG makes it possible to obtain better results than using classical materials, namely activated carbon (AC). It was found that the sample based on FLG has a higher specific capacitance – 65 F×g-1 compared to the sample from AC, the specific capacitance of which is 35 F×g-1, for a speed of 5 mV×s-1 these values are 170 and 64 F×g-1, respectively. The drop in capacitance over 1000 cycles was 4%, which indicates a sufficiently high stability of FLG and allows us to consider FLG as perspective material for use in supercapacitors.
Keywords:
few-layer graphene
; self-propagating high-temperature synthesis
; supercapacitors
1. Introduction
Solving the problem of rapidly growing global energy consumption, combined with the critical issue of climate change, is one of the important challenges for scientists and engineers worldwide, requiring the development of new sustainable and renewable energy sources. [1]. Energy storage devices, a key solution to the above problems, must be portable, economical, easy to maintain, energy-efficient, and environmentally friendly. However, the development of such devices is becoming increasingly tricky [2,3,4].
Supercapacitors are energy storage devices with high power characteristics, demonstrating a high charge/discharge rate, cycle life, shelf life, a wide operating temperature range, and safety. [5]. General Electric obtained the first patent for an electrochemical capacitor in 1957 [6], and the term "supercapacitor" was introduced by the first manufacturers of electrochemical capacitors - Nippon Electric Company [7]. Since being commercialized about 40 years ago, supercapacitors have become good electrical energy storage devices for various applications, including renewable energy, transportation, and portable electronic devices [8,9]. The operation of a supercapacitor is based on the principle of maintaining an electric charge on two opposite electrodes separated by a dielectric, and the accumulation of energy in them occurs due to the accumulation of charge by forming an electric double layer of electrolyte ions on the surface of conductive electrodes [10].
Among all supercapacitors, one can highlight devices based on aqueous electrolytes, which are both high-power, environmentally friendly, and therefore attractive for mass production [11,12,13]. The search for new, environmentally friendly renewable, and cheap materials for supercapacitor electrodes is an urgent task that contributes to creating more efficient devices with high specific, capacitive, and power characteristics [14,15]. Currently, activated carbon (AC), carbon nanotubes (CNT), templated carbon, carbon onion, etc., have been proposed as functional materials for the electrodes of such supercapacitors [16,17]. AC is the most used among these materials due to its high availability, large surface area, and low cost. However, the presence of oxygen, nitrogen, and other atoms in amorphous AC structures leads to conduction limitation, adversely affecting the supercapacitor's specific power [18,19]. CNTs have also been actively explored as electrode materials for supercapacitors [19,20]. However, most CNTs are known to be bound to each other by van der Waals forces between individual nanotubes, which hinders electrolyte diffusion. Despite the advantages, the main problem with CNT-based supercapacitors is their price [18,21]. Other carbon materials such as templated carbon, carbon onion, and carbide-derived carbon can be used effectively in supercapacitors, but are difficult to manufacture, so the cost of such materials is high, which limits their use in end devices [21,17].
At the moment, graphene and graphene nanostructures (GNS) can be distinguished among the most promising materials for creating supercapacitors [12,22,23]. Graphene material has an exceptional theoretical specific surface (more than 2630 m2/g) [24], increased mechanical strength, and a unique set of electrochemical properties [25,26], distinguishing it from activated carbon, carbon nanotubes, and fullerenes [12,22,27].
The capacitance characteristics of graphene-based supercapacitors depend on key material characteristics such as specific surface area, pore size distribution, interlayer spacing, heteroatom doping, surface functionalization, and conductivity [28,29]. Most of these parameters strongly depend on each other and are determined mainly by the graphene synthesis method. The production of functional materials for new generations of energy storage devices often requires high-tech equipment and processes that can only sometimes be easily scaled up for mass production, significantly contributing to the cost of final devices.
However, despite all the promise of using GNS in creating supercapacitors, their practical application has yet to occur. One of the critical reasons for this is the high cost of GNS, which makes the use of GNS unprofitable. The high price of GNS is due to the imperfection of GNS synthesis methods, which do not allow the synthesis of large volumes of high-quality material at an acceptable cost. Considering the methods of synthesis of GNS, two main approaches can be distinguished: "top-down" (top-down) [30] and bottom-up (bottom-up) [31]. In synthesizing graphene nanostructures by the "top-down" method, the synthesis occurs by isolating graphene structures from ready-made materials, primarily graphite. These include the separation of graphene with tape, exfoliating graphite using surface active agents (surfactants) and ultrasonic (US) irradiation, and reducing graphite oxidized by the Hummers method. In synthesizing graphene nanostructures by the "bottom-up" method, the synthesis occurs by assembling graphene structures from carbon-containing clusters. This approach includes chemical vapor deposition (CVD) and epitaxial growth. The main advantage of methods based on the top-down approach is their high productivity, low cost, and relative technical simplicity. However, these techniques do not allow for obtaining few-layer, high-quality, with reproducible properties of graphene structures. On the contrary, the "bottom-up" approach makes it possible to synthesize high-quality graphene nanostructures and strictly control their final properties. However, this approach is significantly less productive and more expensive [32].
In our previous works, we reported on the possibility of synthesizing large volumes of few-layer graphene (FLG) from cyclic biopolymers under the conditions of the self-propagating high-temperature synthesis (SHS) [33] free of Stone–Wales Defects [34]. The synthesized FLG showed high efficiency as a modifying additive in the creation of polymer composites by DLP 3D printing [35] and when creating pyrotechnic compositions [36].
This work is devoted to the study of the possibility of using graphene synthesized under the conditions of the SHS process in the creation of supercapacitors.
2. Materials and Methods
2.1. Synthesis of FLG
The particles of FLG synthesized by the SHS method were taken as a modifying additive. The initial biopolymer (starch, analytical grade) was mixed with the oxidizing agent (ammonium nitrate, analytical grade) in a 6 to 4 ratio using a drunk barrel homogenizer for 15 min (60 rpm). Then, the resulting mixture was placed in a reactor and heated to a temperature of 220 (initialization of SHS synthesis). The procedure for obtaining FLG is described in detail in [33].
2.2. Methods for the Characterization of FLG
2.2.1. Electron Microscopy
Electronic images of the few-layer graphene (FLG) sample were obtained using a TESCAN Mira-3M scanning electron microscope (SEM) (accelerating voltage - 20 kV) and an FEI Tecnai G2 30 S-TWIN transmission electron microscope (accelerating voltage - 50 kV). For transmission electron microscopy (TEM) analysis, a suspension of the FLG sample in toluene (concentration 0.05 mass. %) was prepared, applied to a carbon grid and dried in a drying cabinet at 60 ℃.
2.2.2. Dispersion Measurement
To study the laser diffraction method, a Mastersizer 2000 device (USA) was used to study the dispersion of the synthesized material. A suspension of FLG particles in water (0.05 mass %) was prepared by sonication n an ultrasonic bath «Sapphire» (50 W, 22 kHz) for measurement purposes.
2.2.3. X-ray Diffraction
X-ray phase analysis was carried out using a Shimadzu XRD-7000 diffractometer (Cu Kα = 0.154051 nm). The scanning rate was 1 deg/min.
2.2.4. Raman Spectroscopy
Raman spectroscopy was carried out on a Confotec NR500 instrument (532 nm, SOL Instruments, Belarus). For measurements, a suspension of the FLG sample in toluene (concentration of 0.05 mass %) was prepared, applied onto a silicon plate and dried in a drying cabinet at 60 ℃.
2.2.5. Specific Surface Area Measurement
The specific surface area of the FLG sample was measured using the ASAP 2020 instrument, USA, by the Brunauer–Emmett–Teller (BET) method. Before measurement, the FLG sample was dried for 2 hours at 300℃ under a vacuum.
2.3. Preparation of Electrodes from FLG
The electrodes were prepared according to the following procedure: graphene or carbon powder (22 mg) and 2 mg of Poly(vinylidene fluoride) (HSV 900 PVDF, Arkema, France) used as a binder, and 0.3 ml of N-Methyl- 2-pyrrolidone (NMP, EMPLURA®, Merck KGaA, Germany) as a solvent was carefully mixed with ultrasound until a homogeneous mass (slurry) was obtained. Next, a commercially available MF-2012 glassy carbon electrode (working surface area 0.07 cm2; BASi, USA) was evenly coated with the above suspension using a micropipette (0.7 µl) and then dried at 60°C for 2 hours. The load of electroactive material on each received electrode was 51 µg (0.73 mgcm-2) (without considering the mass of PVDF). As a reference sample, electrodes were made from commercial activated carbon (AC, grade AG-3 (GOST 20464-75), specific surface area 740 m2/g) using a similar procedure.
2.4. Electrochemical Measurement Technique
The electrochemical properties of the prepared electrodes were studied on a VSP multichannel potentiostat-galvanostat (BioLogic Science Instruments, France) in a three-electrode electrochemical cell containing a glassy carbon plate (3 cm2) as an auxiliary electrode and a standard silver chloride reference electrode MF-2056 (Ag/AgCl (3M KCl); BASi, USA). All potentials in the work are given relative to the Ag/AgCl reference electrode.
The prepared graphene electrodes were tested as electrodes for supercapacitors using cyclic voltammetry (CV), galvanostatic charge-discharge (GCD), and electrochemical impedance spectroscopy (EIS) techniques in 1 M LiClO4 solution (Sigma-Aldrich, 99%) in distilled water in the range potentials from -1 to 0.8 V CV measurements were carried out at various scan rates in the range from 5 to 200 mVs-1.
2.5. Specific capacitance
The specific capacitance (Csp, Fg-1) was calculated based on the data obtained by CV and GCD measurements according to equations (1) and (2) respectively [37].
Where Q is the accumulated charge in coulombs (equal to half the integrated area of the corresponding CV curve), m(g) is the mass of the active substance, ∆t (s) is the discharge time, ∆V (V) is the voltage window, I (A) - current during discharge.
GCD was carried out at specific currents from 0.2 to 5 Axg-1 in the potential range (a voltage window range) from -1 to 0.8 V. EIS measurements were carried out in the frequency range (100 mHz - 100 kHz) with a sinusoidal potential amplitude of 5 mV rms at open circuit potential (OCP). Before the EIS measurements, the electrodes were preliminarily soaked in the electrolyte for 5 minutes to ensure stability. All parameters were obtained using EC-Lab V11.02 software.
3. Results and Discussion
Figure 1 shows the electronic images of the synthesized FLG sample obtained with the help of a scanning electron microscope (SEM) and transmission electron microscope (TEM).
As can be seen from Figure 1, the synthesized particles have a few-layer structure and have linear dimensions up to several tens of microns. Studies were carried out by laser diffraction to clarify the linear dimensions of graphene particles (Figure 2).
As can be seen from Figure 2, although the sample contains particles with lateral sizes of up to several hundred microns (Figure 2a), the proportion of such particles is small (Figure 2b). As can be seen from Figure 2b, most of the particles have linear dimensions of about one μm.
An X-ray diffraction study was carried out to determine the number of layers in the synthesized FLG sample. The results of the experiment are shown in Figure 3.
Based on the position of the 002 peak and its FWHM, using the Scherer formula [38], the crystallite size (L) was calculated as equal to 17.7 Å. The formula N=L/d was used to calculate the number of graphene layers in the sample. The formula presented "N" is the number of graphene layers in the sample, d=3.81 Å is the interplanar distance. As a result of the calculation, it was found that the number of graphene layers in the sample does not exceed 5.
Figure 4 shows the Raman spectrum of the synthesized FLG sample. As can be seen from Figure 4, the synthesized sample demonstrates a typical Raman spectrum for graphene nanostructures.
The intensity ratio of the D and G peaks is 0.89. Similar Raman spectra were observed in [39]. In [40], the authors associated the mutual superposition of the 2D and D+G peaks in the region of 2500–3500 cm–1 with the wavy structure of the samples, the presence of a large number of edges, and the multidirectional superposition of graphene layers on each other. In our previous work [34], we have shown that FLG samples synthesized under the conditions of the SHS process do not contain Stone-Wales defects.
The specific surface, according to the BET theory of the synthesized FLG sample, was 220 m2/g.
Samples made from FLG and activated carbon (AC) were studied by Cyclic Voltammetry (CV) as model electrodes of supercapacitors in a three-electrode cell in 1 M aqueous LiClO4 solution. Figure 5a,b shows the comparative results of CVs of fabricated samples at scan rates of 200 (Figure 5a) and 5 mVs–1 (Figure 5b) in the range of potential change from –1 to 0.8 V.
For both scan rates, the samples show an electrical double-layer capacitance behavior (no pronounced peaks).
The specific capacity of the obtained samples was calculated using equation (1). Figure 5 shows that at a scanning speed of 200 mVs-1 and 5 mVs-1, these values are 170 and 64 Fg-1, respectively. It should be noted that despite the fact that the specific surface area of FLG is much smaller than that of AC (220 and 740 m2/g, respectively), it demonstrates greater efficiency than AC.
Figure 6 a–c show curves of current density versus electrode potential at potential scan rates of 5–200 mVs–1.
It can be seen from the presented graphs that for both samples, the values of current densities become larger with increasing scanning speed. At lower potential scan rates, all samples show curve shapes close to rectangular (rectangular-like shape), which is typical for double-layer behavior. With an increase in the sweep rate, the shape of the CV curves was distorted (fusiform), which is associated with the resistance of electron transfer. Still, the general shape of the curves remained close to rectangular, which indicates relatively high power characteristics of the materials.
Figure 7 shows the dependence lg(Ip)–lg(v) for FLG and AC.
The slope of this dependence enables the estimation of the limiting stage of the process [41]. The slope (coefficient b) may take values from 0.5, corresponding to the diffusion-controlled process, to 1, corresponding to adsorption. For the AC sample, the coefficient b values correspond to mixed kinetics (b = 0.86), which suggests insignificant limitations of mass transfer in the electrode material. A noticeable contribution of limited mass transfer was observed for FLG sample only at high values of scan rates (b values close to 0.5).
The Galvanostatic charge/discharge method was used to study the capacitive properties of the obtained graphene samples. Figure 8 shows the GCD behavior of all electrodes at current densities of 0.2 – 5 Ag–1. All samples are characterized by deviations from the linearity of the charge-discharge curves, especially when discharging to low potentials, which is probably associated with side irreversible recovery processes.
The gravimetric capacitances of the electrodes were calculated using equation (2). The capacitances of electrodes based on graphene made from FLG and AC at a current of 0.2 Ag–1 are 265 and 75 Fg–1, respectively. All calculated capacitance values from CV and GCD are presented in Table 1 and Table 2.
To better understand the electrochemical properties of the electrodes, the samples were studied by electrochemical impedance spectroscopy (EIS). Spectra in Nyquist coordinates are shown in Figure 9. The spectra have a classical shape for porous systems without a pronounced semicircle and a linear section in the low-frequency region [42]. This indicates a sufficiently high conductivity of the samples and the predominant dominance of diffusion kinetics. The main differences between the samples are observed in the slope of the linear dependence in the low-frequency region, which may be due to more significant diffusion limitations for the sample with FLG. This may be due to differences in specific surface area and porosity. These findings are in good agreement with CV measurements at various sweep rates.
The stability of electrode materials based on few-layer graphene was tested by the GCD method in 1 M LiClO4 aqueous solution at a current of 2 Ag-1 for 1000 cycles. The resulting dependence is shown in Figure 10.
The drop in capacitance for 1000 cycles was 4% (the initial capacitance was 144 Fg-1, and after a thousand cycles it was 138 Fg-1), which indicates a sufficiently high stability of the materials, and allows them to be considered for use in supercapacitors. The decrease in capacity may be associated with irreversible reduction processes, which is confirmed by an increase in the values of the Coulomb efficiency with cycling. It is recommended to use a narrower range of potentials to improve stability.
4. Conclusions
It was experimentally shown that FLG synthesized under the conditions of the SHS process is a promising material for the using in supercapacitors. It was found that de-spite the lower specific surface area than AC, FLG samples have better capacitive parameters. Samples with FLG also showed high stability: the drop in capacity over 1000 cycles was less than 4%.
As a result, the FLG has optimal structure and particle size distribution, and thus achieve higher capacitance values. A high capacitance of 265 Fxg−1 (0.2 mAxg−1) was achieved FLG electrode in aqueous LiClO4 electrolyte. The achieved capacitance values were 2-4 times higher of the activated carbon-based electrode with a higher surface area. Furthermore, the FLG electrode maintained its capacitive performance cycling (1000 cycles). Thus, the findings suggest that the FLG composite can be promising electrode material for supercapacitors.
Author Contributions
For research articles with several authors, a short paragraph specifying their individual contributions must be provided. The following statements should be used “Conceptualization, A.P.V, S.K. and A.A.V.; methodology, R.A.; formal analysis, A.A.V., R.A. and E.S.; investigation, A.A.V. and E.S.; resources, A.A.V. and R.A.; data curation, A.A.V; writing—original draft preparation, A.A.V., R.A. and E.S.; writing—review and editing, A.A.V. and E.S.; visualization, S.K. and R.A.; supervision, A.P.V., project administration, S.K.
Funding
The study was performed under the Ioffe Institute Project №FFUG-2024-0019 Carbon nanostructurized functional materials.
Institutional Review Board Statement
Not applicable
Informed Consent Statement
Not applicable
Data Availability Statement
Not applicable.
Acknowledgments
Not applicable.
Conflicts of Interest
The authors declare no conflict of interest.
References
- Ataca, C.; Ciraci, S. Perpendicular growth of carbon chains on graphene from first-principles. Phys. Rev. B. 2011, 83, 235417. [Google Scholar] [CrossRef]
- Hannan, M.A.; Hoque, M.M.; Mohamed, A.; Ayob, A. Review of energy storage systems for electric vehicle applications: Issues and challenges. Renew. Sustain. Energy Rev. 2017, 69, 771–789. [Google Scholar] [CrossRef]
- Dutta, A.; Mitra, S.; Basak, M.; Banerjee, T. A comprehensive review on batteries and supercapacitors: development and challenges since their inception. Energy Storag. 2023, 5, e339. [Google Scholar] [CrossRef]
- Elsherif, S.A.; Ibrahim, M.A.; Ghany, N.A. A. Graphene fabricated by different approaches for supercapacitors with ultrahigh volumetric capacitance. J. Energy Storag. 2022, 50, 104281. [Google Scholar] [CrossRef]
- Chen, W.; Rakhi, R.B.; Hu, L.; Xie, X.; Cui, Y.; Alshareef, H.N. High-performance nanostructured supercapacitors on a sponge. Nano Lett. 2011, 11, 5165–5172. [Google Scholar] [CrossRef]
- Becker, H.I. Low voltage electrolytic capacitor. US Patent 2800616, 1957. [Google Scholar]
- Sharma, P.; Bhatti, T.S. A review on electrochemical double-layer capacitors. Energy Convers. Manage. 2010, 51, 2901–2912. [Google Scholar] [CrossRef]
- Pandolfo, A.; Hollenkamp, A. Electrochemical capacitors–scientific fundamentals and technological applications. J Power Sources. 2006, 157, 11–27. [Google Scholar] [CrossRef]
- Simon, P.; Gogotsi, Y.; Dunn, B. Where do batteries end and supercapacitors begin? Science. 2014, 343, 1210–1211. [Google Scholar] [CrossRef]
- Sharma, K.; Arora, A.; Tripathi, S.K. Review of supercapacitors: Materials and devices. J. Energy Storag. 2019, 21, 801–825. [Google Scholar] [CrossRef]
- Chee, W.K.; Lim, H.N.; Zainal, Z.; Huang, N.M.; Harrison, I.; Andou, Y. Flexible graphene-based supercapacitors: a review. J. Phys. Chem. C. 2016, 120, 4153–4172. [Google Scholar] [CrossRef]
- Yang, W.; Ni, M.; Ren, X.; Tian, Y.; Li, N.; Su, Y.; Zhang, X. Graphene in supercapacitor applications. Curr. Opin. Colloid Interface Sci. 2015, 20, 416–428. [Google Scholar] [CrossRef]
- Inagaki, M.; Konno, H.; Tanaike, O. Carbon materials for electrochemical capacitors. J. Power Sources. 2010, 195, 7880–7903. [Google Scholar] [CrossRef]
- Simon, P.; Gogotsi, Y. Nanostructured activated carbons from natural precursors for electrical double layer capacitors. Nat. Mater. 2008, 7, 845–854. [Google Scholar] [CrossRef]
- Miller, J.R.; Simon, P. The chalkboard: Fundamentals of electrochemical capacitor design and operation. Electrochem. Soc. Interface. 2008, 17, 31. [Google Scholar] [CrossRef]
- J. ; Zhang, L.; Zhang, A Review of Electrolyte Materials and Compositions for Electrochemical Supercapacitors. Chem. Soc. Rev. Chem. Soc. Rev. 2015, 44, 7431–7920. [Google Scholar] [CrossRef]
- Gu, W.; Yushin, G. Review of nanostructured carbon materials for electrochemical capacitor applications: advantages and limitations of activated carbon, carbide-derived carbon, zeolite-templated carbon, carbon aerogels, carbon nanotubes, onion-like carbon, and graphene. Wiley Interdiscip. Rev. Energy Environ. 2014, 3, 424–473. [Google Scholar] [CrossRef]
- Arruda, T.M.; Heon, M.; Presser, V.; Hillesheim, P.C.; Dai, S.; Gogotsi, Y.; Kalinin, S.; Balke, N. In situ tracking of the nanoscale expansion of porous carbon electrodes. Energy Environ. Sci. 2013, 6, 225–231. [Google Scholar] [CrossRef]
- Zhu, S.; Ni, J.; Li, Y. Carbon nanotube-based electrodes for flexible supercapacitors. Nano Res. 2020, 13, 1825–1841. [Google Scholar] [CrossRef]
- Liu, L.; Niu, Z.; Chen, J. Flexible supercapacitors based on carbon nanotubes. Chin. Chem. Lett. 2018, 29, 571–581. [Google Scholar] [CrossRef]
- Gu, W.; Wang, X.; Yushin, G. Nanostructured activated carbons for supercapacitors. Nanocarbons Adv. Energy Storag. 2015, 1, 1–34. [Google Scholar] [CrossRef]
- Tan, Y.B.; Lee, J.M. Graphene for supercapacitor applications. J. Mater. Chem. A. 2013, 1, 14814–14843. [Google Scholar] [CrossRef]
- Lakra, R.; Kumar, R.; Sahoo, P.K.; Thatoi, D.; Soam, A. A mini-review: Graphene based composites for supercapacitor application. Inorg. Chem. Commun. 2021, 133, 108929. [Google Scholar] [CrossRef]
- Kim, H.; Abdala, A.A. ve Macosko, CW, Graphene/polymer nanocomposites. Macromolecules 2010, 43, 6515–6530. [Google Scholar] [CrossRef]
- Balamurugan, J.; Thanh, T.D.; Heo, S.B.; Kim, N.H.; Lee, J.H. Novel route to synthesis of N-doped graphene/Cu–Ni oxide composite for high electrochemical performance. Carbon. 2015, 94, 962–970. [Google Scholar] [CrossRef]
- Vermisoglou, E.C.; Giannakopoulou, T.; Romanos, G.; Boukos, N.; Psycharis, V.; Lei, C.; Lekakou, C.; Petridis, D.; Trapalis, C. (2017). Graphene-based materials via benzidine-assisted exfoliation and reduction of graphite oxide and their electrochemical properties. Appl. Surf. Sci. 2017, 392, 244–255. [Google Scholar] [CrossRef]
- Zhao, H.; Pan, F.; Li, Y. A review on the effects of TiO2 surface point defects on CO2 photoreduction with H2O. J. of Materiomics. 2017, 3, 17–32. [Google Scholar] [CrossRef]
- Zhang, H.; Yang, D.; Lau, A.; Ma, T.; Lin, H.; Jia, B. Hybridized graphene for supercapacitors: Beyond the limitation of pure graphene. Small. 2021, 17, 2007311. [Google Scholar] [CrossRef]
- Horn, M.; Gupta, B.; MacLeod, J.; Liu, J.; Motta, N. Graphene-based supercapacitor electrodes: Addressing challenges in mechanisms and materials. Curr. Opin. Green Sustain. Chem. 2019, 17, 42–48. [Google Scholar] [CrossRef]
- Kumar, N.; Salehiyan, R.; Chauke, V.; Botlhoko, O.J.; Setshedi, K.; Scriba, M.; Masukume, M. Ray, S.S. Top-down synthesis of graphene: A comprehensive review. FlatChem. 2021, 27, 100224. [Google Scholar] [CrossRef]
- Mahmoudi, T.; Wang, Y.; Hahn, Y.B. Graphene and its derivatives for solar cells application. Nano Energy. 2018, 47, 51–65. [Google Scholar] [CrossRef]
- Lee, X.J.; Hiew, B.Y. Z.; Lai, K.C.; Lee, L.Y.; Gan, S.; Thangalazhy-Gopakumar, S.; Rigby, S. Review on graphene and its derivatives: Synthesis methods and potential industrial implementation. J. Taiwan Inst. Chem. Eng. 2019, 98, 163–180. [Google Scholar] [CrossRef]
- Voznyakovskii, A.; Vozniakovskii, A.; Kidalov, S. New Way of Synthesis of Few-Layer Graphene Nanosheets by the Self Propagating High-Temperature Synthesis Method from Biopolymers. Nanomaterials 2022, 12, 657. [Google Scholar] [CrossRef] [PubMed]
- Voznyakovskii, A.; Neverovskaya, A.; Vozniakovskii, A.; Kidalov, S. A Quantitative Chemical Method for Determining the Surface Concentration of Stone–Wales Defects for 1D and 2D Carbon Nanomaterials. Nanomaterials 2022, 12, 883. [Google Scholar] [CrossRef] [PubMed]
- Kidalov, S.; Voznyakovskii, A.; Vozniakovskii, A.; Titova, S.; Auchynnikau, Y. The Effect of Few-Layer Graphene on the Complex of Hardness, Strength, and Thermo Physical Properties of Polymer Composite Materials Produced by Digital Light Processing (DLP) 3D Printing. Materials 2023, 16, 1157. [Google Scholar] [CrossRef] [PubMed]
- Ilyushin, M.A.; Voznyakovskii, A.P.; Shugalei, I.; Vozniakovskii, A.A. Carbonization of Biopolymers as a Method for Producing a Photosensitizing Additive for Energy Materials. Nanomanufacturing 2023, 3, 167–176. [Google Scholar] [CrossRef]
- Pan, H.; Wei, X.; Henderson, W.A.; Shao, Y.; Chen, J.; Bhattacharya, P.; Xiao, J.; Liu, J. On the way toward understanding solution chemistry of lithium polysulfides for high energy Li–S redox flow batteries. Adv. Energy Mater., 2015, 5, 1500113. [Google Scholar] [CrossRef]
- Patterson, A.L. The Scherrer Formula for X-Ray Particle Size Determination. Phys. Rev. 1939, 56, 978–982. [Google Scholar] [CrossRef]
- Johra, F.T.; Lee, J.W.; Jung, W.G. Facile and safe graphene preparation on solution based platform. J. Ind. Eng. Chem. 2014, 20, 2883–2887. [Google Scholar] [CrossRef]
- Li, C.; Zhang, X.; Wang, K.; Sun, X.; Liu, G.; Li, J.; Ma, Y. Scalable self-propagating high-temperature synthesis of graphene for supercapacitors with superior power density and cyclic stability. Adv. Mater. 2017, 29, 1604690. [Google Scholar] [CrossRef]
- Bard, A.J.; Faulkner, L.R. Electrochemical Methods: Fundamental and Applications, 2nd ed.; John Wiley & Sons: Hoboken, NJ, USA, 2001; pp. 267–305. [Google Scholar]
- De Levie, R. On porous electrodes in electrolyte solutions: I. Capacitance effects. Electrochim. Acta. 1963, 8, 751–780. [Google Scholar] [CrossRef]
Figure 1.
SEM and TEM images of FLG particles: (a) SEM image of FLG; (b) TEM image of FLG.
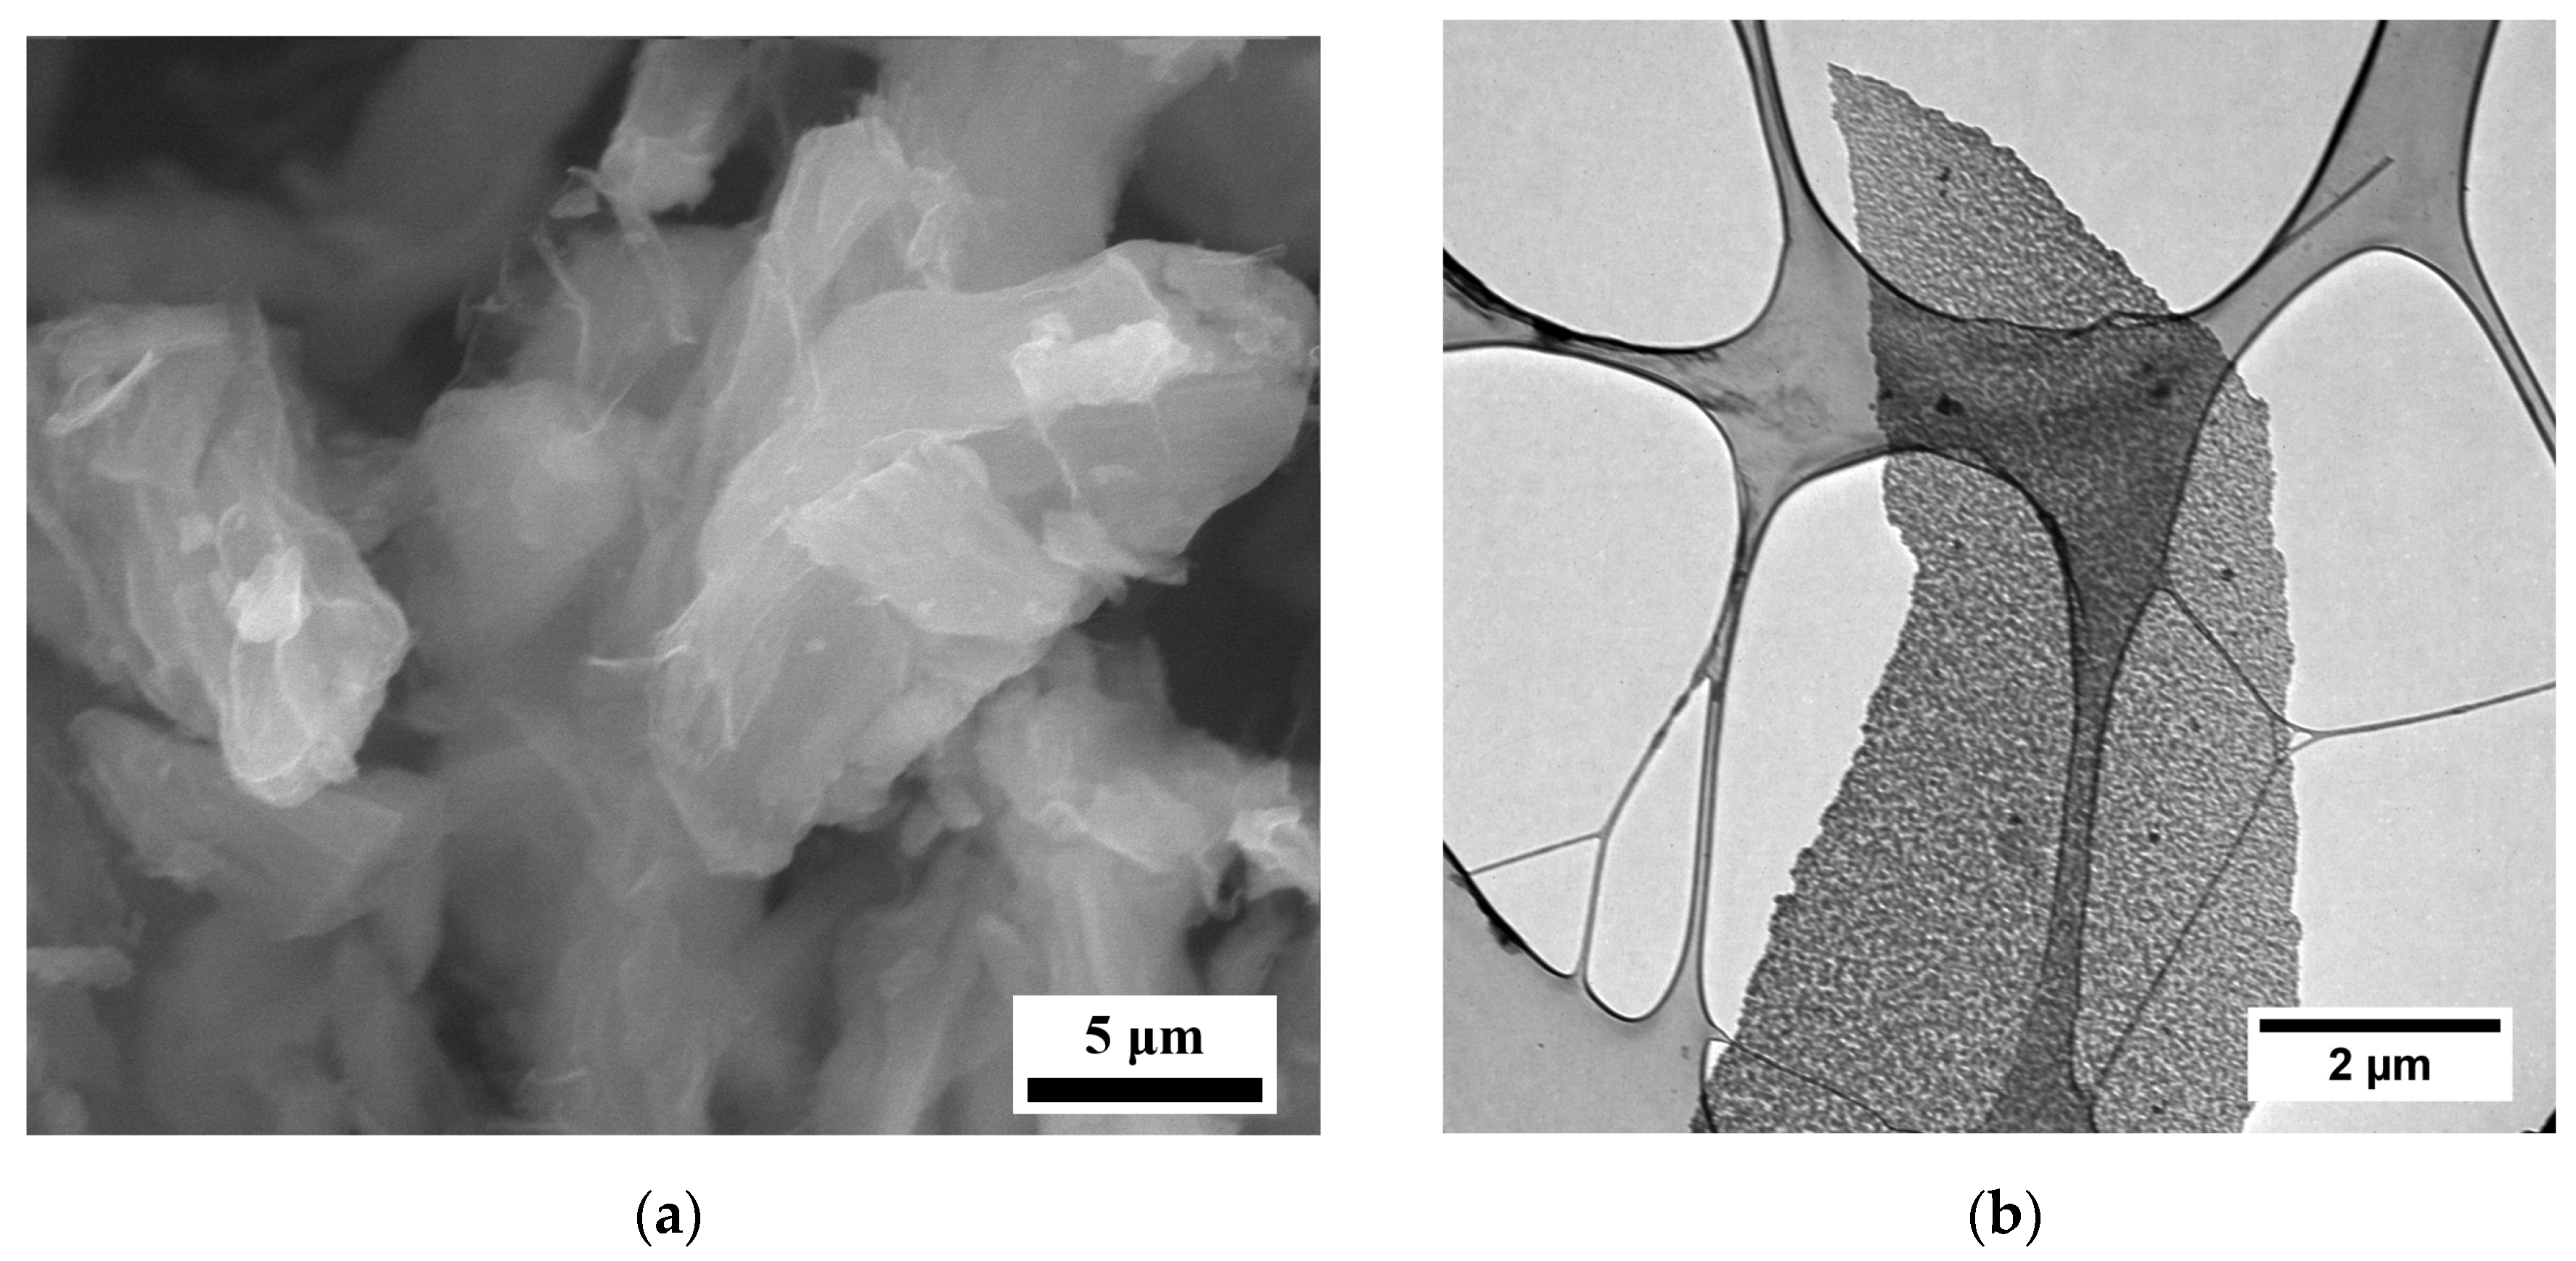
Figure 2.
Results of measurements of the dispersity of FLG particles. a -particle size distribution by volume; b - distribution of particle size by the number of particles.
Figure 2.
Results of measurements of the dispersity of FLG particles. a -particle size distribution by volume; b - distribution of particle size by the number of particles.
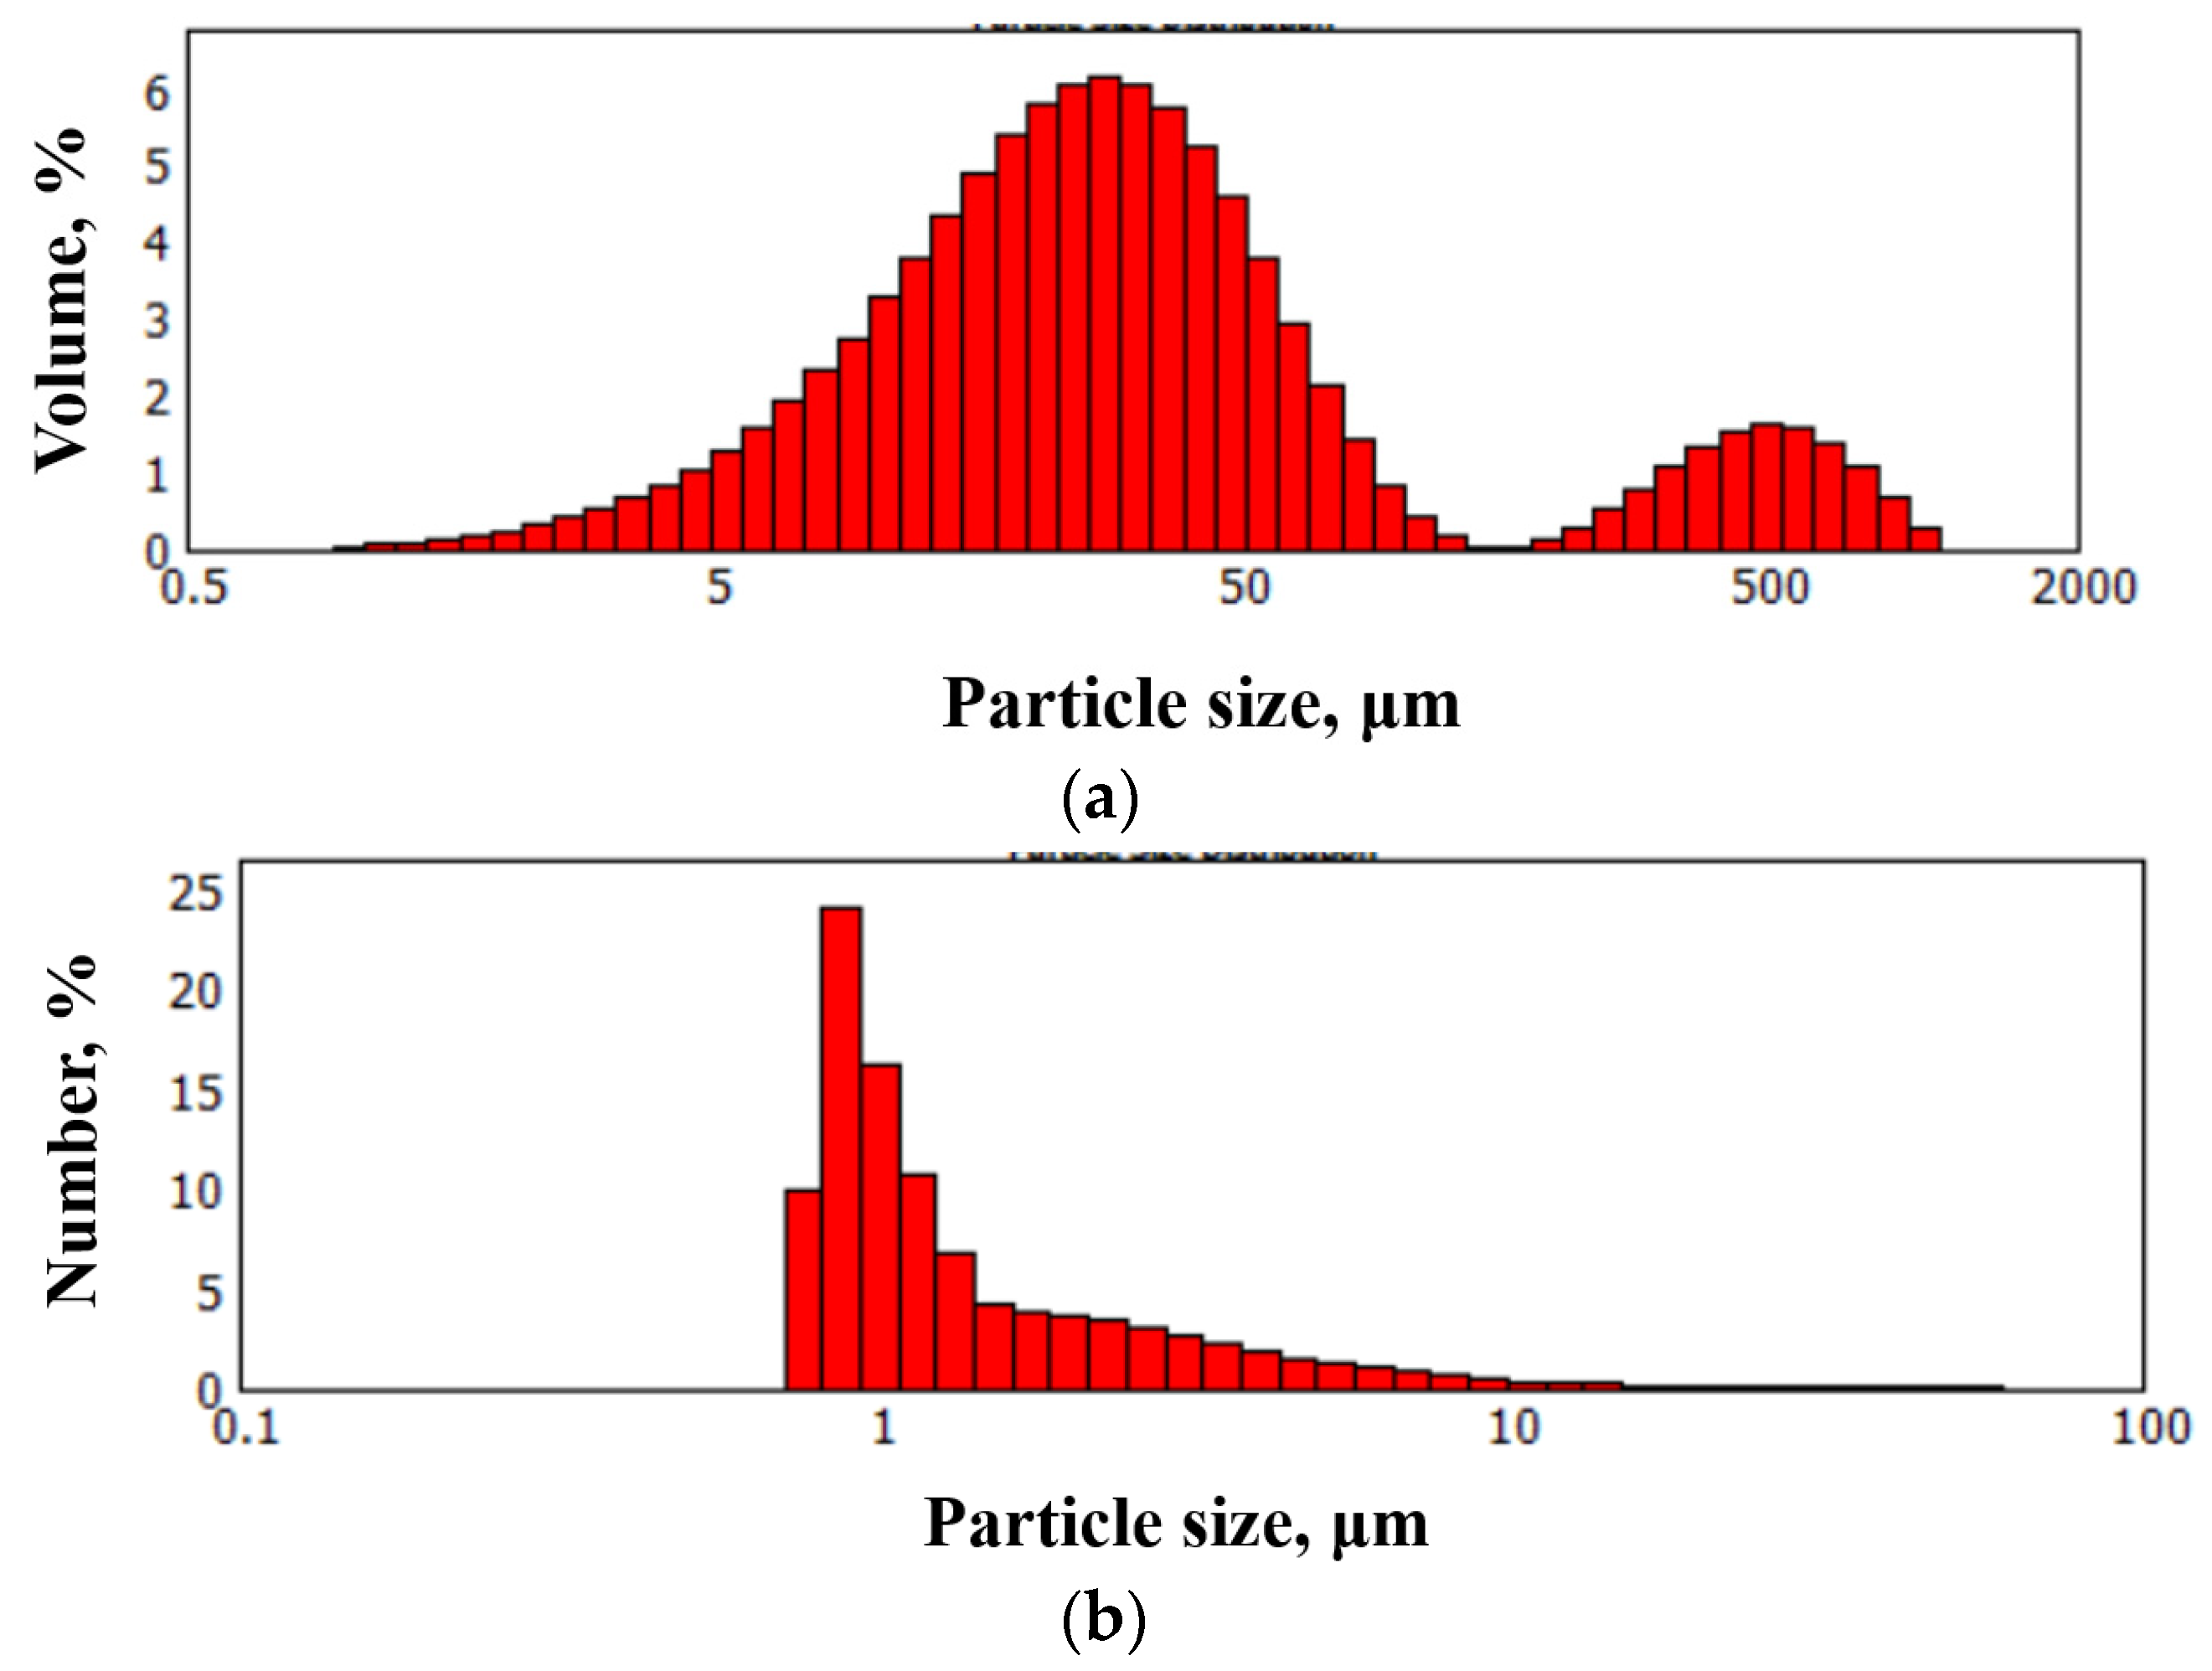
Figure 3.
This is a figure. Schemes follow the same formatting.
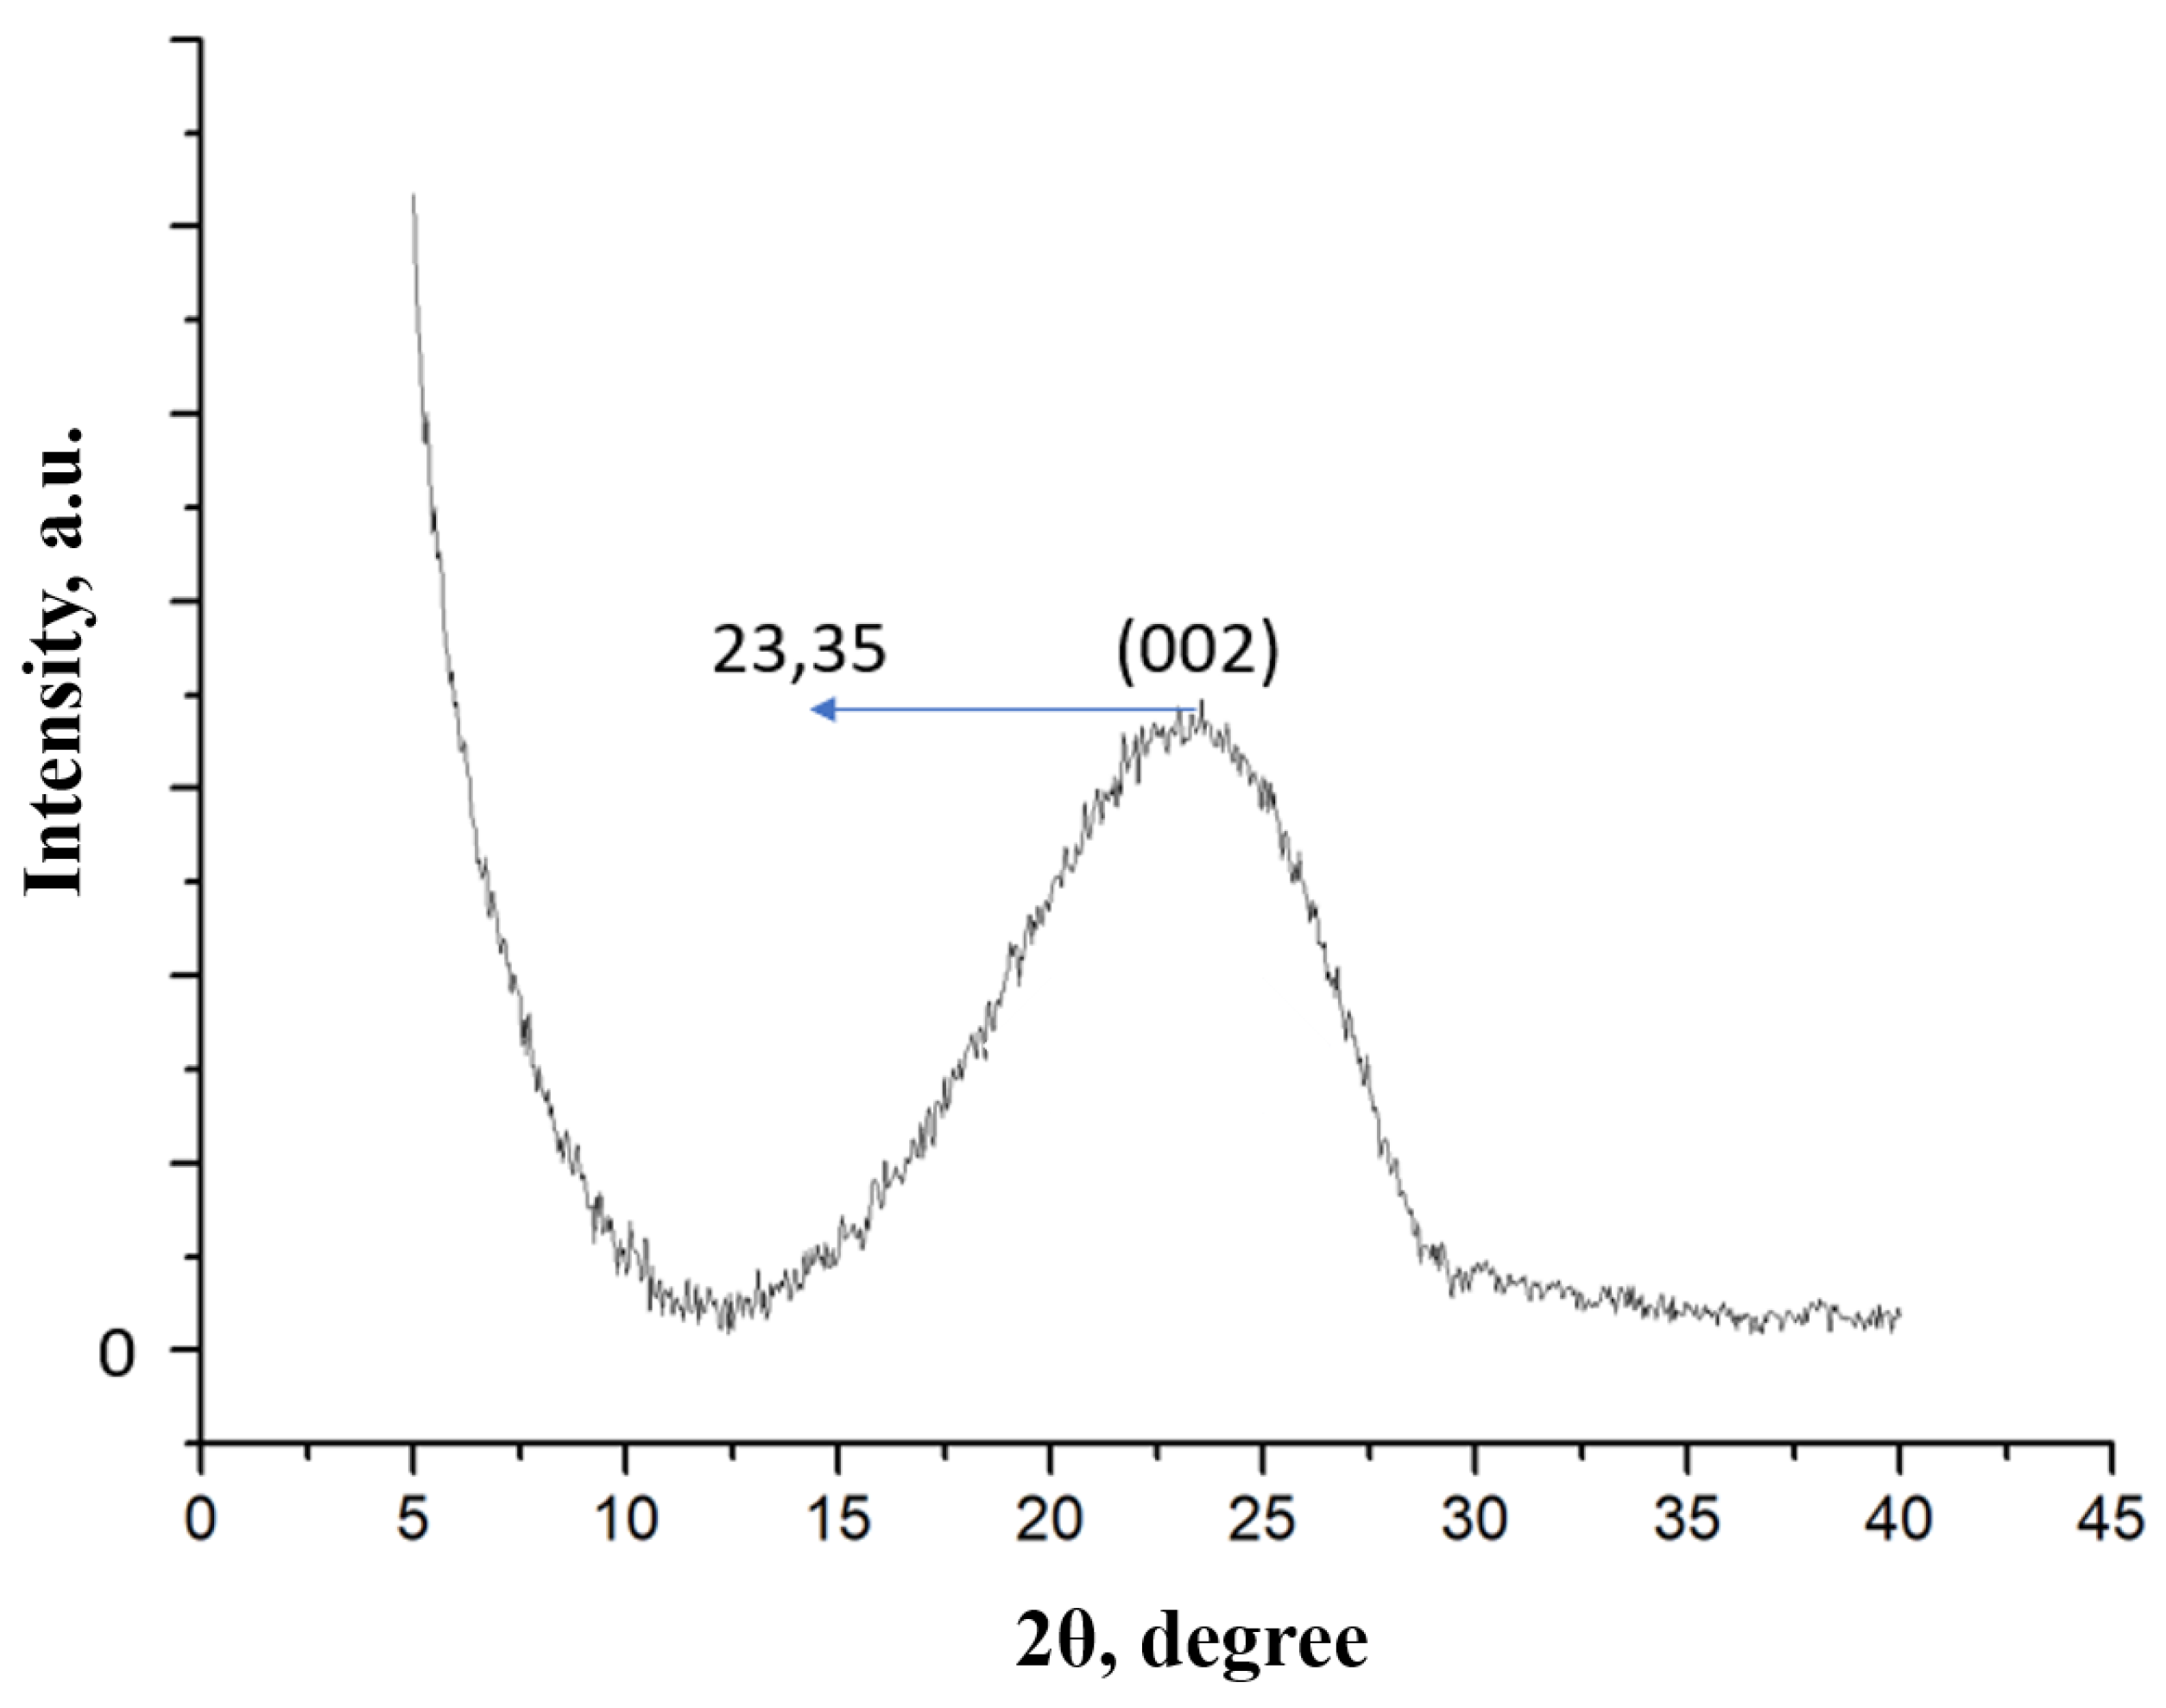
Figure 4.
This is a figure. Schemes follow the same formatting.
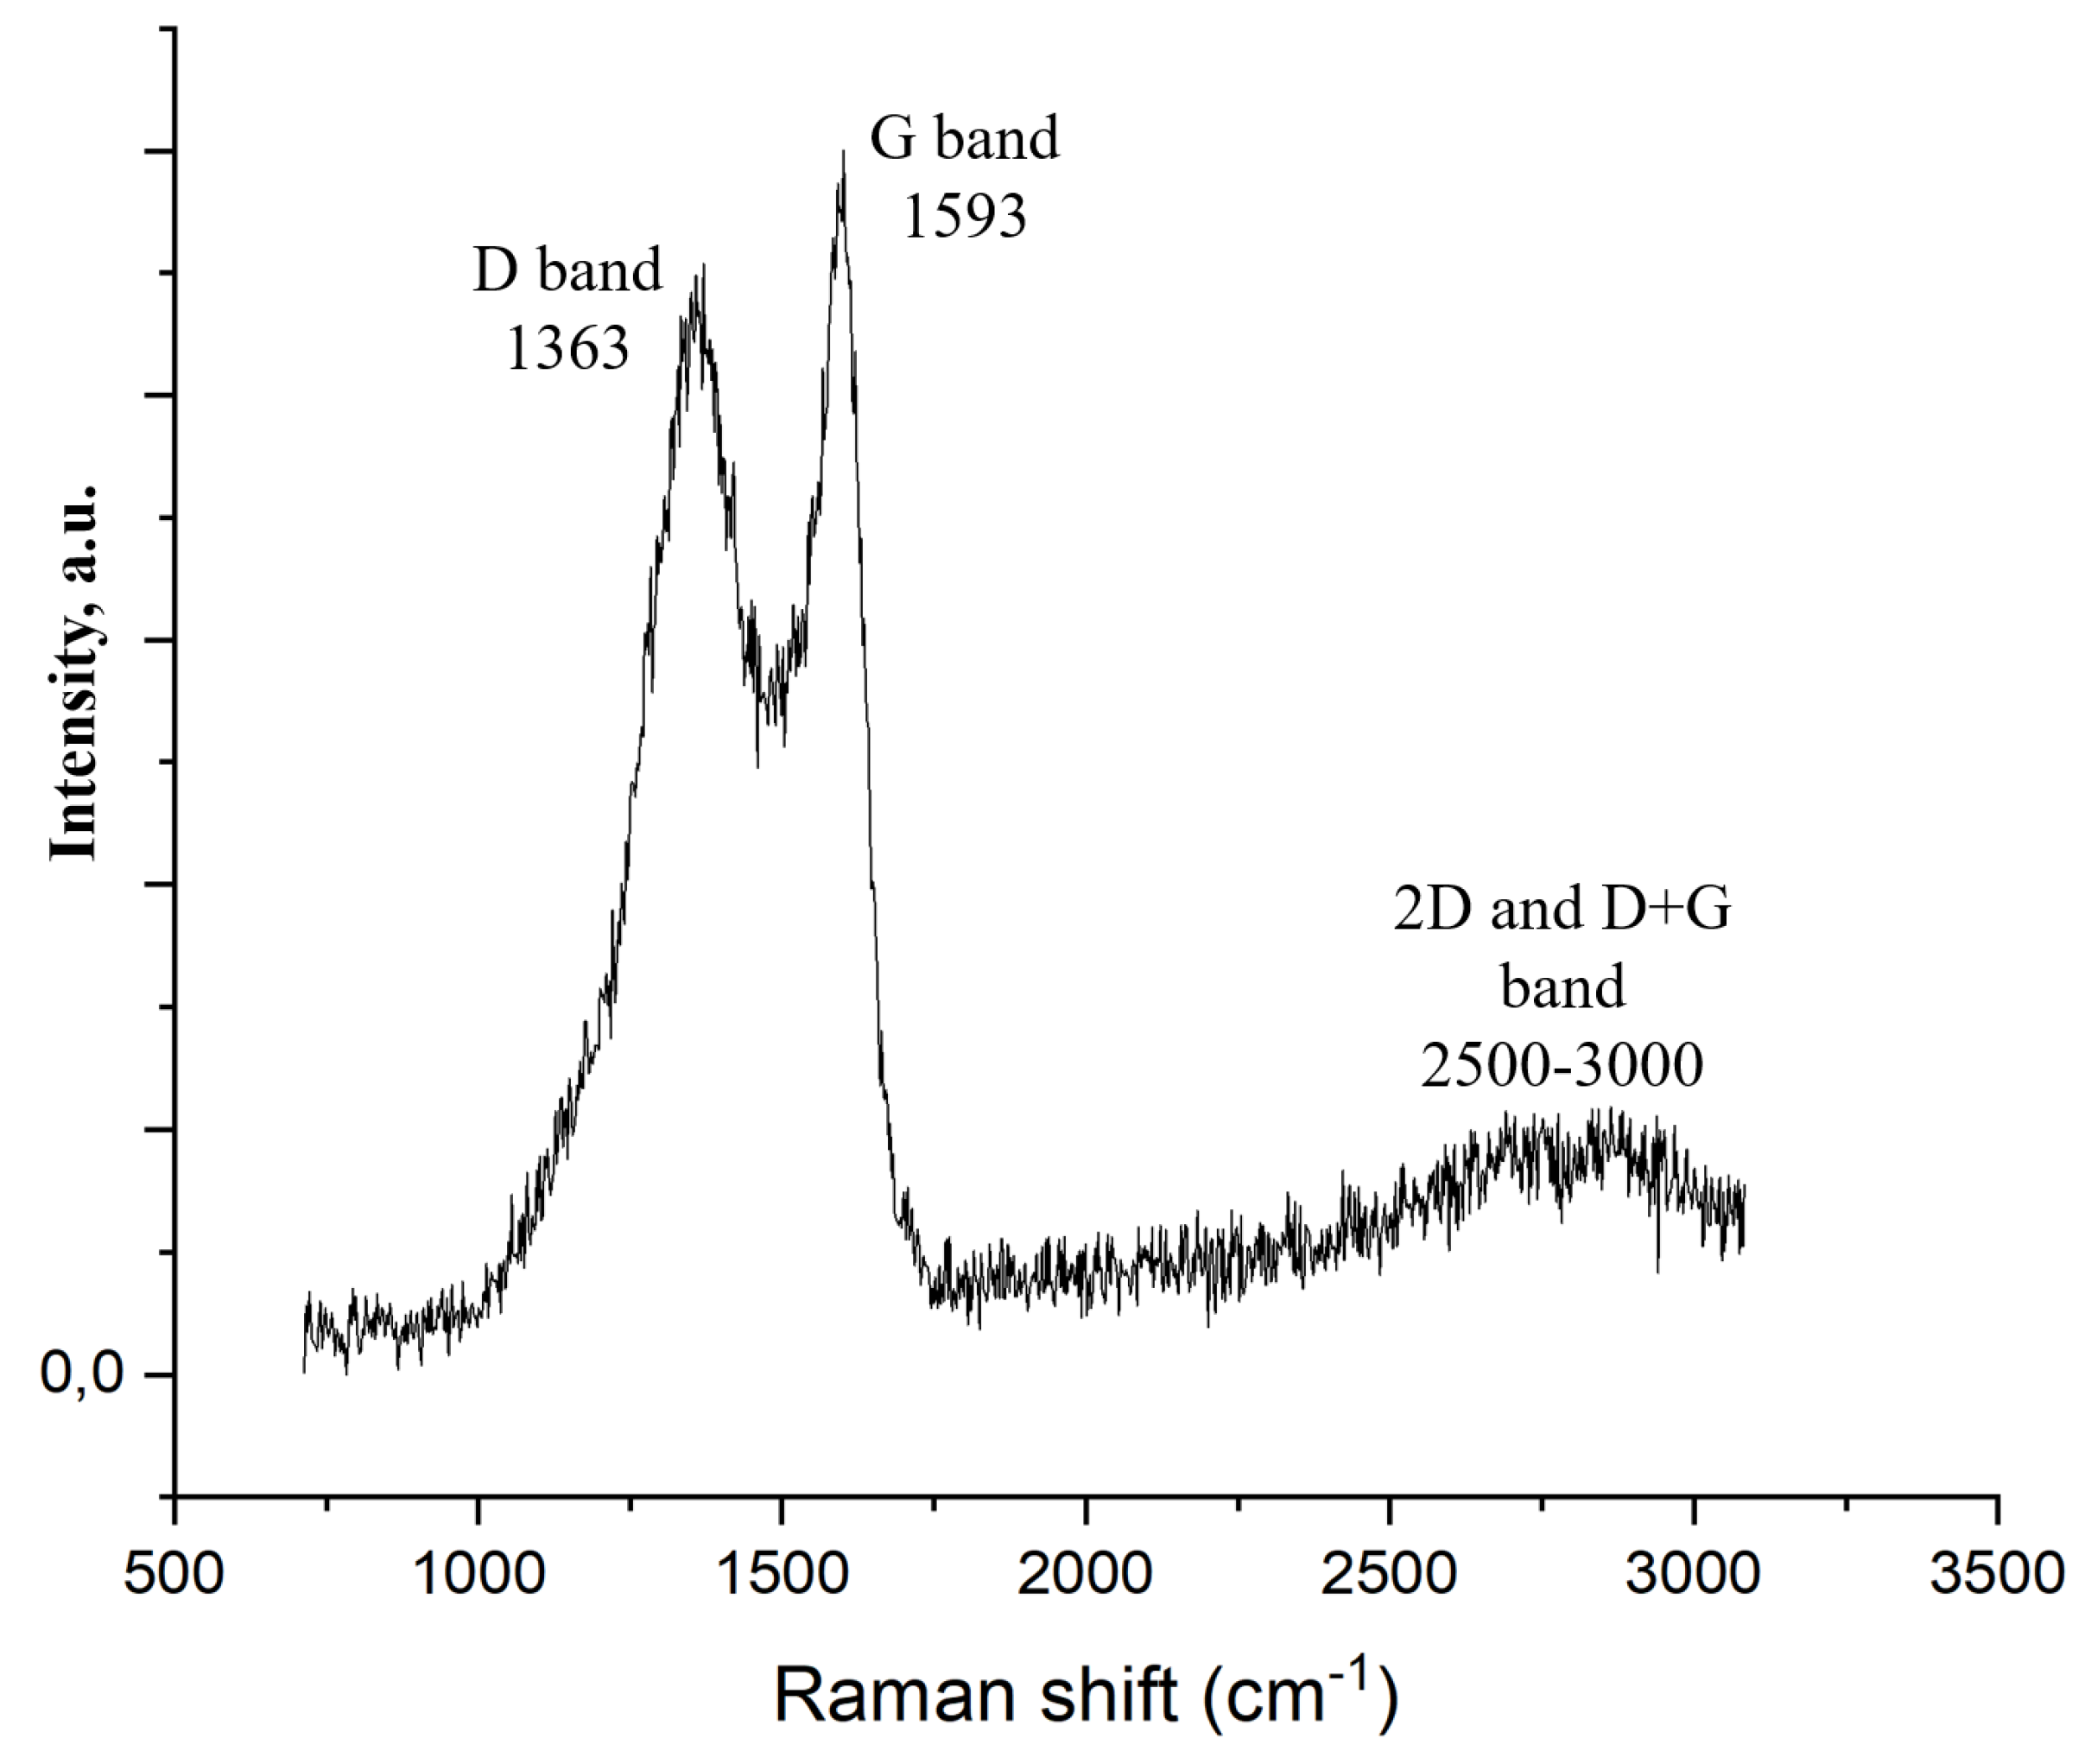
Figure 5.
CV of FLG (1) and AC (2) samples fabricated in 1 M LiClO4 aqueous solution: (a) at a potential sweep rate of 200 mVs −1; (b) 5 mVs −1.
Figure 5.
CV of FLG (1) and AC (2) samples fabricated in 1 M LiClO4 aqueous solution: (a) at a potential sweep rate of 200 mVs −1; (b) 5 mVs −1.
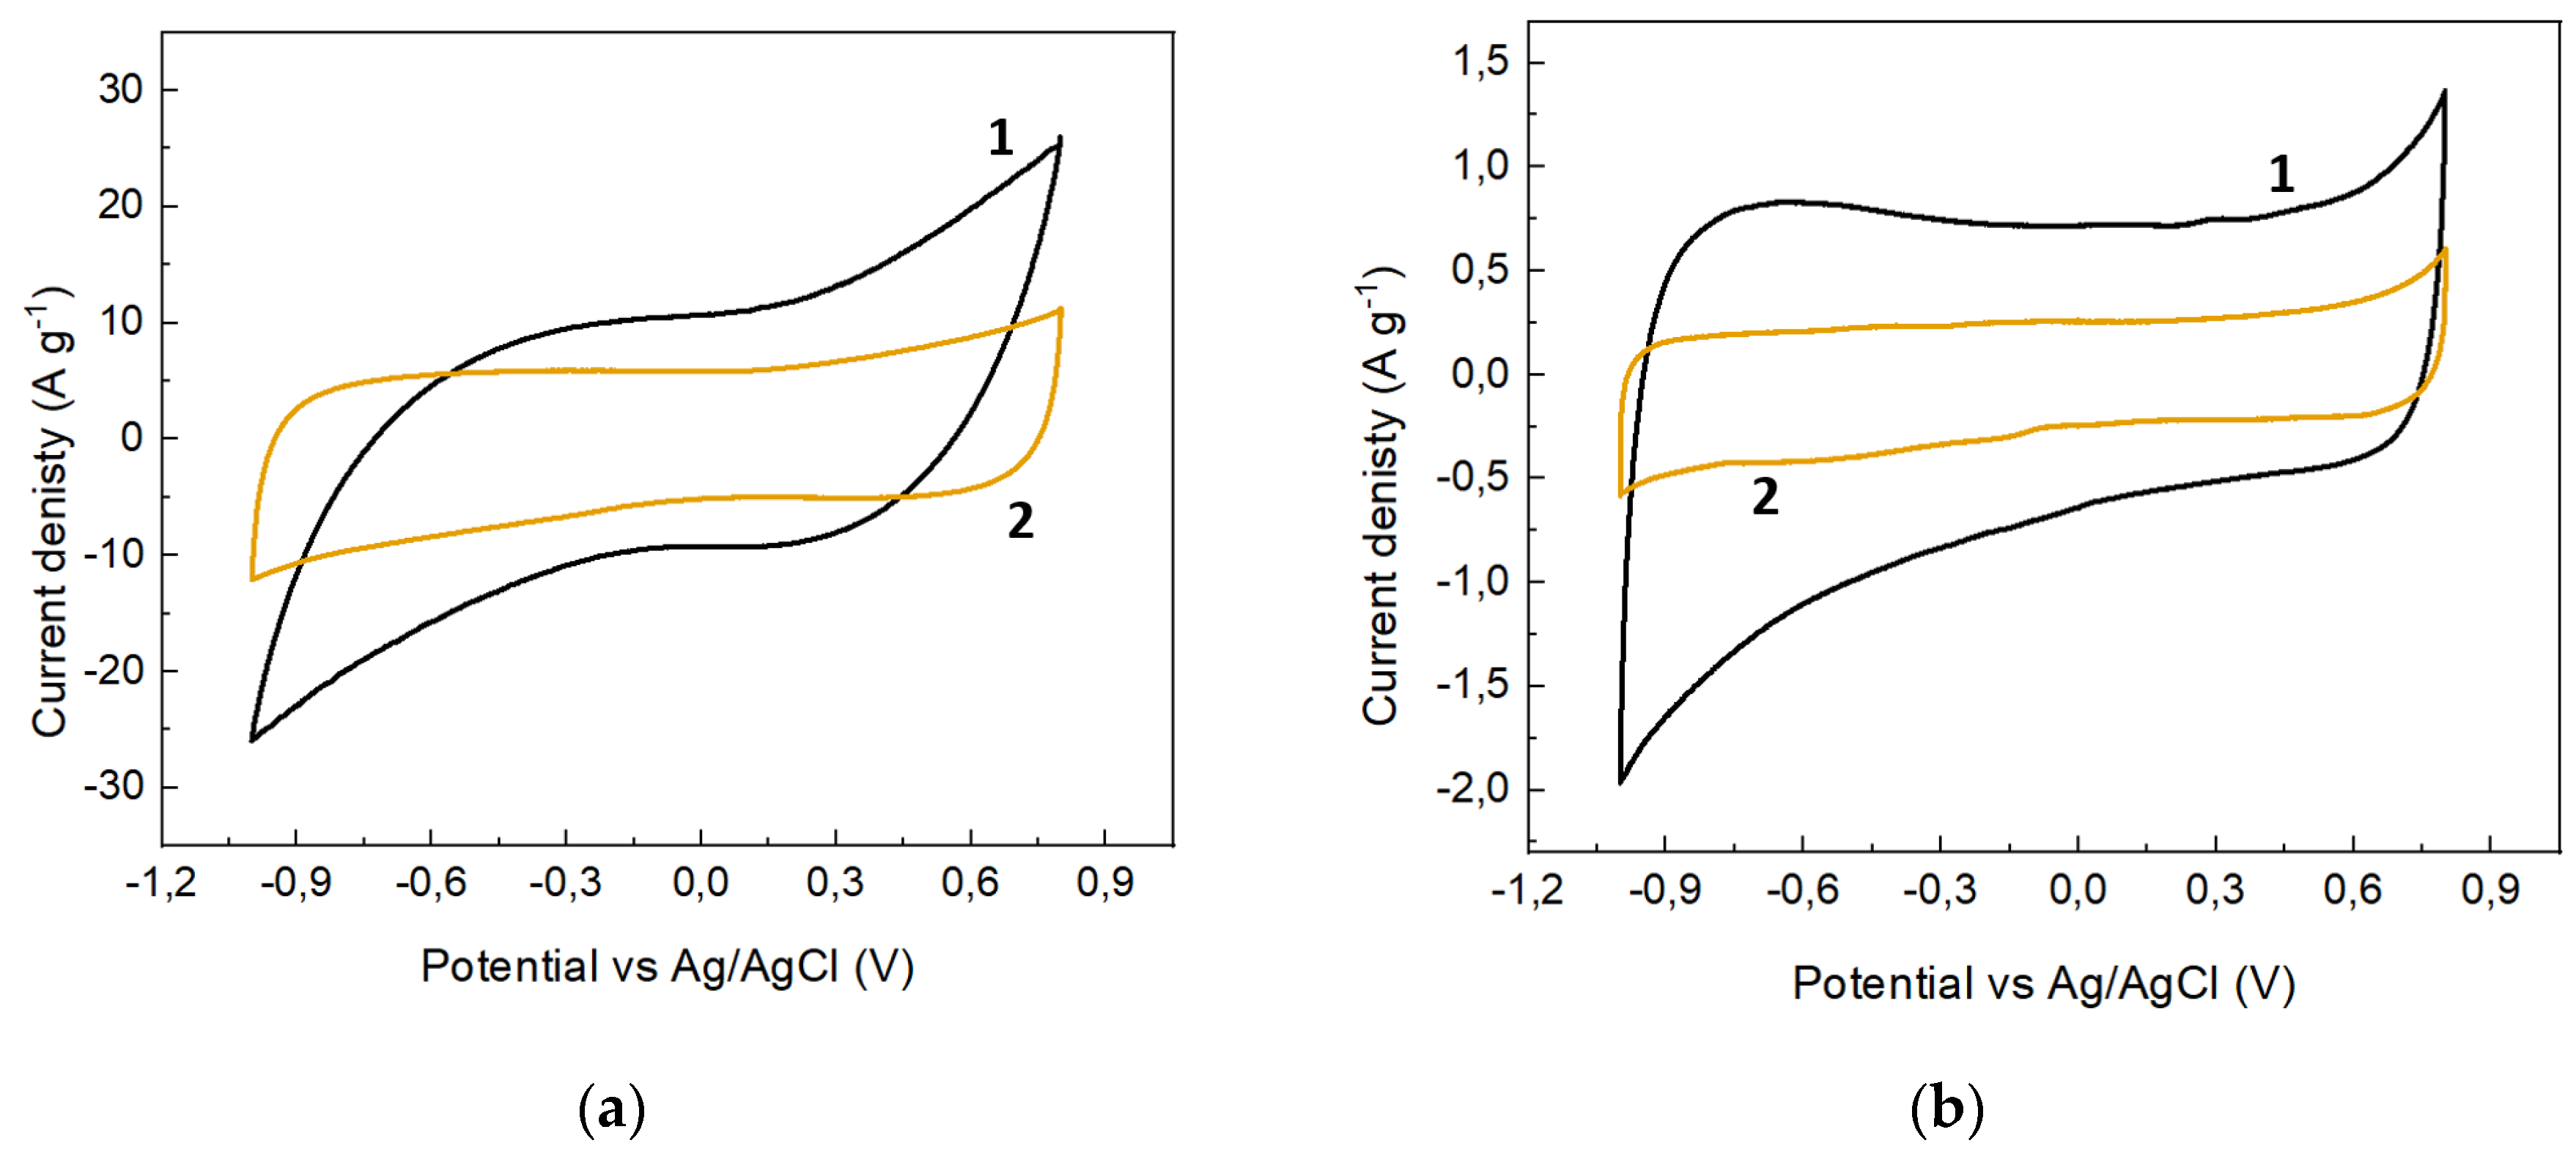
Figure 6.
Cyclic voltammograms in 1 M aqueous solution of LiClO4 at potential scan rates of 5–200 mVs-1 for: (a) FLG; (b) AC.
Figure 6.
Cyclic voltammograms in 1 M aqueous solution of LiClO4 at potential scan rates of 5–200 mVs-1 for: (a) FLG; (b) AC.
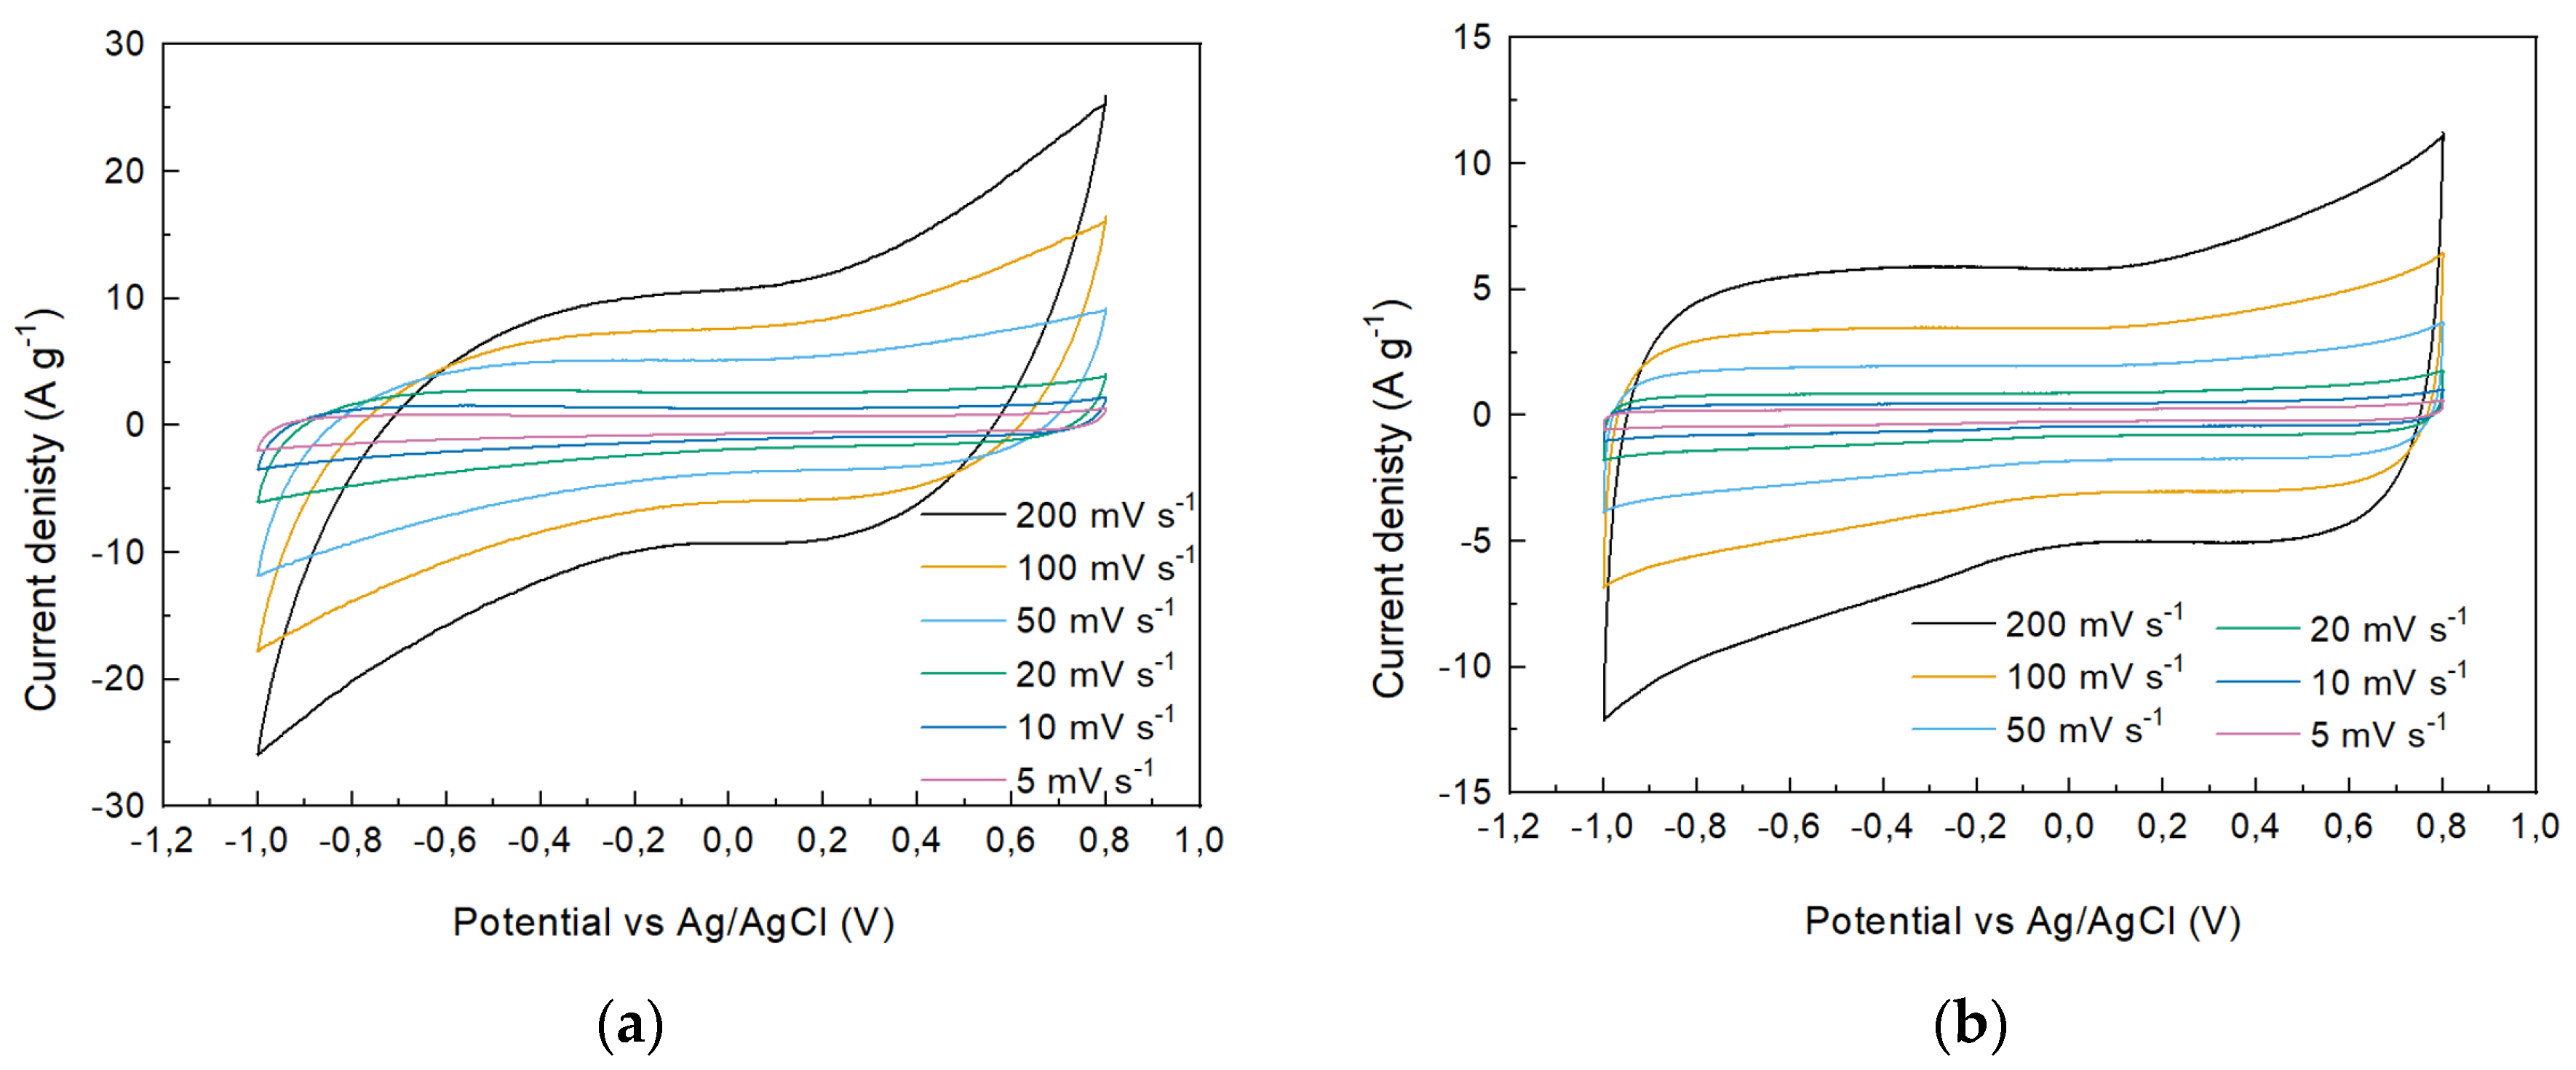
Figure 7.
lg(I)–lg(v) dependencies for: (a) FLG; (b) AC.
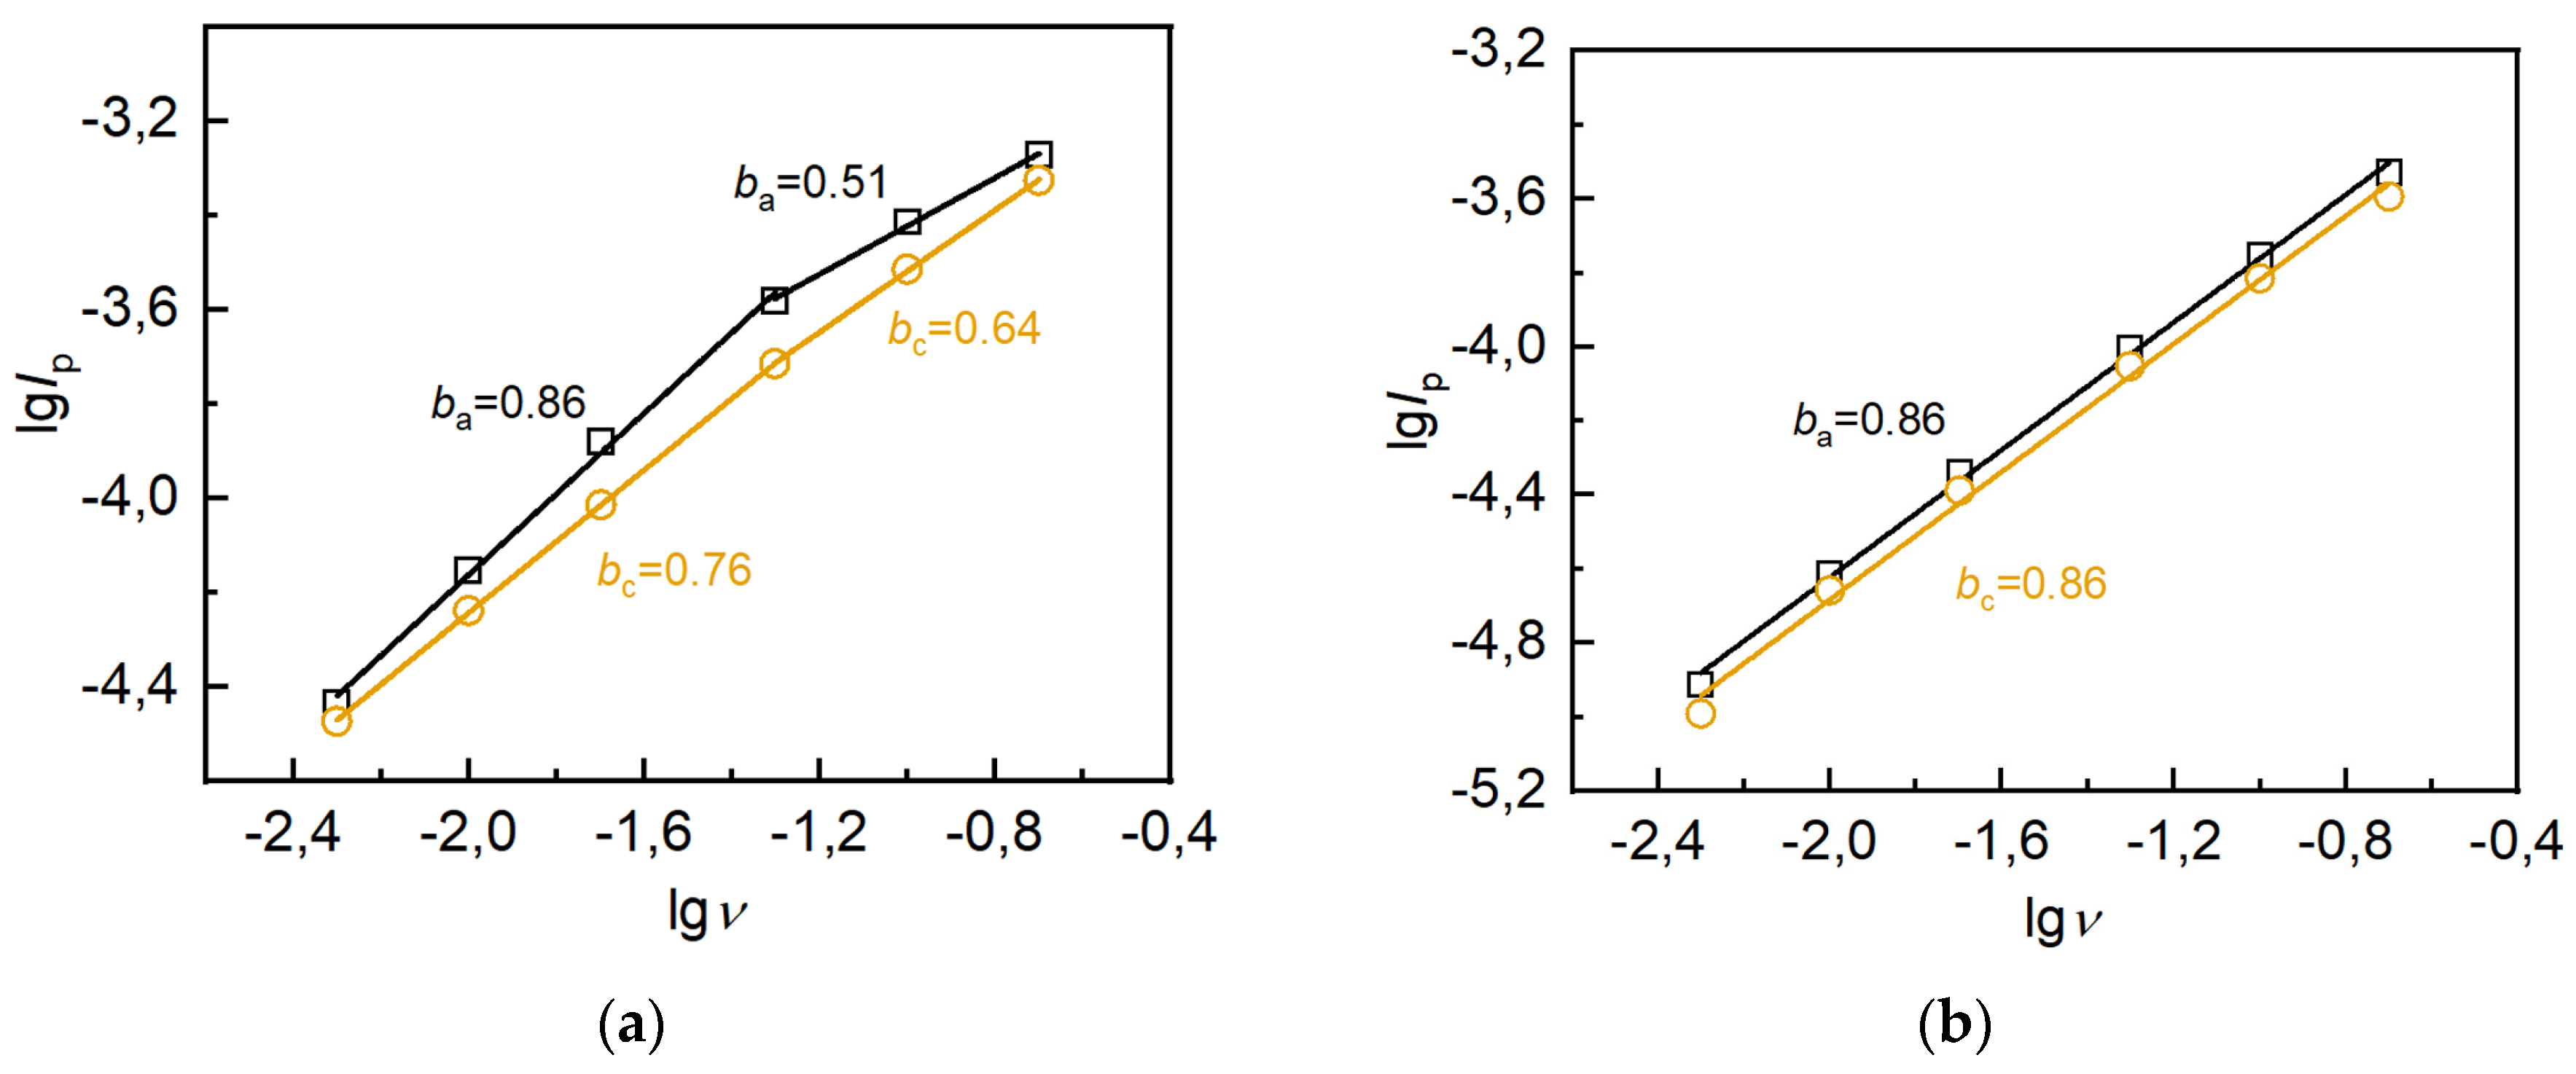
Figure 8.
Galvanostatic charge/discharge curves for a graphene sample made in a 1 M LiClO4 aqueous solution at current densities of 0.2 – 5 Ag–1 from: (a) FLG; (b) AC.
Figure 8.
Galvanostatic charge/discharge curves for a graphene sample made in a 1 M LiClO4 aqueous solution at current densities of 0.2 – 5 Ag–1 from: (a) FLG; (b) AC.
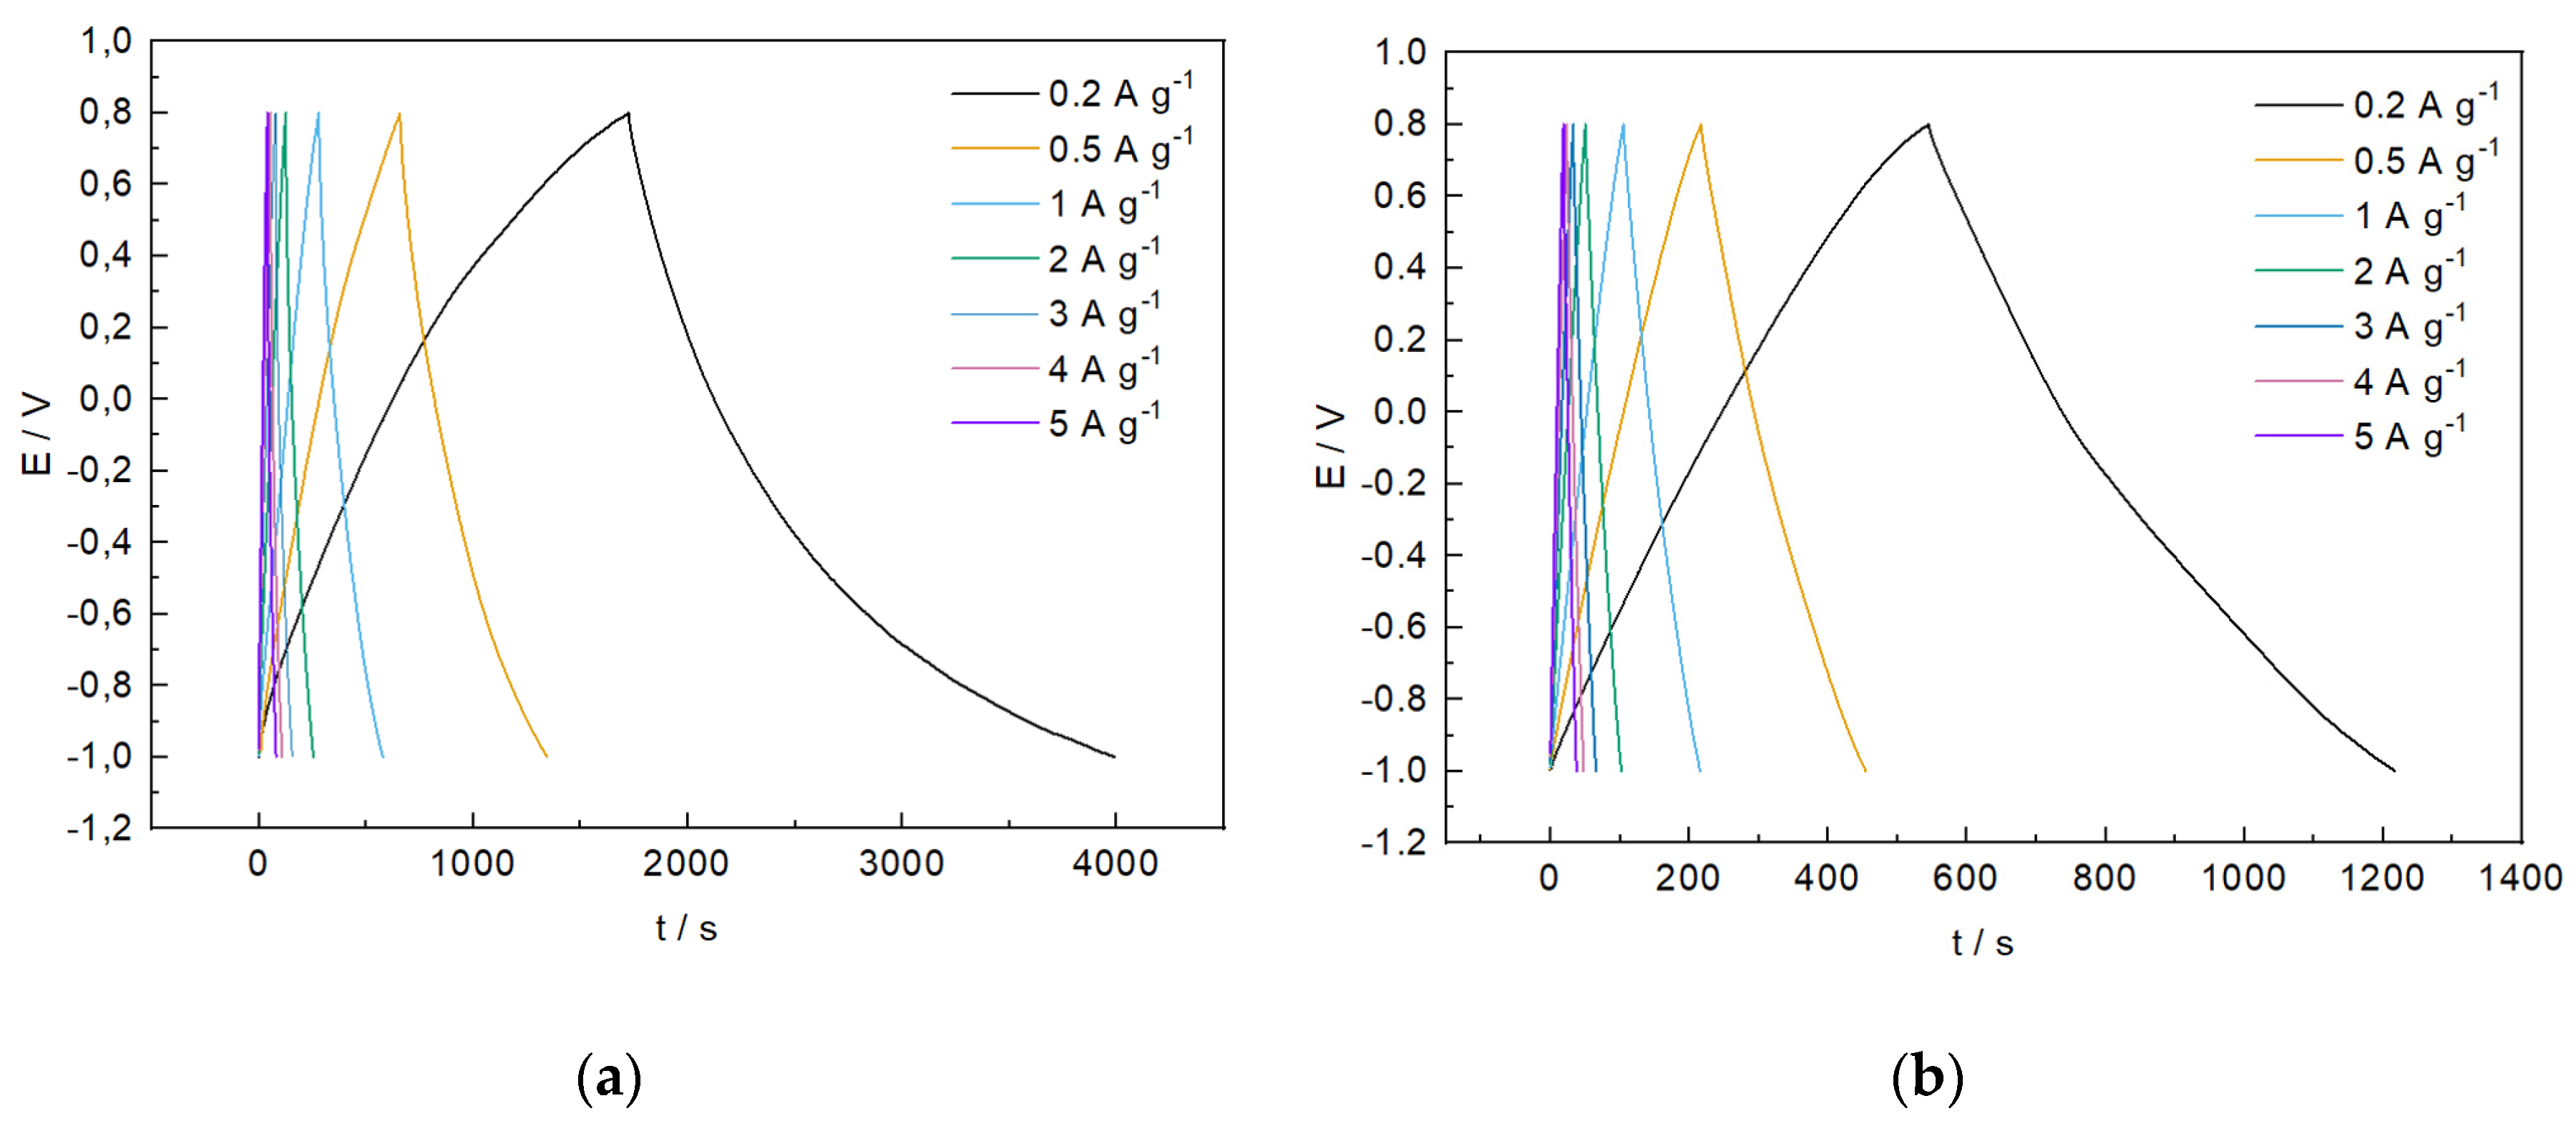
Figure 9.
Impedance spectra at OCP (open circuit potential) for electrodes FLG (1) and AC (2).
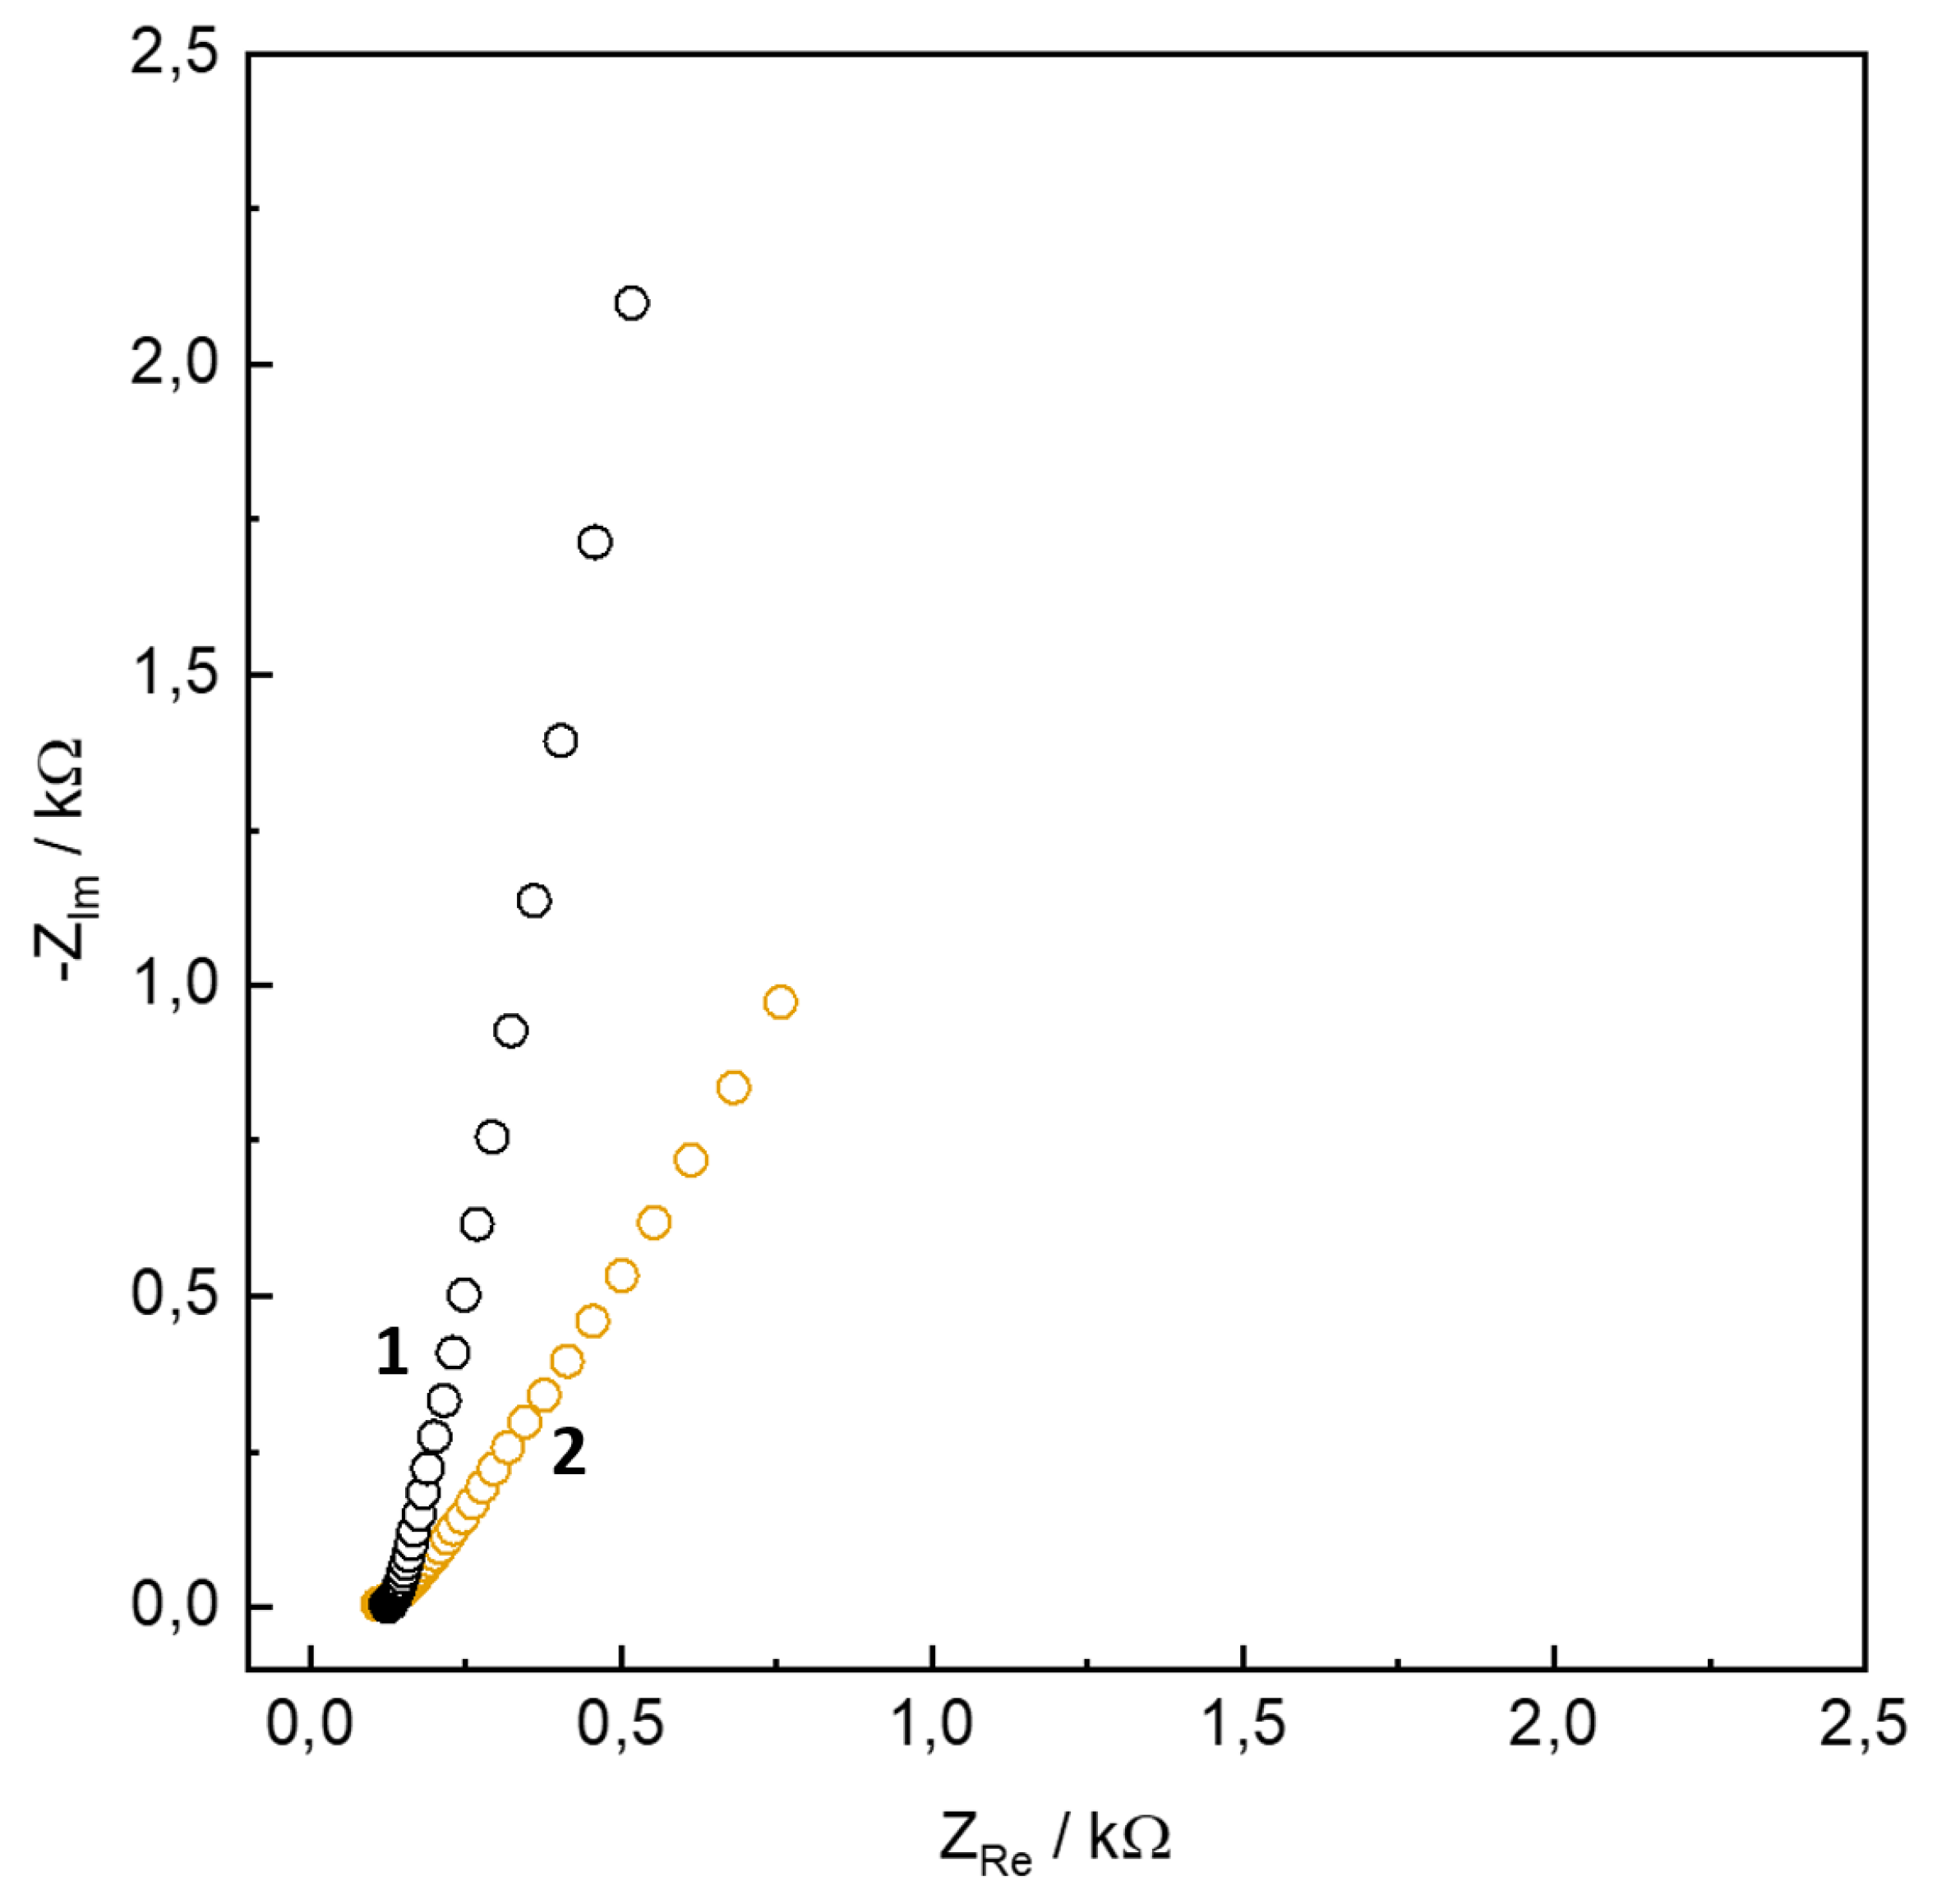
Figure 10.
Impedance spectra at OCP (open circuit potential) for electrodes FLG (1) and AC (2).
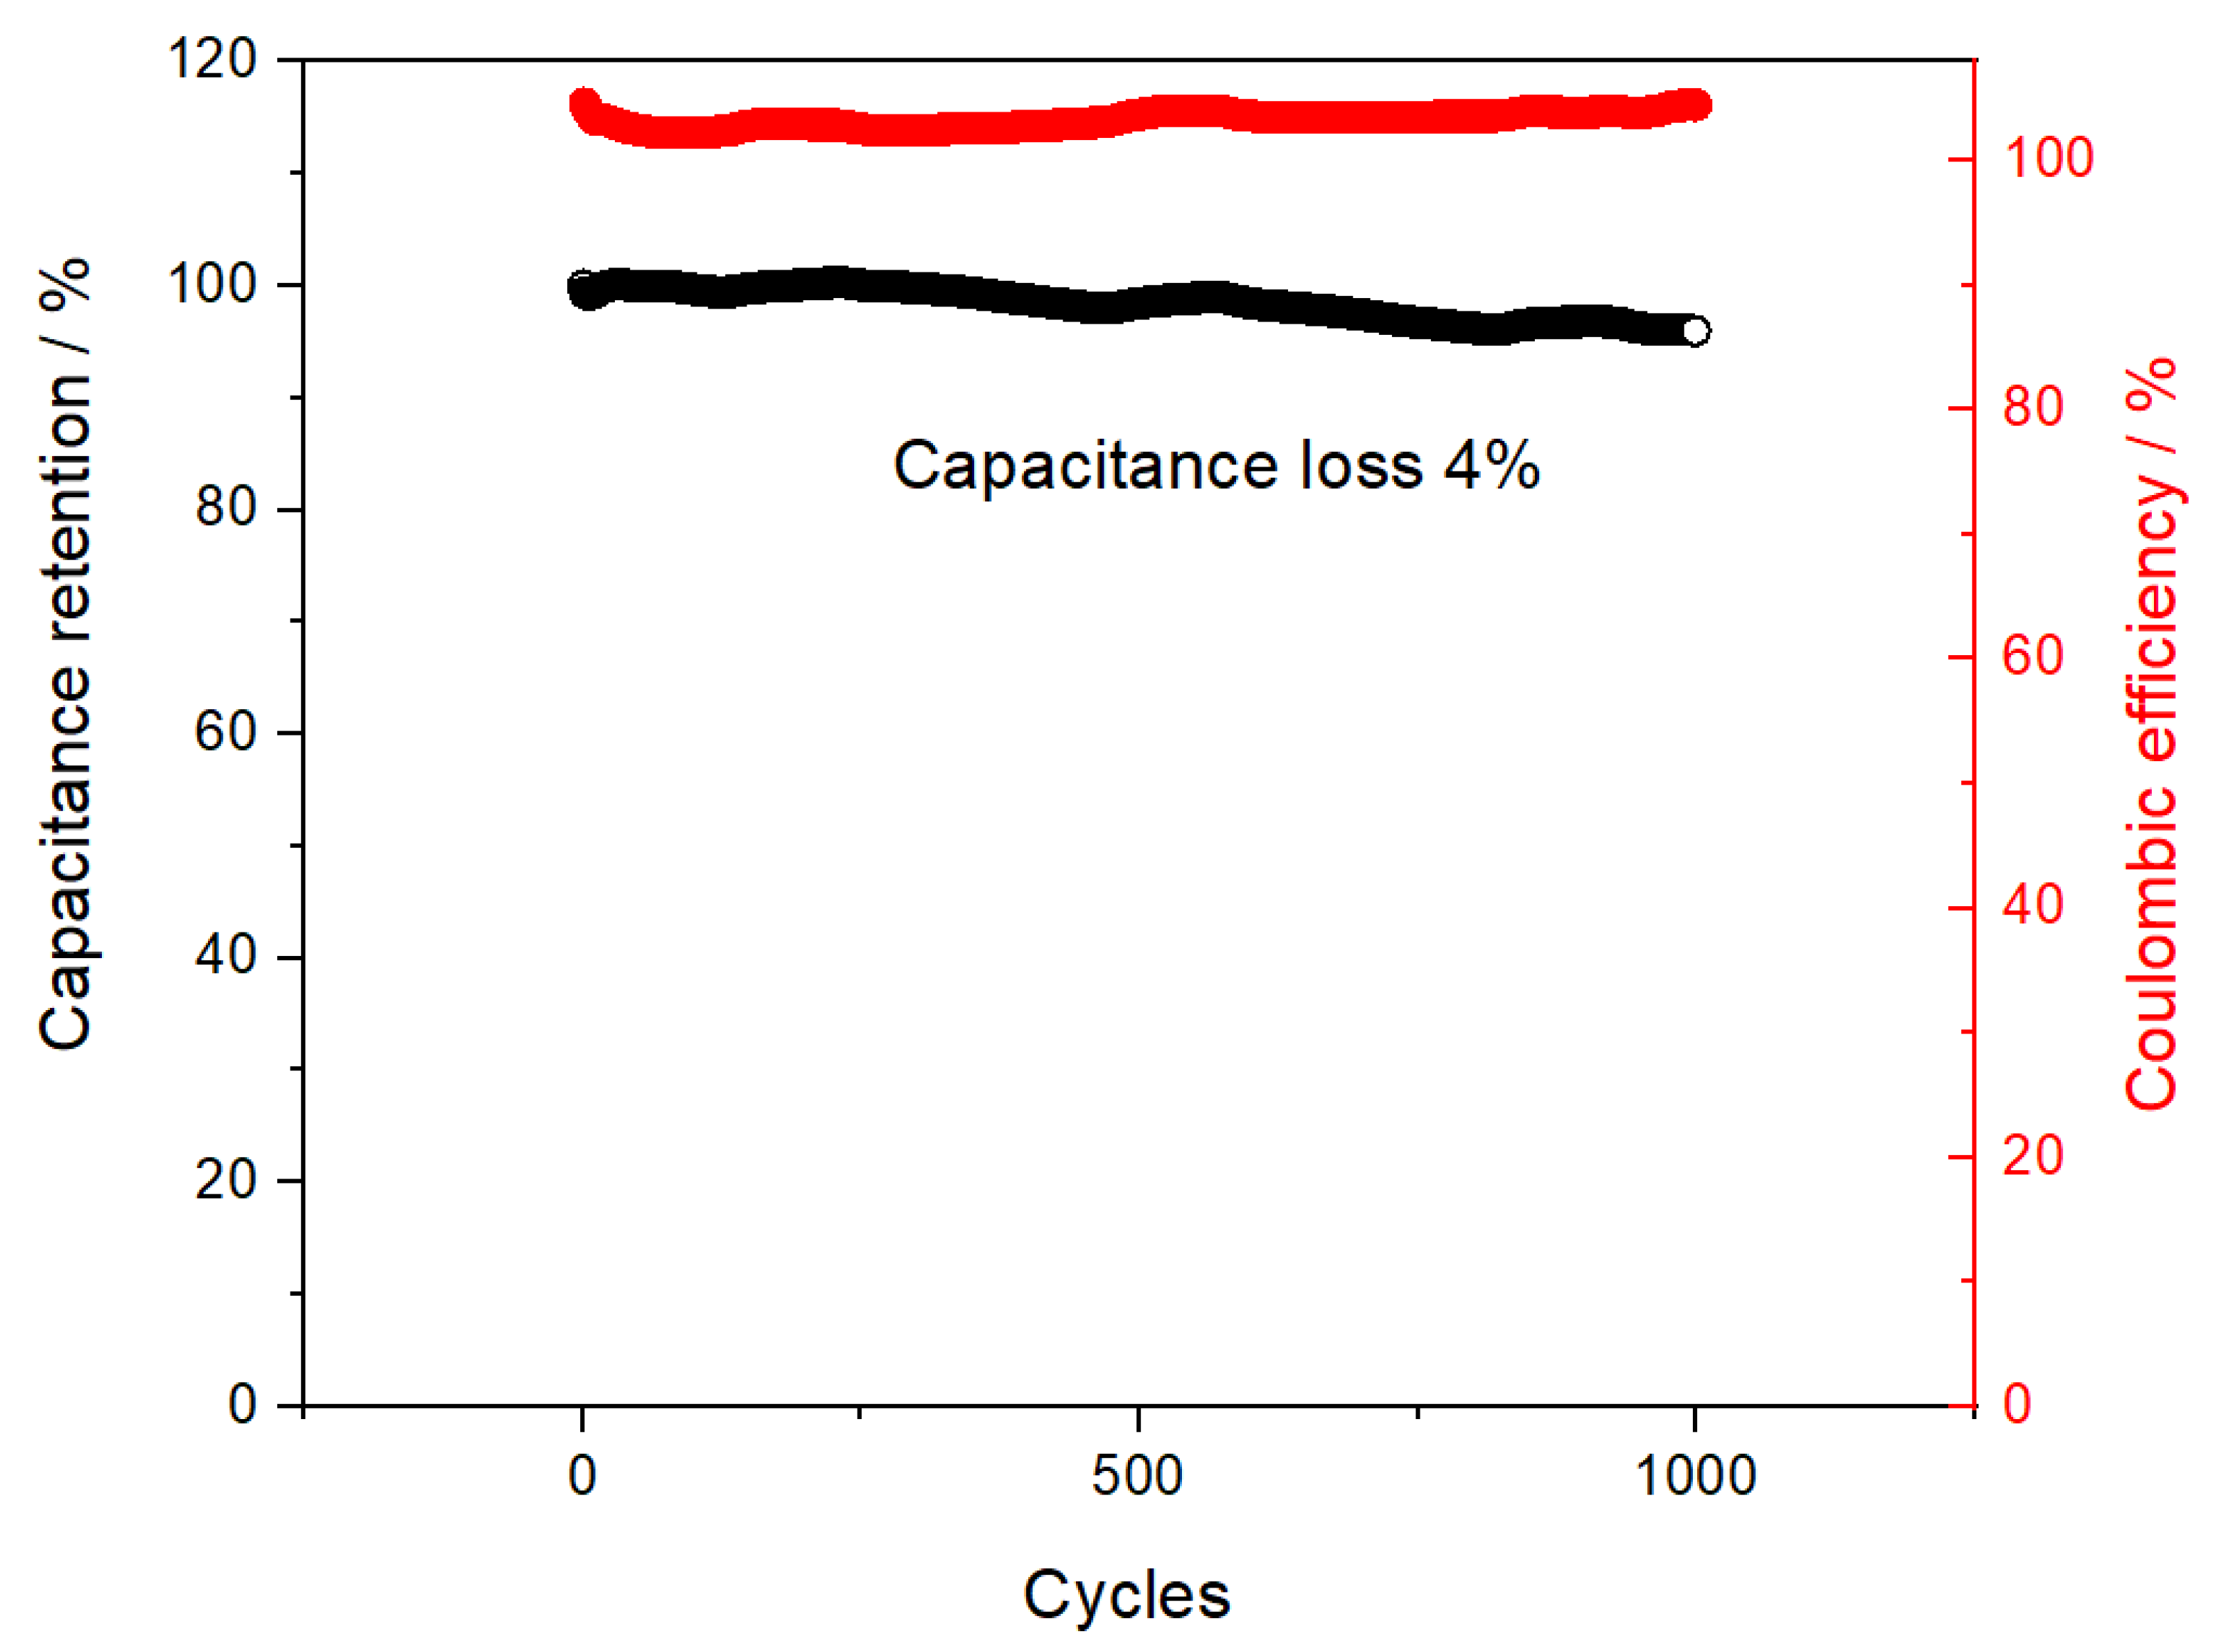

Table 1.
Capacitance from CV.
| s-1 | g-1 | |
|---|---|---|
| FLG | AC | |
| 200 | 65 | 35 |
| 100 | 83 | 38 |
| 50 | 105 | 43 |
| 20 | 135 | 50 |
| 10 | 151 | 57 |
| 5 | 170 | 65 |
Table 2.
Capacitance from GCD.
| g-1 | g-1 | |
|---|---|---|
| FLG | AC | |
| 0.2 | 265 | 75 |
| 0.5 | 194 | 67 |
| 1 | 168 | 62 |
| 2 | 145 | 58 |
| 3 | 130 | 56 |
| 4 | 121 | 54 |
| 5 | 113 | 52 |
Disclaimer/Publisher’s Note: The statements, opinions and data contained in all publications are solely those of the individual author(s) and contributor(s) and not of MDPI and/or the editor(s). MDPI and/or the editor(s) disclaim responsibility for any injury to people or property resulting from any ideas, methods, instructions or products referred to in the content. |
© 2023 by the authors. Licensee MDPI, Basel, Switzerland. This article is an open access article distributed under the terms and conditions of the Creative Commons Attribution (CC BY) license (http://creativecommons.org/licenses/by/4.0/).
Copyright: This open access article is published under a Creative Commons CC BY 4.0 license, which permit the free download, distribution, and reuse, provided that the author and preprint are cited in any reuse.


