
Submitted:
04 July 2023
Posted:
04 July 2023
You are already at the latest version
Abstract
Purpose: This study evaluates the performance of the Early Intervention Physiotherapist Framework (EIPF) for injured workers. This study provides a proper follow-up period (3 years) to examine the impacts of the EIPF program on injury outcomes such as return to work (RTW) and time to RTW. This study also identifies the factors influencing the outcomes. Methods: The study was conducted on data collected from compensation claims of people who were injured at work in Victoria, Australia. Injured workers who commenced their compensation claims after the first of January 2010 and had their initial physiotherapy consultation after the first of August 2014 are included. To conduct the comparison, we divided the injured workers into two groups: physiotherapy services provided by EIPF-trained physiotherapists (EP) and regular physiotherapists (RP) over the three-year intervention period. We used three different statistical analysis methods to evaluate the performance of the EIPF program. We used descriptive statistics to compare two groups based on physiotherapy services and injury outcomes. We also completed survival analysis using Kaplan-Meier curves in terms of time to RTW. We developed univariate and multivariate regression models to investigate whether the difference in outcomes achieved after adjusting for significantly associated variables. Results: The results showed that physiotherapists in the EP group on average dealt with more claims (over twice as many) than those in the RP group. Time to RTW for the injured workers treated by the EP group was significantly lower than for those who were treated by the RP group, indicated by descriptive, survival and regression analyses. Earlier intervention by physiotherapists led to earlier RTW. Conclusion: This evaluation showed that the EIPF program achieved successful injury outcomes three years after implementation. Motivating physiotherapists to intervene earlier in the recovery process of injured workers by initial consultation helps to improve injury outcomes.
Keywords:
Early Intervention
; Return to Work
; Physiotherapists
; Workers’ Compensation
; Evaluation
1. Introduction
Injuries or illnesses occurring at work have a substantial impact on individuals and the society [1]. Although most injured workers can successfully recover and achieve return to work (RTW) [2], RTW may take longer time for many injured workers. As the time that an injured worker is away from work gets longer, the likelihood of not returning to work increases [3]. Therefore, speedy and sustained RTW is the main goal of compensable injury systems, including those in Victoria, Australia such as WorkSafe Victoria (WSV) and Transport Accident Commission (TAC). To reach this goal, early identification of undesired outcomes [4], such as delayed RTW, and early intervention [5] to prevent the undesired outcomes would be beneficial.
Due to the important role of physiotherapists and their early intervention in occupational rehabilitation [6] and consequently in reducing the post-injury cost [7] and RTW [8], WSV in collaboration with TAC implemented the Early Intervention Physiotherapist Framework (EIPF) in 2014. The EIPF aimed to encourage physiotherapists who were working with compensable clients to work with clients early in the treatment program in relation to their RTW. The EIPF was implemented through an online training program for physiotherapists. This Framework was designed to encourage physiotherapists to engage clients in physical therapies early in the Occupational Rehabilitation (OR) process, with the aim of decreasing time to RTW, and improving RTW sustainability. Once the program was successfully completed and a physiotherapist was accredited, higher fees were paid for services provided by these EIPF physiotherapists to encourage participation. WSV also provided incentives for physiotherapists who had their initial consultation for injured workers within 7 month post-injury [9].
An initial evaluation was undertaken immediately post-EIPF program delivery [10]. However, the duration of this evaluation was too short (3 months) to identify data trends and determine the impact of the program on RTW outcomes. In [10], the authors suggested that another evaluation should be undertaken with a sufficient follow-up period. In the current study, we initiated the second evaluation to examine the performance of EIPF program three years after implementation in 2017. We also studied the differences in physiotherapy services and RTW outcomes for injured workers to examine the impact of the EIPF program on WSV clients.
1.1. Aims
This study aims to determine if the implementation of the EIPF program is associated with differences in the physiotherapy services provided or RTW outcomes for injured workers.
The study examines the following research questions:
RQ1. Are there differences in physiotherapy services provided to WSV clients between EIPF-trained physiotherapists (EP) and regular physiotherapists (RP) over the three-year intervention period (2014–2017)?
- Specifically, the type and number of services as well as the frequency of claims.
RQ2. Are there differences in the RTW outcomes of WSV clients treated by either EP or RP over the three-year intervention period (2014–2017)?
- Specifically, any difference between time taken from the injury date to RTW date, adjusting for explanatory variables (age, gender, type of injury and occupation) as required.
- The time to RTW is a common measure to evaluate the performance and success of injury intervention and healthcare improvement programs [11, 12].
1.2. Definitions
The following definitions are used in the data analysis:
- EIPF – Early Intervention Physiotherapy Framework program (the intervention)
- EP – Physiotherapists who completed EIPF program
- RP – Regular physiotherapists who did not complete the EIPF program
- WSV – WorkSafe Victoria.
2. Materials and Methods
To evaluate differences between types of physiotherapists and the effectiveness of the EIPF on client outcomes (addressing the research questions), a comparison of EP and RP was made. To assess the impact of the EIPF program, only claims which were served exclusively by physiotherapists of either the EP or RP group were analyzed. We should mention that the manuscript complies with TRIPOD statement [13] using TRIPOD checklist (the checklist can be found in the Appendix).
2.1. Data
The source of data is the Compensation Research Database (CRD) which was held by the Institute for Safety, Compensation and Recovery Research (ISCRR). The CRD includes the details of all claims, payments, services, hospital admissions and medical certificates for WSV since 1985. It is an administrative database which is fully de-identified, and consent to use data for research purposes is obtained from clients [14, 15]. The selection criteria for claims included in this study are as follows:
- Claims that had at least one day of wage compensation payment (standard time loss claims) with the injury date on or after the first of January 2010,
- Claims that had physiotherapy services provided either by EP or RP,
- Claims that had their initial physiotherapy consultation on or after the first of August 2014,
- If claims resulted in RTW, only claims with RTW on or after the date of initial consultation were included.
According to the selection criteria, 17,991 claims were identified from which 7,363 claims were served only by the EP group, 3,998 claims were served only by the RP group and 6,630 claims were served by a mix EP and RP groups. To provide a better investigation on the performance of EIPF program, the claims in the mixed group were excluded from further analysis.
2.2. Outcomes
Time to RTW is calculated as the number of days between the injury date and the resumed work date. Comparing this outcome between two groups allows for an analysis of the effectiveness of the EIPF on client RTW outcome.
2.3. Analysis
Different data analysis approaches have been used to answer the research questions. We used descriptive statistics to comprehensively compare the differences between the EP and RP groups in terms of physiotherapy services provided to clients and time to RTW.
We performed survival analysis using Kaplan–Meier curves to estimate the probability of RTW in each time interval. Kaplan-Meier curves are commonly used tools to analyze ‘time-to-event’ data [16]. These have been used widely in healthcare areas such as job survival of impaired employees [17] and vision loss after Diabetic Vitrectomy surgery [18]. In this study, we used time to RTW in survival analysis. We also used the log-rank test, which is a non-parametric test, to compare survival curves between two groups.
We assessed the association between time to RTW and claimants’ characteristics, as predictors, using univariate regression analysis. These predictors are gender, age, type of injury and occupation. We also used multivariate regression to determine whether there is a difference in RTW outcomes achieved after adjusting for variables which are significantly associated with the RTW outcome.
3. Results
This section presents the results of data analyzes on the evaluation of the EIPF program across EP and RP groups.
3.1. Descriptive Statistics
3.1.1. Description of Dataset
Table 1 summarizes the claimants’ characteristics for injured workers in the EP and RP groups. All percentages are out of the total population of each group. For age groups, our groups are aligned with the relevant studies derived from CRD [19]. For injury types and occupation groups, we kept the WSV-defined categories. The results show that the groups were not statistically different in terms of client age, gender, injury type or occupation. This provides a fair baseline from which to compare the two groups based on physiotherapy services.
3.1.2. Services and Claims
In this section, we compare two groups in terms of physiotherapy services provided to clients (addressing RQ1). Physiotherapists use a variety of techniques (or services) to treat their clients and support them to RTW after injury. The average services per claim and average number of claims for each physiotherapist type (even if there were multiple physiotherapists servicing the claim) is shown in Table 2.
The average number of claims each physiotherapist treated was significantly higher in the EP group than the RP one. In the EP group, each physiotherapist treated about 10 claims, whereas in the RP group, each physiotherapist only treated 4–5 claims over the three-year period. The average number of services provided per claim was not different between the two groups.
3.1.3. Time to Achieving RTW
In this section, we evaluate differences between EP and RP groups based on time to RTW (addressing RQ2). Table 3 shows the results for the days taken from injury date to RTW date.
The results show that the time from the date of injury to the RTW date was significantly shorter (on average about 3 weeks shorter) for clients treated by the EP group compared to the RP group.
3.2. Survival Analysis
In this section, we perform survival analysis based on time to RTW (addressing RQ2). Figure 1 shows the Kaplan-Meier curves for EP and RP groups up to 1000 days post-injury (about three years).
Table 4 presents the percentages of RTW and outputs of a log-rank test to examine the difference of Kaplan-Meier curves in the periods of 3, 6, 12, 24 and 36 months.
The log-rank test shows that the difference in the time to RTW were statistically significant by physiotherapist type (EP vs RP; χ2 statistic 10.58, p-value < 0.001) for all claims. Table 5 shows that the difference in the time to RTW becomes significant for clients who achieved their RTW in 2 year (χ2 statistic 6.94, p-value <0.001) and in 3 years (χ2 statistic 12.1, p-value <0.001) post-injury. These results provide supporting evidence for the importance of this study having a follow-up period of three years.
3.3. Regression Analysis
Regression analysis examines the association between time to RTW and claimant’s characteristics. Only clients that were treated by either EP or RP groups were included and both univariate and multivariate regression were used to examine the relationship between predictors and RTW outcomes.
3.3.1. Univariate Analysis
Table 5 shows that age and injury type were significant predictors in determining RTW outcome. However, gender and occupation were not. There was also a significant difference in RTW outcomes by physiotherapy group, with those in the EP group returning to work 21 days faster than the RP group.
3.3.2. Multivariate Analysis
We created a multivariate model to perform the regression analysis. The multivariate model adjusted the time to RTW for age and injury type, given the observed statistical association, and examined differences between the outcome between EP and RP groups. A significant difference remained, with injured workers in the EP group still RTW 21 days faster than those in RP group (Table 5).
4. Discussion
The objective of this study was to describe the outcomes of an evaluation of the effects of the Early Intervention Physiotherapist Framework (EIPF) program on the return to work (RTW) outcomes for injured Victorian workers. The RTW outcomes were assessed three years after initial implementation of the EIPF and the effects on clients were examined in comparison with clients treated by physiotherapists not trained in the EIPF (RP group).
Within the examination period, comparing physiotherapists with EIPF training (EP group) to RP group revealed the following results:
- Physiotherapists in the EP group visited more WSV clients per physiotherapist (average of 10.2 claims) than those in the RP group (average of 4.6 claims) over the three-year period.
- Injured workers returned to work on average 25 days sooner when treated by EP compared with RP. This could be a direct result of EIPF by motivating physiotherapists (EP group) for earlier post-injury intervention.
- Survival analysis showed that the clients of the EP group returned to work significantly faster than the RP group. After two years, this difference became statistically significant shown by the log-rank test, confirming the necessity of three-year follow-up analysis such as that performed in this study.
- The time to return to work was significantly associated with age and injury type in both physiotherapy groups. Younger injured workers (between 15 and 24 years old) with fractures had returned to work faster, and the injured workers between 45 and 54 years old with musculoskeletal injuries had taken more time to get back to work.
- After adjusting age and injury type variables, injured workers in the EP group still returned to work significantly faster than those treated in the RP group (by 21 days). These results show that the difference between the two groups was substantially related to the early intervention by EP physiotherapists post-injury.
The results support the positive findings of the initial study [10] on EIPF program (3 months after initiating the program) in terms of adhering to EIPF goals and RTW outcomes.
Strengths and Limitations
The main strength of this study is the use of a well-structured and population-based dataset to evaluate the performance of the early intervention program. The findings result in an insightful conclusion on the important factors that affect RTW outcomes.
The main limitation of this study is that the data are for injured workers in Victoria, Australia. Therefore, the results cannot be generalized to every group of patients. The data we used in this study are administrative and payment data, which meant we relied on wage compensation to define RTW. Also, because the payment date for the physiotherapy services could be different from the actual date of receiving the service, the time to the first consultation session cannot be reliably calculated. Hence, we did not include this indicator in the analyses.
5. Conclusions
This evaluation has shown that three years after implementation, the EIPF resulted in positive outcomes for injured workers. More claims were managed by physiotherapists trained in EIPF than non-EIPF physiotherapists. The earlier intervention by physiotherapists (possibly within seven months post-injury) due to the incentives and the increased reimbursement provided by WSV for services led to faster return to work and better outcomes for the injured worker.
Further monitoring of outcomes and performance will be important to ensure gains continue to be made on the time taken to the initial consultation post-injury, as it seems that any small improvement in this aspect can have a significant impact on the RTW outcomes of injured workers. Early intervention programs and follow-up studies can be used in other allied health professions like chiropractic and osteopathy that play similar roles to physiotherapists in treating injured workers.
Author Contributions
Conceptualization, H.K. and A.D.; methodology, H.K. and A.D.; validation, H.K., U.A. and A.D.; formal analysis, H.K.; investigation, H.K.; data curation, H.K.; writing—original draft preparation, H.K.; writing—review and editing, H.K. and U.A.; visualization, H.K.; supervision, U.A. and A.D. All authors have read and agreed to the published version of the manuscript.
Funding
This study is funded by WorkSafe Victoria (WSV) through the Institute of Safety, Compensation and Recovery Research (ISCRR).
Institutional Review Board Statement
This article does not contain any studies with human participants performed by any of the authors.
Informed Consent Statement
Statement not required. This study was performed using a de-identified administrative dataset, with ethics approval granted by Monash University Human Research Ethics Committee (CF09/3150—2009001727).
Acknowledgments
This study is funded by WorkSafe Victoria (WSV) through the Institute of Safety, Compensation and Recovery Research (ISCRR). ISCRR is a joint initiative of WorkSafe Victoria, the Transport Accident Commission (TAC) and Monash University.
Conflicts of Interest
The authors declare that they have no conflict of interest.
Appendix
| Title and abstract | ||
| 1 | Title | Our paper includes a title which reflects the aim of the study |
| 2 | Abstract | Our paper includes an abstract which provides a summary of background, objectives, study design, participants, predictors, outcomes, statistical analysis, results and conclusions. |
| Introduction | ||
| 3 | Background and objectives | Our paper specifies the objectives, explains the background of the study and refers to existing studies. |
| Methods | ||
| 4 | Source of data | Our paper describes the source of data and specifies the selection criteria. |
| 5 | Participants | Our paper specifies who participated in the study. |
| 6 | Outcome | Our paper defines the outcomes clearly. |
| 7 | Predictors | Our paper clearly explains all predictors used in analyses. |
| 8 | Sample size | Our paper mentions the sample size for both intervention and control groups. |
| 9 | Missing data | There were no missing data. |
| 10 | Statistical analysis methods | Our paper describes all the statistical analysis methods used in the study. |
| 11 | Risk groups | We did not have any risk group in our study. |
| 12 | Development vs validation | Our paper compares the distribution of categories in intervention and control groups. |
| Results | ||
| 13 | Participants | Our paper includes descriptive statistics about participants. |
| 14 | Model development | Our paper compares two groups using descriptive statistics, survival analysis and regression models. |
| 15 | Model specification | Our paper reports all parameters associated with the statistical analysis methods. |
| 16 | Model performance | Our paper presents the results of statistical tests for comparison. |
| 17 | Model updating | Our paper explains how we adjusted for the impact of other predictors on the comparison. |
| Discussion | ||
| 18 | Limitations | Our paper lists limitations and refers to potential future work to address these. |
| 19 | Interpretation | Our paper discusses the results and interprets the outcomes considering the research questions and goals. |
| 20 | Implications | Our paper discusses how the results provide insights on the performance of an early intervention program. |
| Other information | ||
| 21 | Supplementary information | Our paper provides information about ethics. |
| 22 | Funding | Our paper acknowledges the source of funding for the study. |
References
- Berecki-Gisolf, J., A. Collie, and R.J. McClure, Determinants of physical therapy use by compensated workers with musculoskeletal disorders. Journal of Occupational Rehabilitation, 2013. 23(1): p. 63-73.
- Centre, T.S.R. Return to work survey - 2016 (Australia and New Zealand). 2016; Available from: https://www.safeworkaustralia.gov.au/system/files/documents/1703/return-to-work-survey-2016-summary-research-report_0.pdf.
- Pransky, G., et al., Improving return to work research. Journal of Occupational Rehabilitation, 2005. 15(4): p. 453-457.
- Khorshidi, H.A., et al., Early identification of undesirable outcomes for transport accident injured patients using semi-supervised clustering. Studies in health technology and informatics, 2019. 266: p. 1-6.
- Nicholas, M., et al., Implementation of Early Intervention Protocol in Australia for ‘High Risk’Injured Workers is Associated with Fewer Lost Work Days Over 2 Years Than Usual (Stepped) Care. Journal of occupational rehabilitation: p. 1-12.
- Association, A.P. The physiotherapists' role in occupational rehabilitation. 2012; Available from: https://www.physiotherapy.asn.au/DocumentsFolder/APAWCM/Advocacy/PositionStatement_2017_Thephysiotherapist%E2%80%99s_role_occ_rehabilitation.pdf.
- Donovan, M., A. Khan, and V. Johnston, The Contribution of Onsite Physiotherapy to an Integrated Model for Managing Work Injuries: A Follow Up Study. Journal of Occupational Rehabilitation, 2021. 31(1): p. 207-218.
- St-Georges, M., N. Hutting, and A. Hudon, Competencies for Physiotherapists Working to Facilitate Rehabilitation, Work Participation and Return to Work for Workers with Musculoskeletal Disorders: A Scoping Review. Journal of Occupational Rehabilitation, 2022. 32(4): p. 637-651.
- Victoria, W. Early Intervention Physiotherapy Framework (EIPF) 2020; Available from: https://www.worksafe.vic.gov.au/early-intervention-physiotherapy-framework-eipf.
- Gosling, C., et al., Strategies to enable physiotherapists to promote timely return to work following injury. 2015.
- Awang, H. and N. Mansor, Predicting Employment Status of Injured Workers Following a Case Management Intervention. Safety and Health at Work, 2017.
- Choi, K., et al., Time to return to work following workplace violence among direct healthcare and social workers. Occupational and Environmental Medicine, 2020.
- Collins, G.S., et al., Transparent reporting of a multivariable prediction model for individual prognosis or diagnosis (TRIPOD): the TRIPOD Statement. BMC Medicine, 2015. 13(1): p. 1.
- Khorshidi, H.A., B. Hassani-Mahmooei, and G. Haffari Hassani-Mahmooei, and G. Haffari, An Interpretable Algorithm on Post-injury Health Service Utilization Patterns to Predict Injury Outcomes. Journal of Occupational Rehabilitation, 2020. 30: p. 331–342.
- Prang, K.H., B. Hassani-Mahmooei, and A. Collie, Compensation Research Database: population-based injury data for surveillance, linkage and mining. BMC Research Notes, 2016. 9(1): p. 1-11.
- Stel, V.S., et al., Survival Analysis I: The Kaplan-Meier Method. Nephron Clinical Practice, 2011. 119(1): p. c83-c88.
- Martinez, M.C. and F.M. Fischer, Work ability and job survival: Four-year follow-up. International Journal of Environmental Research and Public Health, 2019. 16(17).
- Md Noor, A.K.C., et al., Survival time of visual gains after diabetic vitrectomy and its relationship with ischemic heart disease. International Journal of Environmental Research and Public Health, 2020. 17(1).
- Khorshidi, H.A., M. Marembo, and U. Aickelin, Predictors of Return to Work for Occupational Rehabilitation Users in Work-Related Injury Insurance Claims: Insights from Mental Health. Journal of Occupational Rehabilitation, 2019. 29: p. 740–753.
Figure 1.
Survival analysis for time to RTW from injury date over three years.
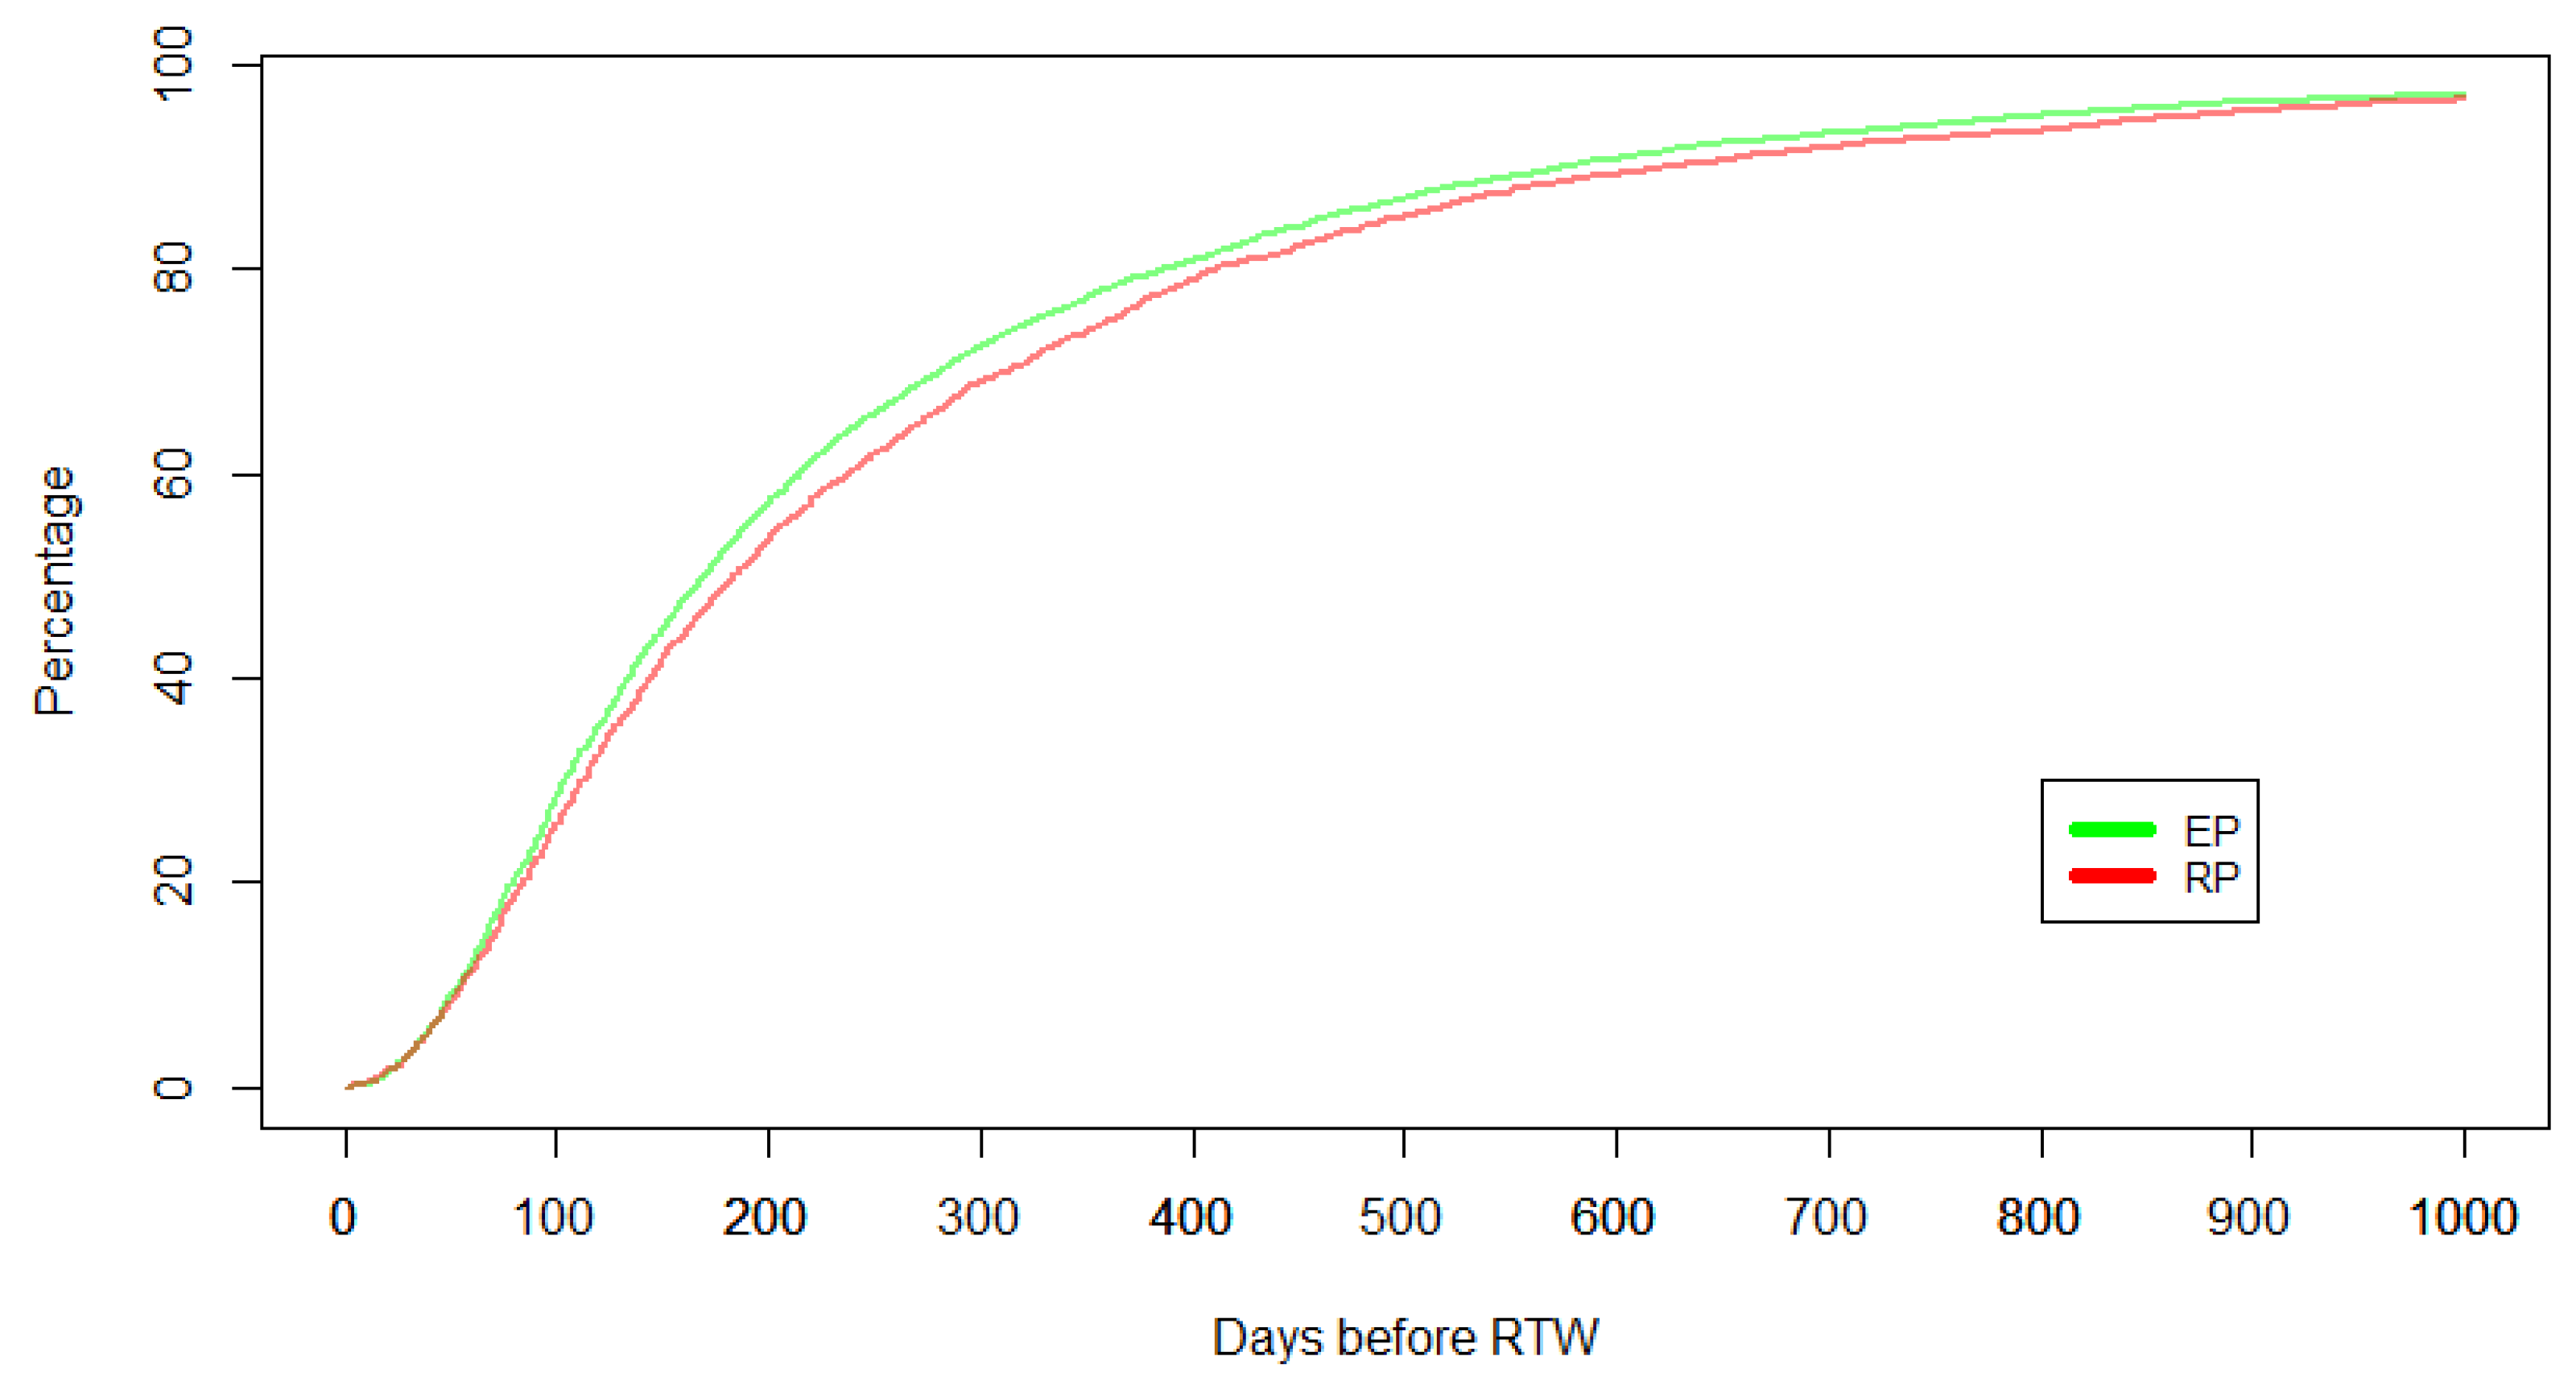

Table 1.
Distribution of injured workers based on characteristics in the EP and RP groups.
| Claimant characteristics | EP | RP | ||
|---|---|---|---|---|
| Number | Percentage | Number | Percentage | |
| Gender | ||||
| Male | 4,909 | 66.67 % | 2,563 | 64.11 % |
| Female | 2,454 | 33.33 % | 1,435 | 35.89 % |
| Age groups | ||||
| 15-24 | 552 | 7.50 % | 298 | 7.45 % |
| 25-34 | 1,269 | 17.23 % | 698 | 17.46 % |
| 35-44 | 1,610 | 21.87 % | 803 | 20.09 % |
| 45-54 | 2,120 | 28.79 % | 1,104 | 27.61 % |
| 55-64 | 1,622 | 22.03 % | 952 | 23.81 % |
| Others | 190 | 2.58 % | 143 | 3.58 % |
| Injury type | ||||
| Fractures | 1,090 | 14.80 % | 594 | 14.86 % |
| Joints | 1,887 | 25.63 % | 1,062 | 26.56 % |
| Mental | 35 | 0.48 % | 16 | 0.40 % |
| Musculoskeletal | 3,442 | 46.75 % | 1,902 | 47.57 % |
| Wounds | 606 | 8.23 % | 241 | 6.03 % |
| Other injuries | 142 | 1.93 % | 98 | 2.45 % |
| Other diseases | 161 | 2.19 % | 85 | 2.13 % |
| Occupation groups | ||||
| Managers | 224 | 3.04 % | 161 | 4.03 % |
| Professionals | 659 | 8.95 % | 432 | 10.81 % |
| Associate professionals | 604 | 8.20 % | 387 | 9.68 % |
| Tradespersons | 1,403 | 19.05 % | 694 | 17.36 % |
| Advanced clerical and Service workers | 84 | 1.14 % | 68 | 1.70 % |
| Intermediate clerical, sales and Service workers | 817 | 11.10 % | 479 | 11.98 % |
| Intermediate production and transport workers | 1,677 | 22.78 % | 741 | 18.53 % |
| Elementary clerical, sales and Service workers | 288 | 3.91 % | 179 | 4.48 % |
| Laborers | 1,607 | 21.83 % | 857 | 21.44 % |
Table 2.
Distribution of injured workers based on characteristics in EP and RP groups.
| Measures | EP | RP | ||
|---|---|---|---|---|
| Mean | 95% CI | Mean | 95% CI | |
| Number of claims treated per physiotherapist | 10.2* | [9.6, 10.8] | 4.6 | [4.3, 4.9] |
| Physiotherapy services per claim | 29.6 | [28.9, 30.4] | 28.5 | [24.4, 29.6] |
95% CI: 95% confidence interval; *significantly higher than RP (p<0.0001).
Table 3.
Time to RTW in EP and RP groups.
| Measures | EP | RP | Difference (EP-RP) |
p-value* | ||
|---|---|---|---|---|---|---|
| Mean | 95% CI | Mean | 95% CI | |||
| Days from date of Injury to RTW | 267.7 | [259.3, 276.2] | 289.1 | [277.0, 301.2] | - 25.4 | <0.01 |
*Based on t-test of difference between groups.
Table 4.
Comparison of RTW percentage between EP and RP over time.
| Time period (months) | RTW percentage | Log-rank test | ||
|---|---|---|---|---|
| EP | RP | Chi-square stat | P-value | |
| 3 | 23.90 % | 22.23 % | 0.25 | 0.62 |
| 6 | 53.31 % | 49.72 % | 0.22 | 0.64 |
| 12 | 78.53 % | 75.30 % | 2.83 | 0.09 |
| 24 | 93.69 % | 92.54 % | 6.94 | <0.001 |
| 36 | 96.93 % | 96.51 % | 12.11 | <0.001 |
Table 5.
Regression analysis with the outcome being the number of days to achieving RTW.
| Univariate | Multivariate | |||
|---|---|---|---|---|
| Coefficient | Variable p-value | Coefficient | Model p-value | |
| Physiotherapy group | < 0.0001 | |||
| RP | Ref | < 0.01 | Ref | |
| EP | -21.38 | -21.57 | ||
| Gender | ||||
| Male | Ref | n.s. | - | |
| Female | 4.77 | - | ||
| Age groups | ||||
| 15-24 | Ref | < 0.0001 | Ref | |
| 25-34 | 26.39 | 14.60 | ||
| 35-44 | 87.84 | 68.55 | ||
| 45-54 | 93.62 | 78.58 | ||
| 55-64 | 59.63 | 49.33 | ||
| Others | 9.33 | 0.77 | ||
| Injury type | ||||
| Fractures | Ref | < 0.0001 | Ref | |
| Joints | 53.34 | 51.80 | ||
| Musculoskeletal | 179.22 | 159.78 | ||
| Mental | 97.92 | 94.63 | ||
| Other Diseases | -22.47 | -16.13 | ||
| Other Injuries | 61.83 | 62.05 | ||
| Wounds | 144.06 | 130.42 | ||
| Occupation | ||||
| Managers | Ref | n.s. | - | |
| Professionals | 303.68 | - | ||
| Associate professionals | -35.51 | - | ||
| Tradespersons | -31.52 | - | ||
| Advanced clerical & service workers | -29.55 | - | ||
| Intermediate clerical, sales & service workers | 1.37 | - | ||
| Intermediate production & transport workers | -43.97 | - | ||
| Elementary clerical, sales & service workers | -36.85 | - | ||
| Labourers | -8.73 | - | ||
n.s. Not significant.
Disclaimer/Publisher’s Note: The statements, opinions and data contained in all publications are solely those of the individual author(s) and contributor(s) and not of MDPI and/or the editor(s). MDPI and/or the editor(s) disclaim responsibility for any injury to people or property resulting from any ideas, methods, instructions or products referred to in the content. |
© 2023 by the authors. Licensee MDPI, Basel, Switzerland. This article is an open access article distributed under the terms and conditions of the Creative Commons Attribution (CC BY) license (http://creativecommons.org/licenses/by/4.0/).
Copyright: This open access article is published under a Creative Commons CC BY 4.0 license, which permit the free download, distribution, and reuse, provided that the author and preprint are cited in any reuse.


