Submitted:
03 July 2023
Posted:
04 July 2023
You are already at the latest version
Abstract
Domestic cats (Felis catus) are widespread worldwide as the most popular pets. This medium-sized carnivore have well-known negative effects on biodiversity, but there is still need to better understand the proximate causes of its predation. Based on a citizen science project, we assessed the role of spatiotemporal (i.e., latitude, longitude and seasons), climatic (i.e., rainfall), anthropogenic (i.e., human footprint, HFI) and individual (i.e., sex and age) variables on the number of preys returned home by cats in metropolitan France. Over the 5 048 cats monitored between 2015 and 2022, prey from 12 different classes (n= 36 568) were returned, being 68% mammals, 21% birds and 8% squamates. Shrews brought home by cats peaked during summer, while rodents were recorded during summer-autumn. Birds brought home by cats peaked in spring-summer and in autumn, and lizards in spring and in late summer. Lower HFI was associated with more voles and mice brought home and the opposite trend was observed for lizards and birds. Younger cats were more prone to bring home shrews, birds and reptiles. Although environmental factors play a minor role in prey brought home by cats, some geographical characteristics of prey species distribution partly explains the hunting behaviour of cats.
Keywords:
domestic cat
; citizen science
; Felis catus
; predation
; prey brought home
; seasonality
; climatic factors
; human footprint
; individual variability
1. Introduction
Domestic cats (Felis catus) are opportunistic generalist predators, that have been globally introduced by humans making them one of the 100 worst non-native invasive species in the world [1]. Across the globe, the number of cats is ranging between 600 million to 1 billion [2], while pet cats exceeds 113 million in European countries [3]. Crowley et al. [4] distinguish different cat populations ranging from feral cats that are neither dependent on nor controlled by humans to indoor cats that are fully confined with their food, reproduction, and movements being closely controlled by humans. In France, the domestic cat is the most popular pet with more than 15 million of individuals in 2020 (I-CAD database 2020), but this number can be doubled when considering free-ranging semi-owned individuals (e.g., farm cats) [5].
Cats' effects on biodiversity are diverse including predation, competition, behavioural disturbance, disease transmission and hybridisation [6,7,8]. Cat predation is a well-documented phenomenon at both local [5,9,10] and continental scales [7,11,12,13]. Cats can locally reduce mainland vertebrate populations including birds and mammals [8,11] as well as invertebrates [14]. In countries where large-scale estimations exist for other direct mortality sources, cats far exceed all other sources of human-related mortality (excluding indirect factors like habitat loss) [15,16].
Unlike feral cats, house-based free-ranging cats (i.e. indoor-outdoor cats) are provided with medical care and shelter by pet owners, so they are not subjected to diseases or fluctuations in prey abundances, and are therefore able to exceed environmental carrying capacity [17,18]. If un-owned cats, as opposed to owned pets, cause the majority of the mortality induced by cat predation [7], indoor-outdoor cats still cause substantial wildlife mortality, and studying their hunting behaviour is useful to improve our knowledge about the whole domestic cat population effect on ecosystems. They frequently kill wild animals without consuming them and bring them to their owners as a “gift” [2,17,19]. Accordingly, one way to study such hunting behaviour is to investigate the number and diversity of prey they brought home [8,18,20,21,22,23,24,25]. Although the fate of prey (i.e., directly eaten, left uneaten or brought back) depends on the nature of the prey itself [25], such method can provide a global account of the variation in the species predated by cats at a national scale.
Citizen science is an interesting tool for ecological issues [26], and is often used to assess effects of domestic cat predation on wildlife communities [2,10,22,23,24,27]. In this study, we used data on prey brought home by free-ranging domestic cats in France recorded by the citizen science project named “Chat domestique et Biodiversité” led by the French society for the study and protection of mammals (SFEPM) and the National Museum of Natural History of Paris (MNHN). First, we quantified the number of prey brought home by cats. Second, we attempted to analyse changes in prey brought home by cats in relation to temporal (seasons), climatic (rainfall), biogeographic (latitude and longitude), anthropogenic (Human Footprint Index, HFI) and individual variables (age and sex). We used the results to test the following predictions:
- Because predation rate of cats is higher during spring and summer when most prey are breeding in temperate areas [27], we predict that number of prey brought home by domestic cats will be higher during these seasons than during the rest of the year.
- Weather conditions influence strongly small mammals [28,29,30], birds [31,32] and lacertids [33] activity; rainfall positively influence small mammal activity but decrease the activity of birds and lacertids. We predict, thus, a higher number of small mammals brought home by cats from higher rainfall locations while the number of birds and lacertids brought home by cats in those localities will be lower.
- Biogeographic factors determine prey species ecological range [34,35]. Accordingly, we predict that endothermic prey categories (i.e., soricids, cricetids, murids and passeriforms) brought home by cats will increase from southeastern to northwest while the opposite pattern will be true for ectothermic prey (i.e., Lacertids) brought home by cats.
2. Materials and Methods
2.1. Preys Brought Home
The project run from 2015 until now. Volunteering cat owners joined the citizen science survey to record preys brought home by their cats through the website: https://www.chat-biodiversite.fr/. In this website, volunteers recovered opportunistic or systematic predation events of their cats. Also, volunteers should provide information about their cat (e.g., name, sex, birth date) and about prey brought home (e.g., the date of the capture, the localization, the species or at least the species group). To help volunteers to identify prey, a photographic guide of potential cat prey is available in the website.
2.2. Spatial Variables
We created a 100 m circular buffer around each owner location (i.e., domestic cats remain close to owner home [39]) to estimate mean annual temperature, mean annual rainfall and HFI (Human Footprint Index). Mean annual temperature and rainfall at 5 m resolution were sourced from the WorldClim dataset (www.wordlclim.org). We quantified anthropogenic influence using the HFI layer version 2, 1995-2004 (Wildlife Conservation Society – WCS 2005); this database is a global spatial dataset of the HFI normalized by biome and realm. Global HFI is calculated using population density, human land use, infrastructure (e.g., night-time lights, built-up areas) and human access (e.g., railroads, roads, coastlines). This index, rated on a scale of 0 (minimum) to 100 (maximum) for each terrestrial biome, is a quantitative analysis of human influence across the globe. A score of 1 indicates the least human influence in the given biome.
2.3. Statistical Analysis
The analyses were performed on the sum of all prey items reported for each cat in a given month between January and December across all years. A total of 40 456 prey brought home were recorded between January 2015 and August 2022, of which 39 085 belonged to an identified owner. Overall, from these observations, 2.8% (n = 1 097) of prey records were not localized, yielding in 37 984 spatially and temporally referenced prey records of which 17 were discarded because they correspond to locations outside the metropolitan French territory or were aberrant due to erroneous input by owners. 244 of these records were not available because of an absence of precise description of preys return home. Within the dataset comprising 37 723 full records of prey brought home by cats, those 11 records from unclearly identified cats were discarded. The dataset corresponded then to 5048 unique identified cats, from 4095 owners, for which 37 711 records of prey return were noted across the entire French metropolitan area. For modelling purpose, 495 records without HFI information, 320 records without cat age and 328 records belonging to senior individuals (minorities in the dataset) were discarded, reducing the dataset to 36 568 records (Figure 1). The anonymized dataset is available in Appendix A.
Generalized Additive Mixed Models (GAMMs, [40]) with a Poisson error distribution and a log link were used to analyse the variability in the five main prey categories brought home by cats (i.e., soricids, cricetids, murids, passeriforms and lacertids). These models allow to characterize non-linear relationships and to detect minimum, maximum, inflexion points and threshold values. These variations are expressed by the number of effective degrees of freedom ("edf") estimated by the models. An edf value of 1 is equivalent to a linear relationship; an edf greater than 1 and less than 2 indicates a weakly non-linear relationship, and when the edf is greater than 2, the relationship is strongly non-linear [40].
We used seven explanatory variables in each GAMM: month (continuous variable, range: 1-12, scaled centred), HFI (continuous variable, scaled centered), mean annual rainfall (continuous variable), latitude and longitude coordinates (continuous variable, transformed into metric coordinates in the Lambert II extended projection system), age (continuous variable, range: 0 – 14) and sex (categorial variable with two levels: female, male). The effect of month was fitted with a cyclic cubic regression spline following Krauze-Griz et al. [21], while the effect of HFI, rainfall and age by sex were fitted with a cubic regression spline. The effect of latitude and longitude was investigated by producing a full tensor product smooth especially useful for representing functions of covariates.
In each GAMM, cat identity, county and year of observation were included as random effects and fitted with a ridge penalty spline. Indeed, significant variability in data collection effort between 2015 and 2022 is related to the history of the project, with years with little or no activity resulting in less information on prey brought home. Similarly, each cat has its own profile of hunting behaviour, with cats for which many predation records have been made - sometimes much focused on a group of small mammals, whereas most monitored cats have only one predation record in the whole project. Additionally, we assumed that cat living closely in space (i.e., at the county scale), would have more similar prey species brought home than those cats living at larger distance from each other.
The collinearity between explanatory variables was investigated, so the mean annual rainfall variable was preferred to the temperature variable. Full models were validated by graphic inspection following Zuur et al. [41]. All analyses were performed in the R 4.2.2 environment (R Core Team 2022) with RStudio 2022.12.0 (RStudio Team 2022), using 'mgcv' (bam function, [42]) and ‘mgcViz' [43] packages, and codes provided by Zuur et al.[40].
3. Results
3.1. Prey Species Brought Home by Cats
During the survey, cats brought home prey belonging to 12 different classes (Actinopterygii, Amphibia, Annelida, Arachnida, Aves, Chilopoda, Clitellata, Gastropoda, Hexapoda, Malacostraca, Mammalia, Reptilia). The main prey species reported by cats were mammals (68.3%), followed by birds (21.4%) and squamates (8.4%). Among mammals, rodents represented 78.8% of the prey, followed by eulipotyphla (i.e., moles, shrews and hedgehogs) with 15.8%. Among eulipotyphla, the vast majority were shrews and shrew-like creatures; the most commonly brought species was the Eurasian Common Shrew (Sorex araneus) (accounting for 1% of the total mammals, while over 12% were 'unidentified shrews'). The remaining percentages are attributed to lagomorphs (2.4%), chiropterans (1.3%) and carnivores (0.3%), while 1.3% of prey wer identified as mammals.
If we consider only "small mammals" (Cricetidae, Gliridae, Muridae) and shrews and related species (Soricidae) (i.e., 23 850 prey items) the most frequently reported species was the House Mouse (Mus musculus: 14.5%), followed by the Common Vole (Microtus arvalis: 3.7%) and the Wood Mouse (Apodemus sylvaticus: 3.5%). However, 64.9% of small mammal data belong to categories not identified at species level, such as "field mice", "shrews", "voles" and "small rodents (mice, field mice, voles)", which account for 16.7%, 12.8%, 14% and 21.4% respectively, which clearly illustrates the difficulty of characterizing these species.
Among birds, 83.3% of the species reported by the cats were Passeriformes, mainly House Sparrow (Passer domesticus: 14.4%), European Robin (Erithacus rubecula: 9.3%), Eurasian Blackbird (Turdus merula: 8.3%), Eurasian Blue Tit (Cyanistes caeruleus: 6.8%) and Chickadee (Parus major: 6.3%), while 10.2% were unidentified passerines. The remaining percentages were mainly attributed to Columbiformes 5.8% (including Eurasian Collared Dove Streptopelia decaocto: 3.1% and Common Wood Pigeon Columba palumbus: 1.2%), Piciformes (0.5%), Caprimulgiformes (0.3%), Galliformes (0.3%) and Gruiformes (0.2%), while 9.3% were unidentified birds.
Among squamates (<0.1% were unidentified), 92.5% of the species reported by the cats belong to Lacertilia family (18.3% were unidentified), including the Common Wall Lizard (Podarcis muralis: 56.7%), the Slow Worm (Anguis fragilis: 6.3%) and the Common Wall Gecko (Tarentola mauritanica: 5.2%). The remaining percentages are attributed to Serpentes (7.3%) and Scincomorpha (0.1%).
Only the following five main categories of preys were used in analysis: murids (Muridae identified or not, i.e. 14,196 prey items), cricetids (Cricetidae identified or not, i.e. 5,149 prey items), soricids (Soricidae identified or not, i.e. 3,482 prey items), passerines (6,486 prey items) and lizards (2,882 prey items).
3.2. Seasonality of Prey Brought Home by Cats
Season was a significant predictor of prey brought home by cats (Table 1 and Figure 2). For each group, the relationship was highly non-linear. Soricids were more brought home by cats from spring to autumn and their numbers increased until they reached a peak in summer. Cricetids were brought similarly along the year, although the number reported reached a plateau throughout the summer. Murids were brough home by cats from spring to autumn and their numbers increased until to reach a maximum in autumn. Birds were most commonly brought home by cats in late-spring and early-autumn. Lacertids were more frequently brought home by cats in spring and summer.
3.3. Climatic and Geographic Effects on Prey Brought home By Cats
The mean annual rainfall was a significant predictor of soricids (linear relationship) and cricetids brought home by cats (Table 1 and Figure 3). Their number increased with increasing rainfall while the splines for murids, birds and lacertids were not significant (Table 1).
The geographic distribution was a significant predictor of the preys brought home by cats (Table 1 and Figure 4). Soricids were more often brought home by cats in the north-west of France; up to twice as often as in the south-east. Cricetids were more often brought home in the northern part of France with a clear trend for the north-east; more than twice as many as in the south-east. Murids were preferentially brought home by cats in the north-western part of the country.
Cats tended to report passerines fairly uniformly in metropolitan France (except in Corsica) and more particularly in south-western and central-eastern France. Lacertids were mostly reported in the south of France, including Corsica; up to 3 times more than in the north.
3.4. Anthropogenic impacts on prey brought home by cats
3.5. Individual Factors Influencing Prey Brought Home by Cats
Age and sex of individuals were significant predictors of prey brought home by cats (Table 1 and Figure 6). Soricids were predominantly reported by young individuals (< 2 years-old), with the number decreasing rapidly with age. There was a significant difference in the number of cricetids brought home by females with a first peak for young adults (i.e., 2 to 4 years-old) and a second, larger peak for adult females (i.e., 8 to 12 years-old). The spline for males, whatever their age, was not significant. Females tended to return back home more murids between the ages of 3 and 7 years, while the number of murids increased progressively until the age of 10 years for males. Passerines were mostly reported by young individuals, their numbers decreasing more gradually for females. A similar pattern was observed for lacertids, with the number of lacertids decreasing linearly for males with age.
4. Discussion
The temporal and spatial coverage of the present study outweighs any previous study investigating the hunting behaviour of cats based on a citizen science program. More precisely, cat owners intensively monitor prey brought home by their cats during eight years, which allowed us to describe seasonal patterns of cat predation at national scale. Moreover, the spatial coverage of our study includes almost all habitats characterizing metropolitan France, leading us to assess the effects of prey brought home by cats nationwide.
Our results confirm that prey brought home by cats were mainly small mammal species, followed by birds and reptiles, with a seasonal pattern of hunting behaviour of cats depending of the taxonomic level of the prey. The most important hunting behaviour was from mid-spring to mid-summer, but also from late summer to mid-autumn. Such behaviour was only partially related to environmental factors for specific taxonomic groups of small mammals (shrews and voles). Age and sex of cats also influenced their hunting behaviour depending on the taxonomic level of prey, with younger cats bringing home more often shrews, passerines and lizards.
4.1. Prey Species Brought Home by Cats
The proportion of vertebrate prey brought home by cats in France accords with previous studies at national or regional scales in Europe (Poland: [21], UK: [17,23,36], Finland: [38] and Italy: [2]), Australia [44,45] and China [12] showing that small mammals were the principal prey brought home followed by birds and lizards. Similarity among European, Asian and Australian studies prey brought home by cats in France may be related to prey relative availability in studied areas, but also to a common evolutionary history of cats from those continents [46].
Our results, however, contrast with results found in New Zealand where rodents and insects [20], macroinvertebrates and rodents [22] or birds and rodents [47] were the main prey categories brought home by cats. Relative discrepancies between the rates of preys brought home among these former studies and the present one most probably lies in the difference in the number of monitored cats used to calculate the rates of preys brought home. For instance, Van Heezik et al. [47] monitored 151 cats, Morgan et al. [20] and Gillies and Clout [22] monitored around 80 cats each while in the present study, we monitored 5048 cats. Comparing the results of such studies can also be challenging, given the range of predictors used and the different taxonomic levels involved (i.e., major taxonomic groups, family, species). The use of combinatorial probabilities as described by Murphy et al. [11] for diet analysis using stomach contents may facilitate comparisons between studies relying on prey species brought home.
Our study shows a very low number of bats reported (1.3%) while Ancilloto et al. [48] found that 28.7% of adult bats admitted to rehabilitation centres were attacked by cats in Italy. This underline that predation by cats is still under-appreciated for bats [49]. It also raises the question of prey killed and reported and therefore accounted for, injured prey that does not survive and is not accounted for, and the fate of prey depending on its type [25].
4.2. Seasonality of Prey Brought Home by Cats
Cats exhibit a seasonal pattern of activity with greater home range sizes [50,51,52] and travel distances [5,53] during favourable seasons (i.e., spring and summer) in temperate areas. According with this seasonal cat behaviour, we found support to our hypothesis of a higher number of preys brought home by cats during spring and summer. This accords with Krause-Gryze et. al. [21], who found a seasonal increase of cat predation of birds in rural habitats in Poland.
We found seasonal differences among prey categories brought home by cats. For soricids, the seasonal pattern observed agrees with the one described by Krause-Gryze et al. [21] in rural habitats in Poland. These results are likely to reflect seasonal reproduction and demography documented for Sorex spp. and Crocidura russula species in western European habitats where Soricids populations experience an increase of reproductive activity from spring to summer and a decrease from late summer to late autumn (Sorex spp.: Britain: [54,55]; Finland: [56]; Crocidura russula: [57]). In consequence, soricids brought home by cats in France are mainly adults in the middle of reproduction period likely affecting their population dynamics. Contrary to shrews, voles occurred from early summer throughout early autumn then decreasing from mid-autumn until the next early spring while for mice we detected a continuous increase from mid-spring until early autumn and decreasing during winter. In contrast, in rural habitats in Poland, only an autumnal peak was described for rodents [21]. Rodents brought home by cats in France corresponds to the end of the breeding period observed during autumn and early winter for voles and mice in this country [58,59]. In consequence, cats not only predate rodents at the end of the breeding season when juveniles and subadults make the bulk of the population at their peak of density, but also affect reproductive adults during the breeding period in mid-spring.
Birds brought home by cats in France exhibited two peaks, one in late spring/early-summer and another one – less important – in mid-autumn. This spring peak in birds brought home by cats has already been observed in many habitats ranging from rural to urban or suburban [18,21,23,47]. Likely, these birds are mainly juveniles or individuals in poor body condition during these months. Only Kauhala et al. [38] found similar results to our autumn peak in Finland, where the highest number of birds brought home by cats occurred during autumn. In this case, cat predation impact on bird populations may be more important than in spring, because the reproductive value of those surviving young individuals is higher at later period of the year. Moreover, this result highlight that many common bird species populations may be at risk during autumn and that to detect this autumnal peak of birds brought home by cats an important number of cats (>5 000 individuals) over many years (>4 years) across a large geographical area (>540 000 km2) are needed.
Lacertids formed the third group of prey brought home by cats in our study, showing a bimodal pattern in the seasonal dynamics composed by: a first peak during spring (i.e., April-May) and a second peak during summer (i.e., August). Spring peak is in accordance with other studies from northern European countries such as in Finland [38] and in Poland [21]. Moreover, we detected a secondary peak during summer where lacertids may be still active and thus exposed to cat predation. Indeed, contrary to more colder environments, in northern European countries where lizards become inactive during this period in France, P. muralis is active during early autumn (i.e., August-September) [60]. Also, A. fragilis populations located in the northwest Iberian peninsula are active for more than three quarters of the year [61]. Likely, reptiles brought home by cats in France during spring peak corresponds to adults emerging from hibernation and moving more frequently for reproduction (i.e., [62]) while summer peak may represent juveniles especially just after parturition [63].
4.3. Climatic and Geographic Effects on Prey Brought Home by Cats
Our results highlight the importance of considering the effects of rainfall on the number of preys brought home by cats across large spatial scales. Although rain reduces the range of activity of cats [5,52], the increase in small mammals activity [28,29,30,64] increases the probability of predator-prey contact. We found that the number of soricids and cricetids brought home by cats increased with increasing rainfall. This result suggests that under climate change scenarios prey brought home by cats could shift with changing prey availability, particularly given the behavioural adaptability of cats. Number of predated prey shift due to climate change have been demonstrated for other carnivores such as the Canadian Lynx (Lynx canadensis) [65] or the Arctic fox (Alopex logopus) [66,67]. Studies regarding dietary responses of cats support the generalist predation hypothesis by documenting switch to alternative prey and an increase of diet diversity when their main prey abundance decrease [68,69,70]. Knowledge of the influence of climate variables on the availability of prey and hence cat number of predated preys will improve our understanding of synergetic effects of climate change and cat predation on wildlife.
Like climate, biogeographic also has strong effects on ecological community composition [71], which may in turn influence what cats bring to home [45,72]. In support to our predictions, endothermic prey (excepting birds) brought home by cats increased from south-eastern to north while the opposite pattern was found for lacertids. These results may be due to cooler temperatures in the north of France. Indeed, soricids distribution is favoured by cold weather conditions [73] while on the contrary lacertids distribution is concentrate on warmer areas located in Mediterranean Basin [74]. Cricetids brought home by cats increased from south-eastern and southwest to north-eastern which may be due to the spatial distribution of their preferred habitat type (i.e., grasslands) in France [71,75,76]. Murids brought home by cats increased from south-eastern to north-western. Because murids are composed by woodland liker species, this trend may be explained by the local habitat quality of woodlands embedded in the agricultural matrix and of nearby forests as it has been shown for A. sylvaticus in United Kingdom [77].
4.4. Anthropogenic Pressure Influence on Prey Return Home
Our results partially support our prediction of a negative relationship between the number of preys brought home by cats and HFI. We found that the number of small mammals decreased with increasing HFI, while the number of lacertids and birds brought home by cats increased. The decrease in the number of small mammals in highly anthropogenic areas is likely to be due to the decrease of diversity [78,79,80,81,82,83,84], abundance and species richness [82,83].
Lacertids as ectotherms organisms are directly linked with ambient temperature (e.g., [85,86,87]). Thus, it may be that lacertids are more likely to be brought home by cats in localities with higher HFI due to the heat island effect [88,89]. Indeed, cat predation upon lacertids along anthropogenic gradients remains poorly studied in Europe [90,91]. Thus, knowledge about cat predation effects on this understudied prey category is essential in order to have a full overview of cat impacts on biodiversity.
The number of birds brought home by cats increased with increasing HFI. This result accords with previous studies carried out in Northern Europe and North America, showing that the number of birds brought home by cats increased with increasing anthropogenic impacts [21,38,92]. Predation of these prey categories may be related to the availability of both bird-feeders and habitat suitability due to garden management.
4.5. Individual Factors Influencing Prey Brought Home by Cats
Hunting specializations in cats has been already described in Australia [24,93] and in France [5] as well as profiles of cat personality responsible for wildlife predation [5,94,95,96]. Citizen science databases of prey brought home by cats collected at nation-wide scale over many years may provide the way forward to identify persistent individual hunting patterns independent of the availability of prey in the environment.
In support with our hypothesis, a greater number of soricids, lacertids and passerines were brought home by young cats (i.e., < five years-old) than older ones. This result supports previous studies in which shrews, reptiles and amphibians are more likely brought home by young cats while older cats return more rodents [38]. Shrews produce vocalizations highly attractive to cats, but their decline with age shows that cats learn that they are inedible prey [38,97]. Young cats more often bring back lizards, probably because the movement of these species can stimulate their propensity to play. Predation on birds requires cats to be in good physical condition (e.g., climbing on trees) which explains why these prey items are more likely to be brought by young cats [34]. Young and old females prefer cricetids while older males choose mice. Further research into individual cat activity patterns would be helpful to understand this result.
5. Conclusions
Our study was based on a large database benefiting from a large array of pet cats from many owners reporting prey species brought home across a large area and over a long time. Our results confirm earlier studies, according to which common species of small vertebrates are preferred by cats. More specifically, small mammals including mice, voles and shrews, and to lesser extent birds mostly composed by small passerines, and reptiles mainly made by lacertids. Our results also confirm seasonal patterns in the hunting behaviour of cats depending on the taxonomic nature of prey. Age was a key parameter of the number and nature of prey brought home by cats, with younger individuals being more prone to bring home shrews, birds and reptiles. Although environmental factors play a minor role in prey brought home by cats, some geographical characteristics in prey species distribution partly explained hunting behaviour of cats.
Author Contributions
Conceptualization, B.P., M.A.F.W., N.D. and I.C.; methodology, B.P., M.A.F.W., N.D. and I.C.; writing—original draft preparation, B.P., M.A.F.W., N.D. and I.C.; writing—review and editing, B.P., M.A.F.W., N.D. and I.C. All authors have read and agreed to the published version of the manuscript.
Funding
This research received no external funding.
Institutional Review Board Statement
Ethical review and approval were waived for this study due to the fact that no animals were manipulated during the study.
Informed Consent Statement
Consent was obtained from the owner of the animals but the dataset available has been anonymized.
Data Availability Statement
The full dataset can be can be obtained on reasoned request from the corresponding author.
Acknowledgments
We thank cat owners to participate in this study leaded by the French Society for Study and Protection of Mammals. We also thank the editor and anonymous reviewers for their constructive comments and suggestions to improve the manuscript.
Conflicts of Interest
The authors declare no conflict of interest
Appendix A
The anonymized dataset.
References
- Lowe, S.; Browne, M.; Boudjelas, S.; De Poorter, M. 100 of the World’s Worst Invasive Alien Species, a Selection from the Global Invasive Species Database; Published by The Invasive Species Specialist Group (ISSG) a specialist group of the Species Survival Commission (SSC) of the World Conservation Union (IUCN): Auckland, New Zealand, 2000; p. 12. [Google Scholar]
- Mori, E.; Menchetti, M.; Camporesi, A.; Cavigioli, L.; Tabarelli de Fatis, K.; Girardello, M. License to Kill? Domestic Cats Affect a Wide Range of Native Fauna in a Highly Biodiverse Mediterranean Country. Frontiers in Ecology and Evolution 2019, 477. [Google Scholar] [CrossRef]
- European Pet Food Industry Facts and Figures 2021; 2021. 2021.
- Crowley, S.L.; Cecchetti, M.; McDonald, R.A. Hunting Behaviour in Domestic Cats: An Exploratory Study of Risk and Responsibility among Cat Owners. People and Nature 2019, 1, 18–30. [Google Scholar] [CrossRef]
- Forin-Wiart, M.-A. Identification Des Facteurs de Variation de La Prédation Exercée Par Les Chats Domestiques (Felis Silvestris Catus) En Milieu Rural. Thèse de doctorat, Université de Reims Champagne-Ardenne: Reims, 2014.
- Trouwborst, A.; McCormack, P.C.; Martínez Camacho, E. Domestic Cats and Their Impacts on Biodiversity: A Blind Spot in the Application of Nature Conservation Law. People and Nature 2020, 2, 235–250. [Google Scholar] [CrossRef]
- Loss, S.R.; Will, T.; Marra, P.P. The Impact of Free-Ranging Domestic Cats on Wildlife of the United States. Nature Communications 2013, 4, 1396. [Google Scholar] [CrossRef] [PubMed]
- Loss, S.R.; Marra, P.P. Population Impacts of Free-ranging Domestic Cats on Mainland Vertebrates. Frontiers in Ecology and the Environment 2017, 15, 502–509. [Google Scholar] [CrossRef]
- Medina, F.M.; Bonnaud, E.; Vidal, E.; Tershy, B.R.; Zavaleta, E.S.; Josh Donlan, C.; Keitt, B.S.; Le Corre, M.; Horwath, S.V.; Nogales, M. A Global Review of the Impacts of Invasive Cats on Island Endangered Vertebrates. Global Change Biology 2011, 17, 3503–3510. [Google Scholar] [CrossRef]
- Krauze-Gryz, D.; Gryz, J.; Żmihorski, M. Cats Kill Millions of Vertebrates in Polish Farmland Annually. Global Ecology and Conservation 2019, 17, e00516. [Google Scholar] [CrossRef]
- Murphy, B.P.; Woolley, L.-A.; Geyle, H.M.; Legge, S.M.; Palmer, R.; Dickman, C.R.; Augusteyn, J.; Brown, S.C.; Comer, S.; Doherty, T.S. Introduced Cats (Felis Catus) Eating a Continental Fauna: The Number of Mammals Killed in Australia. Biological Conservation 2019, 237, 28–40. [Google Scholar] [CrossRef]
- Li, Y.; Wan, Y.; Shen, H.; Loss, S.R.; Marra, P.P.; Li, Z. Estimates of Wildlife Killed by Free-Ranging Cats in China. Biological Conservation 2021, 253, 108929. [Google Scholar] [CrossRef]
- Blancher, P. Estimated Number of Birds Killed by House Cats (Felis Catus) in Canada. Avian Conservation and Ecology 2013, 8, 3. [Google Scholar] [CrossRef]
- Eisenhauer, N. Impacts of Free-ranging Cats on Invertebrates. Frontiers in Ecology and the Environment 2018, 16, 262–263. [Google Scholar] [CrossRef]
- Calvert, A.; Bishop, C.; Elliot, R.; Krebs, E.; Kydd, T.; Machtans, C.; Robertson, G. A Synthesis of Human-Related Avian Mortality in Canada. Avian conservation and ecology 2013, 8. [Google Scholar] [CrossRef]
- Loss, S.R.; Will, T.; Marra, P.P. Direct Mortality of Birds from Anthropogenic Causes. Annual Review of Ecology, Evolution, and Systematics 2015, 46, 99–120. [Google Scholar] [CrossRef]
- Woods, M.; McDonald, R.A.; Harris, S. Predation of Wildlife by Domestic Cats Felis Catus in Great Britain. Mammal. Rev. 2003, 33, 174–188. [Google Scholar] [CrossRef]
- Tschanz, B.; Hegglin, D.; Gloor, S.; Bontadina, F. Hunters and Non-Hunters: Skewed Predation Rate by Domestic Cats in a Rural Village. European Journal of Wildlife Research 2011, 57, 597–602. [Google Scholar] [CrossRef]
- Meek, P.D. Food Items Brought Home by Domestic Cats Felis Catus (L) Living in Booderee National Park, Jervis Bay. In Proceedings of the Proceedings-Linnean Society Of New South Wales; Linnean Society Of New South Wales, 1998; Vol. 120; pp. 43–48. [Google Scholar]
- Morgan, S.A.; Hansen, C.M.; Ross, J.G.; Hickling, G.J.; Ogilvie, S.C.; Paterson, A.M. Urban Cat (Felis Catus) Movement and Predation Activity Associated with a Wetland Reserve in New Zealand. Wildlife Research 2009, 36, 574–580. [Google Scholar] [CrossRef]
- Krauze-Gryz, D.; Żmihorski, M.; Gryz, J. Annual Variation in Prey Composition of Domestic Cats in Rural and Urban Environment. Urban Ecosystems 2017, 20, 945–952. [Google Scholar] [CrossRef]
- Gillies, C.; Clout, M. The Prey of Domestic Cats (Felis Catus) in Two Suburbs of Auckland City, New Zealand. J. Zool. Lond. 2003, 259, 309–315. [Google Scholar] [CrossRef]
- Baker, P.J.; Bentley, A.J.; Ansell, R.J.; Harris, S. Impact of Predation by Domestic Cats Felis Catus in an Urban Area. Mammal. Rev. 2005, 35, 302–312. [Google Scholar] [CrossRef]
- Dickman, C.R.; Newsome, T.M. Individual Hunting Behaviour and Prey Specialisation in the House Cat Felis Catus: Implications for Conservation and Management. Applied Animal Behaviour Science 2015, 173, 76–87. [Google Scholar] [CrossRef]
- Loyd, K.A.T.; Hernandez, S.M.; Carroll, J.P.; Abernathy, K.J.; Marshall, G.J. Quantifying Free-Roaming Domestic Cat Predation Using Animal-Borne Video Cameras. Biological Conservation 2013, 160, 183–189. [Google Scholar] [CrossRef]
- Brown, E.D.; Williams, B.K. The Potential for Citizen Science to Produce Reliable and Useful Information in Ecology. Conservation Biology 2019, 33, 561–569. [Google Scholar] [CrossRef]
- Thomas, R.L.; Fellowes, M.D.; Baker, P.J. Spatio-Temporal Variation in Predation by Urban Domestic Cats (Felis Catus) and the Acceptability of Possible Management Actions in the UK. PloS one 2012, 7, e49369. [Google Scholar] [CrossRef] [PubMed]
- Wróbel, A.; Bogdziewicz, M. It Is Raining Mice and Voles: Which Weather Conditions Influence the Activity of Apodemus Flavicollis and Myodes Glareolus? European Journal of Wildlife Research 2015, 61, 475–478. [Google Scholar] [CrossRef]
- Sidorowicz, J. Influence of the Weather on Capture of Micromammalia. I. Rodents (Rodentia); Wpływ Pogody Na Odłowy Micromammalia. I. Gryzonie (Rodentia). Acta Theriologica 1960, 4, 139–158. [Google Scholar] [CrossRef]
- Vickery, W.L.; Bider, J.R. The Influence of Weather on Rodent Activity. Journal of Mammalogy 1981, 62, 140–145. [Google Scholar] [CrossRef]
- Robbins, C.S. Bird Activity Levels Related to Weather. Studies in avian biology 1981, 6, 301–310. [Google Scholar]
- O’Connor, R.J.; Hicks, R.K. The Influence of Weather Conditions on the Detection of Birds during Common Birds Census Fieldwork. Bird Study 1980, 27, 137–151. [Google Scholar] [CrossRef]
- Ortega, Z.; Pérez-Mellado, V. Seasonal Patterns of Body Temperature and Microhabitat Selection in a Lacertid Lizard. Acta Oecologica 2016, 77, 201–206. [Google Scholar] [CrossRef]
- Fitzgerald, B.M.; Turner, D.C. Hunting Behaviour of Domestic Cats and Their Impact on Prey Populations. In The domestic cats: The Biology of its Behaviour; Turner, D.C., Bateson, P., Eds.; Cambridge Univ. Press: Cambridge, United-Kingdom, 2000; pp. 151–175. [Google Scholar]
- Lozano, J.; Moleón, M.; Virgós, E. Biogeographical Patterns in the Diet of the Wildcat, Felis Silvestris Schreber, in Eurasia: Factors Affecting the Trophic Diversity. Journal of Biogeography 2006, 33, 1076–1085. [Google Scholar] [CrossRef]
- Baker, P.J.; Molony, S.E.; Stone, E.; Cuthill, I.C.; Harris, S. Cat about Town: Is Predation by Free-Ranging Pet Cats Felis Catus Likely to Affect Urban Bird Populations? Ibis 2008, 150, 86–99. [Google Scholar] [CrossRef]
- Cordonnier, M.; Ferry, N.; Renaud, E.; Maurice, A.-C.; Bonnaud, E.; Baudry, E. Drivers of Predation by Pet Cats: Environment Overcomes Predator’s Intrinsic Characteristics. Urban Ecosystems 2022, 25, 1327–1337. [Google Scholar] [CrossRef]
- Kauhala, K.; Talvitie, K.; Vuorisalo, T. Free-Ranging House Cats in Urban and Rural Areas in the North: Useful Rodent Killers or Harmful Bird Predators? Folia Zoologica 2015, 64. [Google Scholar] [CrossRef]
- Kays, R.; Dunn, R.R.; Parsons, A.W.; Mcdonald, B.; Perkins, T.; Powers, S.A.; Shell, L.; McDonald, J.L.; Cole, H.; Kikillus, H. The Small Home Ranges and Large Local Ecological Impacts of Pet Cats. Animal Conservation 2020, 23, 516–523. [Google Scholar] [CrossRef]
- Zuur, A.; Ieno, E.N.; Walker, N.; Saveliev, A.A.; Smith, G.M. Mixed Effects Models and Extensions in Ecology with R; Springer, 2009; ISBN 0-387-87458-5.
- Zuur, A.F.; Ieno, E.N.; Elphick, C.S. A Protocol for Data Exploration to Avoid Common Statistical Problems. Methods in Ecology and Evolution 2010, 1, 3–14. [Google Scholar] [CrossRef]
- Wood, S. Mgcv: GAMs with GCV Smoothness Estimation and GAMs by REML/PQL. R package version 2004, 1.1-8.
- Fasiolo, M.; Nedellec, R.; Goude, Y.; Capezza, C.; Wood, S.N.; Fasiolo, M.M. Package ‘MgcViz.’ Visualisations for gener-alised additive models 2020.
- Barratt, D.G. Predation and Movement by House-Based Domestic Cats Felis Catus (L.) in Suburban and Rural Habitats - Preliminary Findings. People and nature conservation 1995, 181–187. [Google Scholar]
- Barratt, D.G. Predation by House Cats, Felis Catus (L.), in Canberra, Australia. I. Prey Composition and Preference. Wildlife Research 1997, 24, 263–277. [Google Scholar] [CrossRef]
- Driscoll, C.A.; Macdonald, D.W.; O’Brien, S.J. From Wild Animals to Domestic Pets, an Evolutionary View of Domestication. Proceedings of the National Academy of Sciences 2009, 106, 9971–9978. [Google Scholar] [CrossRef]
- van Heezik, Y.; Smyth, A.; Adams, A.; Gordon, J. Do Domestic Cats Impose an Unsustainable Harvest on Urban Bird Populations? Biological Conservation 2010, 143, 121–130. [Google Scholar] [CrossRef]
- Ancillotto, L.; Serangeli, M.T.; Russo, D. Curiosity Killed the Bat: Domestic Cats as Bat Predators. Mammalian Biology 2013, 78, 369–373. [Google Scholar] [CrossRef]
- Oedin, M.; Brescia, F.; Millon, A.; Murphy, B.P.; Palmas, P.; Woinarski, J.C.; Vidal, E. Cats Felis Catus as a Threat to Bats Worldwide: A Review of the Evidence. Mammal Review 2021, 51, 323–337. [Google Scholar] [CrossRef]
- Pisanu, B.; Pavisse, R.; Clergeau, P. GPS-Based Seasonal Home Ranges of Neutered Pet Cats Felis Catus along a Habitat Gradient. Hystrix, the Italian Journal of Mammalogy 2020, 31, 105–109. [Google Scholar]
- Ferreira, J.P.; Leitão, I.; Santos-Reis, M.; Revilla, E. Human-Related Factors Regulate the Spatial Ecology of Domestic Cats in Sensitiveareas for Conservation. PLoS ONE 2011, 6, e25970. [Google Scholar] [CrossRef]
- Germain, E.; Benhamou, S.; Poulle, M.-L. Spatio-Temporal Sharing between the European Wildcat, the Domestic Cat and Their Hybrids. Journal of Zoology 2008, 276, 195–203. [Google Scholar] [CrossRef]
- Goszczyński, J.; Krauze, D.; Gryz, J. Activity and Exploration Range of House Cats in Rural Areas of Central Poland. Folia Zoologica 2009, 58, 363–371. [Google Scholar]
- Churchfield, S. Population Dynamics and the Seasonal Fluctuations in Numbers of the Common Shrew in Britain. Acta Theriologica 1980, 25, 415–424. [Google Scholar] [CrossRef]
- Churchfield, S.; Hollier, J.; Brown, V.K. Population Dynamics and Survivorship Patterns in the Common Shrew Sorex Araneus in Southern England. Acta Theriologica 1995, 40, 53–68. [Google Scholar] [CrossRef]
- Henttonen, H.; Haukisalmi, V.; Kaikusalo, A.; Korpimäki, E.; Norrdahl, K.; Skarén, U.A. Long-Term Population Dynamics of the Common Shrew Sorex Araneus in Finland. In Proceedings of the Annales Zoologici Fennici; JSTOR; 1989; pp. 349–355. [Google Scholar]
- Torre, I.; Bastardas-Llabot, J.; Arrizabalaga, A.; Díaz, M. Population Dynamics of Small Endotherms under Global Change: Greater White-Toothed Shrews Crocidura Russula in Mediterranean Habitats. Science of the Total Environment 2020, 705, 135799. [Google Scholar] [CrossRef]
- Pucek, Z.; Jędrzejewski, W.; Jędrzejewska, B.; Pucek, M. Rodent Population Dynamics in a Primeval Deciduous Forest (Białowieża National Park) in Relation to Weather, Seed Crop, and Predation. Acta Theriologica 1993, 38, 199–232. [Google Scholar] [CrossRef]
- Ylönen, H.; Altner, H.-J.; Stubbe, M. Seasonal Dynamics of Small Mammals in an Isolated Woodlot and Its Agricultural Surroundings. In Proceedings of the Annales Zoologici Fennici; JSTOR; 1991; pp. 7–14. [Google Scholar]
- Meek, R. Patterns of Reptile Road-Kills in the Vendée Region of Western France. The Herpetological Journal 2009, 19, 135–142. [Google Scholar]
- Ferreiro, R.; Galán, P. Reproductive Ecology of the Slow Worm (Anguis Fragilis) in the Northwest Iberian Peninsula. Animal Biology 2004, 54, 353–371. [Google Scholar] [CrossRef]
- Pilorge, T. Density, Size Structure, and Reproductive Characteristics of Three Populations of Lacerta Vivipara (Sauria: Lacertidae). Herpetologica 1987, 345–356. [Google Scholar]
- Koenig, J.; Shine, R.; Shea, G. The Dangers of Life in the City: Patterns of Activity, Injury and Mortality in Suburban Lizards (Tiliqua Scincoides). Journal of Herpetology 2002, 36, 62–68. [Google Scholar] [CrossRef]
- Esther, A.; Imholt, C.; Perner, J.; Schumacher, J.; Jacob, J. Correlations between Weather Conditions and Common Vole (Microtus Arvalis) Densities Identified by Regression Tree Analysis. Basic and applied ecology 2014, 15, 75–84. [Google Scholar] [CrossRef]
- Bretagnolle, V.; Gillis, H. Predator–Prey Interactions and Climate Change. Effects of climate change on birds 2010, 227–248. [Google Scholar]
- Gilg, O.; Sittler, B.; Hanski, I. Climate Change and Cyclic Predator–Prey Population Dynamics in the High Arctic. Global Change Biology 2009, 15, 2634–2652. [Google Scholar] [CrossRef]
- Gilg, O.; Kovacs, K.M.; Aars, J.; Fort, J.; Gauthier, G.; Grémillet, D.; Ims, R.A.; Meltofte, H.; Moreau, J.; Post, E. Climate Change and the Ecology and Evolution of Arctic Vertebrates. Annals of the New York Academy of Sciences 2012, 1249, 166–190. [Google Scholar] [CrossRef]
- Dupuy, G.; Giraudoux, P.; Delattre, P. Numerical and Dietary Responses of a Predator Community in a Temperate Zone of Europe. Ecography 2009, 32, 277–290. [Google Scholar] [CrossRef]
- Weber, J.-M.; Dailly, L. Food Habits and Ranging Behaviour of a Group of Farm Cats (Felis Catus) in a Swiss Mountainous Area. Journal of Zoology (London) 1998, 245, 234–237. [Google Scholar] [CrossRef]
- Liberg, O. Food Habits and Prey Impact by Feral and House-Based Domestic Cats in a Rural Area in Southern Sweden. Journal of Mammalogy 1984, 65, 424–432. [Google Scholar] [CrossRef]
- Delattre, P.; Giraudoux, P.; Baudry, J.; Quéré, J.P.; Fichet, E. Effect of Landscape Structure on Common Vole (Microtus Arvalis) Distribution and Abundance at Several Space Scales. Landscape Ecology 1996, 11, 279–288. [Google Scholar] [CrossRef]
- Bonnaud, E.; Bourgeois, K.; Vidal, E.; Legrand, J.; Le Corre, M. How Can the Yelkouan Shearwater Survive Feral Cat Predation? A Meta-Population Structure as a Solution? Population Ecology 2009, 51, 261–270. [Google Scholar] [CrossRef]
- Neves, T.; Tapisso, J.T.; Porto, M.; Pereira, H.M.; Mathias, M.L.; Borda-de-Água, L. The Role of Competition in Driving Species Global Distributions: Soricid Shrews as a Case Study. Journal of Biogeography 2019, 46, 134–144. [Google Scholar] [CrossRef]
- Carretero, M.A. From Set Menu to a La Carte. Linking Issues in Trophic Ecology of Mediterranean Lacertids. Italian Journal of Zoology 2004, 71, 121–133. [Google Scholar] [CrossRef]
- Graux, A.-I.; Resmond, R.; Casellas, E.; Delaby, L.; Faverdin, P.; Le Bas, C.; Ripoche, D.; Ruget, F.; Therond, O.; Vertès, F. High-Resolution Assessment of French Grassland Dry Matter and Nitrogen Yields. European Journal of Agronomy 2020, 112, 125952. [Google Scholar] [CrossRef]
- Guislain, M.-H.; Raoul, F.; Giraudoux, P.; Terrier, M.-E.; Froment, G.; Ferté, H.; Poulle, M.-L. Ecological and Biological Factors Involved in the Transmission of Echinococcus Multilocularis in the French Ardennes. Journal of Helminthology 2008, 82, 143–151. [Google Scholar] [CrossRef] [PubMed]
- Fuentes-Montemayor, E.; Ferryman, M.; Watts, K.; Macgregor, N.A.; Hambly, N.; Brennan, S.; Coxon, R.; Langridge, H.; Park, K.J. Small Mammal Responses to Long-Term Large-Scale Woodland Creation: The Influence of Local and Landscape-Level Attributes. Ecological Applications 2020, 30, 1051–0761. [Google Scholar] [CrossRef]
- Andrzejewski, R.; Babińska-Werka, J.; Gliwicz, J.; Goszczyński, J. Synurbization Processes in Population of Apodemus Agrarius. I. Characteristics of Populations in an Urbanization Gradient. Acta Theriologica 1978, 23, 341–358. [Google Scholar] [CrossRef]
- Cavia, R.; Cueto, G.R.; Suárez, O.V. Changes in Rodent Communities According to the Landscape Structure in an Urban Ecosystem. Landscape and Urban Planning 2009, 90, 11–19. [Google Scholar] [CrossRef]
- Gomes, V.; Ribeiro, R.; Carretero, M.A. Effects of Urban Habitat Fragmentation on Common Small Mammals: Species versus Communities. Biodiversity and Conservation 2011, 20, 3577–3590. [Google Scholar] [CrossRef]
- Gortat, T.; Barkowska, M.; Gryczyńska-Siemią Tkowska, A.; Pieniążek, A.; Kozakiewicz, A.; Kozakiewicz, M. The Effects of Urbanization — Small Mammal Communities in a Gradient of Human Pressure in Warsaw City, Poland. Polish Journal of Ecology 2014, 62, 163–172. [Google Scholar] [CrossRef]
- Klimant, P.; Klimantová, A.; Baláž, I.; Jakab, I.; Tulis, F.; Rybanský, Ľ.; Vadel, Ľ.; Krumpálová, Z. Small Mammals in an Urban Area: Habitat Preferences and Urban-Rural Gradient in Nitra City, Slovakia. Polish Journal of Ecology 2017, 65, 144–157. [Google Scholar] [CrossRef]
- Łopucki, R.; Kitowski, I. How Small Cities Affect the Biodiversity of Ground-Dwelling Mammals and the Relevance of This Knowledge in Planning Urban Land Expansion in Terms of Urban Wildlife. Urban Ecosystems 2017, 20, 933–943. [Google Scholar] [CrossRef]
- McKinney, M.L. Effects of Urbanization on Species Richness: A Review of Plants and Animals. Urban Ecosystems 2008, 11, 161–176. [Google Scholar] [CrossRef]
- Caldwell, A.J.; While, G.M.; Wapstra, E. Plasticity of Thermoregulatory Behaviour in Response to the Thermal Environment by Widespread and Alpine Reptile Species. Animal Behaviour 2017, 132, 217–227. [Google Scholar] [CrossRef]
- Brandt, E.E.; Kelley, J.P.; Elias, D.O. Temperature Alters Multimodal Signaling and Mating Success in an Ectotherm. Behavioral Ecology and Sociobiology 2018, 72, 1–14. [Google Scholar] [CrossRef]
- Jara, F.G.; Thurman, L.L.; Montiglio, P.-O.; Sih, A.; Garcia, T.S. Warming-Induced Shifts in Amphibian Phenology and Behavior Lead to Altered Predator–Prey Dynamics. Oecologia 2019, 189, 803–813. [Google Scholar] [CrossRef]
- Battles, A.C.; Kolbe, J.J. Miami Heat: Urban Heat Islands Influence the Thermal Suitability of Habitats for Ectotherms. Global change biology 2019, 25, 562–576. [Google Scholar] [CrossRef]
- Ackley, J.W.; Angilletta, M.J.; DeNardo, D.; Sullivan, B.; Wu, J. Urban Heat Island Mitigation Strategies and Lizard Thermal Ecology: Landscaping Can Quadruple Potential Activity Time in an Arid City. Urban ecosystems 2015, 18, 1447–1459. [Google Scholar] [CrossRef]
- French, S.S.; Webb, A.C.; Hudson, S.B.; Virgin, E.E. Town and Country Reptiles: A Review of Reptilian Responses to Urbanization. Integrative and Comparative Biology 2018, 58, 948–966. [Google Scholar] [CrossRef]
- Brum, P.H.R.; Gonçalves, S.R.A.; Strüssmann, C.; Teixido, A.L. A Global Assessment of Research on Urban Ecology of Reptiles: Patterns, Gaps and Future Directions. Animal Conservation 2023, 26, 1–13. [Google Scholar] [CrossRef]
- Lepczyk, C.A.; Mertig, A.G.; Liu, J. Landowners and Cat Predation across Rural-to-Urban Landscapes. Biological Conservation 2003, 115, 191–201. [Google Scholar] [CrossRef]
- Dickman, C.R. House Cats as Predators in the Australian Environment: Impacts and Management. Human-Wildlife Conflicts 2009, 3, 41–48. [Google Scholar]
- Moseby, K.E.; Peacock, D.E.; Read, J.L. Catastrophic Cat Predation: A Call for Predator Profiling in Wildlife Protection Programs. Biological Conservation 2015, 191, 331–340. [Google Scholar] [CrossRef]
- Cordonnier, M.; Perrot, A.; Ferry, N.; Bonnaud, E.; Baudry, E. Pet Cat Personality Linked to Owner-reported Predation Frequency. Ecology and Evolution 2023, 13, e9651. [Google Scholar] [CrossRef]
- Cecchetti, M.; Crowley, S.L.; McDonald, J.; McDonald, R.A. Owner-Ascribed Personality Profiles Distinguish Domestic Cats That Capture and Bring Home Wild Animal Prey. Applied Animal Behaviour Science 2022, 256, 105774. [Google Scholar] [CrossRef]
- Krauze-Gryz, D.; Gryz, J.; Goszczyński, J. Predation by Domestic Cats in Rural Areas of Central Poland: An Assessment Based on Two Methods. Journal of Zoology 2012, 288, 260–266. [Google Scholar] [CrossRef]
Figure 1.
Location of the 36 568 preys brought home by cats over the 8-year period of survey. Reclassified Corine Land Cover 2018 in four categories: urbain (grey), natural (green), agricultural (yellow) and water (blue).
Figure 1.
Location of the 36 568 preys brought home by cats over the 8-year period of survey. Reclassified Corine Land Cover 2018 in four categories: urbain (grey), natural (green), agricultural (yellow) and water (blue).
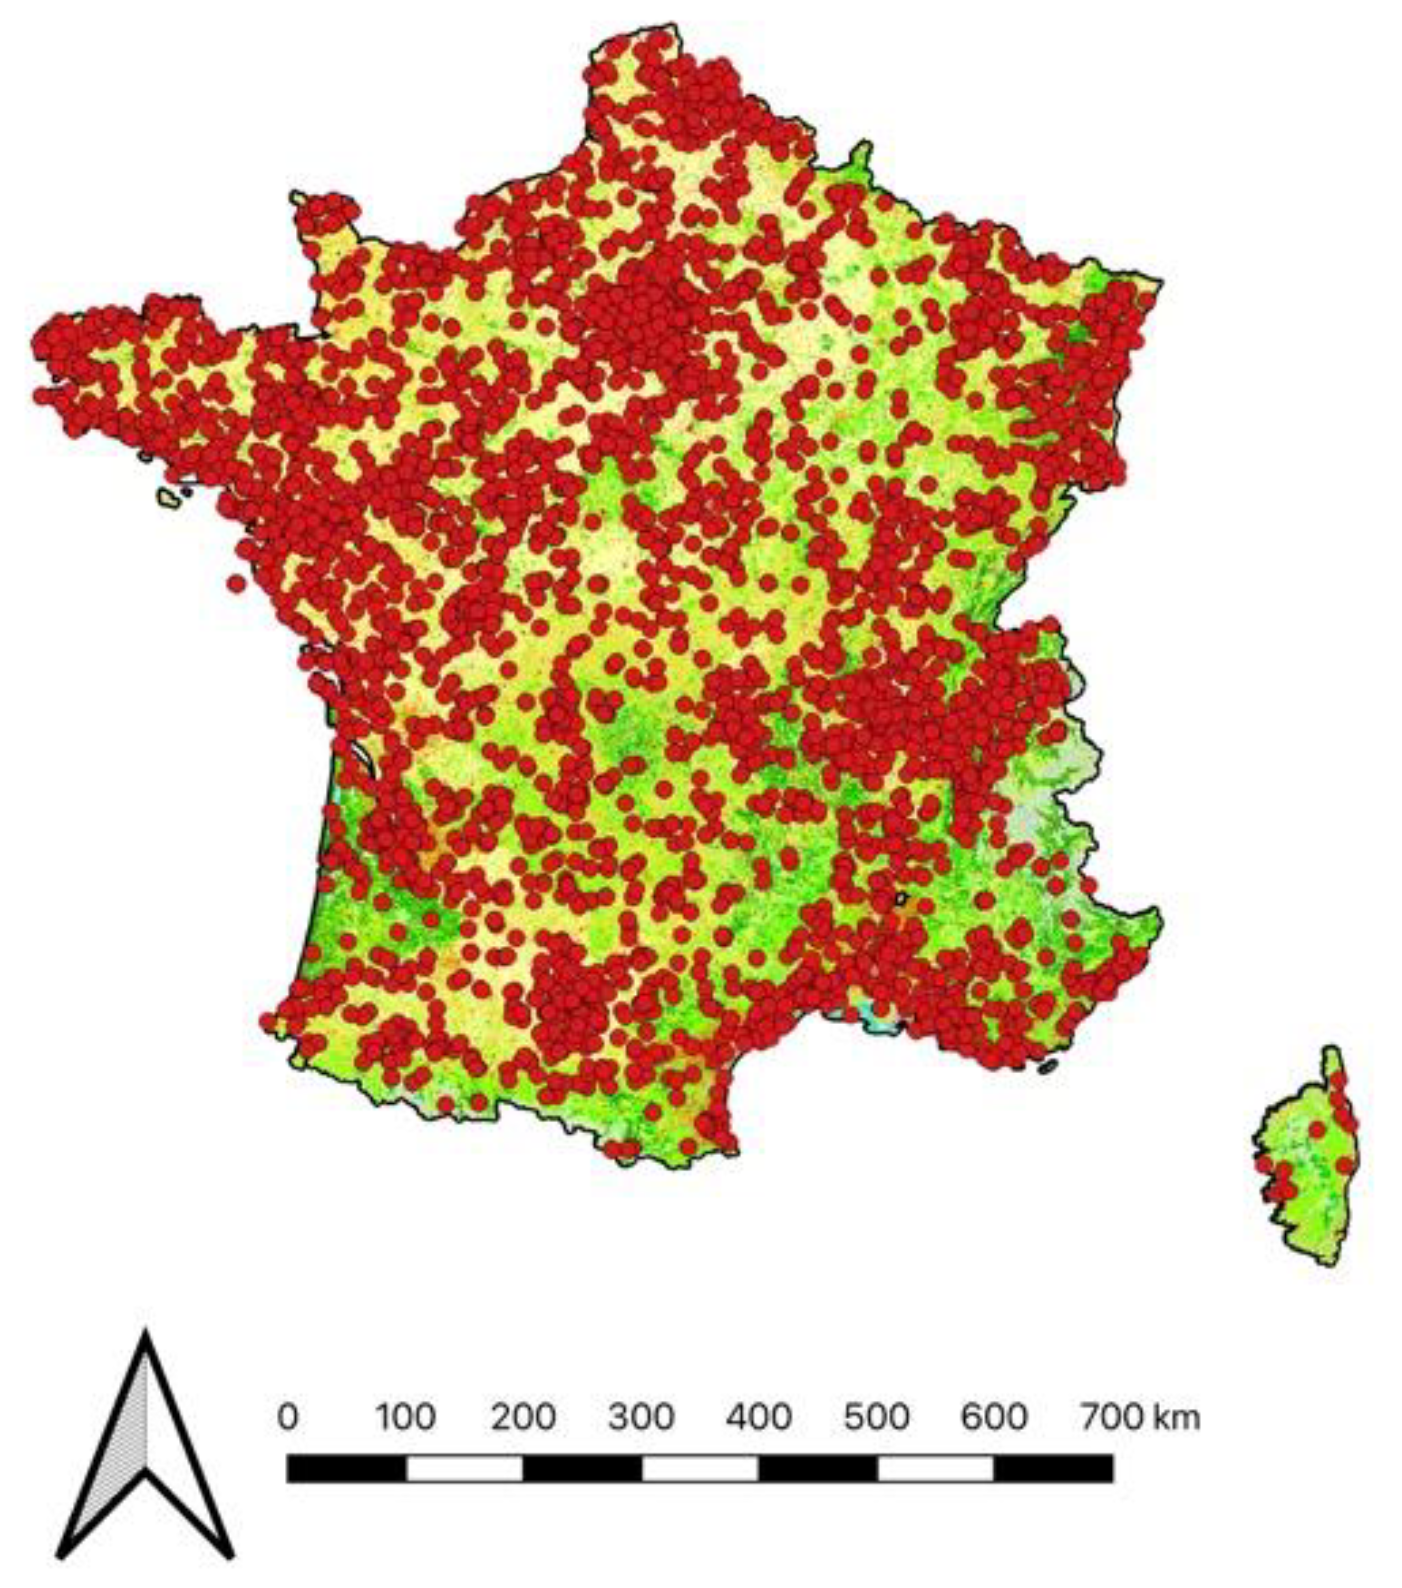
Figure 2.
The predicted number of five main prey categories brought home per month by cats throughout the year: Soricids (A), Cricetids (B), Murids (C), Passerines (D) and Lacertids (E). Curves represent cyclic splines fits with 95% Confidence Intervale as predicted by the GAMMs summarized in Table 1. Seasons are represented by transparent areas: winter (grey), spring (green), summer (yellow) and autumn (orange).
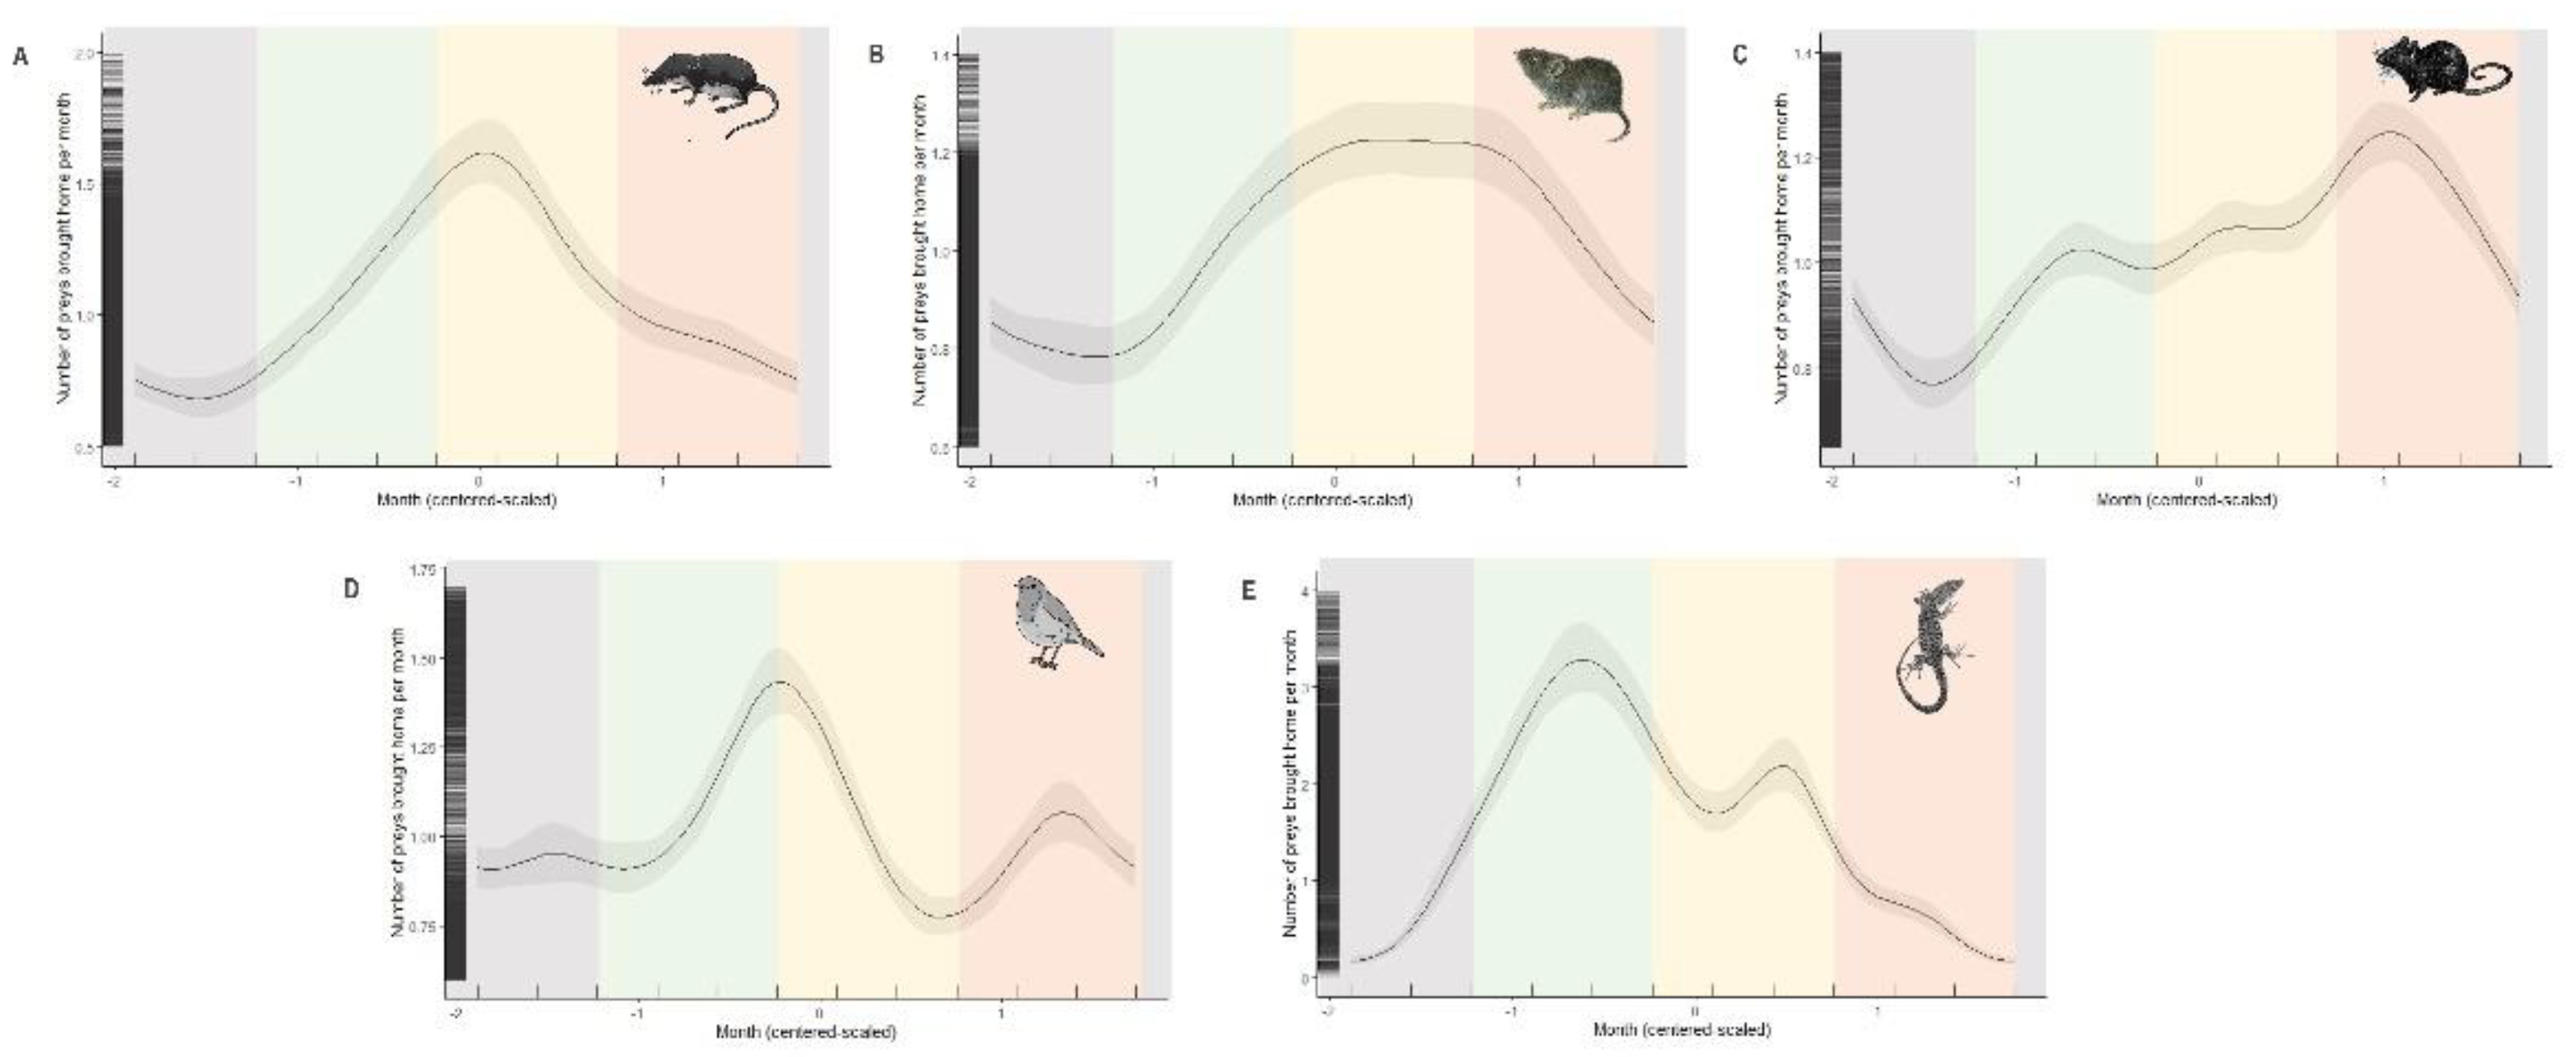
Figure 3.
The predicted number of soricids (A) and cricetids (B) brought home by cats according to the mean annual rainfall. Curves represent cubic regression splines fits with 95% CI as predicted by GAMMS summarized in Table 1.
Figure 3.
The predicted number of soricids (A) and cricetids (B) brought home by cats according to the mean annual rainfall. Curves represent cubic regression splines fits with 95% CI as predicted by GAMMS summarized in Table 1.
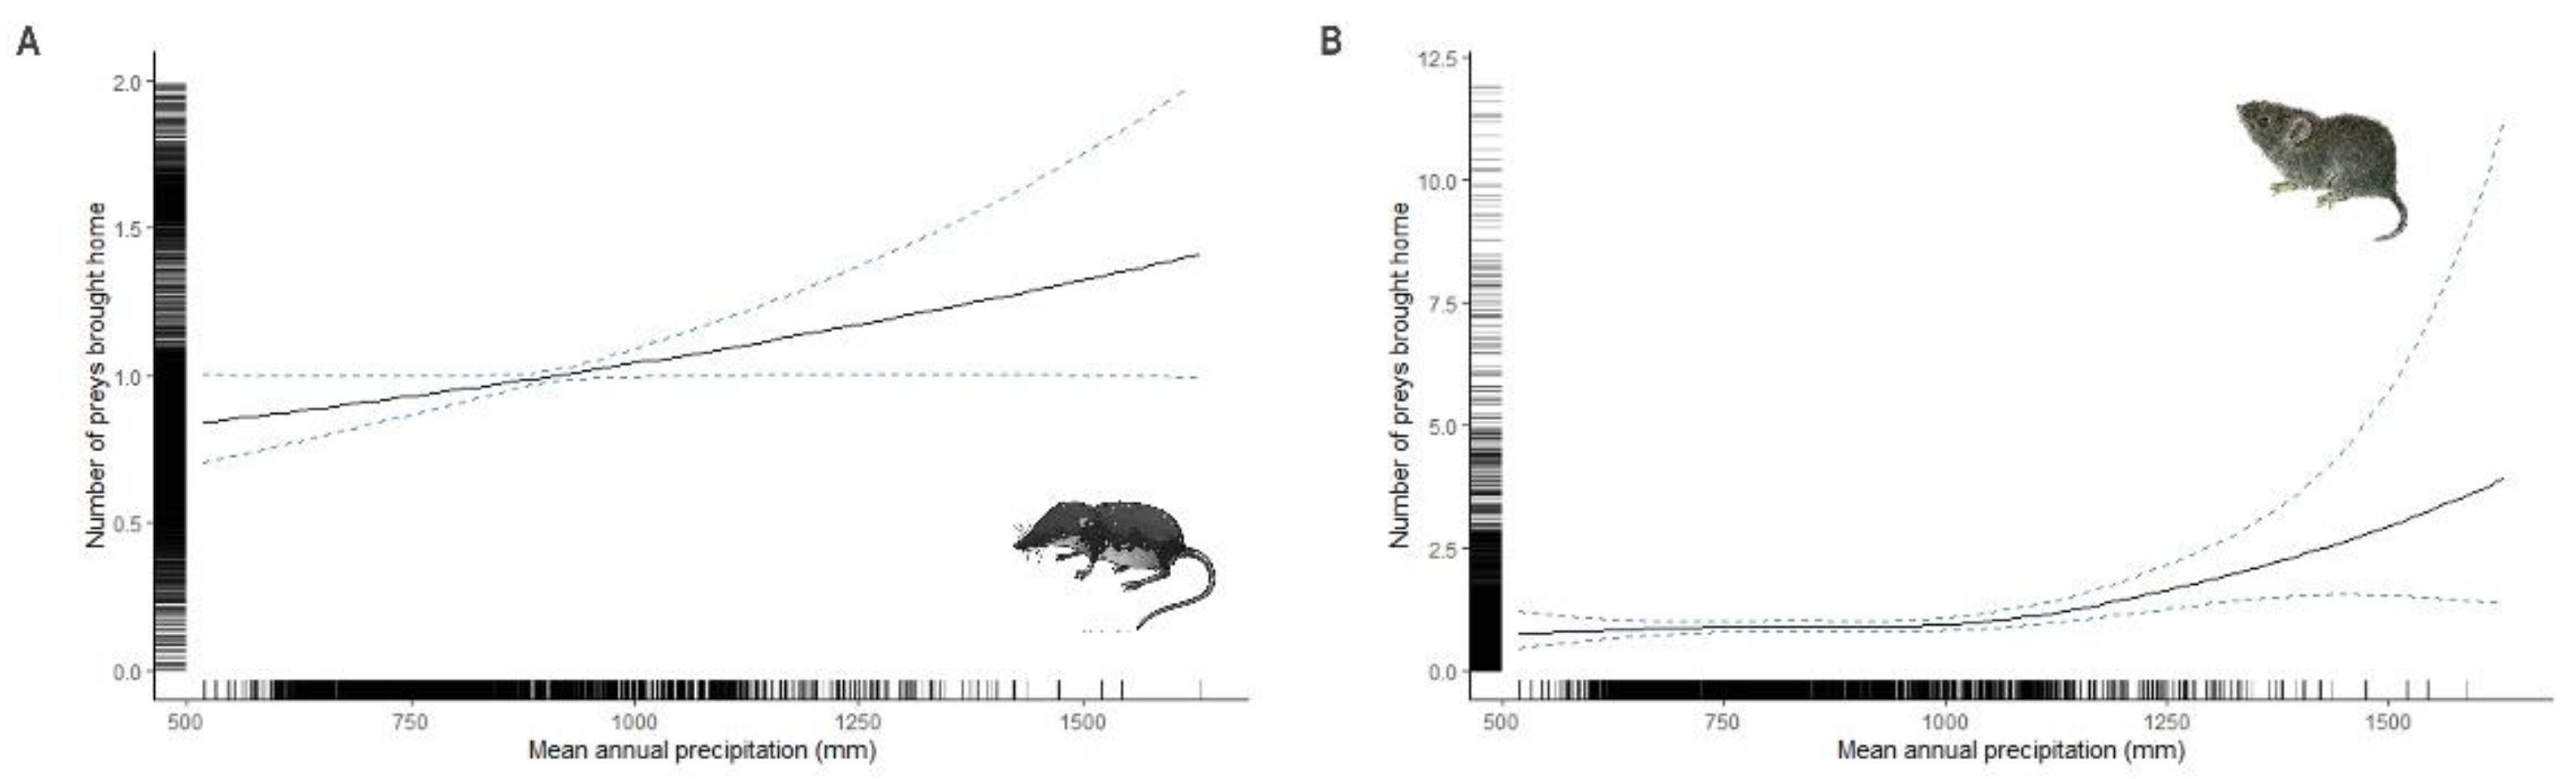
Figure 4.
The predicted number of the five mains prey categories brought home by cats according to latitude and longitude: Soricids (A), Cricetids (B), Murids (C), Passerines (D) and Lacertids (E). A simple heatmap represent both variables and their interaction. The interior is a topographic map of predicted values with yellow to blue colours representing larger to smaller predictions.
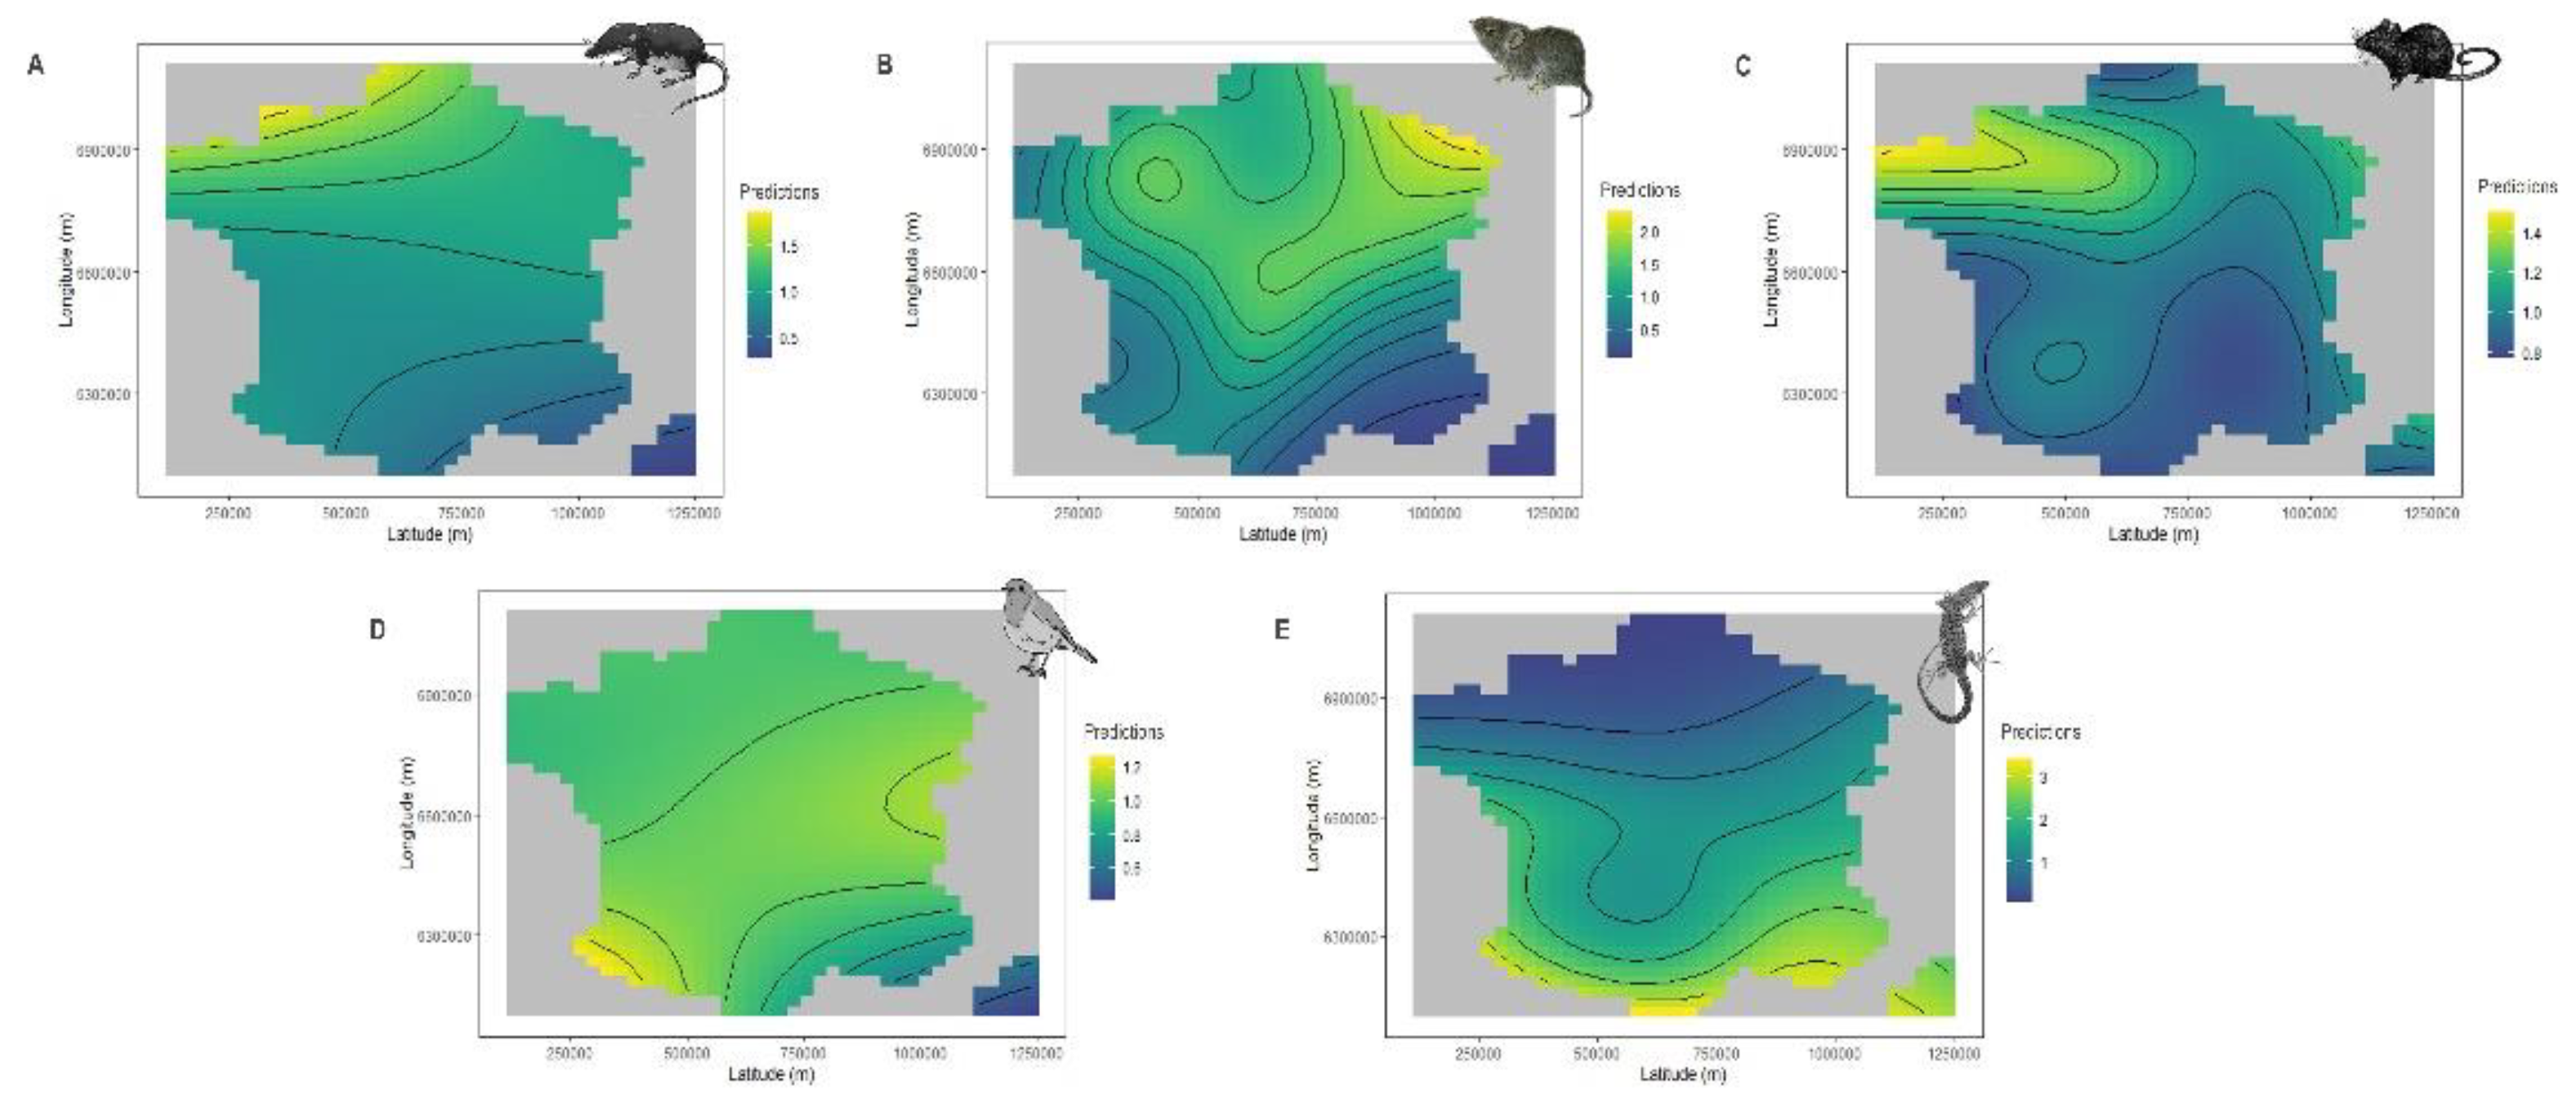
Figure 5.
The predicted number of Cricetids (A), Murids (B), Passeriforms (C) and Lacertids (D) brought home by cats according to the Human Footprint Index. Curves represent cubic regression splines fits with 95% CI as predicted by GAMMS summarized in Table 1.
Figure 5.
The predicted number of Cricetids (A), Murids (B), Passeriforms (C) and Lacertids (D) brought home by cats according to the Human Footprint Index. Curves represent cubic regression splines fits with 95% CI as predicted by GAMMS summarized in Table 1.

Figure 6.
The predicted number of the five mains prey categories brought home by cats according to their age and sex: Soricids (A), Cricetids (B), Murids (C), Passerines (D) and Lacertids (E). Curves represent cubic regression splines fits with 95% CI as predicted by GAMMS summarized in Table 1.
Figure 6.
The predicted number of the five mains prey categories brought home by cats according to their age and sex: Soricids (A), Cricetids (B), Murids (C), Passerines (D) and Lacertids (E). Curves represent cubic regression splines fits with 95% CI as predicted by GAMMS summarized in Table 1.
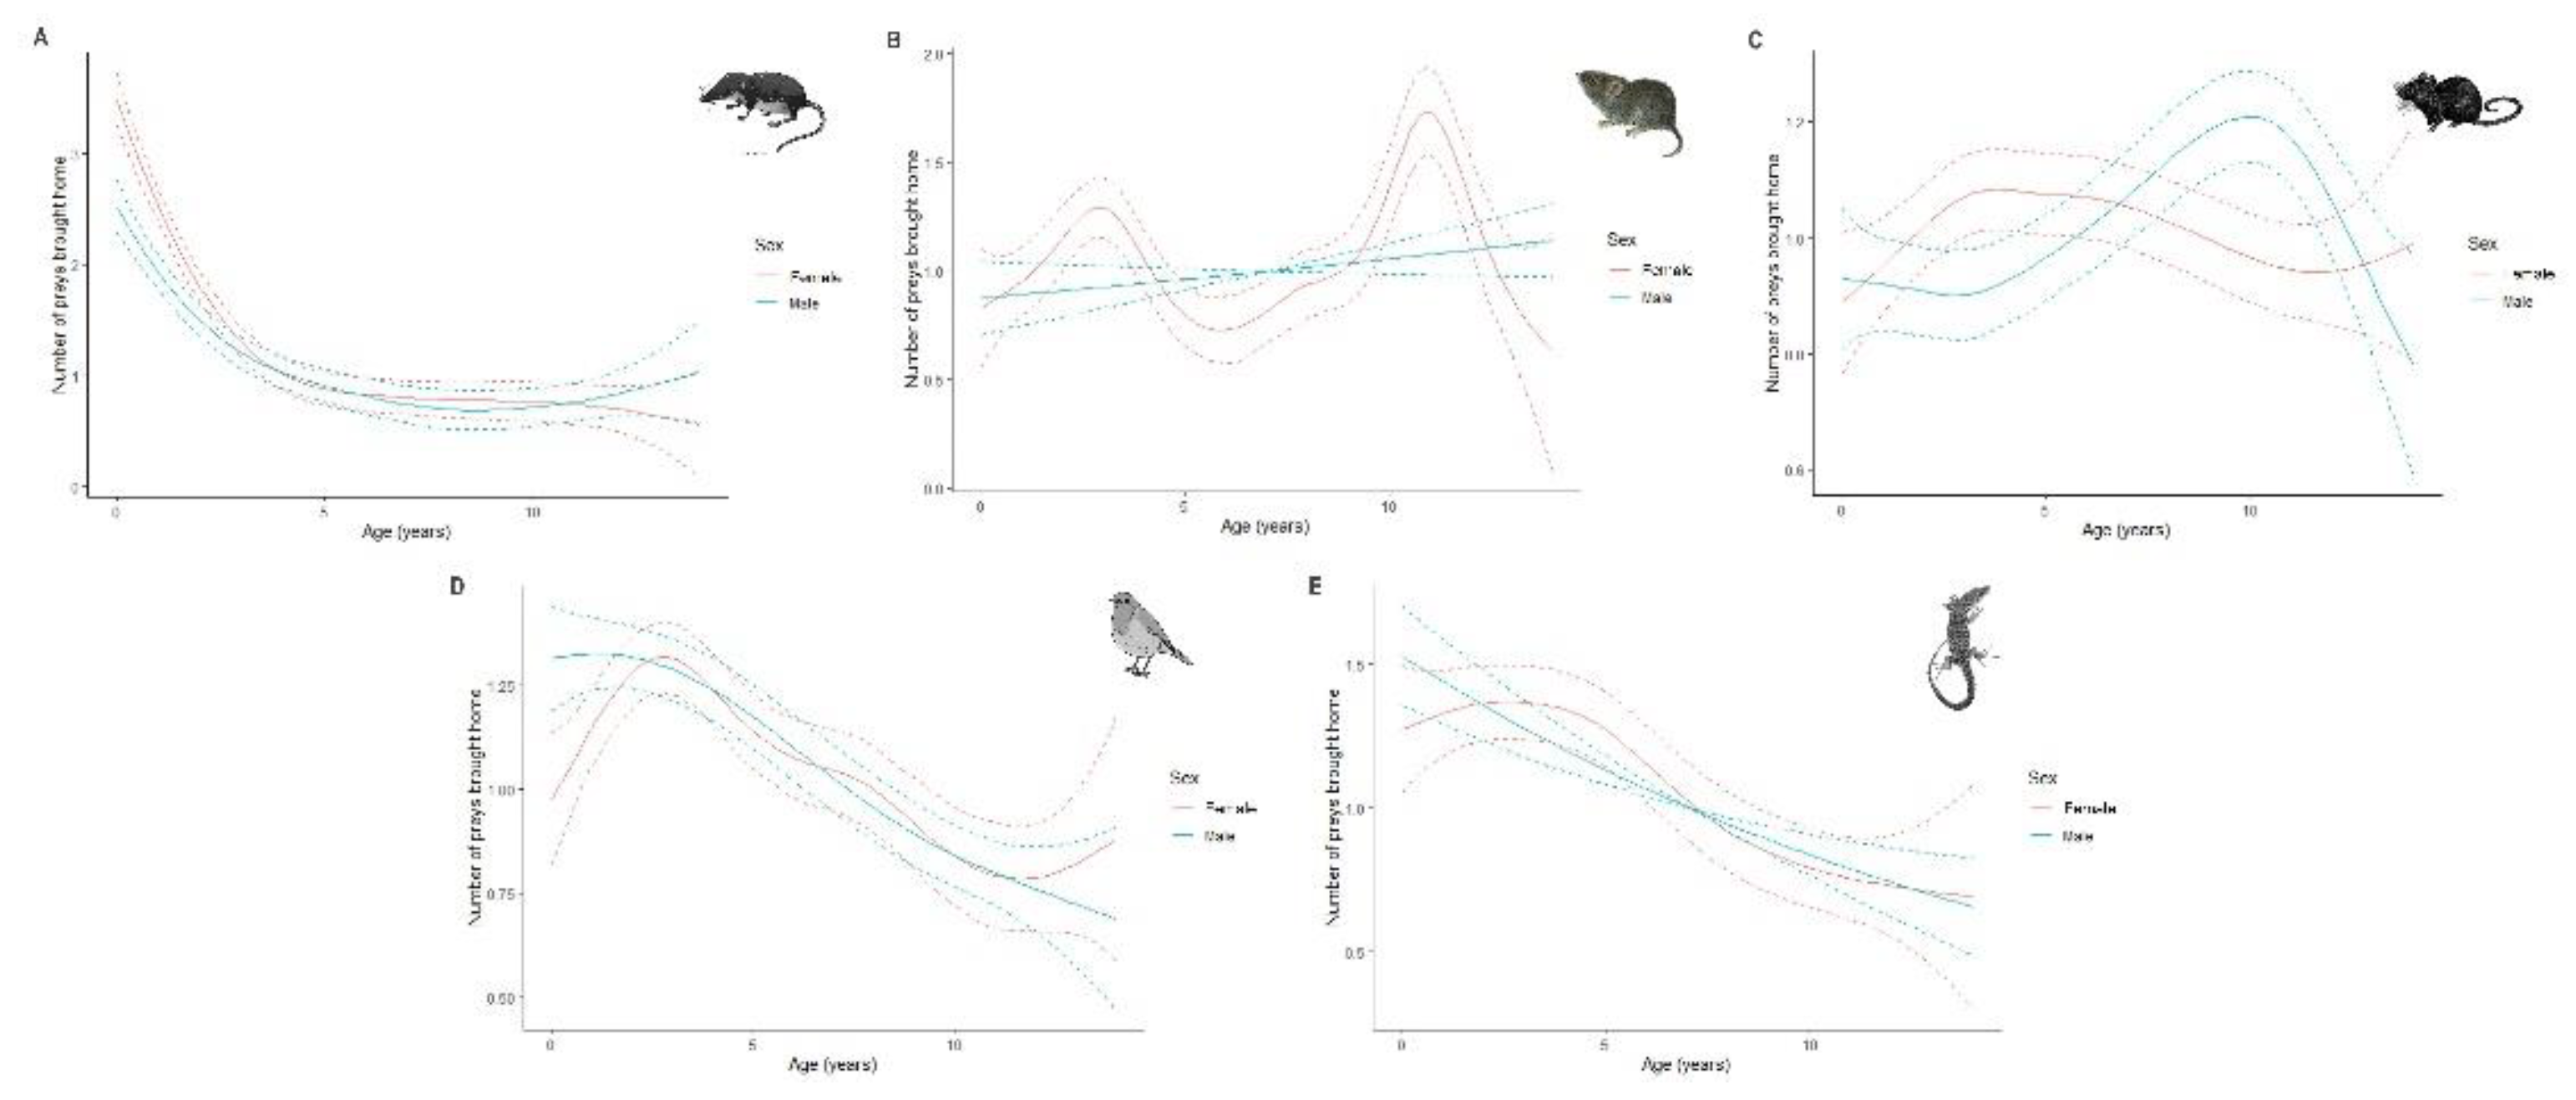

Table 1.
Summary of generalized additive mixed models (GAMMs) explaining the number of the five main prey categories brought home by free-ranging domestic cats. Estimated degrees of freedom (Edf) are given for splines.
Table 1.
Summary of generalized additive mixed models (GAMMs) explaining the number of the five main prey categories brought home by free-ranging domestic cats. Estimated degrees of freedom (Edf) are given for splines.
| Model | Predictor | Estimate (SE) | Statistic | P-value* |
|---|---|---|---|---|
| GAMMsoricids R2adj = 0.48 Pearson estimate = 0.66 Deviance explained = 53.6% |
Intercept | -2.78 (0.24) | z = -11.52 | 0.0001 |
| Month | Edf = 5.33 | X2 = 492.31 | 0.01 | |
| Rainfall | Edf = 1.05 | X2 = 3.97 | 0.05 | |
| Latitude * Longitude | Edf = 5.37 | X2 = 45.65 | 0.0001 | |
| HFI | Edf = 3.12 | X2 = 4.94 | 0.14 | |
| Age(Female) | Edf = 4.21 | X2 = 172.49 | 0.0001 | |
| Age(Male) | Edf = 3.45 | X2 = 86.96 | 0.0001 | |
| CatID | Edf = 1154.40 | X2 = 8888.47 | 0.001 | |
| Town | Edf = 0.28 | X2 = 2.53 | 0.74 | |
| Year | Edf = 6.67 | X2 = 827.85 | 0.01 | |
| GAMMcricetids R2adj = 0.41 Pearson estimate = 0.76 Deviance explained = 57.1% |
Intercept | -2.16 (0.13) | z = -17.19 | 0.0001 |
| Month | Edf = 4.56 | X2 = 571.14 | 0.05 | |
| Rainfall | Edf = 3.12 | X2 = 13.15 | 0.01 | |
| Latitude * Longitude | Edf = 12.41 | X2 = 82.82 | 0.0001 | |
| HFI | Edf = 3.40 | X2 = 163.78 | 0.0001 | |
| Age(Female) | Edf = 7.50 | X2 = 72.13 | 0.0001 | |
| Age(Male) | Edf = 1.00 | X2 = 2.38 | 0.12 | |
| CatID | Edf = 1309.41 | X2 = 16494.29 | 0.01 | |
| Town | Edf = 0.60 | X2 = 90.78 | 0.85 | |
| Year | Edf = 5.79 | X2 = 544.12 | 0.82 | |
| GAMMmurids R2adj = 0.37 Pearson estimate = 1.16 Deviance explained = 47.2% |
Intercept | -0.65 (0.05) | z = -14.14 | 0.0001 |
| Month | Edf = 6.63 | X2 = 209.70 | 0.0001 | |
| Rainfall | Edf = 1.83 | X2 = 1.63 | 0.52 | |
| Latitude * Longitude | Edf = 1.30 | X2 = 49.32 | 0.0001 | |
| HFI | Edf = 2.84 | X2 = 39.99 | 0.0001 | |
| Age(Female) | Edf = 3.72 | X2 = 10.44 | 0.1 | |
| Age(Male) | Edf = 4.73 | X2 = 30.14 | 0.0001 | |
| CatID | Edf = 1828 | X2 = 51789.30 | 0.79 | |
| Town | Edf = 0.00 | X2 = 0.00 | 0.99 | |
| Year | Edf = 4.97 | X2 = 41.94 | 0.05 | |
|
GAMMpasseriforms R2adj = 0.18 Pearson estimate = 0.88 Deviance explained = 24.7% |
Intercept | -1.16 (0.04) | z = -31.89 | 0.0001 |
| Month | Edf = 6.91 | X2 = 251.62 | 0.0001 | |
| Rainfall | Edf = 1.00 | X2 = 1.69 | 0.19 | |
| Latitude * Longitude | Edf = 5.62 | X2 = 11.61 | 0.1 | |
| HFI | Edf = 4.52 | X2 = 18.14 | 0.01 | |
| Age(Female) | Edf = 4.90 | X2 = 46.01 | 0.0001 | |
| Age(Male) | Edf = 2.71 | X2 = 56.38 | 0.0001 | |
| CatID | Edf = 1045.30 | X2 = 6135.86 | 0.96 | |
| Town | Edf = 0.20 | X2 = 0.57 | 0.77 | |
| Year | Edf = 0.80 | X2 = 1.10 | 0.91 | |
| GAMMlacertilians R2adj = 0.46 Pearson estimate = 0.58 Deviance explained = 55.7% |
Intercept | -3.06 (0.08) | z = -37.57 | 0.0001 |
| Month | Edf = 7.61 | X2 = 785.08 | 0.0001 | |
| Rainfall | Edf = 2.79 | X2 = 3.59 | 0.31 | |
| Latitude * Longitude | Edf = 1.86 | X2 = 297.10 | 0.0001 | |
| HFI | Edf = 1.00 | X2 = 11.18 | 0.0001 | |
| Age(Female) | Edf = 3.14 | X2 = 29.88 | 0.0001 | |
| Age(Male) | Edf = 1.00 | X2 = 23.71 | 0.0001 | |
| CatID | Edf = 949.90 | X2 = 4953.17 | 0.001 | |
| Town | Edf = 0.00 | X2 = 0.00 | 0.95 | |
| Year | Edf = 3.56 | X2 = 8.90 | 0.06 |
* Significant effects are in bold, trends are in italic.
Disclaimer/Publisher’s Note: The statements, opinions and data contained in all publications are solely those of the individual author(s) and contributor(s) and not of MDPI and/or the editor(s). MDPI and/or the editor(s) disclaim responsibility for any injury to people or property resulting from any ideas, methods, instructions or products referred to in the content. |
© 2023 by the authors. Licensee MDPI, Basel, Switzerland. This article is an open access article distributed under the terms and conditions of the Creative Commons Attribution (CC BY) license (http://creativecommons.org/licenses/by/4.0/).
Copyright: This open access article is published under a Creative Commons CC BY 4.0 license, which permit the free download, distribution, and reuse, provided that the author and preprint are cited in any reuse.


