
Submitted:
02 July 2023
Posted:
03 July 2023
You are already at the latest version
Abstract
In an urban context, the street network can be considered the most substantial element, as its role is to create the whole urban setting. The street network is a spatial pattern that can be recognized as a linkage bonding other components of the urban context, such as buildings and open spaces. Basically, the street is not only a collection of lines that transfer people, vehicles and goods but also denote a broad range of activities and influences people’s responses. In this respect, some studies address the street as a network that entails two key elements, link and node; the link can be defined by the type of mechanism that it connects, while the node can be identified according to the analysis technique. Defining the street’s elements is a crucial step in ascertaining the expression of whatever is a link or/and a node. Thus, some scholars use the link to refer to a street, and node for the intersection, while others employ the opposite meaning. Two different viewpoints deal with spatial network analysis; the first is a technique based on topological depth, such as Space Syntax SS, and the second is Multiple Centrality Assessment (MCA) that is employed for metric analysis. This paper compares Space Syntax (SS) and Multiple Centrality Assessment (MCA) by measuring the integration and centrality of the street, and highlights the points of similarity and difference between the two techniques.
Keywords:
Graphic theory
; street network
; space syntax (SS)
; multiple centrality assessment (MCA)
1. Introduction
The importance of street space might be extended to include intangible dimensions that mainly relate to historical and social considerations and could be conceived and experienced by people. It plays, to a large extent, an essential role in forming the whole urban setting whilst the city is characterised by the pattern of the street. The street network is a spatial pattern that can be identified as a platform to link other components of the urban setting, such as buildings and open spaces. Fundamentally, the street network is not only a cluster of lines that transfer people, vehicles and goods from a certain point to another, but also contributes to a broad spectrum of activities and influences human behaviour. In this regard, some studies address the street as a network that consists of two primary elements, link and node. The link can be represented by the type of mechanism that it connects, whilst the node can be classified according to the method of the analysis adopted. Determining the street’s elements is a critical point in ascertaining the expression of whatever is a link or/and a node. Thus, some scholars tend to use the term link to refer to a street, and node to define the intersection; meanwhile, others adopt the opposite meaning. This paper will introduce two different perspectives deal with spatial network analysis; the first is a method that is based on topological depth, such as Space Syntax SS, and the second is Multiple Centrality Assessment (MCA) that is used for metric analysis. Besides, it will provide the metric network map of the selected area which will be subject to the MCA.
The street network can be defined as one of the most vital ingredients of an urban setting. It has an essential role in creating the whole urban milieu incorporating components such as buildings and open spaces. Primarily, the street is not only a gathering of links that transfer people, vehicles and goods but also offers a comprehensive spectrum of activities and influences human behaviour. The importance of the street space might be extended to include intangible dimensions that mainly relate to historical and social considerations and could be conceived and experienced by people. In this regard, some studies deal with the street as a system that consists of two main ingredients, link and node. The link can be signified by the type of mechanism that it connects, whilst the node can be identified according to the process of the analysis. Delimiting the street’s components is a significant step to verifying the interpretation of a link or/and a node. Therefore, some scholars prefer to adopt the link to denote a street, and a node to describe the intersection; meanwhile, others choose the opposite meaning. Besides, two different approaches deal with spatial network analysis; the first is based on topological depth, such as Space Syntax SS, and the second is Multiple Centrality Assessment (MCA), which is applied for metric analysis.
A considerable number of scholars and researchers have adopted the practical approaches of Space Syntax (SS) and Multiple Centrality Assessment (MCA) in different ways (van Nes et al. 2017); (Lin et al. 2018); (Pafka et al. 2020); (Garau et al. 2020); (van Nes et al. 2021). Al-Saaidy and Alobaydi (2021b) used the MCA technique in order to make a correlation between human density and the value of betweenness within the different urban patterns in Baghdad, Iraq (Al-Saaidy et al. 2021b). Also, Al-Saaidy (2019) sought to study the correlation between the degree of betweenness (MCA) and human behaviour in four urban areas in Baghdad, Iraq (Al-Saaidy 2019). Furthermore, Remali (2014) adopted the MCA to capture the essence of the capital city, namely urban form and urban life in the city centre of Tripoli, Libya (Remali 2014). Meanwhile, many researchers have applied Space Syntax (SS) to consider various correlations between Space Syntax, other urban aspects and human behaviour. Alobaydi and Rashid (2015) employed the Space Syntax measure to evolve the syntactic structures of Baghdad introducing transect as a way to study morphological evolution (Alobaydi et al. 2015). This paper will conduct a comparative analysis of Space Syntax (SS) and Multiple Centrality Assessment (MCA) aside from the practical perspective and other urban analysis aspects, which will be addressed in future research.
2. Graph Theory and Spatial Network Analysis
Graph Theory can be defined as the mathematics that describe the specific properties of the relations between two representatives; a line and a point. Graph Theory creates a nodal structure where each point has a unique value that relies on its position and the number of lines to connect to other points within the same nodal structure (Nystuen et al. 1961) (Figure 1).
Graph Theory deals with a specific phenomenon as an ideal given case; it represents the components of that phenomenon as a set of points and set of lines to describe the relations between them. The graph defines the communication network where each position in a real system corresponds to a point or node in the graph, and the symmetric communication path or edge corresponds to a link or line that connects a pair of points or positions (Freeman 1979) (Figure 2).
According to Freeman (1979, p 219 - 227), ‘graph centrality’ is when, “a graph is compact to the degree that the distances between pairs of its points are short. Thus, for those who define point centrality in terms of closeness, the graph-theoretic conception of compactness seems to be a natural extension of the centrality idea”. Freeman explained that a certain point or person could be structurally more central than other points or individuals in any other network of a similar size. Freeman (1979, p 219 - 227) states that, “position has the maximum possible degree; it falls on the geodesics between the largest possible number of other points and, since it is located at the minimum distance from all other points, it is maximally close to them”. In respect to graph centrality, each single point (representing a person) reflects the relative dominance when subject to a degree-based measure. Since the 1940s, social scientists have expressed significant interest in network research, including graph theory and how to reflect this in social networks. This plays a key role in formulating the primary trend of social studies. Social scientists have attempted to invest in social network analysis and to contribute to a thoughtful exploration of the expectations, aims, and explanatory mechanisms in the field. The main point of interest is the adoption of network analysis by sociologists who studied transformations in the social fabric of cities after communities were destroying by the new fashion for urbanisation (Borgatti et al. 2009) (Figure 3).
Porta et al. (2006a) describe elaborate networks in various fields, including economics and social science, and suggest that natural and human-made systems have already been subject to some common structural properties. Graphically, the concept of structural sociology deals with people as a type of network system, where individuals can be recognised as nodes, and the relationship between them can be represented as edges or links. However, the definitions of street and intersection are based on the type of graph, with the street as a link and the intersection as a node, or vice versa. Porta et al. (2006a) state that all these contributions and approaches have dealt with various terms, such as accessibility, proximity, integration, connectivity, cost or effort. These terms principally focus on the notion that some streets or spaces seem to be more interesting than others because they have a higher centrality (Porta et al. 2006a). Thus, Space Syntax and Multiple Centrality Analysis (MCA) are two spatial analysis approaches (Figure 4).
2.1. Space Syntax (SS)
It is widely acknowledged that the contribution of urban studies was mostly theoretical until the seminal studies of Hillier et al. (1984). Space Syntax is a dependable application for examining the network system across the various entities of a city, namely streets, neighbourhoods, activities, traffic flow, and particular buildings. Hillier et al. (1976) illustrate that Space Syntax is an attempt to analyse artificial systems, like space patterns and social patterns, for inherent formal structures that could contribute to knowledge. Hillier et al. (1976, p 150) confirmed that, “man-made space is effectively two-dimensional because the movement is two dimensional”. In this respect, two-dimensional space can be characterised by the use of graph theory, which expresses the space as a point or step; this, however, deals with topological depth as a strategy of Space Syntax (Figure 5).
Space Syntax, according to Hillier et al. (1987, p 363), “... is a set of techniques for the representation, quantification, and interpretation of spatial configuration in buildings and settlements. Configuration is defined in general as, at least, the relation between two spaces considering a third, and, at most, as the relations among spaces in a complex taking into account all other spaces in the complex. Spatial configuration is thus a more complex idea than spatial relation, which needs invoke no more than a pair of related spaces” Moreover, they demonstrate that, “the Space Syntax techniques which post-dict (Techniques which find regularities that form the basis for prediction Hillier, B., A. Penn, et al. (1993a). "Natural movement-or, configuration and attraction in urban pedestrian movement." Environment and Planning B-Planning & Design 20(1): 29-66, https://doi.org/10.1068/b200029.) natural movement were not originally aimed at modelling movement but at understanding the morphological logic of urban grids, especially their growth” (Hillier et al. 1993a, p 32). Depth and choice are the configurational properties of spatial analysis, where depth determines the number of spaces that would be required to move from one space to another. Choice offers many alternative routes to pass from one selected space to another. The concept of depth will be formulated in quantitative form, called integration, to express the relative depth of a space (line) from all others in the graph and to produce the mean depth of each line in the system from every line (space) (Hillier et al. 1987); (Hillier et al. 1993a).
The integration value determines that, “the most integrated lines are those from which all others are shallowest on average, and the most segregated are those from which they are deepest” (Hillier et al. 1993a, p 35). Empirically, three fundamental imageries express the application of Space Syntax: axial graph, node graph, and axial map. The axial graph represents the grid where the lines are the nodes and the intersections of these lines are the edges (Hillier et al. 1993a). The primary rule of Space Syntax is to rely on a topological measure rather than a metric measure. The topological pattern can be represented by an axial map that translates the space as a node, and the intersection as a line; this is the second rule of Space Syntax (Hillier 1999b). Hillier argues for the adoption of topological depth as an alternative technique to metric depth; furthermore, this argument has become a stimulating issue for other scholars addressing a new approach in the analysis of spatial patterns. The mechanism to consider the space (street) as a node and the intersection as a line (link) is another dialectic issue for scholars. Figure 6 illustrates that there are four prerequisite steps to understand the integration pattern of the street network. The first step is to determine the boundary of the case study (1), and then to draw the street network and open spaces (2) to produce the axial map (3); the final stage subjects the axial map to the Space Syntax formula to create the integration pattern map.
2.2. Multiple Centrality Assessment (MCA)
Bavelas (1948) presented the concept of centrality in dealing with communication between people. Freeman (1979) states that Bavelas investigated communication within small groups and his hypothesis concerned the relationship between structural centrality and its effects on group processes. Freeman (1979) reported some significant references that addressed the centrality index in communities; these were similar to Bavelas (1948), (1950), Bavelas et al. (1951) and Leavitt (1949), (1951). According to Freeman (1979), the first research to apply centrality was supervised by Bavelas at the Group Networks Laboratory, M.I.T. in the late 1940s. Also, he stated that the first studies in centrality were conducted by Leavitt (1949) and Smith (1950). These were similarly reported by Bavelas (1950) and Bavelas et al. (1951), and addressed in detail by Leavitt (1951). The meaning of centrality, as reported by these studies, related to group efficiency and problem-solving, the awareness of leadership and the personal satisfaction of participants.
Throughout the 1950s and 1960s in particular, the principle of centrality became the basis for numerous experiments; these extended, revised and perfected the centrality results (Freeman 1979). Moreover, Freeman (1979) states that centrality in its own right could be divided into different kinds: centrality as control, centrality as independence, and centrality as an activity. However, combining these three types would, for example, be fruitful to a phenomenon that has different variables and aspects. The scope of the centrality approach has not been narrowed to involve only experimental studies of group problem-solving as a considerable number of researchers have also adopted centrality, for example political integration within the context of social life (Cohn et al. 1958), mentioned in Freeman (1979). Furthermore, Pitts (1965) studied centrality in communication paths for urban development and attempted to reconstruct the Twelfth-Century river transport network in central Russia. In 1974, Rogers researched the occurrence of two types of centrality through inter-organisational relations and found that some organisations managed to be more central than others.
This consideration was derived from the properties of the organisation itself and the characteristics of the network in which it was embedded. Recently, the idea of centrality has attracted the attention of scholars and researchers from different fields of knowledge, such as community organisations, urban studies, and city planning. It is receiving investment from a wide range of applications, meaning that centrality is a quintessential structural attribute of the social network. Thus, centrality refers to the location, position or points in networks and the ways in which to generate the structural properties of the whole network (Freeman 1979). The idea of a network, however, emerged in social studies and anthropology. It was envisaged that, “each person as a node linked with others to form a network to quantify both the interactional attribute of the linkages and to overall morphological attribute of a network” (Rogers 1995, p 15). One of the fundamental issues in urban research is the extent to which measures can provide meaningful and precise findings. The spatial network is considered a vital layer in an urban configuration; it contributes to the shape and whole image of the urban space and is achieved by creating links between urban features. Moreover, it is continuous and moves in harmony with other urban components. Therefore, centrality can reflect a considerable number of factors about human behaviours in urban spaces (Crucitti et al. 2006a), (Crucitti et al. 2006b).
Porta et al. (2006a) stated that centrality, as an intricate system, originated and developed in other scientific fields, particularly structural sociology, before its use in urban research. Furthermore, “centrality has never been extensively investigated metrically in geographic networks at it has been topologically in a wide range of other relational networks such as social, biological, or technological ones” (Porta et al. 2006a, p 705). Porta et al. (2009) stated that the main characteristics of the MCA are the adoption of a standard primal format to represent the street network and that all centrality measures deal with a real street network as a metric computation. It measures centrality by using multiple peer indices, and centrality can reflect a significant role in forming a city’s growth, besides how it works. According to Crucitti et al. (2006b), centrality is a tool to diagnose the value of nodes and edges within the spatial networks of urban spaces. The origin of the principles of centrality occurred in the context of a social system that regarded an individual as part of a whole system that could affect group processes (Crucitti et al. 2006b). This is a new pattern in philosophy that understands human dimensions by reading the relationship between humans and urban elements.
Porta et al. (2006a) defined centrality within a number of studies by focusing on the importance of the growth of centrality in analysing the network system. Porta et al. (2006a) addressed different types of centrality and concluded that efficiency as an index represents a kind of closeness that is used geographically and normalised by associating the shortest length of paths with the virtual straight lines between the same nodes. This becomes the straightness centrality , which identifies a new geographic idea, namely the most directly accessible nodes by all others in the network system; this concerns the most central nodes. The other two indices of centrality, closeness and betweenness , are embedded into the information centrality to generate another concept of a central node, namely when they are critical for other nodes (Porta et al. 2006a). Additionally, Freeman (1979), who defines the centrality of a point, referred to three types of structural attributes for a network: degree, betweenness, and closeness.
Therefore, the centrality indices are: (1) Degree Centrality, (2) Closeness Centrality, (3) Betweenness Centrality, (4) Straightness Centrality, (5) Information Centrality and (6) Efficiency Centrality (Cardillo et al. 2006); (Crucitti et al. 2006b); Freeman (1977); Porta et al. (2006a); Porta et al. (2009). It would be valuable to etymologically, algorithmically and terminologically track the six indices of centrality and their meanings. This research adopted Multiple Centrality Assessment (MCA) as one of its methodological processes.
The degree of centrality, CD, can be represented as the number of ties for one node that connect to other nodes in the graphic network. The more significant the number of ties, the more important the node. The degree of centrality of i is formulated as:
Where ki is the degree of node i, i.e. the number of nodes adjacent to i. The value of is between 0 and 1; 1 when a node is connected to all other nodes of the graph and 0 when there is no connection. The degree of a node can be noted as the number of edges incident with the node or the first neighbours of the node. The degree ki of node i is defined within the adjacency matrix as:
Closeness centrality, CC: identifies the nearest nodes to node i along the shortest links and is formulated as:
Where dij is the shortest link length between i and j. The minimum sum of the length of the edge among all possible links between i and j is the valued graph. Such an index is crucial for a connected graph or, in case one is artificial, it assumes dij is equal to a finite value and there is no path between the two nodes i and j, then marks between 0 and 1 are a nonvalued graph.
Betweenness centrality, CB: the node will be centred when there is a number of links that connect it to other nodes. The betweenness centrality of node i is defined as:
where njk is the number of shortest links between j and k, and njk(i) is the number of shortest links between j and k that contain node i. has one value between 0 and 1 and reaches the maximum value when node i is located within all linking geodesics. From a sociometrical perspective, Freeman (1977, p 35) defines betweenness centrality as “the degree to which a point falls on the shortest path between others and therefore has a potential for control of communication”.
Straightness centrality, CS: Based on the concept that efficient communication between two nodes i and j comes from the inverse of the shortest link length dij. The equation can be defined as:
where is the Euclidean distance between nodes i and j along a straight line. This index measures the extent to which the connecting link between nodes i and j deviates from the virtual straight link.
Information centrality, CI: measures the relative drop in the network efficiency when the i node is removed from G of the edge’s incidence in i:
where the efficiency of a graph G is formulated by:
where G’ is the graph with N nodes and K - ki edges, which is obtained by removing from the graph, G, the edges incident in node i. With a specific definition of the information centrality of node i, the formula is:
The index takes a value between 0 and 1; it is correlated to all three types other of centrality, , , and . Also, the value of is affected by the length of the new geodesics when the substitute of the paths is used once the node i is deactivated. For this multiplicity of indices in the MCA approach, Porta et al. (2006a, p 722) stated that “offering a set of multifaceted pictures of reality, rather than just one, MCA leads to more argumentative, thus less assertive, indications for action”
3. Comparing Space Syntax and Multiple Centrality Assessment
The characteristics that identify the two approaches when analysing the spatial network could help to understand these two methods. The aim is not to favour one side and ignore the other, but rather to formalise the singularity for each method. When applied to the study of urban spaces, network analysis is typically based on a primal graph to represent intersections as nodes and streets as edges. In a social system, the distance between two nodes is measured by the reliance on topological steps; however, this contrasts with Space Syntax by adopting a dual graph of street patterns. It considers the street as a node and the intersections between each pair of streets as an edge (Crucitti et al. 2006b). In comparison, the Multiple Centrality Assessment (MCA) represents another significant approach by providing a number of centrality types that differ from the Space Syntax. In particular, it is based on the primal street graph, adopts the metric framework, and works with a plurality of centrality indices. These indices, however, work collectively to comprise an extended knowledge theme, and to understand the hidden orders underlying the structural, spatial network (Porta et al. 2006a).
3.1. Principles
To distinguish the main characteristics of these two approaches (SS and MCA) Crucitti et al. (2006b) summarise four variances of Space Syntax:
- -
- It relies on the concept of the line of sight where the street pattern is turned into an axial map.
- -
- The axial map is formulated as a dual graph to become what is called a connectivity graph. This connectivity graph expresses the streets as nodes (N) and intersections as edges or links (K).
- -
- The Space Syntax methodology (regarding the index of integration) is based on the analytical key of spatial organisation. The primary equation of integration can be formulated as:
- -
- The integration index, however, will be represented in a coloured graph where each single coloured line is a value of integration. Theoretically and practically, Space Syntax deals with the dual approach; this differs from a network exemplification, which is a geographic system and primal process. Therefore, integration illustrates the value of lines in terms of their relative positions within the global spatial network by depending on the number of mediated steps with others.
In comparison, Porta et al. (2006a) and Crucitti et al. (2006b) determine three fundamental principles of Multiple Centrality Assessment; (1) it is a primal graph representing the spatial network, (2) it deals with metric distance, and (3) it adopts a number of centrality indices. The criteria to derive centrality are based on four steps:
- -
- The street pattern creates the primal graph where the intersections are represented as nodes, and the streets serve as edges or links. The edges reflect the metric distance of real streets. Each street length responds to the single edge in the primal graph, where the metric dimension of the street network is analysed both topologically and geographically.
- -
- A node in the primal graph is subject to four types of centrality, namely: closeness CC, betweenness CB, straightness CS and information CI.
- -
- The analytical values are coded and coloured in the primal graph to weight the centrality of each node.
- -
- Calculating the average of their paired nodes computerises the centrality of the edges. The importance of the end-nodes for every single edge is represented in the axial graph where each edge has its colour and code.
3.2. Structural Generational Model
The process of generating a dual graph completely differs from a primal graph. In the Space Syntax approach, the central principle in producing an axial map is based on the continuity of the street space as a linear object. In this respect, Hillier et al. (1984, p 92 - 99) state that the axial map is, “the least set of such straight lines which passes through each convex space and makes all axial links”. They explained that the mechanism to generate this entails, “first finding the longest straight line that can be drawn …, then the second longest, and so on until all convex spaces are crossed, and all axial lines that can be linked to other axial lines without repetition are so linked”. The procedural formation of the axial map in Space Syntax has recently become varied, as each scholar has adopted a different methodology to create an axial map. For example, Peponis et al. (1998) examined three different methods, while Batty et al. (2002) studied nine methodologies to generate an axial map. In comparison, other researchers relied on the names of streets, “to perceive a street network, we need to merge individual segments into meaningful streets, just as we merge individual pixels into meaningful objects … and this is the so-called named streets approach” (Jiang 2007, p 647, 648). Moreover, another approach is continuous and street-based, “to merge adjacent street segments to form meaningful streets” (Jiang 2007, p 648). Thomson (2004) develops a different way to generalise the axial map, “the use of smoothly continuous road centre-line segments –which are here termed strokes …if a road network is observed as the diagram of a planar graph, with junctions and dead ends representing nodes and the corresponding connective road segments representing arcs, then a stroke is a set of one or more arcs in a non-branching, connected chain” (Figure 7).
According to Porta et al. (2006a), the critical issue with a name-based street is that the street is defined as a nominal element in a spatial network. However, street name databases are not always available and are not always significant or credible in terms of their status and scale. Also, the process of involving and updating street names within a geographical information system (GIS) could be costly on a large scale and involve massive datasets. Porta et al. (2006a) worked on the Intersection Continuity Negotiation (ICN). The ICN employs three steps to generate a dual axial map: firstly, nodes are examined in turn, where the continuity of a street is negotiated among all pairs of incident links. The two-links shape the central convex angle, and the highest continuity is designated, then the other two links with the second most abundant convex angles are allocated the second largest continuity and are merged. The central principle of ICN is good continuation. Therefore, discontinuity in the linearity of the street was neglected. Secondly, a street is allocated to the link and pertinent intersections, and adjacent links are merged as per the first step. Thirdly, the dual graph is created and overlapping double links in the dual maps are excluded (Porta et al. 2006a).
According to Porta et al. (2006a), from the MCA perspective, the street networks and their intersections can be defined by spatial graphs in which one-dimensional geographic elements (in this case streets) are turned into one-dimensional graph elements (links or edges). This kind of graphic expression is termed as primal or direct, where the graph and real network system appear to be analogous. In territorial studies, the network analysis frequently adopts a primal approach where the distance is not only subject to topological terms (steps), such as what has been followed by the social system analysis, but also to spatial terms (metres) within an urban street system.
3.3. Topological, Geometrical and Metric Representation
The notion of distance became the milestone and breakthrough for both the Space Syntax and the Multiple Centrality Assessment. The former deals with the length of the street as a topological value where there is no consideration of the real value of the metrical dimension; in this method, the street is represented as a node in a dual graph. The second adopts the metric distance of street dimensions by formulating the primary algorithm of a spatial network analysis. Ratti (2004) refers to a number of critical points and, significantly, he inserted the main headings to highlight the Space Syntax approach. The criticism of Space Syntax, however, can be found through the topological rather than the geometrical system. Thus, Space Syntax deals with topological depth, but not metric distance, as the primary representation for an axial graph. Furthermore, Space Syntax deals with two-dimensional movement regardless of the three-dimensional perspective of street edges that are constituted by buildings.
Hillier et al. (2004) argue that linking metric and topological data in the configurational model of an area is a key issue. Adopting segment lengths in the topological measures of an axial graph leads to an integration pattern. Therefore, the configurational analysis will focus on the geometric centre of the selected area and exhibit decreasing integration from the centre to the boundary. Distance plays a key role in familiarising the space and how individuals perceive and conceive it. This idea is not bounded to readings of the space, but also how it interacts with people (Hall 1959); (Gehl 2010a). Porta et al. (2006a, p 715) argue that, “… structural terms of metric distance has been recognized as the key feature of road network, which, exactly because of this fact, need to be dealt with as a new, specific family of networks”. MCA primarily adopts a metric distance that is located between two paired intersections of the street centreline (Dalton et al. 2003); (Turner 2007). This mechanism is employed to form the primal system, where the spatial network can be characterised analogously within the real network, and where streets are represented as links or edges and intersections become nodes (Porta et al. 2006a) (Figure 8).
3.4. Edge Effect in Spatial Network Analysis
In considering Space Syntax, Ratti (2004) argues that the edge governs the value of integration. He states that the edge has a significant impact on the Space Syntax results, and on the different product weight values for every single line within the spatial network (Ratti 2004). Hillier et al. (2004) argue that the main aim of axial analysis is not to model the absolute ranges of movement in an urban space but to form the distribution rates of flux within constituent spaces. Also, Hillier et al. (2004, p 505) suggest that, “to ascertain average levels in an area as a whole would require, of course, knowledge of other variables …” (Figure 9 and Figure 10). The edge effect, however, is not limited to Space Syntax so long as the system is a series of interconnected networks where each single link has its value by depending on the other links.
Porta et al. (2006a) argued the influence of the border and the extent that the centrality indices could be affected by the boundary of the spatial network regarding its amplitude and narrowness. Throughout their seminal works, they found that the urban context with the highest quantity of street networks tends to respond to the border effect. To proactively reduce the edge (border) effect on the centrality value, Porta et al. (2006a) considered continuous routes across the urban context by performing a ‘before’ instead of a ‘consequent’ centrality analysis. The mechanism belonged to the algorithm employed in the structural generational model of spatial analysis rather than the principles of centrality. Porta et al. (2006a) stated that, in terms of the edge effect, neither Integration (Space Syntax) nor Closeness Centrality (MCA) are affected by the hidden structure of the urban fabric. Instead, they are of a deep-stead nature, in that they do not give any eligible depiction of urban routes nor focal regions, with the exception of where the generalisation process is based on a defragmented system. Alternatively, the boundary of a case study is extended to cover a specific area in order to create a buffer zone and reduce the border effect.
Moreover, Porta et al. (2006a) refer to two options to deal with the edge (border) effect. The first adopts a dual-generalised model, including the Space Syntax approach, the named-street approach, and the intersection continuity negotiation approach. Moreover, all methods are based on a visibility analysis, and an identified street. The second espouses a primal approach, through reestablishing the entities of a spatial network by employing metric distances. This means that a centreline between two intersections of a street is invested metrically in a graph. According to Porta et al. (2006a), this last option would effectively contribute to the delivery of an exceptional characterisation of streets in an advanced process to allow for easy and consistent access to available data resources. Another step involved the edge (border) effect, which might be addressed within the closeness centrality CC when using a local scale.
3.5. Two-Dimensional Representation in Spatial Network Analysis
Based on widespread agreement between different fields of knowledge, Spatial Network Analysis primarily deals with network systems, although it is not limited to the world wide web or the Internet, biological, social, and infrastructure networks, biochemical networks and citation networks. Two axiom elements represent all these types of network; a set of nodes or vertices are joined in pairs by lines or edges. Moreover, this network system is, in fact, practically planar, where it is possible to draw on a map as a two-dimensional form (Gastner et al. 2006). Both approaches (SS and MCA) use planarity in building a two-dimensional form, namely the dual graph and primal graph respectively (Figure 11).
Ratti (2004) discusses the central role of Space Syntax in studying urban structure. Space Syntax mainly focuses on two dimensions in representing the urban context, namely the height of buildings and the property of streets. In comparison, Hillier et al. (2004) explain that subjecting spatial configuration analysis to other variables could lead to disorganised values. However, three-dimensional urban elements, such as building heights and other metric variables, such as street length and width, are addressed within a study of, for instance, pedestrian and vehicular flow. The level and the scope of an urban study is a crucial requirement in determining the nature of variables, their weights and the type of correlation examined. The shift from regional scale to macro, meso and then micro level, requires the adoption of different variables that must be reasonably comprehensible. Neglecting other considerations and aspects in an urban environment can automatically affect the quality and value of results at any level. Thus, there is a difficulty in adopting two dimensions for the broad scope of an urban context.
3.6. Urban Form Elements and Land Use
Land use is another consideration for Space Syntax and Multiple Centrality Assessment. Neither approach directly refers to the pattern of land use; instead, they are more attentive to spatial configurations within the urban context. Hillier et al. (2004) argue that any theoretical understanding beyond the separation of spatial analysis and land use is that space syntax deals with land use as a dependent variable. Thus, when spatial configuration affects movement, land use can be influenced as an expected result. Nevertheless, Space Syntax has a significant place in seeking a correlation between the topological accessibility of a street network and other urban phenomena, like movement flux, human wayfinding, retail commercial, the distribution of activity patterns, and other influences related to pollution (Porta et al. 2006a). Hillier et al. (2004) state that, recently, a considerable number of studies demonstrate that changes in land use patterns shift live centres from the traditional central area of a city towards its edges. Therefore, according to Hillier et al. (2004, p 507), “space syntax in that sense offers a diagnostic of urban areas, and this is indeed one of its primary functions on live projects … is ideal for use in innovative design … to uncover theoretical principles of how cities work spatially, it is not tied to simple copying of existing urban phenotypes”. Porta et al. (2006a) denote that the primal approach of MCA is not the end of the evaluation of urban patterns, but rather the construction of a correlation between the centralities and dynamics of the network concerning land use, social interaction, the vitality of markets, and pedestrian and vehicular flows. Centrality captures the essence of a location’s advantage in an urban area, and its values should be reflected in the intensity of land uses (Porta et al. 2009).
4. Conclusion
A spatial network is one of the principal urban components. It governs different types of movement and its role is to manage various flux and shape human behaviour. Streets with adjacent buildings help to formulate the identity of a city; they work to connect urban elements to each other in a distinct pattern. Therefore, a considerable number of studies address the key characteristics of a street network, and these studies tend to benefit from graph theory. This theory analyses two significant features, lines and nodes. Two primary elements operate together to form the entire network street system: the street and intersection. These have a reciprocal relationship that maps the distribution of the movement stream. However, graph theory is not restricted to urban studies; instead, many different disciplines adopt this approach, including, although not limited to, sociology, biology, technology, planning studies, and urban studies. The mechanism for representing both line and node is varied. Therefore, several generating models are used to compute the relationship value between nodes and lines. Urban studies consider two substantial approaches that significantly help to enrich the urban field regarding the analysis of the street system’s spatial network, which are Space Syntax (SS) and Multiple Centrality Assessment (MCA). Understanding these two methods was necessary in order to apply each individually. The Multiple Centrality Assessment can be defined as a multimetric approach as it employs a network map that depends on metric distance rather than visual steps, like Space Syntax, or continued street, as in other approaches. In MCA, each street is represented by a link, at the end of which are a pair of nodes.
Acknowledgements
I would like to express my gratitude to my supervisor, Professor Sergio Porta, for his thoughtful guidance. Urban Design and Director of UDSU - Urban Design Studies Unit, Department of Architecture, University of Strathclyde, sergio.porta@strath.ac.uk
References
- Al-Saaidy, H. J. E. (2019). Measuring urban form and urban life: four case studies in Baghdad, Iraq. Architecture. United Kingdom, University of Strathclyde, Department of Architecture, United Kingdom UK. Doctor of Philosophy.
- Al-Saaidy, H. J. E. and D. Alobaydi (2021b). "Studying street centrality and human density in different urban forms in Baghdad, Iraq." Ain Shams Engineering Journal 12(1): 1111-1121. [CrossRef]
- Alobaydi, D. and M. Rashid (2015). Evolving Syntactic Structures of Baghdad - Introducing 'transect' as a way to study morphological evolution. The 10th Space Syntax Symposium (SSS10) from 13 to 17 July 2015, University College London, Bloomsbury, London, UK.
- Batty, M. (2004). "A new theory of space syntax." Centre for Advanced Spatial Analysis, University College London, 1-19 Torrington Place, London WC1E 6BT, UK.
- Batty, M. and S. Rana (2002). "Reformulating space syntax: the automatic definition and generation of axial lines and axial maps." Centre for Advanced Spatial Analysis Working Paper 58.
- Bavelas, A. (1948) A mathematical model for group structures. Human organization 7, 16-30. 7. [CrossRef]
- Bavelas, A. (1950). "Communication patterns in task-oriented groups." The Journal of the Acoustical Society of America 22(6): 725-730.
- Bavelas, A. and D. Barrett (1951). An experimental approach to organizational communication, American Management Association.
- Borgatti, S. P., A. Mehra, et al. (2009). "Network analysis in the social sciences." science 323(5916): 892-895.
- Cardillo, A., S. Scellato, et al. (2006). "Structural properties of planar graphs of urban street patterns." Physical Review E 73(6): 066107.
- Cohn, B. S. and M. Marriott (1958). "Networks and centres of integration in India civilization." Journal of Social Research 1: 1-9.
- Crucitti, P., V. Latora, et al. (2006a). "Centrality measures in spatial networks of urban streets." Physical Review E 73(3): 036125,.
- Crucitti, P., V. Latora, et al. (2006b). "Centrality in networks of urban streets." Chaos: an interdisciplinary journal of nonlinear science 16(1): 015113.
- Dalton, N., J. Peponis, et al. (2003). "To tame a TIGER one has to know its nature: extending weighted angular integration analysis to the descriptionof GIS road-centerline data for large scale urban analysis.".
- Freeman, L. C. (1977) A set of measures of centrality based on betweenness. Sociometry 35-41. [CrossRef]
- Freeman, L. C. (1979) Centrality in social networks conceptual clarification. Social networks 1, 215-239, 1. [CrossRef]
- Garau, C., A. Annunziata, et al. (2020). "A walkability assessment tool coupling multi-criteria analysis and space syntax: The case study of Iglesias, Italy." European Planning Studies: 1-23.
- Gastner, M. T. and M. E. Newman (2006). "The spatial structure of networks." The European Physical Journal B-Condensed Matter and Complex Systems 49(2): 247-252.
- Gehl, J. (2010a). Cities for people, Washington : Island Press.
- Hall, E. T. (1959). The silent language, Doubleday, New York, USA.
- Hillier, B. (1999b). "The hidden geometry of deformed grids: or, why space syntax works, when it looks as though it shouldn't." Environment and Planning B: Planning and Design 26: 169-191.
- Hillier, B. and J. Hanson (1984). The social logic of space, Cambridge Cambridgeshire ; New York : Cambridge University Press. [CrossRef]
- Hillier, B., J. Hanson, et al. (1987). "Ideas are in things: an application of the space syntax method to discovering house genotypes." 14(4).
- Hillier, B., A. Leaman, et al. (1976). "Space syntax." Environment and Planning B: Planning and Design 3(2): 147-185.
- Hillier, B. and A. Penn (2004). "Rejoinder to carlo ratti." Environment and Planning B: Planning and Design 31(4): 501-511.
- Hillier, B., A. Penn, et al. (1993a). "Natural movement-or, configuration and attraction in urban pedestrian movement." Environment and Planning B-Planning & Design 20(1): 29-66.
- Jiang, B. (2007). "A topological pattern of urban street networks: universality and peculiarity." Physica A: Statistical Mechanics and its Applications 384(2): 647-655.
- Leavitt, H., J (1951). "Some effects of communication patterns on group performance." The Journal of Abnormal and Social Psychology 46: 38-50.
- Leavitt, H. J. (1949). Some effects of certain communication patterns on group performance. Cambridge, Cambridge, MA: Massachusetts Institute of Technology. PhD dissertation.
- Lin, G., X. Chen, et al. (2018). "The location of retail stores and street centrality in Guangzhou, China." Applied geography 100: 12-20.
- Nystuen, J. D. and M. F. Dacey (1961). "A graph theory interpretation of nodal regions." Papers in Regional Science 7(1): 29-42.
- Pafka, E., K. Dovey, et al. (2020). "Limits of space syntax for urban design: Axiality, scale and sinuosity." Environment and Planning B: Urban Analytics and City Science 47(3): 508-522.
- Peponis, J., J. Wineman, et al. (1998). "On the generation of linear representations of spatial configuration." Environment and Planning B: Planning and Design 25(4): 559-576.
- Pitts, F. R. (1965). "A graph theoretic approach to historical geography." The professional geographer 17(5): 15-20.
- Porta, S., P. Crucitti, et al. (2006a). "The network analysis of urban streets: A primal approach." Environment and Planning B Planning and Design 33(5): 705-725. [CrossRef]
- Porta, S., P. Crucitti, et al. (2006b). "The network analysis of urban streets: A dual approach." Physica A: Statistical Mechanics and its Applications 369(2): 853-866. [CrossRef]
- Porta, S., S., et al. (2009). "Street centrality and densities of retail and services in Bologna, Italy." Environment and Planning B: Planning and Design 36(3): 450-465. [CrossRef]
- Ratti, C. (2004). "Urban texture and space syntax: some inconsistencies." Environment and Planning B: Planning and Design 31(4): 487-499.
- Remali, A. M. (2014). Capturing the essence of the capital city : urban form and urban life in the city centre of Tripoli, Libya. Department of, Architecture, University of Strathclyde.
- Rogers, A. V., Steven (1995). The urban context : ethnicity, social networks, and situational analysis, Oxford England ; Washington, D.C. : Berg Publishers.
- Smith, S. L. (1950). "Communication pattern and the adaptability of task-oriented groups: an experimental study." Group Networks Laboratory, Research Laboratory of Electronics, Massachusetts Institute of Technology, Cambridge.
- Thomson, R. C. (2004). Bending the axial line: Smoothly continuous road centre-line segments as. Proceedings 4th International Space Syntax Symposium, London, UK.
- Turner, A. (2007). "From axial to road-centre lines: a new representation for space syntax and a new model of route choice for transport network analysis." Environment and Planning B: Planning and Design 34(3): 539-555.
- van Nes, A. and C. Yamu (2017). Space Syntax: A method to measure urban space related to social, economic and cognitive factors. The virtual and the real in planning and urban design, Routledge: 136-150.
- van Nes, A. and C. Yamu (2021). Introduction to space syntax in urban studies, Springer Nature.
Figure 1.
Graph of a nodal structure in a region. Source: Nystuen et al. (1961, p 35).
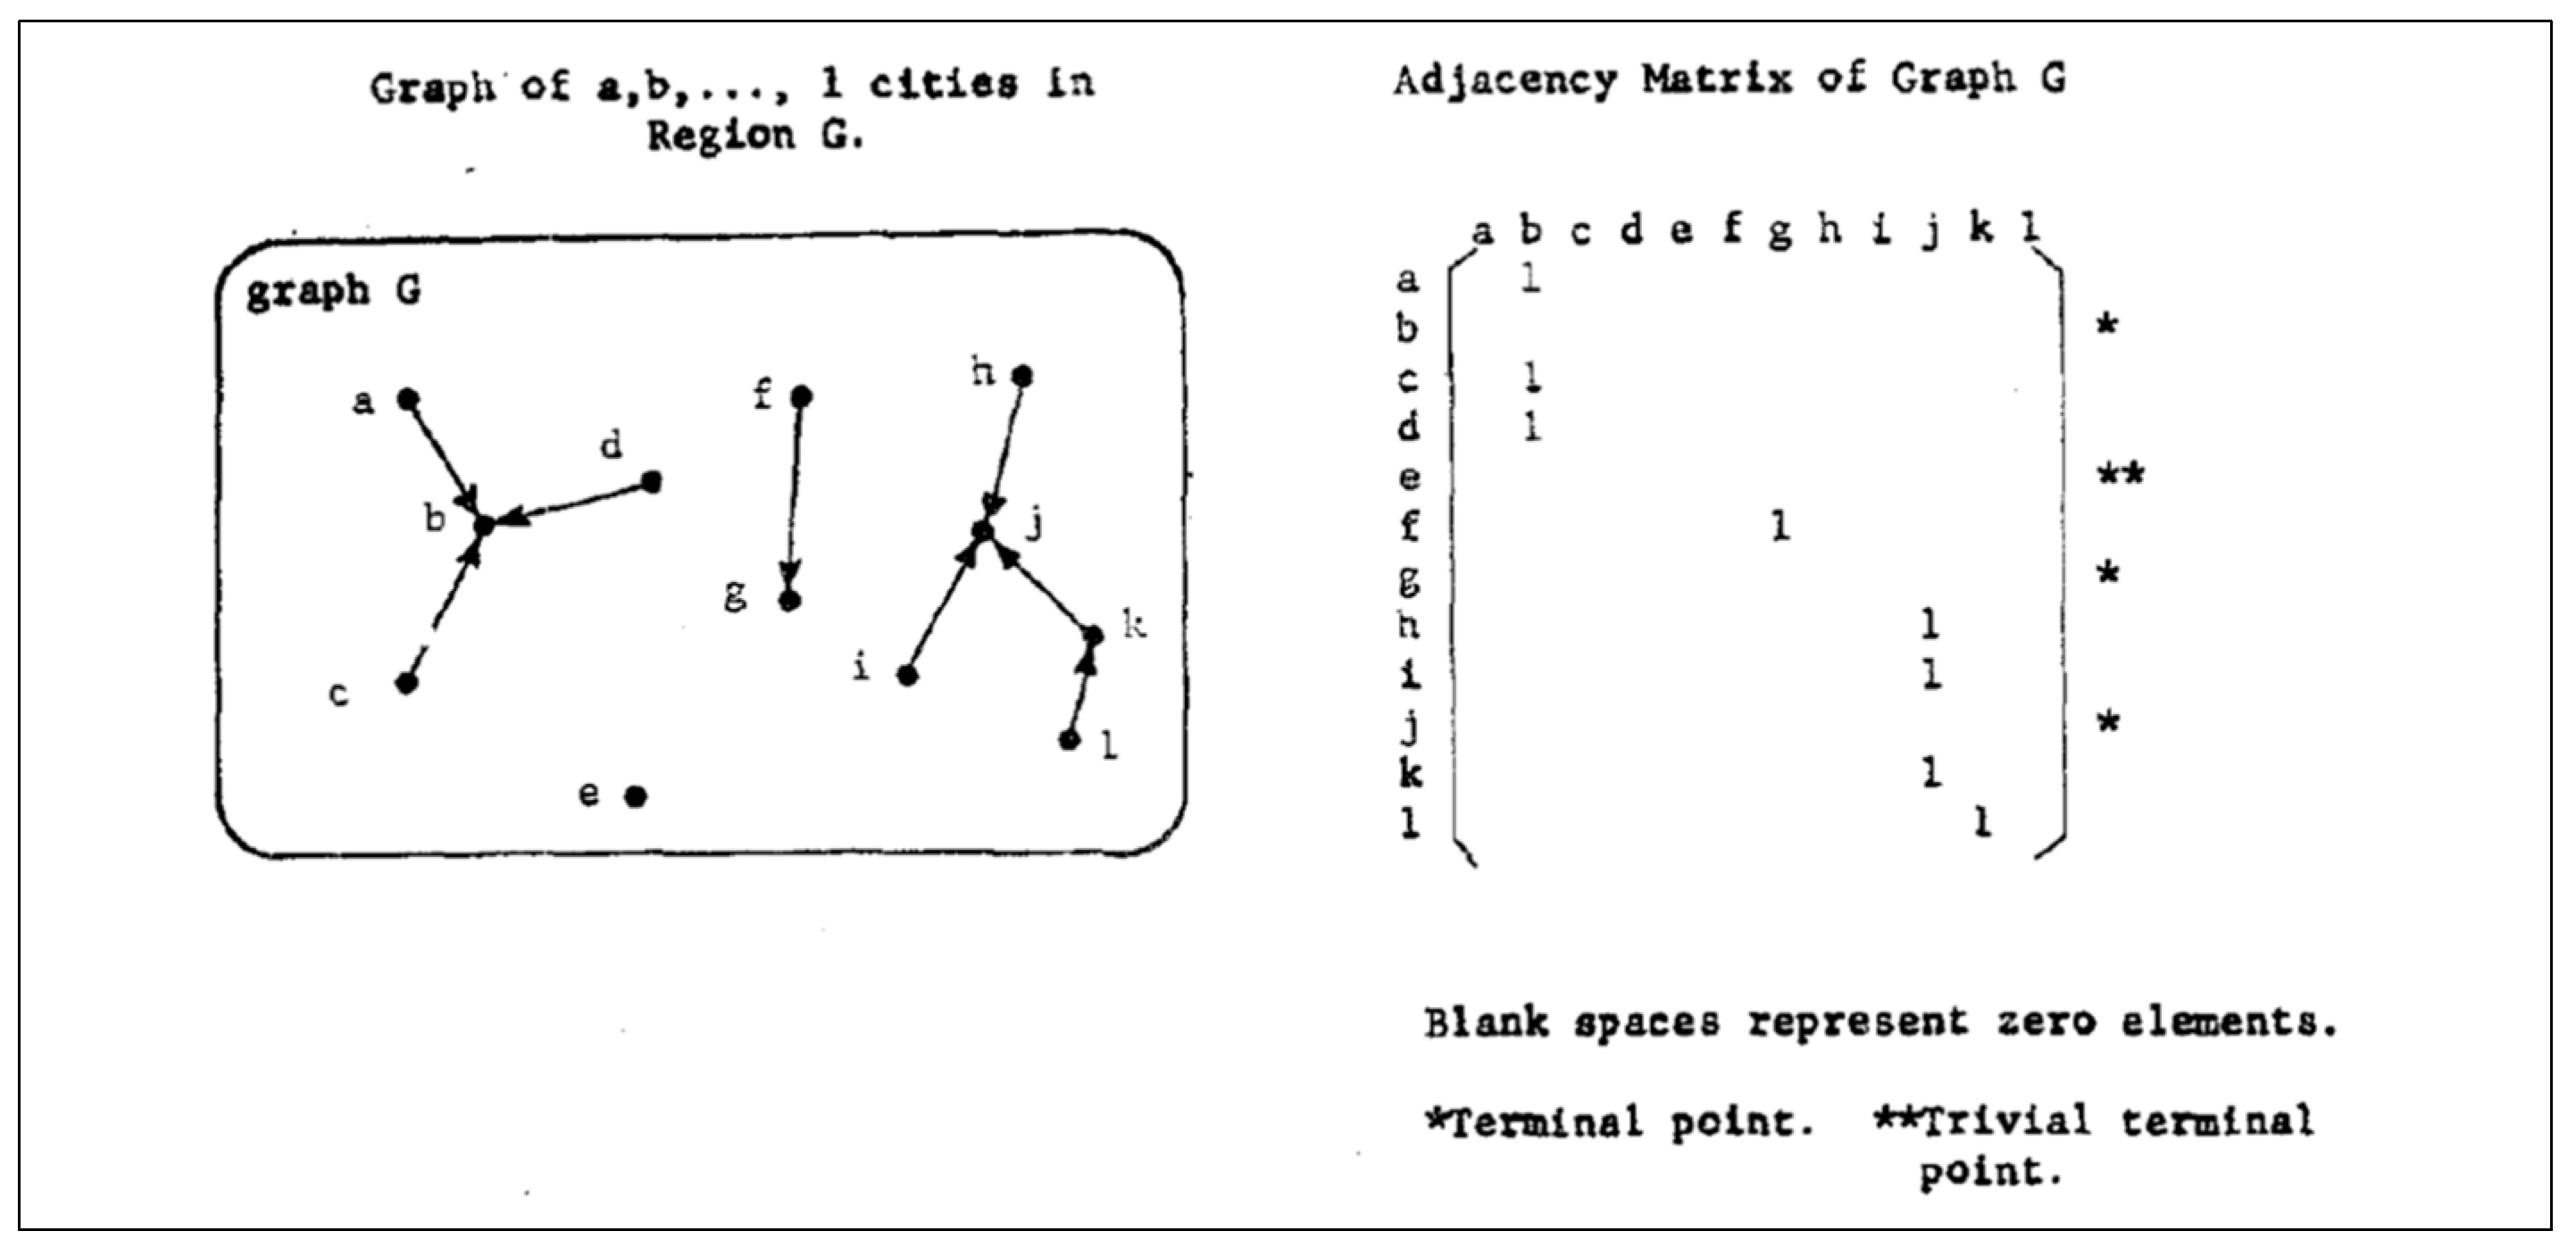
Figure 2.
Graphs of stars or wheels for points (n) = 3, 4, 5, 6, 7. A set of measures of centrality based on betweenness. Source: Freeman (1977, p 38).
Figure 2.
Graphs of stars or wheels for points (n) = 3, 4, 5, 6, 7. A set of measures of centrality based on betweenness. Source: Freeman (1977, p 38).
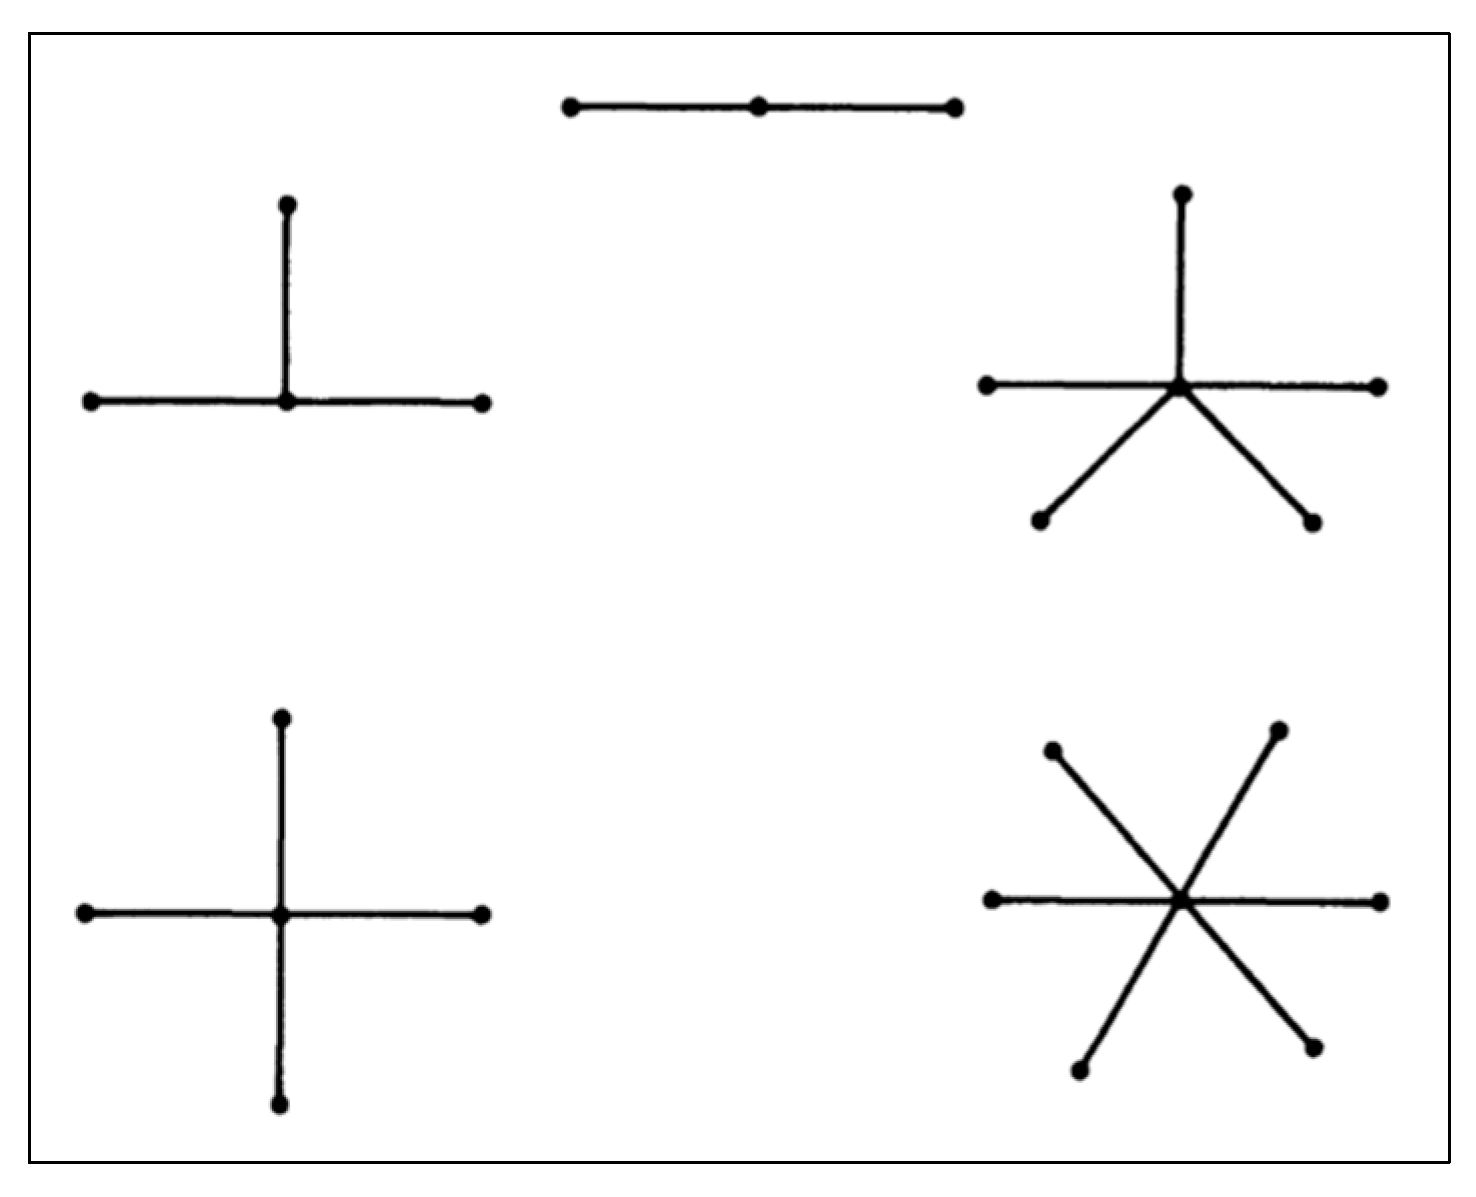
Figure 3.
Four network structures examined by Bavelas and colleagues at MIT. Each node signifies a person; each line denotes a potential channel for interpersonal communication. The most central node in each network is colored red. Source: Borgatti et al. (2009, p 893).
Figure 3.
Four network structures examined by Bavelas and colleagues at MIT. Each node signifies a person; each line denotes a potential channel for interpersonal communication. The most central node in each network is colored red. Source: Borgatti et al. (2009, p 893).
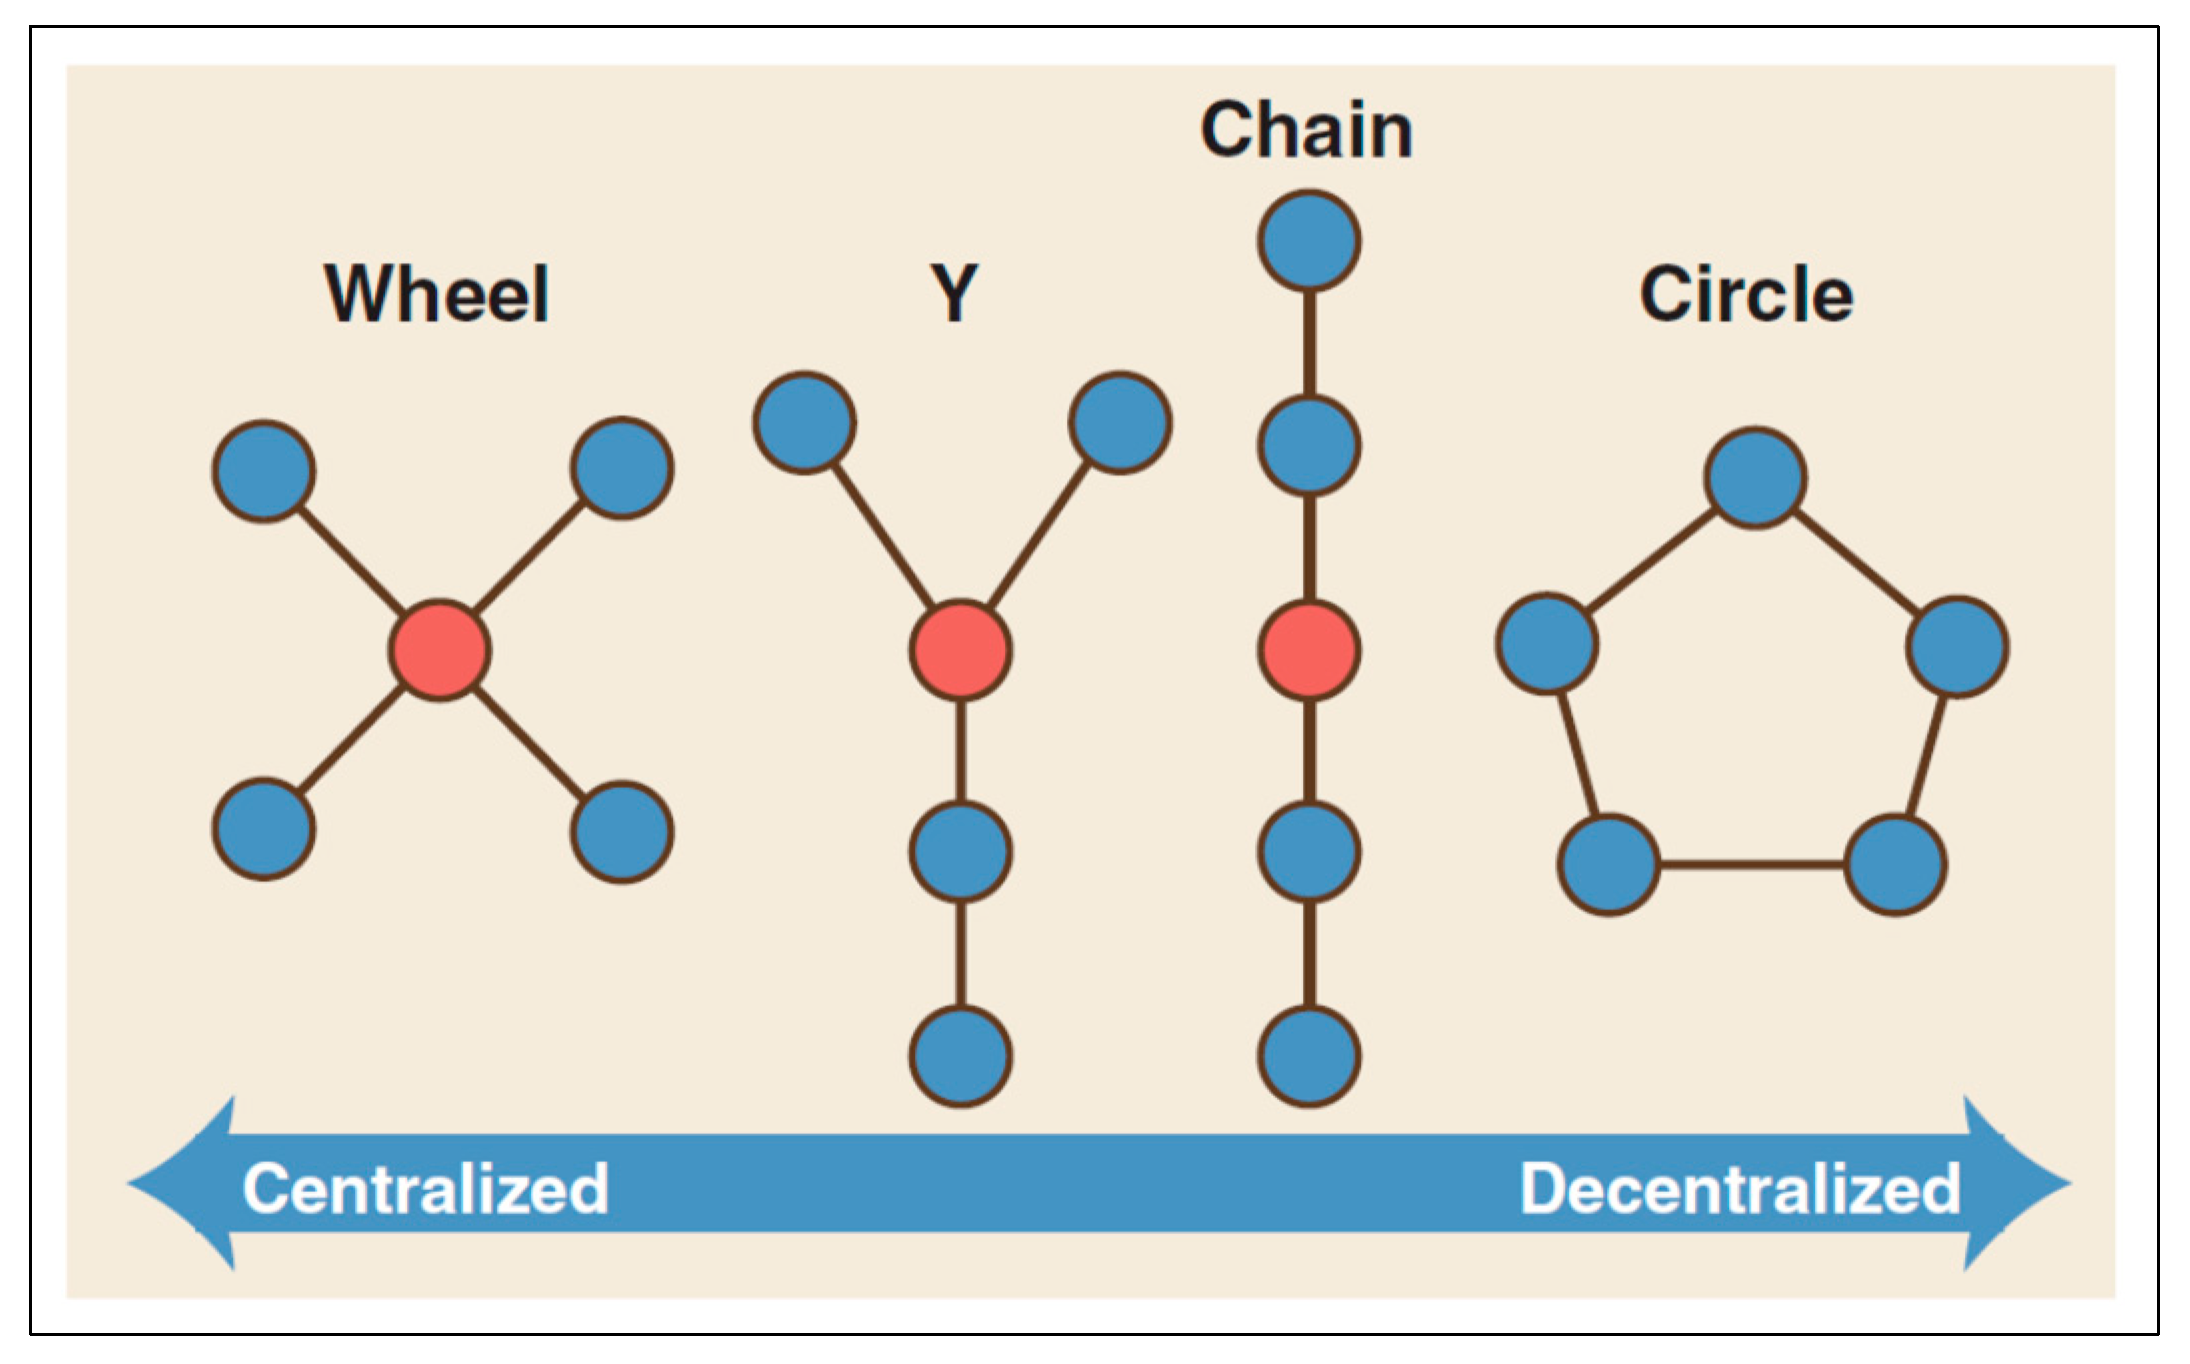
Figure 4.
Conventional Graph-Theoretic Representation of the Street Network. Source: Batty (2004, p 3).
Figure 4.
Conventional Graph-Theoretic Representation of the Street Network. Source: Batty (2004, p 3).
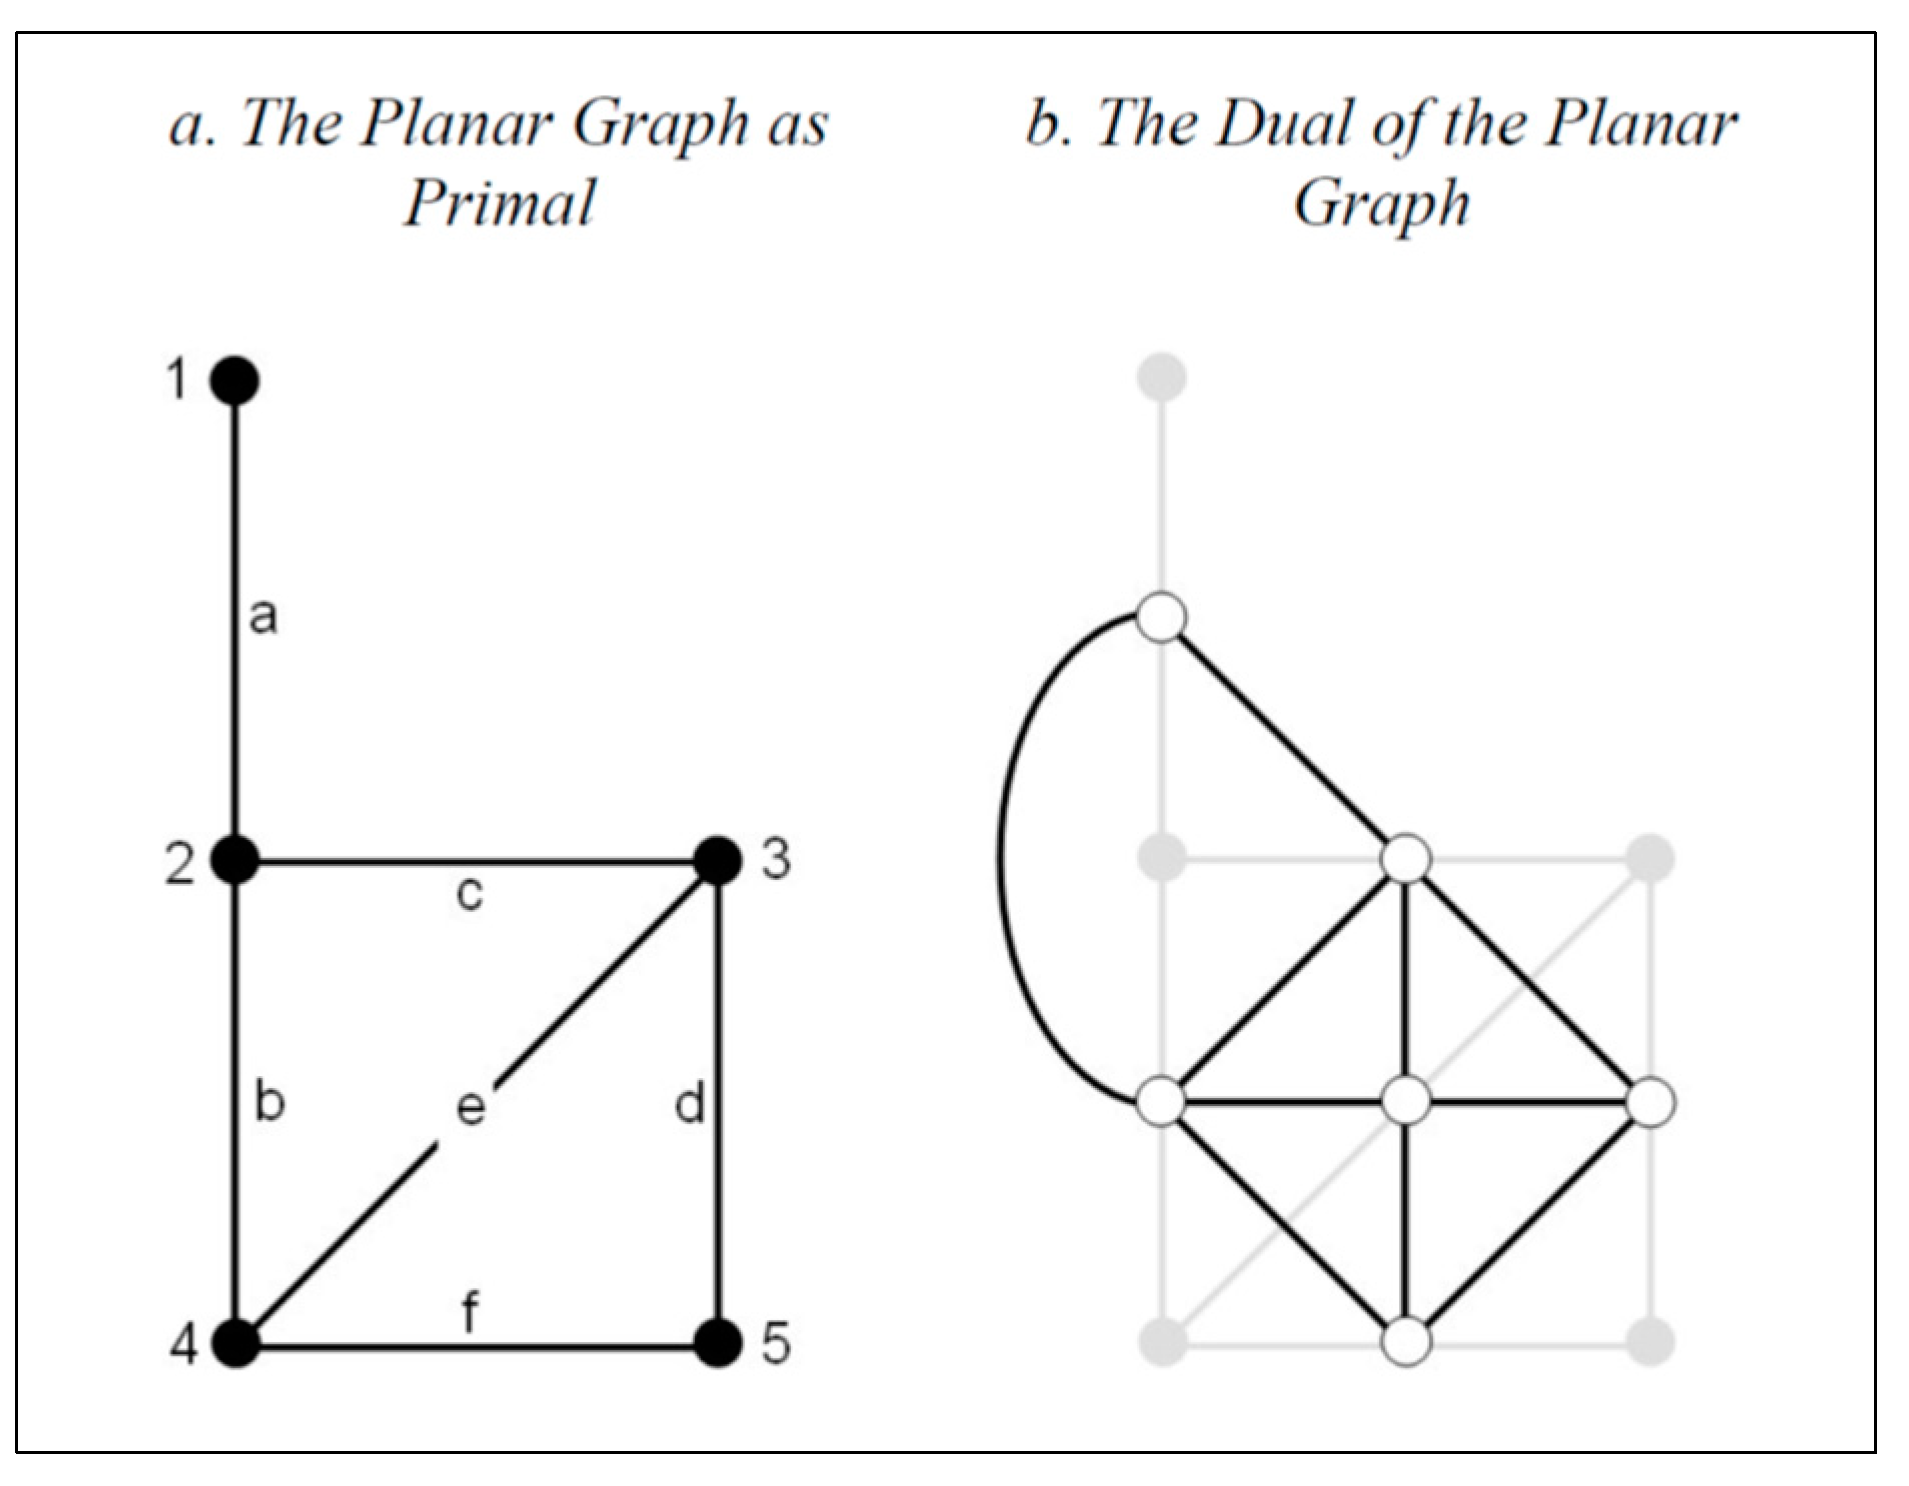
Figure 5.
(a), (b) Two relations of spaces a and b to the outside, space c. (c), (d), the corresponding justified graph. Source: Hillier et al. (1987, p 363).
Figure 5.
(a), (b) Two relations of spaces a and b to the outside, space c. (c), (d), the corresponding justified graph. Source: Hillier et al. (1987, p 363).
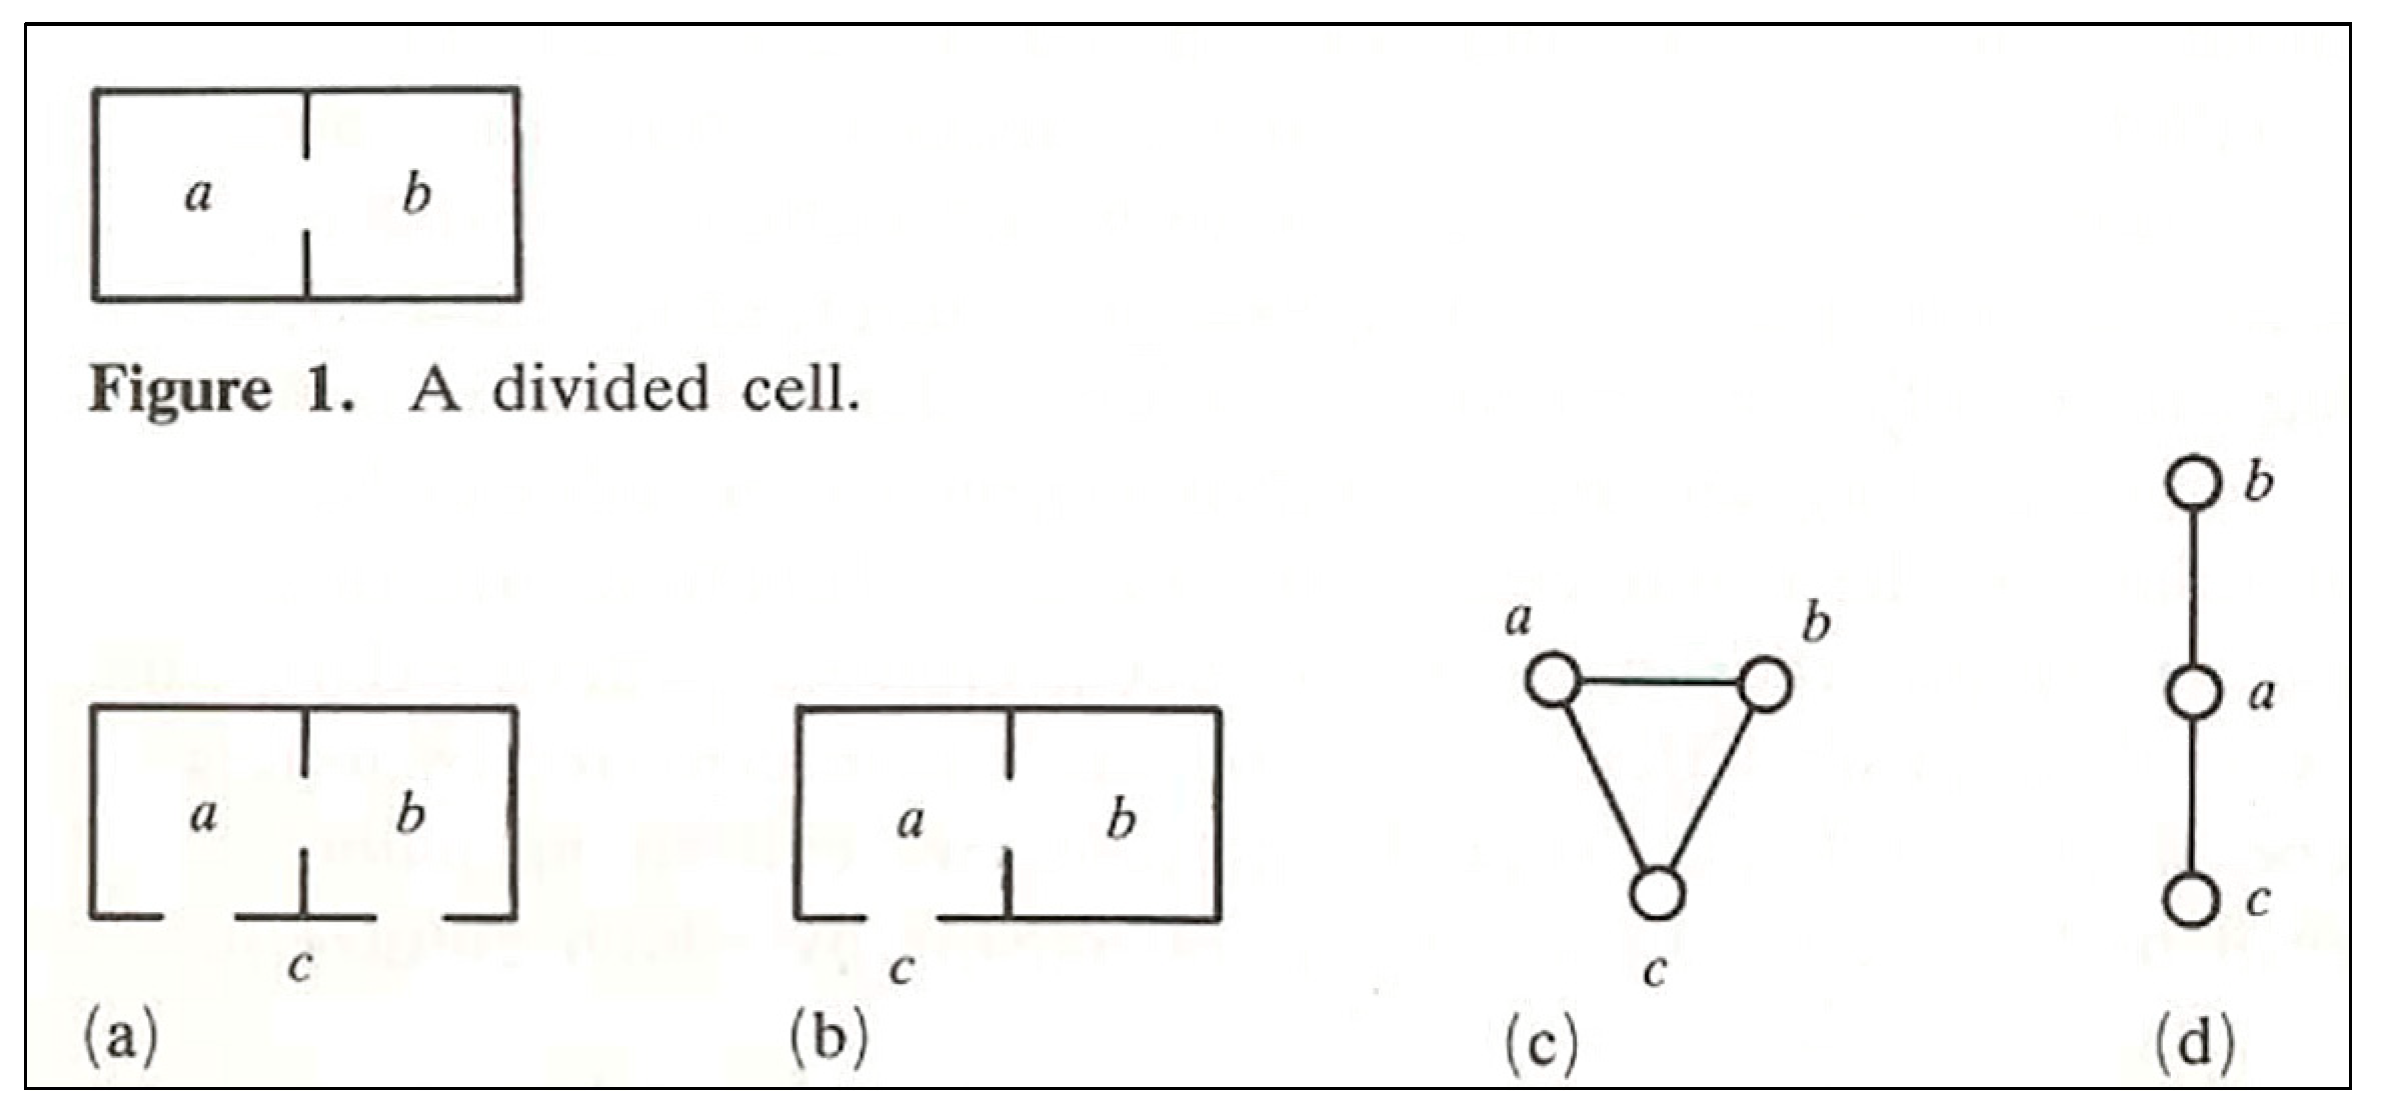
Figure 6.
The case study of King’s Cross. (1) case study boundary; (2) the street and open space pattern; (3) axial map; (4) pattern of integration; (5) observed spaces with number of moving adult per 100m. Source: Hillier et al. (1993a, p 37, 38- 43).
Figure 6.
The case study of King’s Cross. (1) case study boundary; (2) the street and open space pattern; (3) axial map; (4) pattern of integration; (5) observed spaces with number of moving adult per 100m. Source: Hillier et al. (1993a, p 37, 38- 43).
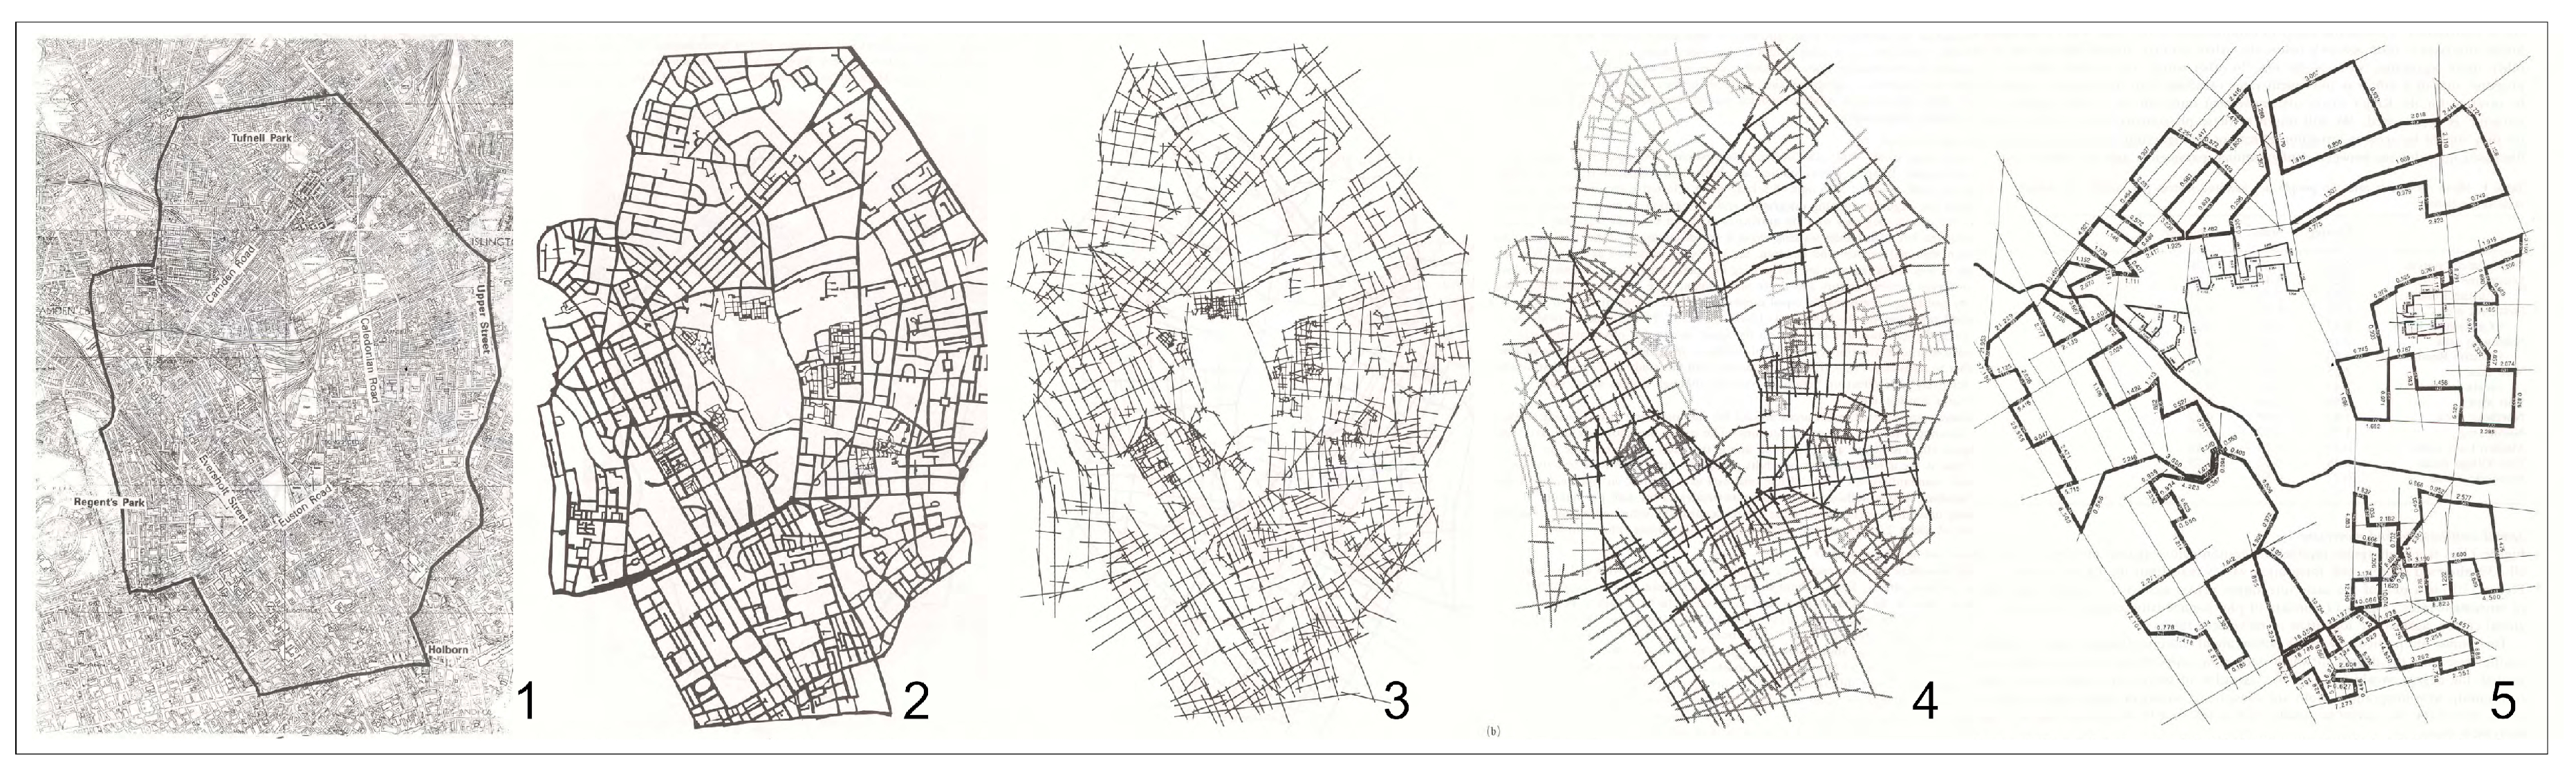
Figure 7.
Multiplicity of methods in generating the structural model of a spatial network. Source: Based on the original figures; (Porta et al. (2006a, p 714); Porta et al. (2006b, p 855).
Figure 7.
Multiplicity of methods in generating the structural model of a spatial network. Source: Based on the original figures; (Porta et al. (2006a, p 714); Porta et al. (2006b, p 855).
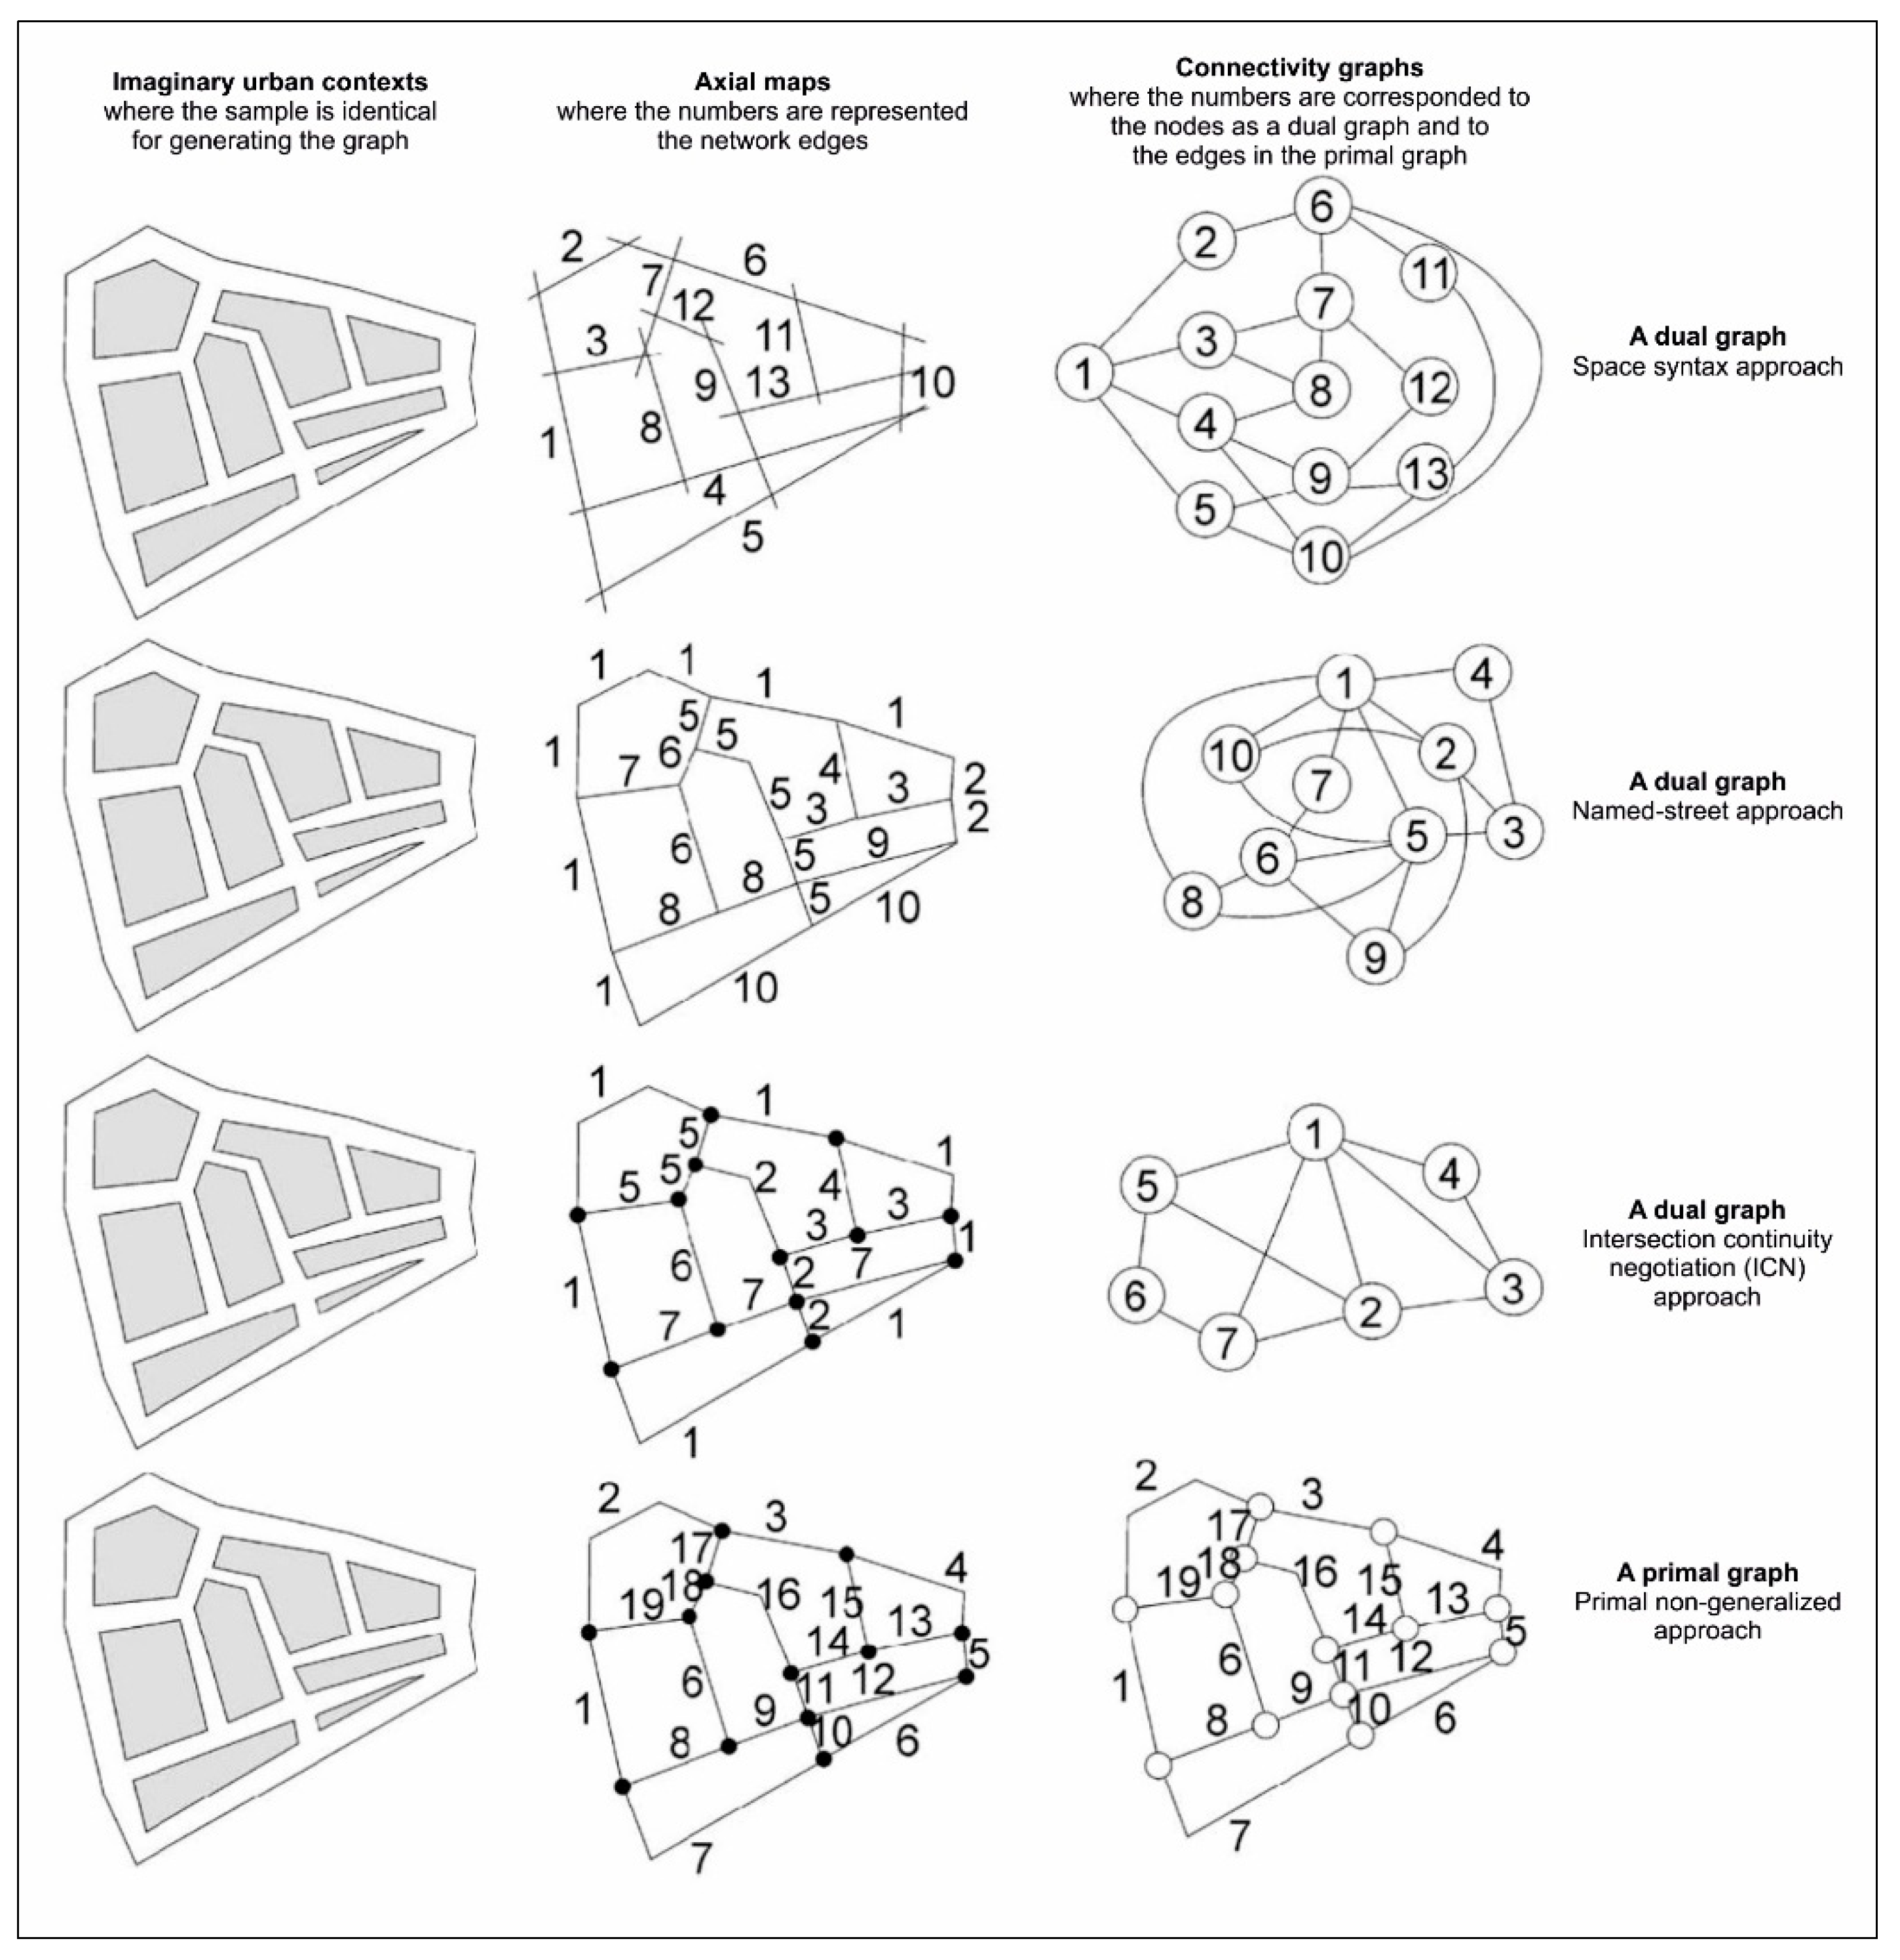
Figure 8.
Panel 1, original maps of four cities; (a) Ahmedabad, (b) Venice, (c) Richmond, CA, and (d) Walnut Creek, CA. Panel 2. primal graph of selected cities based on the MCA approach. Panel 3. dual graph of selected cities based on the Space Syntax approach. Source: (Porta et al. 2006a, p 712).
Figure 8.
Panel 1, original maps of four cities; (a) Ahmedabad, (b) Venice, (c) Richmond, CA, and (d) Walnut Creek, CA. Panel 2. primal graph of selected cities based on the MCA approach. Panel 3. dual graph of selected cities based on the Space Syntax approach. Source: (Porta et al. 2006a, p 712).
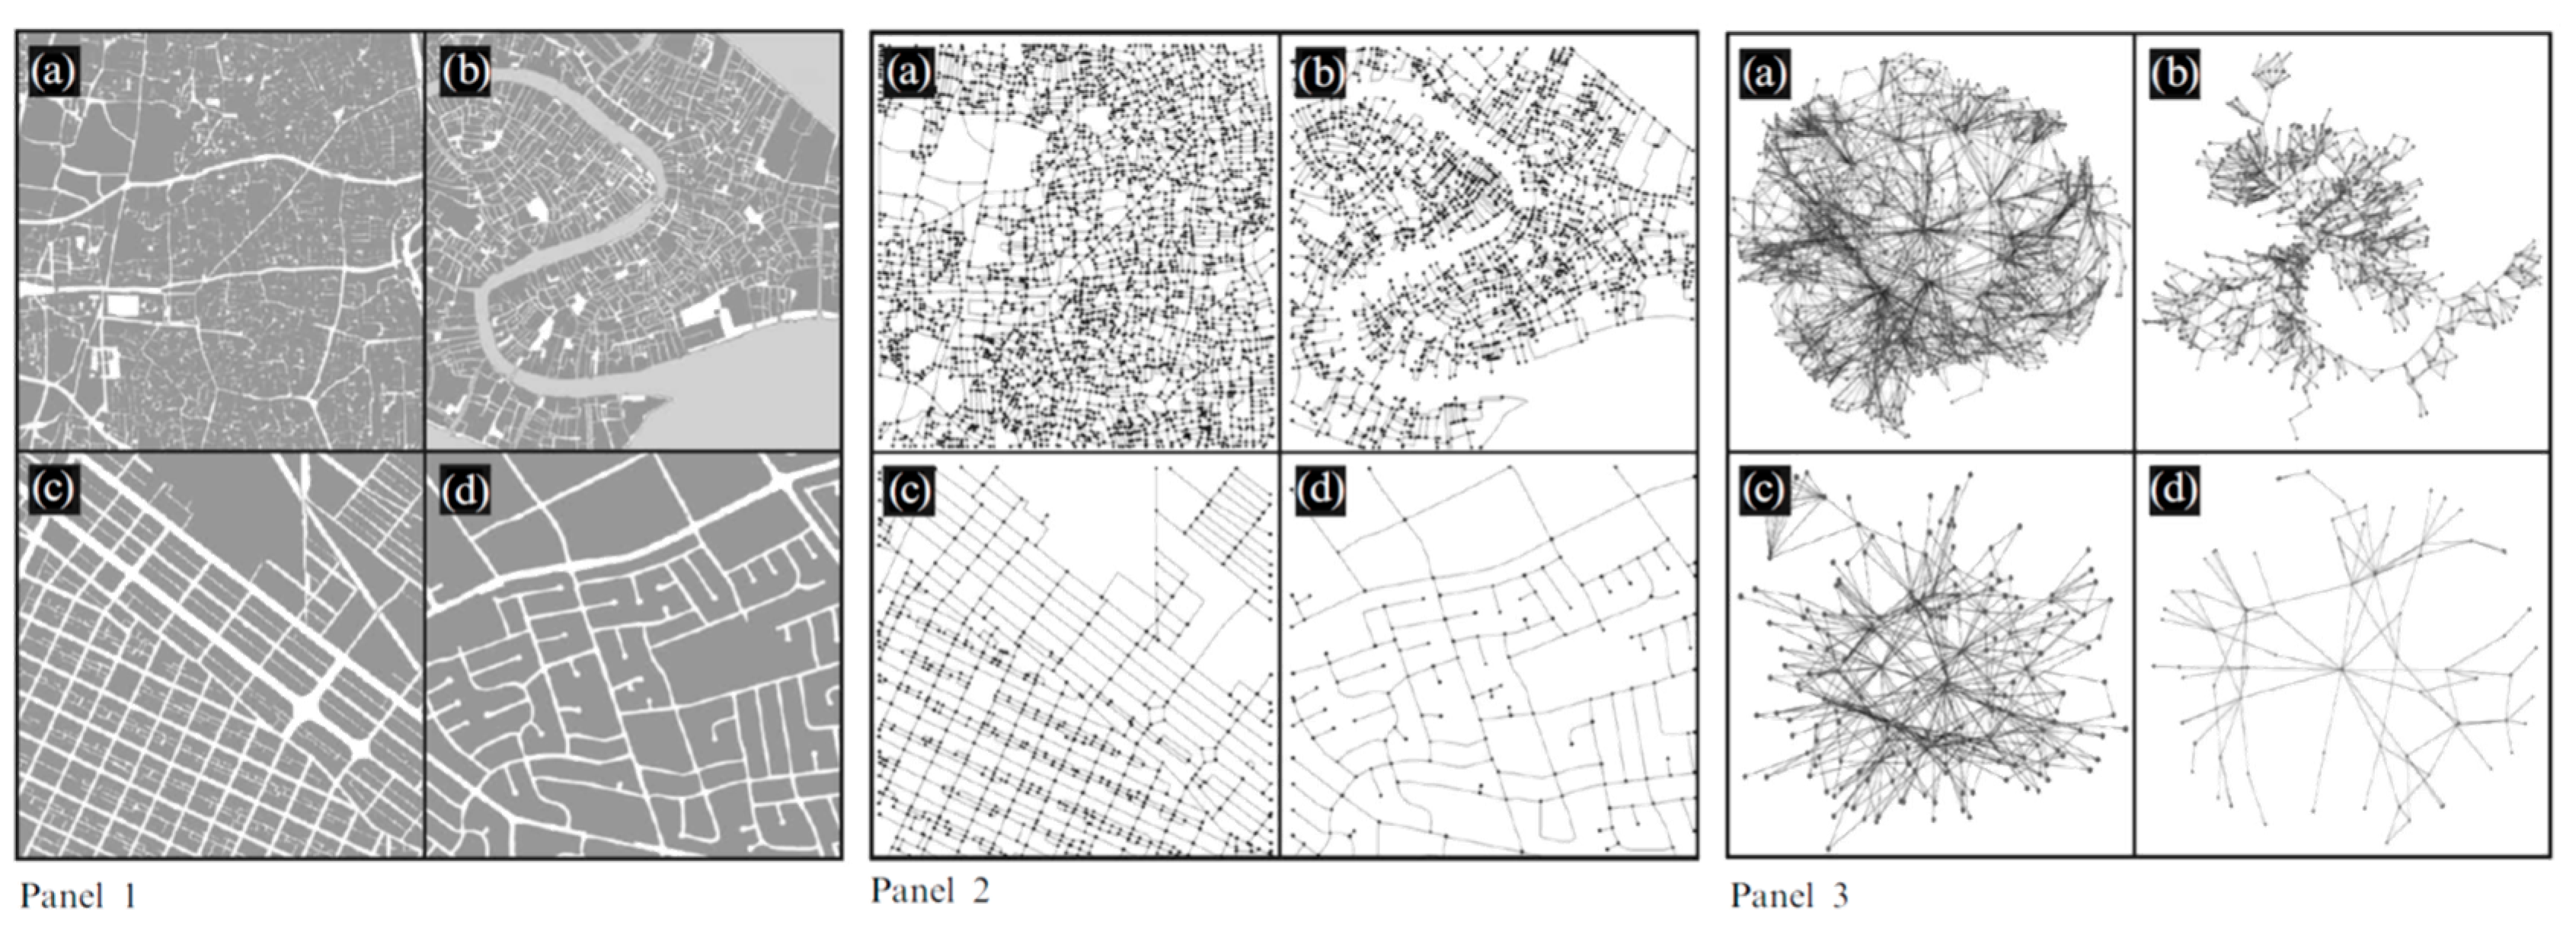
Figure 9.
Left, (a) an orthogonal axial map and (b) a broken or deformed one. Right, global integration values on the two axial maps, they were calculated, where map (a) presents a uniform integration value 3.134, while map (b) varies between 0.919 (corner lines) to 1.930 (central lines). Source: (Ratti 2004, p 8 - 9).

Figure 10.
Global integration in two urban systems, first considered as separate entities and then communicating. The most integrated part is the line connecting the two systems and the adjacent segments. Source: (Ratti 2004, p 11).
Figure 10.
Global integration in two urban systems, first considered as separate entities and then communicating. The most integrated part is the line connecting the two systems and the adjacent segments. Source: (Ratti 2004, p 11).
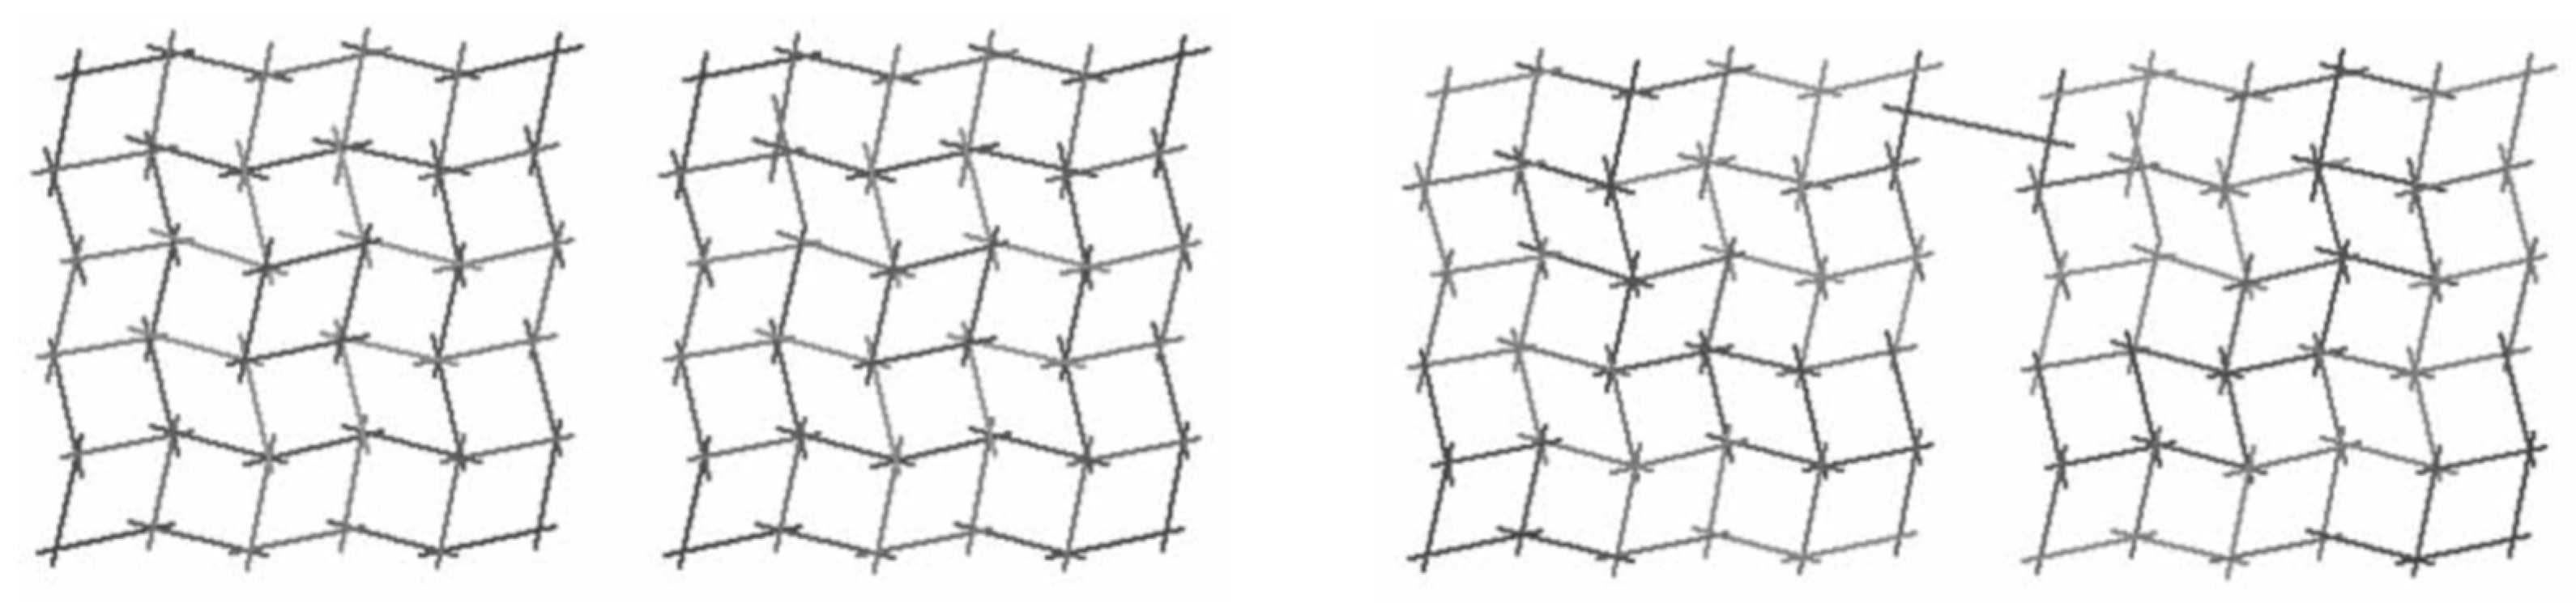
Figure 11.
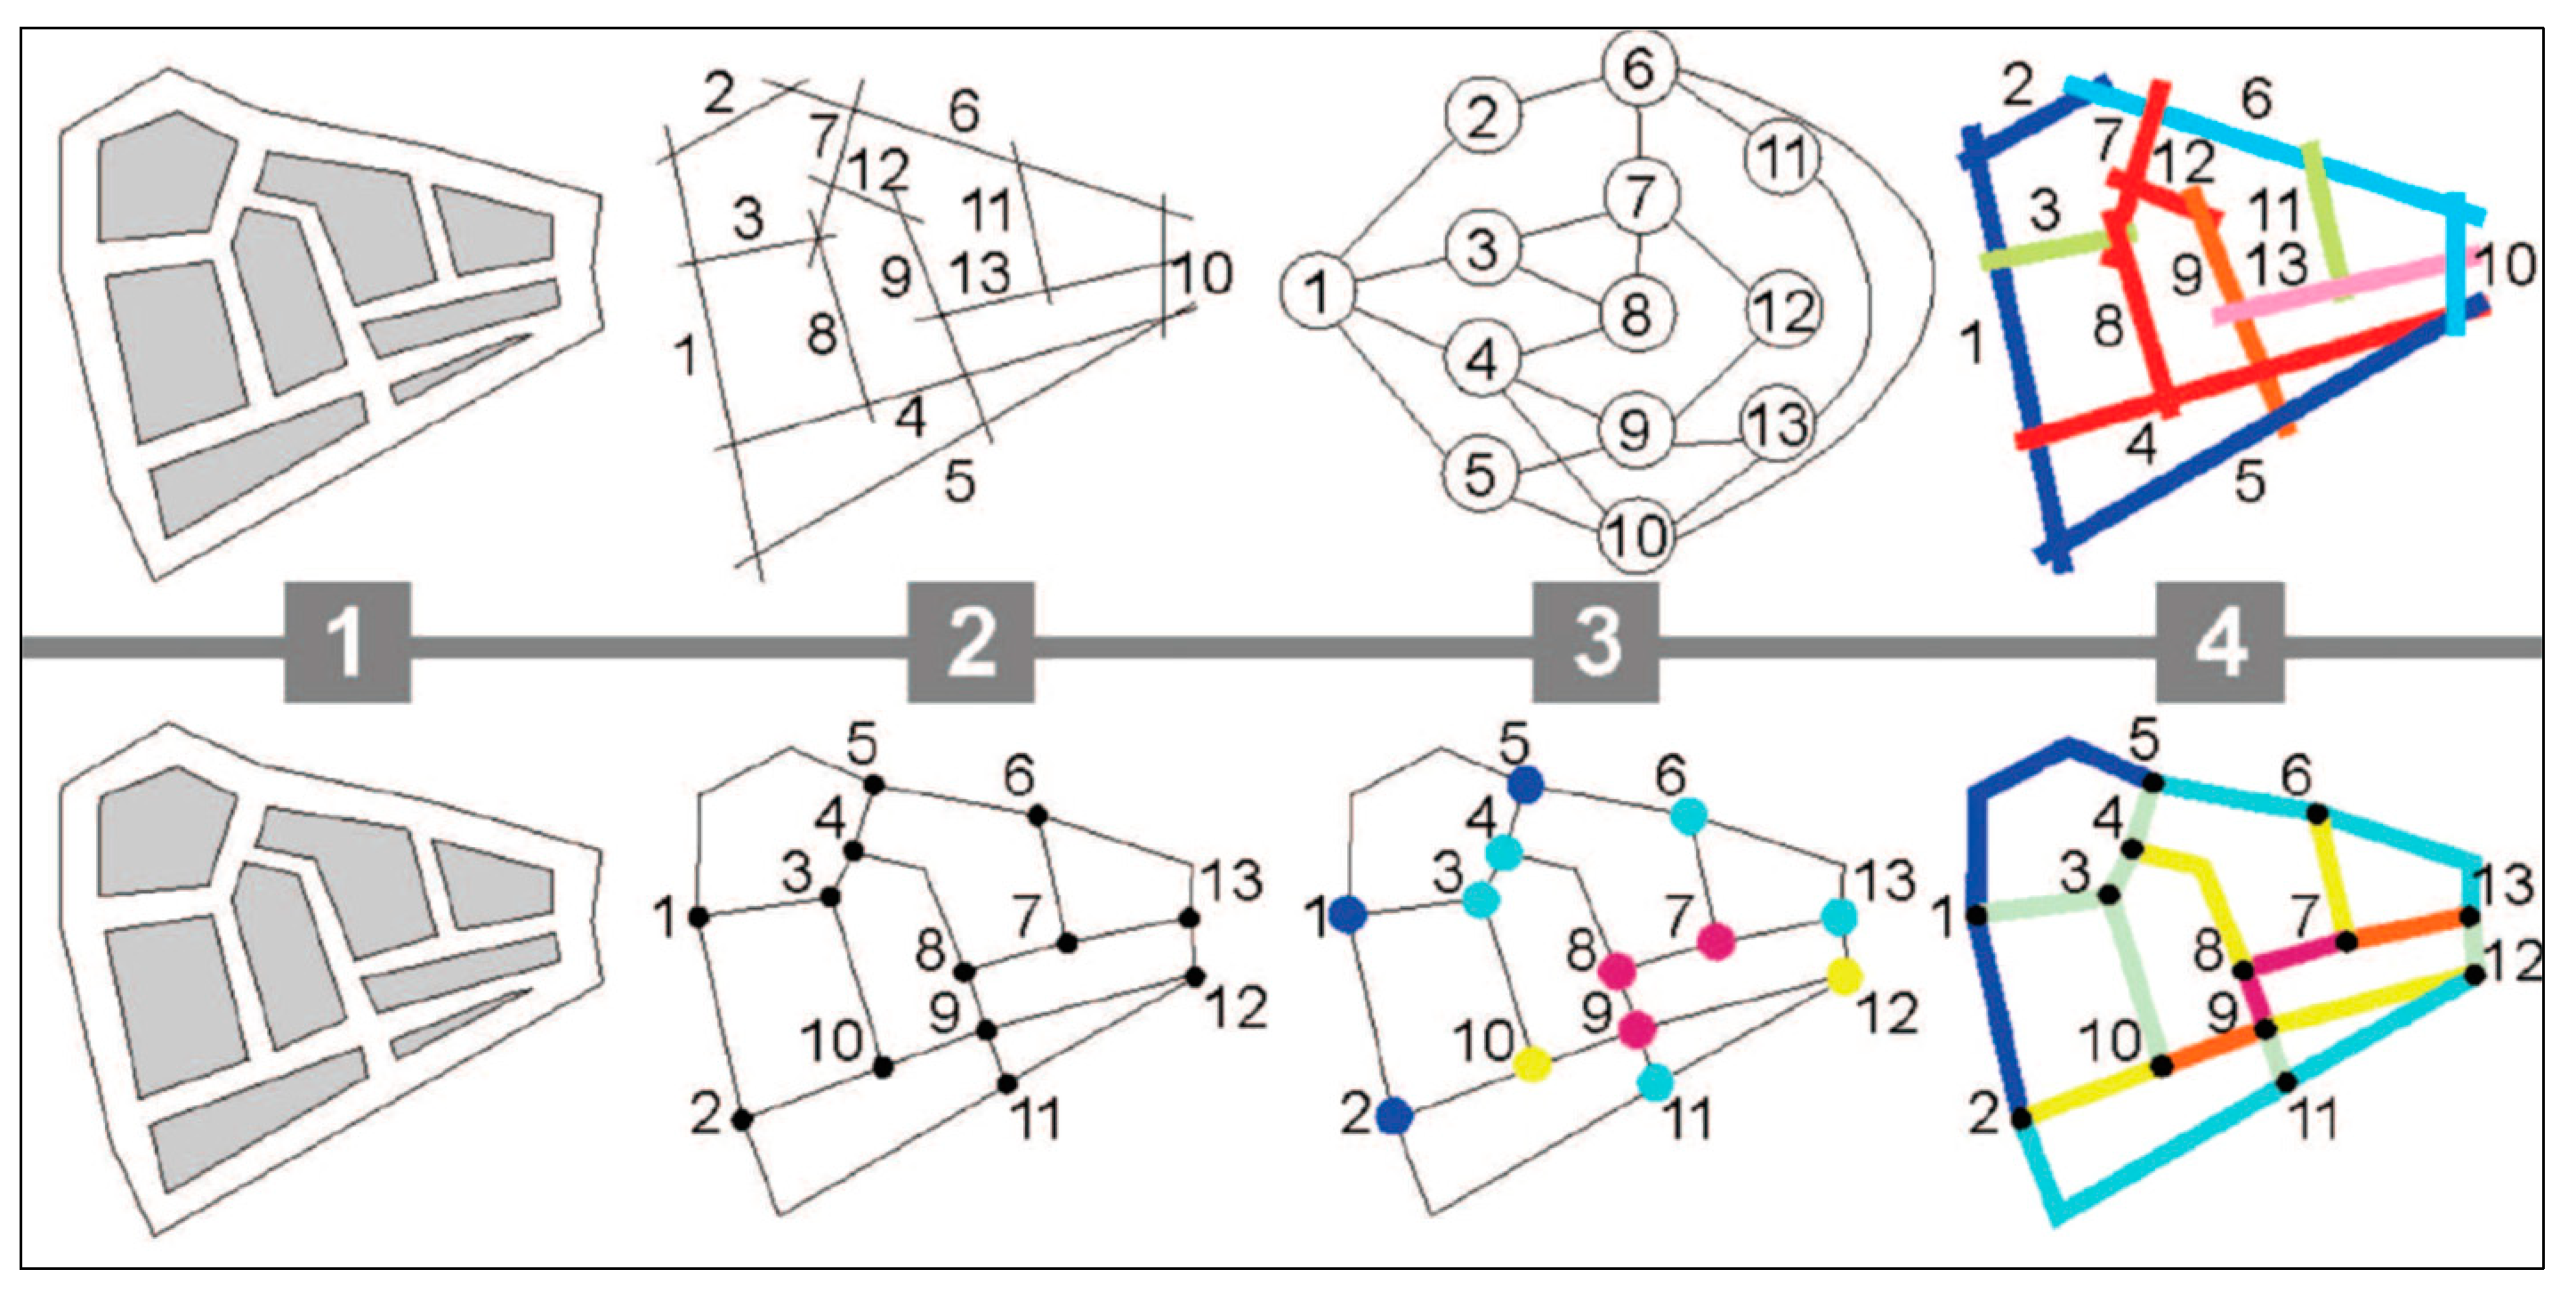
Both approaches adopt planar form in dealing with spatial network system. Top pane is the basic steps in the space syntax (SS) approach and bottom pane is a multiple centrality assessment (MCA) approach. Source: Crucitti et al. (2006b, p 3).
Figure 11.
Both approaches adopt planar form in dealing with spatial network system. Top pane is the basic steps in the space syntax (SS) approach and bottom pane is a multiple centrality assessment (MCA) approach. Source: Crucitti et al. (2006b, p 3).
Disclaimer/Publisher’s Note: The statements, opinions and data contained in all publications are solely those of the individual author(s) and contributor(s) and not of MDPI and/or the editor(s). MDPI and/or the editor(s) disclaim responsibility for any injury to people or property resulting from any ideas, methods, instructions or products referred to in the content. |
© 2023 by the authors. Licensee MDPI, Basel, Switzerland. This article is an open access article distributed under the terms and conditions of the Creative Commons Attribution (CC BY) license (http://creativecommons.org/licenses/by/4.0/).
Copyright: This open access article is published under a Creative Commons CC BY 4.0 license, which permit the free download, distribution, and reuse, provided that the author and preprint are cited in any reuse.


