
Submitted:
30 June 2023
Posted:
30 June 2023
You are already at the latest version
Abstract
The research is focusing on analyzing the concentrations of particulate matter (PM) next to a highly congested road section, with 39,900 as a maximum number of vehicles per 24 h, in the vicinity of Timisoara, Romania. Concentrations have been measured in multiple episodes using two different measurement methods, gravimetric and dynamic light scattering, showing a disperse range of PM concentrations. Presence of metal particles in the samples have been analyzed using an electron microscope. Additionally, impact on human health is described by evaluating results for inhalable, thoracic, and alveolar sized particles.
Keywords:
PM pollution
; microscopic analysis of PM
; PM influences on human health
; presence of metals in PM
; inhalable
; thoracic
; and alveolar sized particles
1. Introduction
The primary objective of this article is to present the findings pertaining to the levels of particulate matter (PM) in close proximity to a heavily trafficked road segment. This investigation entails a comparative analysis of two distinct measurement methodologies, alongside an examination of the metallic chemical particles identified within the collected samples.
Maintaining clean air is a crucial matter for every government worldwide, particularly for developed nations that prioritize implementing comprehensive approaches to mitigate air pollution, particularly in densely populated urban regions. The negative impact of pollution and inferior air quality in cities can lead to a host of health issues, predominantly cardiovascular and respiratory ailments. In accordance with a 2014 World Health Organization (WHO) report, a staggering 80% of premature deaths caused by heart attacks and severe heart diseases are linked to air pollution levels [1].
The detrimental effects of elevated air pollution on human health were first recognized at the start of the 20th century following severe environmental pollution incidents. Notable examples include the Meuse Valley in Belgium (1930), London in Great Britain (1952), and Donora in the United States (1948). These events led to the observation of adverse health effects on individuals, ranging from headaches and vomiting to fatalities [2].
Internal combustion engines produce a variety of pollutants during the combustion process, including suspended particles of varying sizes (PM1.0, PM2.5, PM10). These particles can result in bronchitis, asthma, and inflammation of the respiratory tract [3]. Gases also contribute to health issues like carbon oxides (CO, CO2) by diminishing the blood's capacity to transport oxygen [4], and nitrogen oxides (NO, NO2) which are responsible for respiratory diseases, particularly asthma [5].
Particle matter pollution is a long-known hazard to human health, and it continues to be to this day an important trigger of serious pulmonary and cardiovascular diseases [6], contributing to a great number of premature deaths per year making it a leading cause of mortality worldwide [7].
This section will focus more on the respiratory effects of these particles.
An important factor is the size of the particles as this is directly linked to how much damage it causes to the tissues it manages to reach.
It is widely known that the smaller the particle, the deeper it can penetrate the respiratory tract causing important inflammatory effects along with oxidative stress on the tissues it reaches [8]. The body’s natural barriers can limit to a certain degree the intake of these particles, as the hair and mucus from the upper respiratory tract can trap and further eliminate bigger particles from the body, whereas smaller particles can reach as far as the alveoli and even into the bloodstream [9].
When fine particles reach deeper into the lungs, certain reactions take place, one mentioned above being the oxidative stress that happens when free radical production from the particles exceeds available antioxidant defenses of the body thus further accentuating the inflammatory responses, with harmful effects on the affected tissues [10].
PM 10 particles can be filtered by the nasal mucous layer and cilia, but longer exposure can lead to local inflammatory effects by irritating the nasal cavity which in turn can damage the protective barrier of the nose [11]. Several conditions can arise or become aggravated because of this, on example being allergic rhinitis [12]. The trachea also has its own natural protective barrier; it’s able to produce mucus and it is also lined with cilia that move to push the mucus-trapped particles out of the trachea, thus keeping them from going further into the respiratory tract; another important anatomical structure is represented by the trachealis muscle which, among other roles, aids through its contraction in the further expelling of the particles [13]. Chronic exposure to coarse particle leads to local inflammation of the trachea thus disrupting its protective barrier causing a number of harmful effects and conditions like acute and chronic laryngitis [14]. Although it is still unclear if long-term exposure to PM10 particles can lead to laryngeal cancer, several articles have concluded that this risk is bigger when it comes to fine particles (PM2.5), rather that coarse particle (PM10) [15].
Other organs that are directly affected by PM10 particles are the eyes, where exposure initiates several inflammatory responses, causing dry-eye like symptoms [16]; long term exposure can lead to a chronic condition where the eyes don’t produce enough lubrication thus increasing the risk of infection, damage to the surface of the eyes, that in extreme cases can even lead to vision loss [17].
Because of their size, fine particulate matter (PM2.5) can pass the first protective barriers of the body and reach the lower respiratory tract. An important process that takes place once these particles reach the lung surface is the oxidative stress. Several reactions take place once these particles come in contact with the tissues and depending on the components present in these particles, a production of free radicals is initiated, outnumbering the protective antioxidants produced by the body, resulting in the oxidation and damage of the lung cells and affecting DNA (Deoxyribonucleic acid) and DNA repair, thus increasing the risk of the most hazardous effect these particles cand have: lung cancer [18].
Another important mechanism by which the lung cells become damaged is the inflammatory response these particles initiate when in contact with the tissue. A balance between inflammatory and anti-inflammatory factors is of extreme importance in maintaining the lungs normal functioning. To fight off foreign particles, the body produces pro inflammatory responses that subside when the said particle is destroyed or eliminated. Chronic exposure to such particles, lead to a persistent and excessive inflammatory response, altering the lung homeostasis, that ultimately leads to uncontrolled tissue damage [19]. Uncontrolled chronic inflammation of the lung promotes the production of growth factors, enzymes and deposition of ECM factors that destroy and modify the normal tissue, replacing it with irreversible scarring tissue, ultimately leading to pulmonary fibrosis, also further increasing the risk for developing lung cancer [20].
As several studies show, acute inflammation of the lungs due to inhalation of Pm 2.5 particles can exacerbate symptoms of preexisting conditions such as asthma, increasing the number of hospital admissions and deaths due to acute asthmatic episodes [21].
Although PM2.5 can also be absorbed into de blood stream, ultrafine PM1 are the most harmful as they have a greater chance of breaking the blood barrier due to their smaller size. After reaching the alveoli, a majority of them pass the cell membrane, entering the blood stream and spread to other organs of the body, causing further damage [22]. It can pass through the brains blood barrier, and once they reached the brain tissues, they become much harder to eliminate from the body, leading to neuroinflammation with further cerebral disfunction. Recent studies analyzed a link between particulate matter pollution and certain neurological conditions like a decline in cognitive functions and dementia [23].
When entering the bloodstream, ultrafine particles cause vascular inflammation with the release of excessive inflammatory factors that affect coagulation of the blood and vessel integrity, with long-term exposure to ultrafine particles leading to an increased risk for developing atherosclerosis, a major condition in the increased cardiovascular mortality worldwide [24]. Several studies showed that long-term exposure is also linked to an increased risk for irregular heart rate, hypertension, heart failure and even stroke [25].
All of the above represent serious effects on human health and well-being. That is why it is of extreme importance to find ways to reduce air pollution especially particulate matter pollution because it represents one of the most harmful existing elements that greatly impacts human health worldwide.
Typically, traditional air quality measuring devices are utilized by governments and state institutions, which are placed at various locations throughout urban and peri-urban regions. These devices are located in stationary buildings and necessitate substantial energy consumption, and frequent maintenance to function. However, technological advancements in air quality measurement have introduced novel techniques that make the measuring equipment portable, thereby enabling easy mobility and mobile usage [26].
Installing an air quality monitoring system in public transport stations provides a targeted approach for analyzing and addressing high pollution levels that directly affect passengers waiting at these stops. Although state institutions monitor air quality in urban areas with high population densities, they do not specifically address the unique situations encountered by public transport passengers. While personal vehicle passengers are shielded from pollution by advanced automotive technology, passengers waiting at public transport stops are constantly exposed to harmful pollutants generated by nearby traffic.
The presence of filters in vehicles reduce the introduction of suspended particles, such as PM2.5 and PM10, into passenger compartments of vehicles [27], providing a safe environment for drivers, but those waiting in public transport stations are constantly bombarded by passing vehicles. This exposure disproportionately affects vulnerable groups, such as the elderly and children, who rely heavily on public transport for their daily commutes. Furthermore, a plethora of scientific investigations have revealed that despite the presence of protective filters that effectively inhibit the ingress of particulate matter (PM) into the passenger compartment, the act of operating a vehicle with the windows open leads to a significant amplification of PM concentrations, with an increase of up to 80% being observed in various studies [28].
To measure the levels of suspended particles and polluting gases emitted by motor vehicle thermal engines, air quality measurement equipment will be utilized. Advanced people counting systems, which rely on video recording systems placed in specific areas, will also be employed to determine the number of passengers exposed to the pollutants [29]. The main objective of this study is to assess the concentration levels of suspended particles, which are known to have a detrimental impact on human health. The proposed measurement system will continuously monitor air quality and passenger counts at public transport stops. This research builds on a previous study conducted on the same road section, but with a shorter duration of PM value recordings.
The present study covers a episode of over 20 days and is discussed in detail in this article [30].
2. Materials and Methods
The concentration of particulate matter was determined using two different measurement methods with two separate pieces of equipment. Both instruments are calibrated, metrologically certified, and accredited by the RENAR (Accreditation Association of Romania).
Two different sets of results have been recorded. During a 23-day episode between July 15th and August 7th of 2022, measurements were taken using gravimetric impactors. Additionally, on September 25th, 2023, measurements were taken using both the DLS method and gravimetric impactors in parallel.
The first measurement equipment consists of gravimetric impactors that measure particulate matter concentrations through weight comparison of charged fibre glass filters. These impactors, produced by Sven Leckel GMBH under the model’s name LVS3 (Low Volume Sampler), are specially designed to aspirate air through constructed nozzles at a rate of 55 Nm3/24h. During the 24-hour measurement range, particles of a specific dimension are captured on a glass fibre filter. The charged filter is then weighed and compared to the initial state of the uncharged dry filter, determining the concentration of particulate matter of the targeted dimension. The measurement equipment is in accordance to the European standard CEN EN 12341.
This measurement method allows for microscopic analysis of the captured particles due to their deposition on the filters, which is an analysis that is presented in this research paper.
The second measurement equipment is a spectrometer using light scattering at single to determine the concentration of particulate matter, allowing measurements to be taken every second, leading to detailed concentration readings during the timespan of the 24h measurement episode. This equipment is produced by GRIMM Aerosol Technik, part of Durag Group.
Measuring the fluctuations in the intensity of light scattered from a suspension or solution allows for the determination of particle size. This method is widely known as dynamic light scattering (DLS), although it is also referred to as photon correlation spectroscopy (PCS) and quasi-elastic light scattering (QELS). The latter terms are more frequently encountered in older literature. DLS finds its primary application in the analysis of nanoparticles. It is commonly employed for tasks like determining the size of nanogold, proteins, latex particles, and colloids. Typically, this technique is most effective for submicron particles and can accurately measure particle sizes below a nanometer. Within the range of microns to nanometers, when it comes to size measurement (excluding thermodynamics considerations), the distinction between molecules (e.g., proteins or macromolecules), particles (e.g., nanogold), and even a secondary liquid phase (e.g., emulsion) becomes less clear. While DLS can be utilized as a tool to investigate complex fluids like concentrated solutions, this particular application is relatively less common compared to particle sizing [31].
The measurement sampling was undertaken within a locale characterized by a significant volume of vehicular activity, with the maximum recorded count of vehicles amounting to 39,900 vehicles per 24 hours [32]. This investigation was carried out in close proximity to the city of Timisoara, Romania, specifically along the DJ691 (road indicator), serving as a crucial link connecting the A1 highway to Timisoara. The designated measurement site was situated adjacent to a public transportation stop within a residential region, where the concentrations of particulate matter (PM) exert a substantial influence on the well-being of the local residents. This road is subject to high traffic volumes due to several factors, including its location on the outskirts of Timisoara, a major Romanian city, its role as the primary access road to highway A1, and its proximity to production facilities and logistics hubs. These conditions result in a significant number of vehicles traveling along this main road section. Given the small surface area of Dumbravita and its status as a residential area, most public transport stops are located alongside this one-lane road with 11 such stops in total.
3. Results
Results are presented for the different measurement methods and episodes, including a microscopic analysis of the particles caught on the filters used in the gravimetric method measurement.
3.1. Determination of Concentration of PM2.5 and PM10 Using Gravimetric Impactors
Concentration of PM2.5 and PM10 are measured in a 23 days episode, with each day representing a 24 h measurement cycle.
The determination of the concentrations is performed by weighing the charged filters and subtracting the initial value of the uncharged filter. The result in grams is divided by the air flow measured in 24 h that is aspired through the impactor nozzle, and multiplied by 106 to reach a result measured in µg/Nm3. Normal metric cube is represented due to measurements taken under normal conditions of temperature and pressure.
The concentrations of PM2.5 and PM10 are directly proportionate to the recorded temperatures as shown in Figure 1.
Figure 1.
Variation of concentrations of PM2.5, PM10 and air temperature, recorded during the 23 days measurement episode.
Figure 1.
Variation of concentrations of PM2.5, PM10 and air temperature, recorded during the 23 days measurement episode.
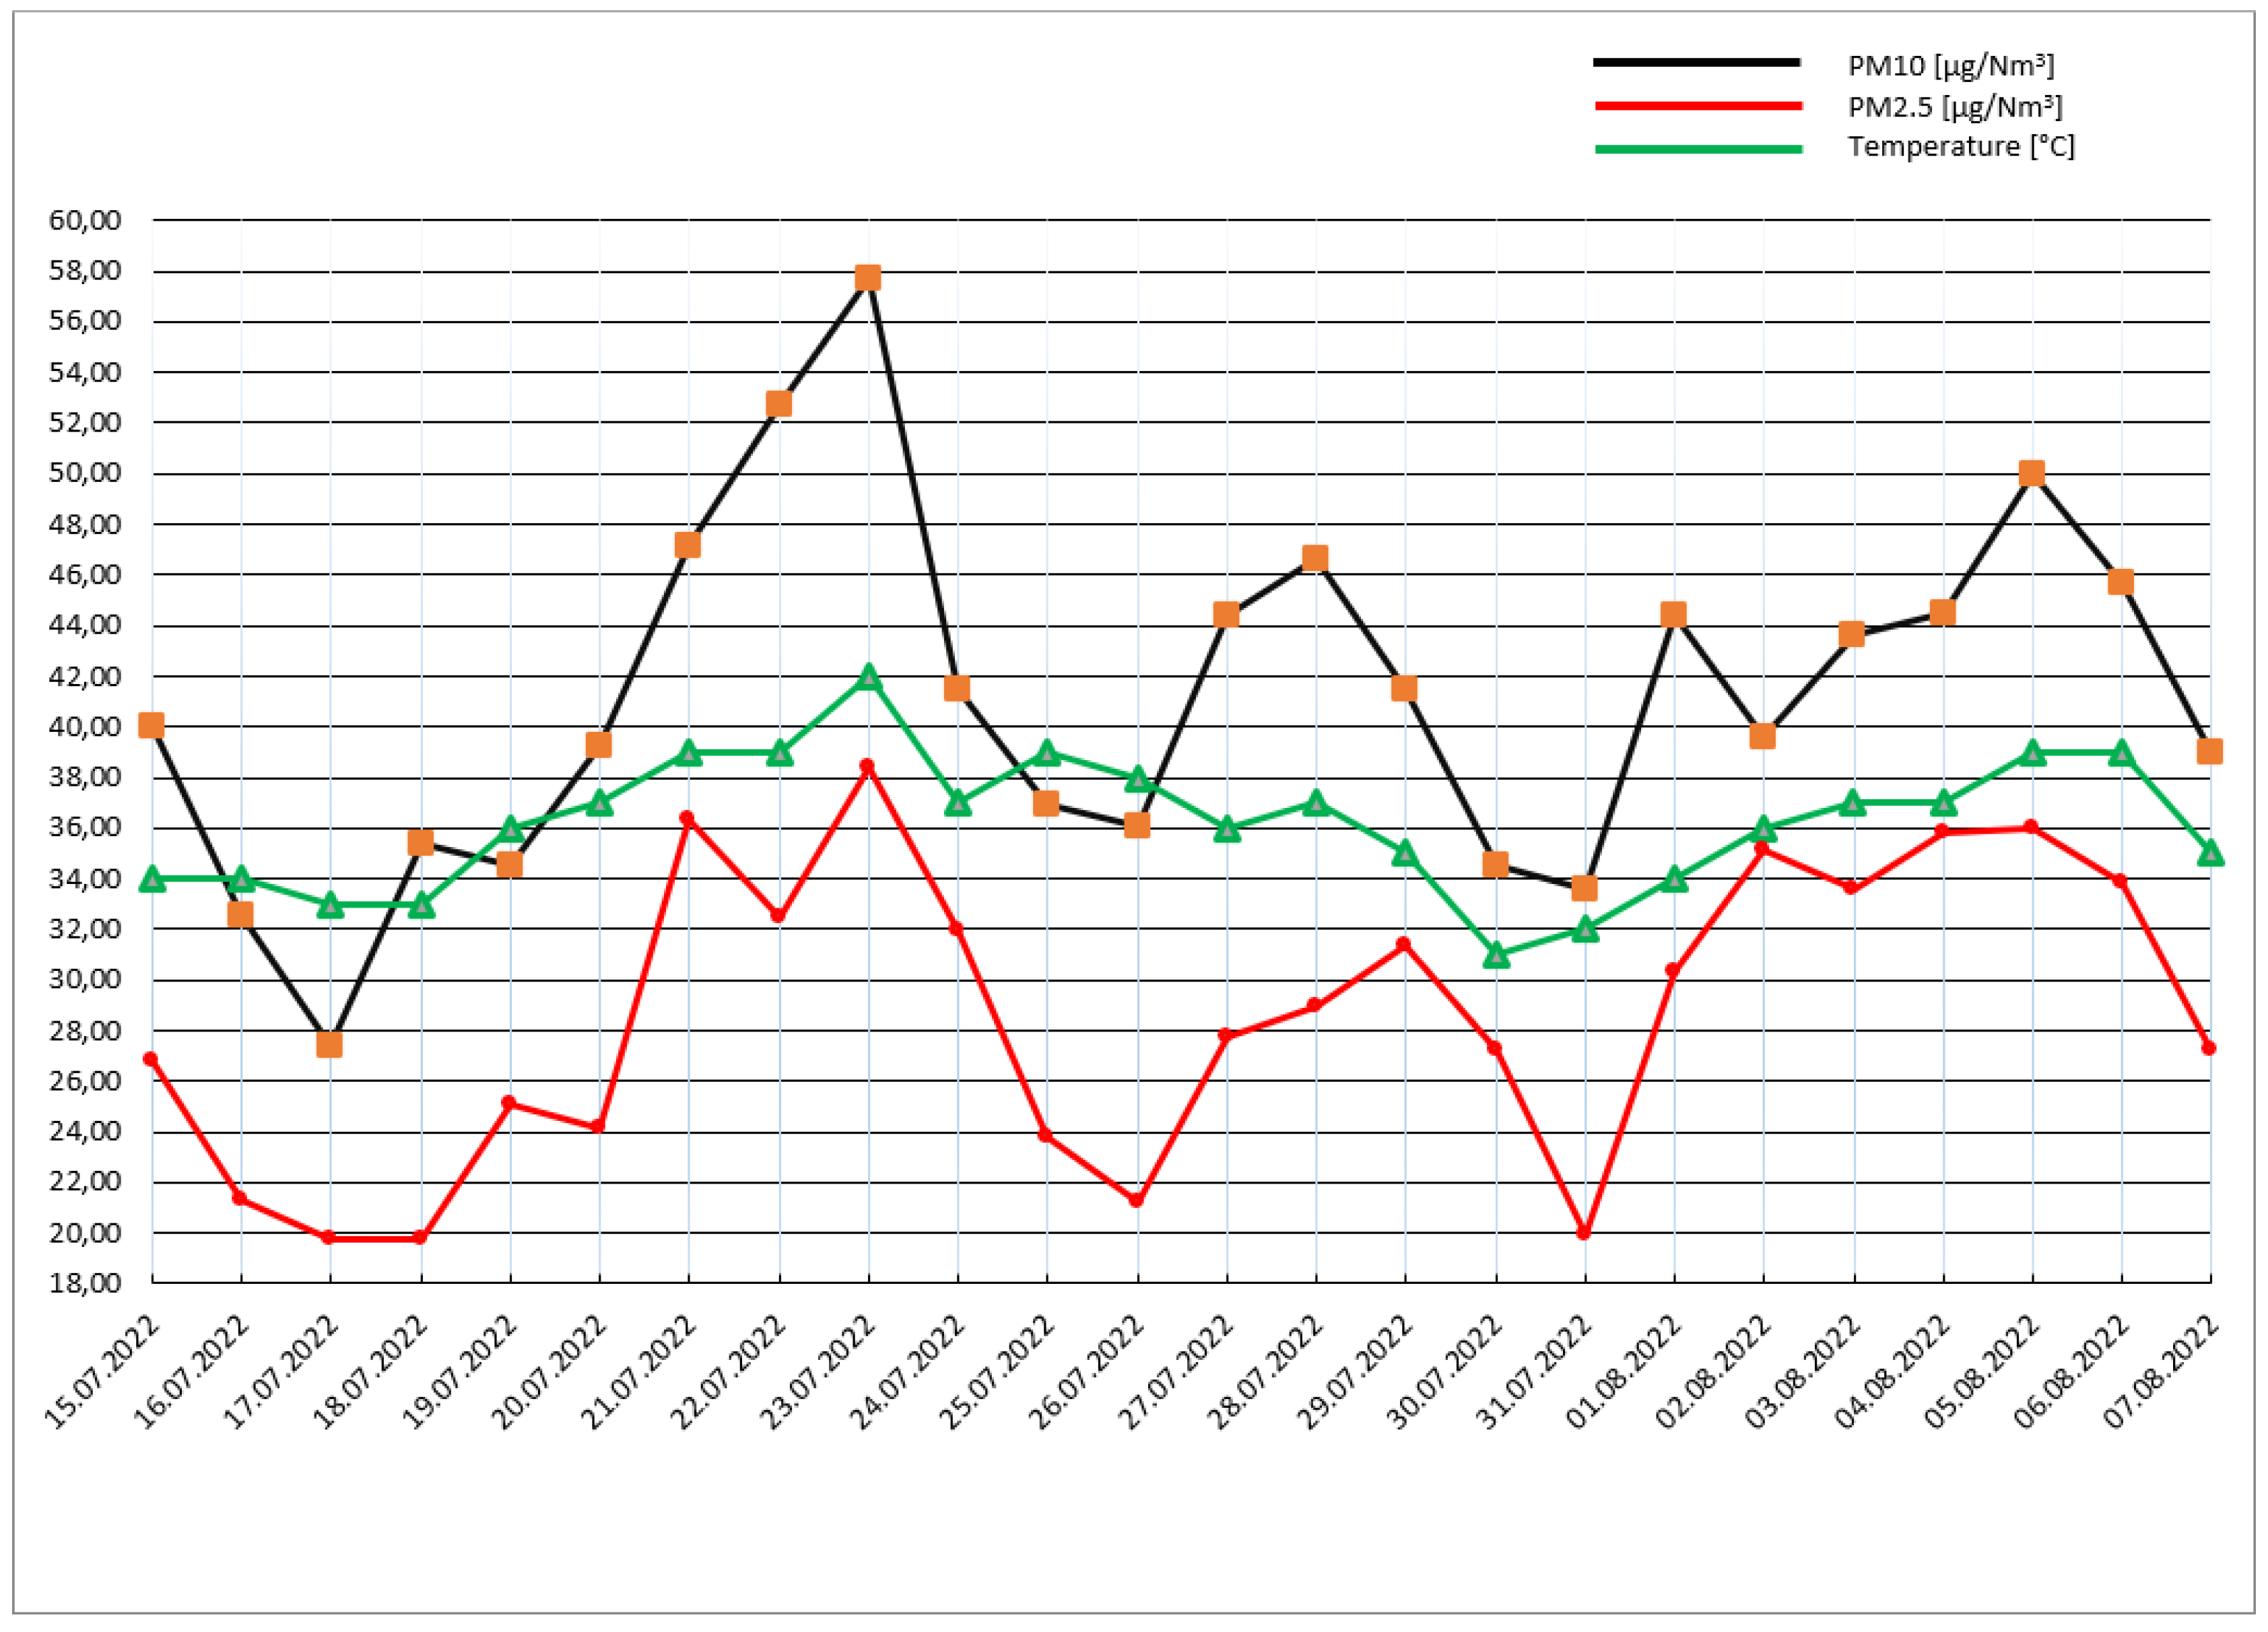
The highest concentration for both PM2.5 (38.43 µg/Nm3) and PM10 (57.71 µg/Nm3), the highest number of vehicles (39,900), and the highest temperature (42 °C) are recorded on 23.07.2022.
The number of vehicles is determined by measuring, each 15 minutes, a one-minute interval counting of vehicles for the entire 24 h episode.
Wind speeds where low, at an average of 10 km/h during the 24 h episode, with the wind direction blowing from N-E, perpendicular to the road section, directly towards the measurement equipment. All these factors lead to a recording of high concentrations of PM2.5 and PM10 during that day [33].
During heat waves and dry weather conditions, particulate pollution increases. The soil becomes very dry, which also results in an increase of dust particles getting raised into the atmosphere [33].
Highest atmospheric pressure recorded was at 1,007 mbar which is in correlation with the heat wave temperature recorded at 42 °C.
Through an analysis of air temperature, atmospheric pressure, and wind speeds, it is possible to account for the elevated levels of PM. During heat waves and periods of low atmospheric pressure and weak wind activity, air movement is restricted, which allows particulate matter to accumulate and remain within the region, rather than being dispersed [34].
3.2. Determination of Concentrations of PM2.5 and PM10 using DLS Spectrometer
On September 25th, 2022, PM2.5 and PM10 concentrations were measured using DLS technology with a spectrometer. This cutting-edge technology enables measurements to be taken every second throughout the entire 24 h episode, providing highly accurate data that can reveal variations in the readings at different times of the day. The concentrations of PM1.0, PM2.5 and PM10 measured using the spectrometer are presented in Table 1.

Table 1.
Values of PM1.0, PM2.5, and PM10 concentrations measured using DLS spectrometer.
| Variable | PM1 [µg/Nm3] | PM2.5 [µg/Nm3] | PM10 [µg/Nm3] |
|---|---|---|---|
| Minimum | 9.9 | 10.9 | 13.5 |
| Maximum | 130.5 | 134.6 | 149.9 |
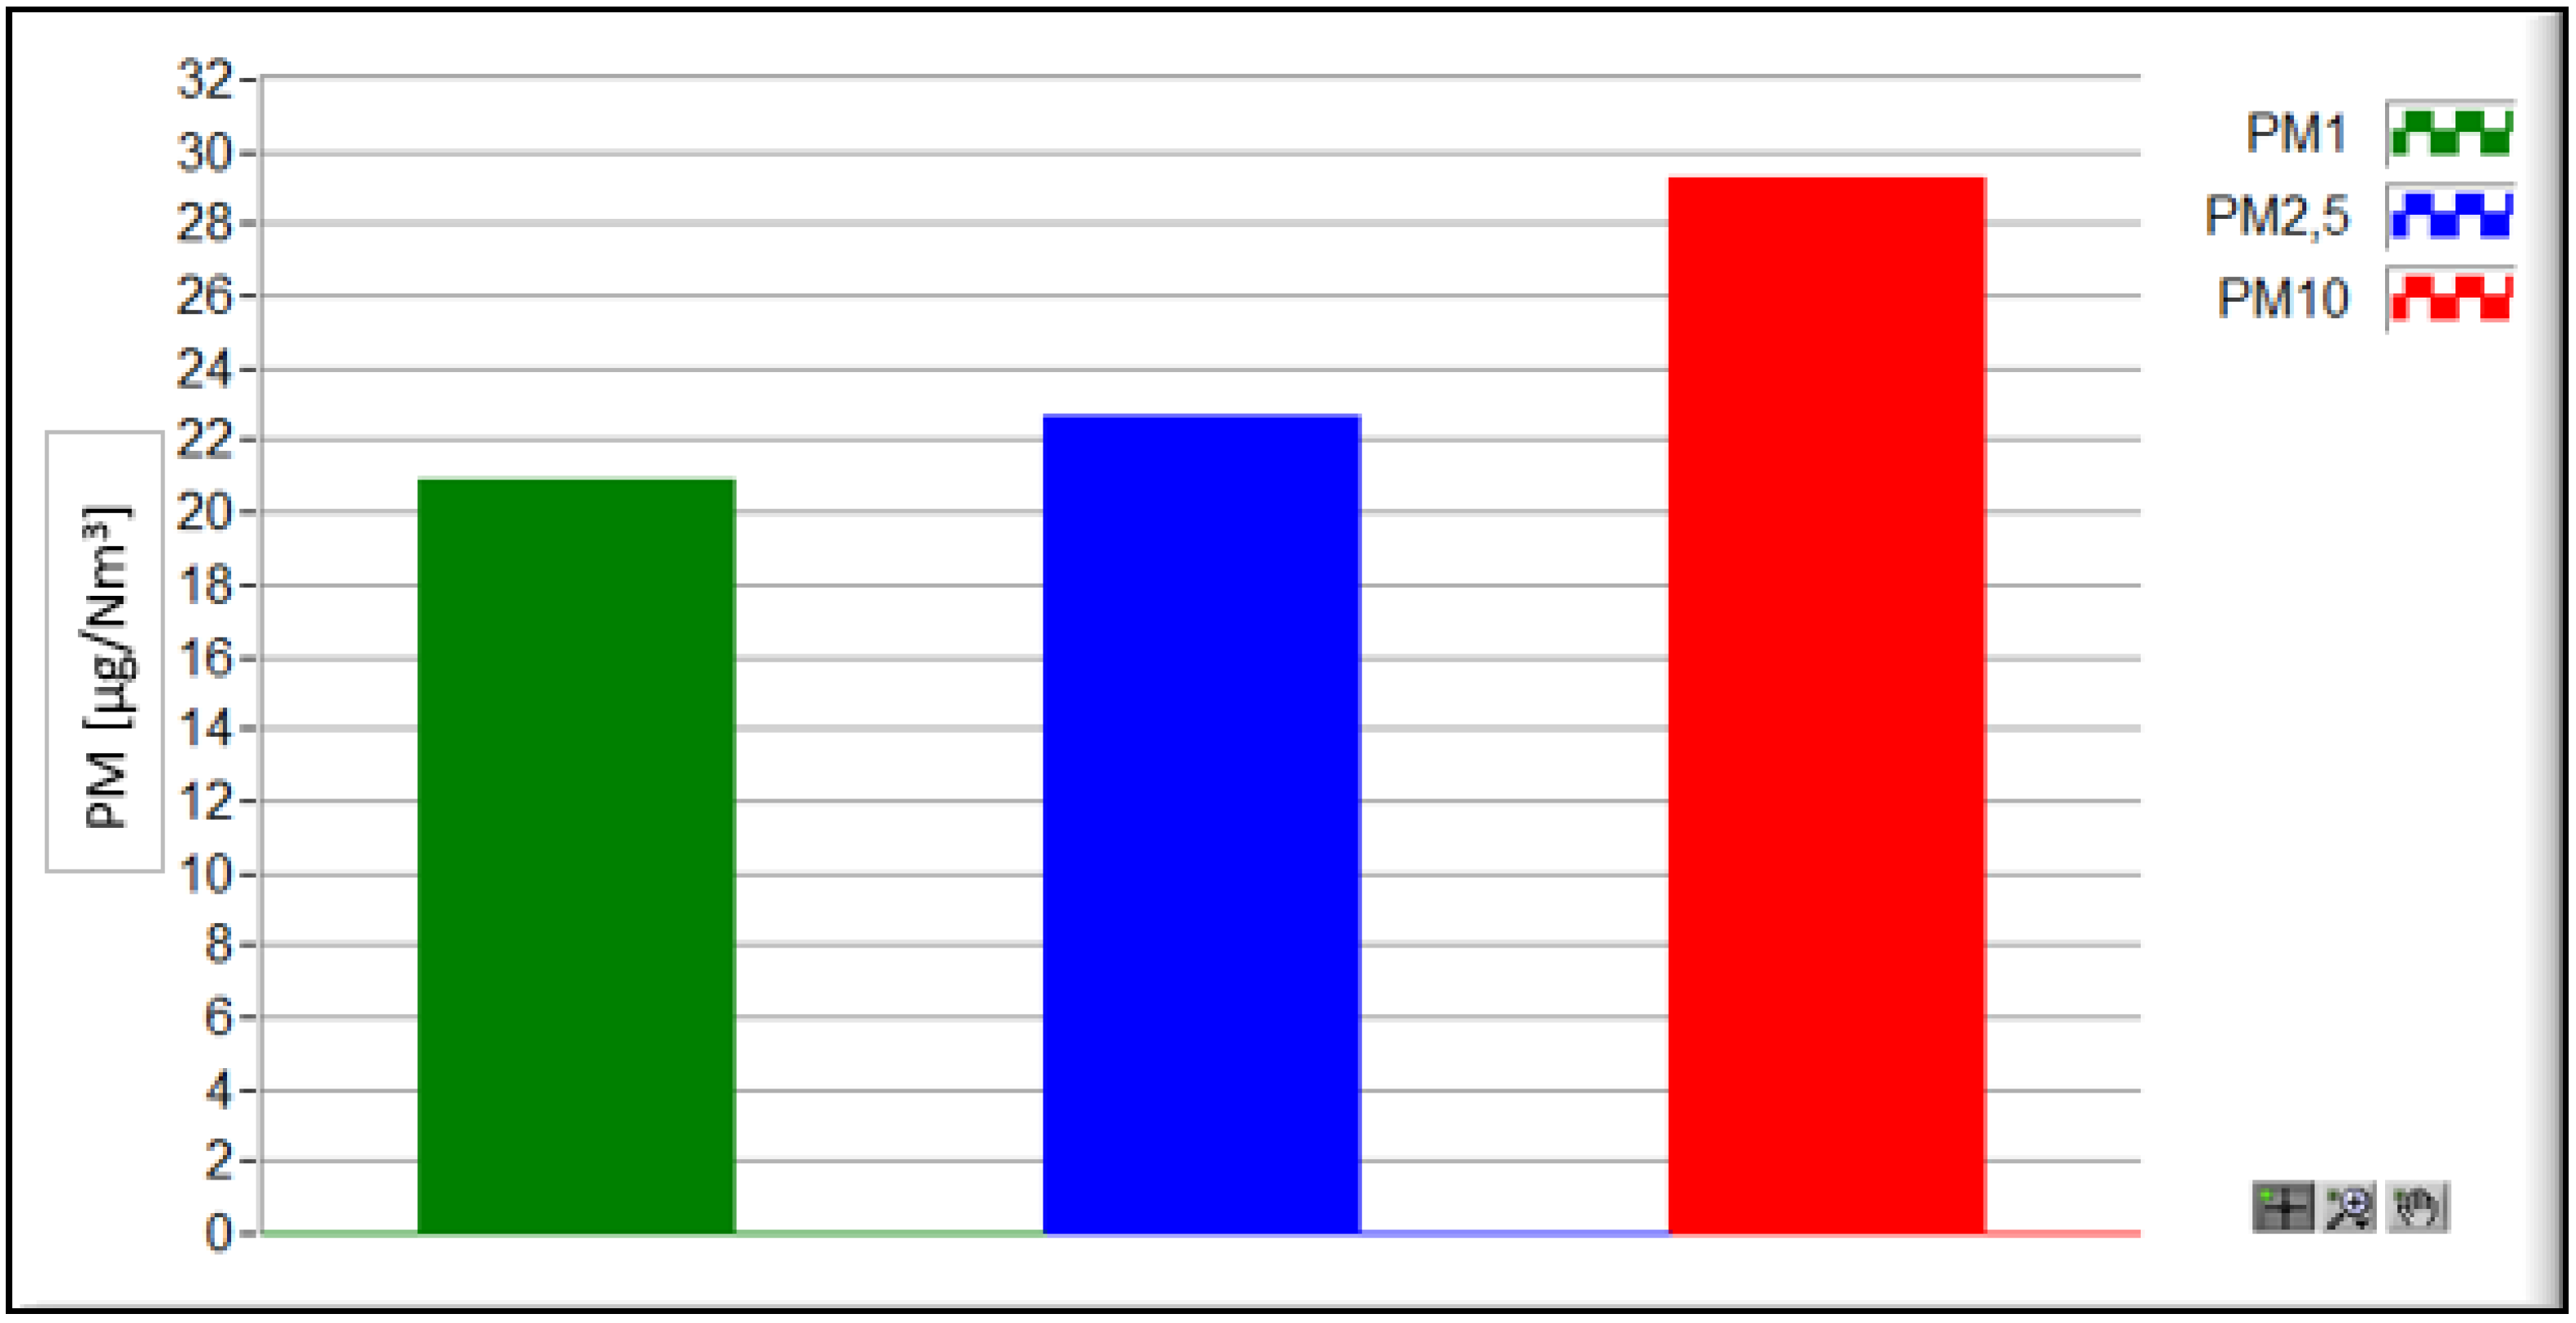
| Mean | 20.9 | 22.7 | 29.3 |
Temperatures have been recorded on September 25th, 2022 at an average of 14 °C, with a high of 21 °C and low of 7 °C. Wind speeds where at an average of 8 km/h [35].
Using the impactors, the concentrations are shown at 30.03 µg/Nm3 for PM2.5 and 32.27 µg/Nm3 for PM10 for the 24 h measurement episode, which are close to the concentrations measured with the spectrometer.
Recorded concentrations of PM during the 24 h measurement episode is shown in Figure 2. The mean values of these concentrations for PM1.0, PM2.5, and PM10 are indicated in Figure 3.
Figure 2.
Concentrations of PM1.0, PM2.5, and PM10, recorded during the 24 h measurement episode.
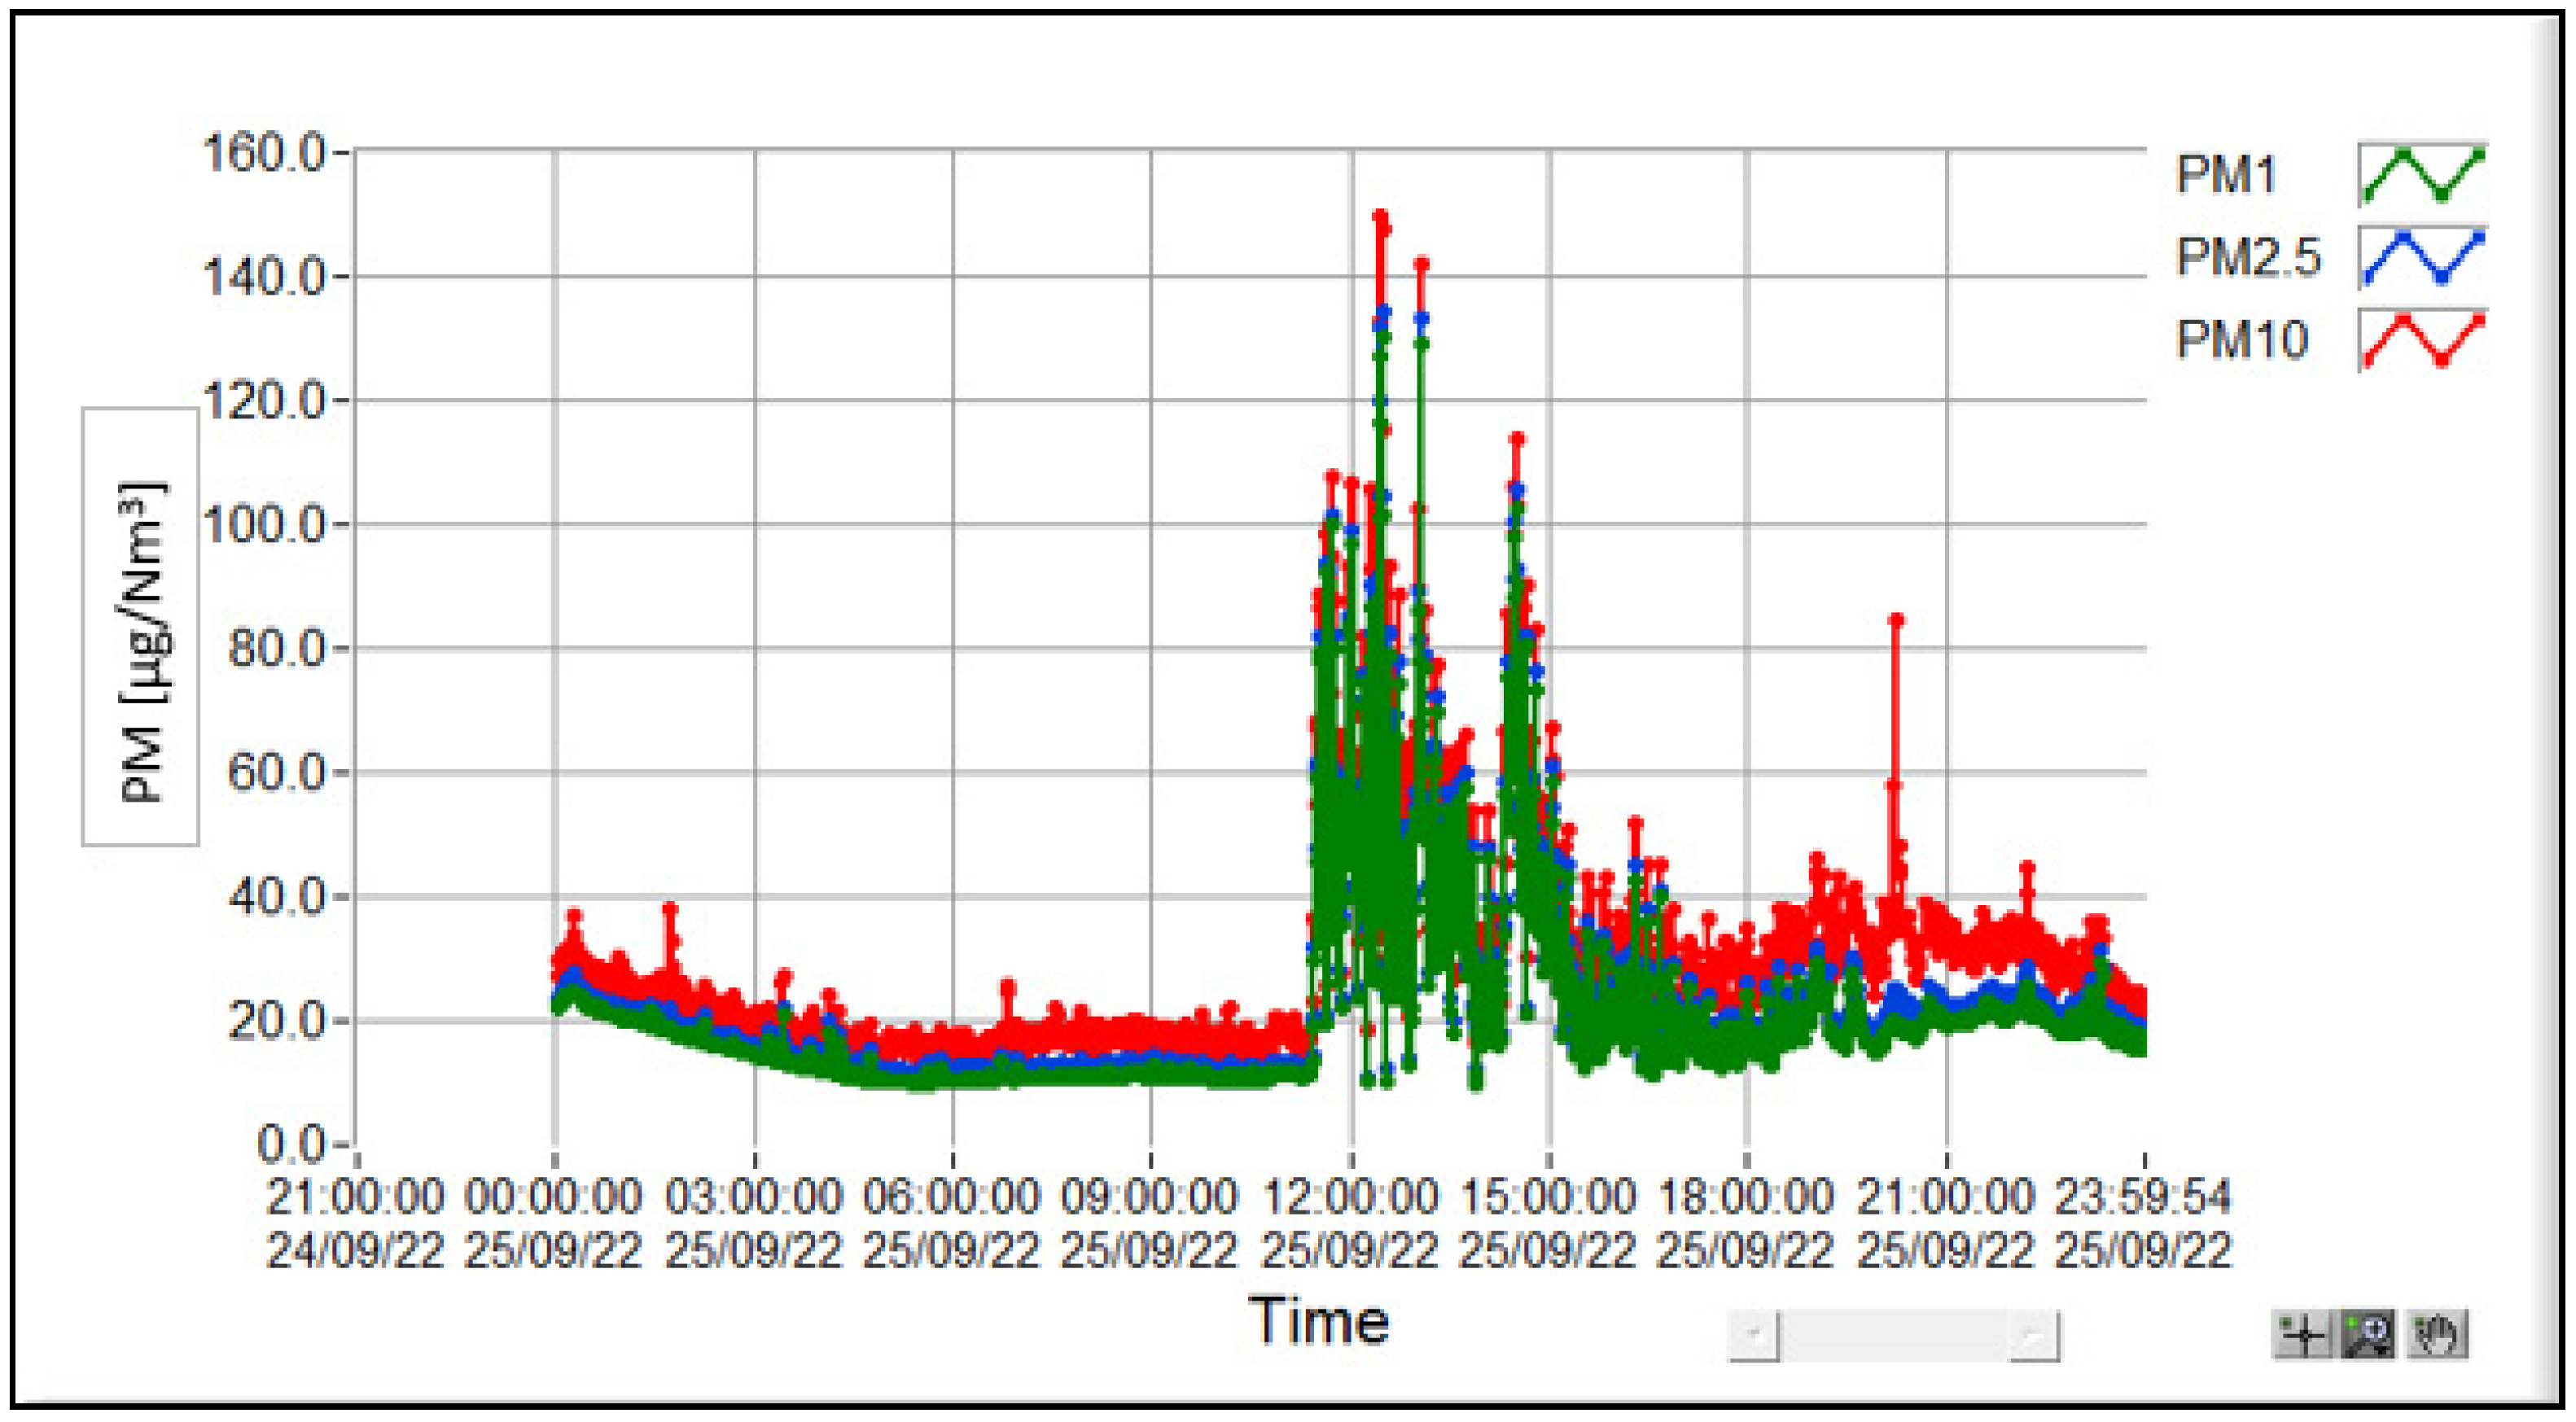
Figure 3.
Mean values for PM1.0, PM2.5, and PM10 concentrations recorded during the 24 h measurement episode.
Figure 3.
Mean values for PM1.0, PM2.5, and PM10 concentrations recorded during the 24 h measurement episode.
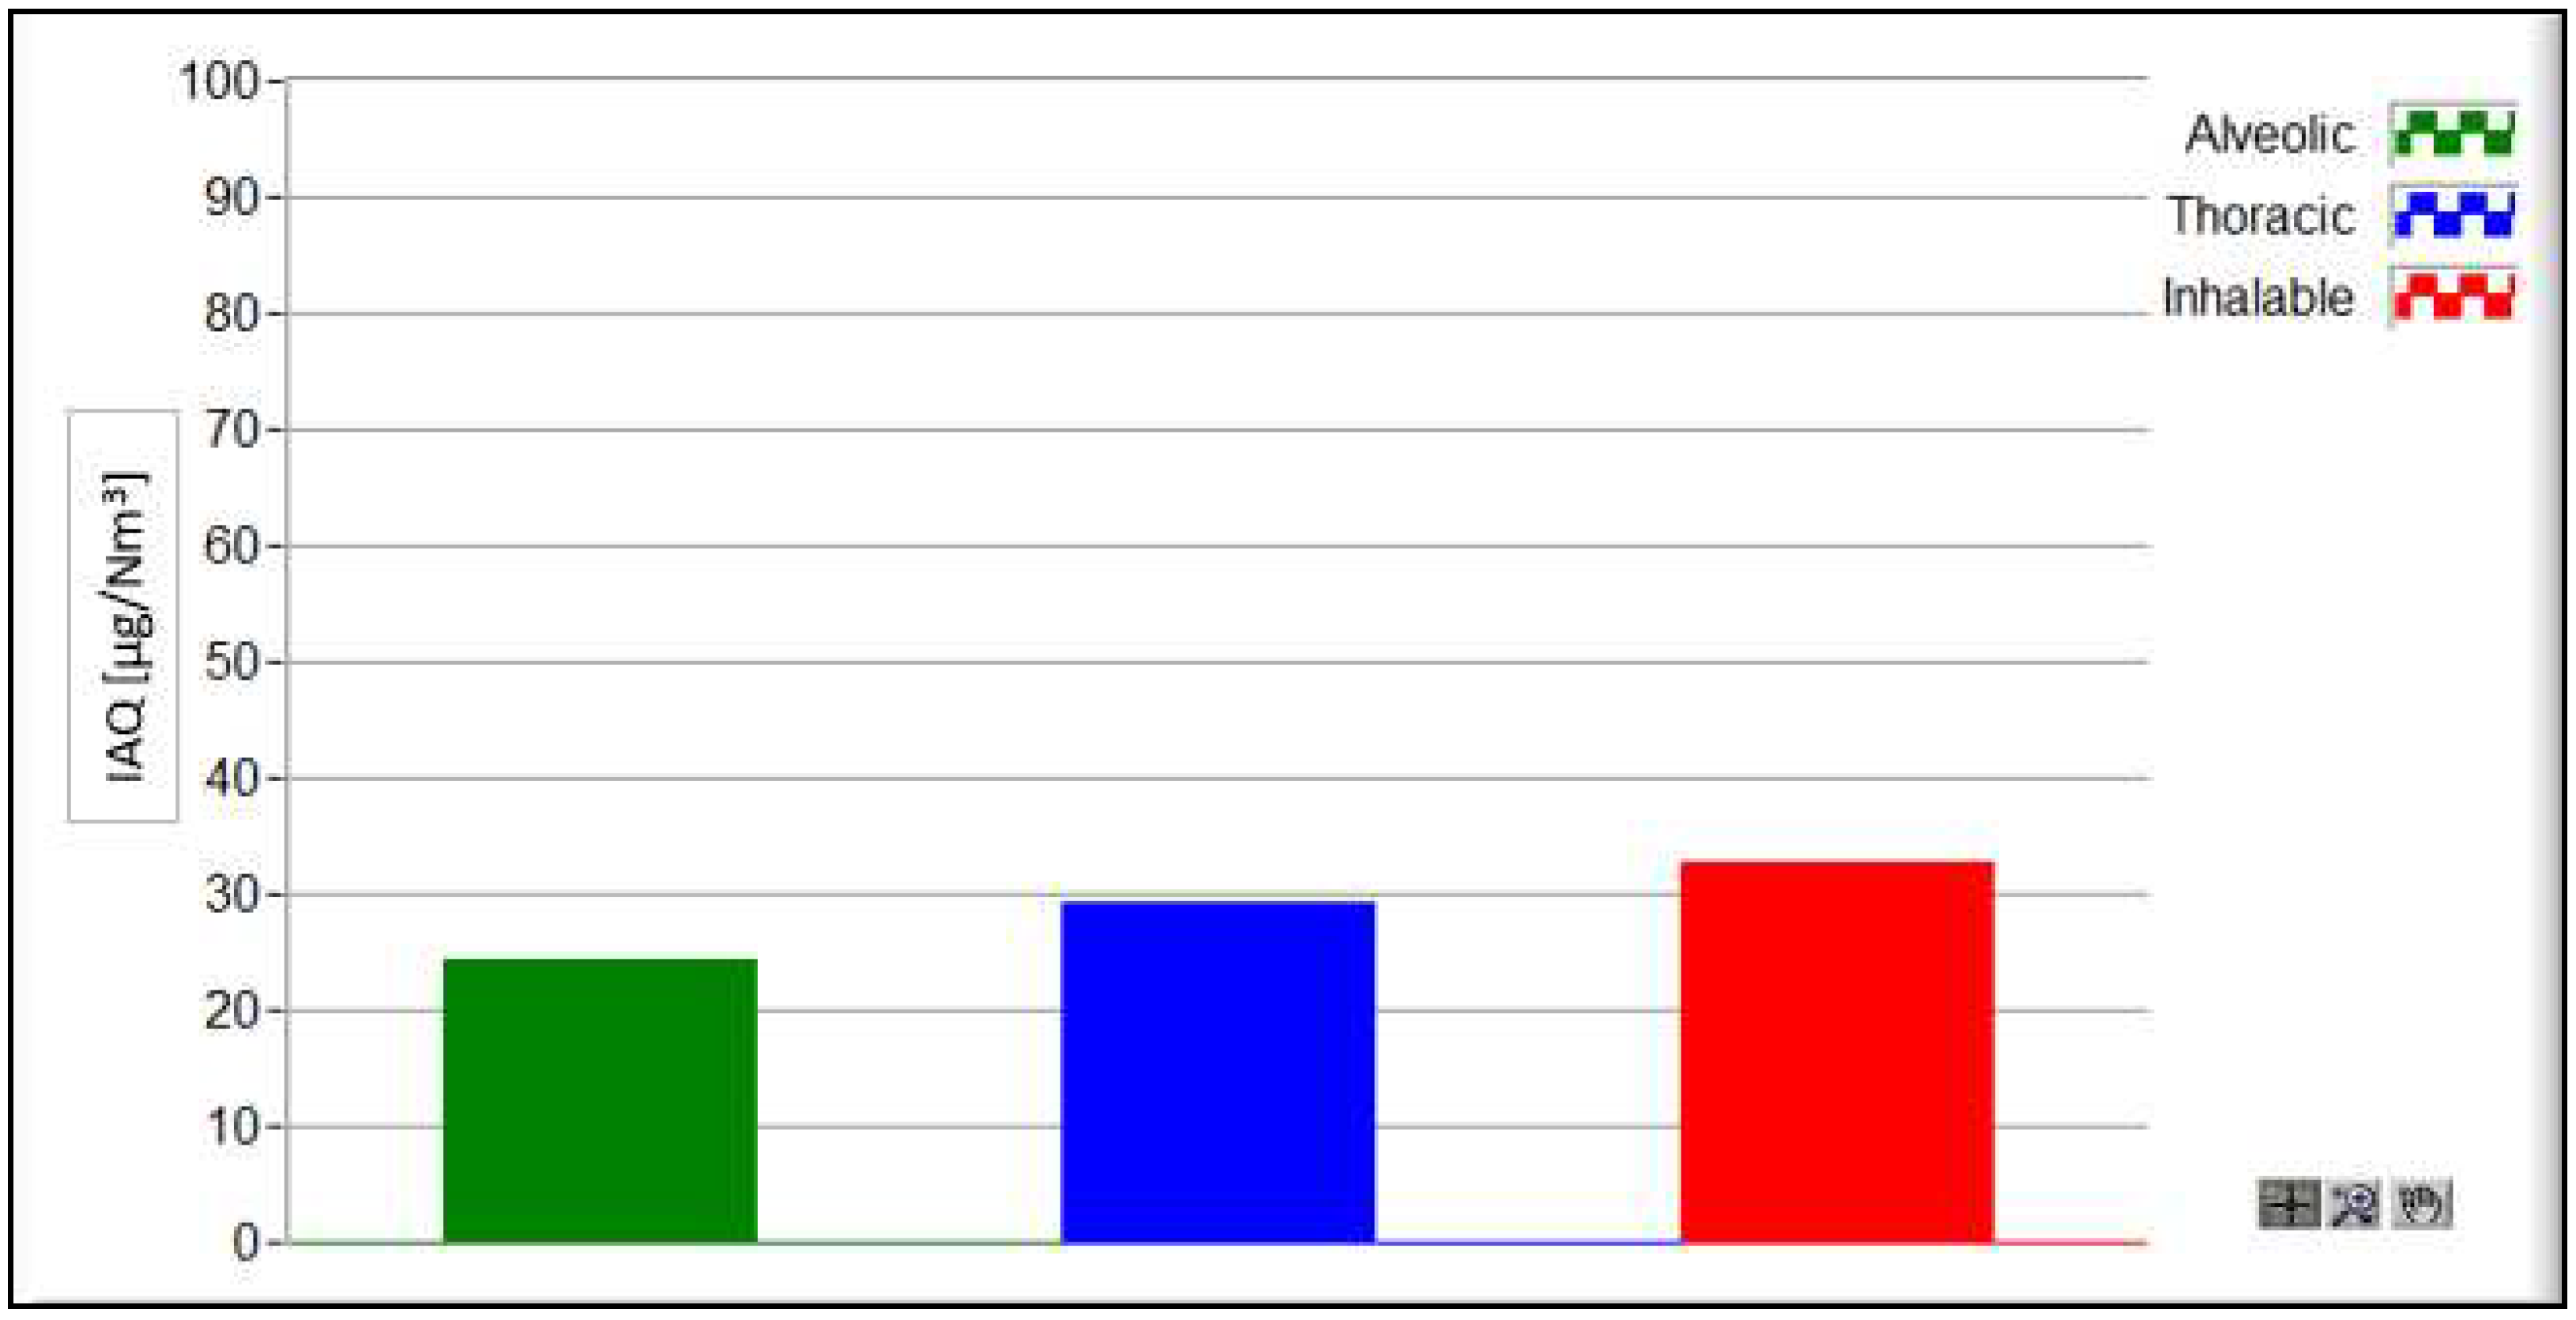
3.3. Determination of Concentrations of Inhalable, Thoracic, and Alveolar Sized Particles
Using the spectrometer, it is possible to determine the concentrations of inhalable, thoracic, and alveolar-sized particles by analyzing the levels of PM1.0, PM2.5, and PM10. Since different particle sizes can penetrate various parts of the human body, this advanced technology can provide a more comprehensive understanding of the potential health impacts associated with each size category. All particle sizes are inhalable, but only PM2.5 and PM1.0 sized particles reach the thoracic level, and finally only PM1.0 is able to reach the alveoli. In Figure 4 there are shown the different concentrations recorded during the 24 h measurement episode. Mean values for the concentration are shown in Figure 5.
Figure 4.
Inhalable, thoracic, and alveolar concentrations of PM.
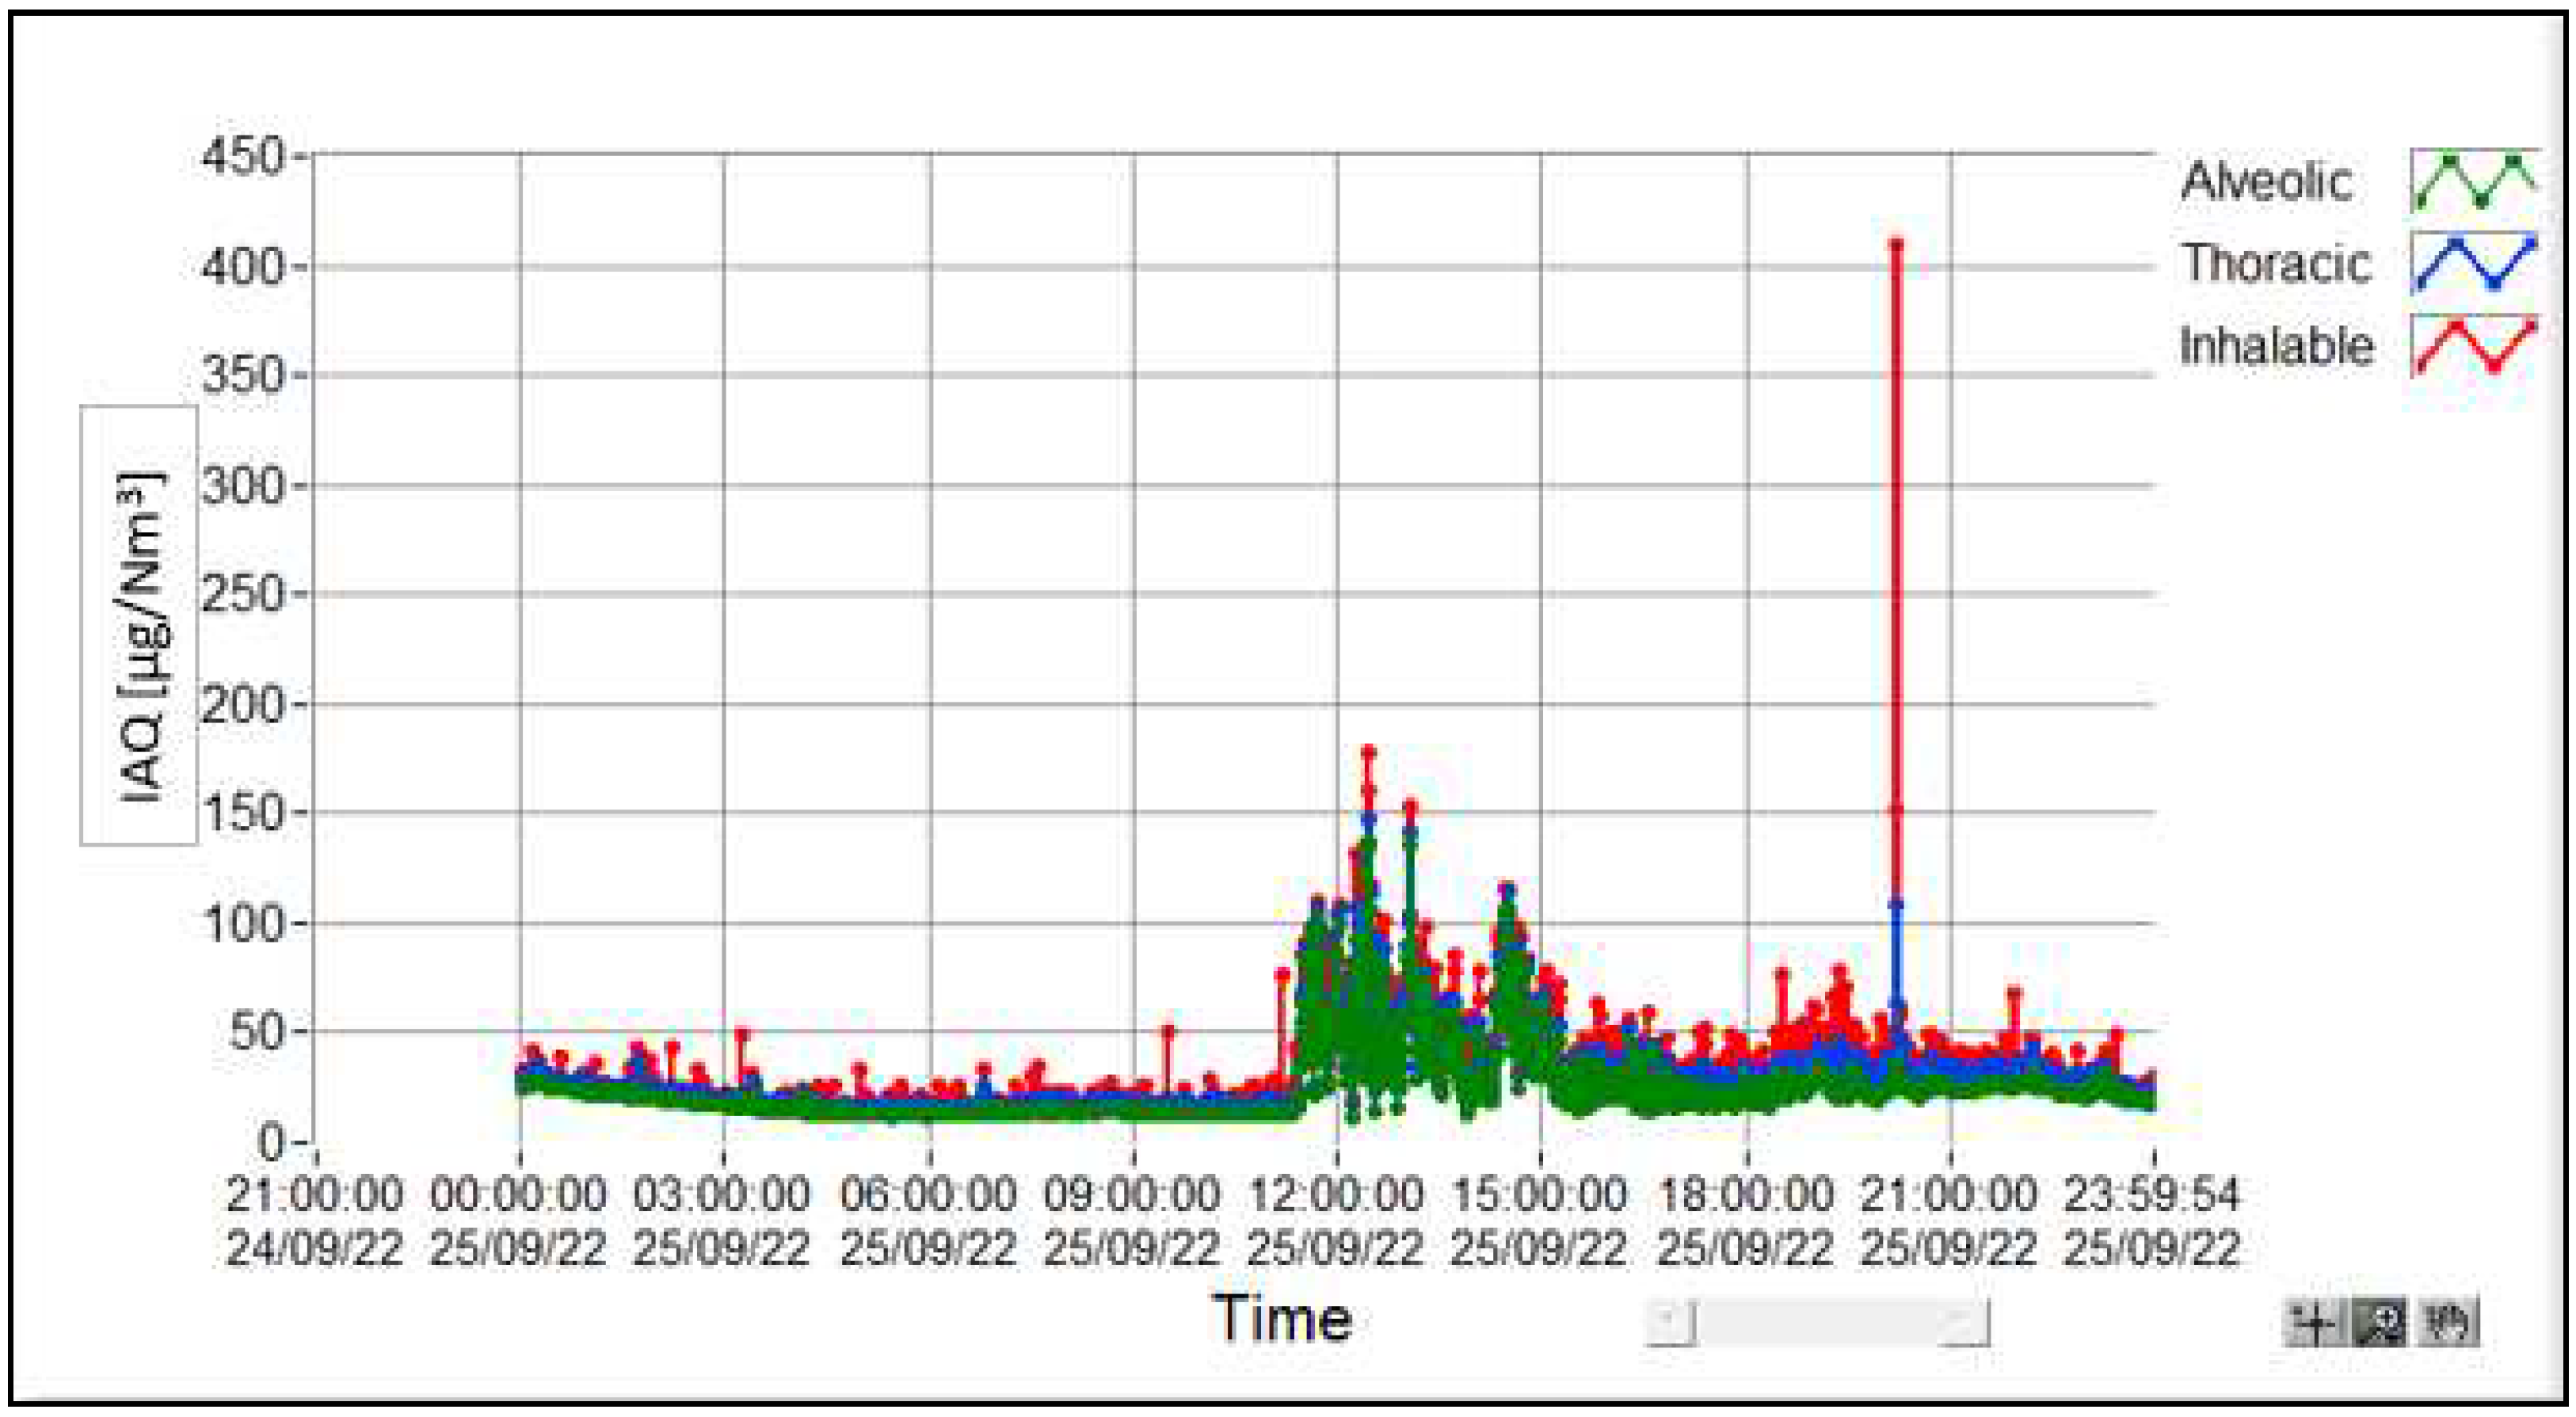
Figure 5.
Inhalable, Thoracic, and Alveolar concentrations mean values.
3.4. Microscopic Analysis of Particles Captured with Gravimetric Impactors
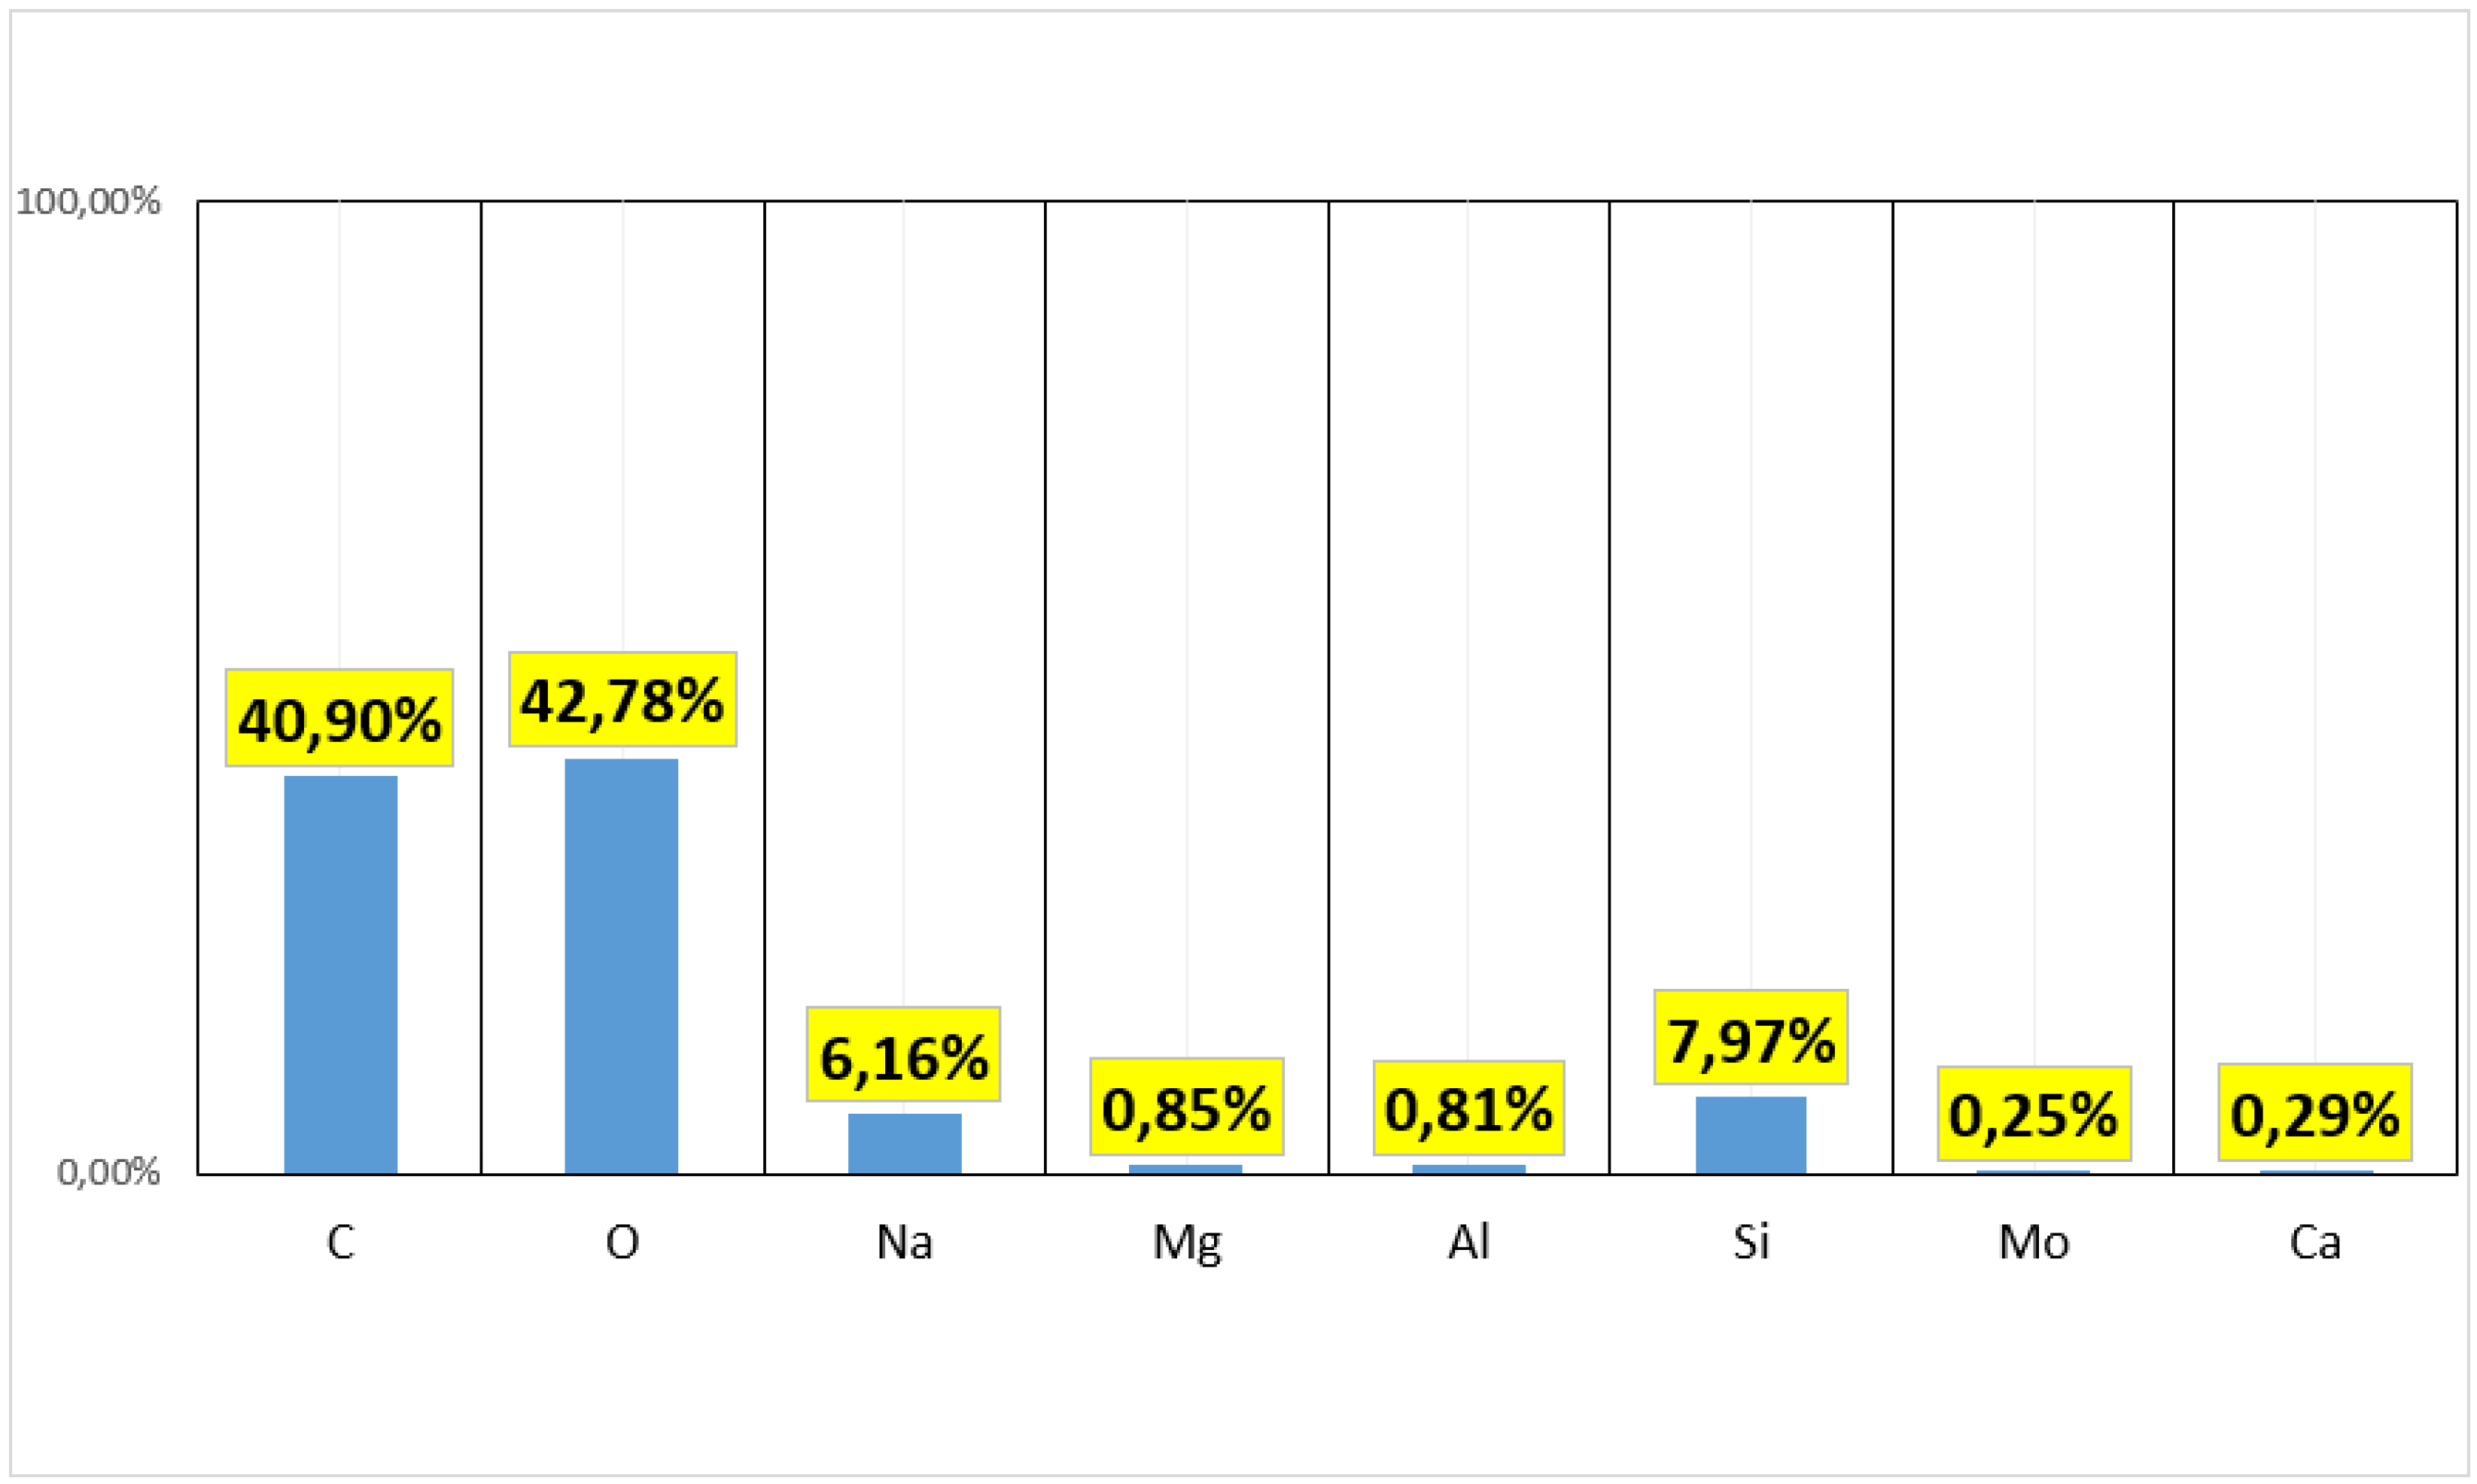
Gravimetric impactors utilize glass fiber glass filters to capture particles of varying sizes as they are drawn into the apparatus from the surrounding air. Following deposition on these filters, the particles are subjected to electron microscope analysis. Analysis of the samples has revealed the presence of various chemical elements, including O, C, Na, Mg, Al, Si, Mo, Ca, and Fe, each present in different proportions. The ratio of each element found on the filter of PM2.5 is shown in Figure 6.
Figure 6.
Percentage of each chemical element present in the analyzed PM2.5 filter.
In comparison, PM10 filter deposited all elements present on the PM2.5 filter, with an inclusion of Fe percentage as shown in Figure 7.
Figure 7.
Percentage of each chemical element present in the analyzed PM10 filter.
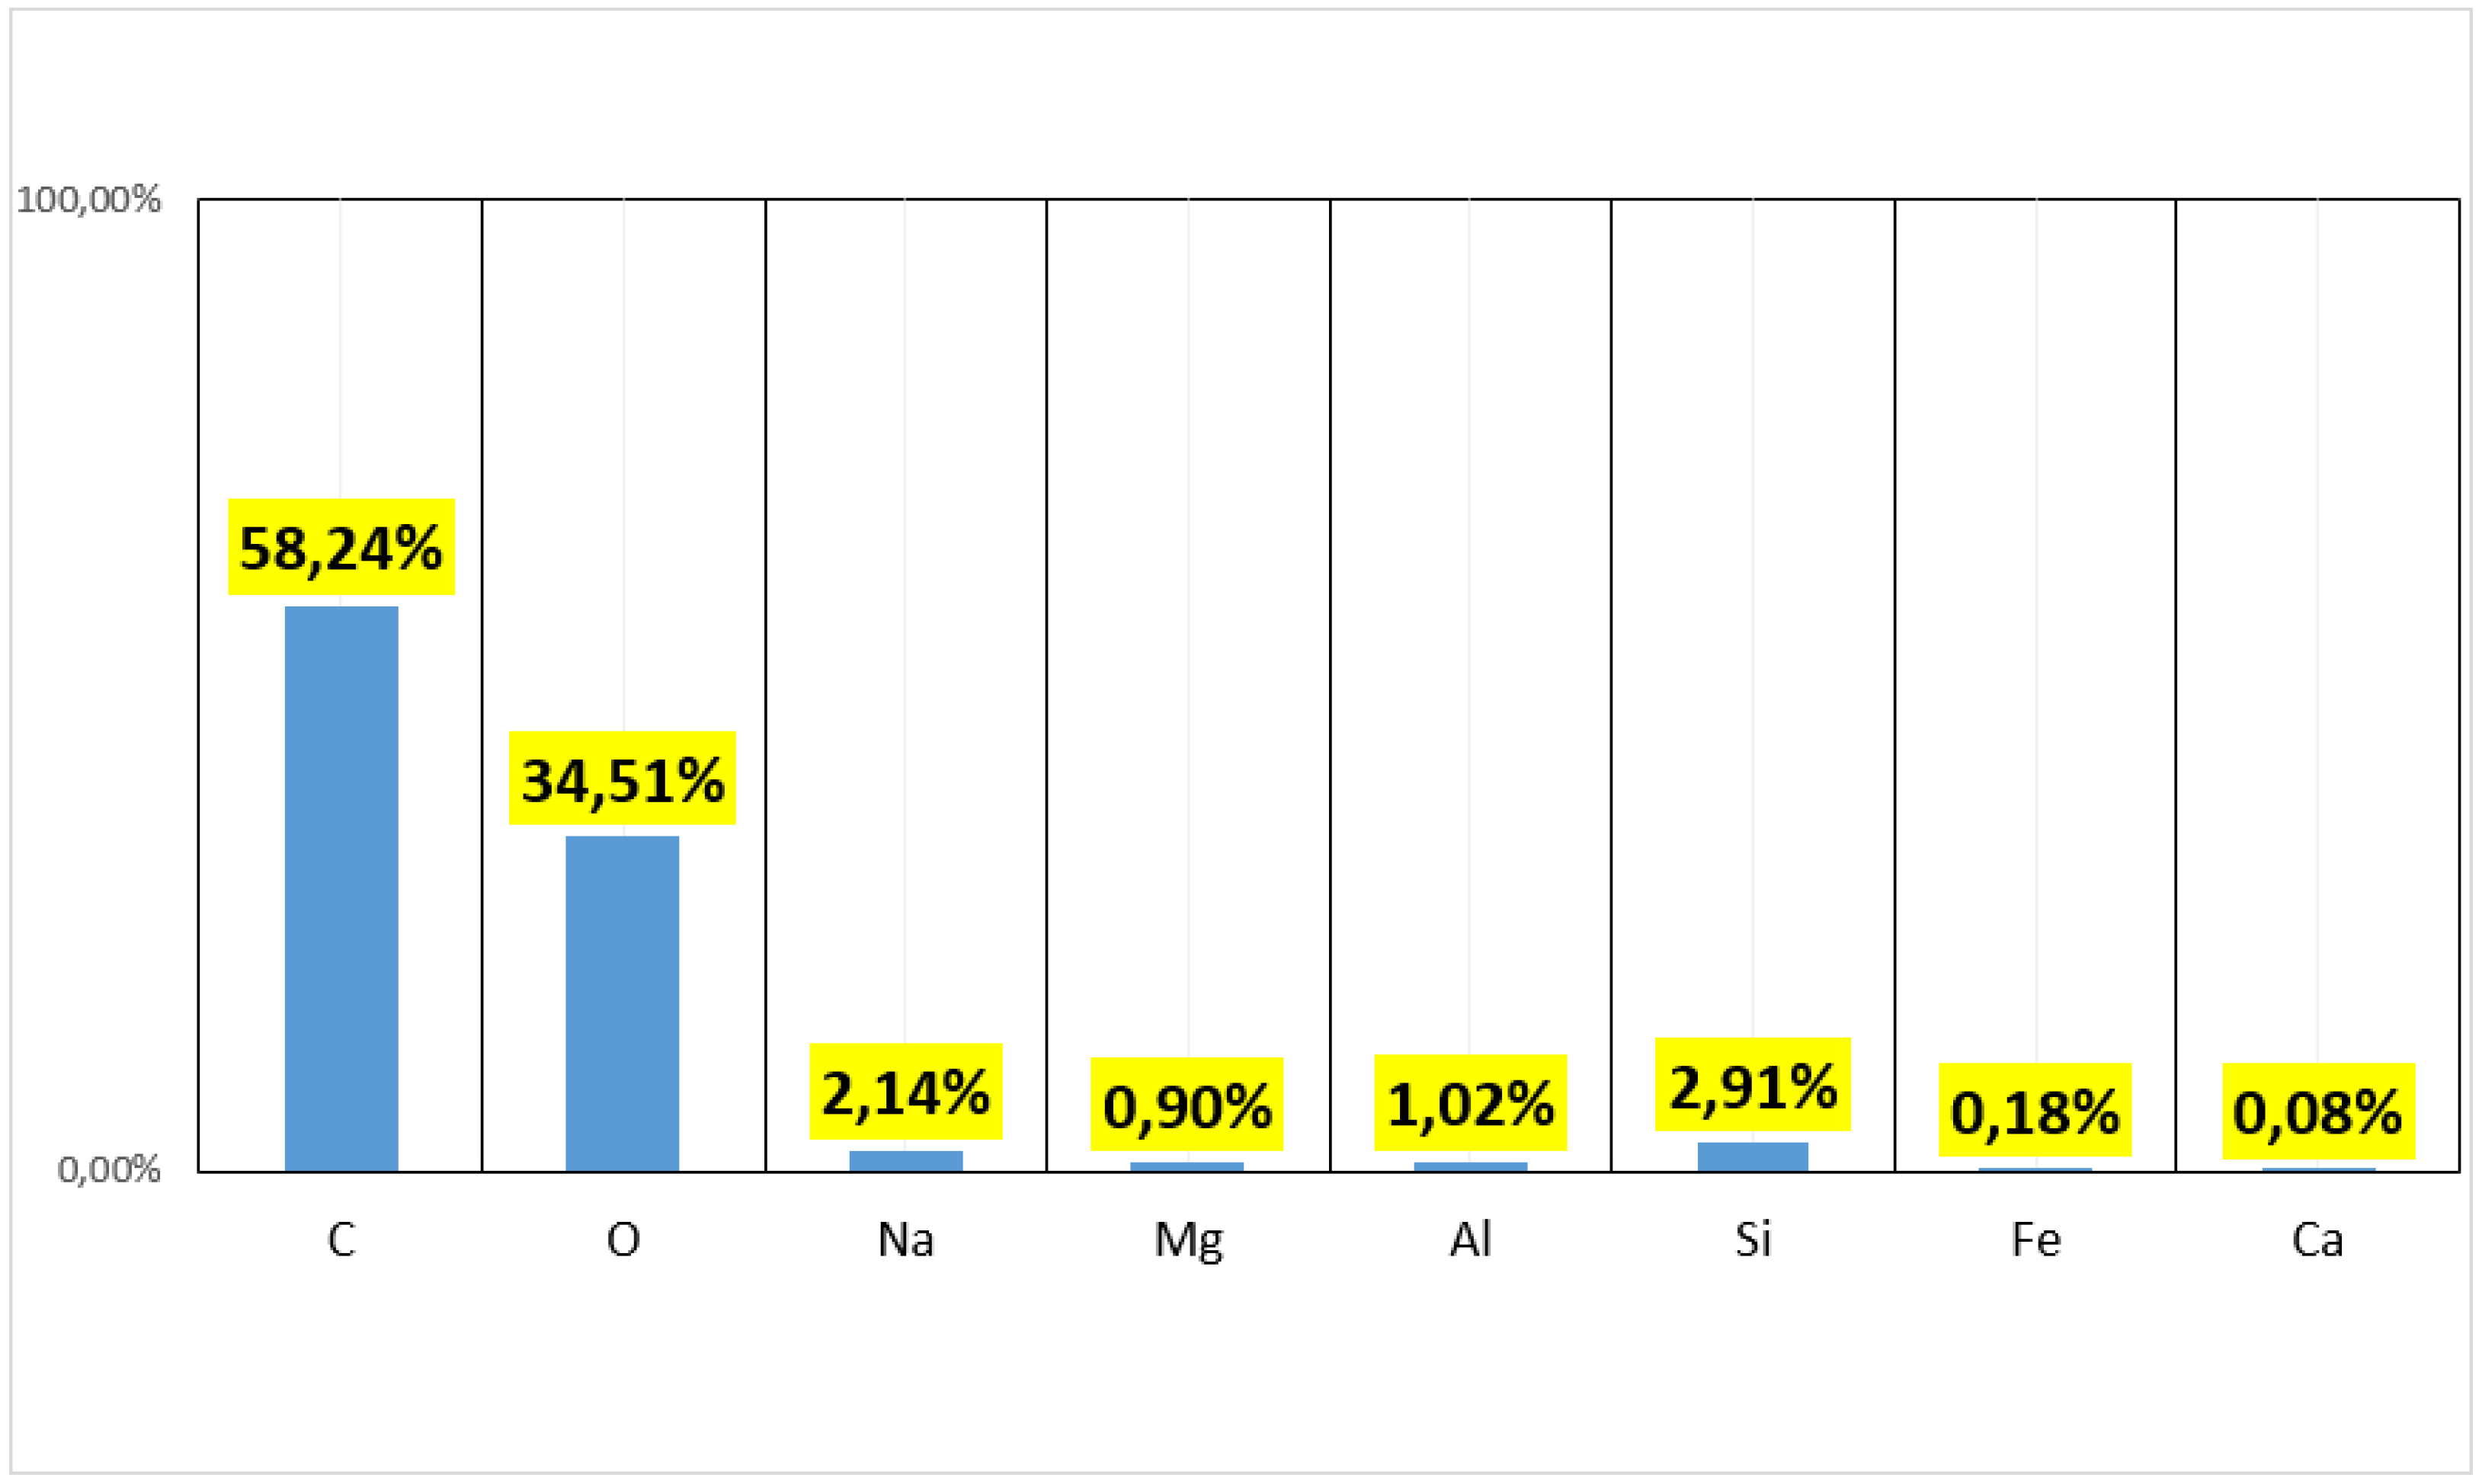
Carbon is the most prevalent chemical compound in both PM2.5 and PM10 samples, together with Oxygen, as a result of burning fuel from the internal combustion process. In terms of concentrations, Carbon shows a smaller percentage in PM2.5 than in PM10 samples, due to the size of the particles, PM10 is able to catch bigger particle sizes. In regards of metals, it can be recognized that Iron (Fe) is present only in the PM10 samples compared to Molybdenum (Mo) with presence only in PM2.5 samples.
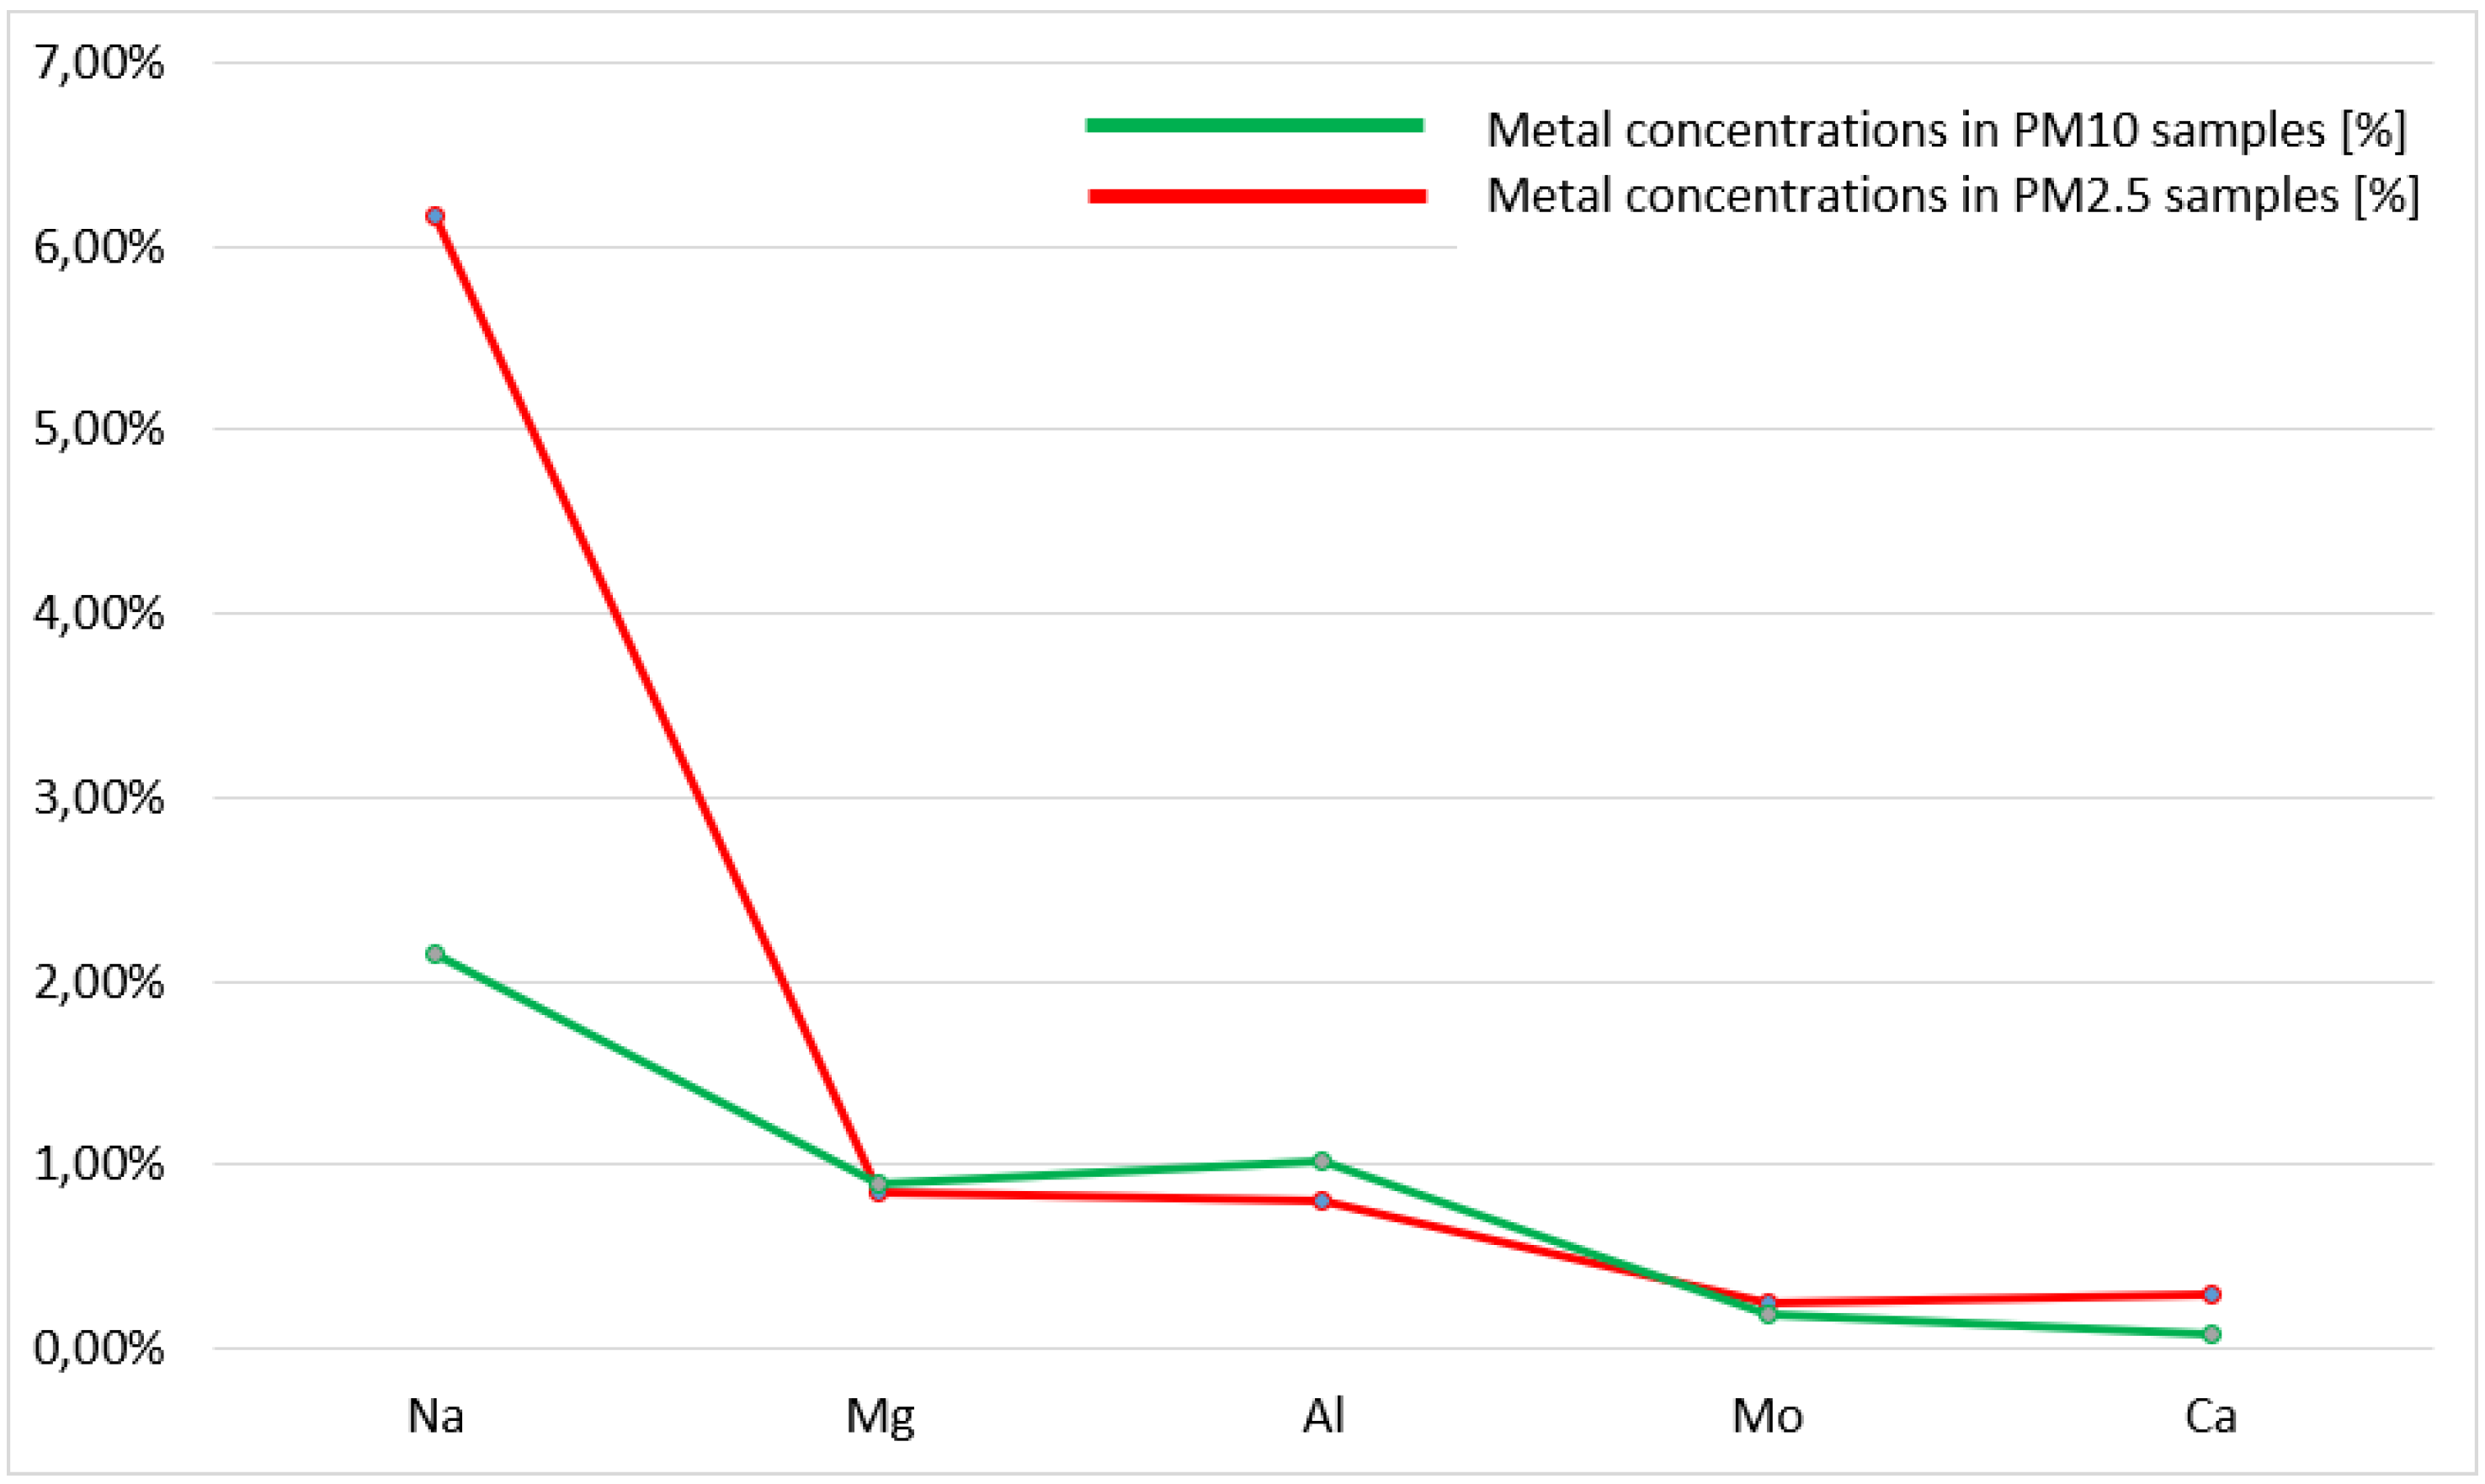
Having a closer look at the metal particles in comparison between the different sized PM samples (PM2.5 versus PM10), Sodium (Na) is showing a higher difference of concentration between PM2.5 and PM10, with a higher presence in PM2.5 samples. The rest of the metal particles like Magnesium (Mg), Aluminum (Al), Fe and Calcium (Ca) are showing smaller differences in concentrations between the PM sample sizes. A graphical representation of the different concentrations of metal particles in PM2.5 and PM10 samples are shown in Figure 8.
Figure 8.
Percentage of metals from PM2.5 and PM10 samples.
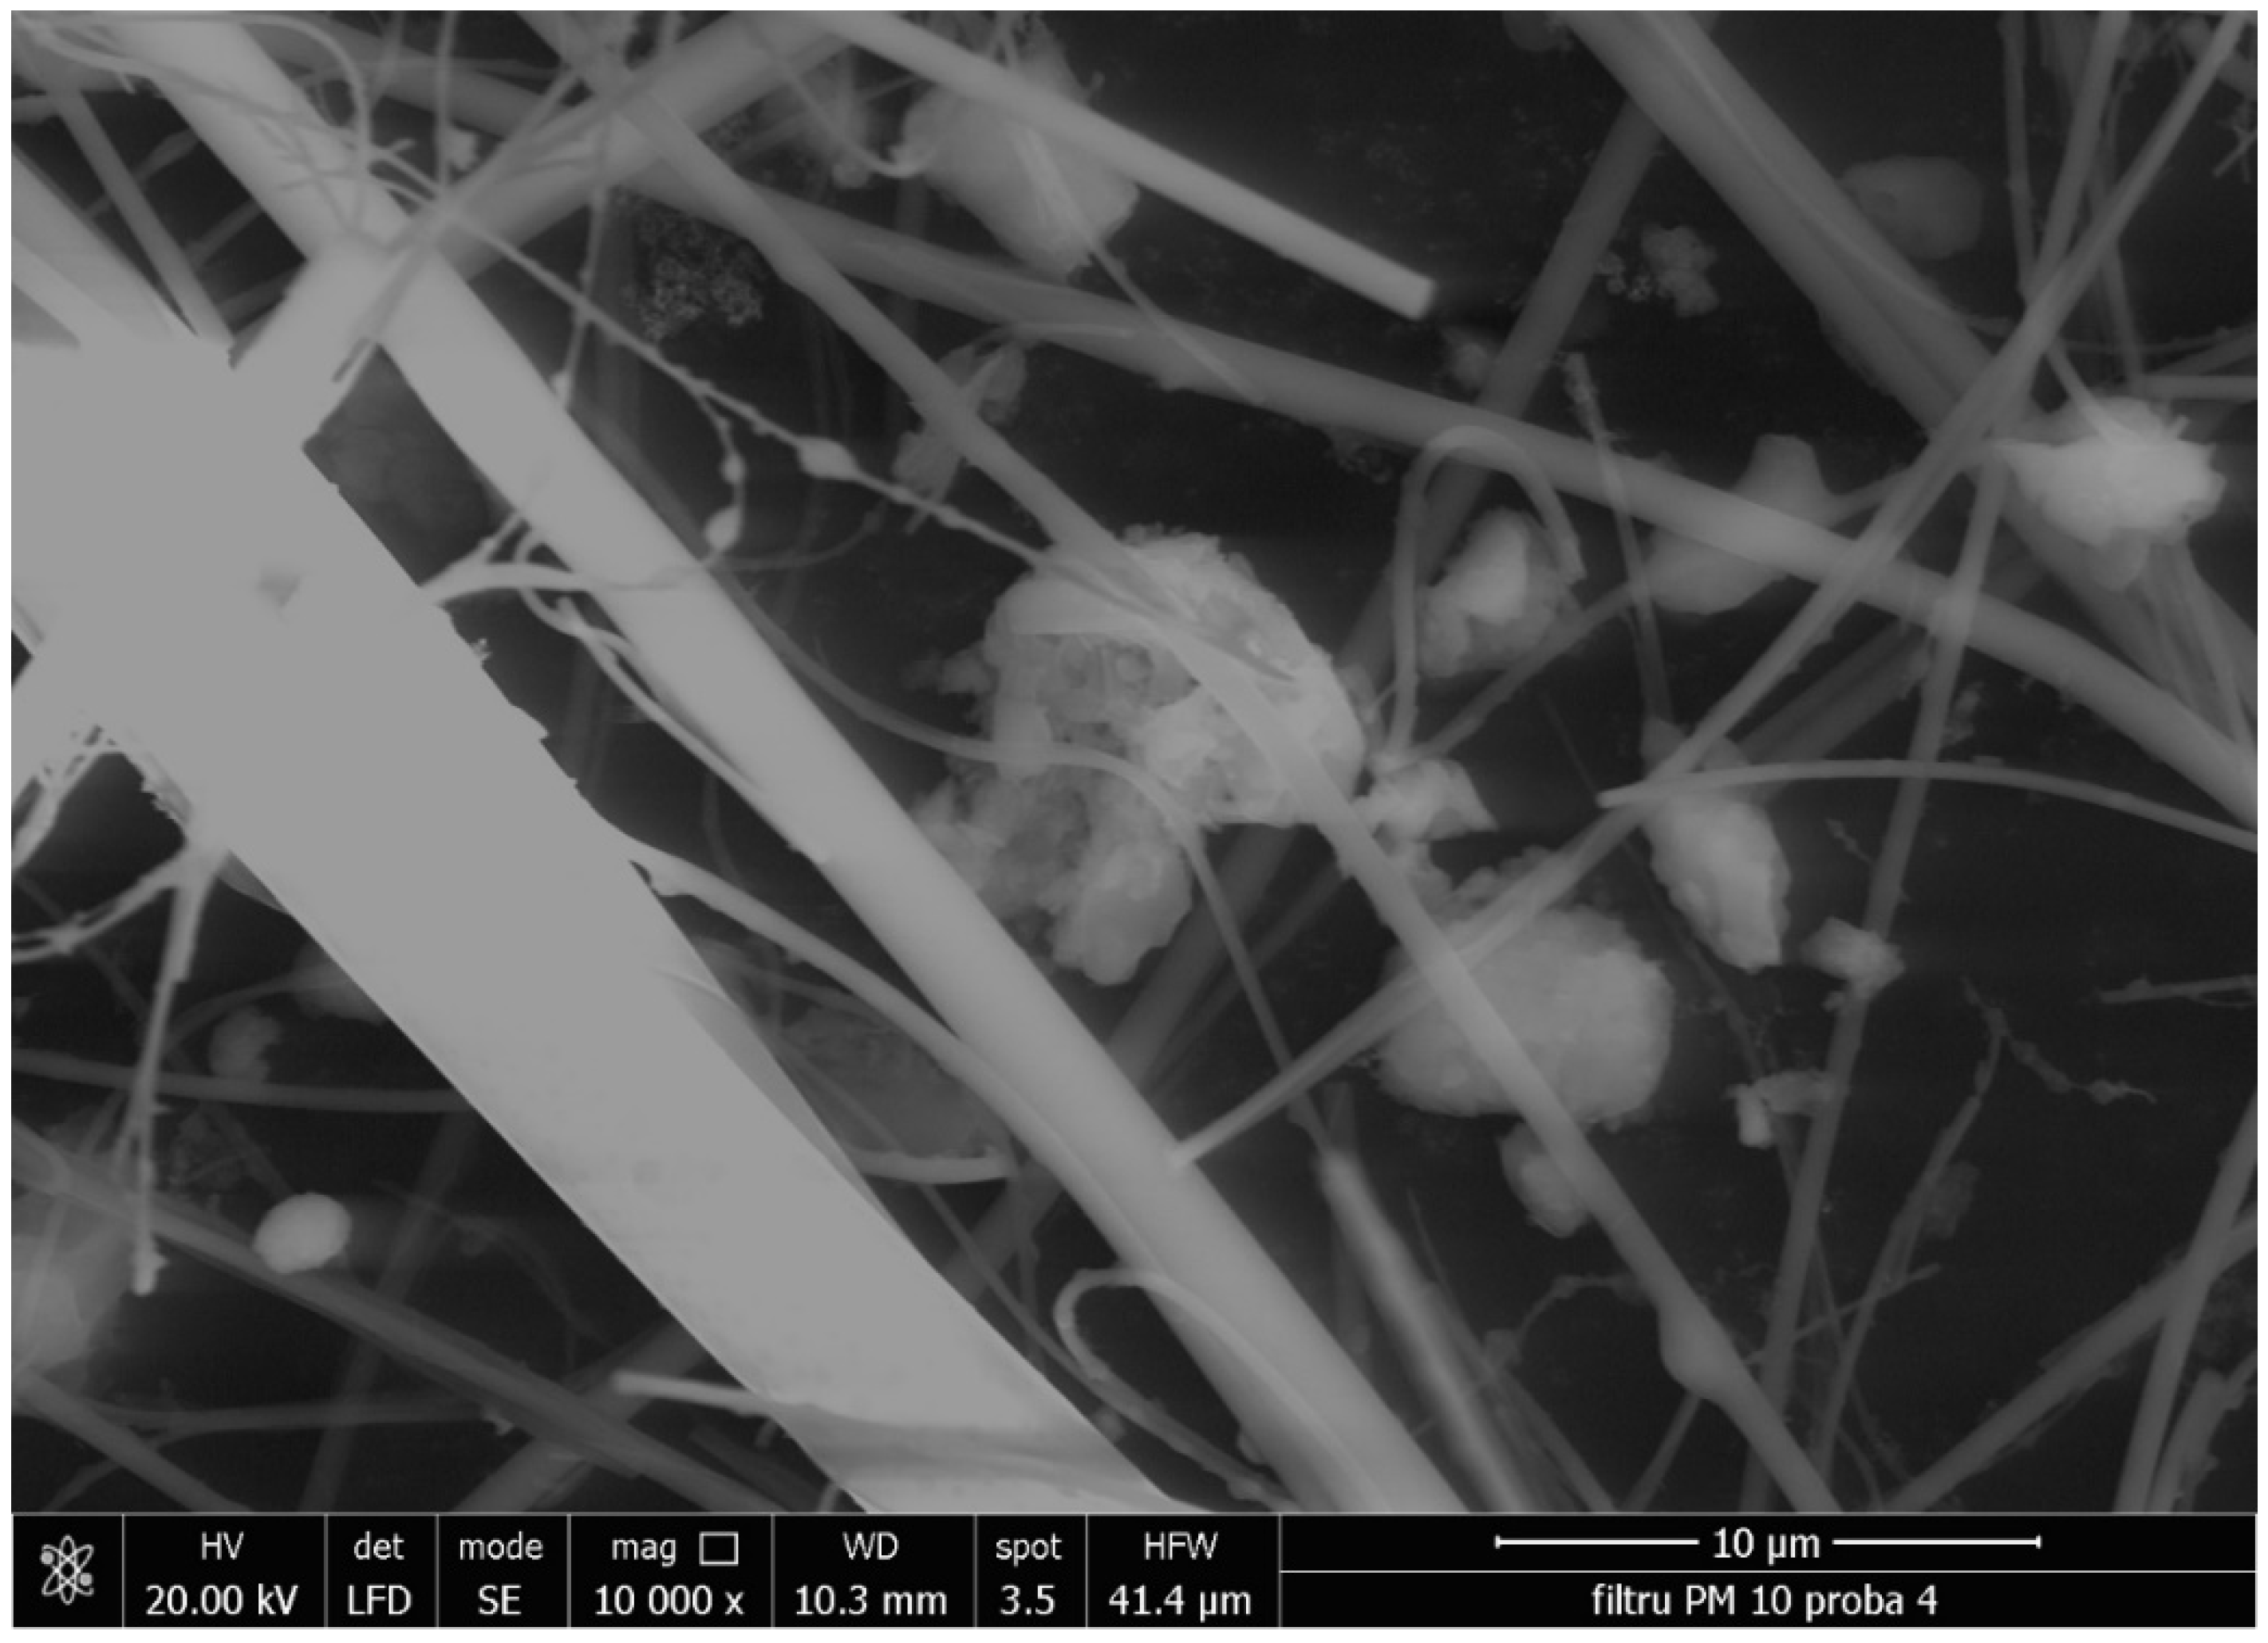
An image from the microscopic analysis is presented in Figure 9, where it can be recognized the size and shape of different particles how they are deposited on the filter fibers. A section of the fiber glass filter was used under microscope to visualize the dust particles at a 10,000 times magnification which shows different sized particles below 10 µm.
Figure 9.
Magnified view of dust particles caught between the glass fibers of the filters (extract from PM10 filter).
Figure 9.
Magnified view of dust particles caught between the glass fibers of the filters (extract from PM10 filter).
4. Discussion
Under Romanian Law, the annual limit for PM10 concentration is set at 40 µg/Nm3, with a daily limit of 50 µg/Nm3 that cannot be exceeded for more than 35 days within a given year. However, neither Romanian nor European Union laws specify any limits for PM2.5 or PM1.0 concentrations [36].
Comparing the data obtained during the 23-day episode using gravimetric impactors with that obtained during the 1-day parallel measurement using both gravimetric impactors and a spectrometer, it is evident that PM10 concentrations exceeded the daily limit of 50 µg/Nm3 on 13 out of the 23 days. While these falls short of the annual limit of 35 days, it is worth noting that exceeding the limit on 13 out of 23 days suggests that the limit is likely to be breached in the longer term, thereby contravening relevant legislation. Although current legislation does not address PM2.5 and PM1.0 concentrations, these particles are known to pose a greater threat to human health than PM10, as explained in the article. Therefore, it is essential to consider these finer particulate matter sizes when assessing air quality and associated health risks, even if they are not explicitly regulated by existing laws.
With regard to the chemical analysis conducted on PM filters, it is evident that carbon emerges as the prevailing chemical element in terms of abundance. This outcome is to be anticipated, considering carbon's role as a byproduct of the combustion processes inherent in internal combustion engines. Hence, the observed proportion of carbon is in line with expectations.
5. Conclusions
The purpose of this study is to show the concentrations of PM near a highly trafficked road section. The novelty of this research lies in the utilization of two distinct measurement methodologies to ascertain the levels of particle concentrations. The authors, drawing upon their experiential insights, deem the incorporation of complementary measurement devices and methods as highly significant in this context.
The research concludes the presence of particulate matter in dangerous concentrations, which according to medical literature pose a threat on human life and the environment. Particulate matter samples collected using gravimetric impactors possess a distinct advantage in their applicability to microscopic analysis for identifying chemical compounds, such as metals. The measurement methodology employed by gravimetric impactors involves the deposition of particles onto filters, facilitating their subsequent examination under a microscope to determine their chemical composition. On the other hand, spectrometers do not deposit the particulate matter onto surfaces and, as a consequence, lack the capability to directly detect the chemical composition of the captured particles. However, spectrometers offer notable benefits, including the ability to measure concentrations of inhalable, thoracic, and alveolar particles by leveraging their respective size ranges. The research study, characterized by its inherent complexity, has yielded valuable insights not only in the determination of concentrations of particulate matter (PM) near a high traffic intensity area but also in the realm of human health effects associated with particulate pollution. By employing multiple measurement methods and meticulously analysing the obtained data, this study has provided a comprehensive understanding of the intricate relationship between PM concentrations and their potential impacts on human well-being. By addressing both the determination of PM concentrations and their impact on human health, this research study provides a comprehensive framework for understanding the multifaceted nature of particulate pollution. These insights contribute to the broader field of environmental health, assisting policymakers and public health professionals in formulating effective strategies to mitigate the adverse effects of particulate pollution and safeguard human well-being in areas characterized by high traffic intensity.
Author Contributions
Conceptualization, D.M. Mustata; methodology, D. Bisorca; software, C. Dughir; validation, I. Ionel; formal analysis, I. Ionel; investigation, R.M. Popa; resources, UPT LACIEDIN laboratories (www.mediu.ro); writing—original draft preparation, D.M. Mustata.; writing—review and editing, I. Ionel.; All authors have read and agreed to the published version of the manuscript.”
Acknowledgments
The primary author wishes to convey heartfelt appreciation to Diana Raluca Streinu, M.D., whose invaluable expertise in the field of medical sciences has played an instrumental role in enriching this work. The author extends profound gratitude for Dr. Streinu's remarkable support and enduring dedication to the advancement of medical knowledge.
Conflicts of Interest
The authors declare no conflict of interest. The funders had no role in the design of the study; in the collection, analyses, or interpretation of data; in the writing of the manuscript; or in the decision to publish the results.
References
- Guerreiro, C.; Gonzalez Ortiz, A.; de Leeuw, F. Air quality in Europe – 2017 report. Eur. Environ. Agency 2017, 13/2017, 11-12. [CrossRef]
- Metcalfe, S.; Derwent, D. Atmospheric Pollution and Environmental Change, 1st ed.; Hodder Arnold: London, Great Britain, 2005; pp. 84–85. [Google Scholar]
- Zaheer, J.; Jeon, J.; Lee, S.B.; Kim, J.S. Effect of Particulate Matter on Human Health, Prevention, and Imaging Using PET or SPECT. Progress in Medical Physics 2018, 29(3), 81–91. [Google Scholar] [CrossRef]
- EPA. Available online: https://www.epa.gov/co-pollution/basic-information-about-carbon-monoxide-co-outdoor-air-pollution#Effects (accessed on 24 April 2023).
- EPA. Available online: https://www.epa.gov/no2-pollution/basic-information-about-no2#Effects (accessed on 24 April 2023).
- Valavanidis, A. Airborne particulate matter and human health: Toxicological assessment and importance of size and composition of particles for oxidative damage and carcinogenic mechanisms. Journal of Environmental Science and Health, Part C 2008, 26(4), 339–362. [Google Scholar] [CrossRef] [PubMed]
- Scott Weichenthal et al. How low can you go? Air pollution affects mortality at very low levels. Sci. Adv. 2022, 8(39). [CrossRef]
- Valavanidis, A.; Vlachogianni, T.; Fiotakis, K.; Loridas, S. Pulmonary oxidative stress, inflammation and cancer: respirable particulate matter, fibrous dusts and ozone as major causes of lung carcinogenesis through reactive oxygen species mechanisms. Int J Environ Res Public Health 2013, 10(9), 3886–3907. [Google Scholar] [CrossRef] [PubMed]
- Anderson, J. O.; Thundiyil, J. G.; Stolbach, A. Clearing the air: A review of the effects of particulate matter air pollution on human health. Journal of Medical Toxicology 2021, 8(2), 166–175. [Google Scholar] [CrossRef] [PubMed]
- Kelly, F.J. Oxidative stress: its role in air pollution and adverse health effects. Occup Environ Med. 2003, 60(8), 612–616. [Google Scholar] [CrossRef] [PubMed]
- Mo, J.H. Association of Particulate Matter With ENT Diseases. Clin Exp Otorhinolaryngol. 2019, (3), 237–238. [Google Scholar] [CrossRef]
- Pénard-Morand, C.; Raherison, C.; Charpin, D.; Kopferschmitt, C.; Lavaud, F.; Caillaud, D.; Annesi-Maesano, I. Long-term exposure to close-proximity air pollution and asthma and allergies in urban children. Eur Respir J. 2010, 36(1), 33–40. [Google Scholar] [CrossRef]
- NIH. Available online: https://www.ncbi.nlm.nih.gov/books/NBK448070/#_ncbi_dlg_citbx_NBK448070 (accessed on 06 June 2023).
- Joo, Y.H.; Lee, S.S.; Han, K.D.; Park, K.H. Association between Chronic Laryngitis and Particulate Matter Based on the Korea National Health and Nutrition Examination Survey 2008-2012. PLoS One 2015, 10(7). [Google Scholar] [CrossRef]
- Wang, J.; Lin, C.; Chu, Y.; et al. Association between long-term exposure to air pollution and the risk of incident laryngeal cancer: a longitudinal UK Biobank-based study. Environ Sci Pollut Res, 2023, 30, 58295–58303. [Google Scholar] [CrossRef]
- Mandell, J.T.; Idarraga, M.; Kumar, N.; Galor, A. Impact of Air Pollution and Weather on Dry Eye. J Clin Med 2020, 9(11), 3740. [Google Scholar] [CrossRef] [PubMed]
- Mayo Clinic. (Accessed on 06 June 2023). Available online: https://www.mayoclinic.org/diseases-conditions/dry-eyes/symptoms-causes/syc-20371863.
- Donaldson, K.; Beswick, P.H.; Gilmour, P.S. Free radical activity associated with the surface of particles: a unifying factor in determining biological activity? Toxicol Lett 1996, 88(1-3), 293–298. [Google Scholar] [CrossRef] [PubMed]
- NIH. Available online: https://pubmed.ncbi.nlm.nih.gov/22096348/ (accessed on 06 June 2023).
- Wynn, TA. Cellular and molecular mechanisms of fibrosis. J Pathol. 2008, 4(2), 199–210. [Google Scholar] [CrossRef]
- Luo, J.; Liu, H.; Hua, S.; Song, L. The Correlation of PM2.5 Exposure with Acute Attack and Steroid Sensitivity in Asthma. Biomed Res Int 2022, 2022. [Google Scholar] [CrossRef] [PubMed]
- Moreno-Rios, A.L.; Tejeda-Benitez, L.P.; Bustillo-Lecompte, C.F. Sources, characteristics, toxicity, and control of ultrafine particles: An overview. Geoscience Frontiers 2022, 13(1). [Google Scholar] [CrossRef]
- Shi, L.; Zhu, Q.; Wang, Y.; Liu, P. Incident dementia and long-term exposure to constituents of fine particle air pollution: A national cohort study in the United States. 2022, 120(1). [CrossRef]
- Schrafnagel, D.E. The health effects of ultrafine particles. 2020, 52, 311-317. [CrossRef]
- Li, Y. Association of long-term near-highway exposure to ultrafine particles with cardiovascular diseases, diabetes and hypertension. Int. J. Environ. Res. Public Health 2017, 14(5), 461. [Google Scholar] [CrossRef]
- Agrawaal, H.; Jones, C.; Thompson, J.E. Personal Exposure Estimates via Portable and Wireless Sensing and Reporting of Particulate Pollution. J. Environ. Res. Public Health 2020, 17(3), 843. [Google Scholar] [CrossRef]
- Yu, N.; Shu, S. ; Lin, Y; She, J.; Ip, H.S.S.; Qiu, X; Zhu, Y.. High efficiency cabin air filter in vehicles reduces drivers’ roadway particulate matter exposures and associated lipid peroxidation. PLoS ONE 2017, 12(11). [Google Scholar] [CrossRef]
- Kumar, P.; et al. In-car particulate matter exposure across ten global cities. Science of The Total Environment 2021, 750. [Google Scholar] [CrossRef]
- Khan, S.H.; Yousaf, M.H.; Murtaza, F.; Velastin, S. PASSENGER DETECTION AND COUNTING FOR PUBLIC TRANSPORT SYSTEM. Ned Univ. J. of Research 2020, 2, 35–46. [Google Scholar] [CrossRef]
- Mustata, D.M.; Popa, R.M.; Ionel, I.; Balogh, R.M.; Streinu, D.R. Air quality analysis on a frequently congested road section. IOP Conf. Ser.: Mater. Sci. Eng. 2022, 1220. [Google Scholar] [CrossRef]
- Horiba. (accessed on 05 may 2023). Available online: https://www.horiba.com/gbr/scientific/technologies/dynamic-light-scattering-dls-particle-size-distribution-analysis/dynamic-light-scattering-dls-particle-size-distribution-analysis/#:~:text=Particle%20size%20can%20be%20determined,elastic%20light%20scattering%20(QELS).
- Federal Highway Administration. Available online: https://www.fhwa.dot.gov/policyinformation/hpms/volumeroutes/ch5.cfm (accessed on 02 June 2023).
- UCAR. Available online: https://scied.ucar.edu/learning-zone/air-quality/how-weather-affects-air-quality (accessed on 24 April 2023).
- Air Quality. Available online: https://airquality.climate.ncsu.edu/2021/06/06/atmospheric-dispersion-and-pollution-transport/ (accessed on 24 April 2023).
- Meteo blue. Available online: https://www.meteoblue.com/ro/vreme/archive/export/dumbr%c4%83vi%c8%9ba_rom%c3%a2nia_678688?fcstlength=1m&year=2022&month=9 (accessed on 24 April 2023).
- Romanian Law no. 104 from 15 June 2011 in relation to air quality (original in Romanian: LEGE nr. 104 din 15 iunie 2011 privind calitatea aerului înconjurător) Parliament of Romania http://legislatie.just.ro/Public/DetaliiDocument/129642.
Disclaimer/Publisher’s Note: The statements, opinions and data contained in all publications are solely those of the individual author(s) and contributor(s) and not of MDPI and/or the editor(s). MDPI and/or the editor(s) disclaim responsibility for any injury to people or property resulting from any ideas, methods, instructions or products referred to in the content. |
© 2023 by the authors. Licensee MDPI, Basel, Switzerland. This article is an open access article distributed under the terms and conditions of the Creative Commons Attribution (CC BY) license (http://creativecommons.org/licenses/by/4.0/).
Copyright: This open access article is published under a Creative Commons CC BY 4.0 license, which permit the free download, distribution, and reuse, provided that the author and preprint are cited in any reuse.


