
Submitted:
28 June 2023
Posted:
29 June 2023
You are already at the latest version
Abstract
Dysfunction of the retinal pigment epithelium (RPE) is associated with several diseases characterized by retinal degeneration, such as diabetic retinopathy (DR). However, it has recently been proposed that outer retinal neurons also participate in the damage triggering. Therefore, we have evaluated possible crosstalk between RPE and photoreceptors in priming and maintaining oxi-dative damage of the RPE. For this purpose, we used ARPE-19 cells as a model of human RPE, grown in normal (NG, 5.6 mM) or high glucose (HG, 25 mM), and unoxidized (UOx) or oxidized (Ox) mammalian retinal rod outer segments (OS). ARPE-19 cells were efficient at phagocytizing rod OS in both NG and HG settings. However, in HG, ARPE-19 cells treated with Ox-rod OS accumulated MDA and lipofuscins and displayed altered LC3, GRP78, and Caspase 8 expression, compared to untreated and UOx-rod OS-treated cells. Data suggest that early oxidative damage may originate from the photoreceptors and subsequently extend to the RPE, providing a new perspective to the idea that retinal degeneration depends solely on a redox alteration of the RPE.
Keywords:
retinal pigmented epithelium
; rod outer segments
; aerobic metabolism
; oxidative stress
; lipofuscin
; antioxidants
; diabetic retinopathy
; hyperglycemia.
1. Introduction
The retinal pigment epithelium (RPE) of polarised, melanosome-rich epithelial cells is located between the retinal photoreceptor layer and Bruch’s membrane, next to the choroid [1]. RPE impairment is linked to the development of degenerative retinal diseases such as diabetic retinopathy (DR) [2,3] and age-related macular degeneration (AMD) [4], both leading causes of blindness [2]. The interaction of the photoreceptors with the RPE, the Bruch’s membrane, and the choroid regulates the renewal of 11-cis retinal and the outer segment (OS) of photoreceptor, the exchange of substances between the neural retina and the circulation and forms the outer blood-retinal barrier (OBRB) [5,6,7]. Rods represent most parts of the mammalian retina and the human parafovea [8]. The rod OS is a modified cilium involved in visual signal transduction [9]. In particular, the OS contains about 2,000 stacked membranous disks that undergo a process of continuous renewal regulated by light [10]. While RPE continually phagocytes the OS tip disks, new disks are formed at the cilium base [11]. OS phagocytosis involves αvβ5 integrin receptors, focal adhesion kinase (FAK), and Mer tyrosine kinase (MerTK) [12,13,14]. The disk formation, still incompletely understood, involves the synthesis of basal membrane evaginating next to the cilium to form sacs and the incorporation of disk proteins synthesized in the inner segment via intraflagellar transport proteins (IFT) [15,16]. Disk shedding has been proposed to also serve as an antioxidant system to ease the oxidative burden of the retina, typically restricted to the outer part [11]. The retina is vulnerable to oxidative stress due to its high oxygen (O2) consumption [17] and metabolic rates [18], and content of polyunsaturated fatty acids (PUFAs) [19]. Oxidative stress, a condition arising from an imbalance between reactive oxygen intermediates (ROI) production and scavenging [20], plays a pivotal role in the pathogenesis of retinal degenerative diseases, causing RPE and photoreceptor cell loss [3,21,22]. Apoptosis of rods, which display a preferential vulnerability over cones [8], causes, in turn, cone loss impairing high-acuity vision. In fact, rods secrete a trophic cone viability factor, identified in a truncated thioredoxin-like protein [23]. Contrary to prior belief, the onset of DR has been lately identified in oxidative damage of the neural retina that precedes retinal microvascular histological damage [24,25]. In experimental DR, the outer retina is the primary site of oxidative stress [26]. On the other hand, a spectroscopic method has localized such retinal oxidative stress at the interphase between the OS and the RPE [25], and mitochondrial dysfunction seems involved in DR onset [27]. To elucidate the pathogenesis of DR, it appears fundamental to understand the interactions between the RPE and rod OS, considering that, to sustain the energy demand of the phototransduction, the OS display their own oxidative metabolism [28,29,30,31,32], which represents a source of oxidative stress inside the OS [33,34]. As no studies have investigated this topic, the present work aims to assess whether crosstalk exists between the OS and the RPE, causing cumulative oxidative damage to the outer retina. Thus, herein, we have investigated the effect of unoxidized (UOx) or oxidized (Ox) rod OS phagocytosis on ARPE-19 cells grown in normal (NG) or high (HG) glucose conditions. The ARPE-19 cells are a spontaneously immortalized cell line of human origin, which express RPE markers and display physiologically relevant features, such as barrier formation and the ability to phagocytize rod OS [35]. ARPE-19 cells are considered an ex-vivo model of human RPE [36] used to study several pathological changes associated with DR [37]. Intracellular trafficking and oxidation markers were studied to test whether phagocytosis of Ox-rod OS could recapitulate the characteristics of RPE pathology associated with DR.
2. Materials and Methods
2.1. Cell line and culture conditions
The human cell line of retinal pigment epithelia ARPE-19 (American Type Culture Collection, Manassas, VA, USA) was grown in DMEM/F12 1:1 medium (Euroclone, Milano, Italy) supplemented with 10% fetal bovine serum and 2 mM glutamine (Euroclone, Milano, Italy) at 37°C in 5% CO2. Cells were grown to confluence, removed with trypsin-EDTA (Euroclone, Milano, Italy), seeded in multi-wells plates, and then cultured for 7-9 days in two different glucose concentrations: 5.6 mM (defined “normal” or NG, and corresponding to the standard glucose concentration at which ARPE-19 cells normally grow) and 25 mM (high, HG).
In some experiments, ARPE-19 cells were grown in the presence of outer rod segments (OS, the preparation of which is described in the next section), in amounts corresponding to 50 μg of total protein, for 5.5 hours. Subsequently, the growth medium was collected and centrifuged at 20,000xg for 5 minutes to obtain the OS fraction not phagocytosed by the rods, while the ARPE-19 cells were analyzed biochemically to study the crosstalk between the two samples.
2.2. Rod OS isolation
Rod OS have been isolated from retinas extracted from freshly enucleated bovine eyes (obtained from a local slaughterhouse) by a procedure maximizing the OS yield [38]. Briefly, under dim red light, eyecups deprived of vitreous, and lens are filled with Mammalian Ringer (0.157 M NaCl, 5 mM KCl, 7 mM Na2HPO4, 8 mM NaH2PO4, 0.5 mM MgCl2, 2 mM CaCl2 pH 6.9 plus protease inhibitor cocktail (Sigma-Aldrich, S. Louis, MO, USA) and 50 μg/ml ampicillin, for 10 min. Then floating retinas are cut free of the optic nerve. Afterward, rod OS were obtained by sucrose/Ficoll continuous gradient centrifugation in the presence of a protease inhibitor cocktail (Sigma–Aldrich, S. Louis, MO, USA) and ampicillin (50 µg/ml) as described in [39]. Before the ARPE-19 cell incubation with rod OS, part of the sample was kept in the dark while the other part was exposed to ambient light for 30 minutes. In both cases, rod OS have been supplemented with respiratory substrates (0.6 mM NADH, 20 mM succinate, and 0.1 mM ADP) to trigger their OxPhos. As shown in Supplementary Figure S1, the samples pre-treated with the substrates but kept in the dark produce ATP and consume oxygen without accumulating malondialdehyde (lipid peroxidation marker). In contrast, rod OS exposed to ambient light in the presence of the substrates display high oxygen consumption but low ATP synthesis, suggesting an OxPhos uncoupling, which favors the peroxided lipid accumulation. For these metabolic characteristics, rod OS maintained in the dark have been defined as unoxidized (UOx), and the rod OS exposed to ambient light have been called oxidized (Ox).
2.3. Oxygen consumption rate evaluation
Oxygen consumption rates (OCR) have been evaluated by means of an amperometric electrode (Unisense Microrespiration, Unisense A/S, Denmark) in a closed chamber, at 37°C. For the experiment, 2x10⁵ ARPE-19 cells were employed after resuspension in phosphate buffer saline (PBS) and permeabilization for 1 min with 0.03 mg/ml digitonin. 10 mM pyruvate plus 5 mM malate or 20 mM succinate were added to stimulate the respiratory pathways composed of Complexes I, III, and IV or Complexes II, III, and IV, respectively [40,41]. In both cases, 0.1 mM ADP was added. For rod OS, 50 μg of total protein was used, and 0.1 mM NADH and 0.1 mM ADP were employed as respiratory substrates.
2.4. Aerobic ATP synthesis evaluation
To evaluate the aerobic ATP synthesis by the F1Fo-ATP synthase (ATP Synthase) in ARPE-19 cells, 2x10⁵ cells were incubated for 10 min at 37 °C in a medium containing: 50 mM Tris-HCl (pH 7.4), 50 mM KCl, 1 mM EGTA, 2 mM MgCl2, 0.6 mM ouabain, 0.25 mM di(adenosine)-5-penta-phosphate (an adenylate kinase inhibitor), and 25 μg/mL ampicillin (0.1 mL final volume). The same respiratory substrates employed for OCR evaluation were used [41]. For rod OS, 50 μg of total protein was used, and 0.1 mM NADH was employed as respiratory substrates. In both cases, ATP synthesis was induced by 0.1 mM ADP addition. The reactions were monitored by a luminometer (GloMax® 20/20 Luminometer, Promega Italia) every 30 sec for 2 min, using the luciferin/luciferase chemiluminescent method. For calibration were used ATP standard solutions in a concentration range between 10-8 and 10-5 M (luciferin/luciferase ATP bioluminescence assay kit CLS II, Roche, Basel, Switzerland) [41]. The ratio between ATP synthesis and OCR was calculated to obtain P/O values to evaluate the OxPhos efficiency. Efficient mitochondria have a P/O value of around 2.5 or 1.5, depending on whether pyruvate/malate or succinate were used as substrates. Conversely, a lower P/O ratio indicates an uncoupled OxPhos in which part of the oxygen is not used for energy production but contributes to the formation of oxidative stress [42].
2.5. Evaluation of lipofuscin accumulation in ARPE-19 cells by confocal microscopy
To investigate the pro-oxidative effects of UOx- or Ox-rod OS phagocytosis on ARPE-19 cells, the lipofuscin accumulation was analyzed by confocal microscopy, exploiting its autofluorescence in 570-620 nm detection channel [43,44]. For this evaluation, the ARPE-19 cells were cultured onto 12 mm glass coverslips in NG or HG mediums. After the 5.5-hours treatments with rod OS, cells were washed three times with PBS and postfixed with 4% paraformaldehyde (Sigma-Aldrich, St. Louis, MO, USA; Cat# 47608) in PBS for 15 min at 25°C. Cells were washed three times with PBS and stained with DAPI. Glass coverslips were assembled on microscope glass slides. Fluorescence image (1024× 1024 × 8 bit) acquisition was performed by a Leica TCS SP2 laser-scanning confocal microscope, using the 488 line of the argon ion laser for excitation through a plan apochromatic oil immersion objective 63x (1.4 NA). Leica software package was used for image acquisition and analysis.
2.6. Lipoperoxidation evaluation
To evaluate oxidative damage, malondialdehyde (MDA) concentration was assessed using the thiobarbituric acid reactive substances (TBARS) assay. This test is based on the reaction of MDA, a breakdown product of lipid peroxides, with thiobarbituric acid (TBA). The TBARS solution contained: 26 mM thiobarbituric acid and 15% trichloroacetic acid in 0.25 N HCl. 600 μl of TBARS solution were used and 50 μg of total protein dissolved in 300 μl of Milli-Q water were added. The mix was then incubated at 95°C for 60 min. The samples were centrifuged for 2 min at 20,000 x g and the supernatants were analyzed spectrophotometrically at 532 nm [45].
2.7. Antioxidants enzymes activity evaluation
For each assay, 20 μg of total protein was employed. Catalase (CAT) activity was assayed following the decomposition of H2O2 at 240 nm, using an assay medium composed of 50 mM phosphate buffer (pH 7.0) and 5 mM H2O2 [41]. Glucose 6-phosphate dehydrogenase (G6PD) activity was assayed spectrophotometrically following the NADP reduction at 340 nm, with a solution containing: 100 mM Tris-HCl (pH 7.4), 0.5 mM NADP, and 10 mM glucose-6-phosphate [46]. Glutathione reductase (GR) activity was assayed following the oxidation of NADPH with a spectrophotometric analysis at 340 nm. The assay solution contained: 100 mM Tris-HCl (pH 7.4), 1 mM EDTA, 5 mM GSSH, and 0.2 mM NADPH [47]. Glutathione peroxidase (GPx) activity was assayed following the decomposition of H2O2 at 240 nm, using an assay solution containing 100 mM Tris-HCl (pH 7.4), 5 mM H2O2, and 5 mM GSH. Since H2O2 is also a substrate of catalases, GPx activity is obtained by subtracting the result of this assay from the catalase activity values [41].
2.8. Western Blot analysis
To assess the expression of LC3, an autophagy marker; GRP78, an unfolding protein response (UPR) marker; and caspase 8, an apoptosis marker, 30 μg of proteins were loaded for each sample to perform denaturing electrophoresis (SDS-PAGE) on 4-20% gradient gels (BioRad, Hercules, CA, USA). The primary antibodies used: anti-LC3 (Novus, Centennial, CO, USA; #NB100-2220), anti-GRP78 (Santa Cruz Biotechnology, Dallas, TX, USA; #sc-1050), anti-Caspase 8 (Cell Signaling, Danvers, MA, USA; #9746), and anti-Actin (Santa Cruz Biotechnology, Dallas, TX, USA #sc-1616), used as housekeeping protein. All primary antibodies were diluted 1:1,000 in PBS plus 0.15% tween (PBSt). Specific secondary antibodies were employed (Sigma-Aldrich, St. Louis, MO, USA), all diluted 1:10,000 in PBSt. To evaluate the amount of rod OS phagocytosed by ARPE-19 cells, the expression of rhodopsin (the most abundant protein in rod OS) was quantified in the no-phagocytosed rod OS fraction collected from the growth medium after 5.5 hours of incubation with ARPE-19 cells. The primary antibody against Rhodopsin (Sigma-Aldrich, St Louis, MO, USA; #R5403) was diluted 1:5,000 in PBSt. A specific secondary antibody was employed (Sigma-Aldrich, St. Louis, MO, USA), diluted 1:10,000 in PBSt. All bands observed were detected and analyzed for optical density using an enhanced chemiluminescence substrate (ECL, BioRad, Hercules, CA, USA), a chemiluminescence system (Alliance 6.7 WL 20M, UVITEC, Cambridge, UK), and UV1D software (UVITEC, Cambridge, UK).
2.9. Statistical Analysis
Results are representative of at least 3 independent experiments. All data were analyzed with GraphPad Prism 8.0 software (GraphPad Software, San Diego, CA, USA). Data were expressed as the mean ± SD and then analyzed using one-way ANOVA followed by Tukey's multiple comparison test. Differences were considered statistically significant if the error probability was p < 0.05.
3. Results
Following the hypothesis that the oxidative stress arising in the rod OS after impairment of its respiratory activity due to overwork is involved in the neuronal damage representing the first event in DR pathogenesis, two experimental groups were compared, consisting of ARPE-19 cells grown either in NG or HG medium, treated for 5.5 h with rod OS maintained in the dark (unoxidized, UOx) or exposed to ambient light in the presence of metabolic substrates and ADP (oxidized, Ox) (for more details see section 2.2 of Materials and Methods). Untreated ARPE-19 cells were used as controls.
3.1. ARPE-19 cells increase the aerobic energy metabolism proportionally to glucose concentration without causing an increase in oxidative damage due to the activation of endogenous antioxidant defenses.
The oxygen consumption rate (OCR), ATP synthesis by F1Fo-ATP synthase, and the relative P/O ratio are evaluated employing pyruvate plus malate or succinate as respiratory substrates to assess changes in the energy metabolism of ARPE-19 cells in NG (5.6 mM) or HG (25 mM) conditions. Increased glucose availability causes a rise in oxygen consumption (Figure 1A) and ATP synthesis (Figure 1B) in the presence of both pyruvate/malate and succinate as respiratory substrates. Interestingly, the evaluation of OxPhos efficiency, in terms of P/O ratio, remains similar under both glucose concentrations (Figure 1C), suggesting that the raising in mitochondrial function does not uncouple respiration and energy production.
OxPhos activity is always associated with ROI production [48,49], leading to increased oxidative damage [50,51]. Nonetheless, ARPE-19 cells grown in HG do not display an increased lipid peroxidation accumulation compared to cells grown in NG glucose, as shown by the similar MDA content (Figure 2A). The absence of additional oxidative damage probably depends on the increased activity of CAT, G6PD, GR, and GPx (Figure 2B-E), enzymes involved in cellular antioxidant defenses.
3.2. The phagocytizing capacity of ARPE-19 cells depends on the glucose concentration in the medium and the rod outer-segments oxidative state.
The rhodopsin quantity was evaluated in the growth medium after the ARPE-19 cells incubation with UOx- or Ox-rod OS (Figure 3) for 5.5 hours to verify whether ARPE-19 cells retained the phagocytic capacity. Data show that the rhodopsin concentration in the medium of ARPE-19 cells grown in NG after incubation with UOx-rod OS is significantly lower than in the suspension of rod OS supplied to the cells, suggesting that the ARPE-19 cells have partly phagocytosed them. This ability further increases when the cells are grown in an HG medium. However, the ARPE-19 phagocytizing capability appears lower when cells are incubated with Ox-rod OS. This difference could depend on lipid peroxidation accumulation occurring when the OS are exposed to ambient light in the presence of energy substrates and ADP. This, in turn, causes OxPhos uncoupling, as previously demonstrated [52] and shown in Supplementary Figure S1.
3.3. The altered ARPE-19 cells phagocytosis capacity depends on the accumulation of oxidative stress.
To understand the effects of UOx- or Ox-rod OS phagocytosis on ARPE-19 cells, the cellular accumulation of lipofuscin, an oxidative stress marker ([48]), has been assessed by confocal microscopy (Figure 4), taking advantage of the auto-fluorescence features of this byproduct of the cellular metabolism. Data show low lipofuscin levels in cells grown without rod OS addition in the presence of both NG and HG mediums, confirming that when ARPE-19 cells are not challenged with rod OS, the glucose availability does not cause an increased oxidative damage accumulation. In contrast, when ARPE-19 cells are incubated with UOx-rod OS, an increment in the lipofuscin concentration has been observed, especially in cells grown in the HG medium, suggesting that the activation of processes related to phagocytosis unmasks the increased risk of oxidative stress linked to the enhanced OxPhos functionality observed in the presence of high glucose concentration. However, the most evident lipofuscin accumulation is visible in ARPE-19 cells incubated with Ox-rod OS, suggesting that the cells' oxidative state is influenced by the nature of phagocytosed rod OS.
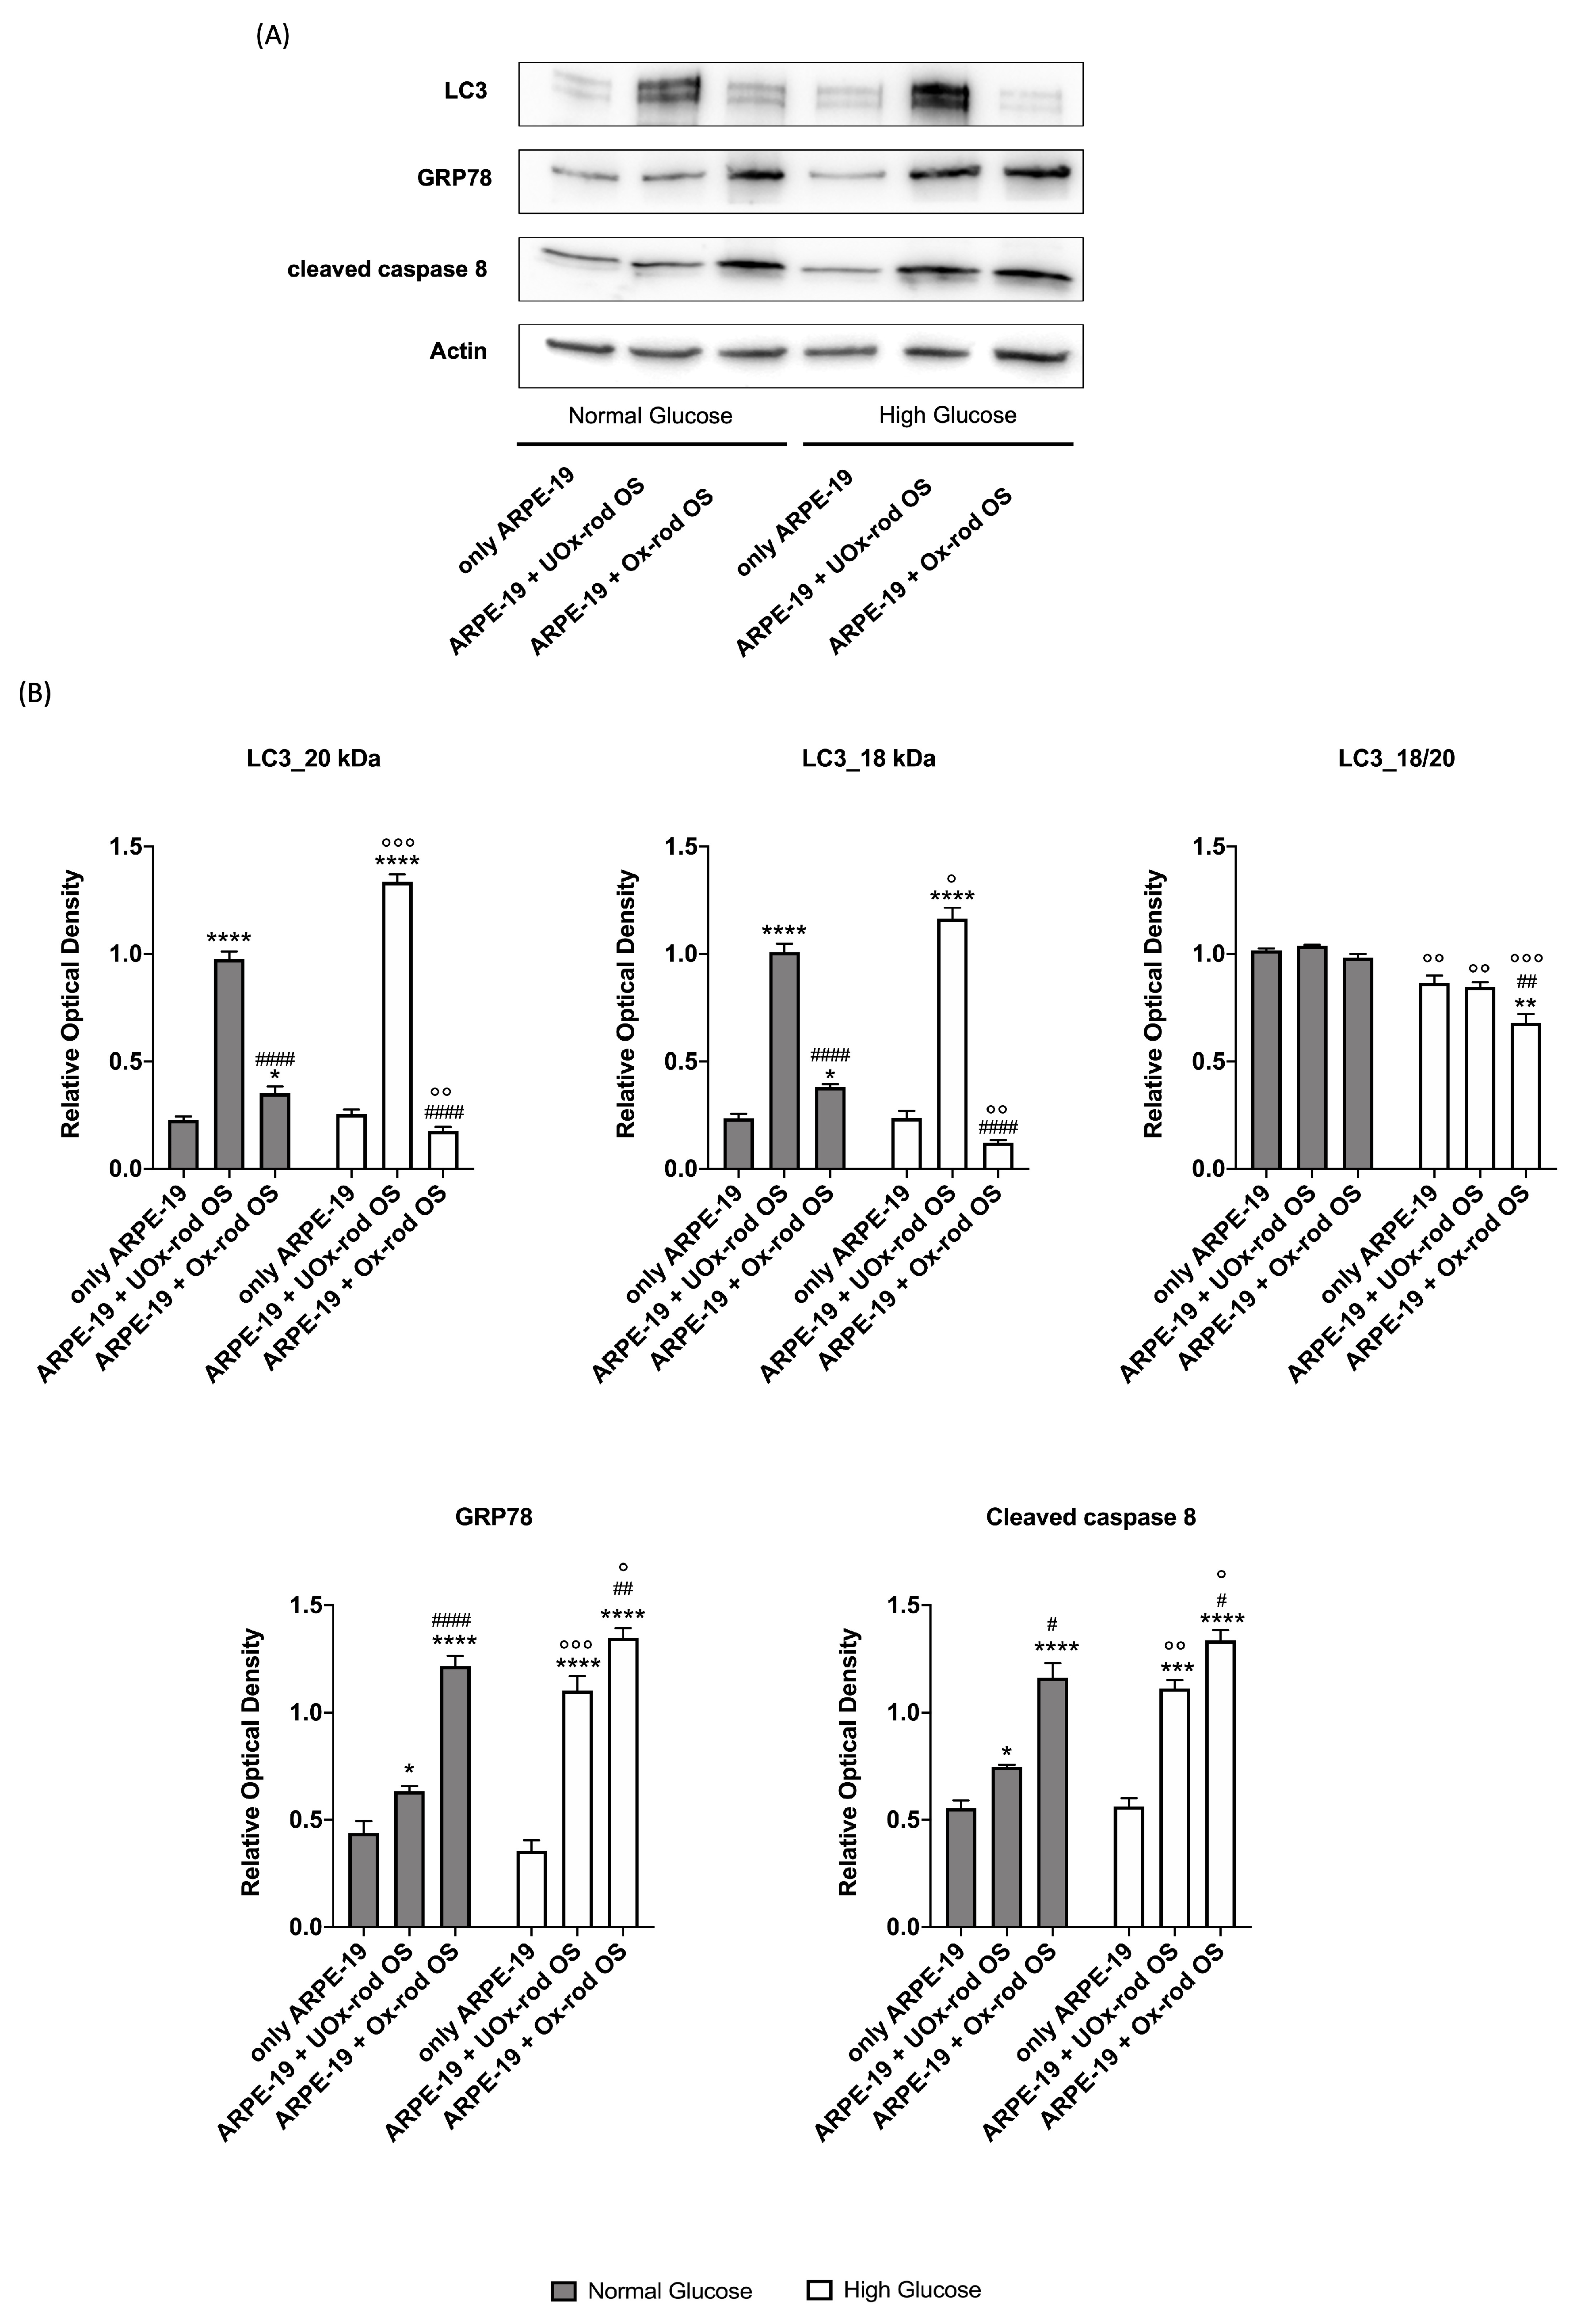
3.4. The accumulation of oxidative stress due to phagocytosis of Ox-rod OS causes an increase in the expression of markers of the unfolding protein response and pro-apoptotic signal and reduces the autophagy process.
To test whether the accumulation of oxidative stress induced by Ox-rod OS causes changes in the pathways involved in cellular homeostasis, the expression of LC3, an autophagy marker, GRP78, an unfolding protein response (UPR) marker, and the cleaved form of caspase 8, an apoptosis marker, was assessed by western blot (Figure 6). Data show that LC3 expression increases in ARPE-19 cells treated with UOx-rod OS compared with untreated cells, with a more pronounced increment when ARPE-19 cells are grown in the HG medium. By contrast, LC3 expression does not change after incubation with Ox-rod OS under either growth condition compared to the control. Furthermore, despite the different amounts of protein expression, the ratio between the 18-kDa isoform (activated) and the 20-kDa isoform (inactive) remains constant between untreated cells and those incubated with UOx- or Ox-rod OS when ARPE-19 cells are grown in NG condition. In contrast, incubation with Ox-rod OS causes a decrease in the 18/20 kDa ratio in favor of the inactive form in ARPE-19 cells grown in HG.
Assessing the activation of the UPR, the GRP78 expression in ARPE-19 cells grown in NG conditions increases after incubation with rod OS, reaching the highest level when they were oxidized. The same trend is observed in cells grown in HG, although, in the presence of UOx-rod OS, the GRP78 signal is higher compared to the cells grown in NG conditions.
Finally, the cleaved caspase 8, which indicates activation of the protein, follows the same trend of GRP78 in both growth conditions.
4. Discussion
This work aimed to investigate a possible reciprocal influence between the pigment epithelium and the apical portion of the rods (rod OS) in establishing a pro-oxidative condition based on excessive oxidative stress production and nutrient availability. For this purpose, ARPE-19 cell cultures and UOx- or Ox-rod OS were employed. ARPE-19 cells express RPE markers and display physiologically relevant features, such as barrier formation and the ability to phagocytize OS [37]. In detail, the working hypothesis postulated that phagocytosis of Ox-rod OS could trigger oxidative damage to the RPE and the outer retina, which is recognized as a principal cause of DR [3,25,53,54]. To mimic DR conditions ex-vivo, here ARPE-19 cells were grown under high glucose (HG, 25 mM) concentrations, which corresponds to an uncompensated diabetic. The cells were challenged once for 5.5h with either UOx- or Ox-rod OS and were able to phagocytize them similarly to the in vivo condition. Since rod OS disks express the proteins of the ETC, F1Fo-ATP synthase, and Krebs cycle enzymes [55,56,57] to meet the bioenergetic needs of phototransduction [33,58,59,60,61,62], rod OS were exposed to ambient light for 30 minutes in the presence of respiratory substrates and ADP to promote their endogenous oxidative phosphorylation and to induce rod OS oxidation. Indeed, in these in vitro conditions, rod OS produce a considerable amount of ROI [33,34], which oxidized the disk membrane as their lipids contain high amounts of long-chain polyunsaturated fatty acids (PUFA) [19]. The data reported herein show that ARPE-19 cells exhibit energy metabolism supported by oxidative phosphorylation that can adapt based on glucose availability without increasing the accumulation of oxidative damage, which is generally due to the increment of endogenous antioxidant activities (namely, glucose-6-phosphate-dehydrogenase (involved in the generation of NADPH), glutathione reductase (regenerating reduced glutathione), glutathione peroxidase (neutralizing hydrogen peroxide by exploiting reduced glutathione) and catalase (the endoplasmic reticulum enzyme that converts hydrogen peroxide into water and oxygen)). In contrast, when ARPE-19 cells phagocytose OS rods, the glucose concentration seems to influence the cellular redox state, as phagocytizing cells grown in HG appear more prone to suffer a permanent oxidative insult than those grown in NG glucose conditions. In other words, the activation of phagocytosis processes seems to unleash a pro-oxidative phenomenon related to excessive glucose. However, the higher oxidative stress accumulation in ARPE-19 cells may depend on the redox state of the phagocytosed objects. In detail, Ox-rod OS induce more cellular damage than the same unoxidized sample, as shown by increased MDA levels and lipofuscin accumulation. Oxidative damage accumulation can have several consequences for the RPE and, consequently, the retina. In detail, our data show that ARPE-19 cells grown in NG glucose conditions and phagocytosed UOx-rod OS activate the autophagy pathway, increase the expression of the proactive (LC3-I, 20 kDa) and active form of LC3 (LC3-II, 18 kDa), probably to eliminate the phagocytosis products, thus, causing only a slight increase in markers related to the unfolding protein response (GRP78) and apoptosis activation (caspase 8). In contrast, phagocytosis of Ox-rod OS does not promote autophagy, resulting in increased UPR and apoptotic activation, probably triggered by cellular engulfment. The severity of the phenomenon is much more pronounced in ARPE-19 cells grown in the HG medium. In fact, although the expression of the two forms of LC3 was increased in the presence of UOx-rod OS, ARPE-19 cells grown in high-glucose showed increased GRP78 and caspase 8 levels, which are signs of cellular stress. This confirms that the activation of phagocytosis mechanisms in a hyperglycemic environment triggers the activation of cellular pathways that negatively modulate cellular homeostasis. The damage was even more pronounced if ARPE-19 cells were incubated with oxidized rod OS since LC3 expression did not increase, and the ratio between the active isoform (LC3-II) and the inactive isoform (LC3-I) was unbalanced towards the latter, indicating further cell engulfment, in line with the accumulation of lipofuscin. This alteration leads to a further increase in markers of UPR and apoptosis, suggestive of cellular distress. In other words, a hyperglycemic condition associated with altered energy metabolism could favor an intra and extracellular pro-oxidant microenvironment, triggering a vicious circle involving RPE and photoreceptors and fueling oxidative stress production. This insight could provide a new perspective to the idea that retinal degeneration depends solely and only on a redox alteration of the RPE. Based on the current data, one could consider the possibility of early oxidative damage of the rod OS, which affects the RPE in more advanced stages of the disease. This interaction appears consistent with the findings that the early event that causes DR is oxidative damage to outer retinal neurons [24,25]. On the other hand, OS phagocytosis is impaired in several diseases, including diabetes. We recently studied the expression of MerTK, a cell surface receptor that regulates phagocytosis of RPE cells, in ARPE-19 cells cultured in HG [14]. Reduced expression of MerTk and increased expression of ADAM9, a protease that causes increased shedding of MerTK, were found. In turn, decreased expression of MerTK impaired OS binding and internalization and impaired the ability to phagocytose oxidized OS from the rod [14].
The damage resulting from the lipofuscin granules accumulation in ARPE-19 cells was also demonstrated by the internalization of lipofuscin granules extracted from autopsy human RPE into cultured ARPE-19 cells [63]. The study also showed that lipofuscin granules are present in human RPE in concentrations directly proportional to the age of the subjects and that their presence produces oxidative stress [63]. Notably, relatively few lipofuscin granules accumulate in the RPE of normal subjects, especially in the first decade of life. Therefore, despite the heavy metabolic overload imposed by the large volume of material in the outer segment of the rods to be phagocytosed, degraded, and recycled, there is an effectively regulated mechanism essential for the proper functioning of RPE cells that keeps the undigested material level very low. Nevertheless, some lipofuscin material accumulation occurs with physiological aging and even more so in some pathological conditions, such as diabetic retinopathy.
Similar results were obtained in a study conducted on ARPE-19 cells treated with porcine OS oxidized by treatment with UV light (254 nm) for three hours [36], electron-dense material accumulation was observed in the swollen lysosomes. However, the porcine OS used in the cited article were severely oxidized, which renders the model unphysiological. By contrast, our ex-vivo model utilizing self-oxidized OS was able to recapitulate the onset of DR pathology. Despite DR has long been considered a microvascular disease in which vascular damage was thought to precede neuronal damage [64], it is now that neuro-retinal oxidative damage precedes vascular damage in patients with DR [24]. In addition, the oxidative stress involved in the onset of DR has been localized to the subretinal space [25]. Interestingly, correcting the early subretinal space oxidative stress could restore vision and mitigate histopathology in diabetic animal models. Imaging studies have shown that oxidative stress can be measured at the interface between OS and RPE [53], consistent with the existence of a crosstalk between OS and RPE in the etiology of DR.
5. Conclusions
The present data suggest the existence of a crosstalk between the RPE and the OS photoreceptor, which would be decisive in the DR pathogenesis. The data also support new findings showing that the primum movens of DR is oxidative damage to outer retinal neurons. The latter would, in turn, cause oxidative damage to the RPE and, ultimately, to the vascular system. The data also show that ARPE-19 cells alone may not be an exhaustive model for studying the role of oxidative stress in the outer retina. We believe that evaluating of interaction between several cell types is necessary. The present experimental model made possible to highlight a latent phenomenon that could occur in pathological conditions in vivo, opening new horizons for future preventive interventions for DR.
Supplementary Materials
The following supporting information can be downloaded at the website of this paper posted on Preprints.org. Figure S1: ATP synthesis, oxygen consumption rate, OxPhos efficiency, and lipid peroxidation in rod OS.
Author Contributions
Conceptualization, S.R. and I.P.; methodology, S.R., A.P., S.B. and I.P.; validation, S.R., A.P. and I.P.; formal analysis, S.R., and I.P.; investigation, S.R., N.B., A.P., S.B.; resources, S.R., D.M. and I.P.; data curation, S.R.; writing—original draft preparation, S.R., N.B. and I.P.; writing—review and editing, S.R. and I.P.; visualization, S.R.; supervision, S.R., D.M., and I.P.; project administration, S.R. and I.P. All authors have read and agreed to the published version of the manuscript.
Funding
This research received no external funding.
Institutional Review Board Statement
Not applicable as the rod OS were isolated from cattle eyes taken and processed immediately after slaughter, following all safety rules. Since the animals were not bred nor sacrificed at the University of Genoa, it was not necessary to request any ethics committee approval.
Informed Consent Statement
Not applicable.
Data Availability Statement
All the data is contained within the article and the supplementary figure.
Conflicts of Interest
The authors declare no conflict of interest.
References
- Caceres, P.S.; Rodriguez-Boulan, E. Retinal Pigment Epithelium Polarity in Health and Blinding Diseases. Curr Opin Cell Biol 2020, 62, 37. [Google Scholar] [CrossRef]
- Wang, W.; Lo, A.C.Y. Diabetic Retinopathy: Pathophysiology and Treatments. Int J Mol Sci 2018, 19. [Google Scholar] [CrossRef]
- Q, K.; C, Y. Oxidative Stress and Diabetic Retinopathy: Molecular Mechanisms, Pathogenetic Role and Therapeutic Implications. Redox Biol 2020, 37. [Google Scholar] [CrossRef]
- Shaw, P.X.; Stiles, T.; Douglas, C.; Ho, D.; Fan, W.; Du, H.; Xiao, X. Oxidative Stress, Innate Immunity, and Age-Related Macular Degeneration. AIMS Mol Sci 2016, 3, 196–221. [Google Scholar] [CrossRef] [PubMed]
- Bhutto, I.; Lutty, G. Understanding Age-Related Macular Degeneration (AMD): Relationships between the Photoreceptor/Retinal Pigment Epithelium/Bruch’s Membrane/Choriocapillaris Complex. Mol Aspects Med 2012, 33, 295–317. [Google Scholar] [CrossRef]
- Moran, E.P.; Wang, Z.; Chen, J.; Sapieha, P.; Smith, L.H.; Ma, J.X. Neurovascular Cross Talk in Diabetic Retinopathy: Pathophysiological Roles and Therapeutic Implications. Am J Physiol Heart Circ Physiol 2016, 311, H738–H749. [Google Scholar] [CrossRef]
- Strauss, O. The Retinal Pigment Epithelium in Visual Function. Physiol Rev 2005, 85, 845–881. [Google Scholar] [CrossRef] [PubMed]
- Curcio, C.A. Photoreceptor Topography in Ageing and Age-Related Maculopathy. Eye (Lond) 2001, 15, 376–383. [Google Scholar] [CrossRef]
- Lamb, T.D.; Curtin, J. Photoreceptor Physiology and Evolution: Cellular and Molecular Basis of Rod and Cone Phototransduction. J Physiol 2022, 0. [Google Scholar] [CrossRef] [PubMed]
- Hsu, Y.C.; Chuang, J.Z.; Sung, C.H. Light Regulates the Ciliary Protein Transport and Outer Segment Disc Renewal of Mammalian Photoreceptors. Dev Cell 2015, 32, 731–742. [Google Scholar] [CrossRef]
- Winkler, B.S. An Hypothesis to Account for the Renewal of Outer Segments in Rod and Cone Photoreceptor Cells: Renewal as a Surrogate Antioxidant. Invest Ophthalmol Vis Sci 2008, 49, 3259–3261. [Google Scholar] [CrossRef]
- Law, A.L.; Parinot, C.; Chatagnon, J.; Gravez, B.; Sahel, J.A.; Bhattacharya, S.S.; Nandrot, E.F. Cleavage of Mer Tyrosine Kinase (MerTK) from the Cell Surface Contributes to the Regulation of Retinal Phagocytosis. J Biol Chem 2015, 290, 4941–4952. [Google Scholar] [CrossRef]
- Nandrot, E.F.; Silva, K.E.; Scelfo, C.; Finnemann, S.C. Retinal Pigment Epithelial Cells Use a MerTK-Dependent Mechanism to Limit the Phagocytic Particle Binding Activity of Avβ5 Integrin. Biology of the cell / under the auspices of the European Cell Biology Organization 2012, 104, 326. [Google Scholar] [CrossRef]
- Puddu, A.; Ravera, S.; Panfoli, I.; Bertola, N.; Maggi, D. High Glucose Impairs Expression and Activation of MerTK in ARPE-19 Cells. International Journal of Molecular Sciences 2022, 23, 1144. [Google Scholar] [CrossRef] [PubMed]
- Pazour, G.J.; Baker, S.A.; Deane, J.A.; Cole, D.G.; Dickert, B.L.; Rosenbaum, J.L.; Witman, G.B.; Besharse, J.C. The Intraflagellar Transport Protein, IFT88, Is Essential for Vertebrate Photoreceptor Assembly and Maintenance. J Cell Biol 2002, 157, 103–113. [Google Scholar] [CrossRef]
- Insinna, C.; Besharse, J.C. Intraflagellar Transport and the Sensory Outer Segment of Vertebrate Photoreceptors. Dev Dyn 2008, 237, 1982–1992. [Google Scholar] [CrossRef] [PubMed]
- Braun, R.D.; Linsenmeier, R.A.; Goldstick, T.K. Oxygen Consumption in the Inner and Outer Retina of the Cat. Invest Ophthalmol Vis Sci 1995, 36, 542–554. [Google Scholar]
- Wangsa-Wirawan, N.D.; Linsenmeier, R.A. Retinal Oxygen: Fundamental and Clinical Aspects. Arch Ophthalmol 2003, 121, 547–557. [Google Scholar] [CrossRef] [PubMed]
- Berdeaux, O.; Juaneda, P.; Martine, L.; Cabaret, S.; Bretillon, L.; Acar, N. Identification and Quantification of Phosphatidylcholines Containing Very-Long-Chain Polyunsaturated Fatty Acid in Bovine and Human Retina Using Liquid Chromatography/Tandem Mass Spectrometry. J Chromatogr A 2010, 1217, 7738–7748. [Google Scholar] [CrossRef] [PubMed]
- Sies, H. Oxidative Stress: A Concept in Redox Biology and Medicine. Redox Biol 2015, 4, 180–183. [Google Scholar] [CrossRef]
- Domènech, E.B.; Marfany, G. The Relevance of Oxidative Stress in the Pathogenesis and Therapy of Retinal Dystrophies. Antioxidants 2020, 9. [Google Scholar] [CrossRef] [PubMed]
- Bellezza, I. Oxidative Stress in Age-Related Macular Degeneration: NRF2 as Therapeutic Target. Front Pharmacol 2018, 9. [Google Scholar] [CrossRef] [PubMed]
- Léveillard, T.; Mohand-Saïd, S.; Lorentz, O.; Hicks, D.; Fintz, A.C.; Clérin, E.; Simonutti, M.; Forster, V.; Cavusoglu, N.; Chalmel, F.; et al. Identification and Characterization of Rod-Derived Cone Viability Factor. Nat Genet 2004, 36, 755–759. [Google Scholar] [CrossRef]
- Sohn, E.H.; van Dijk, H.W.; Jiao, C.; Kok, P.H.B.; Jeong, W.; Demirkaya, N.; Garmager, A.; Wit, F.; Kucukevcilioglu, M.; van Velthoven, M.E.J.; et al. Retinal Neurodegeneration May Precede Microvascular Changes Characteristic of Diabetic Retinopathy in Diabetes Mellitus. Proc Natl Acad Sci U S A 2016, 113, E2655–E2664. [Google Scholar] [CrossRef] [PubMed]
- Berkowitz, B.A. Preventing Diabetic Retinopathy by Mitigating Subretinal Space Oxidative Stress in Vivo. Vis Neurosci 2020, 37. [Google Scholar]
- Berkowitz, B.A. Preventing Diabetic Retinopathy by Mitigating Subretinal Space Oxidative Stress in Vivo. Vis Neurosci 2020, 37. [Google Scholar]
- Bek, T. Mitochondrial Dysfunction and Diabetic Retinopathy. Mitochondrion 2017, 36, 4–6. [Google Scholar] [CrossRef]
- Panfoli, I.; Musante, L.; Bachi, A.; Ravera, S.; Calzia, D.; Cattaneo, A.; Bruschi, M.; Bianchini, P.; Diaspro, A.; Morelli, A.; et al. Proteomic Analysis of the Retinal Rod Outer Segment Disks. J Proteome Res 2008, 7. [Google Scholar] [CrossRef]
- Ravera, S.; Bartolucci, M.; Calzia, D.; Morelli, A.M.; Panfoli, I. Efficient Extra-Mitochondrial Aerobic ATP Synthesis in Neuronal Membrane Systems. J Neurosci Res 2021, 99. [Google Scholar] [CrossRef]
- Calzia, D.; Garbarino, G.; Caicci, F.; Pestarino, M.; Manni, L.; Traverso, C.E.; Panfoli, I.; Candiani, S. Evidence of Oxidative Phosphorylation in Zebrafish Photoreceptor Outer Segments at Different Larval Stages. J Histochem Cytochem 2018, 66, 497–509. [Google Scholar] [CrossRef]
- Panfoli, I.; Calzia, D.; Bianchini, P.; Ravera, S.; Diaspro, A.; Candiano, G.; Bachi, A.; Monticone, M.; Aluigi, M.G.; Barabino, S.; et al. Evidence for Aerobic Metabolism in Retinal Rod Outer Segment Disks. International Journal of Biochemistry and Cell Biology 2009, 41. [Google Scholar] [CrossRef]
- Calzia, D.; Garbarino, G.; Caicci, F.; Manni, L.; Candiani, S.; Ravera, S.; Morelli, A.; Traverso, C.E.; Panfoli, I. Functional Expression of Electron Transport Chain Complexes in Mouse Rod Outer Segments. Biochimie 2014, 102. [Google Scholar] [CrossRef] [PubMed]
- Calzia, D.; Degan, P.; Caicci, F.; Bruschi, M.; Manni, L.; Ramenghi, L.A.; Candiano, G.; Traverso, C.E.; Panfoli, I. Modulation of the Rod Outer Segment Aerobic Metabolism Diminishes the Production of Radicals Due to Light Absorption. Free Radic Biol Med 2018, 117. [Google Scholar] [CrossRef] [PubMed]
- Calzia, D.; Oneto, M.; Caicci, F.; Bianchini, P.; Ravera, S.; Bartolucci, M.; Diaspro, A.; Degan, P.; Manni, L.; Traverso, C.E.; et al. Effect of Polyphenolic Phytochemicals on Ectopic Oxidative Phosphorylation in Rod Outer Segments of Bovine Retina. Br J Pharmacol 2015, 172. [Google Scholar] [CrossRef] [PubMed]
- Dunn, K.C.; Aotaki-Keen, A.E.; Putkey, F.R.; Hjelmeland, L.M. ARPE-19, a Human Retinal Pigment Epithelial Cell Line with Differentiated Properties. Exp Eye Res 1996, 62, 155–170. [Google Scholar] [CrossRef] [PubMed]
- Keeling, E.; Culling, A.J.; Johnston, D.A.; Chatelet, D.S.; Page, A.; Tumbarello, D.A.; Lotery, A.J.; Ratnayaka, J.A. An In-Vitro Cell Model of Intracellular Protein Aggregation Provides Insights into RPE Stress Associated with Retinopathy. Int J Mol Sci 2020, 21, 6647. [Google Scholar] [CrossRef] [PubMed]
- Lynn, S.A.; Ward, G.; Keeling, E.; Scott, J.A.; Cree, A.J.; Johnston, D.A.; Page, A.; Cuan-Urquizo, E.; Bhaskar, A.; Grossel, M.C.; et al. Ex-Vivo Models of the Retinal Pigment Epithelium (RPE) in Long-Term Culture Faithfully Recapitulate Key Structural and Physiological Features of Native RPE. Tissue Cell 2017, 49, 447–460. [Google Scholar] [CrossRef]
- Panfoli, I.; Calzia, D.; Ravera, S.; Bianchini, P.; Diaspro, A. Maximizing the Rod Outer Segment Yield in Retinas Extracted from Cattle Eyes. Bio Protoc 2022, 12. [Google Scholar] [CrossRef]
- Schnetkamp, P.P.M.; Daemen, F.J.M. Isolation and Characterization of Osmotically Sealed Bovine Rod Outer Segments. Methods Enzymol 1982, 81, 110–116. [Google Scholar] [CrossRef]
- Cappelli, E.; Cuccarolo, P.; Stroppiana, G.; Miano, M.; Bottega, R.; Cossu, V.; Degan, P.; Ravera, S. Defects in Mitochondrial Energetic Function Compels Fanconi Anaemia Cells to Glycolytic Metabolism. Biochim Biophys Acta Mol Basis Dis 2017, 1863, 1214–1221. [Google Scholar] [CrossRef]
- Cappelli, E.; Degan, P.; Bruno, S.; Pierri, F.; Miano, M.; Raggi, F.; Farruggia, P.; Mecucci, C.; Crescenzi, B.; Naim, V.; et al. The Passage from Bone Marrow Niche to Bloodstream Triggers the Metabolic Impairment in Fanconi Anemia Mononuclear Cells. Redox Biol 2020, 36, 101618. [Google Scholar] [CrossRef]
- Hinkle, P.C. P/O Ratios of Mitochondrial Oxidative Phosphorylation. Biochim Biophys Acta Bioenerg 2005, 1706, 1–11. [Google Scholar] [CrossRef] [PubMed]
- Semenov, A.N.; Maksimov, E.G.; Moysenovich, A.M.; Yakovleva, M.A.; Tsoraev, G. V.; Ramonova, A.A.; Shirshin, E.A.; Sluchanko, N.N.; Feldman, T.B.; Rubin, A.B.; et al. Protein-Mediated Carotenoid Delivery Suppresses the Photoinducible Oxidation of Lipofuscin in Retinal Pigment Epithelial Cells. Antioxidants 2023, 12, 413. [Google Scholar] [CrossRef] [PubMed]
- Jung, T.; Höhn, A.; Grune, T. Lipofuscin: Detection and Quantification by Microscopic Techniques. Methods Mol Biol 2010, 594, 173–193. [Google Scholar] [CrossRef]
- Bianchi, G.; Ravera, S.; Traverso, C.; Amaro, A.; Piaggio, F.; Emionite, L.; Bachetti, T.; Pfeffer, U.; Raffaghello, L. Curcumin Induces a Fatal Energetic Impairment in Tumor Cells in Vitro and in Vivo by Inhibiting ATP-Synthase Activity. Carcinogenesis 2018, 39. [Google Scholar] [CrossRef] [PubMed]
- Miceli, A.; Cossu, V.; Marini, C.; Castellani, P.; Raffa, S.; Donegani, M.I.; Bruno, S.; Ravera, S.; Emionite, L.; Orengo, A.M.; et al. 18F-Fluorodeoxyglucose Positron Emission Tomography Tracks the Heterogeneous Brain Susceptibility to the Hyperglycemia-Related Redox Stress. Int J Mol Sci 2020, 21, 1–14. [Google Scholar] [CrossRef]
- Ravera, S.; Bertola, N.; Pasquale, C.; Bruno, S.; Benedicenti, S.; Ferrando, S.; Zekiy, A.; Arany, P.; Amaroli, A. 808-Nm Photobiomodulation Affects the Viability of a Head and Neck Squamous Carcinoma Cellular Model, Acting on Energy Metabolism and Oxidative Stress Production. Biomedicines 2021, 9, 1–16. [Google Scholar] [CrossRef]
- Murphy, M.P. How Mitochondria Produce Reactive Oxygen Species. Biochemical Journal 2009, 417, 1–13. [Google Scholar] [CrossRef]
- Bernacchia, A.; Biondi, A.; Genova, M.L.; Lenaz, G.; Falasca, A. The Various Sources of Mitochondrial Oxygen Radicals: A Minireview. Toxicol Mech Methods 2004, 14, 25–30. [Google Scholar] [CrossRef]
- Lenaz, G. The Mitochondrial Production of Reactive Oxygen Species: Mechanisms and Implications in Human Pathology. IUBMB Life 2001, 52, 159–164. [Google Scholar] [CrossRef]
- Lenaz, G. Role of Mitochondria in Oxidative Stress and Ageing. Biochimica et Biophysica Acta (BBA) - Bioenergetics 1998, 1366, 53–67. [Google Scholar] [CrossRef]
- Carlini, L.; Tancreda, G.; Iobbi, V.; Caicci, F.; Bruno, S.; Esposito, A.; Calzia, D.; Benini, S.; Bisio, A.; Manni, L.; et al. The Flavone Cirsiliol from Salvia x Jamensis Binds the F1 Moiety of ATP Synthase, Modulating Free Radical Production. Cells 2022, 11. [Google Scholar] [CrossRef] [PubMed]
- Berkowitz, B.A.; Qian, H. OCT Imaging of Rod Mitochondrial Respiration in Vivo. 2021. https://doi.org/10.1177/15353702211013799. [CrossRef]
- Kowluru, R.A.; Kowluru, A.; Mishra, M.; Kumar, B. Oxidative Stress and Epigenetic Modifications in the Pathogenesis of Diabetic Retinopathy. Prog Retin Eye Res 2015, 48, 40–61. [Google Scholar] [CrossRef]
- Panfoli, I.; Musante, L.; Bachi, A.; Ravera, S.; Calzia, D.; Cattaneo, A.; Bruschi, M.; Bianchini, P.; Diaspro, A.; Morelli, A.; et al. Proteomic Analysis of the Retinal Rod Outer Segment Disks. J Proteome Res 2008, 7. [Google Scholar] [CrossRef] [PubMed]
- Bruschi, M.; Petretto, A.; Caicci, F.; Bartolucci, M.; Calzia, D.; Santucci, L.; Manni, L.; Ramenghi, L.A.; Ghiggeri, G.; Traverso, C.E.; et al. Proteome of Bovine Mitochondria and Rod Outer Segment Disks: Commonalities and Differences. J Proteome Res 2018, 17, 918–925. [Google Scholar] [CrossRef]
- Bruschi, M.; Bartolucci, M.; Petretto, A.; Calzia, D.; Caicci, F.; Manni, L.; Traverso, C.E.; Candiano, G.; Panfoli, I. Differential Expression of the Five Redox Complexes in the Retinal Mitochondria or Rod Outer Segment Disks Is Consistent with Their Different Functionality. FASEB Bioadv 2020, 2, 315–324. [Google Scholar] [CrossRef] [PubMed]
- Panfoli, I.; Calzia, D.; Bruschi, M.; Oneto, M.; Bianchini, P.; Ravera, S.; Petretto, A.; Diaspro, A.; Candiano, G. Functional Expression of Oxidative Phosphorylation Proteins in the Rod Outer Segment Disc. Cell Biochem Funct 2013, 31. [Google Scholar] [CrossRef]
- Calzia, D.; Barabino, S.; Bianchini, P.; Garbarino, G.; Oneto, M.; Caicci, F.; Diaspro, A.; Tacchetti, C.; Manni, L.; Candiani, S.; et al. New Findings in ATP Supply in Rod Outer Segments: Insights for Retinopathies. Biol Cell 2013, 105. [Google Scholar] [CrossRef]
- Calzia, D.; Garbarino, G.; Caicci, F.; Manni, L.; Candiani, S.; Ravera, S.; Morelli, A.; Traverso, C.E.; Panfoli, I. Functional Expression of Electron Transport Chain Complexes in Mouse Rod Outer Segments. Biochimie 2014, 102. [Google Scholar] [CrossRef]
- Panfoli, I.; Calzia, D.; Bianchini, P.; Ravera, S.; Diaspro, A.; Candiano, G.; Bachi, A.; Monticone, M.; Aluigi, M.G.; Barabino, S.; et al. Evidence for Aerobic Metabolism in Retinal Rod Outer Segment Disks. International Journal of Biochemistry and Cell Biology 2009, 41, 2555–2565. [Google Scholar] [CrossRef]
- Panfoli, I.; Calzia, D.; Ravera, S.; Morelli, A.M.; Traverso, C.E. Extra-Mitochondrial Aerobic Metabolism in Retinal Rod Outer Segments: New Perspectives in Retinopathies. Med Hypotheses 2012, 78. [Google Scholar] [CrossRef] [PubMed]
- Olchawa, M.M.; Szewczyk, G.M.; Zadlo, A.C.; Sarna, M.W.; Wnuk, D.; Sarna, T.J. The Effect of Antioxidants on Photoreactivity and Phototoxic Potential of RPE Melanolipofuscin Granules from Human Donors of Different Age. Antioxidants 2020, 9, 1044. [Google Scholar] [CrossRef] [PubMed]
- Liang, F.Q.; Godley, B.F. Oxidative Stress-Induced Mitochondrial DNA Damage in Human Retinal Pigment Epithelial Cells: A Possible Mechanism for RPE Aging and Age-Related Macular Degeneration. Exp Eye Res 2003, 76, 397–403. [Google Scholar] [CrossRef] [PubMed]
Figure 1.
Effect of glucose concentration in growth medium on ARPE-19 cells’ aerobic metabolism. (A) oxygen consumption rate (OCR); (B) aerobic ATP synthesis; (C) P/O values as OxPhos efficiency markers. Aerobic metabolism has been evaluated in the presence of pyruvate plus malate (P/M) or succinate (Succ) to stimulate the Complexes I, III, and IV and Complexes II, III, and IV pathways, respectively. Grey columns represent data obtained on ARPE-19 cells grown at 5.6 mM glucose (normal glucose, corresponding to the glucose concentration commonly used to grow these cells), and white columns represent the same sample grown in a high-glucose medium (25 mM). Data are expressed as mean ± SD and are representative of four independent replicates. ** and *** indicate an error probability of p < 0.01 and 0.001, respectively, between the sample grown in NG or HG mediums.
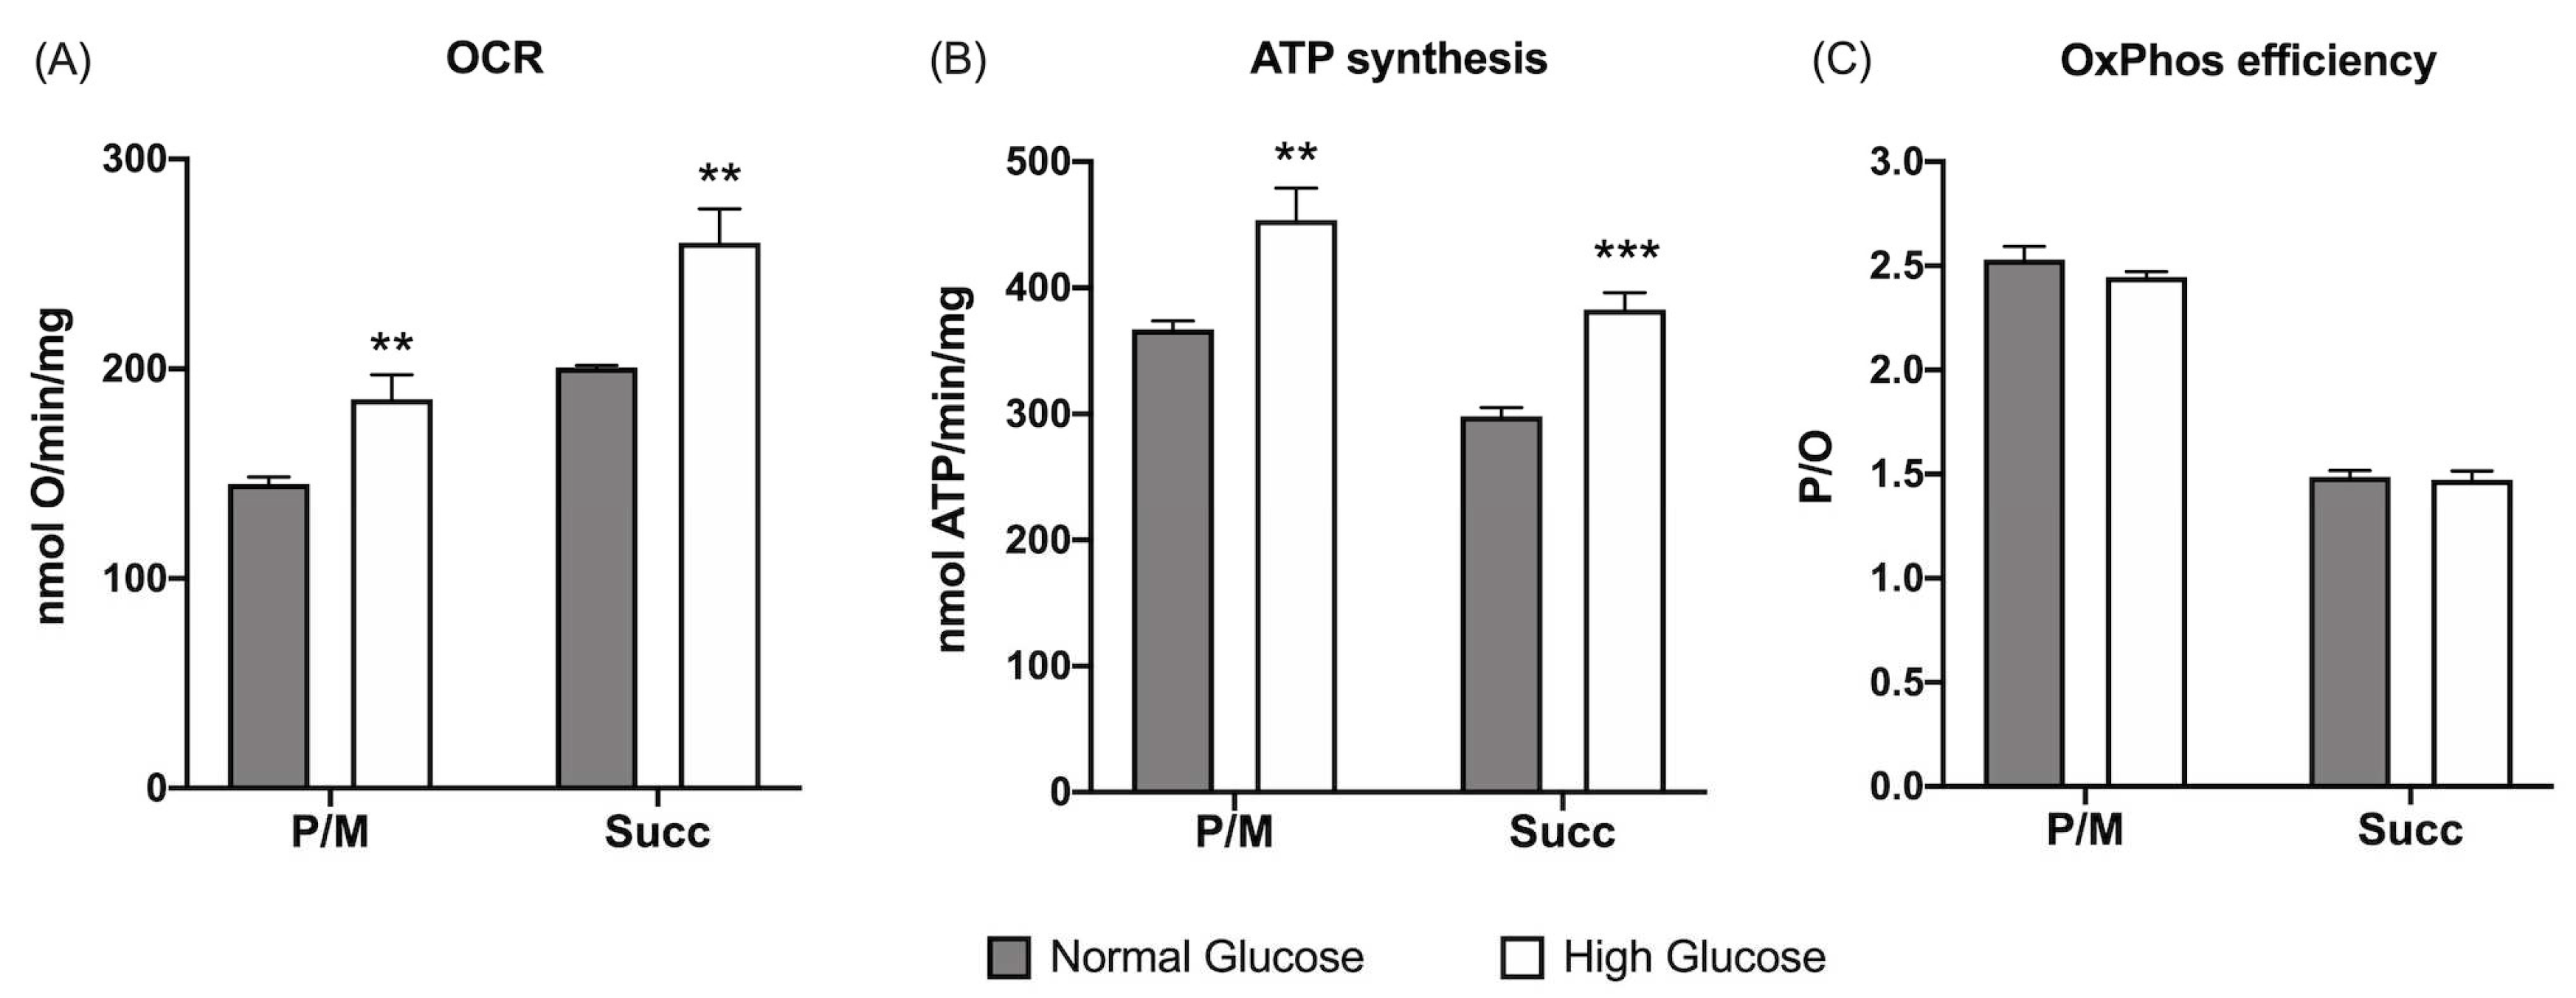
Figure 2.
Lipid peroxidation and antioxidants defenses in ARPE-19 cells grown in normal or high glucose medium. (A) Malondialdehyde (MDA) concentration as a marker of lipid peroxidation; (B) Catalase activity; (C) Glucose 6-phosphate dehydrogenase (G6PD) activity; (D) Glutathione reductase (GR) activity; Glutathione peroxidase (GPx) activity. All tested enzymes are involved in the cellular antioxidant defenses. Grey columns represent data obtained on ARPE-19 cells grown at 5.6 mM glucose (normal glucose, corresponding to the glucose concentration commonly used to grow these cells), and white columns represent the same sample grown in a high-glucose medium (25 mM). Data are expressed as mean ± SD and are representative of four independent replicates. * and **** indicate a significant difference for p < 0.05 or 0.0001, respectively, between the sample grown in NG or HG mediums.
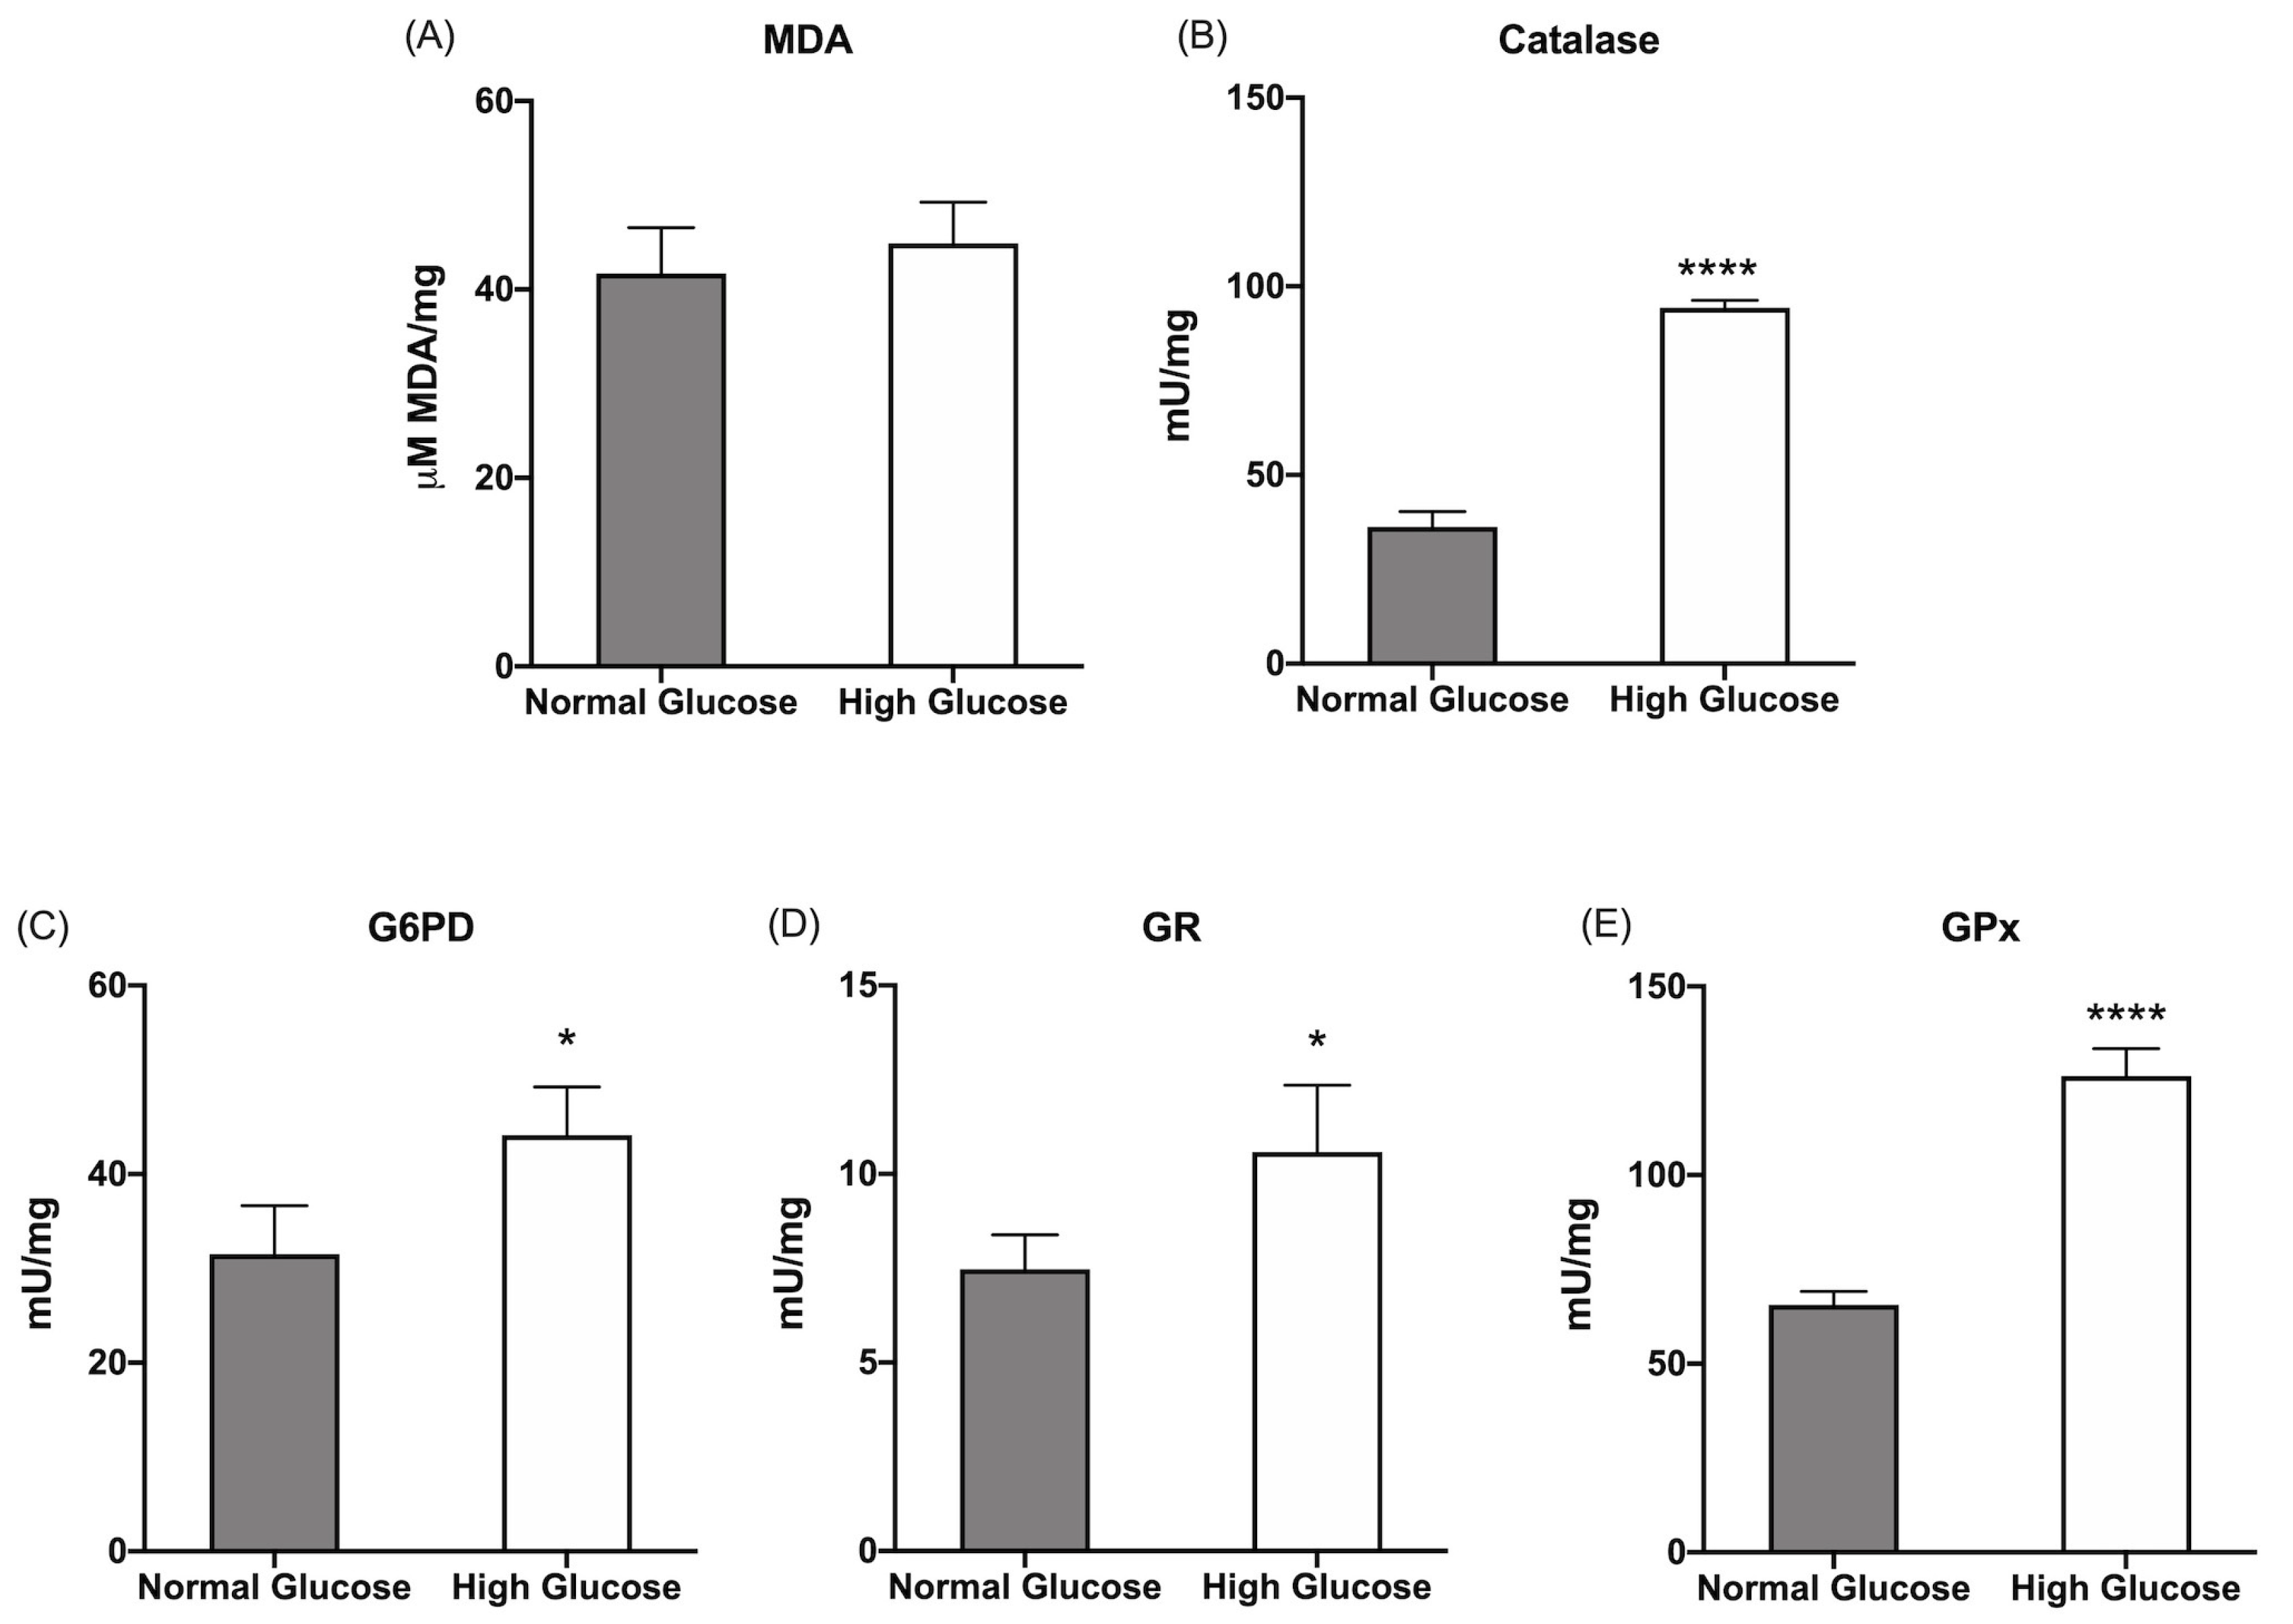
Figure 3.
Rhodopsin quantity in ARPE-19 cells growth medium as a marker of cells ability to phagocyte unoxidized or oxidized rod OS. (A) Rhodopsin signal in ARPE-19 cells growth medium after 5.5 hours of incubation with either unoxidized (UOx) or oxidized (Ox) rod OS; (B) Densitometric analysis of Rhodopsin signal. The black column represents the rhodopsin concentration in rod OS suspension before the incubation; the grey and white columns represent rhodopsin concentration under NG and HG conditions, respectively. Data are expressed as mean ± SD and are representative of four independent replicates. ** and **** indicate an error probability of p < 0.01 and 0.0001, respectively, in rhodopsin concentration before and after the incubation with ARPE-19 cells; #### indicates a p< 0.0001 between the ARPE-19 cells incubated with UOx- or Ox-rod OS; ° and °°°° indicate a p < 0.05 and 0.0001, respectively, between the rhodopsin concentration in NG or HG medium.
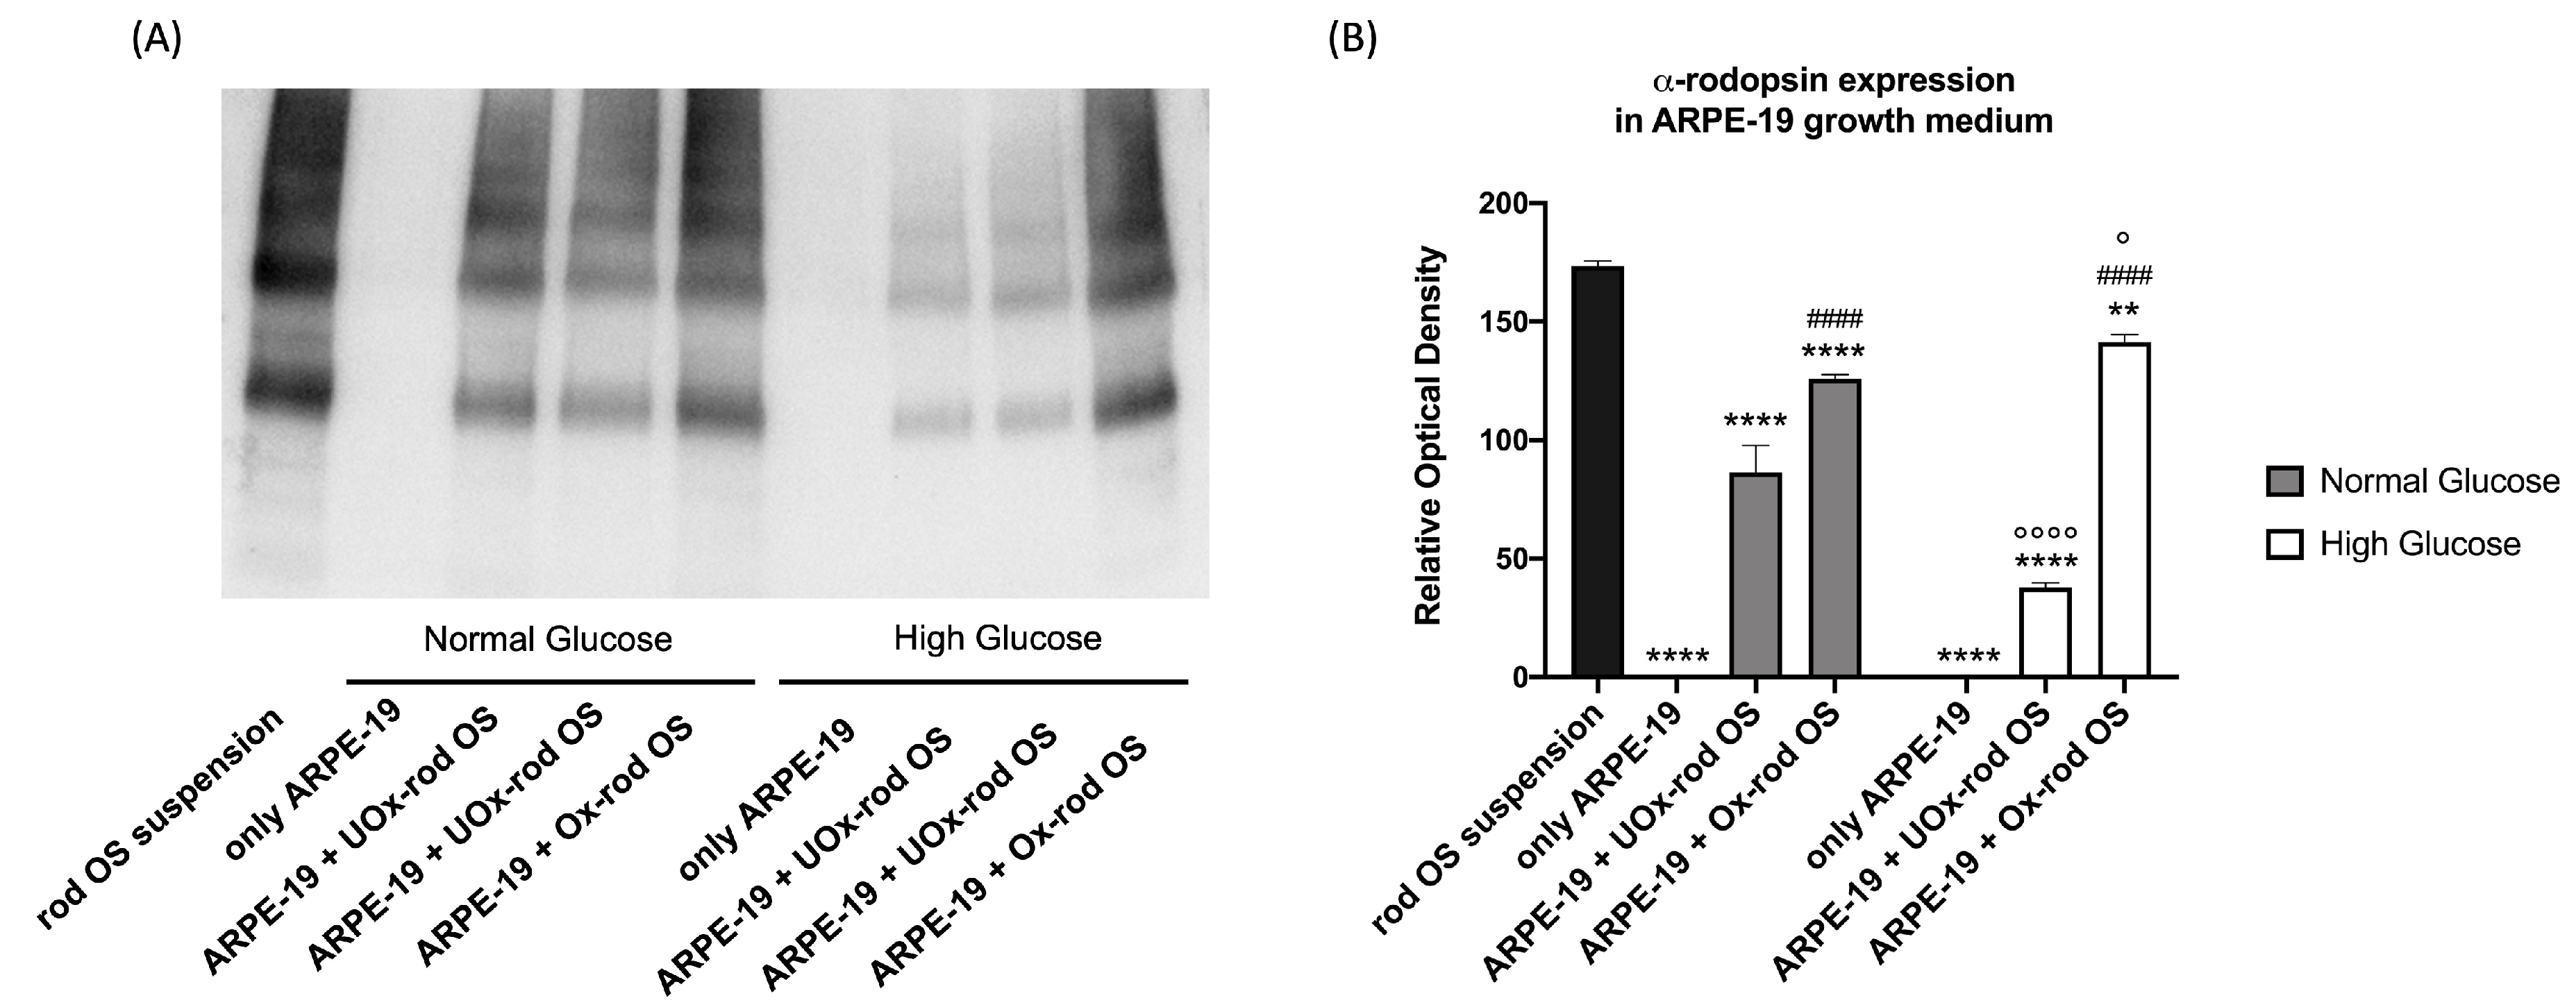
Figure 4.
Lipofuscin accumulation in ARPE-19 cells grown in normal or high glucose medium and incubated with UOx- or Ox-rod OS. (A) Representative confocal images, reporting the cytoplasmic lipofuscin accumulation (red signal) in ARPE-19 cells grown in normal glucose (NG) and high glucose (HG) conditions and incubated with either UOx- or Ox-rod OS. The blue signal corresponds to cells nuclei stained with DAPI. The bar scale corresponds to 10 μm. (B) The intensity of lipofuscin fluorescence signal. Grey columns represent data obtained on ARPE-19 cells grown with NG, and white columns represent the same sample grown in HG condition. Data are expressed as mean ± SD and are representative of four independent replicates. * and **** indicate a p < 0.05 and 0.0001, respectively, between ARPE-19 cells incubated or not with rod OS; # and #### indicate a p< 0.05 and 0.0001 between the ARPE-19 cells incubated with UOx- or Ox-rod OS; °°° and °°°° indicate a p < 0.001 and 0.0001, respectively, between lipofuscin accumulation in ARPE-19 cells grown in NG or HG medium.
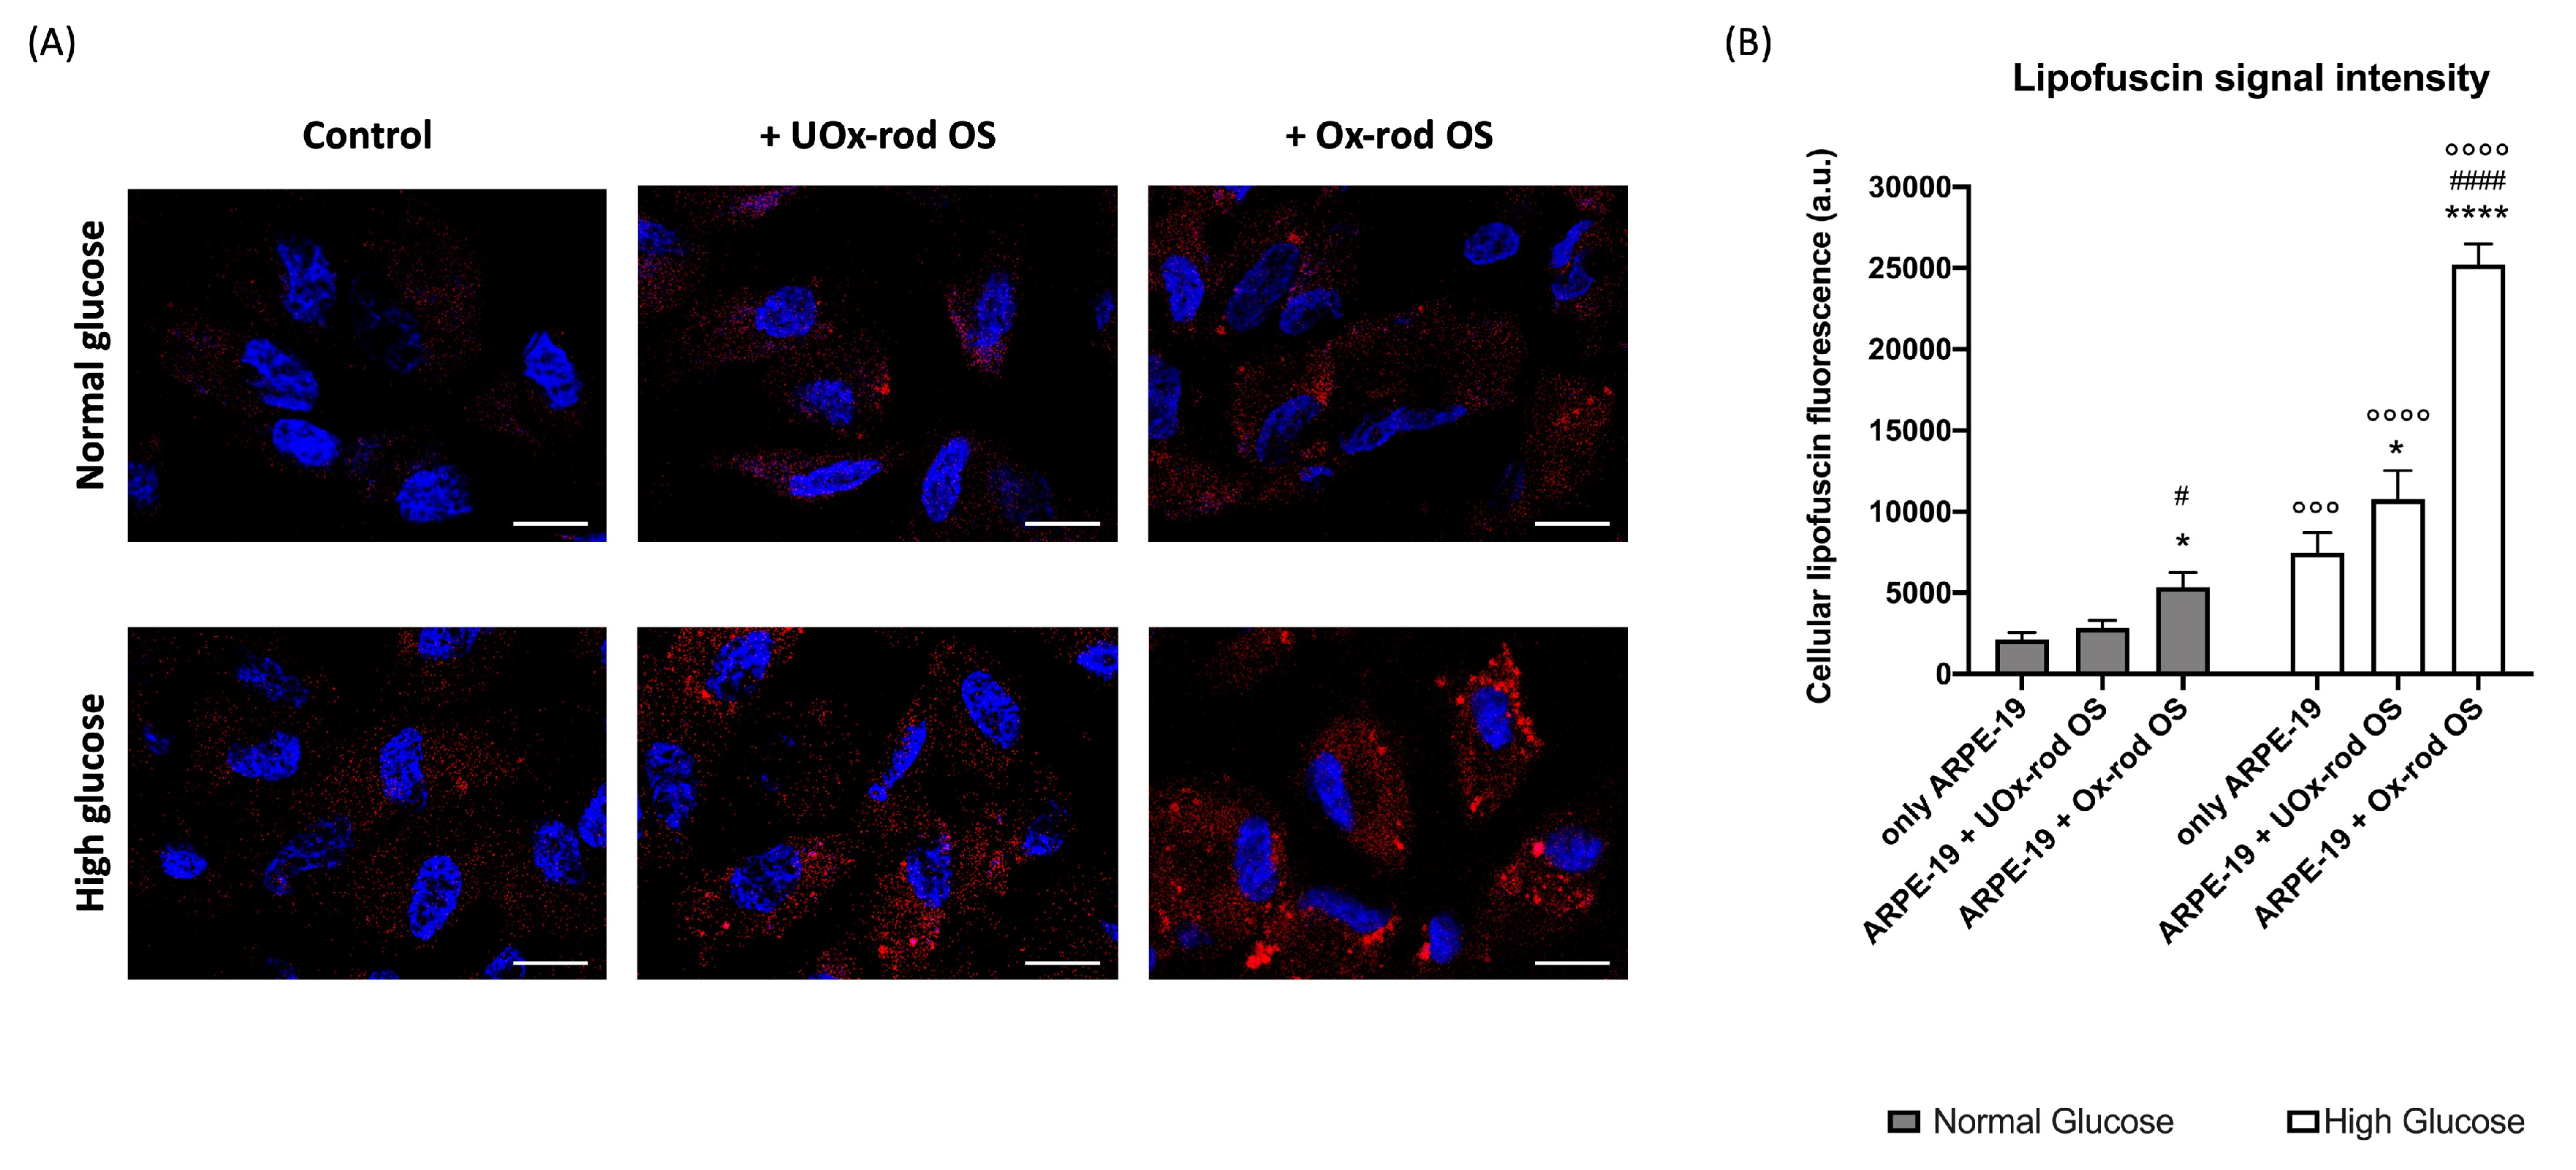
Figure 5.
Lipid peroxidation and antioxidant defenses in ARPE-19 cells grown in normal and high-glucose conditions, after incubation with UOx- or Ox-rod OS. (A) Malondialdehyde (MDA) concentration as a marker of lipid peroxidation; (B) Catalase activity; (C) Glucose 6-phosphate dehydrogenase (G6PD) activity; (D) Glutathione reductase (GR) activity; Glutathione peroxidase (GPx) activity. All tested enzymes are involved in the cellular antioxidant defenses. Grey columns represent data obtained on ARPE-19 cells grown in NG, and white columns represent the same sample grown in HG. Data are expressed as mean ± SD and are representative of four independent replicates. **, ***, and **** indicate a p < 0.01, 0.001, and 0.0001, respectively, between ARPE-19 cells incubated or not with rod OS; ## and #### indicate a p< 0.01 and 0.0001 between the ARPE-19 cells incubated with UOx- or Ox-rod OS; °, °°, °°°, and °°°° indicate a p < 0.05, 0.01, 0.001 and 0.0001, respectively, between lipofuscin accumulation in ARPE-19 cells grown in NG or HG medium.
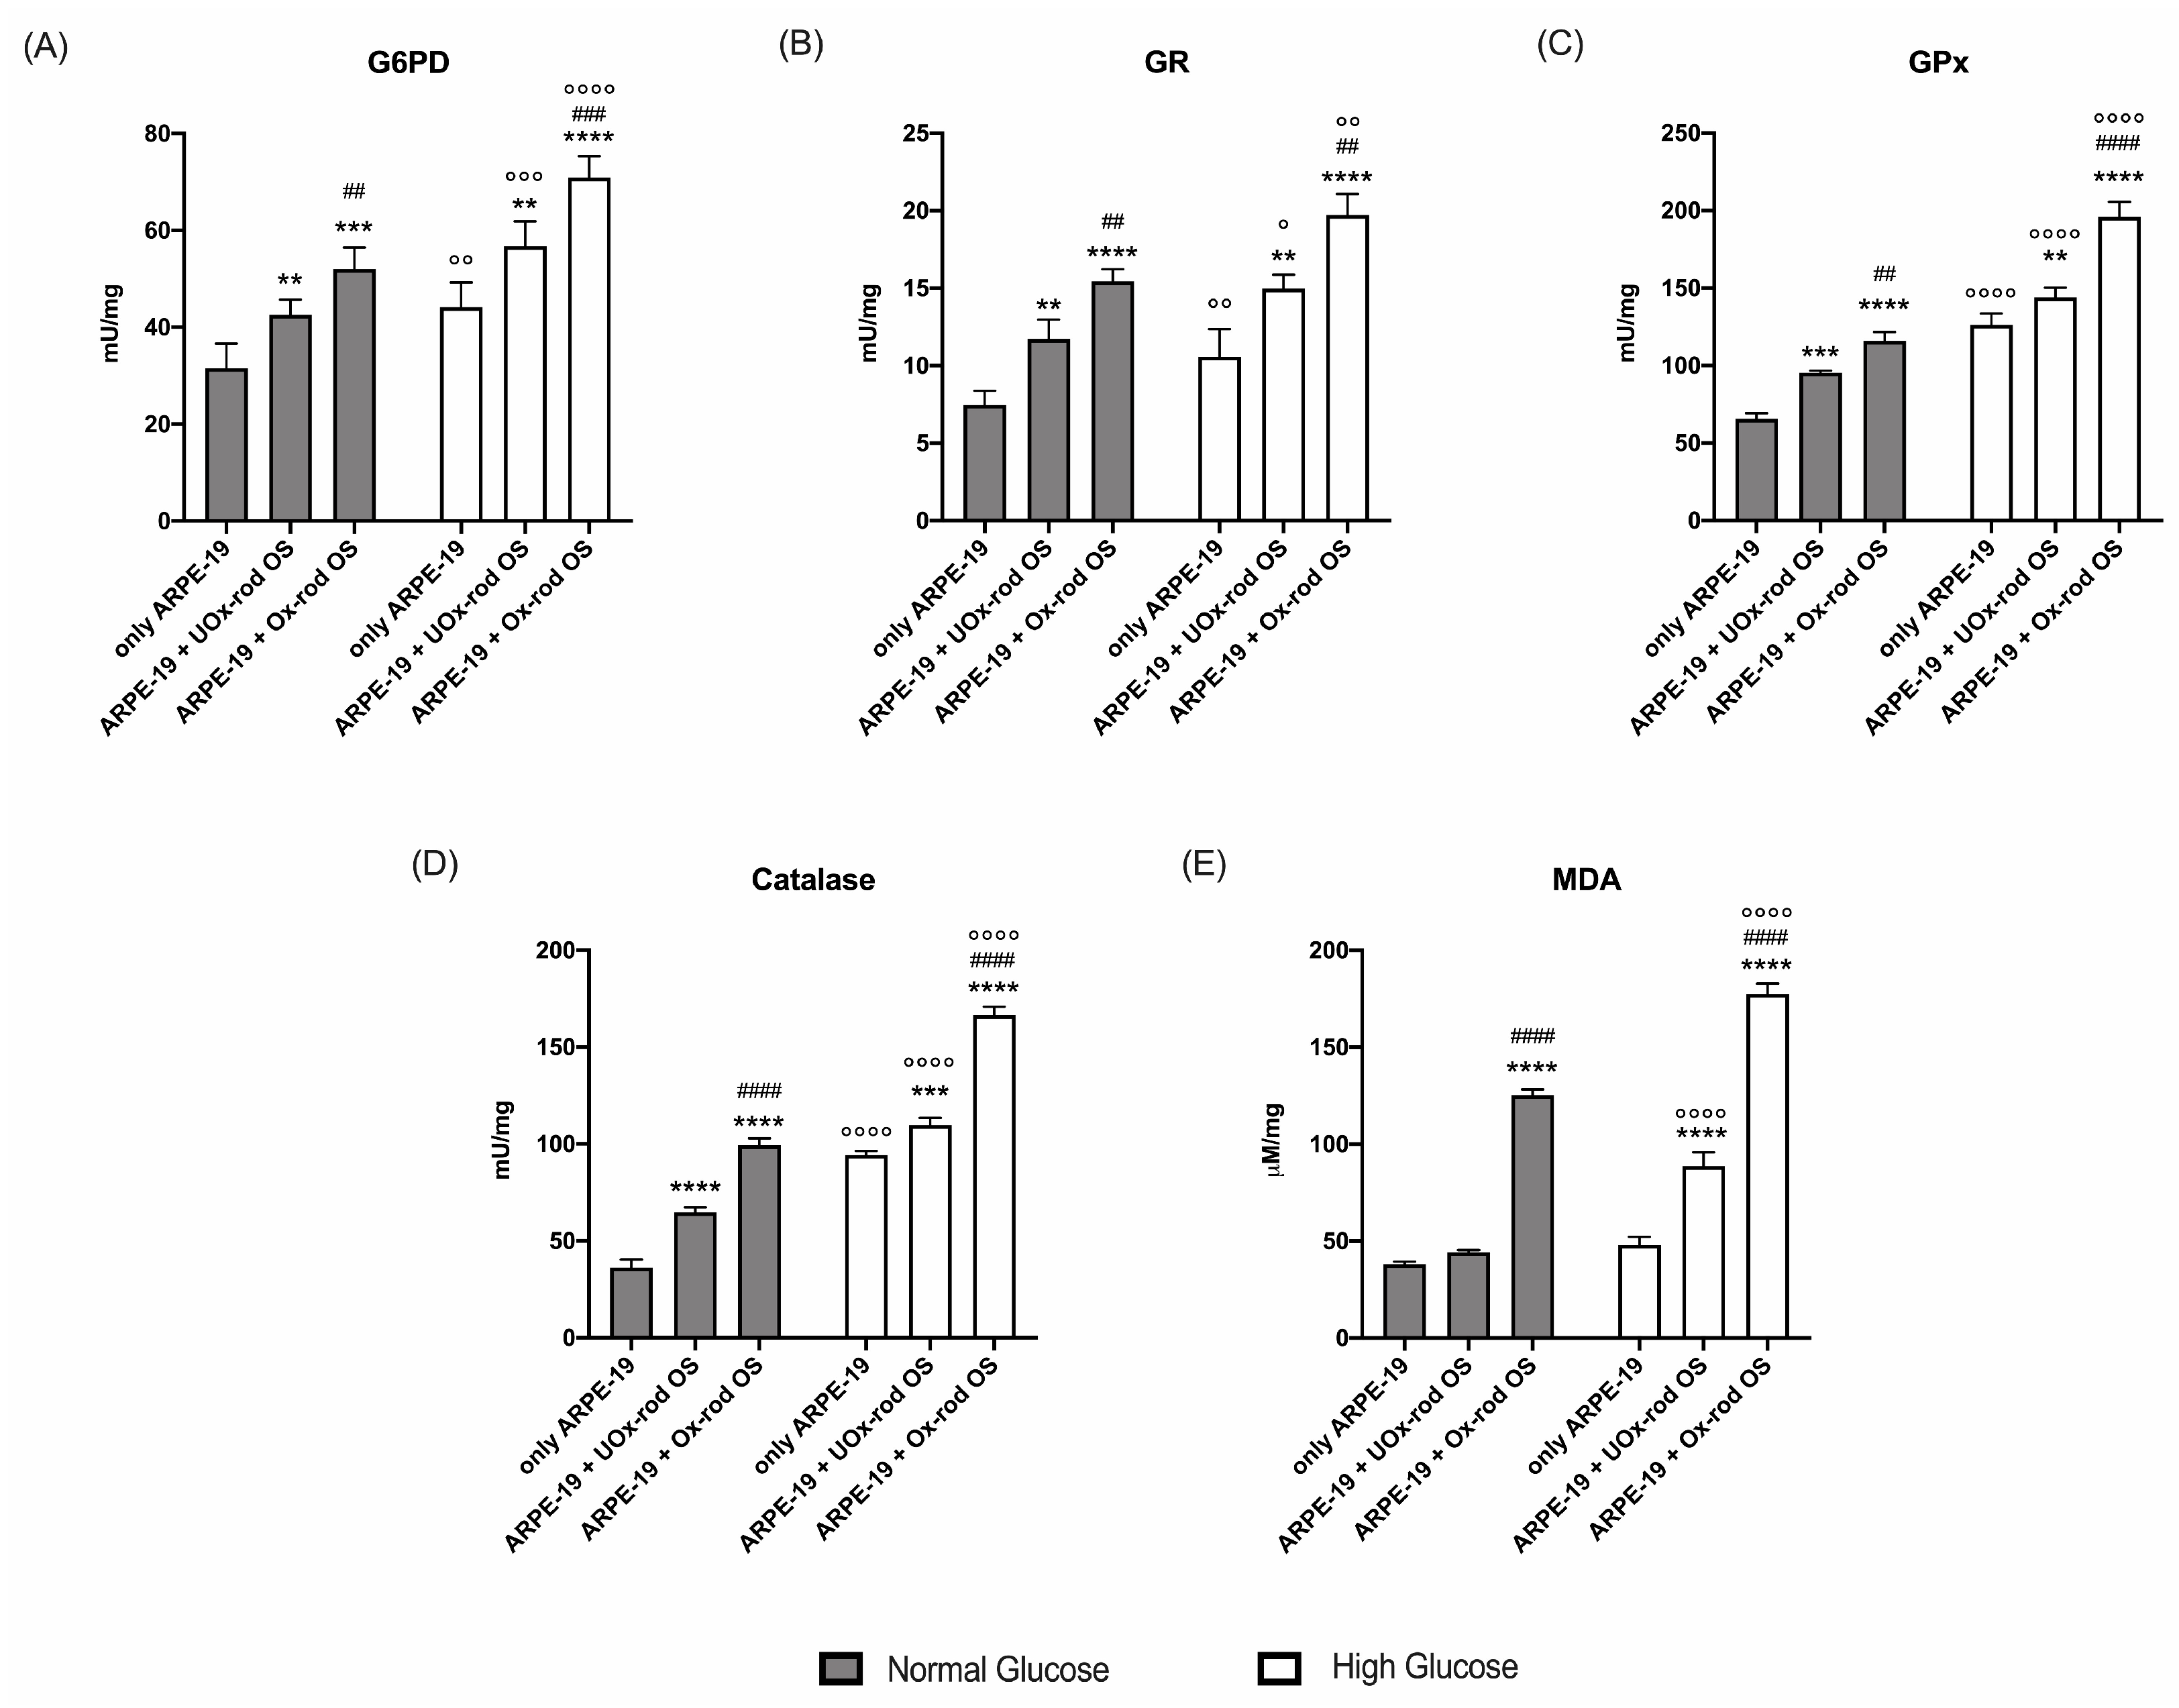
Figure 6.
LC3, GRP78, and cleaved caspase 8 expression in ARPE-19 grown in normal and high glucose medium and incubated with UOx- or Ox-rod OS. (A) WB signals of LC3 (20 and 18 kDa bands), GRP78, Cleaved caspase 8, and actin (used as housekeeping protein) in ARPE-19 cells grown in NG or HG conditions after incubation with either UOx- or Ox-rod OS; (B) Densitometric analysis of 20 kDa-LC3, 18 kDa-LC3, 18 kDa and 20 kDa bands ratio, GRP78, and cleaved caspase 8 signals. Grey and white columns represent ARPE-19 cells grown in NG or HG medium, respectively. Data are expressed as mean ± SD and are representative of four independent replicates. *, **, ***, and **** indicate a significant difference with an error probability of p < 0.05, 0.01, 0.001, and 0.0001, respectively, between signals in ARPE-19 cells incubated or not with rod OS; #, ##, and #### indicate a p< 0.05, 0.01, and 0.0001 between the ARPE-19 cells incubated with UOx- or Ox-rod OS; °, °°, °°°, and °°°° indicate a p < 0.05, 0.01, 0.001 and 0.0001, respectively, between the signal intensity in ARPE-19 cells grown in NG or HG medium.
Disclaimer/Publisher’s Note: The statements, opinions and data contained in all publications are solely those of the individual author(s) and contributor(s) and not of MDPI and/or the editor(s). MDPI and/or the editor(s) disclaim responsibility for any injury to people or property resulting from any ideas, methods, instructions, or products referred to in the content. |
© 2023 by the authors. Licensee MDPI, Basel, Switzerland. This article is an open access article distributed under the terms and conditions of the Creative Commons Attribution (CC BY) license (http://creativecommons.org/licenses/by/4.0/).
Copyright: This open access article is published under a Creative Commons CC BY 4.0 license, which permit the free download, distribution, and reuse, provided that the author and preprint are cited in any reuse.


